Article

Determination of Potential Aquifer Recharge Zones Using Geospatial Techniques for Proxy Data of Gilgel Gibe Catchment, Ethiopia

1
Department of Civil and Environmental Engineering, University of Science and Technology (UST), Daejeon 34113, Korea
2
Department of Water Resources and River Research, Korea Institute of Civil Engineering and Building Technology, Goyang 10223, Korea
*
Author to whom correspondence should be addressed.
Water 2022, 14(9), 1362; https://doi.org/10.3390/w14091362
Submission received: 6 April 2022 / Revised: 16 April 2022 / Accepted: 19 April 2022 / Published: 22 April 2022
(This article belongs to the Special Issue Drought and Groundwater Development)

Abstract

:
The lack of valuable baseline information about groundwater availability hinders the robust decision-making process of water management in humid, arid, and semi-arid climate regions of the world. In sustainable groundwater management, identifying the spatiotemporal and extrapolative monitoring of potential zone is crucial. Thus, the present study focused on determining potential aquifer recharge zones using geospatial techniques for proxy data of the Gilgel Gibe catchment, Ethiopia. Proxy data are site information derived from satellite imageries or conventional sources that are operated as a layer attribute in the geographical information system (GIS) to identify groundwater occurrence. First, GIS and analytical hierarchy process (AHP) were applied to analyze ten groundwater recharge controlling factors: slope, lithology, topographic position index lineament density, rainfall, soil, elevation, land use/cover, topographic wetness index, and drainage density. Each layer was given relative rank priority depending on the predictive implication of groundwater potentiality. Next, the normalized weight of thematic layers was evaluated using a multi-criteria decision analysis AHP algorithm with a pairwise comparison matrix based on aquifer infiltration relative significance. Lithology, rainfall, and land use/cover were dominant factors covering a weight of 50%. The computed consistency ratio (CR = 0.092, less than 10%) and consistency index (CI = 0.1371) revealed the reliability of input proxy layers’ in the analysis. Then, a GIS-based weighted overlay analysis was performed to delineate very high, high, moderate, low, and very low potential aquifer zones. The delineated map ensures very high (29%), high (25%), moderate (28%), low (13%), and very low (5%) of the total area. According to validation, most of the inventory wells are located in very high (57%), high (32), and moderate (12%) zones. The validation results realized that the method affords substantial results supportive of sustainable development and groundwater exploitation. Therefore, this study could be a vigorous input to enhance development programs to alleviate water scarcity in the study area.

1. Introduction

Assessing the continuous availability of freshwater in all climatic regions with low development costs is crucial to withstand the water-food security issues [1,2]. Nowadays, freshwater demand has become a global issue due to natural and anthropogenic influences [3,4,5,6]. Groundwater is a renewable resource that provides areas with limited access to surface water [7,8]. Groundwater is essential to improve socio-economic development in the rapidly increasing demand of rural and urban populations [9,10]. Africa has a substantial amount of groundwater storage that has not been adequately utilized and managed yet [11]. In Africa and most developing countries, such as Ethiopia, subsurface water is the leading source of crop production and drinking water supply [11,12,13]. Despite this, most people suffer water scarcity due to poor knowledge in identifying and utilizing water resource potentials to the limit [5,14,15]. However, most groundwater aquifers do not afford sufficient scientific evidence to assess groundwater flow for setting long-term utilization and national development goals [13,16].
The variability of groundwater recharge affects freshwater availability [17]. The spatiotemporal assessment of groundwater recharge is becoming a critical concern due to data scarcity in different climatic regions [18]. Recharging becomes effective if the infiltration is concentrated at a given time and space [19]. Groundwater recharge requires detailed assessments of scientific principles governing groundwater flow processes [20]. Delineating potential aquifer recharge zones (PARZ) in the areas of interest is vital in determining water demand and supply under hydrologic extremes [21,22]. However, several factors hinder water sector development from attaining sustainable and appropriate mitigating strategies [23,24,25]. The physical, hydrological, and climate variables are the key factors that govern the subsurface flow of the aquifer system [26]. Determining the governing controlling factors leads to reasonable design input and decision-making processes for complex systems. Identifying potential groundwater sites remains challenging as its exploration relies on precise analysis of hydrogeological data [27]. Recently, geospatial techniques have become essential tools in spatiotemporal predictions of groundwater [28,29,30].
Geospatial techniques have been used in many recharge studies to avoid dilemmas of methods that rely on groundwater flow [31,32], field surveys [13,32], and geophysical technologies [33], which are both costly and complex. The robust application of Geographic Information Systems (GIS) and Remote Sensing (RS) can manage the amount of spatially correlated governing parameters [34,35,36,37]. In addition, GIS increases the accuracy of results, minimizing bias [38]. The development of these technologies with Multi-Criteria Decision Analysis (MCDA) provided a new scientific inquiry in recent groundwater studies [39,40,41,42]. GIS and RS are effective tools that offer a fast and systematic spatiotemporal depiction of productive areas [2,14,29,43,44,45]. MCDA technique has been accepted worldwide for solving decision problems in driving groundwater controlling parameters [46,47,48,49]. The Analytical Hierarchy Process (AHP), advanced by Saaty [50], is the extensively used MCDA technique for complex decision-making in groundwater studies worldwide. The AHP provides a formalized approach for creating better resolutions of varied domains of highly dynamic, uncertain, and unpredictable complex decision-making problems [51,52]. Many authors comprehensively used different groundwater flow controlling parameters to delineate potential zones with GIS-based MCDA [25,30,53,54]. Various controlling factors were applied in other research conducted worldwide though the results vary from site [27]. Hence, accurate predictions of groundwater recharge zones challenged scientists as factors that control infiltration have remained unsolved [19,55].
In the Gilgel Gibe catchment, there is an alarming expansion of many satellite cities with unregulated population growth and increasing freshwater demand. Groundwater will remain the critical source of freshwater as most streams are drying up due to natural and anthropogenic activities. Groundwater has immense advantages of drought resilience [13], less treatment cost, and slow response to climate variability [56]. The area is mainly rain-fed agriculture despite the high potential for irrigable land. As rainfall is erratic, rainfall-dependent agriculture does not support sustainable crop production, resulting in food insecurity issues. Therefore, exploration of groundwater aquifers and identifying potential zones is desirable for sustainable groundwater management and selection of productive aquifers. Exploring PARZ is one of the best approaches for emerging viable water utilization for domestic, irrigation, and industrial developments [15]. PARZ can be determined from proxy data sources and has substantial advantages under data-scarce conditions [36,57,58,59]. Proxy data are site information produced from satellite imageries or conventional sources prepared as a geospatial layer attribute in the GIS environment. Satellite imagery affords tremendous insights into hydrologic characteristics [27,60]. However, robust application of proxy data has not been exclusively applied in the study area, which causes overexploitation and an unreliable decision-making process. Hence, the present study aims to determine potential aquifer recharge zones from proxy data sources of Gilgel Gibe catchment using geospatial techniques based on MCDA and AHP. This study used ten thematic layers to reinforce the data analysis and interpretation process. The present study will become significant baseline information to enhance aquifer management and engineering judgments.

2. Materials and Methods

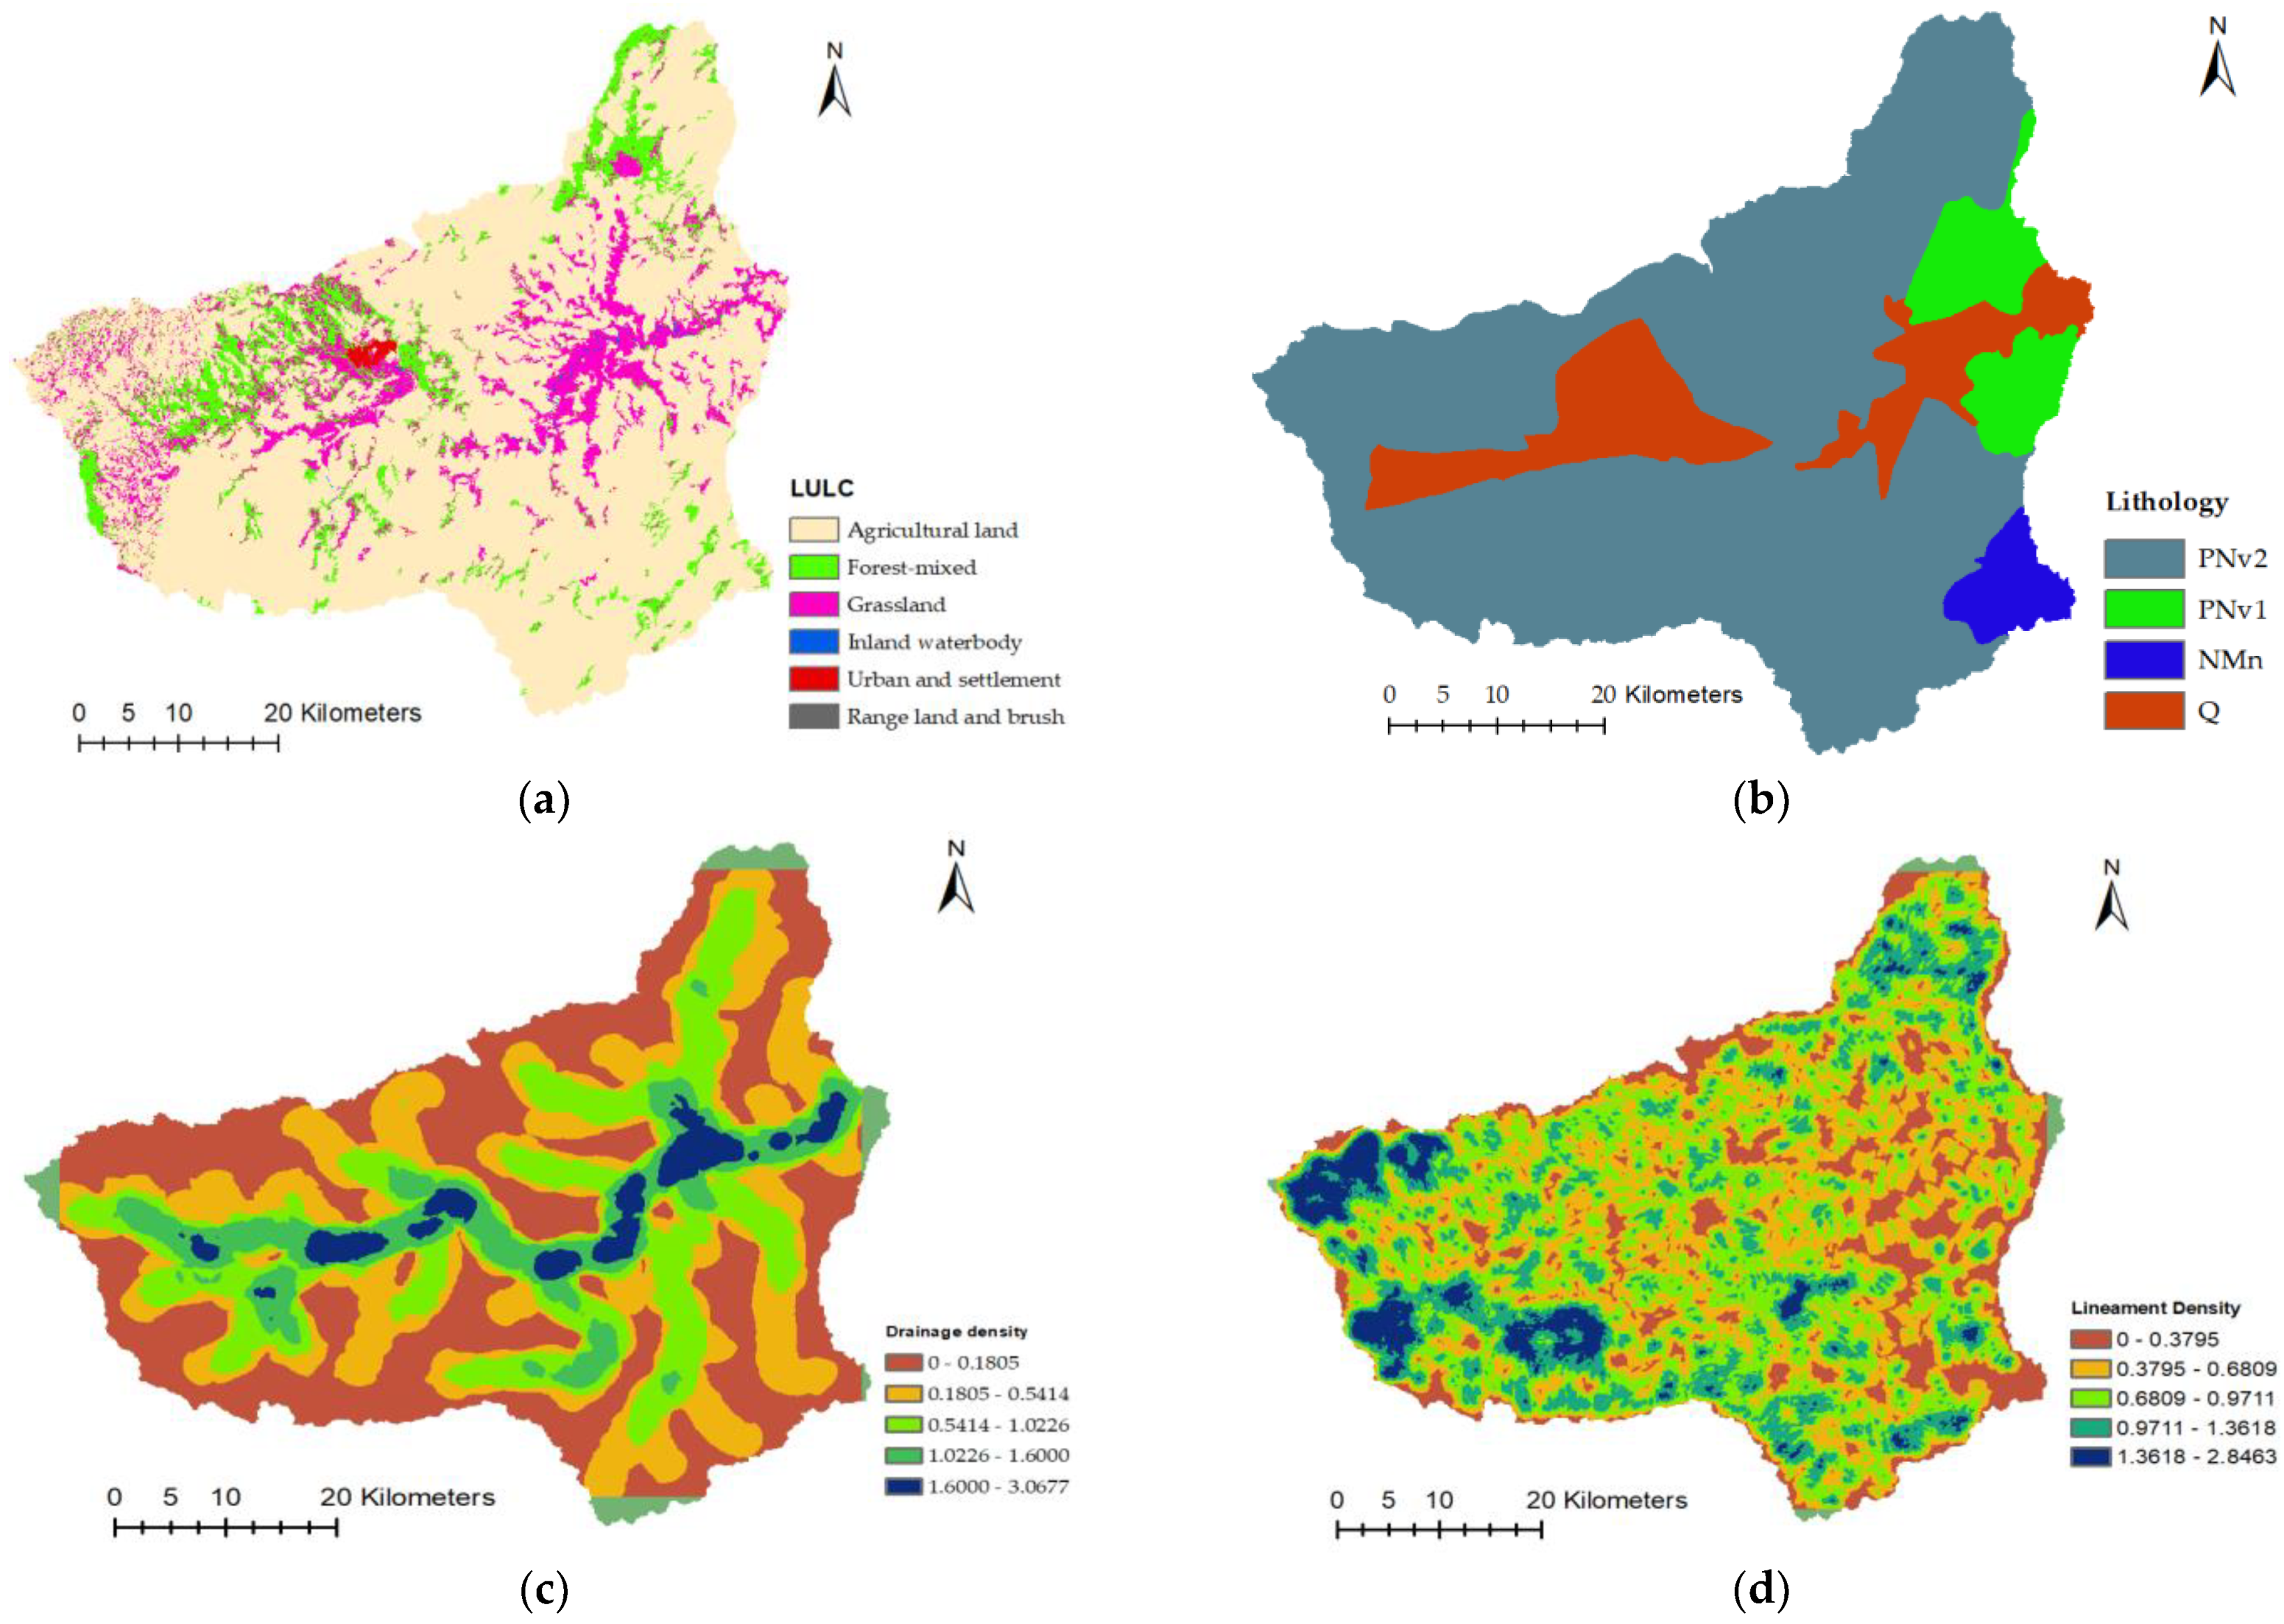
2.1. Description of Study Area

The Gilgel Gibe catchment (GGC) is situated in Eastern Africa in the Omo-Gibe river basin of Southwestern Ethiopia. The watershed geographically (Figure 1) lies between (226126.133, 304388.193) North Latitudes and (811017.916, 883266.897) East Longitudes. Numerous intermittent rivers also characterize the catchment. The primary water source for the rivers is precipitation from the mountainous areas. The weather in Ethiopia is primarily managed through topography and seasonal variations in the Inter-Tropical Convergence Zone [61]. Ethiopia has a two-season tropical climate. The magnitude of rainfall varies with topography, location, and elevation. The catchment falls within the humid tropical class with a monomodal rainfall distribution. A semi-arid and humid subtropical weather is typically GGC. The cyclic wave of the intertropical convergence area and numerous panoramas mainly affect the climate conditions in Ethiopia. The GGC has an average annual rainfall and air temperature of 1405.8 mm and 18.5 °C, respectively. There is a dry winter weather season between October and April and a wet season (the summer season) between May and September. The geography of the catchment is typically rugged topography with varied mountains, hills, and plains, with upper plateaus divided by deep V-shaped valleys into the flanks and flat river terraces around the main river.

2.2. Aquifers Recharge Controlling Parameters

Geospatial techniques, a synergistic effect of RS, GIS, and AHP, were employed to combine ten significant proxy data sets which affect groundwater potential and recharge rates. The proxy information was produced from satellite images using a digital image-processing algorithm. The generated proxy layers were prepared with a GIS environment to reclassify and adjust for further interpretation and spatial manipulation. Finally, a set of weights for their features were decided based on personal judgment and experts’ opinion considering their relative significance for aquifer recharging potentiality in the area of interest. The comprehensive workflow approach for this study to delineate the final PARZ is shown in Figure 2.

2.2.1. Rainfall

Rainfall is the primary basis for infiltration and recharge. Groundwater flow and storage capacity depend on the percolation rate in the aquifer [42,62,63]. The rainfall records of GGC and surrounding areas were collected from the National Meteorological Agency. Rainfall maps evolved from the historic rainfall information (1988–2018) measured from meteorological stations inside the study area’s buffer zone. The rainfall map was produced using the soil and water assessment tool (SWAT) in the QGIS environment using the inverse distance weight (IDW) interpolation technique. The rainfall depth plays a significant role in infiltration; consequently, the weight rainfall classes were assigned (Figure 3a). The rainfall classes have been reclassified and ranked into five classes, mainly based on their effect on the flow and storage of groundwater.

2.2.2. Elevation and Slope

The Digital Elevation Model (DEM) is a quantitative demonstration of landscape significant for science, hydrological applications, geologic analyses, and agricultural land management [64]. The required spatial data sets were projected to Adindan UTM Zone 37, the transverse Mercator projection parameter for Ethiopia. For the present study, 30-m grid resolution DEM was used and retrieved from freely available open-source product United States Geological Survey (USGS), Shuttle Radar Topography Mission (SRTM). The slope changes elevation between two locations and directly influences groundwater recharge and infiltration [65]. The water flow energy is driven by the slope [66,67]. Thus, slope and infiltration rate are inversely correlated factors [35,68,69]. This study generated the slope from SRTM DEM (Figure 3c), using the spatial analysis tool in the GIS environment. The slope was then reclassified and ranked into five classes flat, gentle, moderate, high, and steep slopes reliant on aquifers recharging potentiality, as indicated in (Figure 3d).

2.2.3. Land Use/Cover and Soil Map

The land use/cover (LULC) happens mainly due to population increase, urbanization, and anthropogenic activities [70,71], affecting infiltration, runoff, evapotranspiration rates, groundwater quantity, and recharge process [72,73]. LULC data were retrieved from World’s First Global Land Cover Datasets at a 30 m Resolution, GlobeLand30 [74,75,76]. The LULC has been classified into inland water bodies, agricultural land, grassland, forest-mixed, range and shrubland, and settlement and urban. Groundwater recharge is subjective with LULC of the study area [35,70,77,78]. LULC is classified (Figure 4a) according to infiltration capacity suitable for aquifer potential. Soil influences groundwater recharging potential by controlling runoff and infiltration rates [36]. The catchment soil information was acquired from FAO Harmonized World Soil Database (HWSD) [79], a freely accessible open-source/www.fao.org/geonetwork/website (accessed on 23 April 2021). HWSD viewer v 1.21 was used to generate a code for soil properties. First, six dominant soil textures were distinguished, sandy clay loam, loam, clay loam, clay light, clay, and clay-heavy. Then the soil map linked to the soil database intended to hold data for all of the world’s soils. Finally, the soil textures that are suitable for groundwater recharge were analyzed based on FAO classification on infiltration and water holding capacity.

2.2.4. Drainage Density

Drainage density (DD) is the typical flow structure to a pooled point. DD refers to the closeness of stream networks and the total length of channel segment per unit area [69], as indicated in Equation (1). It indicates surface and subsurface formation, soil permeability, infiltration, and runoff. High DD values have high excess surface flow signifying a probability of low groundwater availability [59,80,81,82]. This implies that DD and permeability have an inverse correlation in determining potential aquifer sites [44,83]. In this study, DD was prepared using SRTM DEM by line density tool of the GIS environment and reclassified (Figure 4c) as appropriate for groundwater potential and recharging effects.
DD = i n D i A i
where Di is the stream’s total length (km), and A is the watershed unit area (km2).

2.2.5. Lineament Density

Lineaments are physical discontinuity of the Earth’s surface and linear plan landscapes critical for infiltration [42,84,85]. They are linear features in a terrain that demonstrates a fundamental geological structure such as folds, faults, joints, or fractures as secondary porosity [68,86,87]. Lineaments characterize the weak zones which disturb groundwater flow, increasing infiltration to the subsurface [88]. The thematic layer of LD (km/km2) is defined as the total length of all verified lineaments divided by the unit area of grid cells [68], as given in Equation (2). The lineaments increase groundwater recharging potential implicitly if linked to an aquifer [68]. The lineaments were converted to an LD map using the Line Density Tool in the Spatial Analysis Tool inverse distance to a power function of the GIS environment. The LD was interpolated with Geospatial Data Abstraction Library (GDAL) toolbox with Inverse distance weighted (IDW). Each unit was then given weights on the suitability of infiltration contributions to groundwater, as indicated in (Figure 4d). Thus, high LD areas are suitable for groundwater recharge, and low LD is ideal for groundwater recharge and discharges [81,88,89].
LD = i n L i A i
where Li indicates lineaments’ total length (km), A represents the unit area (km2)

2.2.6. Lithology

Lithology governs the quantity and quality of groundwater occurrence and permeability of aquifer rocks [49,90]. It is a governing factor for empathetic recharge and infiltration processes [39,91,92]. Therefore, lithological characteristics should be examined to define PARZ accurately. The dominant geological materials are volcanic rocks, intercalated basalt flows with quaternary volcanic, lacustrine deposits, and alluvial sediments exposure [93]. The catchment consists of volcanic rocks (37–11 Ma) [94], the alluvial and lacustrine (sandy silt, clay, diatomite, limestone, and beach sand), Eocene and Paleocene-Pleistocene undivided lacustrine and fluvial sediments, sand, silt gravel conglomerate (Omo group), agglomerates, and basalts [20,93]. The spatial occurrence of the different geological materials is very complex and heterogeneous and not known in detail. Each lithology unit has a different impact on groundwater permeability. Hence, it was ranked as the aquifer’s recharging and permeability feature (Figure 4b).

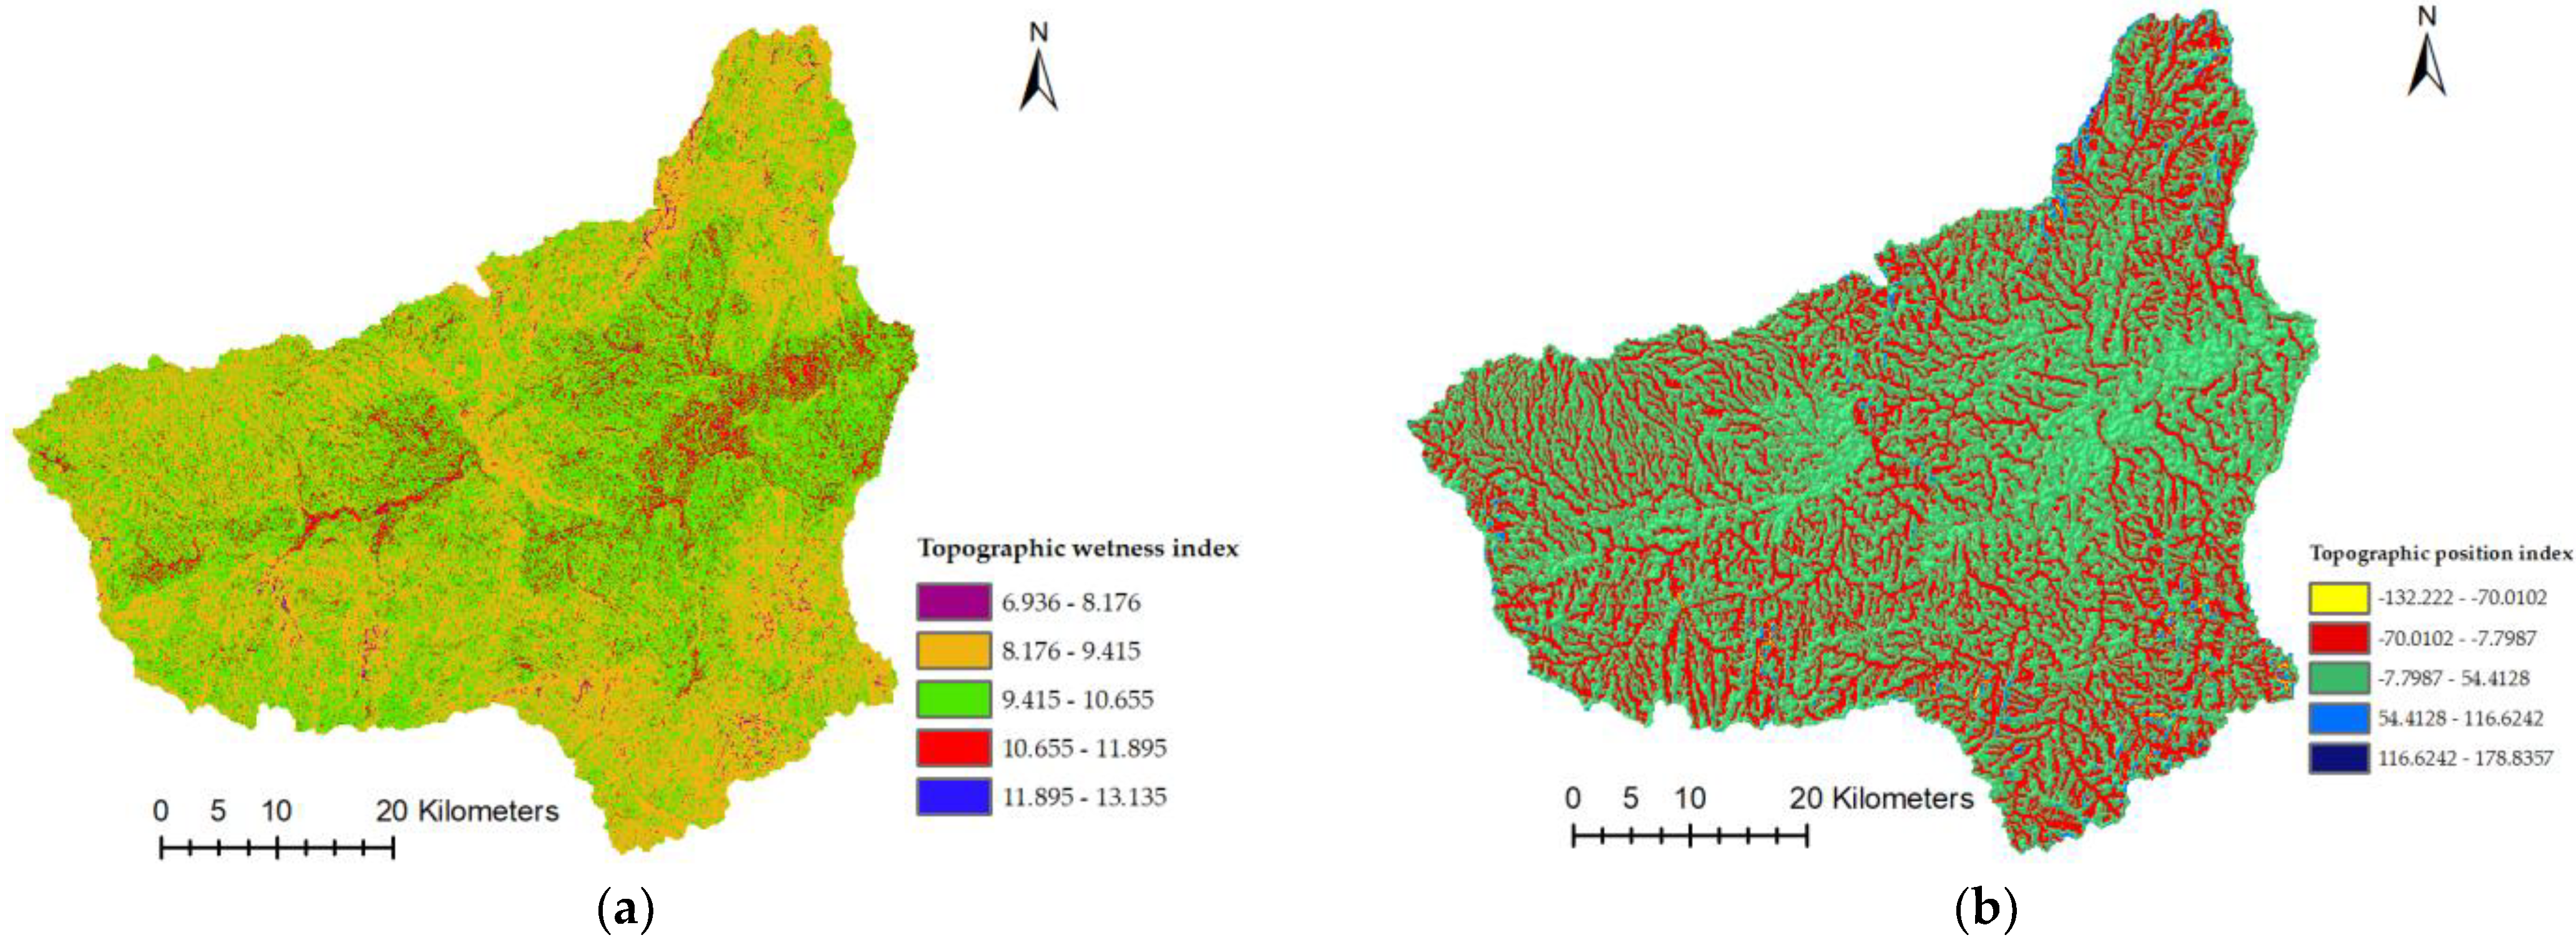
2.2.7. Topographic Position Index

The topographic position index (TPI) is an algorithm extensively applied to quantify topographic positions and systematize land surface categorizations [95]. TPI is a terrain classification method where each data point’s altitude is evaluated against its neighbors [96]. In addition, it is correlated with various physical processes in the given aquifer system [97]. First, a TPI map was produced using the GDAL raster analysis tool of the QGIS environment. Then, the reclassification and ranking were conducted based on each unit’s recharging suitability, as shown (Figure 5a).

2.2.8. Topographic Wetness Index

The topographic wetness index (TWI) measures terrain-driven variation in soil moisture, the subsurface lateral transmissivity, and blends the upslope catchment area of the aquifer system [98,99,100] and downslope drainage for each cell in a DEM [82]. TWI is used to evaluate the landscape influence on hydrological processes of infiltration. TWI was prepared using the TOPMODEL toolbox [101] in the QGIS. This model simulates hydrologic fluxes of water throughout the watershed [82], SAGA terrain analysis tool. Then, reclassified and ranked (Figure 5b) depending on the groundwater recharging capabilities [81].

2.3. Multi-Criteria Decision Analysis

Multi-criteria decision analysis (MCDA) is a technique used for configuring numerous problems and a principle of measurement by pairwise comparison and governed by experts’ decisions [42]. Data normalization is widely used in GIS-based MCDA and diminishes all decision criteria to a standard measurement scale [39,41,57,88]. In this study, MCDA was used to configure numerous pairwise comparisons matrices’ (PCM) to derive priority scales for proxy data layers. The AHP is a powerful tool introduced and developed by Saaty [50] to tackle different decision-making questions providing an MCDA for measuring one unique alternative. Saaty’s AHP was used to normalize hierarchical orders for the comparative effectiveness of various proxy data layers. Then, it creates a PCM based on expert opinions or judgment between the standards chosen. Saaty’s [50] importance scale of intensity relative importance (Table 1) compared the thematic maps classification criteria. The weights were normalized by averaging the values in each row to the corresponding ranking, which gives the normalized weights of each parameter.
The normalized principal eigenvector was computed to find the relative importance of parameters per PCM to find a consistency ratio (CR). The influence of each factor was decided by experts’ knowledge [23,35] and personal judgment. Finally, the PCM of the assigned weights to different thematic layers using [102,103] were normalized using the eigenvector approach [50,104]. The CR, which indicates the suitability of a PCM, was computed to inspect the normalized implications as presented in [50,104,105]. CR is a measurement of the consistency of the PCM and calculated using Equation (3). The comparison of the random consistency index shows how essential a layer is [50]. The consistency index (CI) designates the tolerability of the reciprocal matrix, which is computed with the mean Eigenvalue of the PCM (λmax), random consistency index (RI), and the number of applied parameters (N) [50,106] as in Equations (3) and (4). The CR of the matrix is significant if less than 10% unless the matrix should be re-evaluated based on the (CI) measure tabulated in (Table 2) [104].
CR = CI RI
CI = λ max N   N 1  

2.4. Estimating Spatial Distribution of Recharge Zones

The PCM of the given weight for proxy data classes was constructed and normalized using AHP and the eigenvector approach. Next, a comparative rank for each raster was given depending on the extrapolative implication of groundwater potentiality. Next, the thematic raster layers were overlaid based on weighted overlay analysis (WOA) in the GIS environment. Finally, after the thematic maps were integrated, an output raster map was obtained to classify and quantify the potential aquifer recharge zones.

3. Results and Discussion

3.1. Assessing the Effects of Groundwater Controlling Parameters

Numerous parameters of measurable infiltration rates mainly control the potential aquifer recharge zone map development. Hence, the groundwater movement and occurrence controlling proxy data layers were presented and discussed in the following section according to the degree of infiltration to the subsurface for the potentiality of the aquifer system.

3.1.1. Rainfall and Soil Textures

The annual catchment rainfall ranges from 1152.95–1621.68 mm. The areal rainfall distribution is classified into five as 1152.95–1168.66, 1168.66–1311.29, 1311.29–1506.02, 1506.02–1527.90, and 1527.90–1621.68 mm very low, low, moderate, high, and very high, respectively (Figure 3a). Low rainfall shows low recharge indicating low groundwater potential zones, while the excessive rainfall quantities suggest the chance of high recharge, the potentiality of high groundwater zones. The catchment zones that obtained high rainfall have a chance of getting more percolated water than with low rainfall. In contrast, the high rainfall class is given high ranks as of its significance for groundwater recharge potentiality of the aquifer system. Rainfall infiltrates if the soil has sufficient permeability or goes away as overland flow based on the aquifer’s nature. Therefore, it is reasonable to account for precipitation to determine its influence on groundwater recharge. Similar studies confirmed that rainfall is a critical parameter governing the groundwater potential recharge [23,25,41,53,57].
Soil texture controls the infiltration rate into the subsurface and influences groundwater recharge. The high hydraulic conductivity of the soil allows more infiltration and limits evaporation [29,45,107,108]. Therefore, the study area soil was reclassified and comprised of six soil types (Figure 3b). The soil was characterized by very low to very high infiltration capacity. Therefore, ranks were assigned as sandy clay loam (high), loam (high), clay loam (moderate), clay light (poor), clay (poor), and clay-heavy (very poor) based on infiltration and water holding capacity as suitable for groundwater. The groundwater potential is higher in a coarse-grained structure and very low in a fine-grained structured soil type. The least weight was assigned for clayey soil because clay horizons considerably restrict percolation and have low permeability.

3.1.2. Elevation and Slope

The elevation of the study area varies from 3353 m (highest) to 1674 m (lowest). In elevated areas, runoff conditions are high, and low infiltration indicates water delays over the land surface for percolation [68]. The elevation was reclassified and ranked as suitable for groundwater recharging potential 1674–2009.8 m (very high), 2009.8–2345.6 m (high), 2345.6–2681.4 m (moderate), 2681.4–3017.2 m (low), 3017.2–3353 m (very low) as shown in (Figure 3c). The lower elevation areas were more favorable for groundwater recharge predictions than higher elevations. However, soil texture is the leading cause of percolation in highly elevated areas. Potential groundwater is high at lower elevations with sandy loam soil. The percolation rate varies from low to very low at low elevations with clay soil. Similar studies confirmed that elevation was a good decision and robust parameter for delineating PARZ [59,88,109]. The slope affects groundwater percolation during the overland and base flow [110]. The landscape slope is classified into five classes based on suitability of recharging potential and infiltration rate, then assigned weights to each slope class. The classified slope (in degrees) was 0–5 (Flat), 5–10 (gentle), 10–15 (moderate), 15–30 (hill), and 30–66.18 (steep) with very high, high, moderate, low, and very low, respectively, of recharging suitability (Figure 3d). The slope classes with flat, gentle, moderate, hilly, and steep are 15.41%, 15.61%, 16.53%, 40.77%, and 11.68%, respectively. As steepness increases, the percolation rate decreases due to the high speed of overland flow. Therefore, flat and gentle slopes indicate the presence of high groundwater recharging potentials.

3.1.3. Land Use/Cover and Lithology

The LULC substantially influences infiltration rates [71,72,73,111]. This study ranked LULC classes based on the capacity to infiltrate water into the ground and water holding capacity. Inland water bodies, agricultural land, grassland, forest-mixed, range and shrubland, and settlement and urban (Figure 4a) were weighted and ranked as very high, high, moderate, slightly moderate, low, and very low, respectively, as suitable for recharging potentiality. The LULC classes of GGC constitute about 77.52% (agriculture), 12.08% (grassland), 9.84% (forest-mixed), and others for water bodies, settlement and urban, and range and shrubland. Agricultural land has high groundwater potential with more porosity increasing soil water percolation [48]. An intense agricultural activity changes the hydrologic cycle by causing soil moisture conditions and recharge [70,77]. Waterbodies are the most fundamental and permanent source of groundwater recharge. Forest-mixed sites have lower groundwater recharge rates than grassland increases groundwater recharge [84] and reduce the runoff process by increasing infiltration rates, thereby augmenting groundwater recharge. On the other hand, built areas generate runoff having poor groundwater recharging potential. Other studies have agreed that land use covers are essential in delineating potential groundwater zones [30,47,59,68,86].
Infiltration is predominantly good in plateaus covered by thick alluvial sediments [20]. The dominant lithology is divided into four aquifer subclasses based on permeability and productivity potentials. The study area Lithological unit groundwater prospect classification is adapted from [20], as shown in (Figure 4b). These are very highly permeable-volcanic sand (NMn), lower felsic, volcanic, and sedimentary formation (PNv1), sandy pyroclastic sediments of the Pleistocene-Holocene volcanic group (Qv1), upper felsic volcanic (PNv2). The quaternary sediments are alluvium, river gravels, fans, and travertine [20,112]. The quaternary alluvial has good potential for deposits and structures with higher permeability and productivity [20,112]. If fractured, quaternary volcanic have to yield considerable groundwater flow [113]. Numerous studies confirmed the importance of lithological features in PARZ map development [33,49,57,59,85].

3.1.4. Drainage Density and Lineament Density

Drainage density (DD) influences the distribution of runoff and infiltration [30]. Low DD is associated with widely spaced streams due to less resistant surface materials or high infiltration. Low DD leads to a coarse texture, while high DD is favorable with a high infiltration rate [23,114]. DD (km/km2) values are categorized into five classes as 0–0.18045 (very high), 0.18045–0.54136 (high), 0.54136–1.02256 (moderate), 1.0226–1.6000 (low), and 1.6000–3.0677 (very low) as suitable for groundwater recharge rate rankings, respectively, as revealed in (Figure 4c). High DD values indicate low groundwater availability assigned with low rank having high runoff. The lowest DD values were given the highest level for decreasing runoff in the area, as low DD is related to higher recharge and higher groundwater potentials. High DD indicates impermeable sub-surface and mountainous relief. On the other hand, the low DD of the watershed reveals that it is composed of permeable subsurface, good land cover, and more infiltration capacity. Similar studies confirmed the applicability of DD in mapping potential groundwater zone [23,25,30,47,89]. Lineament density (LD) is directly relational to the groundwater perspective [85,89]. The LD (km/km2) was determined and reclassified into five categories, 0–0.3795 (very low), 0.3795–0.6809 (low), 0.6809–0.9711 (moderate), 0.9711–1.3618 (high), and 1.3618–2.8463 (very high) as per prospects of groundwater suitability as shown in (Figure 4d). In a very high LD, there is a high infiltration rate to the subsurface, whereas, in low LD, the rate of infiltration is low [23,25,30,47,114].

3.1.5. Topographic Positioning Index and Topographic Wetness Index

The topographic position index (TPI) is used in figuring out the landscape’s upper, middle, and lower components [97]. High TPI values are located close to the ends of hills, while small TPI is close to valley bottoms [47]. The highest rating is given for low TPI due to the potentiality of groundwater prospects. Accordingly, the TPI of this study was reclassified and ranked (Figure 5a) as −133.22 to −70.0102 (very high), −70.0102 to −7.7987 (high), −7.7987 to 54.4128 (moderate), 54.4128 to 116.6242 (low), and 116.6242 to 178.8357 (very low). These studies confirmed TPI as a vigorous groundwater flow controlling parameter in delineating PARZ [47,115]. The topographic wetness index (TWI) was applied to quantify topographic control of groundwater infiltration capability due to topographical effects [84,116]. The lowest rank was given to the lowest TWI and vice versa. Then, TWI were reclassified into five categories (Figure 5b) 6.936–8.176 (very low), 8.176–9.415 (low), 9.415–10.655 (moderate), 10.655–11.895 (high), and 11.895–13.135 (very high) as suitability for infiltration of soil water into the subsurface. This indicates that TWI considerably influences runoff concentration at the soil surface. Likewise, various studies used TWI as a robust parameter in determining PARZ [47,86,117].

3.2. Multi-Criteria Decision Analysis and Weight Normalization

In this study, the AHP was developed hierarchically, based on expert opinions, weighing the criteria were used to normalize principal eigenvector values depending on MCDA. The MCDA has been widely used in many studies to predict potential groundwater zones [25,40,44,45,67,84]. The weights were normalized and considered by averaging values to find the normalized weights of respective parameters. According to interpretation, the normalized weights of each feature of proxy data layers for groundwater potentiality are indicated in Table 3. In the PCM, the consistency ratio value was less than 0.1, indicating that all experts’ weightings are consistent and suitable for implementation. The calculated normalized principal Eigenvector value (λmax = 11.371). A PCM is consistent only if λmax is equal to or more than the examined thematic layers; otherwise, a new matrix must be created. In the present study, λmax is 11.371 and has ten thematic layers, confirming that there is no need to develop a matrix of new data layers. Hence, the principal eigenvalue (λmax) exemplifies a purpose for the matrix divergence [106]. The λmax was computed depending on the consistency ratio from the PCM of ten parameters. The consistency index was calculated to overcome the consistency ratio formula, which results in CI = 0.1371. Then, taking the RI value as 1.49 from Table 2, the computed consistency ratio (CR = 0.0920), less than 10%, and the given weights were valid for further analysis. The CI and CR were evaluated, and a PCM of ten groundwater-controlling factors was generated in the AHP process. The consistency evaluation indicates that the PARZ s map developed using MCDA is reasonably accurate.

3.3. Evaluating the Spatial Distribution of Potential Recharge Zones

In the present study, the importance of factors is assigned based on experts’ opinions and personal judgment as there is no standard scale for a simple WOA. The thematic layer’s relative weight is defined using a PCM based on the expert judgment of other similar studies [24,30,59,68,69]. These criteria were weighted based on the recharging potentiality by constructing pairwise assessments in MCDA. The maps were reclassified into five classes based on aquifer recharging potentiality to examine the areas with different stages of aquifer recharging potential. The weighted index map of the study area was developed using ten thematic layers with WOA in the GIS environment. The raster layers and their corresponding weights have been assigned to account for relative significance from a recharging perspective. The computed scale importance weighted normalization showed the value of 20.2% for lithology, 15.3% for LULC, 7.3% for topographic wetness index, 8.8% for lineament density, 5.4% for slope, 5.1% for elevation, 8.8% for soil, 14.5% for rainfall, 7.2% for drainage density, and 7.5% for topographic position index. The dominant factors governing the aquifer recharging potential were lithology, rainfall, and LULC, covering about 50% of the total weight. The catchment is delineated into five PARZ zones: very high, high, moderate, low, and very low, combining all reclassified raster layers. The developed map covers very high (29%), high (25%), moderate (28%), low (13%), and very low (5%) of the total area. The developed PARZ map with high potential zones predominantly exists in the Eastern part (Figure 6). Accordingly, most of the southwestern and northeast parts of the catchment are categorized under high and very high groundwater potentiality. As revealed from the consistency index criteria, the selected groundwater controlling factors were reliable.
The very high groundwater potential comprises quaternary alluvium deposits and quaternary volcanics and sediments. In addition, most of the tertiary volcanics and sediments, undivided quaternary alluvium, eluvium, and lacustrine sediments, have high to moderate potential zones. The very high aquifer recharging potential is found in the flat plains of the catchment with high rainfall distribution, which has a very high infiltration potential to the subsurface flow. The high potential zone is due to high lineament density with gentle slope, alluvial plains, and valleys. As a result, quaternary lacustrine sediment controls dominate low drainage density, flatter slopes, and agricultural land distribution. Loamy soil, high lineament density, and low drainage density promote groundwater aquifers’ high infiltration rate. The moderate PARZ is mainly agrarian land flatter to gentle slope, with high lineament density and low drainage density. The high elevation and impermeable rock formations increase runoff resulting in low groundwater recharging. Steep slopes and the hilly regions, clay soil, and very high drainage density are the main reasons for low infiltration potential and low groundwater storage capacity.

3.4. Validation of Developed Map

The probability of aquifer recharge zone defined by geospatial techniques is usually validated by matching existing inventory data [67]. The validity of the potential aquifer recharge map was performed by overlaying the point data of inventory wells with the generated PARZ map. In addition, the result has been validated using the available inventory data or pumping wells information in the catchment (Figure 6). The validation points of the PARZ indicated that most of the production wells are located in very high (57%), high (32), and moderate (12%) delineated recharge zones with a productivity rate range of 0.35—21.6 L/s. This supports an agreement between the groundwater inventory data and PARZ defined using geospatial techniques. Based on the distribution of wells and the corresponding yield values, the developed PARZ map was complimented as a proxy for the aquifer productivity of existing pumping wells. Depending on their productivity, most African aquifers [118,119] are classified as very high (>20), high (5–20), moderate (2–5), low-moderate (0.5–2), low (0.1–0.5), very low (<0.1) in liters/second. However, from total inventory wells in the Gilgel Gibe catchment, according to the aquifer productivity classification of most African aquifers [118,119], there exists very high (25%), high (22%), moderate (28%), and low (25%) production wells. Therefore, the developed aquifer recharge map and the production wells are mismatched at some locations. This study verifies that the applicability of proxy data sources to delineate is trustworthy in groundwater development and management. This confirms that the significance of the weighted influencing parameter threshold values through GIS-based overlay analysis as credible support for delineating potential recharge zones is valuable for stakeholders to augment groundwater management and reduce the uncertainty of the decision-making process and resources allocation.

4. Conclusions

In the present study, the integrated application of GIS, RS, and MCDA were applied to identify potential aquifer recharge zones for the proxy data of the Gilgel Gibe catchment, Ethiopia. The study has proven that geospatial techniques can afford suitable proxy data analysis for viable groundwater assessments. An attempt was made to analyze ten governing data layers using GIS and AHP, and the corresponding weights of thematic layers have been assigned considering the relative implication of recharging. Each layer has no equal importance in controlling groundwater flow within the aquifer system. Accordingly, the most significant factors with a weighted value of lithology (20.2%), lineament density (8.8%), slope (5.4%), elevation (5.1%), soil (8.8%), LULC (15.3%), rainfall (14.5%), drainage density (7.2%), topographic position index (7.5%), and topographic wetness index (7.3%), respectively. Accordingly, the assessment revealed that lithology, rainfall, and LULC are dominant factors covering 50% of the controlling groundwater flow in the study area.
The computed consistency ratio (CR = 0.0920), less than 10%, verified that the established results are reasonably accurate and given valid weights. The developed map was classified into five classes: very high, high, moderate, low, and very low groundwater potentiality using weighted overlay analysis with GIS-based AHP analysis. The developed map with high potential predominantly exists in the central, western, and eastern parts. Areas with poor potential contribute to high runoff and relatively low infiltration. Therefore, a very high zone indicates the most appropriate place for productive wells allocations in practical applications. The validation indicated that most of the inventory wells are located in very high (57%), high (32), and moderate (12%) zones. The study is the first attempt to develop potential aquifer recharge zones in the Gilgel Gibe catchment. Hence, the findings are essential in providing insights to reduce complexity in decision-making processes for proper groundwater aquifer management. Furthermore, the study confirms that the applied techniques are helpful for groundwater exploration in varied climates and remote regions. The present study recommends that assessing the amount of exploitable and vulnerable groundwater in the catchment is indispensable for sustainable utilization and ecosystem management.

Author Contributions

Conceptualization, T.D.M. and I.-M.C.; writing—original draft preparation, T.D.M.; writing—review and editing, I.-M.C.; resources and data curation, M.-G.K. and I.-H.K.; visualization, M.-G.K.; supervision, I.-M.C. and S.W.C.; funding acquisition, I.-M.C. and S.W.C. All authors have read and agreed to the published version of the manuscript.

Funding

This research was supported by a grant from a Strategic Research Project (20220178-001) funded by the Korea Institute of Civil Engineering and Building Technology and partially supported by a grant from the Korea Ministry of Environment (MOE) as a Demand Responsive Water Supply Service Program (146515).

Institutional Review Board Statement

Not applicable.

Informed Consent Statement

Not applicable.

Data Availability Statement

Not applicable.

Conflicts of Interest

The authors declare no conflict of interest.

References

  1. Sophocleous, M. Global and Regional Water Availability and Demand: Prospects for the Future. Nat. Resour. Res. 2004, 13, 61–75. [Google Scholar] [CrossRef]
  2. Jha, M.K.; Kamii, Y.; Chikamori, K. Cost-effective Approaches for Sustainable Groundwater Management in Alluvial Aquifer Systems. Water Resour. Manag. 2009, 23, 219–233. [Google Scholar] [CrossRef]
  3. Menon, S.V. Ground Water Management: Need for Sustainable Approach. MPRA (Munich Personal RePEc Archieve) Paper, 15 October, 2007. Available online: https://mpra.ub.uni-muenchen.de/6078 (accessed on 1 January 2020).
  4. Pavelic, P. Groundwater Availability and Use in Sub-Saharan Africa: A Review of 15 Countries; International Water Management Institute (IWMI): Colombo, Sri Lanka, 2012; ISBN 9789290907589. [Google Scholar]
  5. Calow, R.C.; MacDonald, A.M.; Nicol, A.L.; Robins, N.S. Ground Water Security and Drought in Africa: Linking Availability, Access, and Demand. Ground Water 2010, 48, 246–256. [Google Scholar] [CrossRef] [PubMed]
  6. Milly, P.C.D.; Dunne, K.A.; Vecchia, A.V. Global pattern of trends in streamflow and water availability in a changing climate. Nature 2005, 438, 347–350. [Google Scholar] [CrossRef]
  7. Foster, S.S.D.; Chilton, P.J. Groundwater: The processes and global significance of aquifer degradation. Philos. Trans. R. Soc. London. Ser. B Biol. Sci. 2003, 358, 1957–1972. [Google Scholar] [CrossRef] [Green Version]
  8. Chowdhury, A.; Jha, M.K.; Chowdary, V.M.; Mal, B.C. Integrated remote sensing and GIS-based approach for assessing groundwater potential in West Medinipur district, West Bengal, India. Int. J. Remote Sens. 2009, 30, 231–250. [Google Scholar] [CrossRef]
  9. Berhanu, B.; Seleshi, Y.; Melesse, A.M. Surface Water and Groundwater Resources of Ethiopia: Potentials and Challenges of Water Resources Development. In Nile River Basin; Melesse, A.M., Abtew, W., Setegn, S.G., Eds.; Springer: Cham, Switzerland, 2014; Volume 9783319027, pp. 97–117. ISBN 978-3-319-02719-7. [Google Scholar]
  10. Awulachew, S.B.; Erkossa, T.; Namara, R. Irrigation potential in Ethiopia: Constraints and opportunities for enhancing the system. Research Report, International Water Management Institute, Addis Ababa. Gates Open Res. 2010, 2, 1–59. [Google Scholar]
  11. MacDonald, A.M.; Bonsor, H.C.; Dochartaigh, B.É.Ó.; Taylor, R.G. Quantitative maps of groundwater resources in Africa. Environ. Res. Lett. 2012, 7, 024009. [Google Scholar] [CrossRef]
  12. Famiglietti, J.S. The global groundwater crisis. Nat. Clim. Change 2014, 4, 945–948. [Google Scholar] [CrossRef]
  13. Foster, S.; Tuinhof, A.; Van Steenbergen, F. Managed groundwater development for water-supply security in Sub-Saharan Africa: Investment priorities. Water SA 2012, 38, 359–366. [Google Scholar] [CrossRef] [Green Version]
  14. Gumma, M.K.; Pavelic, P. Mapping of groundwater potential zones across Ghana using remote sensing, geographic information systems, and spatial modeling. Environ. Monit. Assess. 2013, 185, 3561–3579. [Google Scholar] [CrossRef]
  15. Macdonald, A.; Dochartaigh, B.Ó. Mapping for Water Supply and Sanitation (WSS) in Ethiopia. Research-inspired Policy and Practice Learning in Ethiopia and the Nile region (RiPPLE). In Working Paper-11, January 2009; WaterAid Ethiopia: Addis Ababa, Ethiopia, 2009. [Google Scholar]
  16. Moges, S. AgWater Solutions Project Case Study Agricultural Use of Ground Water in Ethiopia: Assessment of Potential and Analysis of Economics, Policies, Constraints and Opportunities. Gates Open Res. 2012, 3, 136. [Google Scholar] [CrossRef]
  17. Dile, Y.T.; Tekleab, S.; Ayana, E.K.; Gebrehiwot, S.G.; Worqlul, A.W.; Bayabil, H.K.; Yimam, Y.T.; Tilahun, S.A.; Daggupati, P.; Karlberg, L.; et al. Advances in water resources research in the Upper Blue Nile basin and the way forward: A review. J. Hydrol. 2018, 560, 407–423. [Google Scholar] [CrossRef]
  18. Chung, I.-M.; Sophocleous, M.A.; Mitiku, D.B.; Kim, N.W. Estimating groundwater recharge in the humid and semi-arid African regions: Review. Geosci. J. 2016, 20, 731–744. [Google Scholar] [CrossRef]
  19. Nimmo, J.; Stonestrom, D.A.; Healy, R.W. Aquifers: Recharge. In Fresh Water and Watersheds, 2nd ed.; CRC Press: Boca Raton, FL, USA, 2020; pp. 11–15. [Google Scholar]
  20. Kebede, S. Groundwater in Ethiopia; Springer: Berlin/Heidelberg, Germany, 2013; ISBN 978-3-642-30390-6. [Google Scholar]
  21. Foster, S.; Kemper, K. Sustainable Groundwater Management: Management. In GW Mate World Bank; Springer: Berlin/Heidelberg, Germany, 2003; p. 6. [Google Scholar]
  22. Tuinhof, A.; Foster, S.; Van Steenbergen, F.; Talbi, A.; Wishart, M. Strategic Overview Series Number 5 Appropriate Groundwater Management Policy for Sub-Saharan Africa in Face of Demographic Pressure and Climatic Variability Sustainable Groundwater Management Contributions to Policy Promotion; World Bank: Washington, DC, USA, 2011. [Google Scholar]
  23. Ahmad, I.; Dar, M.A.; Andualem, T.G.; Teka, A.H. GIS-based multi-criteria evaluation of groundwater potential of the Beshilo River basin, Ethiopia. J. Afr. Earth Sci. 2020, 164, 103747. [Google Scholar] [CrossRef]
  24. Fenta, A.A.; Kifle, A.; Gebreyohannes, T.; Hailu, G. Spatial analysis of groundwater potential using remote sensing and GIS-based multi-criteria evaluation in Raya Valley, northern Ethiopia. Hydrogeol. J. 2015, 23, 195–206. [Google Scholar] [CrossRef]
  25. Andualem, T.G.; Demeke, G.G. Groundwater potential assessment using GIS and remote sensing: A case study of Guna tana landscape, upper blue Nile Basin, Ethiopia. J. Hydrol. Reg. Stud. 2019, 24, 100610. [Google Scholar] [CrossRef]
  26. Abiy, A.Z.; Melesse, A.M. Evaluation of watershed scale changes in groundwater and soil moisture storage with the application of GRACE satellite imagery data. Catena 2017, 153, 50–60. [Google Scholar] [CrossRef] [Green Version]
  27. Díaz-Alcaide, S.; Martínez-Santos, P. Review: Advances in groundwater potential mapping. Hydrogeol. J. 2019, 27, 2307–2324. [Google Scholar] [CrossRef]
  28. Magesh, N.S.; Chandrasekar, N.; Soundranayagam, J.P. Delineation of groundwater potential zones in Theni district, Tamil Nadu, using remote sensing, GIS and MIF techniques. Geosci. Front. 2012, 3, 189–196. [Google Scholar] [CrossRef] [Green Version]
  29. Fashae, O.A.; Tijani, M.N.; Talabi, A.O.; Adedeji, O.I. Delineation of groundwater potential zones in the crystalline basement terrain of SW-Nigeria: An integrated GIS and remote sensing approach. Appl. Water Sci. 2014, 4, 19–38. [Google Scholar] [CrossRef] [Green Version]
  30. Tolche, A.D. Groundwater potential mapping using geospatial techniques: A case study of Dhungeta-Ramis sub-basin, Ethiopia. Geol. Ecol. Landsc. 2021, 5, 65–80. [Google Scholar] [CrossRef]
  31. Medici, G.; Engdahl, N.B.; Langman, J.B. A Basin-Scale Groundwater Flow Model of the Columbia Plateau Regional Aquifer System in the Palouse (USA): Insights for Aquifer Vulnerability Assessment. Int. J. Environ. Res. 2021, 15, 299–312. [Google Scholar] [CrossRef]
  32. Manna, F.; Walton, K.M.; Cherry, J.A.; Parker, B.L. Mechanisms of recharge in a fractured porous rock aquifer in a semi-arid region. J. Hydrol. 2017, 555, 869–880. [Google Scholar] [CrossRef]
  33. Lentswe, G.B.; Molwalefhe, L. Delineation of potential groundwater recharge zones using analytic hierarchy process-guided GIS in the semi-arid Motloutse watershed, eastern Botswana. J. Hydrol. Reg. Stud. 2020, 28, 100674. [Google Scholar] [CrossRef]
  34. Roy, A.; Keesari, T.; Sinha, U.K.; Sabarathinam, C. Delineating groundwater prospect zones in a region with extreme climatic conditions using GIS and remote sensing techniques: A case study from central India. J. Earth Syst. Sci. 2019, 128, 201. [Google Scholar] [CrossRef] [Green Version]
  35. Singh, S.K.; Zeddies, M.; Shankar, U.; Griffiths, G.A. Potential groundwater recharge zones within New Zealand. Geosci. Front. 2019, 10, 1065–1072. [Google Scholar] [CrossRef]
  36. Nigussie, W.; Hailu, B.T.; Azagegn, T. Mapping of groundwater potential zones using sentinel satellites (−1 SAR and -2A MSI) images and analytical hierarchy process in Ketar watershed, Main Ethiopian Rift. J. Afr. Earth Sci. 2019, 160, 103632. [Google Scholar] [CrossRef]
  37. Abdalla, F.; Moubark, K.; Abdelkareem, M. Groundwater potential mapping using GIS, linear weighted combination techniques and geochemical processes identification, west of the Qena area, Upper Egypt. J. Taibah Univ. Sci. 2020, 14, 1350–1362. [Google Scholar] [CrossRef]
  38. SRINIVASA RAO, Y.; JUGRAN, D.K. Delineation of groundwater potential zones and zones of groundwater quality suitable for domestic purposes using remote sensing and GIS. Hydrol. Sci. J. 2003, 48, 821–833. [Google Scholar] [CrossRef]
  39. Malczewski, J. GIS-based multicriteria decision analysis: A survey of the literature. Int. J. Geogr. Inf. Sci. 2006, 20, 703–726. [Google Scholar] [CrossRef]
  40. Adiat, K.A.N.; Nawawi, M.N.M.; Abdullah, K. Assessing the accuracy of GIS-based elementary multi criteria decision analysis as a spatial prediction tool–A case of predicting potential zones of sustainable groundwater resources. J. Hydrol. 2012, 440–441, 75–89. [Google Scholar] [CrossRef]
  41. Aykut, T. Determination of groundwater potential zones using Geographical Information Systems (GIS) and Analytic Hierarchy Process (AHP) between Edirne-Kalkansogut (northwestern Turkey). Groundw. Sustain. Dev. 2021, 12, 100545. [Google Scholar] [CrossRef]
  42. Agarwal, R.; Garg, P.K. Remote Sensing and GIS Based Groundwater Potential & Recharge Zones Mapping Using Multi-Criteria Decision Making Technique. Water Resour. Manag. 2016, 30, 243–260. [Google Scholar] [CrossRef]
  43. Mukherjee, P.; Singh, C.K.; Mukherjee, S. Delineation of Groundwater Potential Zones in Arid Region of India-A Remote Sensing and GIS Approach. Water Resour. Manag. 2012, 26, 2643–2672. [Google Scholar] [CrossRef]
  44. Chowdhury, A.; Jha, M.K.; Chowdary, V.M. Delineation of groundwater recharge zones and identification of artificial recharge sites in West Medinipur district, West Bengal, using RS, GIS and MCDM techniques. Environ. Earth Sci. 2010, 59, 1209–1222. [Google Scholar] [CrossRef]
  45. Singh, L.K.; Jha, M.K.; Chowdary, V.M. Multi-criteria analysis and GIS modeling for identifying prospective water harvesting and artificial recharge sites for sustainable water supply. J. Clean. Prod. 2017, 142, 1436–1456. [Google Scholar] [CrossRef]
  46. Saraf, A.K.; Choudhury, P.R. Integrated remote sensing and gis for groundwater exploration and identification of artificial recharge sites. Int. J. Remote Sens. 1998, 19, 1825–1841. [Google Scholar] [CrossRef]
  47. Nair, H.C.; Padmalal, D.; Joseph, A.; Vinod, P.G. Delineation of Groundwater Potential Zones in River Basins Using Geospatial Tools—An Example from Southern Western Ghats, Kerala, India. J. Geovisualization Spat. Anal. 2017, 1, 5. [Google Scholar] [CrossRef]
  48. Zghibi, A.; Mirchi, A.; Msaddek, M.H.; Merzougui, A.; Zouhri, L.; Taupin, J.-D.; Chekirbane, A.; Chenini, I.; Tarhouni, J. Using Analytical Hierarchy Process and Multi-Influencing Factors to Map Groundwater Recharge Zones in a Semi-Arid Mediterranean Coastal Aquifer. Water 2020, 12, 2525. [Google Scholar] [CrossRef]
  49. Dar, T.; Rai, N.; Bhat, A. Delineation of potential groundwater recharge zones using analytical hierarchy process (AHP). Geol. Ecol. Landsc. 2010, 56, 699–711. [Google Scholar] [CrossRef] [Green Version]
  50. Saaty, R.W. The analytic hierarchy process—what it is and how it is used. Math. Model. 1987, 9, 161–176. [Google Scholar] [CrossRef] [Green Version]
  51. Bernasconi, M.; Choirat, C.; Seri, R. The Analytic Hierarchy Process and the Theory of Measurement. Manag. Sci. 2010, 56, 699–711. [Google Scholar] [CrossRef] [Green Version]
  52. Bushan, N.; Rai, K. Strategic-Decision-Making-Navneet-Bhushan-and-Kanwal-Rai. Springer: London, UK, 2004; ISBN 1852337567.
  53. Hussein, A.-A.; Govindu, V.; Nigusse, A.G.M. Evaluation of groundwater potential using geospatial techniques. Appl. Water Sci. 2017, 7, 2447–2461. [Google Scholar] [CrossRef] [Green Version]
  54. Murthy, K.S.R.; Mamo, A.G. Multi-criteria decision evaluation in groundwater zones identification in Moyale-Teltele subbasin, South Ethiopia. Int. J. Remote Sens. 2009, 30, 2729–2740. [Google Scholar] [CrossRef]
  55. Nimmo, J.R.; Healy, R.W.; Stonestrom, D.A. Aquifer Recharge. In Encyclopedia of Hydrological Sciences; John Wiley & Sons, Ltd: Chichester, UK, 2005; pp. 2229–2246. ISBN 0470848944. [Google Scholar]
  56. Siebert, S.; Burke, J.; Faures, J.M.; Frenken, K.; Hoogeveen, J.; Döll, P.; Portmann, F.T. Groundwater use for irrigation—A global inventory. Hydrol. Earth Syst. Sci. 2010, 14, 1863–1880. [Google Scholar] [CrossRef] [Green Version]
  57. Yıldırım, Ü. Identification of Groundwater Potential Zones Using GIS and Multi-Criteria Decision-Making Techniques: A Case Study Upper Coruh River Basin (NE Turkey). ISPRS Int. J. Geo-Inf. 2021, 10, 396. [Google Scholar] [CrossRef]
  58. Mengistu, T.D.; Chung, I.-M.; Chang, S.W.; Yifru, B.A.; Kim, M.-G.; Lee, J.; Ware, H.H.; Kim, I.-H. Challenges and Prospects of Advancing Groundwater Research in Ethiopian Aquifers: A Review. Sustainability 2021, 13, 11500. [Google Scholar] [CrossRef]
  59. Berhanu, K.G.; Hatiye, S.D. Identification of Groundwater Potential Zones Using Proxy Data: Case study of Megech Watershed, Ethiopia. J. Hydrol. Reg. Stud. 2020, 28, 100676. [Google Scholar] [CrossRef]
  60. Ganapuram, S.; Kumar, G.T.V.; Krishna, I.V.M.; Kahya, E.; Demirel, M.C. Mapping of groundwater potential zones in the Musi basin using remote sensing data and GIS. Adv. Eng. Softw. 2009, 40, 506–518. [Google Scholar] [CrossRef]
  61. Fazzini, M.; Bisci, C.; Billi, P. The Climate of Ethiopia. In World Geomorphological Landscapes; 2015; pp. 65–87. ISBN 9789401780261. [Google Scholar]
  62. Selvam, S.; Dar, F.A.; Magesh, N.S.; Singaraja, C.; Venkatramanan, S.; Chung, S.Y. Application of remote sensing and GIS for delineating groundwater recharge potential zones of Kovilpatti Municipality, Tamil Nadu using IF technique. Earth Sci. Inform. 2016, 9, 137–150. [Google Scholar] [CrossRef]
  63. Terzer, S.; Wassenaar, L.I.; Araguás-Araguás, L.J.; Aggarwal, P.K. Global isoscapes for δ18O and δ2H in precipitation: Improved prediction using regionalized climatic regression models. Hydrol. Earth Syst. Sci. 2013, 17, 4713–4728. [Google Scholar] [CrossRef]
  64. Moura-Bueno, J.M.; Dalmolin, R.S.D.; Ten Caten, A.; Ruiz, L.F.C.; Ramos, P.V.; Dotto, A.C. Assessment of Digital Elevation Model for Digital Soil Mapping in a Watershed with Gently Undulating Topography. Rev. Bras. Ciência Do Solo 2016, 40, 1–15. [Google Scholar] [CrossRef] [Green Version]
  65. Grinevskii, S.O. The effect of topography on the formation of groundwater recharge. Mosc. Univ. Geol. Bull. 2014, 69, 47–52. [Google Scholar] [CrossRef]
  66. Awawdeh, M.; Obeidat, M.; Al-Mohammad, M.; Al-Qudah, K.; Jaradat, R. Integrated GIS and remote sensing for mapping groundwater potentiality in the Tulul al Ashaqif, Northeast Jordan. Arab. J. Geosci. 2014, 7, 2377–2392. [Google Scholar] [CrossRef]
  67. Allafta, H.; Opp, C.; Patra, S. Identification of Groundwater Potential Zones Using Remote Sensing and GIS Techniques: A Case Study of the Shatt Al-Arab Basin. Remote Sens. 2020, 13, 112. [Google Scholar] [CrossRef]
  68. Yeh, H.-F.; Cheng, Y.-S.; Lin, H.-I.; Lee, C.-H. Mapping groundwater recharge potential zone using a GIS approach in Hualian River, Taiwan. Sustain. Environ. Res. 2016, 26, 33–43. [Google Scholar] [CrossRef] [Green Version]
  69. Rahmati, O.; Nazari Samani, A.; Mahdavi, M.; Pourghasemi, H.R.; Zeinivand, H. Groundwater potential mapping at Kurdistan region of Iran using analytic hierarchy process and GIS. Arab. J. Geosci. 2015, 8, 7059–7071. [Google Scholar] [CrossRef]
  70. Riley, D.; Mieno, T.; Schoengold, K.; Brozović, N. The impact of land cover on groundwater recharge in the High Plains: An application to the Conservation Reserve Program. Sci. Total Environ. 2019, 696, 133871. [Google Scholar] [CrossRef]
  71. Owuor, S.O.; Butterbach-Bahl, K.; Guzha, A.C.; Rufino, M.C.; Pelster, D.E.; Díaz-Pinés, E.; Breuer, L. Groundwater recharge rates and surface runoff response to land use and land cover changes in semi-arid environments. Ecol. Process. 2016, 5, 16. [Google Scholar] [CrossRef] [Green Version]
  72. Jinno, K.; Tsutsumi, A.; Alkaeed, O.; Saita, S.; Berndtsson, R. Effects of land-use change on groundwater recharge model parameters. Hydrol. Sci. J. 2009, 54, 300–315. [Google Scholar] [CrossRef]
  73. Adhikari, R.K.; Mohanasundaram, S.; Shrestha, S. Impacts of land-use changes on the groundwater recharge in the Ho Chi Minh city, Vietnam. Environ. Res. 2020, 185, 109440. [Google Scholar] [CrossRef] [PubMed]
  74. Zhang, W.W.; Chen, J.; Liao, A.P.; Han, G.; Chen, X.H.; Chen, L.J.; Peng, S.; Wu, H.; Zhang, J. Geospatial knowledge-based verification and improvement of GlobeLand30. Sci. China Earth Sci. 2016, 59, 1709–1719. [Google Scholar] [CrossRef]
  75. Chen, J.; Chen, J.; Liao, A.; Cao, X.; Chen, L.; Chen, X.; He, C.; Han, G.; Peng, S.; Lu, M.; et al. Global land cover mapping at 30m resolution: A POK-based operational approach. ISPRS J. Photogramm. Remote Sens. 2015, 103, 7–27. [Google Scholar] [CrossRef] [Green Version]
  76. Chen, J.; Chen, J. GlobeLand30: Operational global land cover mapping and big-data analysis. Sci. China Earth Sci. 2018, 61, 1533–1534. [Google Scholar] [CrossRef]
  77. Scanlon, B.R.; Reedy, R.C.; Stonestrom, D.A.; Prudic, D.E.; Dennehy, K.F. Impact of land use and land cover change on groundwater recharge and quality in the southwestern US. Glob. Chang. Biol. 2005, 11, 1577–1593. [Google Scholar] [CrossRef]
  78. Razandi, Y.; Pourghasemi, H.R.; Neisani, N.S.; Rahmati, O. Application of analytical hierarchy process, frequency ratio, and certainty factor models for groundwater potential mapping using GIS. Earth Sci. Inform. 2015, 8, 867–883. [Google Scholar] [CrossRef]
  79. Nachtergaele, F.; Van Velthuizen, H.; Verelst, L.; Batjes, N.; Dijkshoorn, K.; Van Engelen, V.; Fischer, G.; Jones, A.; Montanarella, L.; Petri, M.; et al. Harmonized World Soil Database. In Proceedings of the 19th World Congress of Soil Science, Soil Solutions for a Changing World, Brisbane, Australia, 1–6 August 2010. [Google Scholar]
  80. Manap, M.A.; Sulaiman, W.N.A.; Ramli, M.F.; Pradhan, B.; Surip, N. A knowledge-driven GIS modeling technique for groundwater potential mapping at the Upper Langat Basin, Malaysia. Arab. J. Geosci. 2013, 6, 1621–1637. [Google Scholar] [CrossRef]
  81. Arunbose, S.; Srinivas, Y.; Rajkumar, S.; Nair, N.C.; Kaliraj, S. Remote sensing, GIS and AHP techniques based investigation of groundwater potential zones in the Karumeniyar river basin, Tamil Nadu, southern India. Groundw. Sustain. Dev. 2021, 14, 100586. [Google Scholar] [CrossRef]
  82. Kopecký, M.; Macek, M.; Wild, J. Topographic Wetness Index calculation guidelines based on measured soil moisture and plant species composition. Sci. Total Environ. 2021, 757, 143785. [Google Scholar] [CrossRef] [PubMed]
  83. Kaliraj, S.; Chandrasekar, N.; Magesh, N.S. Identification of potential groundwater recharge zones in Vaigai upper basin, Tamil Nadu, using GIS-based analytical hierarchical process (AHP) technique. Arab. J. Geosci. 2014, 7, 1385–1401. [Google Scholar] [CrossRef]
  84. Arulbalaji, P.; Padmalal, D.; Sreelash, K. GIS and AHP Techniques Based Delineation of Groundwater Potential Zones: A case study from Southern Western Ghats, India. Sci. Rep. 2019, 9, 2082. [Google Scholar] [CrossRef] [PubMed]
  85. Varade, A.M.; Khare, Y.D.; Yadav, P.; Doad, A.P.; Das, S.; Kanetkar, M.; Golekar, R.B. ‘Lineaments’ the Potential Groundwater Zones in Hard Rock Area: A Case Study of Basaltic Terrain of WGKKC-2 Watershed from Kalmeswar Tehsil of Nagpur District, Central India. J. Indian Soc. Remote Sens. 2018, 46, 539–549. [Google Scholar] [CrossRef]
  86. Abrams, W.; Ghoneim, E.; Shew, R.; LaMaskin, T.; Al-Bloushi, K.; Hussein, S.; AbuBakr, M.; Al-Mulla, E.; Al-Awar, M.; El-Baz, F. Delineation of groundwater potential (GWP) in the northern United Arab Emirates and Oman using geospatial technologies in conjunction with Simple Additive Weight (SAW), Analytical Hierarchy Process (AHP), and Probabilistic Frequency Ratio (PFR) techniques. J. Arid Environ. 2018, 157, 77–96. [Google Scholar] [CrossRef]
  87. Igor, V. Florinsky Digital Terrain Analysis in Soil Science and Geology; Elsevier: Amsterdam, The Netherlands, 2012; ISBN 9780123850362. [Google Scholar]
  88. Pinto, D.; Shrestha, S.; Babel, M.S.; Ninsawat, S. Delineation of groundwater potential zones in the Comoro watershed, Timor Leste using GIS, remote sensing and analytic hierarchy process (AHP) technique. Appl. Water Sci. 2017, 7, 503–519. [Google Scholar] [CrossRef] [Green Version]
  89. Maity, D.K.; Mandal, S. Identification of groundwater potential zones of the Kumari river basin, India: An RS & GIS based semi-quantitative approach. Environ. Dev. Sustain. 2019, 21, 1013–1034. [Google Scholar] [CrossRef]
  90. Arabameri, A.; Rezaei, K.; Cerda, A.; Lombardo, L.; Rodrigo-Comino, J. GIS-based groundwater potential mapping in Shahroud plain, Iran. A comparison among statistical (bivariate and multivariate), data mining and MCDM approaches. Sci. Total Environ. 2019, 658, 160–177. [Google Scholar] [CrossRef]
  91. Gates, J.B.; Steele, G.V.; Nasta, P.; Szilagyi, J. Lithologic influences on groundwater recharge through incised glacial till from profile to regional scales: Evidence from glaciated Eastern Nebraska. Water Resour. Res. 2014, 50, 466–481. [Google Scholar] [CrossRef] [Green Version]
  92. Saravanan, S.; Saranya, T.; Jennifer, J.J.; Singh, L.; Selvaraj, A.; Abijith, D. Delineation of groundwater potential zone using analytical hierarchy process and GIS for Gundihalla watershed, Karnataka, India. Arab. J. Geosci. 2020, 13, 695. [Google Scholar] [CrossRef]
  93. Regassa, A.; Van Daele, K.; De Paepe, P.; Dumon, M.; Deckers, J.; Asrat, A.; Van Ranst, E. Characterizing weathering intensity and trends of geological materials in the Gilgel Gibe catchment, southwestern Ethiopia. J. Afr. Earth Sci. 2014, 99, 568–580. [Google Scholar] [CrossRef]
  94. Bonini, M.; Corti, G.; Innocenti, F.; Manetti, P.; Mazzarini, F.; Abebe, T.; Pecskay, Z. Evolution of the Main Ethiopian Rift in the frame of Afar and Kenya rifts propagation. Tectonics 2005, 24. [Google Scholar] [CrossRef]
  95. De Reu, J.; Bourgeois, J.; Bats, M.; Zwertvaegher, A.; Gelorini, V.; De Smedt, P.; Chu, W.; Antrop, M.; De Maeyer, P.; Finke, P.; et al. Application of the topographic position index to heterogeneous landscapes. Geomorphology 2013, 186, 39–49. [Google Scholar] [CrossRef]
  96. Muddarisna, N.; Yuniwati, E.D.; Masruroh, H.; Oktaviansyah, A.R. An Automated Approach Using Topographic Position Index (TPI) for Landform Mapping (Case Study: Gede Watershed, Malang Regency, East Java, Indonesia). IOP Conf. Ser. Earth Environ. Sci. 2020, 412, 012027. [Google Scholar] [CrossRef]
  97. Mokarram, M.; Roshan, G.; Negahban, S. Landform classification using topography position index (case study: Salt dome of Korsia-Darab plain, Iran). Model. Earth Syst. Environ. 2015, 1, 40. [Google Scholar] [CrossRef] [Green Version]
  98. Moore, I.D.; Grayson, R.B.; Ladson, A.R. Digital terrain modelling: A review of hydrological, geomorphological, and biological applications. Hydrol. Processes 1991, 5, 3–30. [Google Scholar] [CrossRef]
  99. Sørensen, R.; Zinko, U.; Seibert, J. On the calculation of the topographic wetness index: Evaluation of different methods based on field observations. Hydrol. Earth Syst. Sci. 2006, 10, 101–112. [Google Scholar] [CrossRef] [Green Version]
  100. Beven, K.J.; Kirkby, M.J. A physically based, variable contributing area model of basin hydrology / Un modèle à base physique de zone d’appel variable de l’hydrologie du bassin versant. Hydrol. Sci. Bull. 1979, 24, 43–69. [Google Scholar] [CrossRef] [Green Version]
  101. Beven, K. Topmodel: A critique. Hydrol. Processes 1997, 11, 1069–1085. [Google Scholar] [CrossRef]
  102. Saaty, T.L. Decision making with the analytic hierarchy process. Int. J. Serv. Sci. 2008, 1, 83. [Google Scholar] [CrossRef] [Green Version]
  103. Saaty, T.L. Highlights and critical points in the theory and application of the Analytic Hierarchy Process. Eur. J. Oper. Res. 1994, 74, 426–447. [Google Scholar] [CrossRef]
  104. Saaty, T.L. How to make a decision: The analytic hierarchy process. Eur. J. Oper. Res. 1990, 48, 9–26. [Google Scholar] [CrossRef]
  105. Podvezko, V. Application of AHP Technique. J. Bus. Econ. Manag. 2009, 10, 181–189. [Google Scholar] [CrossRef] [Green Version]
  106. Brunelli, M. Introduction to the Analytic Hierarchy Process; SpringerBriefs in Operations Research; Springer: Cham, Switzerland, 2015; ISBN 978-3-319-12501-5. [Google Scholar]
  107. Kebede, S.; Travi, Y.; Asrat, A.; Alemayehu, T.; Ayenew, T.; Tessema, Z. Groundwater origin and flow along selected transects in Ethiopian rift volcanic aquifers. Hydrogeol. J. 2008, 16, 55–73. [Google Scholar] [CrossRef]
  108. Besbes, M.; De Marsily, G. From infiltration to recharge: Use of a parametric transfer function. J. Hydrol. 1984, 74, 271–293. [Google Scholar] [CrossRef]
  109. Mallick, J.; Singh, C.K.; Al-Wadi, H.; Ahmed, M.; Rahman, A.; Shashtri, S.; Mukherjee, S. Geospatial and geostatistical approach for groundwater potential zone delineation. Hydrol. Processes 2015, 29, 395–418. [Google Scholar] [CrossRef]
  110. Chenini, I.; Ben Mammou, A.; El May, M. Groundwater Recharge Zone Mapping Using GIS-Based Multi-criteria Analysis: A Case Study in Central Tunisia (Maknassy Basin). Water Resour. Manag. 2010, 24, 921–939. [Google Scholar] [CrossRef]
  111. Cherkauer, D.S.; Ansari, S.A. Estimating Ground Water Recharge from Topography, Hydrogeology, and Land Cover. Ground Water 2005, 43, 102–112. [Google Scholar] [CrossRef]
  112. Ajay Kumar, V.; Mondal, N.C.; Ahmed, S. Identification of Groundwater Potential Zones Using RS, GIS and AHP Techniques: A Case Study in a Part of Deccan Volcanic Province (DVP), Maharashtra, India. J. Indian Soc. Remote Sens. 2020, 48, 497–511. [Google Scholar] [CrossRef]
  113. Medici, G.; Smeraglia, L.; Torabi, A.; Botter, C. Review of Modeling Approaches to Groundwater Flow in Deformed Carbonate Aquifers. Groundwater 2021, 59, 334–351. [Google Scholar] [CrossRef]
  114. Achu, A.L.; Thomas, J.; Reghunath, R. Multi-criteria decision analysis for delineation of groundwater potential zones in a tropical river basin using remote sensing, GIS and analytical hierarchy process (AHP). Groundw. Sustain. Dev. 2020, 10, 100365. [Google Scholar] [CrossRef]
  115. Lee, S.; Hyun, Y.; Lee, S.; Lee, M.-J. Groundwater Potential Mapping Using Remote Sensing and GIS-Based Machine Learning Techniques. Remote Sens. 2020, 12, 1200. [Google Scholar] [CrossRef] [Green Version]
  116. Mallick, J.; Khan, R.A.; Ahmed, M.; Alqadhi, S.D.; Alsubih, M.; Falqi, I.; Hasan, M.A. Modeling Groundwater Potential Zone in a Semi-Arid Region of Aseer Using Fuzzy-AHP and Geoinformation Techniques. Water 2019, 11, 2656. [Google Scholar] [CrossRef] [Green Version]
  117. Benjmel, K.; Amraoui, F.; Boutaleb, S.; Ouchchen, M.; Tahiri, A.; Touab, A. Mapping of Groundwater Potential Zones in Crystalline Terrain Using Remote Sensing, GIS Techniques, and Multicriteria Data Analysis (Case of the Ighrem Region, Western Anti-Atlas, Morocco). Water 2020, 12, 471. [Google Scholar] [CrossRef] [Green Version]
  118. MacDonald, A.M.; Bonsor, H.C. An Initial Estimate of Depth to Groundwater across Africa; Groundwater Science Programme Open Report OR/11/067; British Geological Survey: Nottingham, UK, 2011; 26p. [Google Scholar]
  119. Macdonald, A.; Ochartaigh, B.; Bonsor, H.; Davies, J.; Key, R. Developing Quantitative Aquifer Maps for Africa; British Geological Survey Internal Report IR/10/103; British Geological Survey: Nottingham, UK, 2010; 34p. [Google Scholar]
Figure 1. Location map of the study area.
Water 14 01362 g001
Figure 2. General flowchart of study methodology.
Water 14 01362 g002
Figure 3. Thematic map of (a) Rainfall, (b) Soil, (c) Elevation, (d) Slope.
Water 14 01362 g003
Figure 4. Thematic map of (a) LULC, (b) Lithology, (c) Drainage density, (d) Lineament density.
Water 14 01362 g004
Figure 5. Thematic map of (a) Topographic position index, (b) Topographic wetness index.
Water 14 01362 g005
Figure 6. Spatial distribution of potential aquifer recharge zones of the study area.
Water 14 01362 g006
Table 1. Saaty’s 1–9 scale of relative importance [104].
ScaleImportance
1Equal importance
2Weak importance
3Moderate importance
4Moderate plus
5Strong plus
6Strong importance
7Very strong importance
8Very very strong importance
9Extreme importance
Table 2. Tabulated standards of N for Saaty’s ratio index.
N12345678910
RI000.580.891.121.241.321.411.451.49
Table 3. Normalized weights for proxy layers as suitable for groundwater recharge.
Thematic LayersNormalized Weight (%)CategoryRanksSimilar Efforts
Rainfall14.51152.95–1168.66Very low[23,25,30,41,53,57,59]
1168.66–1311.29Low
1311.29–1506.02Moderate
1506.02–1527.90High
1527.90–1621.68Very high
Lithology20.2NMnHigh[33,49,57,59,85]
PNv1Moderately
Qv1Moderately
PNv2Poor
Land use/cover15.3WATRVery high[25,30,59,68,80,88,89]
AGRCHigh
RNGEModerate
FRSTSlightly moderate
RNGBLow
URBNVery low
Drainage density7.20–0.18045Very high[23,25,30,47,89]
0.18045–0.54136High
0.54136–1.02256Moderate
1.0226–1.6000Low
1.6000–3.0677Very low
Elevation5.11674–2009.8 mVery high[43,59,88,109]
2009.8–2345.6 mHigh
2345.6–2681.4 mModerate
2681.4–3017.2 mLow
3017.2–3353 mVery low
Slope5.40–5Flat[23,25,28,43,53,57,114]
5–10Gentle
10–15Moderate
15–30Hill
30–66.18Steep
Lineament density8.80–0.3795Very low[23,25,30,47,114]
0.3795–0.6809Low
0.6809–0.9711Moderate
0.9711–1.3618High
1.3618–2.8463Very high
Soil8.8Sandy loamHigh[23,25,30,36,53,57,59]
LoamHigh
Clay loamModerate
Clay lightPoor
ClayPoor
Clay-heavyvery poor
Topographic position index7.5−133.22 to −70.0102Very high[47,84,115]
−70.0102 to −7.7987High
−7.7987 to 54.4128Moderate
54.4128 to 116.6242Low
116.6242 to 178.8357Very low
Topographic wetness index7.36.936–8.176Very low[47,84,86,116,117]
8.176–9.415Low
9.415–10.655Moderate
10.655–11.895High
11.895–13.135Very high
Publisher’s Note: MDPI stays neutral with regard to jurisdictional claims in published maps and institutional affiliations.

