Article

Improved Method of Defining Rainfall Intensity and Duration Thresholds for Shallow Landslides Based on TRIGRS

College of Geo-Exploration Science and Technology, Jilin University, Changchun 130026, China
*
Author to whom correspondence should be addressed.
Water 2022, 14(4), 524; https://doi.org/10.3390/w14040524
Submission received: 4 January 2022 / Revised: 8 February 2022 / Accepted: 8 February 2022 / Published: 10 February 2022
(This article belongs to the Special Issue Rainfall-Induced Shallow Landslides Modeling and Warning)

Abstract

:
The Transient Rainfall Infiltration and Grid-Based Regional Slope-Stability (TRIGRS) model has been widely used to define rainfall thresholds for triggering shallow landslides. In this study, the rainfall intensity(I)-duration(D) thresholds for multiple slope units of an area in Pu’an County, Guizhou Province, China were defined based on TRIGRS. Given that TRIGRS is used to simulate the slope stability under the conditions of a given increasing sequence of I-D data, if the slope reaches instability at I = a, D = b, it will also become unstable in the case of I = a, D > b or I > a, D = b. To explore the effect of these I-D data with the same I or D values on the definition of I-D thresholds and the best method to exclude these data, two screening methods were used to exclude the I-D data that caused instability in the TRIGTS simulation. First, I-D data with the same I values when D values are greater than a certain limit value were excluded. Second, several D values were selected to exclude I-D data with the same I values for a slope unit. Then, an I value was selected to exclude I-D data with the same D values. After screening, two different I-D thresholds were defined. The comparison with the thresholds defined without screening shows that the I-D data with the same I or D values will reduce the accuracy of thresholds. Moreover, the second screening method can entirely exclude these data.

1. Introduction

Shallow landslides are a common global hazard. Shallow landslides mainly occur on the slopes composed of an impermeable bedrock and a shallow stratum of soil [1,2]. Guizhou province is located in the southwest of China. Due to the widespread distribution of soft rocks easily weathered into deposits and the rainy environment, shallow landslides frequently occur [3,4,5,6]. Rainfall is considered the primary trigger of shallow landslides [7,8,9]. The reason for this is that rainfall infiltration can increase the pore water pressure of soil and decrease the shear strength of soil [10,11,12]. Thus, rainfall thresholds have been widely used in landslide early warning [13,14,15,16,17,18]. Currently, rainfall thresholds have become a key component in landslide early warning system (LEWS) to reduce the risk of landslides [19,20]. Many variables can be used to define rainfall thresholds: (i) rainfall intensity (I) [13,16,21,22,23]; (ii) rainfall duration (D); (iii) accumulated event rainfall (E) [24,25,26,27]; (iv) antecedent rainfall [28,29].
Rainfall thresholds can be defined using statistically and physically based methods [20,30]. Statistical methods are used to define rainfall thresholds through statistical analysis of historical landslides and corresponding rainfall records [31]. The definitions of rainfall thresholds based on statistical methods are widely used globally given their simplicity. However, statistical methods are severely limited when landslide inventory is unavailable or incomplete [32,33,34]. Physically based methods through simulation of the internal hydrological process of soil and slope stability under rainfall conditions are used to define rainfall thresholds [35,36]. Thus, physically based methods do not rely on the quality and quantity of landslide inventory. For areas where landslide inventory is incomplete or unavailable, physically based methods can be ideal alternatives to statistical methods.
TRIGRS is a shallow landslide prediction model combining 1-D transient infiltration model and slope stability analysis [37,38,39]. As a shallow landslide prediction model, TRIGRS has been widely used to predict the timing and location of shallow landslides [40,41,42,43,44,45] and susceptibility assessment [39,46,47,48]. Since TRIGRS can describe the scaling behavior of rainfall thresholds [49]. TRIGRS has been gradually used in the definition of rainfall thresholds [50,51]. Alvioli et al. utilized TRIGRS to define the I-D thresholds that trigger shallow landslides in many sub-basins of the Upper Tiber River Basin, Italy [49]. The study defined I-D thresholds at slope unit scale, i.e., each slope unit with critical rainfall corresponds to a threshold. Alvioli et al. utilized TRIGRS to determine the E-D thresholds in the Upper Tiber River Basin [52]. Marin et al. utilized TRIGRS to define the I-D threshold of the Envigado Basin in Colombia [53]. Marin et al. utilized TRIGRS to define the I-D thresholds of 93 small basins in the Colombian Andes [54]. These studies defined rainfall thresholds at the basin scale, that is, a basin corresponds to a threshold, and the rainfall conditions of the defined threshold represent the occurrence of several shallow landslides in the basin.
Recently, Marin proposed a new method of utilizing TRIGRS to define I-D thresholds at the grid cell scale [55]. This method can define the distributed I-D thresholds for the grid cells with critical rainfall. Marin defined the distributed I-D thresholds for each grid cell with critical intensity in the Envigado Basin [55]. Subsequently, Marin et al. utilized TRIGRS to define I-D thresholds of La Arenosa and La Liboriana Basins in Colombian Andes at the basin and grid cell scales, respectively [56].
Whatever TRIGRS is utilized to define the I-D thresholds at any scale, TRIGRS is used to simulate the slope stability under a given increasing sequence of I-D data to determine the data that cause instability. The mentioned studies processed the I-D data determined by TRIGRS differently before fitting to define rainfall thresholds. When defining the I-D thresholds at the basin and grid cell scales, Marin et al. excluded the I-D data with repeated I values when the D values were above 10 h before fitting [53,54,55,56]. However, Alvioli et al. did not exclude any I-D data before fitting at the slope unit scale [49]. Thus, whether screening I-D data before fitting is required when defining I-D thresholds at the slope unit scale remains underinvestigated.
Marin et al. explained the reason for excluding the I-D data is the variation in the critical intensity is significantly reduced for long durations [53,54,55,56]. However, during the simulation of TRIGRS, if instability exists at I = a, D = b, it will also exist at I = a, D = b + α … I = a, D = b + nα or I = a + α, D = b… I = a + nα, D = b (α represents the increment step). These I-D data with the same I or D values show that not only does the critical intensity become constant for a long duration, but the critical duration also becomes constant for a great intensity. Thus, the screening method proposed by Marin et al. has limitations.
Marin et al. proposed to exclude the repeated I values when the D values are above 10 h [38,39,40,41]. However, what effect these data have on the definition of the rainfall threshold and whether the screening method proposed by Marin et al. can completely exclude these data remain underinvestigated.
This study aims to improve the screening method of using TRIGRS to define the I-D rainfall thresholds. The objectives of this study can be summarized as follows: (i) exploring whether screening I-D data is required when defining threshold at the slope unit scale; (ii) exploring the effect of I-D data with the same I or D values on the definition of I-D thresholds; (iii) determining the best way to exclude the I-D data with the same I or D values. To this end, this study took an area of Pu’an county in Guizhou province as the study area to define I-D thresholds at the slope unit scale. After utilizing TRIGRS to determine the I-D data that caused the instability of each slope unit in the study area, two screening methods were used to exclude the I-D data with the same I or D values. Then, two different I-D thresholds were defined. Finally, this study compares the two thresholds with the thresholds defined without screening.

2. Study Area and Data
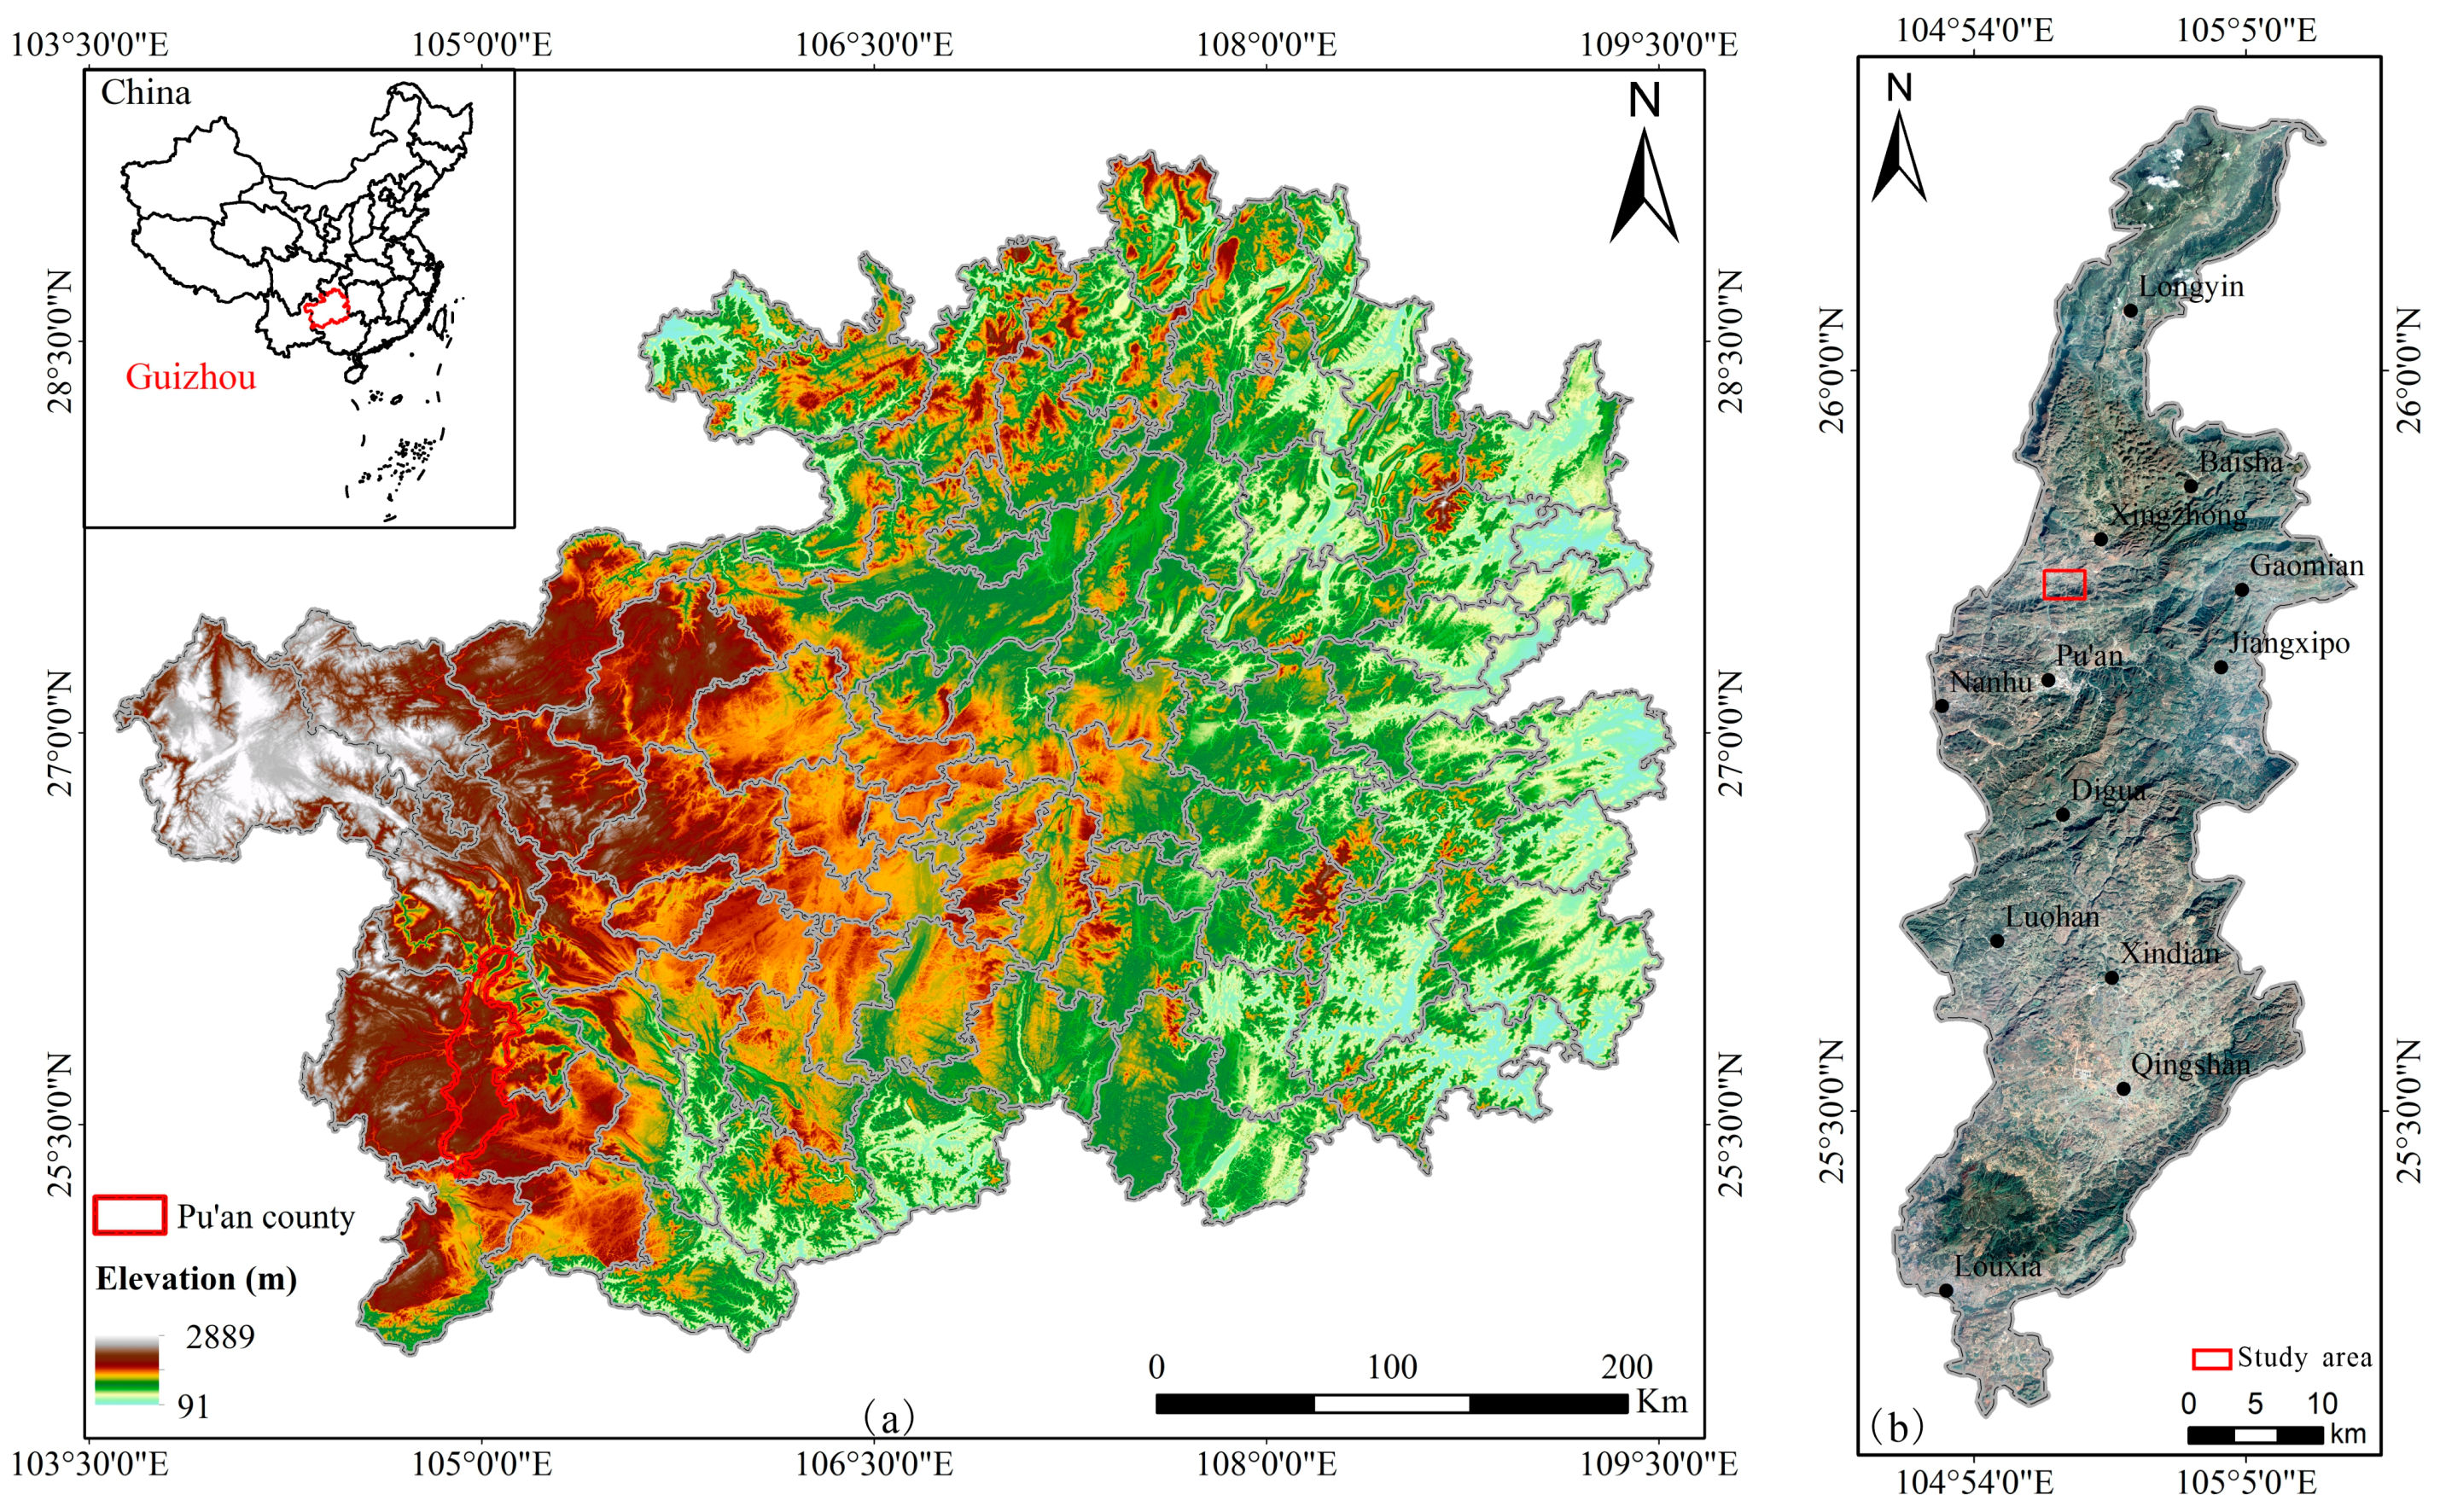
2.1. Study Area

Guizhou province is located in the southwest of China (Figure 1a). Pu’an County is a county of the Qianxinan Prefecture in the southwest of Guizhou province (Figure 1b). Pu’an county is one amongst several landslide-prone counties of Guizhou province. In the county, geological condition is extremely complicated, and terrain undulates terribly, intersecting with rivers and valleys. In the Dabang village study area, Lower Triassic sandstone, siltstone, clay rock and Upper Permian mudstone, siltstone and clay rock are the most widely distributed (Figure 2a). These rocks have poor shear strength and weather easily. The eluvium and slope wash formed easily cause landslides and debris flows. The soil types in the study area are red loam and lime soil. Red loam is mainly distributed on the sandstone, basalt and mudstone in the study area. Lime soil is mainly distributed on the limestone (Figure 2b). Records of past landslide events are lacking in the study area due to the lack of standard operational protocols to investigate landslides.
The annual average precipitation in Pu’an county is 1443.0 mm, the annual maximum and minimum precipitations are 1841.3 mm and 955.6 mm, respectively. The maximum daily precipitation is 146.7 mm, and the maximum hourly precipitation is 38.7 mm. The rainfall is mainly concentrated in June to August, accounting for 82% of the annual precipitation. In this study, Pu’an county, a landslide-prone area in Dabang village, was taken as the study area.

2.2. Digital Elevation Model

Digital elevation model provides the basic data for TRIGRS simulation. This study took DEM with a resolution of 10 m generated from a 1:10,000 topographic map as input. Moreover, TRIGRS requires slope and flow direction maps as input. These maps were all generated using ArGIS software.

2.3. Geotechnical Parameters

When utilizing TRIGRS for simulation, geotechnical parameters, such as unit weight ( γ s ), internal friction angle ( ϕ ), cohesion ( c ), and saturated hydraulic conductivity ( K s ), hydraulic diffusivity ( D 0 ), saturated water content ( θ s ) and residual water content ( θ r ) of the soil must be input. A total of 15 sampls locations were taken for field sampling in the Dabang village study area (Figure 2a and Figure 3). We collected undisturbed samples at depths ranging from 1 m to 1.2 m at each sampling location. In total, 18 samples of red loam and 12 samples of lime soil were collected. The parameters were measured by laboratory static triaxial and variable tap penetration experiments (Table S1). The average of the measurements for each parameter was taken as the input to TRIGRS (Table 1) [57]. As for the saturated water content and residual water content, this study took the parameters of corresponding soil types in the geotechnical handbook of the neighboring area with similar geology and geomorphic setting [58,59,60]. The input parameters of each type of soil were assigned to each grid cell based on the distribution map of the soil types in the study area (Figure 2b).
TRIGRS simulation also requires input of initial conditions, which include initial surface flux and initial groundwater table. Initial surface flux was set to be 0.01 of K s , as suggested by [47,61]. Initial groundwater table was set at the same depth of soil thickness, as suggested by [41,43].

2.4. Spatial Distribution of Soil Depth

TRIGRS must input the soil thickness, which significantly influences the stability simulation results [44] and the hydrological response of slope [62,63]. Using a fixed soil thickness may give unreasonable results in some areas. Moreover, given the complexity of the soil structure of the study area, finding a representative soil thickness for simulation is difficult. Several studies constructed a soil thickness map through the relationship between soil thickness and slope [64,65]. Thus, we assumed a linear relationship between slope and soil thickness to represent the spatial distribution of soil thickness, as suggested by [44,45,61].
This linear relationship assumes slope is inversely proportional to soil thickness. Following this approach, the soil thickness (y) and the corresponding slope (x) can be calculated by the Equation (1). The soil thickness of each grid cell in the study area was calculated by this equation. The units of y and x are meter and degree, respectively.
y = 0.03437 x + 2.3 ,

3. Method

3.1. Transient Rainfall Infiltration and Grid-Based Regional Slope-Stability Model

TRIGRS is a model that computes the transient pore-pressure changes and attendant changes in the factor of safety of slope cause by rainfall infiltration for simulating the timing and distribution of rainfall-induced shallow landslides [37,38,39]. For saturated initial conditions, TRIGRS is based on the linearized solution of Richards equation [66] proposed by [67]. For unsaturated initial conditions, TRIGRS is based on the analytical solution of Richards equation for unsaturated soil proposed by [68], and exponential hydraulic parameter model proposed by [69].
Slope stability in TRIGRS is analyzed on the basis of the infinite slope-model that assumes failure planes are parallel to the ground, and ignores the force between neighboring grid cells in the sliding mass [70]. The stability of the slope is characterized by the factor of safety, F s , which can be calculated as follows:
F s ( Z , t ) = tan ϕ tan δ + c ψ ( Z , t ) γ w tan ϕ γ S Z sin δ cos δ ,
where c is the effective cohesion of the soil, ϕ is the effective internal friction angle of the soil, δ is the slope angle, ψ ( Z , t ) is the pressure head as a function of depth Z and time t . Stability is predicted when F s 1 and failure when F s < 1 . This study uses the latest version (v2.1) of TRIGRS to simulate [71].

3.2. Delineation of Slope Units

The delineation of slope units in this study followed the method proposed by [72,73]. In this method, the delineation of slope units is based on the ridge and valley lines. First, ridge lines were divided by successively processing DEM data in ArcGIS. The process includes fill, flow direction, flow accumulation, stream link, watershed, and raster to polygon. Then, valley lines were divided by processing reverse DEM data following the first step. Third, the delineation of slope units was obtained by combing the ridge valley lines. Finally, the obtained slope units were modified manually according to aspect and gradient.

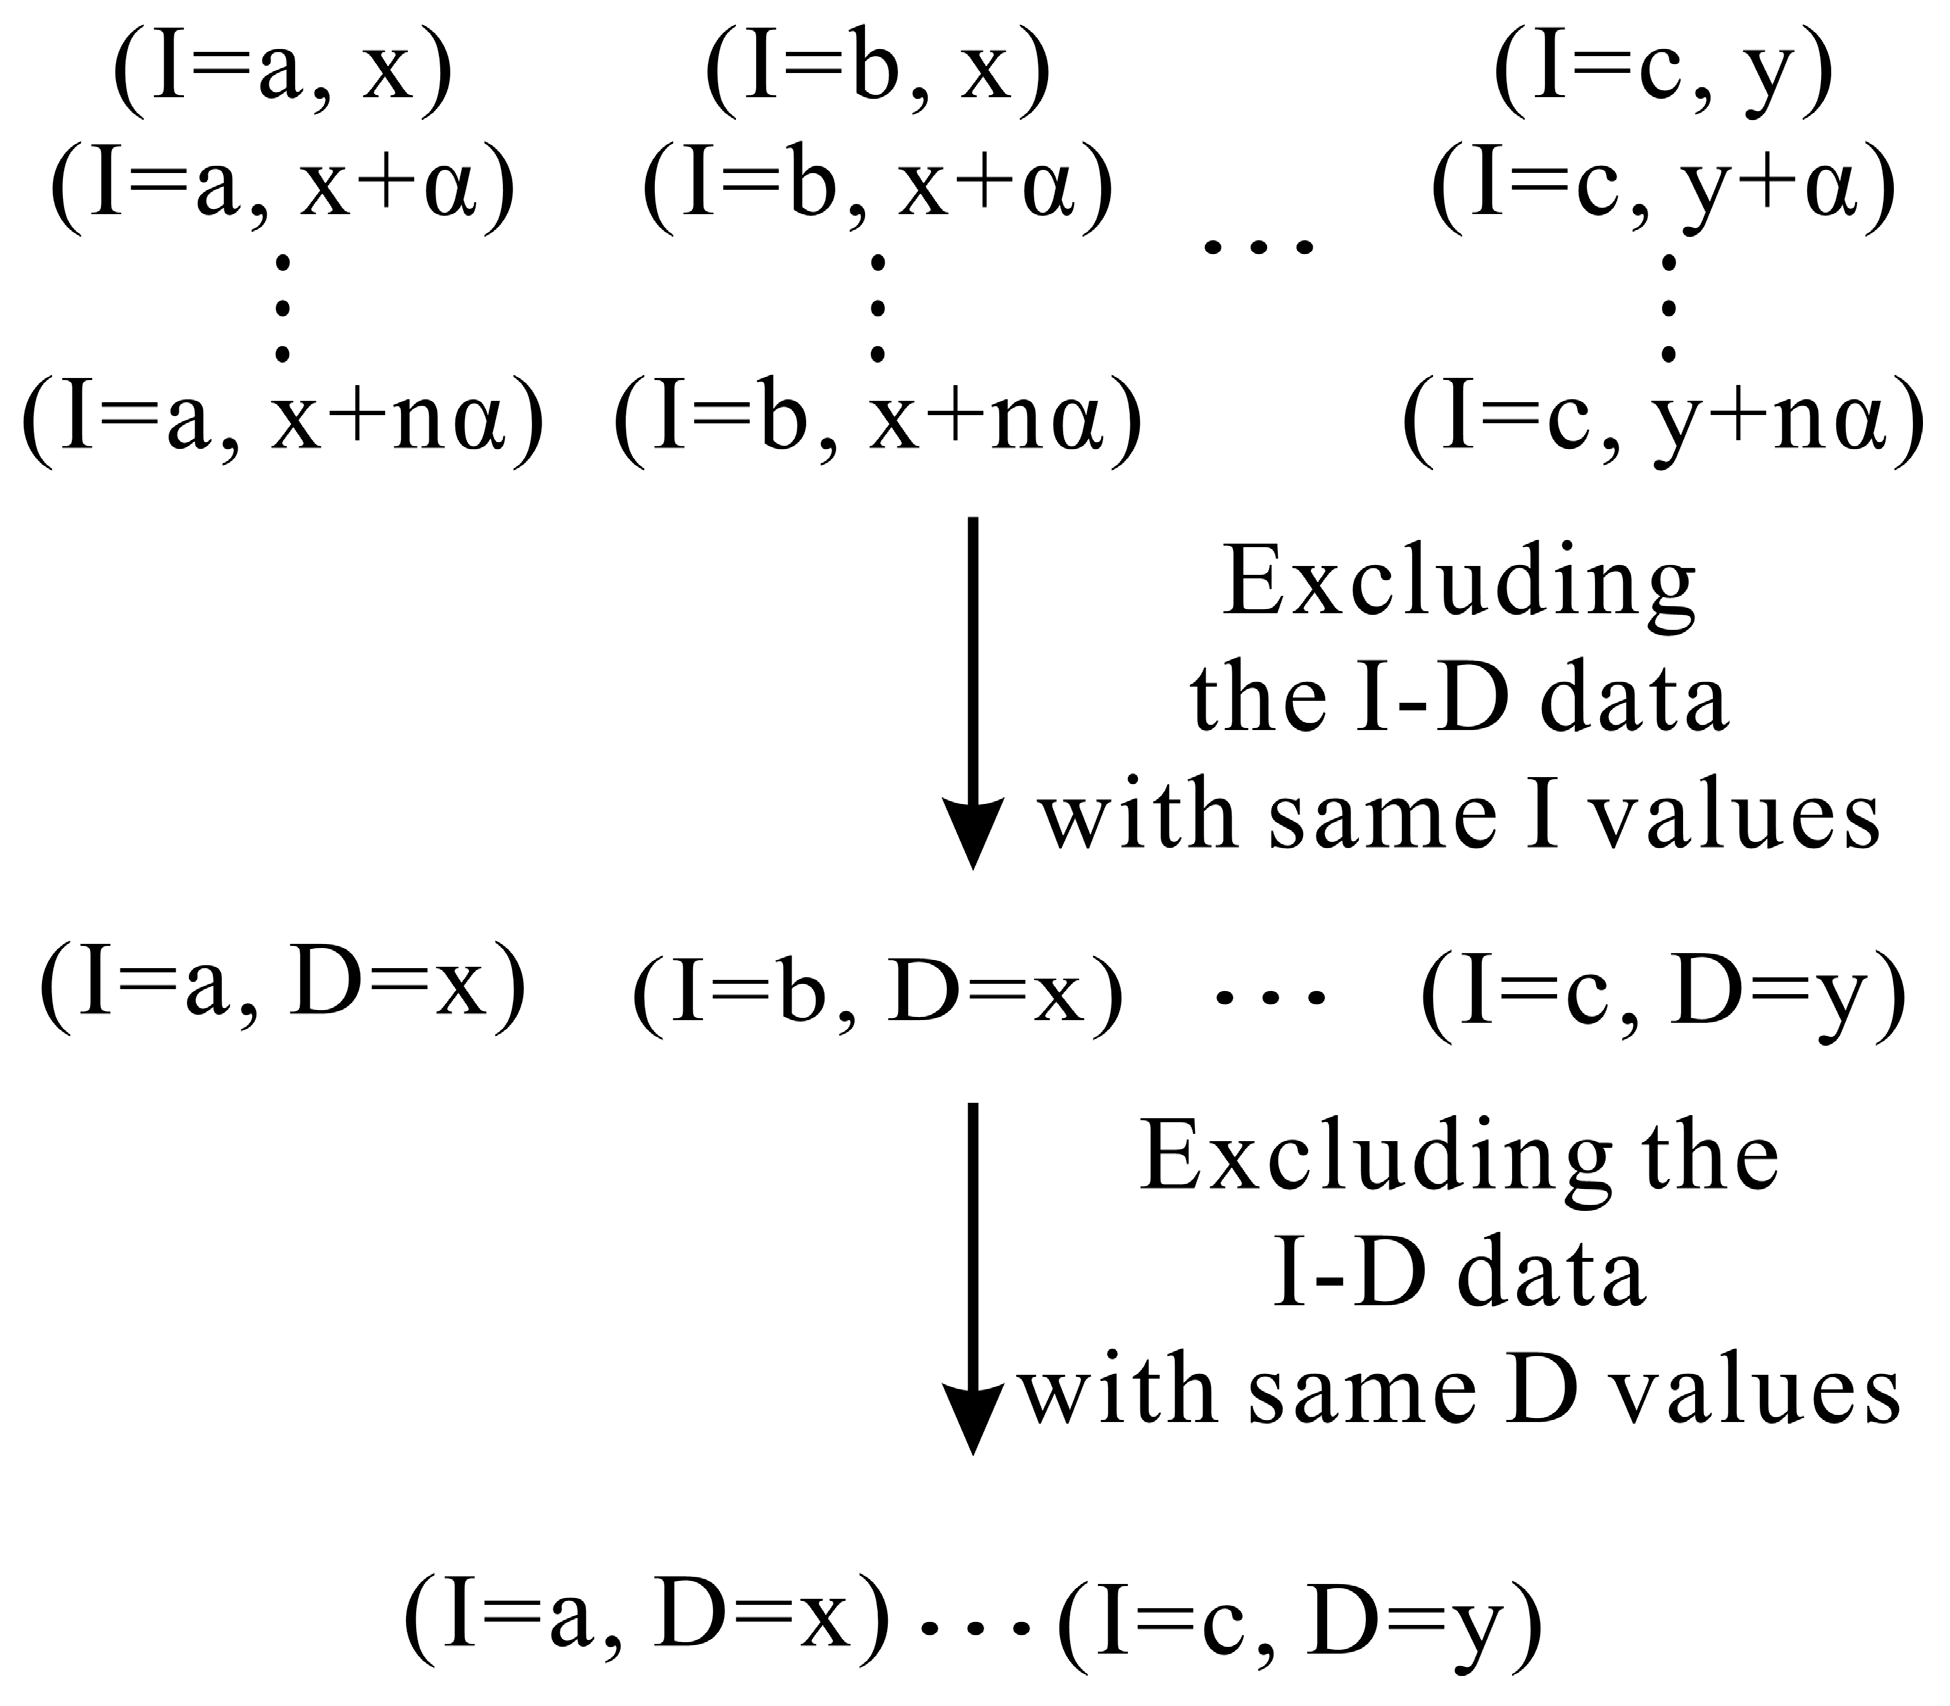
3.3. Method to Define I-D Thresholds

Marin et al. utilized TRIGRS to define the I-D thresholds at the basin scale [53,54,56]. This method was used in this study to define the I-D rainfall threshold of the slope units with critical rainfall in Dabang village. This method is based on two ratios, critical failure area ratio ( a c ) and the failing area ratio ( a f ). The critical failure area ratio can exclude unconditionally unstable grid cells, that is, when there is no rainfall, F s < 1. The failing area ratio is defined as the ratio of the area of the unstable grid cells to the total area. TRIGRS was utilized to simulate under the given series of I-D conditions. For each slope unit, when a f is greater than a c , it is regarded as unstable. Within the given series, the I-D conditions were constantly changed, and the I-D data that lead to the instability of slope units with critical rainfall were determined. In this study, a c was set to 1%.
During TRIGRS simulation, the rainfall intensity was set to increase from 2 mm/h to 30 mm/h, with an increment step of 2 mm/h. The rainfall duration was set to increase from 1 h to 60 h, with different increment steps, as presented in Table 2.
Before fitting, the I-D data determined by simulation were screened. Then, each I-D data was plotted in the graph of lgI vs. lgD, and was fit as a linear equation of Equation (3):
lg I = β lg D + lg α ,
where I is the mean rainfall intensity (mm/h), D is the duration (h), logα is the intercept, and β is the slope. α and β are scale and shape parameters, respectively. After determining parameters α and β, the linear equation was transformed into the original power law equation (Equation (4)). Through this, the I-D thresholds of each slope unit with critical rainfall in the study area were defined. The general flowchart is shown in Figure S1.
I = α D β ,

3.4. Screening Method and Accuracy Evalution

In this study, two screening methods were used to screen the I-D data determined by simulation. The first method (M1) uses the screening method proposed by Marin et al. to exclude the I values that repeat after the D values above 10 h. Given the differences in topography and geotechnical parameters of the study areas, many slope units with critical rainfall in the Dabang village were stable when the D value was 10 h. Thus, the limit value of the D values was set as 28 h to exclude the I-D data with the same I values.
Due to the spatial difference of topography and geotechnical parameters, the I-D conditions that cause the instability of each slope unit are quite different. Selecting a fixed D value as the limit value cannot completely exclude the I-D data with the same I values. Moreover, M1 does not exclude the I-D data with the same D values. Thus, this study proposes the second screening method (M2) (Figure 4). For each slope unit with critical rainfall, the I-D data that cause instability were divided into several subsets according to the difference in I value, given that the rainfall threshold is considered the minimum condition for inducing the landslides [30,74]. The minimum of D values in each subset was selected as the limit value to exclude I-D data with the same I values. In this way, one I-D data was selected in each subset. Then, the minimum of I value appearing in these data was selected as the limit value to exclude I-D data with the same D values. The rainfall thresholds defined by the I-D data without screening were also obtained (N).
As for the accuracy evaluation, this study took the discrete degree between the critical rainfall intensity I p calculated by the defined I-D thresholds and the critical rainfall intensity I c determined by the simulation of TRIGRS to evaluate the accuracy of defined thresholds. Considering that the duration conditions have been used for fitting cannot be selected and within the duration range of defined thresholds. TRIGRS was used to simulate the critical rainfall that caused the instability of each slope unit with critical rainfall in the study area when D = 35 h and D = 50 h. For each slope unit with critical rainfall, I p and I c were calculated. The average of the absolute value of the difference between I p and I c were taken as indexes to represent the discrete degree between I p and I c .

4. Results

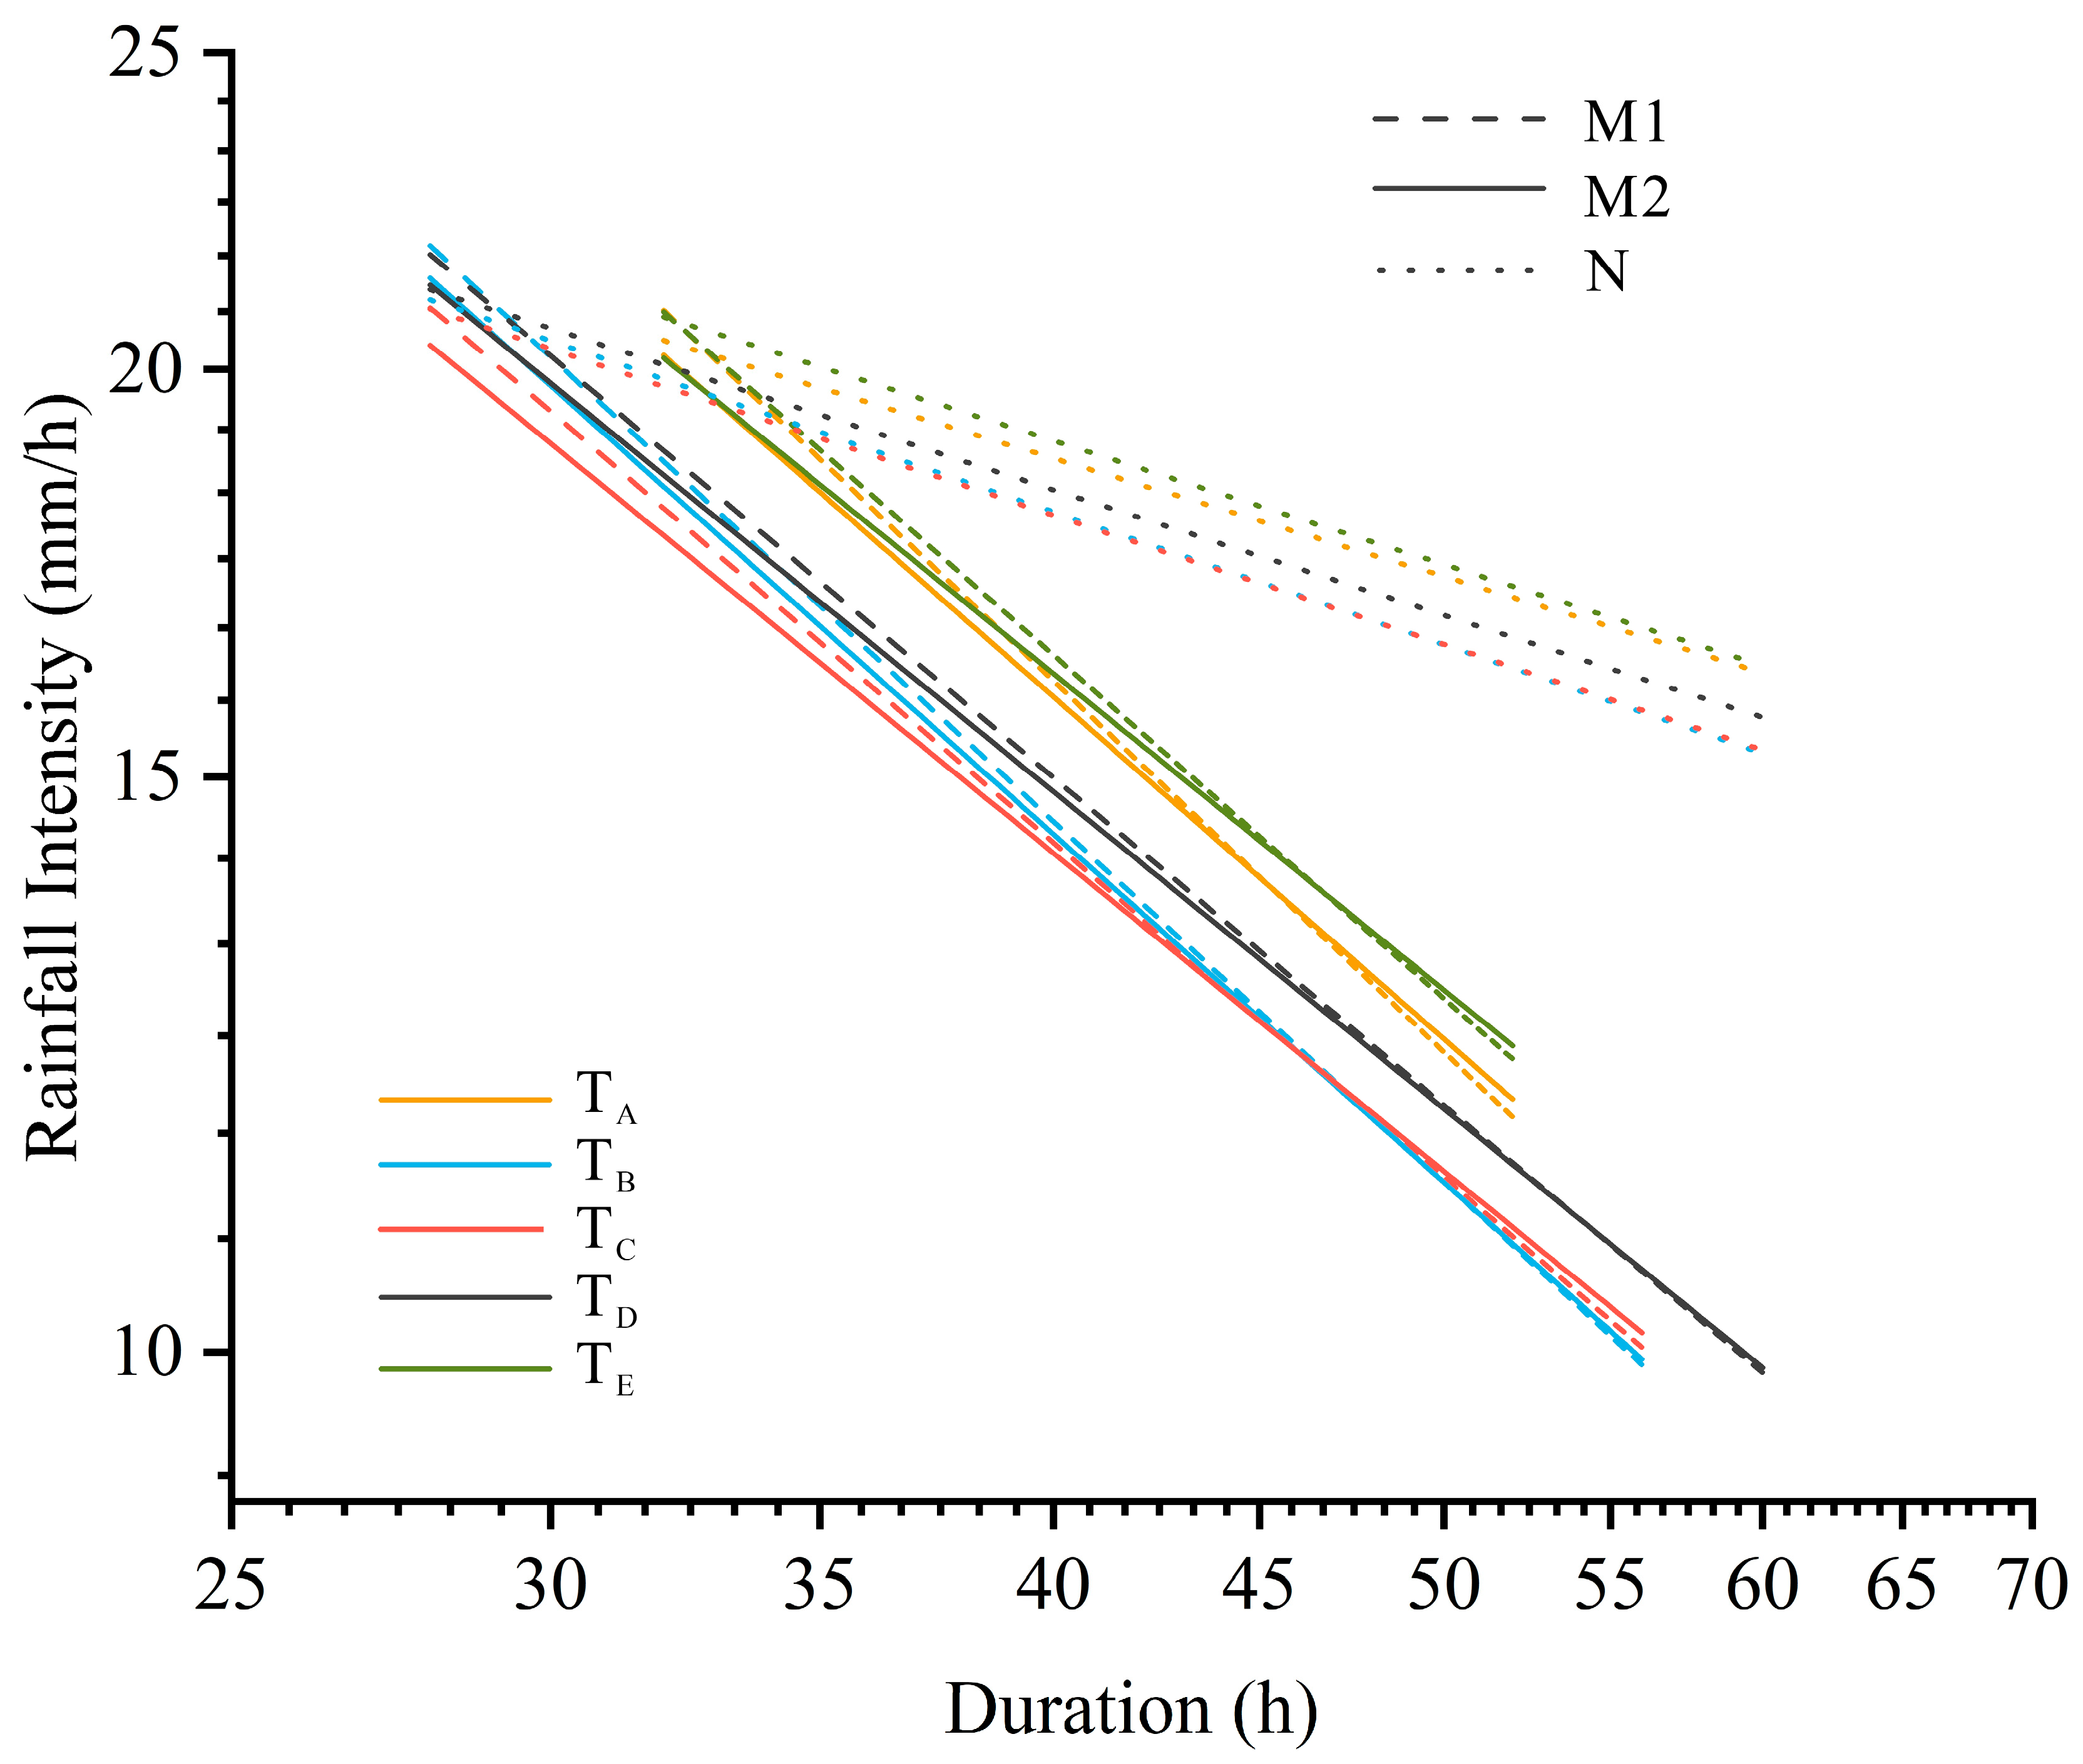
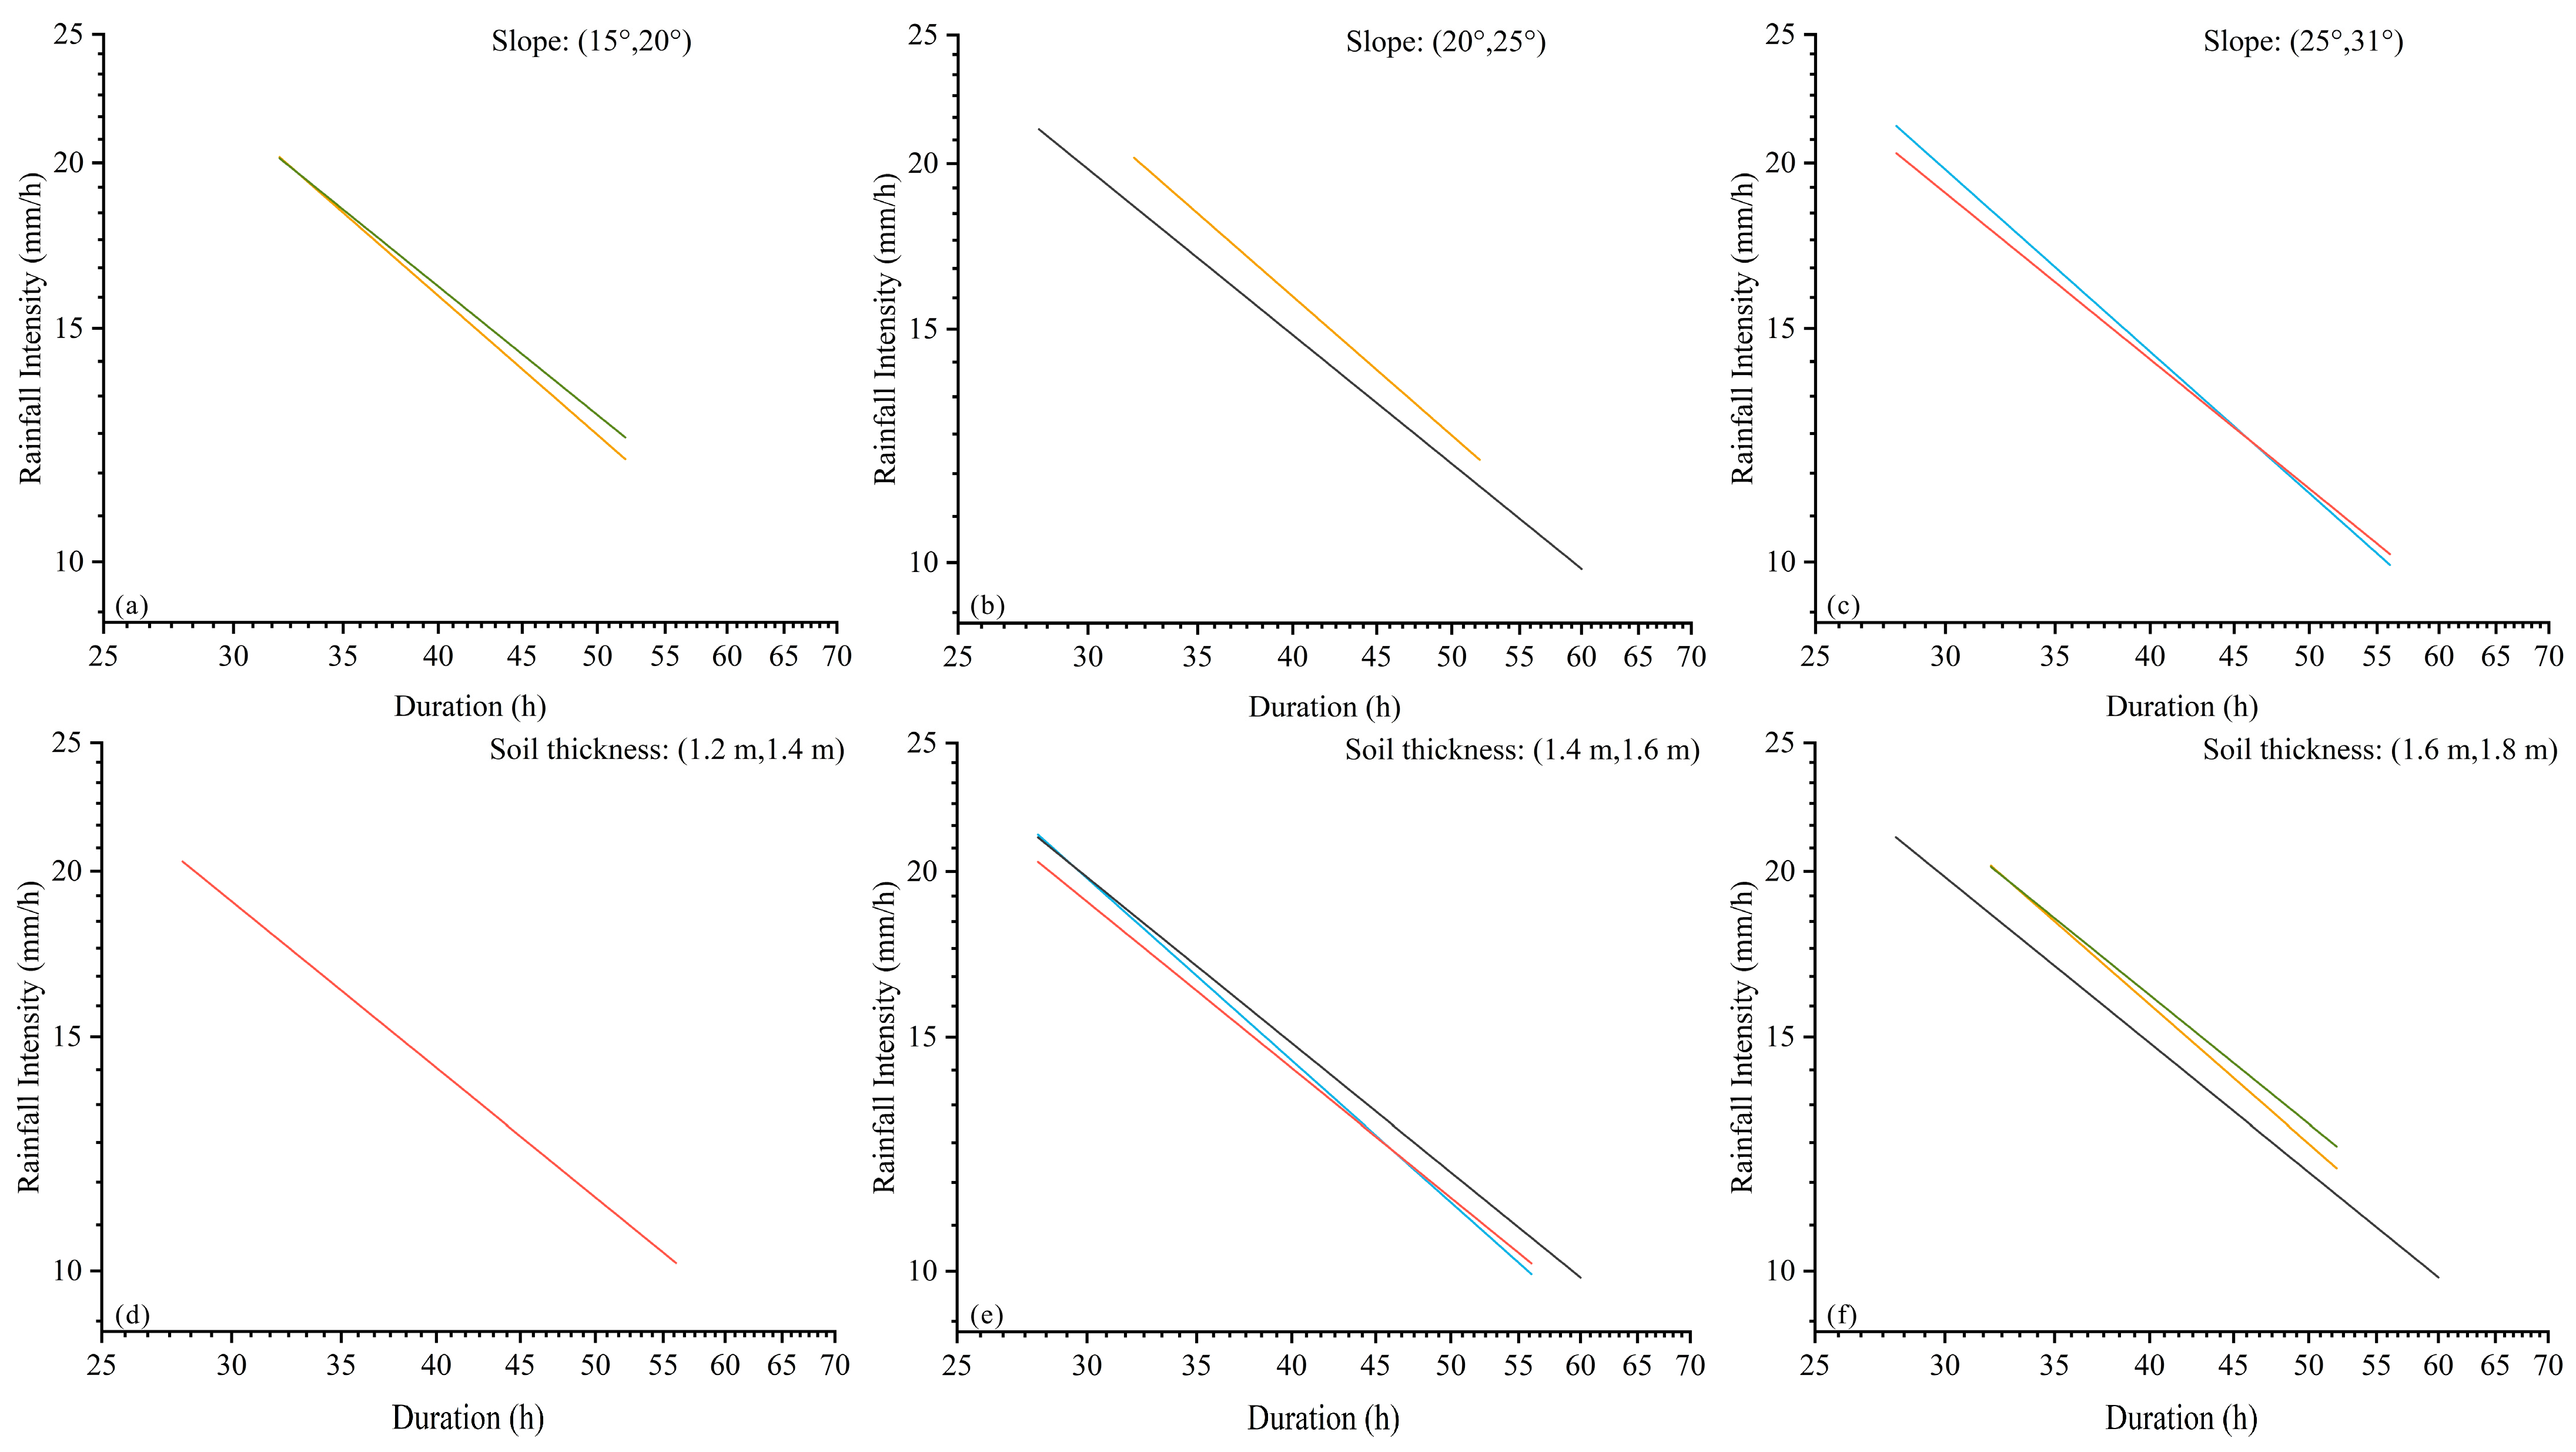
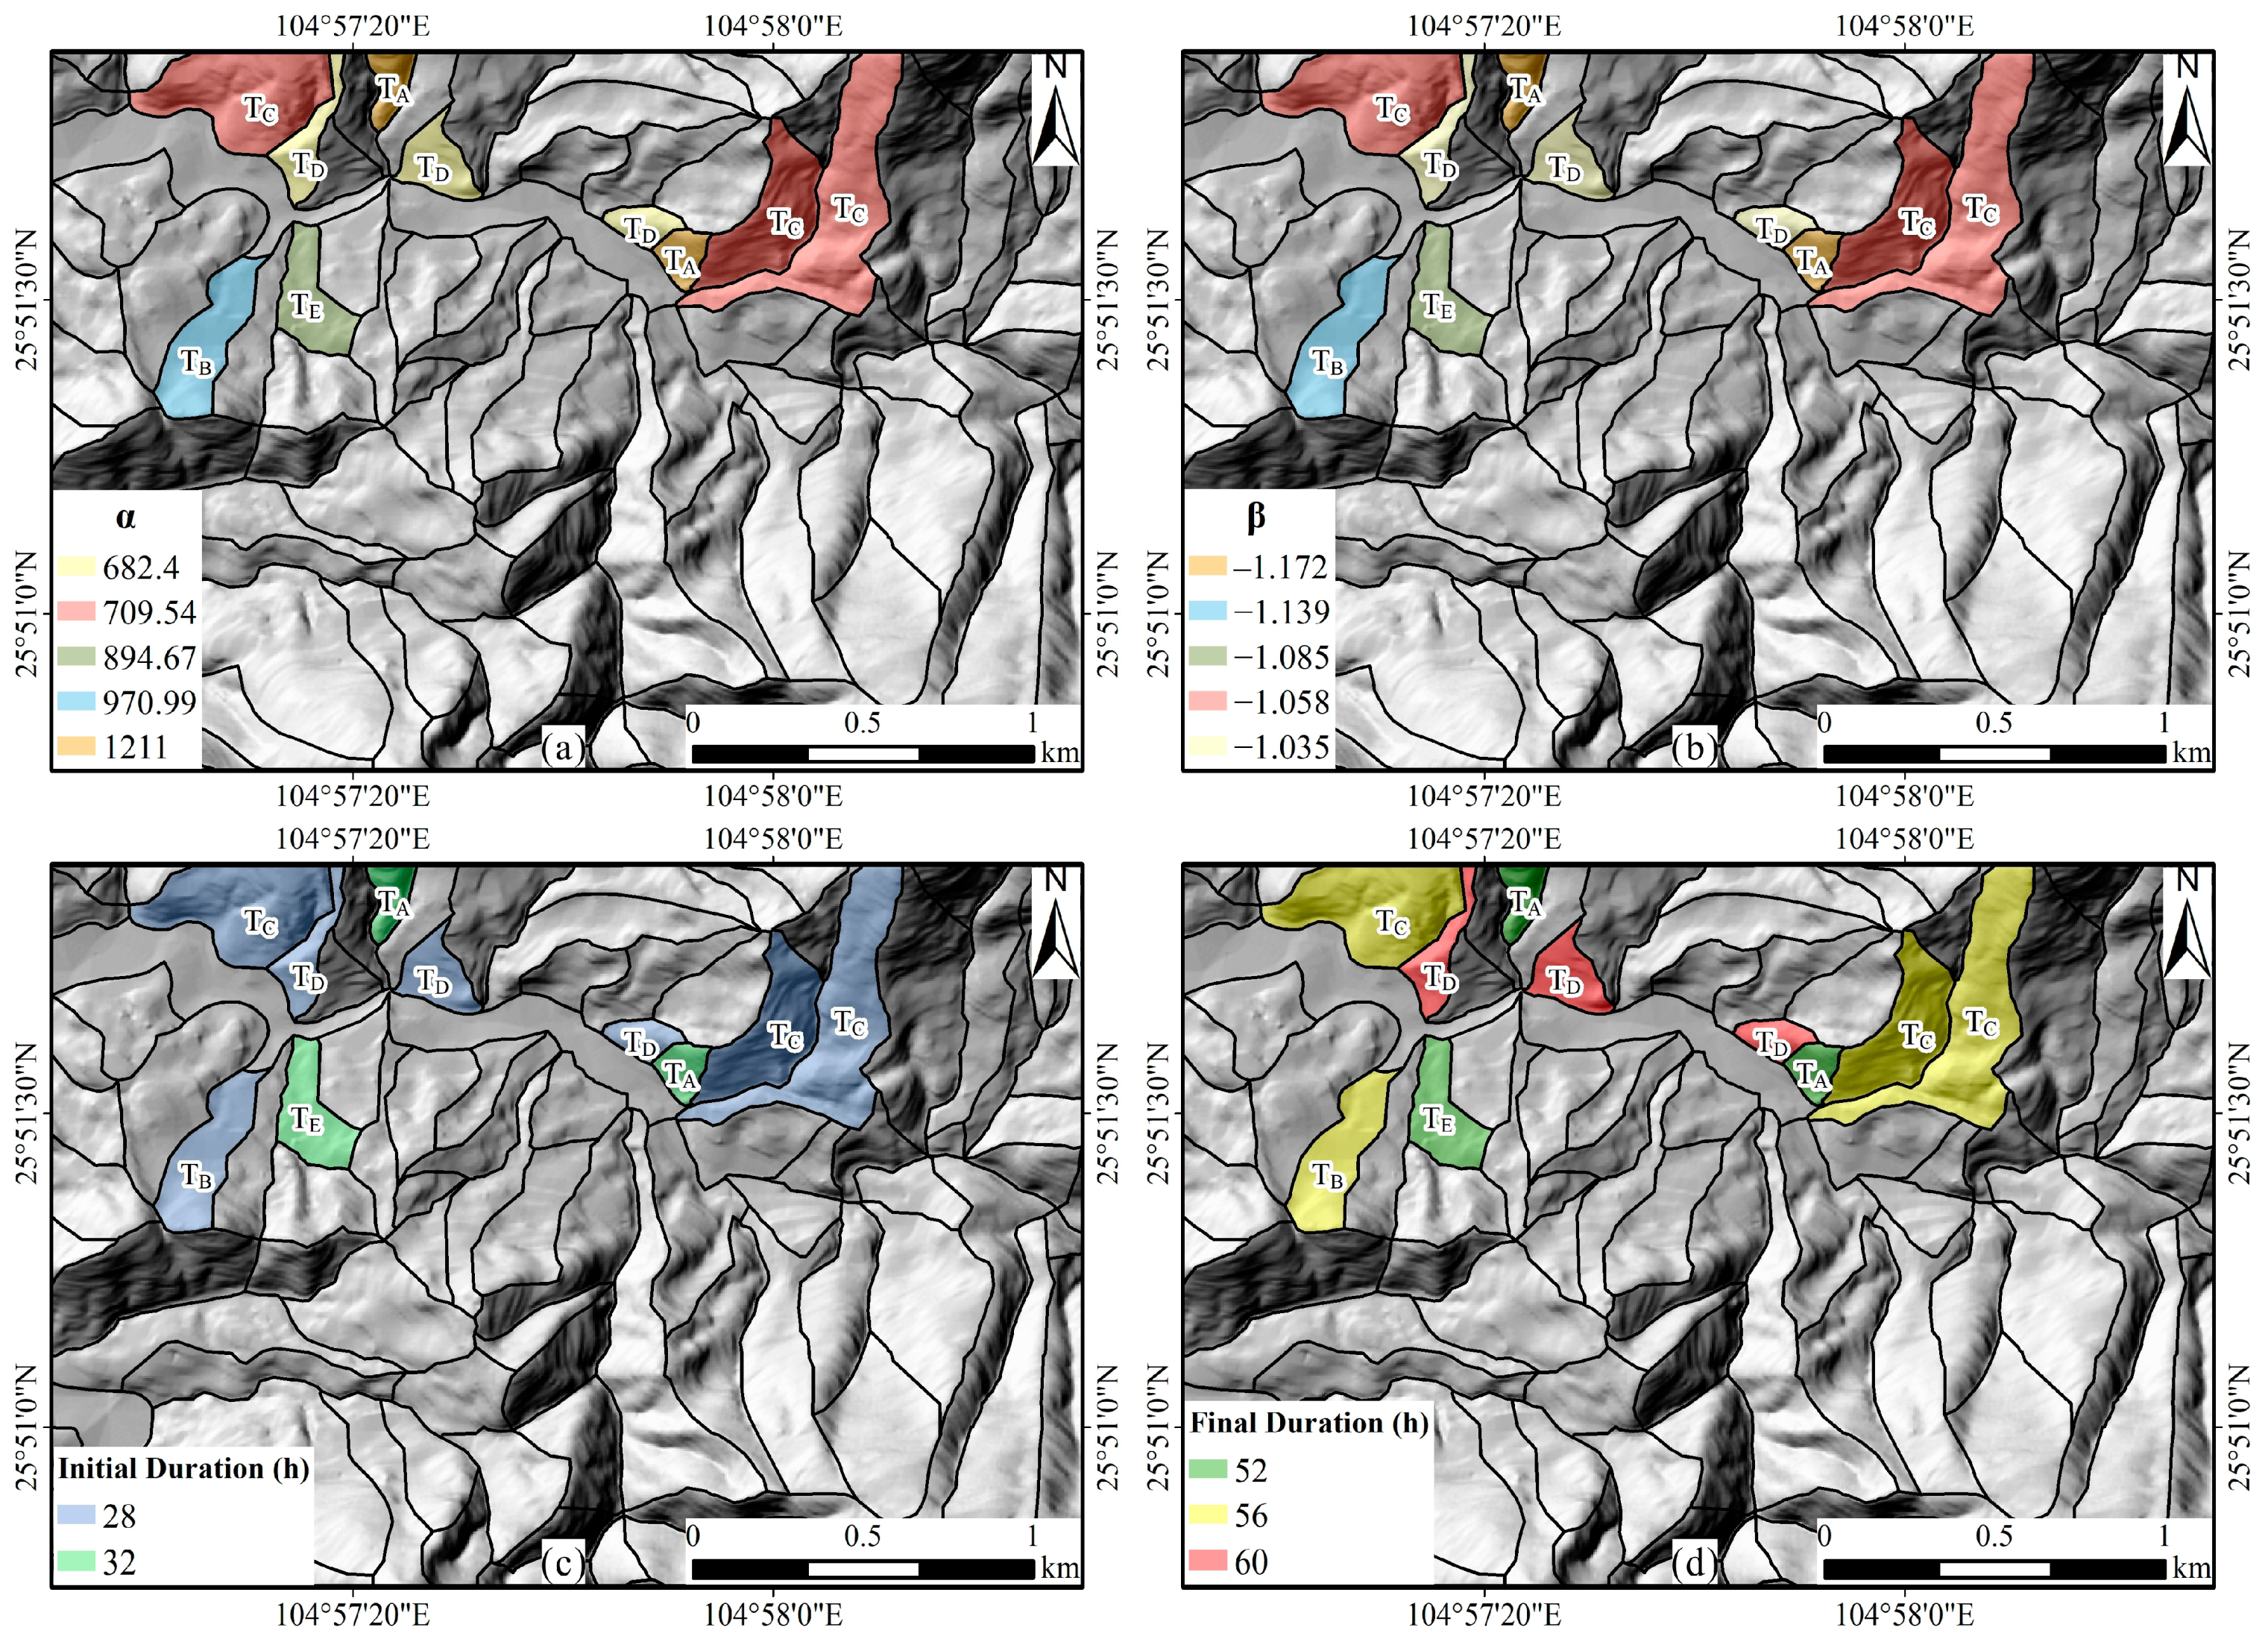
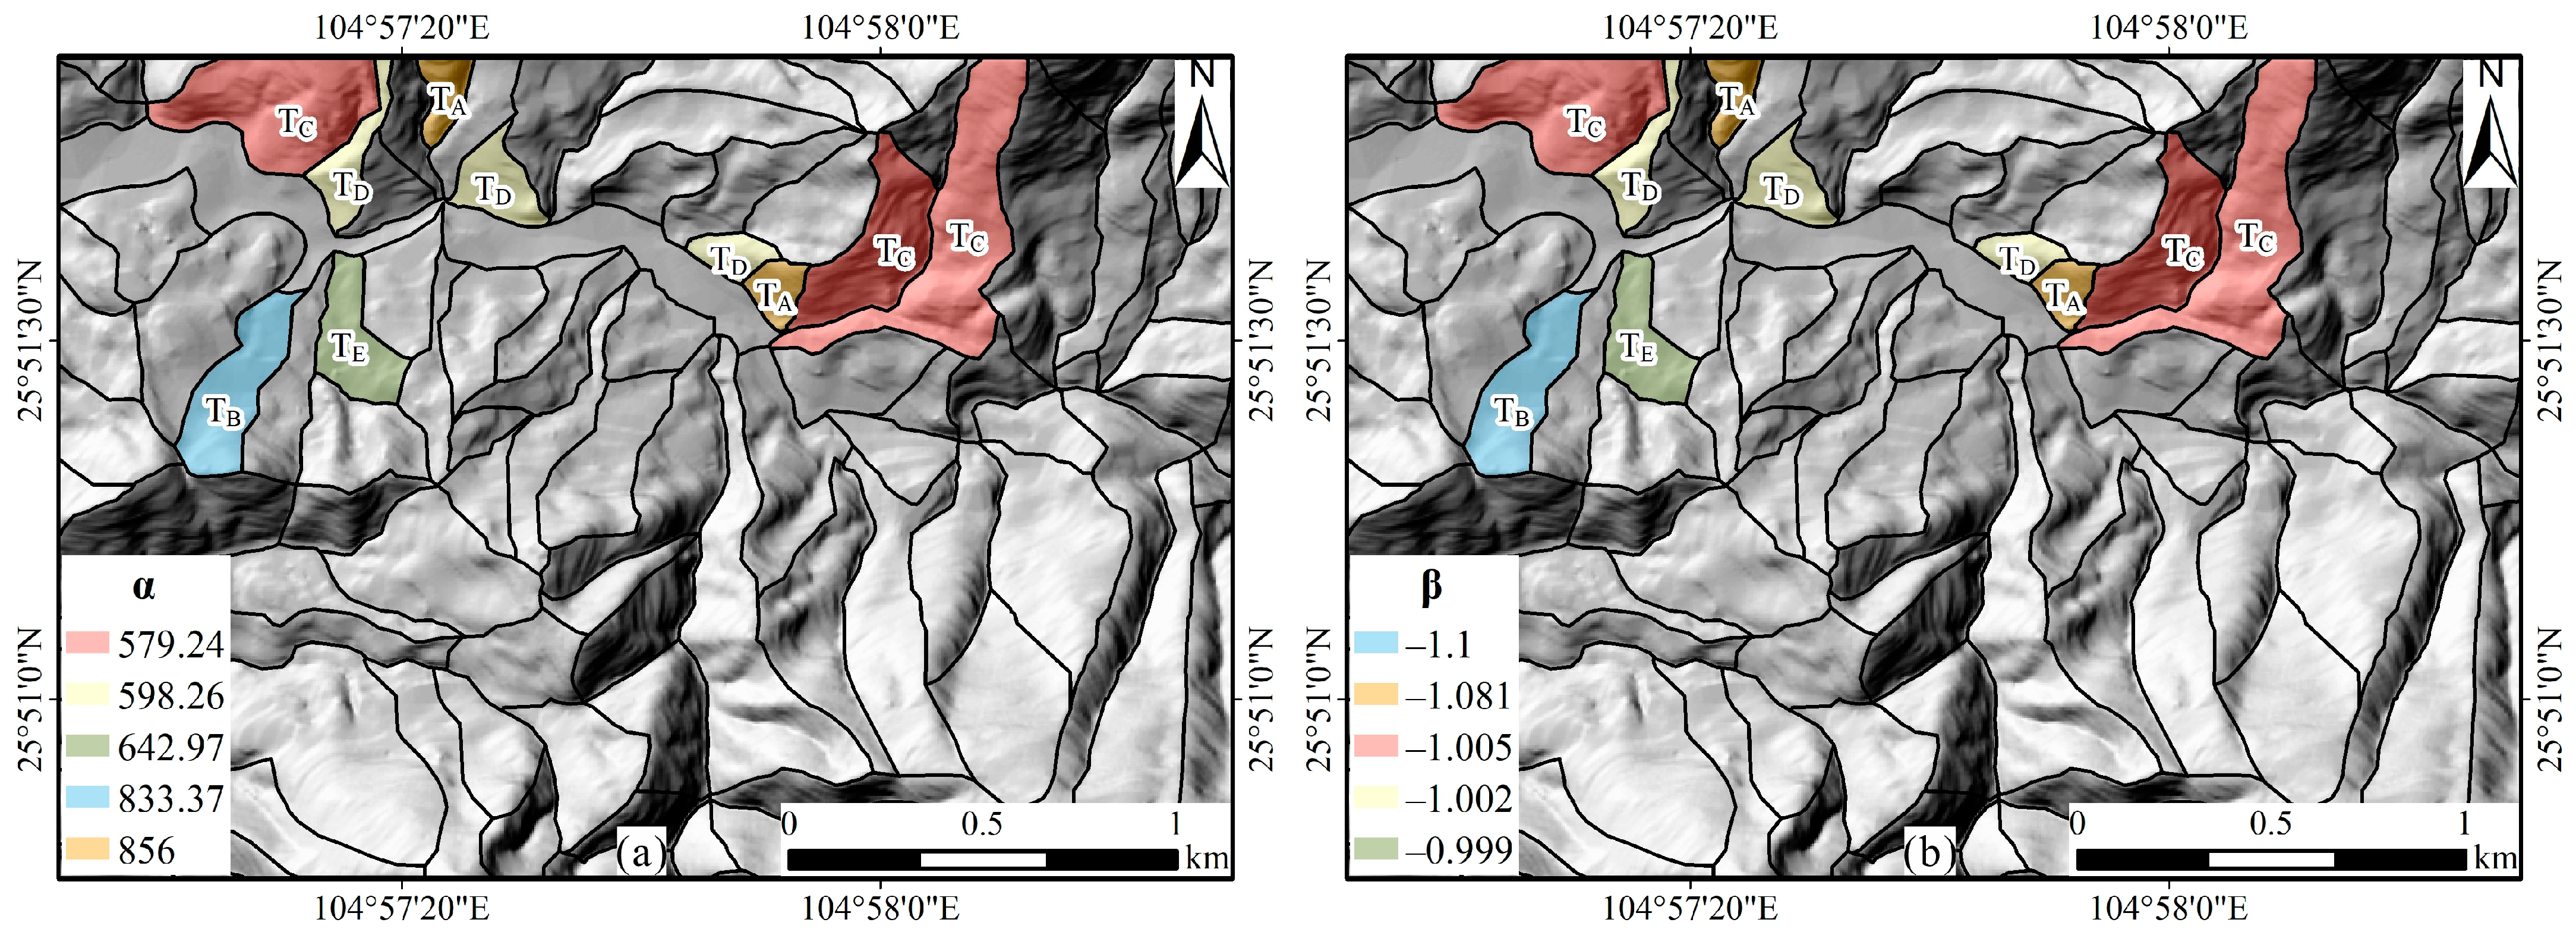
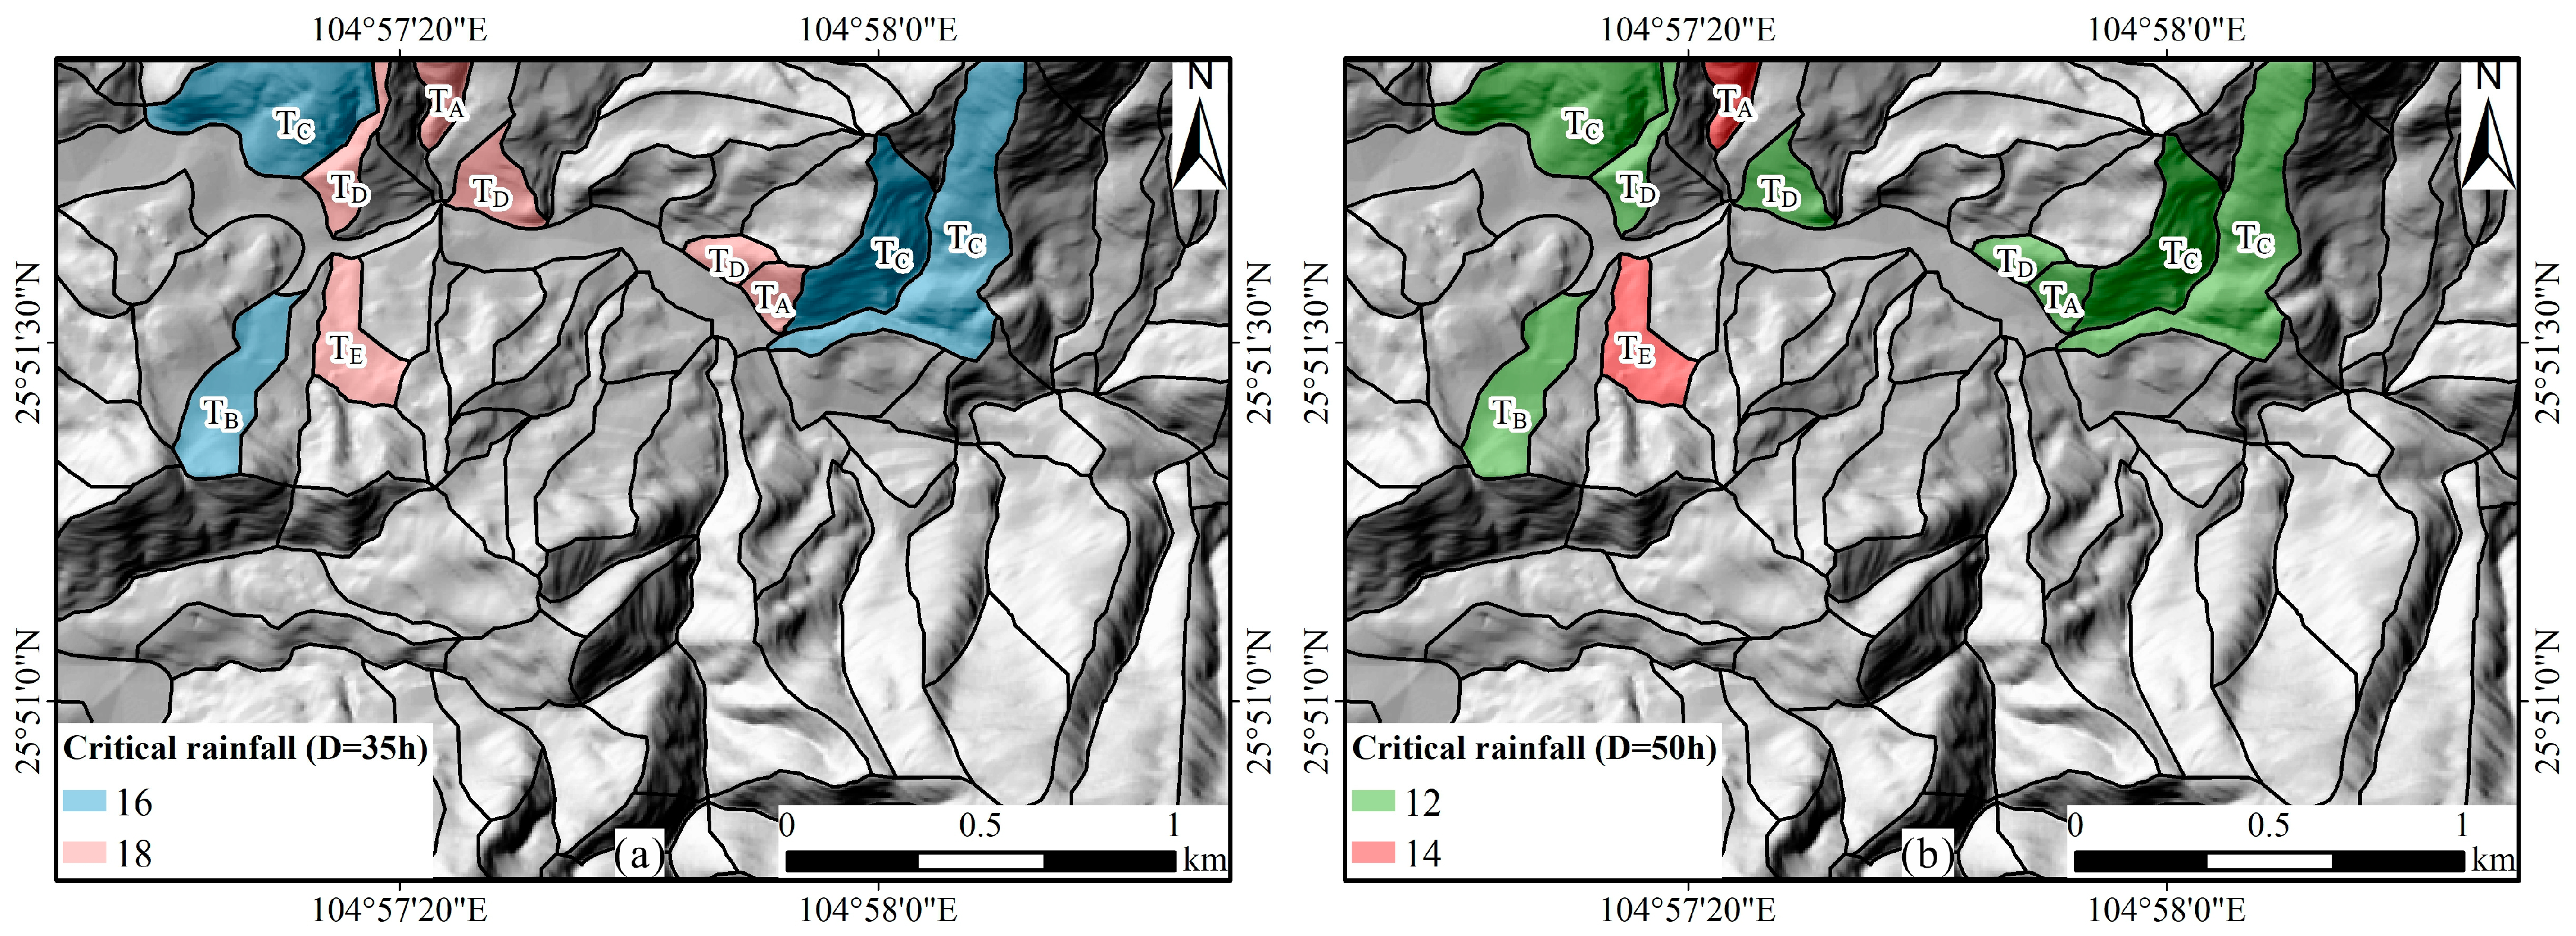
4.1. Defined I-D Thresholds

When rainfall intensity and duration are minimum (i.e., I = 2 mm/h, D = 1 h), no slope unit instability exists in the study area. When rainfall intensity and duration are maximum (i.e., I = 30 mm/h, D = 60 h), there exist 10 instable slope units in the study area.
After excluding the I-D data with same I or D values using M1 and M2, respectively. The I-D data screened by each screening method were plotted in the graph of lgI vs. lgD for fitting. Then, three different I-D thresholds were defined (Figure 5).
Figure 5 shows that the defined I-D thresholds conform to the power law equation, that is, the intensity decreases with the increase of duration. Moreover, the defined I-D thresholds without screening have the highest position on the lg–lg coordinates, M1 is the second and M2 is the lowest.
This study separated the thresholds curves after M2 screening based on slope and soil thickness of the slope units to represent the effect of slope and soil thickness on the position of thresholds curves. Figure 6a–c shows that the curve of the slope unit with higher slope is situated on the lower part of the graph. Figure 6d–f shows that the curve of slope unit with greater soil thickness is situated on the higher part of the graph.
Maps of α, β, initial and final durations were generated to indicate that each slope unit with critical rainfall has a corresponding I-D threshold (Figure 7, Figure 8 and Figure 9).
The defined I-D thresholds are not applicable to rainfall events of any duration, but only to rainfall events within the duration range of the initial and the final durations. The initial duration is the duration when each slope unit loses stability for the first time in the simulation. The final duration is the maximum duration within the given range of intensities when the increase in duration no longer affects the stability [54].
Different screening methods did not affect the initial and final durations. Thus, only the corresponding maps of the initial and final duration are shown in Figure 7.

4.2. Evaluation of Defined I-D Thresholds Accuracies

The critical intensity of 10 slope units when D = 35 h and D = 50 h was determined by the simulation of TRIGRS (Figure 10).
The result shows that, when without screening, the average of the absolute value of I p I c are the maximal, followed by M1 and M2 are the minimal. This indicates that not excluding the I-D data with same I or D values significantly reduces the accuracy of the defined I-D threshold. The thresholds defined after screening through M2 has the highest accuracy.

5. Discussion

TRIGRS is a model that can describe the scaling behavior of rainfall threshold among several distributed slope stability models [49]. TRIGRS simulates the slope stability under a series of I-D conditions to determine the I-D data that lead to instability. After screening the simulated I-D data, the screened data are fitted to define the I-D thresholds. This method can be used to define the rainfall thresholds for the areas with few historical landslides recorded or small areas, which improves the performance and extends the application scenarios of LEWS based on rainfall threshold. However, due to the limited nature of historical landslide records, using historical landslide records to validate or improve the defined rainfall thresholds is difficult. Thus, in the process, the accuracy of the rainfall threshold must be improved.
In the TRIGRS simulation, given that TRIGRS simulates under the I-D conditions of the given increasing sequence, the I-D data with the same I or D values will exist in the determined I-D data that result in instability. Comparing the rainfall thresholds defined by not excluding and excluding these data shows that these data will reduce the accuracy and lift the position of the rainfall thresholds curves on the graph (Figure 5, Table 3). At the basin scale, given that the overall behavior of all unstable grid cells in the entire study area is analyzed, it is reasonable to select a fixed D value to exclude the same I values [53,54,56]. However, it is different for defining the rainfall thresholds at the grid cell or slope unit scales. Defining the rainfall thresholds at the slope unit scale is to analyze the overall behavior of the unstable grid unit within the range of the slope units, and the grid unit scale is to analyze the behavior of a single unstable grid unit. In this case, due to the spatial differences in the topography and geotechnical parameters of various grid cells, significant differences exist between the I-D data that cause instability. Selecting a fixed D value can no longer meet the need to completely exclude the I-D data with the same I or D values (Table 3).
Therefore, the exclusion of the data with the same I or D values must be more specific at the slope unit scale. Chiefly, this study proposes a screening method. Initially, the I-D data that result in instability determined through the TRIGS simulation are divided into several subsets according to I values. Then, a D value is selected for each subset to exclude repeated I values. After excluding the I-D data with same I values, whether there are I-D data with the same D values should be judged; if there is, then an I value is selected to exclude the I-D data with the same D values. This screening method can effectively exclude these data and improve the accuracy of rainfall thresholds (Table 3). Although we did not validate the defined rainfall thresholds due to the unavailability of landslides event records in the study area, the accuracy and the position of the threshold curves are sufficient to prove that these data have a negative effect on the definition of rainfall thresholds and M2 screening method can completely exclude these data.
The relationship between the defined threshold curves and slope, soil thickness (Figure 6) indicates that the position of threshold curves varies negatively with slope and varies positively with soil thickness. This is consistent with the results of Alvioli et al. [49] and Marin et.al. [54]. Besides slope and soil thickness, geotechnical parameters also affect the position of threshold curves. The position of thresholds varies positively with cohesion and internal friction angle and varies negatively with unit weight [75]. As for the hydraulic parameters, the position of thresholds varies negatively with saturated soil water content [53]. The position of curves is more sensitive to mechanical parameters than hydraulic parameters [75,76]. Thus, when defining the rainfall thresholds at the small scale (i.e., slope unit scale and grid cell scale), besides specific screening of I-D data, inputting high-resolution DEM data and accurate geotechnical parameters is also important.

6. Conclusions

This study proposes a screening method for defining the I-D thresholds for shallow landslides using TRIGRS. This method further improves the current method of using TRIGRS to define rainfall thresholds. This is important for the application of rainfall threshold in LEWS. The conclusions can be summarized as follows.
(i) The I-D data with the same I or D values will reduce the accuracy of the rainfall thresholds and lift the position of the threshold curves on the coordinate, which may lower the predictive performance of defined thresholds. Thus, it is necessary to screen the I-D data that lead to instability determined by TRIGRS simulation before fitting.
(ii) Due to the spatial differences in the topography and geotechnical parameters, the I-D data causing the instability of different slope units are significantly different. Selecting a fixed D value to screen cannot completely exclude the I-D data with the same I or D values. When defining the I-D thresholds at the slope unit scale, the screening method to select several limit D values and a limit I value can completely exclude the I-D data with the same I or D values.

Supplementary Materials

The following supporting information can be downloaded at: https://www.mdpi.com/article/10.3390/w14040524/s1, Figure S1: General flowchart of defining I-D thresholds at the slope unit scale in this study area; Table S1: The measurements of geotechnical parameters for soil samples in the study area.

Author Contributions

Conceptualization, S.Z.; methodology, S.Z.; software, S.Z. and X.X.; formal analysis, S.Z.; investigation, S.Z. and D.W.; resources, P.S. and Y.T.; writing—original draft preparation, S.Z.; writing—review and editing, S.Z.; visualization, S.Z.; supervision, Q.J.; project administration, Q.J. All authors have read and agreed to the published version of the manuscript.

Funding

This research was funded by The First Surveying and Mapping Institute of Guizhou Province, grant number GZWH-2021-4536Y.

Institutional Review Board Statement

Not applicable.

Informed Consent Statement

Not applicable.

Data Availability Statement

Not applicable.

Acknowledgments

We thank The First Surveying and Mapping Institute of Guizhou Province for the support of the field survey in this research.

Conflicts of Interest

The authors declare no conflict of interest.

References

  1. Montrasio, L.; Valentino, R. A model for triggering mechanisms of shallow landslides. Nat. Hazards Earth Syst. Sci. 2008, 8, 1149–1159. [Google Scholar] [CrossRef]
  2. Montrasio, L.; Valentino, R. Experimental analysis and modelling of shallow landslides. Landslides 2007, 4, 291–296. [Google Scholar] [CrossRef]
  3. Yu, B.; Wang, T.; Zhu, Y.; Zhu, Y. Topographical and rainfall factors determining the formation of gully-type debris flows caused by shallow landslides in the Dayi area, Guizhou Province, China. Environ. Earth Sci. 2016, 75, 551. [Google Scholar] [CrossRef]
  4. Lin, Q.; Wang, Y. Spatial and temporal analysis of a fatal landslide inventory in China from 1950 to 2016. Landslides 2018, 15, 2357–2372. [Google Scholar] [CrossRef]
  5. Fan, X.; Tang, J.; Tian, S.; Jiang, Y. Rainfall-induced rapid and long-runout catastrophic landslide on July 23, 2019 in Shuicheng, Guizhou, China. Landslides 2020, 17, 2161–2171. [Google Scholar] [CrossRef]
  6. Guo, J.; Yi, S.; Yin, Y.; Cui, Y.; Qin, M.; Li, T.; Wang, C. The effect of topography on landslide kinematics: A case study of the Jichang town landslide in Guizhou, China. Landslides 2020, 17, 959–973. [Google Scholar] [CrossRef]
  7. Campbell, R.H. Soil Slips, Debris Flows, and Rainstorms in the Santa Monica Mountains and Vicinity, Southern California; US Government Printing Office: Washington, DC, USA, 1975; Volume 851.
  8. Keefer, D.K.; Wilson, R.C.; Mark, R.K.; Brabb, E.E.; Brown, W.M.; Ellen, S.D.; Harp, E.L.; Wieczorek, G.F.; Alger, C.S.; Zatkin, R.S. Real-time landslide warning during heavy rainfall. Science 1987, 238, 921–925. [Google Scholar] [CrossRef]
  9. Wilson, R.C. The rise and fall of a debris-flow warning system for the San Francisco Bay region, California. Landslide Hazard Risk 2005, 493–516. [Google Scholar] [CrossRef]
  10. Chung, M.-C.; Tan, C.-H.; Chen, C.-H. Local rainfall thresholds for forecasting landslide occurrence: Taipingshan landslide triggered by Typhoon Saola. Landslides 2017, 14, 19–33. [Google Scholar] [CrossRef]
  11. Ran, Q.; Hong, Y.; Li, W.; Gao, J. A modelling study of rainfall-induced shallow landslide mechanisms under different rainfall characteristics. J. Hydrol. 2018, 563, 790–801. [Google Scholar] [CrossRef]
  12. Naidu, S.; Sajinkumar, K.S.; Oommen, T.; Anuja, V.J.; Samuel, R.A.; Muraleedharan, C. Early warning system for shallow landslides using rainfall threshold and slope stability analysis. Geosci. Front. 2018, 9, 1871–1882. [Google Scholar] [CrossRef]
  13. Caine, N. The rainfall intensity-duration control of shallow landslides and debris flows. Geogr. Ann. Ser. A Phys. Geogr. 1980, 62, 23–27. [Google Scholar] [CrossRef]
  14. Aleotti, P. A warning system for rainfall-induced shallow failures. Eng. Geol. 2004, 73, 247–265. [Google Scholar] [CrossRef]
  15. Guzzetti, F.; Peruccacci, S.; Rossi, M.; Stark, C.P. Rainfall thresholds for the initiation of landslides in central and southern Europe. Meteorol. Atmos. Phys. 2007, 98, 239–267. [Google Scholar] [CrossRef]
  16. Guzzetti, F.; Peruccacci, S.; Rossi, M.; Stark, C.P. The rainfall intensity–duration control of shallow landslides and debris flows: An update. Landslides 2008, 5, 3–17. [Google Scholar] [CrossRef]
  17. Ma, T.; Li, C.; Lu, Z.; Bao, Q. Rainfall intensity-duration thresholds for the initiation of landslides in Zhejiang Province, China. Geomorphology 2015, 245, 193–206. [Google Scholar] [CrossRef]
  18. Li, W.Y.; Liu, C.; Scaioni, M.; Sun, W.W.; Chen, Y.; Yao, D.J.; Chen, S.; Hong, Y.; Zhang, K.H.; Cheng, G.D. Spatio-temporal analysis and simulation on shallow rainfall-induced landslides in China using landslide susceptibility dynamics and rainfall I-D thresholds. Sci. China Earth Sci. 2017, 60, 720–732. [Google Scholar] [CrossRef]
  19. Piciullo, L.; Calvello, M.; Cepeda, J.M. Territorial early warning systems for rainfall-induced landslides. Earth-Sci. Rev. 2018, 179, 228–247. [Google Scholar] [CrossRef]
  20. Guzzetti, F.; Gariano, S.L.; Peruccacci, S.; Brunetti, M.T.; Marchesini, I.; Rossi, M.; Melillo, M. Geographical landslide early warning systems. Earth-Sci. Rev. 2020, 200, 102973. [Google Scholar] [CrossRef]
  21. Mathew, J.; Babu, D.G.; Kundu, S.; Kumar, K.V.; Pant, C.C. Integrating intensity–duration-based rainfall threshold and antecedent rainfall-based probability estimate towards generating early warning for rainfall-induced landslides in parts of the Garhwal Himalaya, India. Landslides 2014, 11, 575–588. [Google Scholar] [CrossRef]
  22. Segoni, S.; Rosi, A.; Rossi, G.; Catani, F.; Casagli, N. Analysing the relationship between rainfalls and landslides to define a mosaic of triggering thresholds for regional-scale warning systems. Nat. Hazards Earth Syst. Sci. 2014, 14, 2637–2648. [Google Scholar] [CrossRef] [Green Version]
  23. Rosi, A.; Peternel, T.; Jemec-Auflič, M.; Komac, M.; Segoni, S.; Casagli, N. Rainfall thresholds for rainfall-induced landslides in Slovenia. Landslides 2016, 13, 1571–1577. [Google Scholar] [CrossRef]
  24. Vennari, C.; Gariano, S.L.; Antronico, L.; Brunetti, M.T.; Iovine, G.; Peruccacci, S.; Terranova, O.; Guzzetti, F. Rainfall thresholds for shallow landslide occurrence in Calabria, southern Italy. Nat. Hazards Earth Syst. Sci. 2014, 14, 317–330. [Google Scholar] [CrossRef] [Green Version]
  25. Gariano, S.L.; Brunetti, M.T.; Iovine, G.; Melillo, M.; Peruccacci, S.; Terranova, O.; Vennari, C.; Guzzetti, F. Calibration and validation of rainfall thresholds for shallow landslide forecasting in Sicily, southern Italy. Geomorphology 2015, 228, 653–665. [Google Scholar] [CrossRef]
  26. Melillo, M.; Brunetti, M.T.; Peruccacci, S.; Gariano, S.L.; Guzzetti, F. Rainfall thresholds for the possible landslide occurrence in Sicily (Southern Italy) based on the automatic reconstruction of rainfall events. Landslides 2016, 13, 165–172. [Google Scholar] [CrossRef]
  27. Rossi, M.; Luciani, S.; Valigi, D.; Kirschbaum, D.; Brunetti, M.T.; Peruccacci, S.; Guzzetti, F. Statistical approaches for the definition of landslide rainfall thresholds and their uncertainty using rain gauge and satellite data. Geomorphology 2017, 285, 16–27. [Google Scholar] [CrossRef]
  28. Kanungo, D.P.; Sharma, S. Rainfall thresholds for prediction of shallow landslides around Chamoli-Joshimath region, Garhwal Himalayas, India. Landslides 2014, 11, 629–638. [Google Scholar] [CrossRef]
  29. Ma, T.; Li, C.; Lu, Z.; Wang, B. An effective antecedent precipitation model derived from the power-law relationship between landslide occurrence and rainfall level. Geomorphology 2014, 216, 187–192. [Google Scholar] [CrossRef]
  30. Segoni, S.; Piciullo, L.; Gariano, S.L. A review of the recent literature on rainfall thresholds for landslide occurrence. Landslides 2018, 15, 1483–1501. [Google Scholar] [CrossRef]
  31. Melillo, M.; Brunetti, M.T.; Peruccacci, S.; Gariano, S.L.; Roccati, A.; Guzzetti, F. A tool for the automatic calculation of rainfall thresholds for landslide occurrence. Environ. Model. Softw. 2018, 105, 230–243. [Google Scholar] [CrossRef]
  32. Peruccacci, S.; Brunetti, M.T.; Luciani, S.; Vennari, C.; Guzzetti, F. Lithological and seasonal control on rainfall thresholds for the possible initiation of landslides in central Italy. Geomorphology 2012, 139–140, 79–90. [Google Scholar] [CrossRef]
  33. Peres, D.J.; Cancelliere, A. Derivation and evaluation of landslide-triggering thresholds by a Monte Carlo approach. Hydrol. Earth Syst. Sci. 2014, 18, 4913–4931. [Google Scholar] [CrossRef] [Green Version]
  34. Bogaard, T.; Greco, R. Invited perspectives: Hydrological perspectives on precipitation intensity-duration thresholds for landslide initiation: Proposing hydro-meteorological thresholds. Nat. Hazards Earth Syst. Sci. 2018, 18, 31–39. [Google Scholar] [CrossRef] [Green Version]
  35. Wu, Y.M.; Lan, H.X.; Gao, X.; Li, L.P.; Yang, Z.H. A simplified physically based coupled rainfall threshold model for triggering landslides. Eng. Geol. 2015, 195, 63–69. [Google Scholar] [CrossRef]
  36. Park, J.Y.; Lee, S.R.; Lee, D.H.; Kim, Y.T.; Lee, J.S. A regional-scale landslide early warning methodology applying statistical and physically based approaches in sequence. Eng. Geol. 2019, 260, 105193. [Google Scholar] [CrossRef]
  37. Baum, R.L.; Savage, W.Z.; Godt, J.W. TRIGRS—A Fortran Program for Transient Rainfall Infiltration and Grid-Based Regional Slope-Stability Analysis, Open-File Report 02-0424; US Geological Survey: Reston, VA, USA, 2002; p. 35.
  38. Baum, R.L.; Savage, W.Z.; Godt, J.W. TRIGRS—A Fortran Program for Transient Rainfall Infiltration and Grid-Based Regional Slope-Stability Analysis, Version 2.0, Open File Report 2008-1159; US Geological Survey: Reston, VA, USA, 2008; p. 75.
  39. Baum, R.L.; Godt, J.W.; Savage, W.Z. Estimating the timing and location of shallow rainfall-induced landslides using a model for transient, unsaturated infiltration. J. Geophys. Res. Earth Surf. 2010, 115, F03013. [Google Scholar] [CrossRef]
  40. Vieira, B.C.; Fernandes, N.F.; Filho, O.A. Shallow landslide prediction in the Serra do Mar, São Paulo, Brazil. Nat. Hazards Earth Syst. Sci. 2010, 10, 1829–1837. [Google Scholar] [CrossRef]
  41. Kim, D.; Im, S.; Lee, S.H.; Hong, Y.; Cha, K.-S. Predicting the rainfall-triggered landslides in a forested mountain region using TRIGRS model. J. Mt. Sci. 2010, 7, 83–91. [Google Scholar] [CrossRef]
  42. Saadatkhah, N.; Mansor, S.; Kassim, A.; Lee, L.M.; Saadatkhah, R.; Sobhanmanesh, A. Regional modeling of rainfall-induced landslides using TRIGRS model by incorporating plant cover effects: Case study in Hulu Kelang, Malaysia. Environ. Earth Sci. 2016, 75, 445. [Google Scholar] [CrossRef]
  43. Lee, G.; An, H.; Kim, M. Comparing the performance of TRIGRS and TiVaSS in spatial and temporal prediction of rainfall-induced shallow landslides. Environ. Earth Sci. 2017, 76, 315. [Google Scholar]
  44. Tran, T.V.; Alvioli, M.; Lee, G.; An, H.U. Three-dimensional, time-dependent modeling of rainfall-induced landslides over a digital landscape: A case study. Landslides 2018, 15, 1071–1084. [Google Scholar] [CrossRef]
  45. He, J.; Qiu, H.; Qu, F.; Hu, S.; Yang, D.; Shen, Y.; Zhang, Y.; Sun, H.; Cao, M. Prediction of spatiotemporal stability and rainfall threshold of shallow landslides using the TRIGRS and Scoops 3D models. Catena 2021, 197, 104999. [Google Scholar] [CrossRef]
  46. Baum, R.L.; Coe, J.A.; Godt, J.W.; Harp, E.L.; Reid, M.E.; Savage, W.Z.; Schulz, W.H.; Brien, D.L.; Chleborad, A.F.; McKenna, J.P. Regional landslide-hazard assessment for Seattle, Washington, USA. Landslides 2005, 2, 266–279. [Google Scholar] [CrossRef]
  47. Park, D.W.; Nikhil, N.V.; Lee, S.R. Landslide and debris flow susceptibility zonation using TRIGRS for the 2011 Seoul landslide event. Nat. Hazards Earth Syst. Sci. 2013, 13, 2833–2849. [Google Scholar] [CrossRef] [Green Version]
  48. Ciurleo, M.; Mandaglio, M.C.; Moraci, N. Landslide susceptibility assessment by TRIGRS in a frequently affected shallow instability area. Landslides 2019, 16, 175–188. [Google Scholar] [CrossRef]
  49. Alvioli, M.; Guzzetti, F.; Rossi, M. Scaling properties of rainfall induced landslides predicted by a physically based model. Geomorphology 2014, 213, 38–47. [Google Scholar] [CrossRef] [Green Version]
  50. Salciarini, D.; Godt, J.W.; Savage, W.Z.; Baum, R.L.; Conversini, P. Modeling landslide recurrence in Seattle, Washington, USA. Eng. Geol. 2008, 102, 227–237. [Google Scholar] [CrossRef]
  51. Salciarini, D.; Tamagnini, C.; Conversini, P.; Rapinesi, S. Spatially distributed rainfall thresholds for the initiation of shallow landslides. Nat. Hazards 2012, 61, 229–245. [Google Scholar] [CrossRef]
  52. Alvioli, M.; Melillo, M.; Guzzetti, F.; Rossi, M.; Palazzi, E.; von Hardenberg, J.; Brunetti, M.T.; Peruccacci, S. Implications of climate change on landslide hazard in Central Italy. Sci. Total Environ. 2018, 630, 1528–1543. [Google Scholar] [CrossRef]
  53. Marin, R.J.; Velásquez, M.F. Influence of hydraulic properties on physically modelling slope stability and the definition of rainfall thresholds for shallow landslides. Geomorphology 2020, 351, 106976. [Google Scholar] [CrossRef]
  54. Marin, R.J.; García, E.F.; Aristizábal, E. Effect of basin morphometric parameters on physically-based rainfall thresholds for shallow landslides. Eng. Geol. 2020, 278, 105855. [Google Scholar] [CrossRef]
  55. Marin, R.J. Physically based and distributed rainfall intensity and duration thresholds for shallow landslides. Landslides 2020, 17, 2907–2917. [Google Scholar] [CrossRef]
  56. Marin, R.J.; Velásquez, M.F.; García, E.F.; Alvioli, M.; Aristizábal, E. Assessing two methods of defining rainfall intensity and duration thresholds for shallow landslides in data-scarce catchments of the Colombian Andean Mountains. Catena 2021, 206, 105563. [Google Scholar] [CrossRef]
  57. Bordoni, M.; Meisina, C.; Valentino, R.; Bittelli, M.; Chersich, S. Site-specific to local-scale shallow landslides triggering zones assessment using TRIGRS. Nat. Hazards Earth Syst. Sci. 2015, 15, 1025–1050. [Google Scholar] [CrossRef] [Green Version]
  58. Zhang, S.J.; Wei, F.Q.; Liu, D.L.; Yang, H.J.; Jiang, Y.H. A regional-scale method of forecasting debris flow events based on water-soil coupling mechanism. J. Mt. Sci. 2014, 11, 1531–1542. [Google Scholar] [CrossRef]
  59. Liu, D.L.; Zhang, S.J.; Yang, H.J.; Zhao, L.Q.; Jiang, Y.H.; Tang, D.; Leng, X.P. Application and analysis of debris-flow early warning system in Wenchuan earthquake-affected area. Nat. Hazards Earth Syst. Sci. 2016, 16, 483–496. [Google Scholar] [CrossRef] [Green Version]
  60. Zhang, S.; Zhao, L.; Delgado-Tellez, R.; Bao, H. A physics-based probabilistic forecasting model for rainfall-induced shallow landslides at regional scale. Nat. Hazards Earth Syst. Sci. 2018, 18, 969–982. [Google Scholar] [CrossRef] [Green Version]
  61. Viet, T.T.; Lee, G.; Thu, T.M.; An, H.U. Effect of Digital Elevation Model Resolution on Shallow Landslide Modeling Using TRIGRS. Nat. Hazards Rev. 2017, 18, 04016011. [Google Scholar] [CrossRef]
  62. Tufano, R.; Formetta, G.; Calcaterra, D.; De Vita, P. Hydrological control of soil thickness spatial variability on the initiation of rainfall-induced shallow landslides using a three-dimensional model. Landslides 2021, 18, 3367–3380. [Google Scholar] [CrossRef]
  63. Fusco, F.; Mirus, B.B.; Baum, R.L.; Calcaterra, D.; De Vita, P. Incorporating the effects of complex soil layering and thickness local variability into distributed landslide susceptibility assessments. Water 2021, 13, 713. [Google Scholar] [CrossRef]
  64. De Vita, P.; Agrello, D.; Ambrosino, F. Landslide susceptibility assessment in ash-fall pyroclastic deposits surrounding Mount Somma-Vesuvius: Application of geophysical surveys for soil thickness mapping. J. Appl. Geophys. 2006, 59, 126–139. [Google Scholar] [CrossRef]
  65. Del Soldato, M.; Pazzi, V.; Segoni, S.; De Vita, P.; Tofani, V.; Moretti, S. Spatial modeling of pyroclastic cover deposit thickness (depth to bedrock) in peri-volcanic areas of Campania (southern Italy). Earth Surf. Process. Landforms 2018, 43, 1757–1767. [Google Scholar] [CrossRef] [Green Version]
  66. Richards, L.A. Capillary conduction of liquids through porous mediums. Physics 1931, 1, 318–333. [Google Scholar] [CrossRef]
  67. Iverson, R.M. Landslide triggering by rain infiltration. Water Resour. Res. 2000, 36, 1897–1910. [Google Scholar] [CrossRef] [Green Version]
  68. Srivastava, R.; Yeh, T.J. Analytical solutions for one-dimensional, transient infiltration toward the water table in homogeneous and layered soils. Water Resour. Res. 1991, 27, 753–762. [Google Scholar] [CrossRef]
  69. Gardner, W.R. Some steady-state solutions of the unsaturated moisture flow equation with application to evaporation from a water table. Soil Sci. 1958, 85, 228–232. [Google Scholar] [CrossRef]
  70. Taylor, D.W. Fundamentals of Soil Mechanics; John Wiley & Sons, Inc.: New York, NY, USA, 1948; Volume 66, p. 161. [Google Scholar]
  71. Alvioli, M.; Baum, R.L. Parallelization of the TRIGRS model for rainfall-induced landslides using the message passing interface. Environ. Model. Softw. 2016, 81, 122–135. [Google Scholar] [CrossRef]
  72. Xie, M.; Esaki, T.; Zhou, G. GIS-based probabilistic mapping of landslide hazard using a three-dimensional deterministic model. Nat. Hazards 2004, 33, 265–282. [Google Scholar] [CrossRef]
  73. Wei, L.W.; Huang, C.M.; Chen, H.; Lee, C.T.; Chi, C.C.; Chiu, C.L. Adopting the I3-R24 rainfall index and landslide susceptibility for the establishment of an early warning model for rainfall-induced shallow landslides. Nat. Hazards Earth Syst. Sci. 2018, 18, 1717–1733. [Google Scholar] [CrossRef] [Green Version]
  74. Reichenbach, P.; Cardinali, M.; De Vita, P.; Guzzetti, F. Regional hydrological thresholds for landslides and floods in the Tiber River Basin (central Italy). Environ. Geol. 1998, 35, 146–159. [Google Scholar] [CrossRef]
  75. Wu, S.J.; Hsiao, Y.H.; Yeh, K.C.; Yang, S.H. A probabilistic model for evaluating the reliability of rainfall thresholds for shallow landslides based on uncertainties in rainfall characteristics and soil properties. Nat. Hazards 2017, 87, 469–513. [Google Scholar] [CrossRef]
  76. Zhang, S.J.; Xu, C.X.; Wei, F.Q.; Hu, K.H.; Xu, H.; Zhao, L.Q.; Zhang, G.P. A physics-based model to derive rainfall intensity-duration threshold for debris flow. Geomorphology 2020, 351, 106930. [Google Scholar] [CrossRef]
Figure 1. (a) Location of Guizhou province and Pu’an county; (b) Location of study area.
Water 14 00524 g001
Figure 2. (a) Geology map of Dabang village study area; (b) the distribution map of red loam and lime soil in the study area.
Water 14 00524 g002
Figure 3. Field sampling images.
Water 14 00524 g003
Figure 4. Flowchart of the second screening method (M2).
Water 14 00524 g004
Figure 5. Intensity–duration thresholds for the slope units with critical rainfall in Dabang village study area. N represent the defined I-D thresholds without screening. M1 represent the thresholds defined after M1 screening method. M2 represent after M2 method.
Water 14 00524 g005
Figure 6. (ac) Intensity–duration threshold curves separated in average slope for the slope units with critical rainfall; (df) intensity–duration threshold curves separated in soil thickness for the slope units with critical rainfall.
Water 14 00524 g006
Figure 7. Maps representing the defined I-D thresholds after M1 screening for each slope unit: (a) scale parameter α; (b) shape parameter β; (c) initial duration; and (d) final duration.
Water 14 00524 g007
Figure 8. Maps representing the defined I-D thresholds after M2 screening for each slope unit: (a) scale parameter α; (b) shape parameter β.
Water 14 00524 g008
Figure 9. Maps representing the defined I-D thresholds without screening for each slope unit: (a) scale parameter α; (b) shape parameter β; (c) initial duration; and (d) final duration.
Water 14 00524 g009
Figure 10. Critical rainfall intensity ( I c ) of 10 slope units for: (a) D = 35 h and (b) D = 50 h. The average of the absolute value of I p I c was calculated (Table 3).
Water 14 00524 g010
Table 1. Geotechnical parameters of the study area input in TRIGRS.
ParametersSymbol (Unit)Zone 1 (Lime Soil)Zone 2 (Red Loam)
Cohesion c ( Kpa ) 45.2110.73
Internal friction angle ϕ ( ° ) 19.0012.60
Unit weight of soil γ s ( KN / m 3 ) 18.2019.27
Saturated hydraulic conductivity K s ( m / s ) 3.33 × 10−65.73 × 10−6
Hydraulic diffusivity D 0 ( m / s ) 3.33 × 10−45.73 × 10−4
Saturated water content θ s 0.430.49
Residual water content θ r 0.060.08
Table 2. Incremental steps for duration(D).
Increment Step (h)Duration Range
1 h1–20 h
4 h20–60 h
Table 3. Average of the absolute value of I p I c .
DurationNM1M2
Average of | I p I c |
D = 35 h2.1910.72000.6122
D = 50 h4.4330.62590.5655
Publisher’s Note: MDPI stays neutral with regard to jurisdictional claims in published maps and institutional affiliations.

