
Changes in the Heat Content of Water Column in the Slope Area of the Southern Basin of Lake Baikal in the 21st Century


1
Limnological Institute of SB RAS, 664033 Irkutsk, Russia
2
Physical Department, Irkutsk State University, 664003 Irkutsk, Russia
*
Author to whom correspondence should be addressed.
Water 2022, 14(3), 348; https://doi.org/10.3390/w14030348
Submission received: 24 December 2021
/
Revised: 21 January 2022
/
Accepted: 23 January 2022
/
Published: 25 January 2022
(This article belongs to the Special Issue Climate Change and Human Impact on Freshwater Water Resources: Rivers and Lakes)
Abstract
:Climate change influences the temperature, ice and thermal regimes of lakes in the Northern Hemisphere. This study discusses the change in the heat content of the water column in the slope area of the southern basin of Lake Baikal under the influence of climate for the past 20 years. We clarify the seasonal variability of heat content in different water layers selected taking into account temperature and dynamic characteristics. During the study period, the value of heat content increased in the upper water layer (45–100 m) only in May (12.4 (MJ/m2)/year). In the water layers deeper than 100 m, the value of heat content decreased: −3–−4 (MJ/m2)/year from July to September in a layer of 100–300 m, −9–−13 (MJ/m2)/year in all months in a layer of 300–1100 m and −1.5–−3 (MJ/m2)/year in all months, except for January in a layer of 1100 m–bottom. Despite the revealed trends of the change in the heat content, the annual heat circulation remained within the normal range and did not have any trends.
1. Introduction
The influence of climate on the water temperature of the surface and deep-water layers is being investigated in many lakes of the world, e.g., [1,2,3,4,5,6,7,8,9]. Some studies assess the influence of climate on ice regime, stratification and stability of waters, e.g., [10,11,12,13,14]. Other studies provide the results of assessing the influence on the number of nutrients, phyto- and zooplankton in lakes, e.g., [15,16].
Similar studies are also being carried out for Lake Baikal [17,18,19,20,21,22,23,24,25]. In [20], a positive relationship was shown between the changes in air temperature on the coast of Lake Baikal and temperature in the upper water layer of the lake in the second half of the 20th century. The highest water temperature trends were observed at all stations from August to September (0.26–2.23 °C/10 years). At the same time, it was revealed that the trend value increases from south to north due to lower (i) wind intensity over the northern basin of Lake Baikal and (ii) epilimnion capacity (7–10 m in the southern and central basins of Lake Baikal and at ~2 m in the northern basin during months with the maximum heating). That study [20] and a later study [24] based on the water temperature data until 2016 from many coastal weather stations revealed spatial heterogeneity of temperature trends in the upper water layer, which was especially evident in the southern basin of Lake Baikal. Other studies have shown a reduction in the freeze-up period [14,17,18,19] and the relationship between the change in the surface water temperature and ice characteristics with atmospheric circulation [23,25]. In addition to the study of the influence of climate on the surface water temperature, the influence on the temperature of deep-water layers in different Baikal basins in some months has been also studied [26]. Several studies discuss the influence of the changes in water temperature on chlorophyll a, zooplankton and algae in Lake Baikal, e.g., [21,27,28].
At the same time, there are very few studies on the changes in heat content and annual heat circulation in lakes under the influence of climate [29,30,31]. These are among the important indicators of the heat budget of water bodies, although heat reserves in the lake, their amount and redistribution within the year have a significant impact on both the ecosystem of the lake and on the surrounding area.
The first estimates of heat content of the water in the coastal zone of Lake Baikal date back to the early 20th century [32]. V.B. Shostakovich compared the heat content values in different months of the year and observed the greatest amount of heat in October and the lowest amount in April. In the middle of the 20th century, L.L. Rossolimo [33] estimated heat content in the upper 200 m water layer and the deep part of the water column for different areas of the lake based on the observation data on water temperature in Lake Baikal accumulated by that time. V.B. Shostakovich and L.L. Rossolimo believed that the main heat circulation in Lake Baikal occurs in the upper 200 m water layer, and deeper water layers do not practically participate in heat circulation. Later, the fallacy of this hypothesis was shown in [34,35].
Based on the observations from 1896 until the early 1960s throughout Lake Baikal, V.I. Verbolov and co-authors [34] calculated heat contents in different water layers up to a depth of 500 m. They revealed that (a) in the upper 500 m water layer heat content changes within the year, (b) the greatest heat content value is observed in the upper 100 m water layer, with the maximum in September and the minimum in February, (c) in deeper layers there are two maximums (April and October–November) and two minimums (January and May–June) and (d) there is a several-fold decrease in the amplitude of fluctuations in the heat content value with depth. Additionally, they studied in detail the causes of changes in heat content at different depths.
In [34,35], not only temporal but also spatial variability in heat content were shown. Heat content is greater in coastal zones and lower in the pelagic zone of the lake. At the same station, heat content values can change during hours and days due to advection processes.
Subsequently [36], based on routine measurements of water temperature from 1971 to 1985, heat content values were calculated for individual layers of the entire water column, and annual heat circulation was estimated for the three basins of Lake Baikal. Long-term changes in heat content were associated with interannual variability of the maximum heat content values (September). The same study [36] provided the qualitative assessment of the increase in the values of the minimum heat content in the upper 300 m water layer in the southern basin owing to softer weather conditions in autumn and winter and a shift in the onset of freeze-up to later dates.
This study aims to investigate seasonal and interannual changes in the heat content and the annual heat circulation in the water column of the slope area in the southern basin of Lake Baikal under the influence of climate for the past 20 years.
2. Materials and Methods
2.1. Materials
To calculate heat content (Q), we used the data on water temperature from 1999 to 2021 at buoy station Ice Camp (BS IC) located near the Baikal-GVD Deep Underwater Neutrino Telescope (Ivanovskiy Cape, southern basin of Lake Baikal, Figure 1). BS IC was established in 1999 at a distance of 3.5 km from the coast at the foot of the underwater slope (depth 1367 m). In different years, from 5 to 19 thermistors of the TR (RBR Ltd., Ottawa, ON, Canada; accuracy ±0.002 °C) and VEMCO (VEMCO Ltd., Nova Scotia, Canada, accuracy ±0.05 °C, installed until March 2009 in the upper water layers where significant seasonal changes in water temperature were observed) series were used for records, which were installed at depths of 15–43 m to the bottom. In the upper 200 m water layer, thermistors were installed every 15–50 m, and in deeper layers every 50–300 m. In the near-bottom layer, they were installed at depths of 150, 100, 30 and 4 m from the bottom. Discreteness of measurements in different years and different layers varied from 15 s to 15 min.
The analysis did not use the data obtained from March 1999 to March 2000 because of the small number of thermistors (five) at BS IC as well as from March 2002 to March 2004 due to overestimated values of the measured water temperature below 100 m depth. In different years, the first thermistor from the water surface was located at BS IC at depths from 11 (from March 2005 to March 2007) to 43 m (from March 2015 to March 2016) and from 15 to 20 m (in other years).
2.2. Calculation Methods
Heat content (Q) was calculated taking into account the characteristics of temperature regime and dynamic processes for the layers of 0–100 m, 100–300 m, 300–1100 m and 1100 m–bottom as well as for the entire water column. Based on the data from BS IC, the average daily temperatures were calculated first, and then the weighted average temperatures of the water layer were calculated for certain days. Thereafter, values of heat content in each water layer were calculated for certain months; the trends and their reliability (p) were estimated. Additionally, annual heat circulation (ΔQ) of the entire water column was studied for the observation period.
Based on the data from the stations near the west coast of the southern basin (WCSB), heat content was calculated for March and September. At the initial stage, heat content was calculated in water layers and the entire water column for each station. Then, the average values of the heat content in the water layers at all stations for a particular month were calculated by averaging. Additionally, the Q trends and their reliability were estimated, and ΔQ was studied for the observation period.
The ΔQ value was determined as the average of the absolute values of increments of heat content in the entire water column during heat accumulation (ΔQ+) and heat loss (ΔQ−). The ΔQ+ and ΔQ− values were calculated using the heat content values obtained in March and September near BS IC and for WCSB.
3. Results
3.1. Seasonal and Long-Term Changes in Heat Content
As expected, the most significant seasonal variation in Q is characteristic of the upper water layer of 45–100 m (Figure 2a). The Q45–100 m maximum occurs in October, and the minimum is in February. The greatest differences between the maximum and minimum Q45–100 m values are observed in September and October (1225.2 and 1008.2 MJ/m2, respectively), which is associated with weather conditions during the ice-free period (air temperature, wind activity, cloudiness, etc.), affecting heat accumulation by the end of the summer warm-up.
In the lower part of the active layer, the Q100–300 m maximum (Figure 2b) occurs one month later (November), and the minimum is observed a month earlier (January). The greatest variations in the Q100–300 m values are observed in October and November (506.0 and 417.1 MJ/m2, respectively) as well as in January (421.2 MJ/m2). Such variability in Q100–300 m in October and November is associated with weather conditions of the summer warm-up, which determine the amount of the incoming heat to the water column, and autumn cooling when heat release into the atmosphere begins. Moreover, during this time, Q100–300 m also depends on the intensity of the free temperature convection in the active layer of the water column. It develops in autumn during the transition from direct stratification to reverse stratification in November and contributes both to the redistribution of heat deep into the water column and to the release of heat into the atmosphere.
In January, weather conditions before the freeze-up period and during the freeze-up determine the great variability in Q100–300 m [25]. The earlier the ice cover appears the more heat is retained in the lower part of the active layer and, conversely, with a later onset of the freeze-up, the lower layer of the active layer releases more heat into the upper 100 m water layer and cools more intensively. For instance, the observations on the pier of Limnological Institute SB RAS in the Listvyanka settlement revealed that in the southern basin the freeze-up periods from 2000 to 2021 varied within a month: from 4 January (2010) to 2 February (2014).
In the deep-water layer, seasonal variability in the Q300–1100 m value is insignificant (Figure 2c). Nevertheless, there is some maximum in the winter months (December and January) and a minimum in the middle of summer (July). The greatest variability in the Q300–1100 m values, as well as for the layer of 100–300 m, is typical of October and November (477.6 and 528.4 MJ/m2, respectively). Perhaps, it is also associated with weather conditions (mainly wind activity). With a small wind activity in the active layer, more heat should be retained, which then enters the deep-water layer with turbulent diffusion. With high wind activity, heat loss in the active layer is greater and, hence, its supply to the deep-water layer decreases.
In the bottom layer, the average Q1100 m-bottom value slightly increases during the year (Figure 2d). A slight decrease can be observed in December and January. The greatest variations in the Q300–1100 m values are characteristic for January (139.1 MJ/m2) due to intrusions of cold surface waters [39,40,41], depending on the freeze-up onset. The influence of spring intrusions in June affects only the minimum Q300–1100 m values from June to August (3722.4, 3729.8 and 3723.3, respectively). These Q300–1100 m values were obtained for 2007 when on 28 May a cold-water intrusion with a volume of 165 km3 was recorded [41].
Seasonal distribution of Q45 m-bottom (Figure 2e) corresponds to that for the water layer of 45–100 m, the heat content of which affects the heat content of the entire water column most. The maximum variations in the Q45 m-bottom values, as in the upper water layer, are observed in September and October (1765.5 and 1818.6 MJ/m2, respectively). Therefore, seasonal variations in the heat content at the end of the heat accumulation period (September and October) largely depend on the heat accumulation in the upper 100 m layer. At the same time, the heat contents in the water layers of 100–300 and 300–1100 m with the greatest variations in Q values in October and November make a clear contribution to the Q45 m-bottom value.
The uppermost water layer (45–100 m) is distinguished by the greatest interannual variability in the heat content (Figure 2, Table 1). The standard deviation (SD) for all months varies within 11–40% of the average Qmonth value from 2000 to 2021. In deeper water layers, long-term changes in the heat content values are less significant by an order of magnitude. In a water layer of 100–300 m, the standard deviation ranges from 1 to 4%. In deeper water layers, the standard deviation does not exceed 1%, and for the entire water column, 2%.
The greatest changes in the heat content (SD 33–40%) in the upper water layer (45–100 m) are typical of January to April (Table 1). In winter, this is associated with air temperature and wind activity before the freeze-up period, which affect the formation of the ice [25]. High wind activity and low air temperatures contribute to the large heat losses during evaporation from the lake surface before the freeze-up. However, very low air temperatures and weak wind activity contribute to the earlier formation of the ice (first half of January).
In spring, with the onset of the under-ice warm-up, the ice thickness and the presence of snow on the ice play a more important role. The thicker the ice and snow on the ice, the less sunlight penetrates the water and, conversely, the thinner the ice and snow on the ice, the more intensively the under-ice water layer warms up. Moreover, the end of the ice period has an influence in April. Based on the observations from 2000 to 2021, the end of freeze-up in the southern basin of Lake Baikal varied, like the freeze-up onset, within a month (13 April (2014) and 11 May (2010), the average date was 23 April).
In a layer of 100–300 m, the changes in the heat content depend not only on weather conditions but also on the process of vertical mixing that develops in the field of temperature and density heterogeneity (free temperature convection, forced deep convection, turbulent diffusion, etc.) and carries heat to the lower part of the active layer. The greatest variations (Table 1) were found for October–November and January–February (3–4%).
The deep (300–1100 m) and near-bottom (1100–bottom) layers have the lowest variability of the heat content (Table 1). The deep layer is distinguished by the highest dynamic and thermal stability both within the year and in the long-term aspect. In the near-bottom layer, there is a change in temperature owing to the sinking of water along the underwater slopes in the flow field from July to October and intrusions of cold surface waters in January and late May–early June. Although intrusions near BS IC can reach large volumes in some years (171 km3 on 17 December 2002, 203 km3 on 5 January 2007 and 165 km3 on 28 May 2007 [41]), they do not have a significant impact on monthly values of the heat content in near-bottom layer.
In the entire water column, the interannual variability of the heat content is small in different years (SD ≤ 2%). This allows us to conclude that though the heat content in the upper 100 m water layer makes the maximum contribution to the interannual variability of the heat content in the entire water column, its variability is insignificant for the heat content of the entire water column.
During the study period, the upper water layer (45–100 m) did not show a significant positive trend of heat content (Table 2). In the lower part of the active layer of the water column in Lake Baikal (100–300 m), significant negative Q trends occurred from July to September. In the deep zone, significant negative trends of heat content were observed in all months (Table 2). Furthermore, the greatest changes occurred in November and December (−12.1–−13.4 (MJ/m2)/year). In the near-bottom layer (1100 m–bottom), significant negative Q trends were identified in all months, except for January. In the entire water column, significant negative Q trends occurred in July and August (Table 2), accounting for −25.5–−34.6 (MJ/m2)/year.
Therefore, we can assume the local features of the changes in the heat content of certain water layers near Ivanovskiy Cape in different months. In the entire water column, a decrease in the heat content occurs only in July and August. Shortening of the freeze-up period contributes to the greater heat release not only from the active layer but also from deep layers before and during the freeze-up. During the warm-up period, this overexpenditure is not replenished. This is likely caused by the increased stratification of the upper water layers, which prevents the transfer of heat to deep layers due to turbulent diffusion. Negative trends of heat content in a water layer of 100–300 m from July to September indirectly confirm this. Even if heat accumulates in the upper 100 m water layer, it quickly returns to the atmosphere due to wind and wave-driven mixing and evaporation from the surface of the lake during the ice-free period.
3.2. Heat Circulation
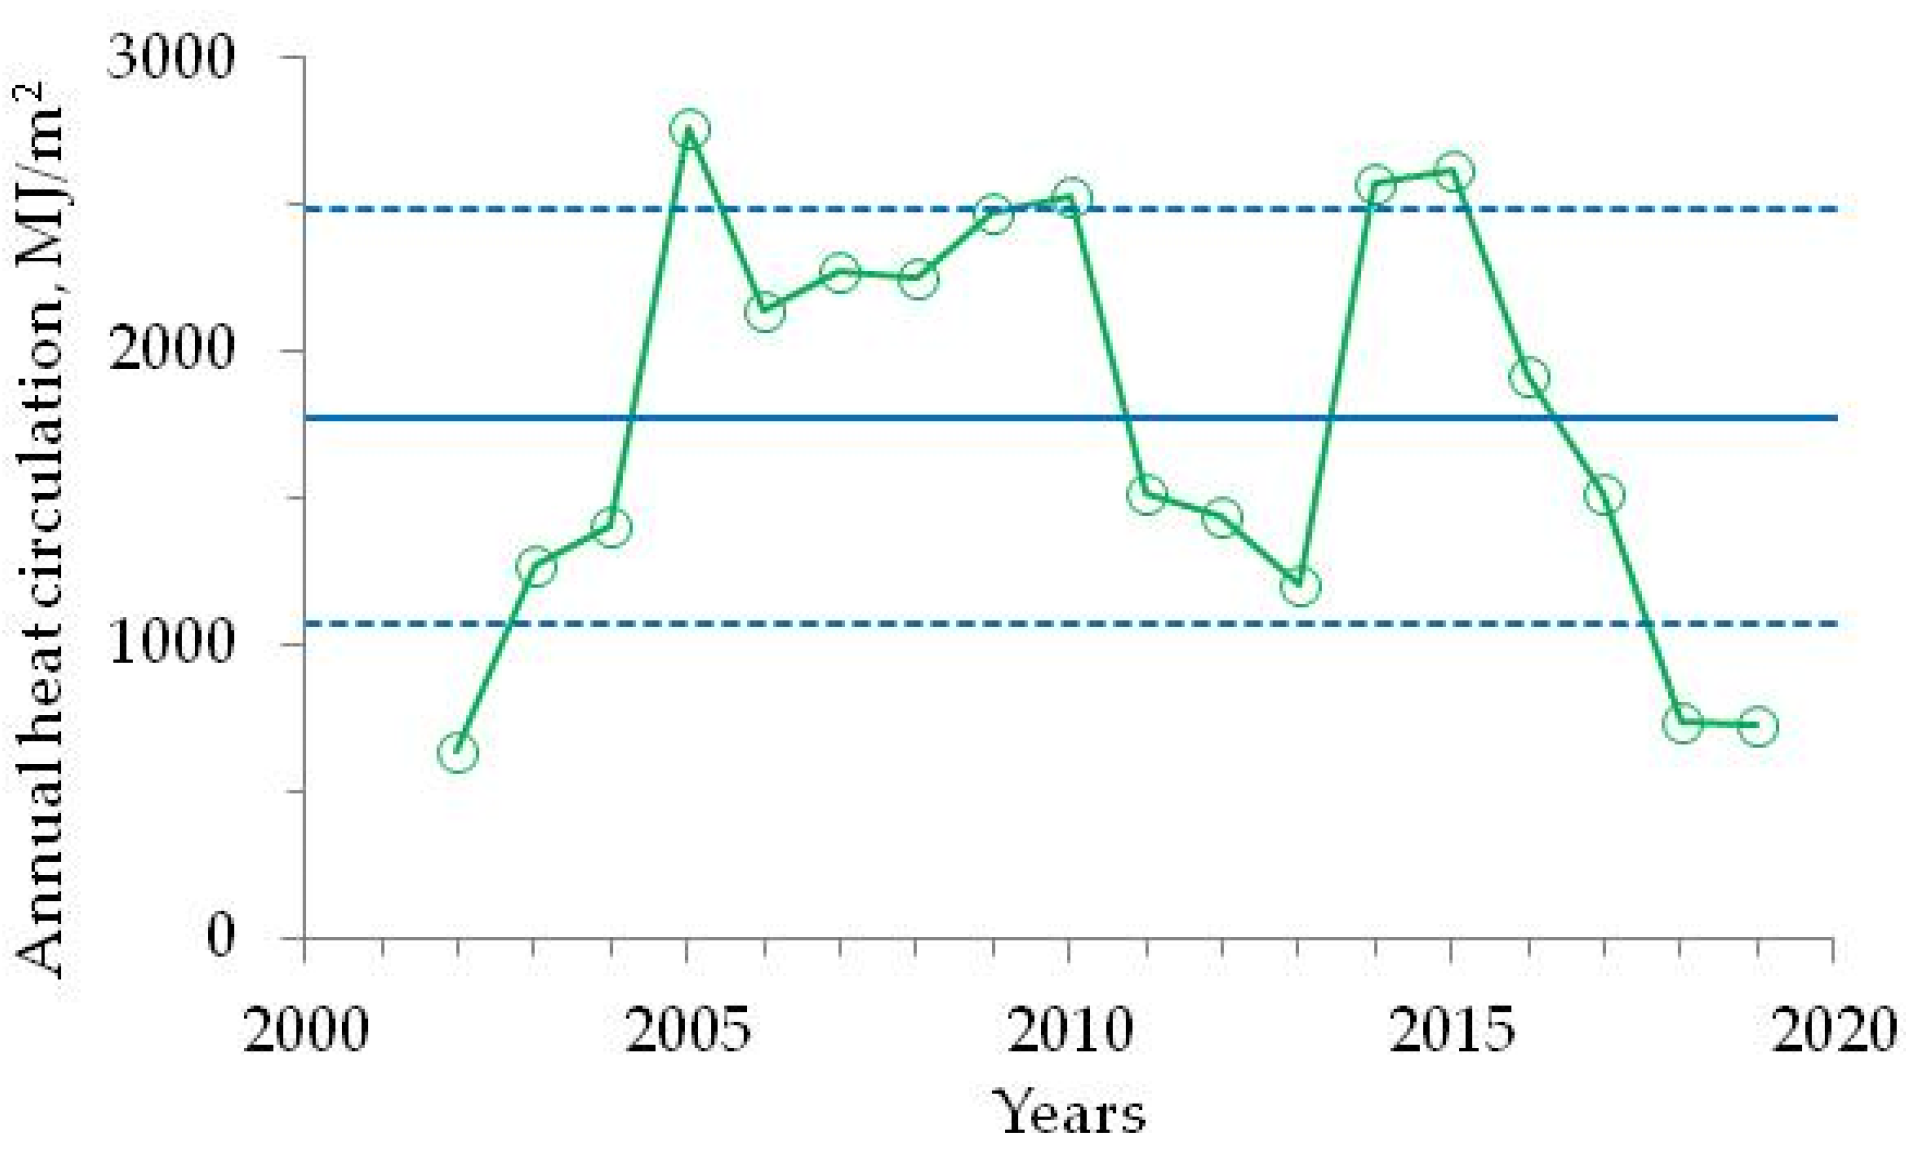
The ΔQ value (Figure 3) has significant interannual variations (635.9–2767.7 MJ/m2, the average 1778.9 MJ/m2, SD 704.8 MJ/m2). Nevertheless, in most observation years, the value of heat circulation was within the range of standard deviations (Figure 3). In some years, the heat circulation was beyond the standard deviation range (exceeded in 2005, 2010, 2015 and 2016; was lower in 2002, 2018 and 2019). The excess of heat circulation in 2005 is probably associated with the maximum heat content in August in September in all observation years, while in 2010 and 2015 with the minimum values of heat content in January and February, respectively, from 2000 to 2021. In 2006, no peculiarities were observed. Between 2000 and 2021, when the values of heat circulation were beyond the lower limit of SD, the maximum values of heat content were identified in 2002 from April to July. In other years, no peculiarities were observed. The value of linear trend is small (−17.7 (MJ/m2)/year) and insignificant (r = 0.13, p > 0.1).
4. Discussion
The data from the buoy station with large time discreetness allowed us to clarify seasonal changes in the heat content of the slope area in the southern basin of Lake Baikal. In the upper water layer (45–100 m) and the entire water column, the minimum heat content occurs in February and March, and the maximum in October. In the deeper water layers, the extremums shift. In a layer of 100–300 m, the minimum heat content occurs in January, and the maximum in November; in a layer of 300–1100 m, the minimum occurs in July, and the maximum in December and January; in a layer of 1100 m–bottom, the minimum occurs in December and January, and the maximum in November. Comparison of seasonal variability of a layer of 45–100 m and the upper 100 m water layer is incorrect. In the water layers deeper than 100 m, there were no shifts in the maximum and minimum heat contents. To check the change in the seasonal variability of the heat content in the upper 100 m water layer, data on ship measurements from the surface to the bottom should be used.
Even though the upper water layer was studied from the 45 m depth, its heat content is characterized by insignificant interannual differences throughout the year. The maximum variations in the Q values (up to 40%) are observed in the southern basin of Lake Baikal during the months with the ice (from January to April); the minimum variations—from June to August and in November–December (up to 14%). In the deeper water layers, interannual differences in the heat content in different months do not exceed 4% in a layer of 100–300 m and 2% in the water layers below 300 m.
The revealed trends of heat content indicate a redistribution of heat in the water column. Considering that we studied the upper water layer from the 45 m depth, we can assume that in the past 20 years heat has been accumulating in the upper 100 m water layer of the slope area in the southern basin of Lake Baikal under the influence of climate change. Positive trends of the average weighted water temperature (0.36–0.31 °C/10 years) in a layer of 0–100 m were observed in the southern basin in June and July from 1972 to 1992 [26]. However, later, from 1994 to 2016, long-term variations in the surface water temperature near the west coast of the southern basin of Lake Baikal did not have any significant trends from May to October [27]. Consequently, this should have led to a decrease in trends of the upper 100 m water layer. Fires occurring both in the watershed of Lake Baikal and in East Siberia could play a clear role in a decrease in the surface water temperature trends. The smoke from fires prevents the flow of solar heat to Baikal water. Severe wildfires in East Siberia were recorded in 2015, 2016, 2018, 2019 and 2020 [42,43,44,45,46,47].
Nevertheless, we revealed significant negative trends of the heat content from July to September in a layer of 100–300 m, throughout the year in the deep zone and in all months, except for January, in the near-bottom layer. On the one hand, this can be due to the intensification of stratification in the warm-up period and an increase in the vertical gradients of temperature and density, which prevents the heat supply into the deeper layers. This can take place not only with the growth of the surface water temperature caused by a greater heat supply from the atmosphere but also owing to a decrease in wind activity observed in recent years from May to October [48]. On the other hand, advection heat transfer in the water column from one area to another cannot be excluded.
Significant negative trends of the heat content in the water layers deeper than 300 m in late autumn and winter are associated with the shift in the freeze-up onset to later dates in the southern basin of Lake Baikal. The rise in air and water surface temperatures from November to January contributes to the increase in heat losses due to evaporation from the surface. With an increase in the wind speed in November and December, heat losses increase. On the contrary, in January, increased wind speed contributes to the growth of heat losses due to ice breaking and heat losses with evaporation from the lake surface. This leads to large heat losses from the active layer (0–300 m) and a heat deficiency in the water layers deeper than 300 m. After the formation of the negative stratification, the heat deficiency in the water layers deeper than 300 m persists until July when the minimum heat content is observed in a layer of 300–1100 m.
Previous research [26] revealed the significant negative trend of the average weighted water temperature (−0.03 °C/10 years) from 1995 to 2007 only in a water layer of 100 m from the bottom for the entire southern basin of Lake Baikal. In the water layers above, the trends of the average weighted water temperature were also negative, but their values were insignificant.
Intrusions of cold surface waters to the near-bottom area could influence the heat content of a layer of 1100 m–bottom, but this was revealed only in 2007 when some of the strongest intrusions were observed [41]. Most likely, deep intrusions influence the heat content of the water layer with a smaller thickness. Based on the obtained results, the issue of the influence of cold surface water intrusions on heat content in the near-bottom layer requires an individual study in the future.
Author Contributions
Conceptualization, M.S. and E.T.; methodology, E.T.; formal analysis, E.T.; investigation, M.S. and E.T.; resources, N.B.; writing—original draft preparation, E.T.; writing—review and editing, M.S.; visualization, E.T.; funding acquisition, N.B. All authors have read and agreed to the published version of the manuscript.
Funding
This research was funded within the framework of the State project “Science” by the Ministry of Science and Higher Education of the Russian Federation, grant number 075-15-2020-778, and this research was carried out by research workers within the framework of the LIN SB RAS State Project No. 0279-2021-0004.
Institutional Review Board Statement
Not applicable.
Informed Consent Statement
Not applicable.
Data Availability Statement
Not applicable.
Acknowledgments
The authors thank the colleagues from EAWAG (Switzerland) for the joint fieldwork and data collection, members of the Baikal collaboration and colleagues from Laboratory of Hydrology and Hydrophysics at LIN SB RAS for useful comments and discussion of the results of this study.
Conflicts of Interest
The authors declare no conflict of interest.
References
- Schneider, P.; Hook, S.J. Space observations of inland water bodies show rapid surface warming since. Geophys. Res. Lett. 1985, 37, 22405–22409. [Google Scholar]
- Goldman, C.R.; Kumagai, M.; Robarts, R.D. (Eds.) Climatic Change and Global Warming of Inland Waters: Impacts and Mitigation for Ecosystems and Societies; Wiley-Blackwell Chichester: West Sussex, UK, 2013; Part I; 496p. [Google Scholar]
- Winslow, L.A.; Read, J.S.; Hansen, G.J.A.; Hanson, P.C. Small lakes show muted climate change signal in deep-water temperatures. Geophys. Res. Lett. 2014, 42, 355–361. [Google Scholar] [CrossRef]
- O’Reilly, C.M.; Sharma, S.; Gray, D.K.; Hampton, S.E.; Read, J.S.; Rowley, R.J.; Schneider, P.; Lenters, J.D.; McIntyre, P.B.; Kraemer, B.M.; et al. Rapid and highly variable warming of lake surface waters around the globe. Geophys. Res. Lett. 2015, 42, 10773–10781. [Google Scholar] [CrossRef] [Green Version]
- Kraemer, B.M.; Hook, S.; Huttula, T.; Kotilainen, P.; O’Reilly, C.M.; Peltonen, A.; Plisnier, P.-D.; Sarvala, J.; Tamatamah, R.; Vadeboncoeur, Y.; et al. Century-long warming trends in the upper water column of Lake Tanganyika. PLoS ONE 2015, 10, e0132490. [Google Scholar] [CrossRef] [Green Version]
- Mason, L.A.; Riseng, C.M.; Gronewold, A.D.; Rutherford, E.S.; Wang, J.; Clites, A.; Smith, S.D.P.; McIntyre, P.B. Fine-scale spatial variation in ice cover and surface temperature trends across the surface of the Laurentian Great Lakes. Clim. Chang. 2016, 138, 71–83. [Google Scholar] [CrossRef]
- Winslow, L.A.; Read, J.S.; Hansen, G.J.A.A.; Rose, K.C.; Robertson, D.M. Seasonality of change: Summer warming rates do not fully represent effects of climate change on lake temperatures. Limnol. Oceanogr. 2017, 62, 2168–2178. [Google Scholar] [CrossRef]
- Woolway, R.I.; Merchant, C.J. Intralake heterogeneity of thermal responses to climate change: A study of large Northern Hemisphere lakes. J. Geophys. Res. Atmos. 2018, 6, 3087–3098. [Google Scholar] [CrossRef]
- Woolway, R.I.; Kraemer, B.M.; Lenters, J.D.; Merchant, C.J.; O’Reilly, C.M.; Sharma, S. Global lake responses to climate change. Nat. Rev. Earth Environ. 2020, 1, 388–403. [Google Scholar] [CrossRef]
- Kraemer, B.M.; Anneville, O.; Chandra, S.; Dix, M.; Kuusisto, E.; Livingstone, D.M.; Rimmer, A.; Schladow, S.G.; Silow, E.; Sitoki, L.M.; et al. Morphometry and average temperature affect lake stratification responses to climate change. Geophys. Res. Lett. 2015, 42, 4981–4988. [Google Scholar] [CrossRef] [Green Version]
- Rose, K.; Winslow, L.; Read, J. Climate-induced warming of lakes can be either amplified or suppressed by trends in water clarity. Limnol. Oceanogr. Lett. 2016, 1, 44–53. [Google Scholar] [CrossRef]
- Richardson, D.C.; Melles, S.J.; Pilla, R.M.; Hetherington, A.L.; Knoll, L.B.; Williamson, C.E.; Kraemer, B.M.; Jackson, J.R.; Long, E.C.; Moore, K.; et al. Transparency, Geomorphology and Mixing Regime Explain Variability in Trends in Lake Temperature and Stratification across Northeastern North America (1975–2014). Water 2017, 9, 442. [Google Scholar] [CrossRef]
- Niedrist, G.H.; Psenner, R.; Sommaruga, R. Climate warming increases vertical and seasonal water temperature differences and inter-annual variability in a mountain lake. Clim. Chang. 2018, 151, 473–490. [Google Scholar] [CrossRef] [Green Version]
- Magnuson, J.J.; Robertson, D.M.; Benson, B.J.; Wynne, R.H.; Livingstone, D.M.; Arai, T.; Assel, R.A.; Barry, R.G.; Card, V.V.; Kuusisto, E.; et al. Historical Trends in Lake and River Ice Cover in the Northern Hemisphere. Science 2000, 289, 1743–1746. [Google Scholar] [CrossRef] [PubMed] [Green Version]
- Bartosiewicz, M.; Przytulska, A.; Lapierre, J.-F.; Laurion, I.; Lehmann, M.F.; Maranger, R. Hot tops, cold bottoms: Synergistic climate warming and shielding effects increase carbon burial in lakes. Limnol. Oceanogr. Lett. 2019, 4, 132–144. [Google Scholar] [CrossRef] [Green Version]
- Ho, J.C.; Michalak, A.M.; Pahlevan, N. Widespread global increase in intense lake phytoplankton blooms since the 1980s. Nature 2019, 574, 667–670. [Google Scholar] [CrossRef] [PubMed]
- Livingstone, D.M. Ice break-up on southern Lake Baikal and its relationship to local and regional air temperatures in Siberia and to the North Atlantic Oscillation. Limnol. Oceanogr. 1999, 44, 1486–1497. [Google Scholar] [CrossRef] [Green Version]
- Shimaraev, M.N.; Kuimova, L.N.; Sinyukovich, V.N.; Tsekhanovskii, V.V. Climate and Hydrological Processes in Lake Baikal in the 20th Century. Memeopoлoгия u Гuдpoлoгuя 2002, 3, 71–78. (In Russian) [Google Scholar]
- Todd, M.C.; Mackay, A.W. Large-scale climate controls on Lake Baikal ice cover. J. Clim. 2003, 16, 3186–3199. [Google Scholar] [CrossRef]
- Troitskaya, E.S.; Shimaraev, M.N.; Tsekhanovsky, V.V. Long-term changes in water surface temperature in Lake Baikal. Geogr. Nat. Resour. 2003, 2, 47–50. (In Russian) [Google Scholar]
- Hampton, S.E.; Izmest’eva, L.R.; Moore, M.V.; Katz, S.L.; Dennis, B.; Silov, E.A. Sixty years of environmental change in the world’s largest freshwater lake—Lake Baikal, Siberia. Glob. Chang. Biol. 2008, 14, 1947–1958. [Google Scholar] [CrossRef] [Green Version]
- Katz, S.L.; Hampton, S.E.; Izmest’eva, L.R.; Moore, M.V. Influence of Long-Distance Climate Teleconnection on Seasonality of Water Temperature in the World’s Largest Lake—Lake Baikal, Siberia. PLoS ONE 2011, 6, e14688. [Google Scholar] [CrossRef] [PubMed] [Green Version]
- Sizova, L.N.; Kuimova, L.N.; Shimaraev, M.N. Influence of the atmospheric circulation on ice-thermal processes on Baikal during 1950–2010. Geogr. Nat. Res. 2013, 2, 74–82. [Google Scholar] [CrossRef]
- Shimaraev, M.N.; Troitskaya, E.S. Current Trends in Upper Water Layer Temperature in Coastal Zones of Baikal. Geogr. Nat. Res. 2018, 4, 95–104. [Google Scholar] [CrossRef]
- Shimaraev, M.N.; Sizova, L.N.; Troitskaya, E.S.; Kuimova, L.N.; Yakimova, N.I. Ice-thermal Regime of Lake Baikal under Conditions of Modern Warming (1950–2017). Russ. Meteorol. Hydrol. 2019, 44, 679–686. [Google Scholar] [CrossRef]
- Shimaraev, M.N.; Troitskaya, E.S.; Gnatovskii, R.Y. Modern climate changes and deep water temperature of Lake Baikal. Dokl. Earth Sci. 2009, 427, 804–808. [Google Scholar] [CrossRef]
- Timoshkin, O.A.; Moore, M.V.; Kulikova, N.N.; Tomberg, I.V.; Malnik, V.V.; Shimaraev, M.N.; Troitskaya, E.S.; Shirokaya, A.A.; Sinyukovich, V.N.; Zaitseva, E.P.; et al. Groundwater contamination by sewage causes benthic algal outbreaks in the littoral zone of Lake Baikal (East Siberia). J. Great Lakes Res. 2018, 44, 230–244. [Google Scholar] [CrossRef]
- Kraemer, B.M.; Pilla, R.M.; Woolway, R.I.; Anneville, O.; Ban, S.; Colom-Montero, W.; Devlin, S.P.; Dokulil, M.T.; Gaiser, E.E.; Hambright, K.D.; et al. Climate change drives widespread shifts in lake thermal habitat. Nat. Clim. Chang. 2021, 11, 521–529. [Google Scholar] [CrossRef]
- Weinberg, S.; Vetter, M. Lake heat content and stability variation due to climate change: Coupled regional climate model (REMO)-lake model (DYRESM) analysis. J. Limnol. 2014, 73, 93–105. [Google Scholar]
- Vanderkelen, I.; van Lipzig, N.P.M.; Lawrence, D.M.; Droppers, B.; Golub, M.; Gosling, S.N.; Janssen, A.B.G.; Marcé, R.; Müller Schmied, H.; Perroud, M.; et al. Global heat uptake by inland waters. Geophys. Res. Lett. 2020, 47, e2020GL087867. [Google Scholar] [CrossRef]
- Filatov, N.; Baklagin, V.; Efremova, T.; Nazarova, L.; Palshin, N. Climate change impacts on the watersheds of Lakes Onego and Ladoga from remote sensing and in situ data. Inland Waters 2019, 9, 130–141. [Google Scholar] [CrossRef]
- Shostakovich, V.B. Lake Baikal. Priroda [Nature] 1917, 7–8, 803–832. (In Russian) [Google Scholar]
- Rossolimo, L.L. Temperature regime of Lake Baikal. In Proceedings of Baikal Limnological Station; Galazii, G.I., Ed.; Publishing house of the USSR Academy of Sciences: Moscow, Russia, 1957; Volume XVI, 552p. (In Russian) [Google Scholar]
- Verbolov, V.I.; Sokolnikov, V.M.; Shimaraev, M.N. Hydrometeorological Regime and Thermal Balance of Lake Baikal; Nauka: Moscow, Russia, 1965; pp. 281–309. (In Russian) [Google Scholar]
- Shimaraev, M.N. Elements of the Thermal Regime in Lake Baikal; Nauka: Novosibirsk, Russia, 1977; pp. 88–136. (In Russian) [Google Scholar]
- Shimaraev, M.N. Thermal regime of deep lakes (on the example of Lake Baikal), Volume 8: Lakes and reservoirs. In Proceedings of the V All-Union Hydrological Congress, Leningrad, Russia, 20–24 October 1986; Preobrazhensky, L.Y., Einbund, M.M., Avakian, A.B., Eds.; Gidrometeoizdat: Leningrad, Russia, 1990; pp. 294–307. (In Russian). [Google Scholar]
- Sherstyankin, P.P.; Alekseev, S.P.; Abramov, A.M.; Stavrov, K.G.; Batist, M.D.; Hus, R.; Canals, M.; Casamor, J.L. Computer-based bathymetric map of Lake Baikal. Dokl. Earth Sci. 2006, 408, 564–569. [Google Scholar] [CrossRef]
- Bathymetric Contour Map of Lake Baikal. Available online: http://www.lin.irk.ru/intas/maps.htm (accessed on 29 October 2021).
- Weiss, R.F.; Carmack, E.C.; Koropalov, V.M. Deep-water renewal and biological production in Lake Baikal. Nature 1991, 349, 665–669. [Google Scholar] [CrossRef]
- Shimaraev, M.N.; Granin, N.G. Temperature stratification and the mechanism of convection in Lake Baikal. Dokl. Akad. Nauk. [Dokl. Earth Sci.] 1991, 321, 381–385. (In Russian) [Google Scholar]
- Tsimitri, C.; Rockel, B.; Wüest, A.; Budnev, N.M.; Sturm, M.; Schmid, M. Drivers of deep-water renewal events observed over 13 years in the South Basin of Lake Baikal. J. Geophys. Res. Oceans 2015, 120, 1508–1526. [Google Scholar] [CrossRef] [Green Version]
- Marinaite, I.I.; Molozhnikova, E.V.; Khodzher, T.V. PAHs transfer and intake to the water area of Lake Baikal during the summer forest fires in 2016. In Proceedings of the SPIE 10833, 24th International Symposium on Atmospheric and Ocean Optics: Atmospheric Physics, Tomsk, Russia, 13 December 2018; Matvienko, G.G., Romanovskii, O.A., Eds.; International Society for Optics and Photonics: Bellingham, DC, USA, 2018; Volume 10833, p. 1083374. [Google Scholar]
- Marinaite, I.I.; Potyomkin, V.L.; Khodzher, T.V. Distribution characteristics of PAHs and solid particles over the water area of lake Baikal during wildfires in summer 2018. In Proceedings of the SPIE 11208, 25th International Symposium on Atmospheric and Ocean Optics: Atmospheric Physics, Novosibirsk, Russia, 18 December 2019; Matvienko, G.G., Romanovskii, O.A., Eds.; International Society for Optics and Photonics: Bellingham, DC, USA, 2018; p. 112082W. [Google Scholar]
- Marinaite, I.I.; Potyomkin, V.L.; Khodzher, T.V. Evaluation of atmospheric pollution with PAHS and PM10 above the water area of Lake Baikal during wildfires in Summer 2019. In Proceedings of the SPIE 11560, 26th International Symposium on Atmospheric and Ocean Optics, Atmospheric Physics, Moscow, Russia, 12 November 2020; Matvienko, G.G., Romanovskii, O.A., Eds.; International Society for Optics and Photonics: Bellingham, DC, USA, 2018; p. 115602W. [Google Scholar]
- Khodzher, T.V.; Golobokova, L.P.; Obolkin, V.A. Chemical composition of aerosol and gas impurities in the Baikal region during wildfires in the summer of 2018–2019. In Proceedings of the SPIE 11560, 26th International Symposium on Atmospheric and Ocean Optics, Atmospheric Physics, Moscow, Russia, 12 November 2020; Matvienko, G.G., Romanovskii, O.A., Eds.; International Society for Optics and Photonics: Bellingham, DC, USA, 2018; p. 1156040. [Google Scholar]
- Golobokova, L.P.; Khodzher, T.V.; Khuriganova, O.I.; Marinayte, I.I.; Onishchuk, N.A.; Rusanova, P.; Potemkin, V.L. Variability of Chemical Properties of the Atmospheric Aerosol above Lake Baikal during Large Wildfires in Siberia. Atmosphere 2020, 11, 1230. [Google Scholar] [CrossRef]
- Popovicheva, O.; Molozhnikova, E.; Nasonov, S.; Potemkin, V.; Penner, I.; Klemasheva, M.; Marinaite, I.; Golobokova, L.; Vratolis, S.; Eleftheriadis, K.; et al. Industrial and wildfire aerosol pollution over world heritage Lake Baikal. J. Environ. Sci. 2021, 107, 49–64. [Google Scholar] [CrossRef]
- Potemkina, T.G.; Potemkin, V.L.; Kotsar, O.V.; Fedotov, A.P. Climate factors as a possible trigger of modern ecological changes in shallow zone of Lake Baikal (Russia). Int. J. Environ. Stud. 2018, 75, 86–98. [Google Scholar] [CrossRef]
Figure 1.
Isobath map in the southern basin of Lake Baikal [37,38], the location of buoy station Ice Camp (orange triangle) near Ivanovskiy Cape (a) and a scheme of the buoy station (b).

Figure 2.
Seasonal variability in the average (blue curve with circles), maximum (red circles) and minimum (green circles) values of the heat content in the layers of 45–100 m (a), 100–300 m (b), 300–1100 m (c), 1100 m–bottom (d) and 45 m–bottom (e) calculated for 2000 to 2021.
Figure 2.
Seasonal variability in the average (blue curve with circles), maximum (red circles) and minimum (green circles) values of the heat content in the layers of 45–100 m (a), 100–300 m (b), 300–1100 m (c), 1100 m–bottom (d) and 45 m–bottom (e) calculated for 2000 to 2021.

Figure 3.
Interannual changes in the heat circulation in the entire water column (green curve with circles). The blue line is the average value of the annual heat circulation from 2002 to 2019, and the blue dotted lines are SD limits.
Figure 3.
Interannual changes in the heat circulation in the entire water column (green curve with circles). The blue line is the average value of the annual heat circulation from 2002 to 2019, and the blue dotted lines are SD limits.

Table 1.
Average values (upper value, MJ/m2) and standard deviation (lower value, absolute (MJ/m2) and relative (%) values) of the heat content values for certain water layers calculated based on the BS IC data.
Table 1.
Average values (upper value, MJ/m2) and standard deviation (lower value, absolute (MJ/m2) and relative (%) values) of the heat content values for certain water layers calculated based on the BS IC data.
| Month | Layer, m | ||||
|---|---|---|---|---|---|
| 45–100 | 100–300 | 300–1100 | 1100–Bottom | 45 m–Bottom | |
| January | 478.8 | 2902.6 | 11,584.2 | 3759.3 | 19,015.7 |
| 161.7/34 | 127.6/4 | 87.3/1 | 27.3/1 | 393.9/2 | |
| February | 446.5 | 2940.8 | 11,557.1 | 3762.9 | 18,838.4 |
| 179.8/40 | 83.6/3 | 79.9/1 | 18.4/0 | 348.9/2 | |
| March | 465.1 | 2959.1 | 11,550.2 | 3764.1 | 18,858.3 |
| 170.1/37 | 65.2/2 | 100/1 | 19.0/1 | 304.7/2 | |
| April | 493.2 | 2974.6 | 11,545.5 | 3765.9 | 18,929.0 |
| 161.6/33 | 60.2/2 | 98.4/1 | 19.3/1 | 317.2/2 | |
| May | 575.8 | 2969.2 | 11,539.7 | 3766.0 | 19,094.7 |
| 119.0/21 | 55.8/2 | 101.9/1 | 21.0/1 | 293.5/2 | |
| June | 793.5 | 3018.5 | 11,540.0 | 3765.6 | 19,500.8 |
| 107.9/14 | 47.3/2 | 99.9/1 | 23.0/1 | 322.4/2 | |
| July | 896.3 | 3090.4 | 11,533.8 | 3766.4 | 19,822.7 |
| 106.7/12 | 34.1/1 | 101.1/1 | 23.6/1 | 248.0/1 | |
| August | 997.2 | 3114.8 | 11,548.9 | 3767.7 | 20,230.1 |
| 169.7/17 | 32.5/1 | 99.5/1 | 24.7/1 | 369.8/2 | |
| September | 1244.8 | 3153.6 | 11,567.0 | 3769.2 | 20,655.1 |
| 315.4/25 | 44.1/1 | 102.1/1 | 27.1/1 | 490.8/2 | |
| October | 1328.4 | 3253.4 | 11,584.0 | 3771.0 | 20,871.1 |
| 249.6/19 | 131.5/4 | 111.8/1 | 27.5/1 | 513.9/2 | |
| November | 1062.9 | 3267.8 | 11,587.4 | 3772.9 | 20,454.6 |
| 130.2/12 | 111.8/3 | 121.8/1 | 28.4/1 | 364.2/2 | |
| December | 792.5 | 3112.4 | 11,601.1 | 3770.5 | 19,825.0 |
| 89.5/11 | 43.9/1 | 114.5/1 | 23.6/1 | 282.9/1 | |
Table 2.
Trends of the heat content in certain water layers (top row, (MJ/m2)/year), correlation coefficient (r, bottom row) and its confidence intervals (bottom row, in parentheses) at the p-value of 5%.
Table 2.
Trends of the heat content in certain water layers (top row, (MJ/m2)/year), correlation coefficient (r, bottom row) and its confidence intervals (bottom row, in parentheses) at the p-value of 5%.
| Month | Layer, m | ||||
|---|---|---|---|---|---|
| 45−100 | 100−300 | 300−1100 | 1100–Bottom | 45 m–Bottom | |
| January | 12.16 0.28(−0.17–0.98) | 0.00 0(−0.52–0.52) | −8.92 | −1.05 −0.23(−0.89–0.25) | 8.12 0.12(−0.37–0.69) |
| −0.61(−(3.80–0.24)) | |||||
| February | 0.82 0.10(−0.37–0.64) | −2.48 −0.18(−0.79–0.30) | −9.44 | −1.51 | −3.48 −0.06(−0.60–0.44) |
| −0.71(−(3.80–0.44)) | −0.50(−(3.80–0.07)) | ||||
| March | 9.95 0.22(−0.26–0.87) | 0.27 0.02(−0.51–0.57) | −11.74 | −1.76 | 0.72 0.01(−0.52–0.55) |
| −0.68(−(3.80–0.36)) | −0.54(−(3.80–0.11)) | ||||
| April | 10.43 0.29(−0.16–1.00) | −0.39 −0.04(−0.57–0.47) | −11.04 | −2.20 | −0.99 −0.02(−0.54–0.49) |
| −0.67(−(3.80–0.36)) | −0.68(−(3.80–0.38)) | ||||
| May | 12.4 | −0.84 −0.09(−0.64–0.41) | −11.5 | −2.38 | −2.31 −0.05(−0.58–0.46) |
| 0.43(−0.01–1.57) | −0.68(−(3.80–0.37)) | −0.68(−(3.80–0.38)) | |||
| June | 2.73 0.14(−0.33–0.70) | −1.09 −0.14(−0.72–0.35) | −10.7 | −2.38 | −14.7 −0.27(−0.99–0.20) |
| −0.64(−(3.80–0.30)) | −0.62(−(3.80–0.26)) | ||||
| July | −5.69 −0.01(−0.52–0.48) | −2.981 | −11.6 | −2.54 | −25.5 |
| −0.52(−(3.80–0.11)) | −0.69(−(3.80–0.38)) | −0.64(−(3.80–0.30)) | −0.62(−(3.80–0.25)) | ||
| August | −12.7 −0.08(−0.60–0.41) | −3.07 | −11.1 | −2.53 | −34.6 |
| −0.57(−(3.80–0.17)) | −0.67(−(3.80–0.35)) | −0.62(−(3.80–0.25)) | −0.56(−(3.80–0.16)) | ||
| September | −8.58 −0.02(−0.53–0.47) | −3.75 | −10.5 | −2.79 | −33.6 −0.41(−3.80–0.04) |
| −0.51(−(3.80–0.09)) | −0.62(−(3.80–0.25)) | −0.62(−(3.80–0.25)) | |||
| October | −11.4 −0.12(−0.66–0.36) | −2.05 −0.09(−0.65–0.40) | −11.1 | −2.97 | −28.2 −0.33(−1.15–0.13) |
| −0.59(−(3.80–0.21)) | −0.65(−(3.80–0.31)) | ||||
| November | −2.90 −0.01(−0.51–0.49) | −3.48 −0.19(−0.80–0.29) | −12.1 | −3.10 | −16.9 −0.28(−1.00–0.19) |
| −0.60(−(3.80–0.22)) | −0.66(−(3.80–0.32)) | ||||
| December | 6.65 0.31(−0.14–1.06) | 0.23 0.03(−0.48–0.56) | −13.4 | −2.67 | −3.54 −0.08(−0.62–0.42) |
| −0.70(−(3.80–0.41)) | −0.68(−(3.80–0.37)) | ||||
1 The significant values are marked in bold.
Publisher’s Note: MDPI stays neutral with regard to jurisdictional claims in published maps and institutional affiliations. |
© 2022 by the authors. Licensee MDPI, Basel, Switzerland. This article is an open access article distributed under the terms and conditions of the Creative Commons Attribution (CC BY) license (https://creativecommons.org/licenses/by/4.0/).
Share and Cite
MDPI and ACS Style
Troitskaya, E.; Budnev, N.; Shimaraev, M. Changes in the Heat Content of Water Column in the Slope Area of the Southern Basin of Lake Baikal in the 21st Century. Water 2022, 14, 348. https://doi.org/10.3390/w14030348
AMA Style
Troitskaya E, Budnev N, Shimaraev M. Changes in the Heat Content of Water Column in the Slope Area of the Southern Basin of Lake Baikal in the 21st Century. Water. 2022; 14(3):348. https://doi.org/10.3390/w14030348
Chicago/Turabian StyleTroitskaya, Elena, Nikolay Budnev, and Mikhail Shimaraev. 2022. "Changes in the Heat Content of Water Column in the Slope Area of the Southern Basin of Lake Baikal in the 21st Century" Water 14, no. 3: 348. https://doi.org/10.3390/w14030348
Note that from the first issue of 2016, this journal uses article numbers instead of page numbers. See further details here.