Article

A New Optical Method for Quantitative Detection of Microplastics in Water Based on Real-Time Fluorescence Analysis

1
Department of Experimental Medicine, University of Rome Tor Vergata, Via Montpelllier 1, 00133 Rome, Italy
2
Department of Industrial Engineering, University of Rome Tor Vergata, Via del Politecnico 1, 00133 Rome, Italy
3
Department of Civil Engineering and Computer Science Engineering, University of Rome Tor Vergata, Via del Politecnico 1, 00133 Rome, Italy
4
Department of Physics, Sapienza University of Rome, P.le A. Moro 5, 00185 Rome, Italy
*
Authors to whom correspondence should be addressed.
Water 2022, 14(20), 3235; https://doi.org/10.3390/w14203235
Submission received: 19 August 2022 / Revised: 29 September 2022 / Accepted: 11 October 2022 / Published: 14 October 2022

Abstract

:
Microplastics (MPs) have recently emerged as a new major and ubiquitous environmental pollutant with still undefined, yet potentially high risks for human health and ecosystems. This has prompted growing public concern along with an increasing number of scientific studies. In particular, recent research has highlighted the need for a standardized methodology to monitor microplastics in different media, particularly in water. This study reports on the use of a new particle counter for the quantitative detection of MPs in water samples based on real-time analysis of fluorescence emissions. The instrument was calibrated using two types of plastic particles, i.e., polyvinyl chloride and high-density polyethylene, selected as examples of high- and low-density plastics, respectively. Specific solvents were used to match the different plastic densities. Measurements were also carried out on particles obtained from wastewater samples collected at the inlet and outlet of specific units of a municipal wastewater treatment plant after sieving, filtering, digestion with hydrogen peroxide to remove degradable organic matter and resuspension in the solvents employed during the calibration step. A Fourier transform infrared spectroscopy analysis performed on the same wastewater samples confirmed the presence of MPs, and, in particular, of polyethylene, in some of the samples in which the highest concentrations were measured applying the proposed method. Therefore, the novel particle counter described in this paper could represent a promising method to quantitatively measure MP concentrations in water samples.

1. Introduction

The United Nations Environment Assembly’s 5/14 Resolution of March 2022 clearly stated that high and rapidly increasing levels of plastic pollution represent a serious environmental problem at a global scale, negatively impacting the environmental, social and economic dimensions of sustainable development [1]. The adoption of this resolution, entitled “End plastic pollution: towards an international legally binding instrument”, has been considered the most important international multilateral environmental deal since the Paris climate agreement; it aims at putting an end to plastic pollution by forging an international, legally binding accord by 2024 [2].
In fact, in the recent decades, the issue of widespread plastic contamination has become of increasing concern for both the scientific community and the general public. Global plastic production has been steadily increasing, exceeding 400 million tons in 2020, and is estimated to increase to over 1000 million tons in 2050 [3]. Due to its high stability and low biodegradability, it has been estimated that around 9200 million tons of plastics have accumulated on our planet from the 1950s to 2017, 58% of which have been disposed of, mostly through open dumping, in the environment [3,4].
Plastic pollution, especially in the marine environment, has been recognized as the cause of many deaths of seabirds, mammals and fish due to entrapment or ingestion, but also as the cause of the creation of plastic islands. Furthermore, plastic particles of small dimensions, which have been found to be almost ubiquitous, are of particular concern for both human health and the environment. The term microplastics (MPs) was introduced in 2004 by Professor Richard Thompson, a marine biologist at the University of Plymouth in the United Kingdom [5]. In 2009, the National Oceanic and Atmospheric Administration, NOAA, defined an upper size limit: “Pieces of plastic particles smaller than 5 mm” [6]. A more recent definition also provides a lower size limit: “any synthetic solid particle or polymeric matrix, with regular or irregular shape and with size ranging from 1 μm to 5 mm” [7]. In recent years, growing concern has been raised regarding the presence of microplastics in the marine ecosystem. These small plastic debris can derive from the degradation of large plastic waste, but also directly from primary sources, such as pellets, personal care products, cosmetics, textile washing, city dust and fishing.
Given the considerable difficulty in identifying their composition, distribution and quantity, the concentrations reported for MPs in different media have shown a high range of variability due to inconsistent data quality and methodological issues. Investigations have been performed to collect and analyze MPs from air [8,9,10], fresh water [11,12,13], sea water [14,15,16,17,18], soil [19,20,21], waste water [22,23,24,25] and sediment [26,27,28,29]. The results have shown that MPs can be found throughout the majority of marine biotas [30], such as plankton [31], fish [32], mussels [33], oysters [34], seahorses [35], sea turtles [36], dolphins [37], whales [38] and seabirds [39]. Even dietary exposure of MPs is increasingly recognized; salts [40,41], sugar [42], vinegar [43], milk [44], bottled water [45], seafood [17], beer [40], honey [46], beverages [47], packaged meat [48] and other commercial food products have been found to contain MPs. As a summary of the papers mentioned above, the polymers most frequently found are polyethylene (PE), polypropylene (PP), polystyrene (PS), polyvinyl chloride (PVC), polyethylene terephthalate (PET) and nylon (PA). The accumulation of MPs in the human body through the food chain could therefore be a serious risk. In 2019, Schawbl et al. [49] found MPs in human stool samples, and in 2021, Ragusa et al. [50] detected plastic fragments of less than 10 µm in size in human placenta samples collected from six patients with uneventful pregnancies. An in vitro toxicological study of human foreskin cells with polystyrene nanoparticles (PNPs) defined the genotoxic effect of polystyrene on DNA damage [51]. It has been also proven that micro-sized polystyrene exposure can affect learning and memory functions through inducing oxidative stress and decreasing the levels of acetylcholine in mice [52].
Wastewater is believed to be a predominant source of MPs [25,53], since many types of MPs transit through wastewater treatment plants (WWTPs), being discharged directly in domestic or industrial wastewater, or in urban and road runoff that is often treated in WWTPs. Studies have shown that in current WWTPs, MPs are mostly removed from wastewater during treatment. For example, it was shown that in Swedish and Finnish plants presenting chemical and biological treatment units, as well as mechanical treatments, 99% of MPs could be removed from the effluent [54]. Other studies have shown that the implementation of tertiary treatment processes, based on filtration, reverse osmosis or membrane biofiltration, prove very effective in removing MPs from treated water [55,56]. Therefore, in these plants, MPs are mostly concentrated in primary and secondary sludge [54]. While the former are generally landfilled, more than half of the production of sludge from civil wastewater treatment plants is currently employed in agriculture as a soil amendment [57]. This raises concerns over the possible accumulation of MPs in soil and their entry into the food chain. Therefore, it is of paramount importance to have reliable methodologies that can identify and quantify MPs in water and other media, not only to evaluate MP sources, but also to assess the efficacy of management processes and their contents in treatment by-products. Researchers are working to develop a standardized methodology for MP identification and quantification in environmental media [58,59].
The shape, color, size, chemical composition and quantity of MPs can be studied by applying several different detection methods. Microscopy techniques (i.e., dissect, fluorescence, scanning electron and atomic force microscopy) [60] are some of the most used identification methods; other approaches include Fourier transforms infrared spectroscopy (FTIR), Raman spectroscopy and thermal analysis [4,60,61]. These techniques enable sensitive, extensive and reliable analyses, broadening the field of MP detection. Moreover, combinations of different techniques can be implemented in order to reduce the respective limitations of each method and to minimize false positive or negative results. On the other hand, such well-established laboratory methods require sophisticated, generally large and expensive instrumentation which need time-consuming preparation procedures and human intervention by highly skilled staff. Manual particle counts are a typical example of human-based MP quantification through visible microscopy. This is certainly not suitable for fast and diffuse onsite monitoring, especially in outdoor locations. For this reason, alternative strategies for simpler, cheaper and more portable, sensor-based detection with digital read-outs are in high demand. Among the detection methods, optical sensors can easily provide quantitative results on the presence of MPs in samples through analyses of different optical signals, such as fluorescence, scattering or reflection. The particle size, morphology and chemical composition of MPs can also be determined. A few papers have mentioned the use of optical sensors for MP detection. Patterson et al. [62] implemented the “MantaRay” marine system that contains an optical sensor to analyze the flow-through microplastics concentration in a specific sea location, as determined by onboard GPS. Asamoah et al. [63] used an optical sensor for the nonplanar detection of transparent polyethylene terephthalate (PET) and translucent low density polyethylene (LDPE) in freshwater. A Korean team [64] developed a real time monitoring system to detect standard, stained microplastics using fluorescence analysis. However, the authors used a pulsed laser, which is too expensive, bulky and heavy for portable, low-cost monitoring. In addition, in that study, commercial particles were added to laboratory-controlled deionized (DI) water while MPs coming from real water samples were not analyzed.
We believe that further steps are necessary to achieve fast and diffuse onsite monitoring. In particular, in this study, we wanted to provide a proof of concept of a methodology that can measure concentrations of MP particles in water samples. Specifically, we used an opto-mechanical detection system for the quantitative determination of MP concentrations in liquid samples through the analysis of fluorescence emission of fluorophore-stained particles. In order to obtain fluorescence pulsed signals under continuous-wave excitation, roto-translational motion is applied to the sample. This simple method can provide sensitive and quantitative detections of Nile Red-stained MPs suspended in liquid samples. We derived this method from recent studies that were carried out by some members of our group to investigate bacterial concentrations in biological samples [65,66,67]. Here, we report the results obtained for both laboratory-created test suspensions containing MPs of known composition and dimension, and also for particles obtained from wastewater samples collected from different units of a WWTP plant, in order to provide a preliminary assessment on the applicability of employing this new portable prototype for rapid analyses of MPs from multiple types of water samples. In order to reduce the possible interference of other organic matter present in real wastewater samples, such as biofilm and cellulose, pre-treatment processes based on digestion with hydrogen peroxide were applied prior to particle resuspension for fluorescence analyses.

2. Materials and Methods

2.1. Chemicals

Analytical reagent (AR) grade calcium chloride (CaCl2) and ethanol were purchased from Merck Sigma Aldrich (Merck Life Science S.r.l., Milano, Italy) and used as received without any purification. For instrument calibration, polyvinyl chloride (PVC) microparticles with an average grain size of 250 µm and high-density polyethylene (HDPE) microparticles with an average grain size of 150 were used as received (GoodFellow, Huntingdon, UK). Nile Red (Enzo life Science, New York, USA, ENZ-52551) was used as a hydrophobic fluorescent probe, with an excitation wavelength of 552 nm and an emission wavelength of 636 nm for microparticle staining. A 30% H2O2 stabilized solution, reagent grade (Merck Life Science S.r.l., Milano, Italy), was employed to pre-treat the WWTP samples in order to oxidize biodegradable matter. All solutions and suspensions were prepared with Milli-Q water (resistivity 18.2 MΩ cm).

2.2. Experimental Setup

Figure 1 displays a schematic of the portable instrument used for the tests, which was designed and manufactured by ASI srl (Milan, Italy). The instrument is primarily made up of a fluorescence confocal microscope specifically developed to detect labelled plastic microparticles in liquid samples. The liquid sample is held in a cylindrical cuvette with a diameter of 1 cm and a height of 7 cm. Excitation light is generated by a 532 nm diode laser (Apinex, Montreal, QU, Canada, AGLM2-05) with an optical power of 3 mW and is focused by a lens (f = 4.03 mm) into the cuvette at about 200 μm from the entrance wall. The laser spot defines both the excitation and observation volume, as described below. Two motors simultaneously make the cuvette spin around its axis (at about 4 rev/s) and oscillate vertically (about 2.5 cm/s) relative to the laser spot. This allows the excitation spot to scan a significant portion of the cuvette volume. Slower vertical scanning is applied to ensure statistical independence of the observation volume explored in subsequent vertical sweeps. It should be specified that the acceleration of this motion is not high enough to move the particles relative to their initial positions in the sample due to inertial forces as happens during centrifugation. In other words, the situation is virtually identical to that of a laser beam moving through and scanning a fixed sample. The plastic microparticles crossing the observation volume emit fluorescence pulses that are collected by the same lens that provides the excitation and sent to a photodetector (PMT Hamamatsu H10721-110) through a dichroic mirror in a confocal microscope configuration. The combination of a confocal microscope and sample motion provides an effective way to transport the fluid sample through the observation area without requiring a flowing system. The confocal configuration used in the present setup, with a pinhole as spatial filter on the optical detector and a focused excitation beam, ensures that only the fluorescence pulses coming from particles in a certain volume of the sample, illuminated by the laser, are detected. This volume is estimated to be 0.5 × 10⁻⁵ mL, which is small enough, at the particle number concentrations investigated here, to reduce to a negligible value the probability of detecting more than one particle at the same time. This was confirmed by the inspection of several recorded data files where pulses showing overlapping were not found.
The photodetector transforms the fluorescence pulses into time-depending electrical signals which are digitally converted with a 40 kHz sample rate and transmitted to a PC for subsequent software processing.
The processor uses a specific pattern recognition algorithm to analyze the signal and discriminates which variations, out of the noise fluctuations, can be attributed to the particles in the sample. In particular, the algorithm matches specific features of the temporal profile to predetermined patterns, within a certain adjustable range of variation, that correspond to the fluorescence pulses coming from the particles excited by the laser spot. The concentration of particles is evaluated by calculating the number of predetermined patterns matched to the features in the temporal profile for a given scanning period.

2.3. Instrument Calibration

Instrument calibration was carried out by using the PVC and HDPE microparticles described in Section 2.1. To avoid precipitation, the microparticles were dispersed in different solvents to match the respective plastic density values. Specifically, a CaCl2 water solution with a density of ρ = 1.52   g / mL and a 1:1 water/ethanol mixture were used to create the PVC and HDPE suspensions, respectively. The particle number density in the suspension, n/mL, was estimated by measuring the mass concentration and assuming spherical particles of known density and diameter, as declared by the manufacturer (namely 150 μm and 250 μm for the PVC and HDPE, respectively). Starting from a mass concentration of 1.33 mg/mL for both PVC and HDPE suspensions, a two-fold serial dilution was made down to a concentration of 0.04 mg/mL. Each sample was measured in triplicate, and the average values of the counts registered were plotted as a function of the particle number density (n/mL). Linear regression was applied to both graphs in order to obtain the calibration curves for both solvents.

2.4. Particle Staining

Microplastic labeling was achieved by adding the fluorescent probe (Nile Red, Enzo life Science, New York, NY, USA, ENZ-52551) to the sample at a final concentration of 0.07 μg/mL. This concentration was determined experimentally to maximize the signal–noise ratio.

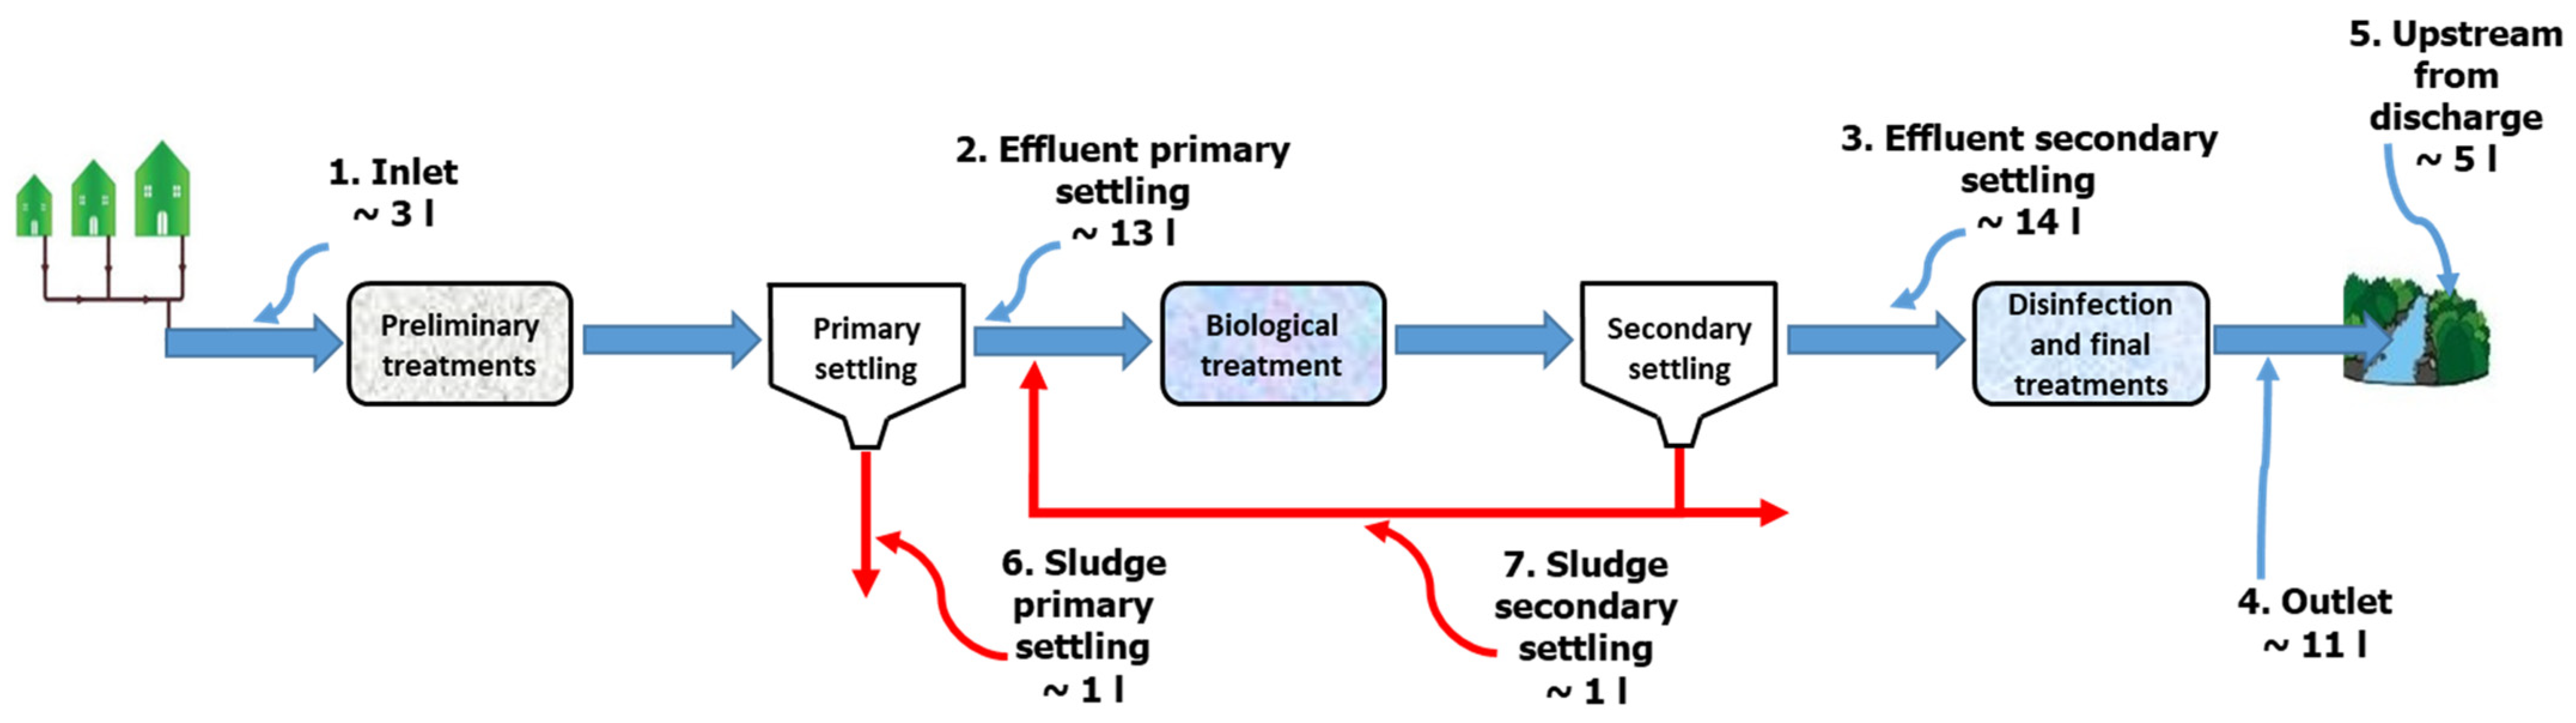
2.5. Sampling and Pre-Treatment of Real Samples from a WWTP

In this preliminary study, we sought to test the possibility of detecting particles obtained from real samples using the calibration curves derived from MP particles of known size and composition. For this reason, the real samples were first filtered, and the material deposited on the filter was resuspended in different types of solvents. In this case, CaCl2 and ethanol solutions were used since they match the density of PVC and HDPE, respectively, which were employed for the calibration.
Water and wastewater samples were collected from a WWTP that is authorized to treat 4.1 m3/s of urban wastewater, serving a population of 780,000 inhabitants, and that during rain events can also receive a maximum flow rate equal to three times the average wastewater flow. The water treatment line includes coarse particle removal through mechanical screening, sand removal through settling, primary settling, biological activated sludge treatment with nitrification followed by secondary settling and chemical disinfection. The effluent is then discharged into a major river (average flow rate of 80–150 m3/s) near the plant. The primary and secondary sludge is sent to a separate treatment line that includes pre-thickening, stabilization, chemical conditioning and dehydration. Sampling was performed on the same day as testing. Figure 2 reports the types and volumes of each collected sample. Seven samples were taken, i.e., four of the wastewater before and after specific treatments, one of the river upstream of the discharge of the treated WWTP effluent and two of sludge samples, directly at the outlet of the primary and secondary settling tanks. It should be noted that the objective of this study was not to carry out a full characterization and mass balance of the MP particles in the different units of the WWTP, as this would have required the sampling of larger volumes of samples at different times during the year; rather, we sought only to test the prototype analyzer with real wastewater and sludge-derived liquid samples. The selection of the volumes of samples to collect was related to the expected MP concentrations; lower volumes were collected for samples that were expected to contain a higher concentration of MPs, i.e., the inlet wastewater and the two sludge samples.
Prior to MP analysis, the samples were pre-treated by manual screening with ASTM sieves to remove the coarser particles (above 250 μm). Then, the sieved suspensions were digested with H2O2 to remove degradable organic matter, filtered and concentrated by centrifugation. The obtained pellets were re-suspended in the same types of solutions employed for the calibration experiments. The pre-treatment method was chosen on the basis of an analysis of the methods employed in previous studies, in particular [54,68,69], and also on preliminary lab testing of the different methodologies.
Specifically, for the testing of the prototype with real water/wastewater samples, it was decided to analyze only the suspensions of particles presenting a size below 250 μm in order to better match the sizes of the PVC and HDPE particles employed for the calibration of the instrument. The water or wastewater samples were sieved to recover particles in a size range between 250 μm and 6 mm (large microplastics). Note that for both the final effluent and river sample, no particles were collected during the sieving process, i.e., no particles above 250 μm were retrieved. For the other three samples (inlet and outlet of the primary and secondary settling tanks), a few particles above 250 μm were collected (see Figures S1–S3 of the Supporting Information Section). These were digested with a H2O2 solution in order to remove biodegradable matter, dried and analyzed by FTIR. The results of these analyses are not reported in this paper, which is focused on the testing of the fluorescence-based analysis prototype.
The volume of the sieved sample was then treated if necessary, as described below, by adding selected amounts of a 30% H2O2 solution and stirring magnetically at ambient temperature for 48–72 h. The suspension was then filtered with fiber glass filters with 1.2 μm pores, and the obtained pellets were re-suspended in a CaCl2 solution or a 1:1 ethanol:water solution, using the same procedure as that employed for the PVC and HDPE lab tests. After the pre-treatment, for each water/wastewater sample, particles within the 1.2 to 250 μm particle size range were collected.
Since the various samples selected present different characteristics, the pre-treatment procedure was tailored for each sample. In particular, for the inlet sample, around 8% by vol. of the H2O2 solution was added, while for the effluent of the primary settling tank, 5% by vol. of the solution was added. For the final effluent, no H2O2 addition was necessary, while for the sample taken from the effluent of the secondary settling tank and from the river, a small addition of the H2O2 solution was used (10 mL in over 5 l of sample), notably to treat the particles deposited on the bottom of the tank.
The sludge samples were treated similarly to the other samples, although they were first digested by slowly adding aliquots of the 30% H2O2 solution, adding around 30% by vol. of this solution, in order to make the suspension easier to sieve. Also in this case, the suspension was stirred magnetically at ambient temperature for 48–72 h. It was then sieved to recover particles in a size range between 38 μm and 6 mm, since suspensions presenting particles with size above 38 μm could not be directly filtered. The volume of the sieved suspension was treated by adding around 8% by vol. of a 30% H2O2 solution at ambient temperature overnight. The suspension was then filtered with fiber glass filters with 1.2 μm pores, and the obtained pellets were dried overnight at 105 °C and re-suspended in the CaCl2 or ethanol–water solutions. Similar to the wastewater samples, for the sludge samples, we report in this paper only the results of the analysis carried out on the particles obtained after the filtration of the suspensions.

2.6. FTIR Analysis

For the infrared measurements, drops of 1 μL were withdrawn from the vials containing the resuspensions of the pellets obtained after filtration of the different types of WWTP samples. These drops were dried on a polished CaF2 substrate to obtain thin films of the samples. The infrared radiation transmitted by the film and the substrate was collected with an infrared microscope (Hyperion2000, Bruker, Milano, Italy) equipped with a single point nitrogen cooled MCT detector. The transmission spectra of the bare CaF2 substrate were then collected and used as references. Data were acquired by coadding 256 interferograms with a spectral resolution of 2 cm−1; since the light spot of the microscope was about 200 μm in size (NA = 0.3), we averaged several spectra collected at different positions of the film to account for inhomogeneities and particle thickness. The measurements were repeated at least three times for each film. The absorbance spectra were obtained according to common a procedure:
A ω = l o g 1 T ω
where T ω is the average transmission of the wastewater films. The spectra were further baselined through rubberband subtraction using the algorithm of the OPUS software (Bruker).

3. Results and Discussion

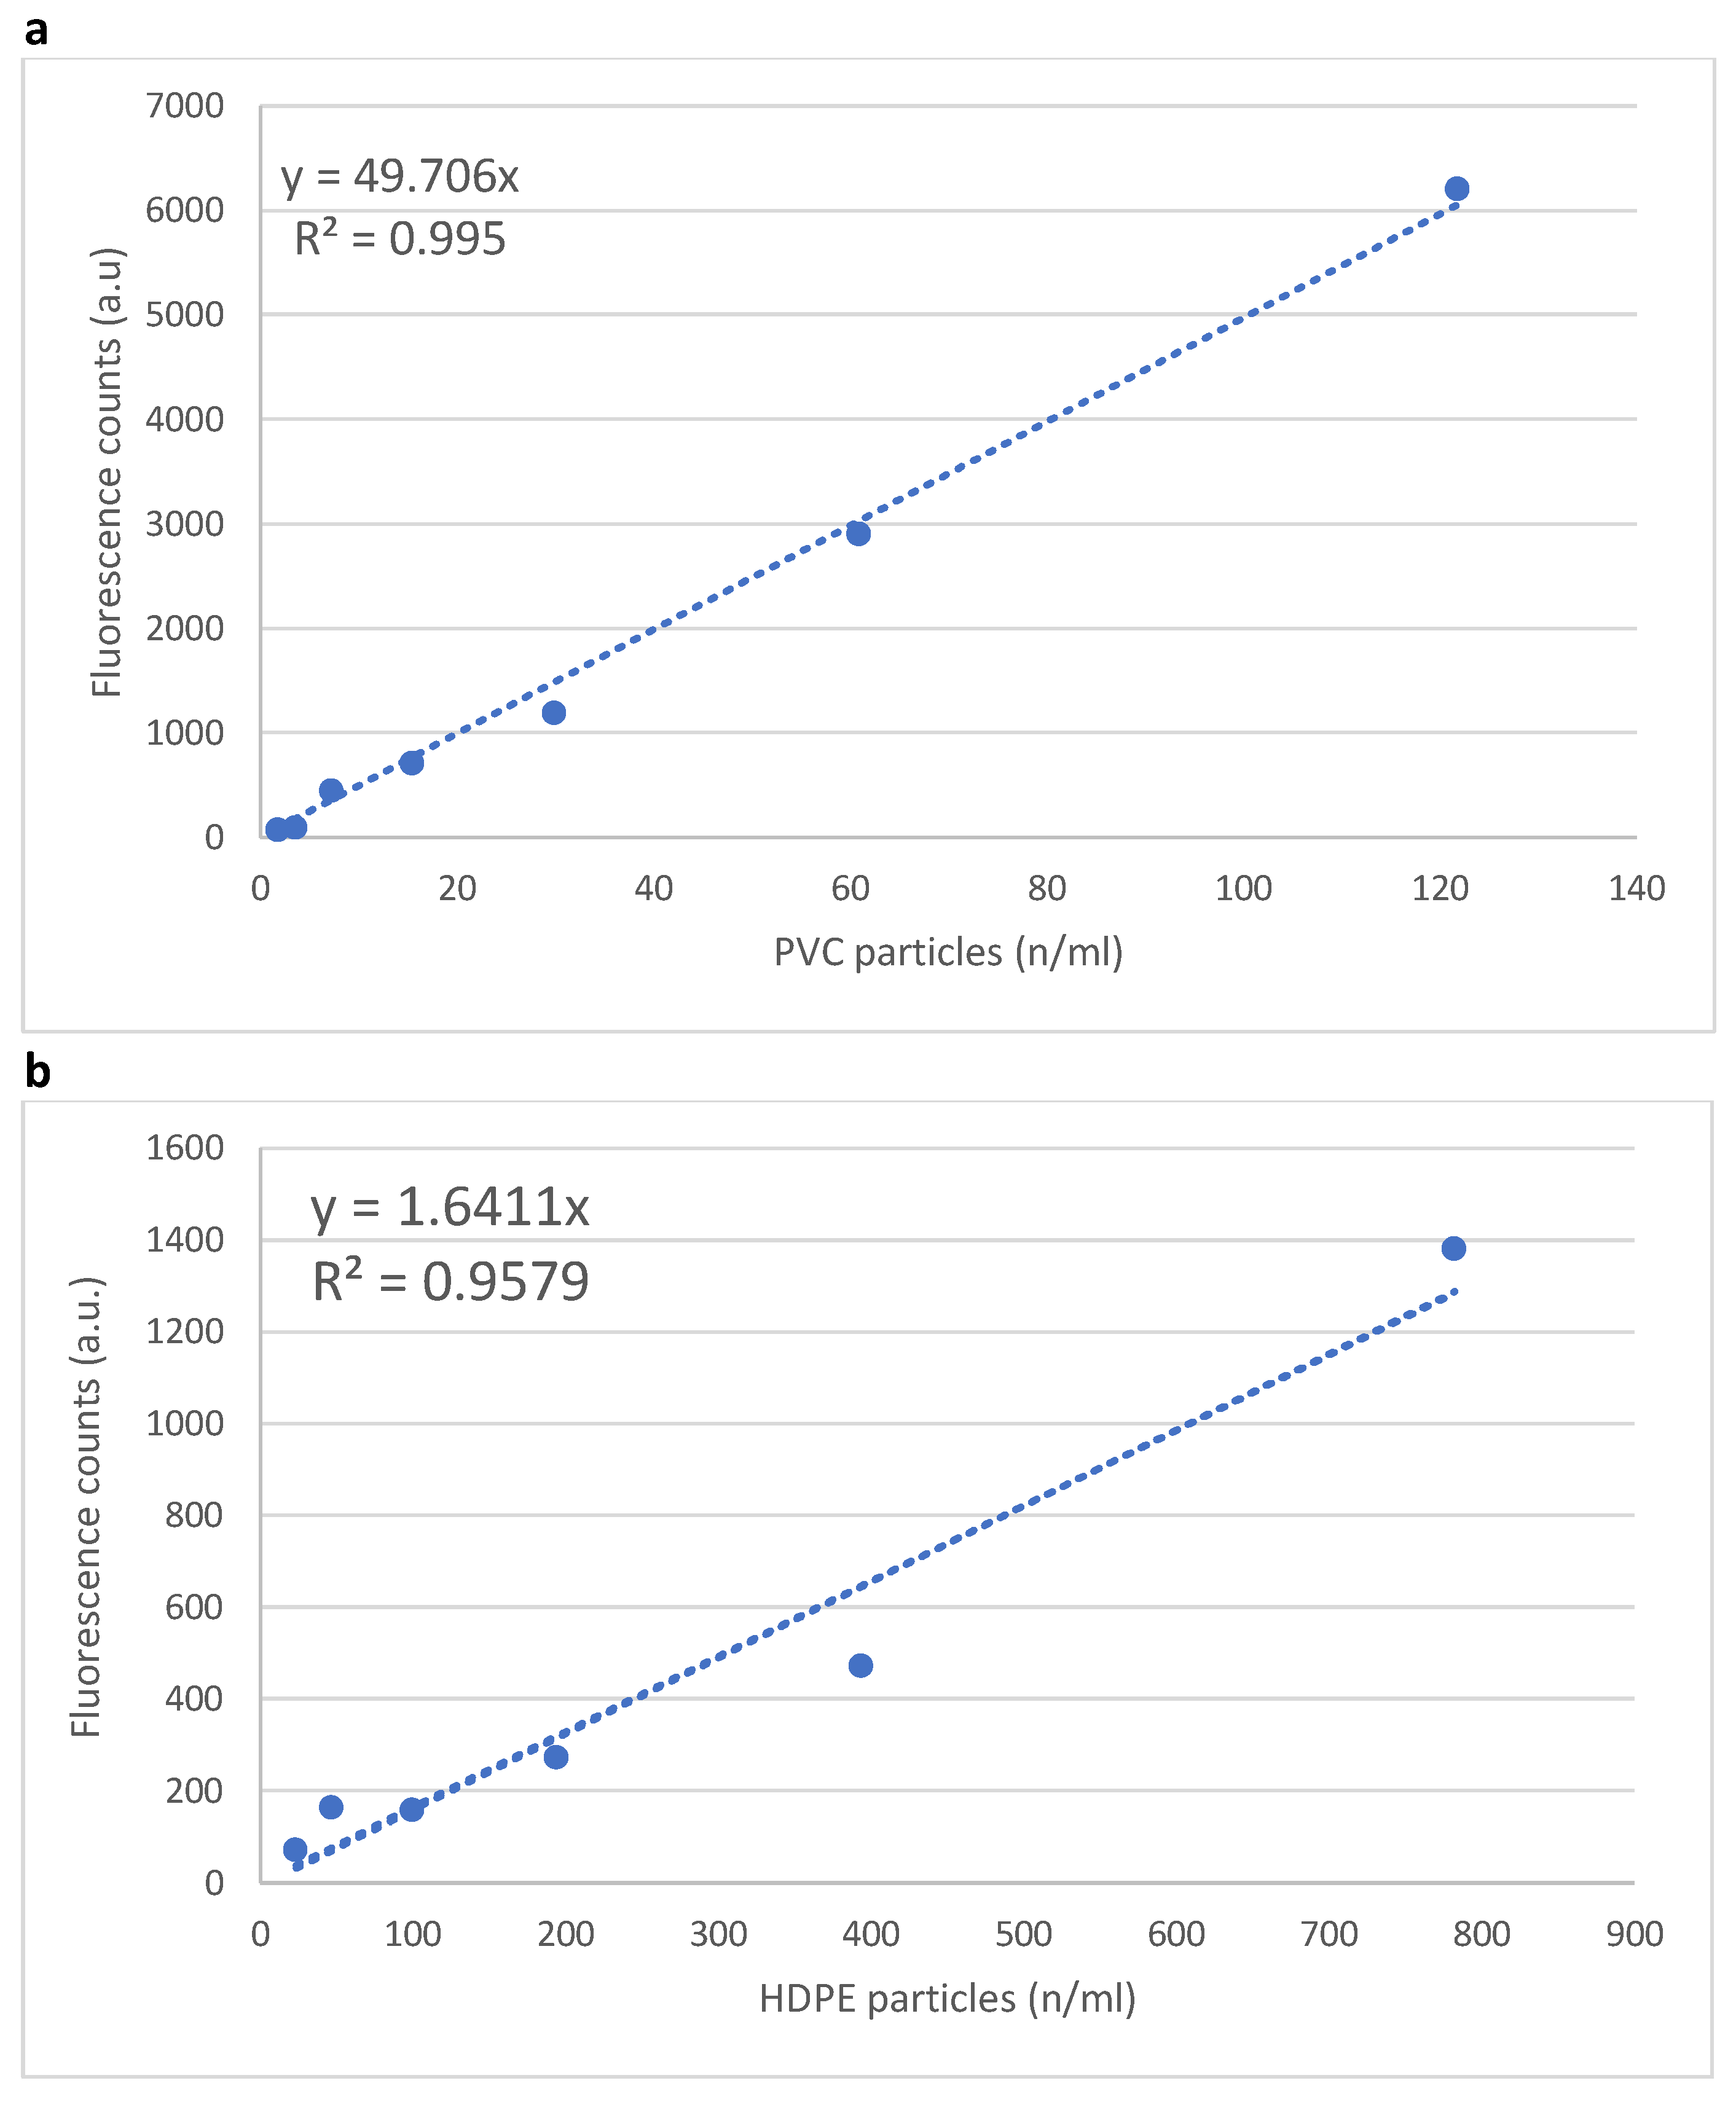
3.1. Instrument Calibration

Figure 3 shows the typical time-dependent electrical signal corresponding to the fluorescence emission of stained particles. Light pulses of different heights can easily be observed; these were attributed to particles crossing different sections of the laser spot.
Figure 4 shows the fluorescence counts recorded for each dilution of the test samples as a function of the particle number density n/mL. The linear fit of the data allowed us to obtain a calibration curve with which to derive the particle concentrations in real water samples.

3.2. Measurements on Wastewater Samples

Figure 5 displays the MP particle number densities estimated for the real samples collected at the inlet or outlet of specific units of the WWTP, on the basis of the fluorescence measurements performed with the test samples. In particular, for the results of the measurements performed with the pellets resuspended in the CaCl2 solution (see Figure 5a), the PVC calibration curve (Figure 4a) was used, while for those obtained by resuspending the pellets in the water/ethanol mixture (see Figure 5b), the HDPE calibration curve (Figure 4b) was adopted. As can be noted, the particle number density found for PVC-like particles was very low for all of the tested samples except for the inlet sample. In contrast, for the HDPE samples, considerably higher number densities and more significant differences were found among the types of samples analyzed. For both types of plastics, a general decrease of the concentration through the plant was observed, with the lowest values being retrieved for the samples from the final outlet of the plant and from the river. This is in good agreement with recent studies [23,24,55]. The fact that the inlet showed a lower content of particles compared to the outlet of the primary settling tank could be related to the low volume of sample analyzed and to the fact that it presented a heterogeneous composition. On the other hand, the lower concentration found for PVC could be due to the fact that the exposition of PVC particles to different physical, biological and/or chemical conditions can change the original polymer composition, especially at the surface [70]. Most studies have reported PVC in low or negligible amounts in both WWTP inlet and outlet samples, compared to other polymers [71].
In the case of HDPE, particle concentrations were significantly higher in sludge samples (data 6 and 7) compared to water samples; note that the densities reported here should be multiplied by 10. Sludge has been reported to contain more than 98% of the plastic particles entering the plant [72,73].
For each sampling point, two identical samples were prepared to be analyzed both with the present instrument and by Fourier Transform Infrared spectroscopy (FTIR). FTIR is used as the gold standard for plastic detection. Thin films of wastewater were obtained on a CaF2 substrate, which is transparent in the 800–6000 cm−1 range [74]. The spectra obtained for dried particles collected from selected samples are reported in Figure 6, specifically: Sludge from secondary settling (magenta line), Effluent from primary settling (violet line), Effluent from secondary settling (blue line) and Inlet (green line). The vertical lines indicate the most important contributions at 1000–1150 cm−1 (CO stretching), 1458 cm−1 (C-H bending), 1760 cm−1 (C=O stretching) 2160 cm−1 (nitrogen compounds vibrations) and 2850–3000 cm−1 (CH stretching). The most intense band observed at 1620–1680 cm−1 was due to residual water. A comparison of our spectra with those provided in databases suggests that these spectra are consistent with the presence of polyethylene, since the CH bond frequencies (either stretching or scissoring modes) fit those reported in the literature [75]. In addition, the spectra showed a scissoring vibration band at 1455 cm−1, a frequency which is typical of the polypropylene molecule, a polymer which has a density close to that of HDPE. The spectral regions of CH vibrations are highlighted in Figure 6b,c. The spectral features of the CH stretching and bending modes of the particles collected from the Effluent from primary settling (violet), Effluent from secondary settling (blue) and Inlet (green) samples are quite similar, while those of the Sludge from secondary settling (magenta) sample differed both in the central frequency (CH bond stretching) and in intensity. We also noted that the spectrum of the particles collected from the Sludge from secondary settling (magenta line) sample varied at frequencies where absorption from thiols (small band at about 2600 cm−1) and from compounds containing sulphur (1200–1400 cm−1) were observed (see Figure 6a). Moreover, this sample showed frequency-shifted CH bands and an overall different spectrum. Therefore, we suggest that the absorption of CH modes was mainly due to the presence of alkenes and aldehyde, and thus, to molecules of lower molecular weight than polymers. This evidence, together with the detection of sulphur compounds, leads us to consider the presence of an appreciable amount of organic material [76], confirming that this sludge sample, even after pre-treatment, still presented a significant content of biomass (bio-sediment).

4. Conclusions

In summary, we presented a new particle counter for the quantitative detection of microplastics in water samples based on real-time analysis of fluorescence emissions from stained particles. The instrument was calibrated with laboratory-prepared test samples and then applied to particles obtained from real samples collected at the inlet and outlet of specific units of a municipal wastewater treatment plant after the samples had been pre-treated with oxidizing agents, filtration and resuspension in the same solutions employed for the instrument’s calibration. The results were compared with FTIR measurements that confirmed the presence of polyethylene and a negligible content of PVC in the same WWTP samples. These preliminary findings indicate that the new particle counter could serve as a useful tool for detecting microplastics in liquid media. The small size of the instrument (length 25 cm, depth 19 cm, height 12 cm) also makes it suitable for in situ measurements. The instrument could represent a valid method to quantitatively measure the concentration of plastics with a potential reduction in time, workload and costs.
Moreover, these preliminary analyses, carried out on real wastewater samples, highlighted the presence of organic matter, especially in the particles collected from the sludge samples, even after pre-treatment with hydrogen peroxide; therefore, it is fundamental to improve the pre-treatment strategies to effectively remove all substances that may create interference.
Future investigations will hence be aimed both at this aspect and at testing different types of plastic particles to obtain other specific calibration curves. Moreover, as the final goal of our project is to develop a quantitative detection method that can be applied in-situ, a simpler sample pre-treatment method that does not require filtration and resuspension will be investigated.

Supplementary Materials

The following supporting information can be downloaded at: https://www.mdpi.com/article/10.3390/w14203235/s1, Figure S1. Coarse particles (0.25–6 mm) collected from the inlet of the WWTP after H2O2 digestion. Figure S2. Coarse particles (0.25–4.6 mm) collected at the outlet of the primary settling tank of the WWTP after H2O2 digestion. Figure S3. Coarse particles (0.25–1.18 mm) collected at the outlet of the secondary settling tank of the WWTP after H2O2 digestion.

Author Contributions

Conceptualization, E.N., R.P. and G.C.; Methodology, E.N. and G.C.; Investigation, E.N., Y.L., S.F., A.N. and G.C.; Data curation E.N. and R.P., Writing, E.N., G.C. and R.P., Supervision, E.N. and R.P. All authors have read and agreed to the published version of the manuscript.

Funding

This research received no external funding.

Conflicts of Interest

The authors declare no conflict of interest.

References

  1. UNEP (United Nations Environment Programme). UNEA Resolution 5/14 Entitled “End Plastic Pollution: Towards an International Legally Binding Instrument”; United Nations: New York, NY, USA, 2022; pp. 1–5. [Google Scholar]
  2. UNEP (United Nations Environment Programme). What You Need to Know about the Plastic Pollution Resolution. Available online: https://www.unep.org/news-and-stories/story/what-you-need-know-about-plastic-pollution-resolution (accessed on 8 August 2022).
  3. UNEP (United Nations Environment Programme). From Pollution to Solution: A Global Assessment of Marine Litter and Plastic Pollution; United Nations: New York, NY, USA, 2021; Volume 237, ISBN 9789280738810. [Google Scholar]
  4. Mariano, S.; Tacconi, S.; Fidaleo, M.; Rossi, M.; Dini, L. Micro and Nanoplastics Identification: Classic Methods and Innovative Detection Techniques. Front. Toxicol. 2021, 3, 636640. [Google Scholar] [CrossRef] [PubMed]
  5. Thompson, R.C.; Olsen, Y.; Mitchell, R.P.; Davis, A.; Rowland, S.J.; John, A.W.G.; McGonigle, D.; Russell, A.E. Lost at Sea: Where Is All the Plastic? Science 2004, 304, 838. [Google Scholar] [CrossRef]
  6. Arthur, C.; Baker, J.; Bamford, H. Proceedings of the International Research Workshop on the Occurrence, Effects, and Fate of Microplastic Marine Debris, Tacoma, WA, USA, 9–11 September 2008; NOAA Technical Memorandum NOS-OR&R-30; NOAA: Washington, DC, USA, 2009; p. 530.
  7. Frias, J.P.G.L.; Nash, R. Microplastics: Finding a consensus on the definition. Mar. Pollut. Bull. 2019, 138, 145–147. [Google Scholar] [CrossRef]
  8. Shao, L.; Li, Y.; Jones, T.; Santosh, M.; Liu, P.; Zhang, M.; Xu, L.; Li, W.; Lu, J.; Yang, C.-X.; et al. Airborne Microplastics: A Review of Current Perspectives and Environmental Implications. J. Clean. Prod. 2022, 347, 959–6526. [Google Scholar] [CrossRef]
  9. Habibi, N.; Uddin, S.; Fowler, S.W.; Behbehani, M. Microplastics in the Atmosphere: A Review. J. Environ. Expo. Assess. 2022, 1, 6. [Google Scholar] [CrossRef]
  10. Uddin, S.; Fowler, S.W.; Habibi, N.; Sajid, S.; Dupont, S.; Behbehani, M. A Preliminary Assessment of Size-Fractionated Microplastics in Indoor Aerosol—Kuwait’s Baseline. Toxics 2022, 10, 71. [Google Scholar] [CrossRef] [PubMed]
  11. Li, J.; Liu, H.; Paul Chen, J. Microplastics in Freshwater Systems: A Review on Occurrence, Environmental Effects, and Methods for Microplastics Detection. Water Res. 2018, 137, 362–374. [Google Scholar] [CrossRef] [PubMed]
  12. Li, C.; Busquets, R.; Campos, L.C. Assessment of Microplastics in Freshwater Systems: A Review. Sci. Total Environ. 2020, 707, 135578. [Google Scholar] [CrossRef] [PubMed]
  13. Wagner, M.; Scherer, C.; Alvarez-Muñoz, D.; Brennholt, N.; Bourrain, X.; Buchinger, S.; Fries, E.; Grosbois, C.; Klasmeier, J.; Marti, T.; et al. Microplastics in Freshwater Ecosystems: What We Know and What We Need to Know. Environ. Sci. Eur. 2014, 26, 12. [Google Scholar] [CrossRef] [PubMed] [Green Version]
  14. Hidalgo-Ruz, V.; Gutow, L.; Thompson, R.C.; Thiel, M. Microplastics in the Marine Environment: A Review of the Methods Used for Identification and Quantification. Environ. Sci. Technol. 2012, 46, 3060–3075. [Google Scholar] [CrossRef]
  15. Khalid, N.; Aqeel, M.; Noman, A.; Hashem, M.; Mostafa, Y.S.; Alhaithloul, H.A.S.; Alghanem, S.M. Linking Effects of Microplastics to Ecological Impacts in Marine Environments. Chemosphere 2021, 264, 128541. [Google Scholar] [CrossRef]
  16. Issac, M.N.; Kandasubramanian, B. Effect of Microplastics in Water and Aquatic Systems. Environ. Sci. Pollut. Res. 2021, 28, 19544–19562. [Google Scholar] [CrossRef] [PubMed]
  17. Barboza, L.G.A.; Dick Vethaak, A.; Lavorante, B.R.B.O.; Lundebye, A.-K.; Guilhermino, L. Marine Microplastic Debris: An Emerging Issue for Food Security, Food Safety and Human Health. Mar. Pollut. Bull. 2018, 133, 336–348. [Google Scholar] [CrossRef]
  18. Cutroneo, L.; Reboa, A.; Besio, G.; Borgogno, F.; Canesi, L.; Canuto, S.; Dara, M.; Enrile, F.; Forioso, I.; Greco, G.; et al. Microplastics in Seawater: Sampling Strategies, Laboratory Methodologies, and Identification Techniques Applied to Port Environment. Environ. Sci. Pollut. Res. 2020, 27, 8938–8952. [Google Scholar] [CrossRef]
  19. Li, Y.; Yao, J.; Nie, P.; Feng, X.; Liu, J. An Effective Method for the Rapid Detection of Microplastics in Soil. Chemosphere 2021, 276, 128696. [Google Scholar] [CrossRef] [PubMed]
  20. Grause, G.; Kuniyasu, Y.; Chien, M.F.; Inoue, C. Separation of Microplastic from Soil by Centrifugation and Its Application to Agricultural Soil. Chemosphere 2022, 288, 132654. [Google Scholar] [CrossRef]
  21. Xiang, Y.; Jiang, L.; Zhou, Y.; Luo, Z.; Zhi, D.; Yang, J.; Lam, S.S. Microplastics and Environmental Pollutants: Key Interaction and Toxicology in Aquatic and Soil Environments. J. Hazard. Mater. 2022, 422, 126843. [Google Scholar] [CrossRef]
  22. Tagg, A.S.; Sapp, M.; Harrison, J.P.; Ojeda, J.J. Identification and Quantification of Microplastics in Wastewater Using Focal Plane Array-Based Reflectance Micro-FT-IR Imaging. Anal. Chem. 2015, 87, 6032–6040. [Google Scholar] [CrossRef] [Green Version]
  23. Bakaraki Turan, N.; Sari Erkan, H.; Onkal Engin, G. Microplastics in Wastewater Treatment Plants: Occurrence, Fate and Identification. Process Saf. Environ. Prot. 2021, 146, 77–84. [Google Scholar] [CrossRef]
  24. Liu, W.; Zhang, J.; Liu, H.; Guo, X.; Zhang, X.; Yao, X.; Cao, Z.; Zhang, T. A Review of the Removal of Microplastics in Global Wastewater Treatment Plants: Characteristics and Mechanisms. Environ. Int. 2021, 146, 106277. [Google Scholar] [CrossRef]
  25. Naji, A.; Azadkhah, S.; Farahani, H.; Uddin, S.; Khan, F.R. Microplastics in Wastewater Outlets of Bandar Abbas City (Iran): A Potential Point Source of Microplastics into the Persian Gulf. Chemosphere 2021, 262, 128039. [Google Scholar] [CrossRef] [PubMed]
  26. Oanh, D.T.; Thuy, D.T.; Huong, N.T.N.; Quynh, H.T.; Hieu, P.D.; Vu, D.M.; Nguyet, V.T.; Quynh, L.T.P.; Van Cuong, B.; Thuong, B.H. Preliminary Investigation of Microplastics in Sediments from Industrial Manufacturing Waste Sources. VNU J. Sci. Nat. Sci. Technol. 2022, 38, 1–8. [Google Scholar] [CrossRef]
  27. Drummond, J.D.; Schneidewind, U.; Li, A.; Hoellein, T.J.; Krause, S.; Packman, A.I. Microplastic Accumulation in Riverbed Sediment via Hyporheic Exchange from Headwaters to Mainstems. Sci. Adv. 2022, 8, eabi9305. [Google Scholar] [CrossRef]
  28. Yang, L.; Zhang, Y.; Kang, S.; Wang, Z.; Wu, C. Microplastics in Freshwater Sediment: A Review on Methods, Occurrence, and Sources. Sci. Total Environ. 2021, 754, 141948. [Google Scholar] [CrossRef]
  29. Van Cauwenberghe, L.; Devriese, L.; Galgani, F.; Robbens, J.; Janssen, C.R. Microplastics in Sediments: A Review of Techniques, Occurrence and Effects. Mar. Environ. Res. 2015, 111, 5–17. [Google Scholar] [CrossRef] [Green Version]
  30. Katare, Y. Microplastics in Aquatic Environments: Sources, Ecotoxicity, Detection & Remediation. Biointerface Res. Appl. Chem. 2021, 12, 3407–3428. [Google Scholar] [CrossRef]
  31. Rodrigues, S.M.; Elliott, M.; Almeida, C.M.R.; Ramos, S. Microplastics and Plankton: Knowledge from Laboratory and Field Studies to Distinguish Contamination from Pollution. J. Hazard. Mater. 2021, 417, 126057. [Google Scholar] [CrossRef]
  32. Burkhardt-Holm, P.; N’Guyen, A. Ingestion of Microplastics by Fish and Other Prey Organisms of Cetaceans, Exemplified for Two Large Baleen Whale Species. Mar. Pollut. Bull. 2019, 144, 224–234. [Google Scholar] [CrossRef]
  33. Li, J.; Lusher, A.L.; Rotchell, J.M.; Deudero, S.; Turra, A.; Bråte, I.L.N.; Sun, C.; Shahadat Hossain, M.; Li, Q.; Kolandhasamy, P.; et al. Using Mussel as a Global Bioindicator of Coastal Microplastic Pollution. Environ. Pollut. 2019, 244, 522–533. [Google Scholar] [CrossRef]
  34. Thomas, M.; Jon, B.; Craig, S.; Edward, R.; Ruth, H.; John, B.; Dick, V.A.; Heather, L.A.; Matthew, S. The World Is Your Oyster: Low-Dose, Long-Term Microplastic Exposure of Juvenile Oysters. Heliyon 2020, 6, e03103. [Google Scholar] [CrossRef]
  35. Jinhui, S.; Sudong, X.; Yan, N.; Xia, P.; Jiahao, Q.; Yongjian, X. Effects of Microplastics and Attached Heavy Metals on Growth, Immunity, and Heavy Metal Accumulation in the Yellow Seahorse, Hippocampus Kuda Bleeker. Mar. Pollut. Bull. 2019, 149, 110510. [Google Scholar] [CrossRef] [PubMed]
  36. Meaza, I.; Toyoda, J.H.; Wise Sr, J.P. Microplastics in Sea Turtles, Marine Mammals and Humans: A One Environmental Health Perspective. Front. Environ. Sci. 2021, 8, 575614. [Google Scholar] [CrossRef] [PubMed]
  37. Hernandez-Gonzalez, A.; Saavedra, C.; Gago, J.; Covelo, P.; Santos, M.B.; Pierce, G.J. Microplastics in the Stomach Contents of Common Dolphin (Delphinus delphis) Stranded on the Galician Coasts (NW Spain, 2005–2010). Mar. Pollut. Bull. 2018, 137, 526–532. [Google Scholar] [CrossRef] [PubMed]
  38. Moore, R.C.; Loseto, L.; Noel, M.; Etemadifar, A.; Brewster, J.D.; MacPhee, S.; Bendell, L.; Ross, P.S. Microplastics in Beluga Whales (Delphinapterus leucas) from the Eastern Beaufort Sea. Mar. Pollut. Bull. 2020, 150, 110723. [Google Scholar] [CrossRef] [PubMed]
  39. Provencher, J.F.; Vermaire, J.C.; Avery-Gomm, S.; Braune, B.M.; Mallory, M.L. Garbage in Guano? Microplastic Debris Found in Faecal Precursors of Seabirds Known to Ingest Plastics. Sci. Total Environ. 2018, 644, 1477–1484. [Google Scholar] [CrossRef]
  40. Kosuth, M.; Mason, S.A.; Wattenberg, E.V. Anthropogenic Contamination of Tap Water, Beer, and Sea Salt. PLoS ONE 2018, 13, e0194970. [Google Scholar] [CrossRef]
  41. Kim, J.S.; Lee, H.J.; Kim, S.K.; Kim, H.J. Global Pattern of Microplastics (MPs) in Commercial Food-Grade Salts: Sea Salt as an Indicator of Seawater MP Pollution. Environ. Sci. Technol. 2018, 52, 12819–12828. [Google Scholar] [CrossRef]
  42. Afrin, S.; Rahman, M.M.; Hossain, M.N.; Uddin, M.K.; Malafaia, G. Are There Plastic Particles in My Sugar? A Pioneering Study on the Identification/Characterization of Microplastics in Commercial Sugars and Risk Assessment. Sci. Total Environ. 2022, 837, 155849. [Google Scholar] [CrossRef]
  43. Makhdoumi, P.; Naghshbandi, M.; Ghaderzadeh, K.; Mirzabeigi, M.; Yazdanbakhsh, A.; Hossini, H. Micro-Plastic Occurrence in Bottled Vinegar: Qualification, Quantification and Human Risk Exposure. Process Saf. Environ. Prot. 2021, 152, 404–413. [Google Scholar] [CrossRef]
  44. Kutralam-Muniasamy, G.; Pérez-Guevara, F.; Elizalde-Martínez, I.; Shruti, V.C. Branded Milks—Are They Immune from Microplastics Contamination? Sci. Total Environ. 2020, 714, 136823. [Google Scholar] [CrossRef]
  45. Mason, S.A.; Welch, V.G.; Neratko, J. Synthetic Polymer Contamination in Bottled Water. Front. Chem. 2018, 6, 407. [Google Scholar] [CrossRef] [PubMed] [Green Version]
  46. Diaz-Basantes, M.F.; Conesa, J.A.; Fullana, A. Microplastics in Honey, Beer, Milk and Refreshments in Ecuador as Emerging Contaminants. Sustainability 2020, 12, 5514. [Google Scholar] [CrossRef]
  47. Shruti, V.C.; Pérez-Guevara, F.; Elizalde-Martínez, I.; Kutralam-Muniasamy, G. First Study of Its Kind on the Microplastic Contamination of Soft Drinks, Cold Tea and Energy Drinks—Future Research and Environmental Considerations. Sci. Total Environ. 2020, 726, 138580. [Google Scholar] [CrossRef]
  48. Kedzierski, M.; Lechat, B.; Sire, O.; Le Maguer, G.; Le Tilly, V.; Bruzaud, S. Microplastic Contamination of Packaged Meat: Occurrence and Associated Risks. Food Packag. Shelf Life 2020, 24, 100489. [Google Scholar] [CrossRef]
  49. Schwabl, P.; Koppel, S.; Konigshofer, P.; Bucsics, T.; Trauner, M.; Reiberger, T.; Liebmann, B. Detection of Various Microplastics in Human Stool: A Prospective Case Series. Ann. Intern. Med. 2019, 171, 453–457. [Google Scholar] [CrossRef] [PubMed]
  50. Ragusa, A.; Svelato, A.; Santacroce, C.; Catalano, P.; Notarstefano, V.; Carnevali, O.; Papa, F.; Rongioletti, M.C.A.; Baiocco, F.; Draghi, S.; et al. Plasticenta: First Evidence of Microplastics in Human Placenta. Environ. Int. 2021, 146, 106274. [Google Scholar] [CrossRef] [PubMed]
  51. Poma, A.; Vecchiotti, G.; Colafarina, S.; Zarivi, O.; Aloisi, M.; Arrizza, L.; Chichiriccò, G.; Di Carlo, P. In Vitro Genotoxicity of Polystyrene Nanoparticles on the Human Fibroblast Hs27 Cell Line. Nanomaterials 2019, 9, 1299. [Google Scholar] [CrossRef] [Green Version]
  52. Wang, S.; Han, Q.; Wei, Z.; Wang, Y.; Xie, J.; Chen, M. Polystyrene Microplastics Affect Learning and Memory in Mice by Inducing Oxidative Stress and Decreasing the Level of Acetylcholine. Food Chem. Toxicol. 2022, 162, 278–6915. [Google Scholar] [CrossRef]
  53. Uddin, S.; Fowler, S.W.; Behbehani, M. An Assessment of Microplastic Inputs into the Aquatic Environment from Wastewater Streams. Mar. Pollut. Bull. 2020, 160, 111538. [Google Scholar] [CrossRef]
  54. Magnusson, K.; Norén, F. Screening of Microplastic Particles in and Down-Stream a Wastewater Treatment Plant; Swedish Environmental Protection Agency: Stockholm, Sweden, 2014; Volume C55. [Google Scholar]
  55. Ziajahromi, S.; Neale, P.A.; Rintoul, L.; Leusch, F.D.L. Wastewater Treatment Plants as a Pathway for Microplastics: Development of a New Approach to Sample Wastewater-Based Microplastics. Water Res. 2017, 112, 93–99. [Google Scholar] [CrossRef]
  56. Talvitie, J.; Mikola, A.; Koistinen, A.; Setälä, O. Solutions to Microplastic Pollution—Removal of Microplastics from Wastewater Effluent with Advanced Wastewater Treatment Technologies. Water Res. 2017, 123, 401–407. [Google Scholar] [CrossRef] [PubMed] [Green Version]
  57. Papa, M.; Foladori, P.; Guglielmi, L.; Bertanza, G. How Far Are We from Closing the Loop of Sewage Resource Recovery? A Real Picture of Municipal Wastewater Treatment Plants in Italy. J. Environ. Manag. 2017, 198, 9–15. [Google Scholar] [CrossRef]
  58. Uddin, S.; Fowler, S.W.; Saeed, T.; Naji, A.; Al-Jandal, N. Standardized Protocols for Microplastics Determinations in Environmental Samples from the Gulf and Marginal Seas. Mar. Pollut. Bull. 2020, 158, 111374. [Google Scholar] [CrossRef]
  59. IMO/FAO/UNESCO-IOC/UNIDO/WMO/IAEA/UN/UNEP/UNDP/ISA Guidelines for the Monitoring and Assessment of Plastic Litter in the Ocean: GESAMP Joint Group of Experts on the Scientific Aspects of Marine Environmental Protection. Rep. Stud. GESAMP 2019, 99, 138.
  60. Baruah, A.; Sharma, A.; Sharma, S.; Nagraik, R. An Insight into Different Microplastic Detection Methods. Int. J. Environ. Sci. Technol. 2021, 19, 5721–5730. [Google Scholar] [CrossRef]
  61. Ivleva, N.P. Chemical Analysis of Microplastics and Nanoplastics: Challenges, Advanced Methods, and Perspectives. Chem. Rev. 2021, 121, 11886–11936. [Google Scholar] [CrossRef]
  62. Edson, E.C.; Patterson, M.R. MantaRay: A Novel Autonomous Sampling Instrument for in Situ Measurements of Environmental Microplastic Particle Concentrations. In Proceedings of the OCEANS 2015-MTS/IEEE Washington, Washington, DC, USA, 19–22 October 2015. [Google Scholar] [CrossRef]
  63. Asamoah, B.O.; Kanyathare, B.; Roussey, M.; Peiponen, K.E. A Prototype of a Portable Optical Sensor for the Detection of Transparent and Translucent Microplastics in Freshwater. Chemosphere 2019, 231, 161–167. [Google Scholar] [CrossRef]
  64. Han, S.H.; Kim, D.G.; Jung, H.Y.; Kim, S.H. Study on Real Time Sensor Monitoring Systems Based on Pulsed Laser for Microplastic Detection in Tap Water. J. Sens. Sci. Technol. 2019, 28, 294–298. [Google Scholar] [CrossRef]
  65. Nicolai, E.; Garau, S.; Favalli, C.; D’Agostini, C.; Gratton, E.; Motolese, G.; Rosato, N. Evaluation of BiesseBioscreen as a New Methodology for Bacteriuria Screening. New Microbiol. 2014, 37, 495–501. [Google Scholar] [PubMed]
  66. Toosky, M.N.; Grunwald, J.T.; Pala, D.; Shen, B.; Zhao, W.; D’agostini, C.; Coghe, F.; Angioni, G.; Motolese, G.; Abram, T.J.; et al. A Rapid, Point-of-Care Antibiotic Susceptibility Test for Urinary Tract Infections. J. Med. Microbiol. 2020, 69, 52–62. [Google Scholar] [CrossRef]
  67. Nicolai, E.; Pieri, M.; Gratton, E.; Motolese, G.; Bernardini, S. Bacterial Infection Diagnosis and Antibiotic Prescription in 3 h as an Answer to Antibiotic Resistance: The Case of Urinary Tract Infections. Antibiotics 2021, 10, 1168. [Google Scholar] [CrossRef]
  68. Lares, M.; Ncibi, M.C.; Sillanpää, M.; Sillanpää, M. Occurrence, Identification and Removal of Microplastic Particles and Fibers in Conventional Activated Sludge Process and Advanced MBR Technology. Water Res. 2018, 133, 236–246. [Google Scholar] [CrossRef]
  69. Lusher, A.L.; Hurley, R.R.; Vogelsang, C.; Nizzetto, L.; Olsen, M. Mapping Microplastics in Sludge; Norsk Institutt for Vannforskning: Oslo, Norway, 2017. [Google Scholar]
  70. Fernández-González, V.; Andrade-Garda, J.M.; López-Mahía, P.; Muniategui-Lorenzo, S. Misidentification of PVC Microplastics in Marine Environmental Samples. TrAC Trends Anal. Chem. 2022, 153, 116649. [Google Scholar] [CrossRef]
  71. Gündoğdu, S.; Çevik, C.; Güzel, E.; Kilercioğlu, S. Microplastics in Municipal Wastewater Treatment Plants in Turkey: A Comparison of the Influent and Secondary Effluent Concentrations. Environ. Monit. Assess. 2018, 190, 626. [Google Scholar] [CrossRef] [PubMed]
  72. Okoffo, E.D.; O’Brien, S.; O’Brien, J.W.; Tscharke, B.J.; Thomas, K.V. Wastewater Treatment Plants as a Source of Plastics in the Environment: A Review of Occurrence, Methods for Identification, Quantification and Fate. Environ. Sci. Water Res. Technol. 2019, 5, 1908–1931. [Google Scholar] [CrossRef]
  73. Gies, E.A.; LeNoble, J.L.; Noël, M.; Etemadifar, A.; Bishay, F.; Hall, E.R.; Ross, P.S. Retention of Microplastics in a Major Secondary Wastewater Treatment Plant in Vancouver, Canada. Mar. Pollut. Bull. 2018, 133, 553–561. [Google Scholar] [CrossRef]
  74. Carbonaro, M.; Di Venere, A.; Filabozzi, A.; Maselli, P.; Minicozzi, V.; Morante, S.; Nicolai, E.; Nucara, A.; Placidi, E.; Stellato, F. Role of Dietary Antioxidant (−)-Epicatechin in the Development of β-Lactoglobulin Fibrils. Biochim. Biophys. Acta -Proteins Proteom. 2016, 1864, 766–772. [Google Scholar] [CrossRef]
  75. Zięba-Palus, J. The Usefulness of Infrared Spectroscopy in Examinations of Adhesive Tapes for Forensic Purposes. Forensic Sci. Criminol. 2017, 2, 1–9. [Google Scholar] [CrossRef] [Green Version]
  76. Liu, X.; Colman, S.M.; Brown, E.T.; Minor, E.C.; Li, H. Estimation of Carbonate, Total Organic Carbon, and Biogenic Silica Content by FTIR and XRF Techniques in Lacustrine Sediments. J. Paleolimnol. 2013, 50, 387–398. [Google Scholar] [CrossRef]
Figure 1. Schematic of the proposed MP detection instrument.
Water 14 03235 g001
Figure 2. Schematic representation of the types and volumes of samples collected from the WWTP and the river upstream the plant.
Water 14 03235 g002
Figure 3. The electrical signal corresponding to the fluorescence time profile for the PVC test sample. In the inset, the matching to a predetermined pattern is reported.
Water 14 03235 g003
Figure 4. Fluorescence counts recorded versus the number density of added particles of (panel a) PVC and (panel b) HDPE test samples.
Water 14 03235 g004
Figure 5. Particle number density (n/mL) of real wastewater/water samples from a WWTP resuspended in the CaCl2 solution ρ = 1.5 g/cm3 (panel (a)) and in the ethanol solution ρ = 0.9 g/cm3 (panel (b)). 1: inlet, 2: outlet of the primary settling tank, 3: outlet of the secondary settling tank, 4: final outlet, 5: river upstream from discharge, 6: sludge from primary settling (data divided by a factor of 10 for the sake of representation), 7: sludge from secondary settling (data divided by a factor of 10 for the sake of representation only in (b)).
Water 14 03235 g005
Figure 6. Infrared absorption spectra (panel (a)) in the region of CH stretching vibrations. Inlet (green line), Effluent from secondary settling (blue line), Effluent from primary settling (violet line), Sludge from secondary settling (magenta line). Highlight of the spectral regions of the CH vibration (panel (b,c)).
Water 14 03235 g006
Publisher’s Note: MDPI stays neutral with regard to jurisdictional claims in published maps and institutional affiliations.

