An Eighteen Year Temporal Trends Analysis of Bifenthrin Sediment Concentrations in California Waterbodies

College of Agriculture and Natural Resources, University of Maryland, Agricultural Experiment Station, Wye Research and Education Center, Queenstown, MD 21658, USA
*
Author to whom correspondence should be addressed.
Water 2020, 12(9), 2402; https://doi.org/10.3390/w12092402
Submission received: 26 June 2020
/
Revised: 20 August 2020
/
Accepted: 22 August 2020
/
Published: 27 August 2020
(This article belongs to the Special Issue Environmental Fate of Contaminants in the Aquatic Environment)
Abstract
:The goal of this study was to conduct long-term temporal trends analysis of bifenthrin sediment concentrations for measurements conducted from 2001 to 2019 in California waterbodies. Long-term data sites defined as spanning 6 years were available for 143 sites but 17 of these sites were excluded from long analysis because all measurements were below the level of detection. At least one site used in the trends analysis was located in all nine California Water Board Regions thus providing a representative statewide spatial scale. Twenty of the 126 long-term California sediment sites showed a statistically significant downward trend in bifenthrin concentrations while nine sites showed a statistically significant upward trend. Declining bifenthrin sediment concentrations were most evident in urban waterbodies when compared with agricultural dominated waterbodies. An analysis of bifenthrin long-term sediment trends by waterbody with at least three sites showed a significant trend for only one residential/urban stream and this trend was declining. In summary, the trends analysis of bifenthrin sediment concentrations does show a compelling case for declining concentrations in the State of California during an 18-year time period that includes a time period before and after the urban use of bifenthrin was further regulated.
1. Introduction
During the past three decades synthetic pyrethroids have been introduced for a variety of insecticidal uses [1]. These insecticides are registered for use on a variety of crops, home and garden, landscaping, nurseries, structural sites, vector control, and golf courses [2]. In recent years, pyrethroid use in urban areas of California has increased as the use of organophosphate insecticides has declined [3]. Synthetic pyrethroid insecticides are highly hydrophobic by nature and tend to strongly sorb to sediment including suspended sediment in the water column [4]. The potential toxicity of pyrethroids to aquatic biota is an area of concern in the State of California [5,6]. Currently there are provisional California bifenthrin water quality criteria (acute criterion of 0.06 ng/L and chronic criterion of 0.01 ng/L based on 1st centile values) [7]. However, bifenthrin sediment criteria have not been developed.
Regulation of all pesticide products used within California is the responsibility of the California Department of Pesticide Regulation (CDPR) [6]. CDPR has the authority to protect aquatic ecosystems from the harmful effects of pesticides and this agency continually monitors for potential pesticide toxicity. CDPR adopted regulations in July of 2012 to minimize pyrethroid transport from urban landscapes to surrounding waterbodies [6]. CDPR summarized pyrethroid monitoring data from 2009 to 2018 and found that bifenthrin had the highest detection frequencies when compared with other pyrethroids [6]. CDPR also used two statistical tests (Mann–Whitney and Kendall tau coefficients) to determine bifenthrin sediment trends and reported no significant bifenthrin sediment trends on data collected from 2008 to 2018. An additional bifenthrin sediment trends analysis was also conducted on another independent data set collected from the Stream Pollution Trends Program (SPoT) within the same Budd et al. [6] paper. The results from this analysis of 2008 to 2016 data showed a significant increasing trend for bifenthrin sediment concentrations when median values were compared before and after 2012 regulations. This SPoT analysis assumes that regulations in 2012 had an immediate impact. This is not likely as broad awareness of requirements, which are not on product labels, requires significant outreach. The conflicting results from the CDPR and SPoT analysis for bifenthrin sediment trends suggest that perhaps a different approach is needed where only long-term data by site are used as the basis for the analysis and the temporal scale of the trends analysis is expanded. To our knowledge this has not been done. The goal of this study was to address this research need.
The specific goal of this study was to conduct bifenthrin sediment trends analysis by site with measurements obtained from the California Environmental Data Exchange Network (CEDEN) using the most updated data sets (2001–2019) with the longest time span. Sediment concentrations and not water concentrations were the focus of the trends analysis due to the hydrophobic nature of bifenthrin [4]. Sites considered for long-term trends analysis were required to span at least 6 years of data and in most cases that included as least 6 years of data as well. If all measurements were below the level of detection these sites were not used in any further analysis. Land use surrounding the long-term bifenthrin sediment sites (urban, agriculture and mixed urban/agriculture) were considered in this analysis. Trends analysis was also conducted for watersheds with at least three sites with 6 years of data to attempt a watershed-based analysis. Appropriate statistical approaches, such as regression analysis or Spearman Correlation, were used to determine temporal trends.
2. Methods
The bifenthrin sediment data from California waterbodies used for the trends analysis presented n this paper were obtained from CEDEN (available at www.ceden.org database accessed on 15 November 2019). CEDEN data are considered high quality data compatible with California’s Surface Water Ambient Monitoring data. Bifenthrin sediment data from various sites in two water bodies (Pleasant Grove Creek and Salinas Streams) were also included in the trends analysis by watershed [8]. Bifenthrin sediment data were obtained from sampling conducted during the 2001 to 2019 time period. In the analysis presented below, non-detected concentrations were assigned a value of ½ the detection limit as recommended by other investigators [9,10]. A measurement that is defined as non-detected does not imply that there is some concentration of bifenthrin present. Bifenthrin is a hydrophobic insecticide that absorbs to organic carbon [11]. Bifenthrin sediment concentrations were measured from sediments with varying concentrations of organic carbon. There was a significant direct (positive) relationship between Total Organic Carbon (TOC) and bifenthrin concentrations using Spearman Rank Order Correlation analysis (r = 0.558; p < 0.001) [12]. Therefore, to provide a consistent carbon normalized measurement that can be used for trends analysis all sediment concentrations were normalized to ng/g at 1% TOC which is common practice used by other investigators [13].
Regression analysis, frequently considered a parametric test because an assumption of normality is required to obtain a p value, was used to determine long-term trends analysis of bifenthrin sediment concentrations by site [14]. Data spanning 6 years were needed for a site in order to be considered for long term trends analysis [15]. In addition if all measurements for a site were below the level of detection then the site data were excluded from further analysis. Regression results were considered significant if p values were less than 0.10 and r2 values exceeded 0.25 [15]. If statistical assumptions of normality and equal variance could not be satisfied with data transformation, a Spearman Rank Order Correlation (non-parametric test) was used in place of the linear regression. Spearman correlations were considered statistically significant if p values were less than 0.10 and r values were greater than 0.5.
Land use defined as predominately urban, predominately agriculture or mixed urban/agriculture was determined for each site that showed a statistically significant trend. Google Earth was used to visually make this land use determination at each site and approximately one mile upstream of the site.
3. Results and Discussion
A total of 143 California sites with the most temporal rich bifenthrin sediment data spanning 6 to 15 years are presented in a detailed report [12]. Bifenthrin sediment concentrations in this data set ranged from non-detected to 697 ng/g at 1% TOC. Only the top 126 sites were used for statistical analysis because the other 17 sites had 100% non-detected values (Figure 1). At least one site was located in each of the nine California Water Board Regions. For the 126 sites used in the trends analysis, the percentage of non-detected concentrations ranged from 0 to 90% with levels of quantification ranging from 0.03 to 1 ng/g, The primary bifenthrin analytical method used for sediment analysis is previously described [16].
Results from regression and correlation analysis at long-term sites with statistically significant trends are summarized in Table 1. Twenty-nine of the 126 sites (Figure 2, Figure 3, Figure 4, Figure 5, Figure 6, Figure 7, Figure 8, Figure 9, Figure 10, Figure 11, Figure 12, Figure 13, Figure 14, Figure 15, Figure 16, Figure 17, Figure 18, Figure 19, Figure 20, Figure 21, Figure 22, Figure 23, Figure 24, Figure 25, Figure 26, Figure 27, Figure 28, Figure 29 and Figure 30) showed a statistically significant trend with non-detected concentrations ranging from 0 to 90% (mean value of 27%). If multiple data points appear in the site figures for a specific year then multiple values were reported for that location and year to include all available data. For 20 sites the trend was downward and for nine sites the trend was upward (Table 1). Sites showing a statistically declining trends were as follows: Alemeda Creek E. of Alvarado Blvd (Figure 2); Alamo River at International Boundary (Figure 3); Butte Slough upstream of Pass Road Bridge (Figure 6); Coachella Valley Stormchannel (Ave 52) (Figure 8); Colusa Basin Drain Upstream at Knights Landing (Figure 9); Cosumnes River at Twin Cities Road (Figure 10); Dual Storm Drain at Opal and Parkside Way (Figure 11); Espinosa Slough upstream of Alisal Slough (Figure 12); Guadalupe Creek at USGS Gaging Station 11169025 (Figure 13); Lagunitas Creek at Coast Guard Station (Figure 15); Laurel Creek at Pintail Drive (Figure 16); Llagas Creek at Southside (Figure 17); Marsh Creek at East Cypress Crossing (Figure 18); Mokelumne River at New Hope Road (Figure 19); Oso Flaco Creek at Oso Flaco Lake Road (Figure 21); Palo Verde Lagoon (LG1) (Figure 22); Salsipuedes Creek downstream of Corralitos Creek (Figure 23); San Luis Obispo Creek at San Luis Bay Drive (Figure 24); Trout Creek (Truckee) near mouth (Figure 28) and Walnut Creek at Concord Ave O.C. (Figure 29).
Sites showing a significant increasing trend were as follows: Ballona Creek downstream of Sawtelle (Centinella) (Figure 4); Bear Creek near Bert Crane Road (Figure 5); Calleguas Creek below Camrosa WWTP, site 6 (Figure 7); Ingram Creek at River Road (Figure 14); Orestimba Creek at River Road (Figure 20); Santa Clara River Estuary (Figure 25); Sutter Creek at Hwy 49 (Figure 26); Tembladero Slough at Monterey Dunes Way (Figure 27) and Z Drain (Dixon RCD) (Figure 30).
The bifenthrin statistically significant sediment trends data presented above provide a compelling case for declining bifenthrin sediment concentrations throughout the state since approximately twice as many sites showed a decline as opposed to an increase. The location of the 20 sites showing significant declining trends and the nine sites showing significant increasing trends in Figure 31 does not show a clear spatial pattern for sites with decreasing and increasing trends.
Land use was considered in the bifenthrin sediment trends analysis. Land use defined as predominately urban, predominately agriculture or mixed urban/agriculture shown in Table 1 for the sites with significant trends was reported as follows: (1) 8 urban sites; (2) 16 agricultural sites; and (3) 5 sites with both mixed urban and agricultural use. Seven urban sites showed declining bifenthrin concentrations while one site showed increasing concentrations. Of the seven urban sites showing a statistically significant downward trend the following four sites were most compelling because all measurements were detected concentrations and the time span ranged from 2008 to 2017: Alameda Cr. East of Alvarado Blvd (Figure 2); Guadalupe Creek at USGS Gaging Station 11169025 (Figure 13); Laural Cr at Pintail Dr. (Figure 16) and Walnut Creek at Concord Av (Figure 29). The results from these four sites would certainly suggest that the 2012 regulations for bifenthrin may be a factor in reducing sediment concentrations. There was however one site (Ballona Creek at downtown of Sawtelle, presented in Figure 4) that does show a statistically significant upward trend with all detected concentrations and a time span of 2008 to 2017.
Ten sites with predominately agricultural land use showed a downward trend in bifenthrin concentrations while six sites showed an increase in concentrations (see Table 1). The six agricultural sites that were most convincing for showing a downward trend based on time span and the presence of few non-detects were: Butt Slough upstream of Pass Road Bridge (Figure 6); Colusa basin drain upstream of Knights Landing (Figure 9); Cosumnes River at Twin Cities Road (Figure 10); Mokelumne River at New Hope Road (Figure 19); San Luis Obispo Cr. at San Luis Bay Drive (Figure 24); and Trout Cr. (Figure 28). Five of the six agricultural sites that were most convincing in showing increasing bifenthrin concentrations with time spans ranging from 6 to 11 years (2003 to 2017 for all sites combined) and the presence of few non-detectable concentrations were as follows: Bear Creek near Bert Crane Rd (Figure 5); Calleguas Cr. Below Camrosa WWTP (Figure 7); Ingram Cr at River Road (Figure 14); Tembladero Slough at Monterey Dunes Way (Figure 27); and Z- Drain (Dixon RCD) (Figure 30). There were more agricultural sites showing statistically significant declining trends (10 sites) versus increasing trends (6 sites) and slightly more highly convincing sites showing a decline versus an increase. Declining bifenthrin concentrations in agricultural areas would most likely be a result of decreased use of bifenthrin products or improved mitigation practices reducing runoff from agricultural fields.
The final land use category included in this analysis is mixed urban and agriculture where one land use type is not dominant. For this land use category three sites showed declining bifenthrin concentrations. These sites were Llagas Cr. at Southside (Figure 17); Marsh Cr. at east Cypress Crossing (Figure 18) and Salsipuedes Cr. downstream of Corralitos Cr. (Figure 23). The trends for both the Llagas Cr and the Salsipuedes Cr were statistically significant but not necessarily compelling due to the presence of non-detects and limited time span of sampling. However, the Marsh Cr declining trend was strong and based on 8 years of data (2010 to 2017) with all measurements above the level of detection. The two mixed category sites with significant increasing bifenthin trends were Santa Clara River estuary (Figure 25) and Sutter Cr. at Highway 49 (Figure 26). The Sutter Cr site analysis was dominated by non-detects and was not as compelling as the regression trends for the Santa Clara River estuary site that covered 8 years with only one non-detectable concentration. Bifenthrin sediment trends for the mixed land use category site designation had somewhat mixed results without a convincing case for either declining or increasing concentrations.
An additional stream-wide analysis for bifenthrin sediment concentrations was also conducted on waterbodies that had at least three sites within a waterbody with data spanning 6 years (Table 2; Figure 32). Based on this analysis from five waterbodies, the only waterbody with a significant trend was Pleasant Grove Creek (primarily an urban waterbody) where a significant downward trend was reported (Figure 33). This trend has been described in detail in another paper currently in review using a substituted value of half the detection limit for non-detects [17]. The stream-wide approach for addressing bifenthrin sediment trends where multiple sites are sampled is important because assuming that a single site in a water body can represent the conditions (a sediment bifenthrin concentration) of a waterbody can be misleading. For example, the bifenthrin sediment concentrations in Pleasant Grove Creek (PGC) in 2019 ranged from 0.66 ng/g at 1% TOC at PGC site 2 to 21.4 ng/g at 1% TOC at PGC site 14 [18].
Although this paper does provide a convincing case for declining concentrations of bifenthrin sediment concentrations primarily in urban waterbodies there are at least two areas of uncertainly that must be recognized. First, 22% of the data used in the analysis are censored left data where a substitution technique (half the detection limit for non-detected concentrations) is used in the analysis. This substitution technique is in general agreement with other approaches used to address censored left data so it is a valid approach [17]. The use of censored left data is transparent within this paper and illustrated in all the figures when present where significant trends were reported. The second area of uncertainty is the lack of consistent sampling and analytical methods (e.g., different detection limits) used to generate the bifenthrin data sets. This is a common issue in all large summary data sets such as CEDEN where different organizations with often different study goals are contributing their data. There are various quality control measures used for data submitted to CEDEN, primarily addressed by the authors, to cover the data reliability part of this issue.
4. Conclusions
Long-term temporal trends analysis of pesticides, such as bifenthrin, are an important component of pesticide ecological risk assessment because this type of analysis provides a means to measure progress and determine the effectiveness of mitigation measures to reduce both concentrations and potential toxic effects in the aquatic environment. The bifenthrin sediment trends analysis presented in this study was novel due to the long time span of data by site and the results from this analysis showed that approximately twice as many sites with long-term significant trends were declining versus increasing. This compelling positive message for declining bifenthrin concentrations was particularly true for urban sites where regulations were adopted in 2012 to curtail control of urban use of bifenthrin. The case for declining bifenthrin concentrations in agricultural areas is not as convincing as urban areas cases although a higher number of sites did show a decline versus an increase. Urban regulations would not be expected to impact agricultural areas unless agricultural waterbodies are influenced by urban bifenthrin use. Reduced use of bifenthrin and/or mitigation measures such as implementation of sediment control in agricultural areas are possible reasons for slightly declining concentrations for specific sites in these type of waterbodies.
Conclusively identifying reasons for declining concentrations of pesticides, such as bifenthrin, in the aquatic environment is always a difficult challenge. Reduced use due to urban regulation, more responsible homeowner use and natural factors such as precipitation that leads to pesticide runoff should be considered. One way to approach this precipitation issue is to have long-term temporal scale data sets by site to increase the odds of including all different levels of precipitation years (e.g., wet years, normal years, dry years) in the trends analysis. The 18- year time span of the high quality bifenthrin sediment data from California waterbodies used in this study provided a solid approach for addressing this precipitation variability issue as documented from approximately 160 long term NOAA precipitation stations from 14 different watershed regions throughout California (http://www.cnrfc.noaa.gov/rainfalldata.php accessed on 28 May 2020).
Author Contributions
L.W.H.J. responsible for writing, reviewing, editing, supervision, project administration, and funding acquisition; R.D.A. responsible for data curation and data analysis. All authors have read and agreed to the published version of the manuscript.
Funding
This research was funded by FMC Corporation.
Acknowledgments
We wish to acknowledge FMC Corporation for sponsoring this study and the California Environmental Exchange Network (CEDEN) for providing the bifenthrin monitoring data for analysis.
Conflicts of Interest
The authors declare no conflict of interest.
References
- Shamim, M.T.; Hoffmann, M.D.; Melendez, J.; Ruhman, M.A. Ecological risk characterization for synthetic pyrethroids. In Synthetic Pyrethroid Occurrence and Behavior in Aquatic Environments; Gan, J., Spurlock, F., Hendley, P., Weston, D., Eds.; American Chemical Society: Washington, DC, USA, 2008; pp. 257–309. [Google Scholar]
- Spurlock, F.; Lee, M. Synthetic pyrethroid use patterns, properties, and environmental effects. In Synthetic Pyrethroid Occurrence and Behavior in Aquatic Environments; Gan, J., Spurlock, F., Hendley, P., Weston, D., Eds.; American Chemical Society: Washington, DC, USA, 2008; pp. 3–25. [Google Scholar]
- Aquatic Science Center. The Pulse of the Delta: Monitoring and Managing Water Quality in the Sacramento-San Joaquin Delta. Rethinking Water Quality Monitoring. Contribution 630; Aquatic Science Center: Oakland, CA, USA, 2012. [Google Scholar]
- Laskowski, D.A. Physical and chemical properties of pyrethroids. Rev. Environ. Contam. Toxicol. 2002, 174, 49–170. [Google Scholar] [PubMed]
- Weston, D.P.; Holmes, R.W.; You, J.; Lydy, M.J. Aquatic toxicity due to residential use of pyrethroid insecticides. Environ. Sci. Technol. 2005, 39, 9778–9784. [Google Scholar] [CrossRef] [PubMed]
- Budd, R.; Wang, D.; Ensminger, M.; Phillips, B. An evaluation of temporal and spatial trends of pyrethroid concentrations in California water bodies. Sci. Total Environ. 2020. [Google Scholar] [CrossRef]
- Fojut, T.L.; Tjeerdema, R.S. Water Quality Criteria for Bifenthrin; Updated report May 2015; Central Valley Regional Water Quality Control Board: Rancho Cordova, CA, USA, 2015.
- Hall, L.W., Jr.; Alden, R.W., III; Anderson, R.D.; Killen, W.D. Ranking the importance of benthic metrics and environmental stressors from over a decade of bioassessment multiple stressor studies in five California waterbodies. J. Environ. Sci. Health A 2019. [Google Scholar] [CrossRef] [PubMed]
- Gibbons, R.D.; Coleman, D.E. Statistical Methods for Detection and Quantification of Environmental Contamination; John Wiley and Sons: New York, NY, USA, 2001. [Google Scholar]
- McNichols, R.J.; Davis, C.B. Statistical issues and problems in groundwater detection monitoring at hazardous waste facilities. Ground Water Monit. Rev. 1988, 8, 135–150. [Google Scholar] [CrossRef]
- Karickoff, S.W.; Brown, D.S.; Scott, T.A. Sorption of hydrophobic pollutants on natural sediments. Water Res. 1979, 13, 241–248. [Google Scholar] [CrossRef]
- Hall, L.W., Jr.; Anderson, R.D. Temporal Trends Analysis of Bifenthrin Sediment and Water Concentrations from Sites in the CEDEN Data Set (Task 4 in 2020 FMC Scope of Work); Report Prepared for FMC Corporation by the University of Maryland, College of Agriculture and Natural Resources, Agricultural Experiment Station; Wye Research and Education Center: Queenstown, MD, USA, 2020. [Google Scholar]
- Amweg, E.L.; Weston, D.P.; You, J.; Lydy, M.J. Pyrethroid insecticides and sediment toxicity in urban creeks for California and Tennessee. Environ. Sci. Technol. 2006, 40, 1700–1706. [Google Scholar] [CrossRef] [PubMed]
- Hirsch, R.M.; Slack, J.R.; Smith, R.A. Techniques of trend analysis for monthly water quality data. Water Resour. Res. 1982, 18, 107–121. [Google Scholar] [CrossRef] [Green Version]
- Hall, L.W., Jr.; Anderson, R.D. Historical trends analysis of 2004 to 2009 toxicity and pesticide data for California’s Central Valley. J. Environ. Sci. Health A 2012, 47, 801–811. [Google Scholar] [CrossRef] [PubMed]
- U.S. Environmental Protection Agency. Method 808 1BM, Organochlorine Pesticides by Gas Chromatography, Revision 1 Modified (Appendix IV); United States Environmental Protection Agency: Washington, DC, USA, 1996.
- Hall, L.W., Jr.; Perry, E.; Anderson, R.D.; Killen, W.D. A comparison of different statistical methods for addressing censored left data in temporal trends analysis of pyrethroids in a California stream. Rev. Arch. Env. Contam. Toxicol. 2020, in press. [Google Scholar]
- Hall, L.W., Jr.; Killen, W.D.; Anderson, R.D.; Alden, R.W., III. An Assessment of Benthic Communities with Concurrent Physical Habitat, Pryethroids, and Metals Analysis in Pleasant Grove Creek in 2019 and 2006-2019; Final Report for the Pyrethroid Working Group prepared by the University of Maryland; Wye Research and Education Center: Queenstown, MD, USA, 2019. [Google Scholar]
Figure 1.
Long term California sediment sites sampled for bifenthrin with ≥6 year time span and ≥6 total data points (n) from the period 2001–2019 California Environmental Data Exchange Network (CEDEN) dataset. The 126 sites presented had at least one detected value.
Figure 1.
Long term California sediment sites sampled for bifenthrin with ≥6 year time span and ≥6 total data points (n) from the period 2001–2019 California Environmental Data Exchange Network (CEDEN) dataset. The 126 sites presented had at least one detected value.
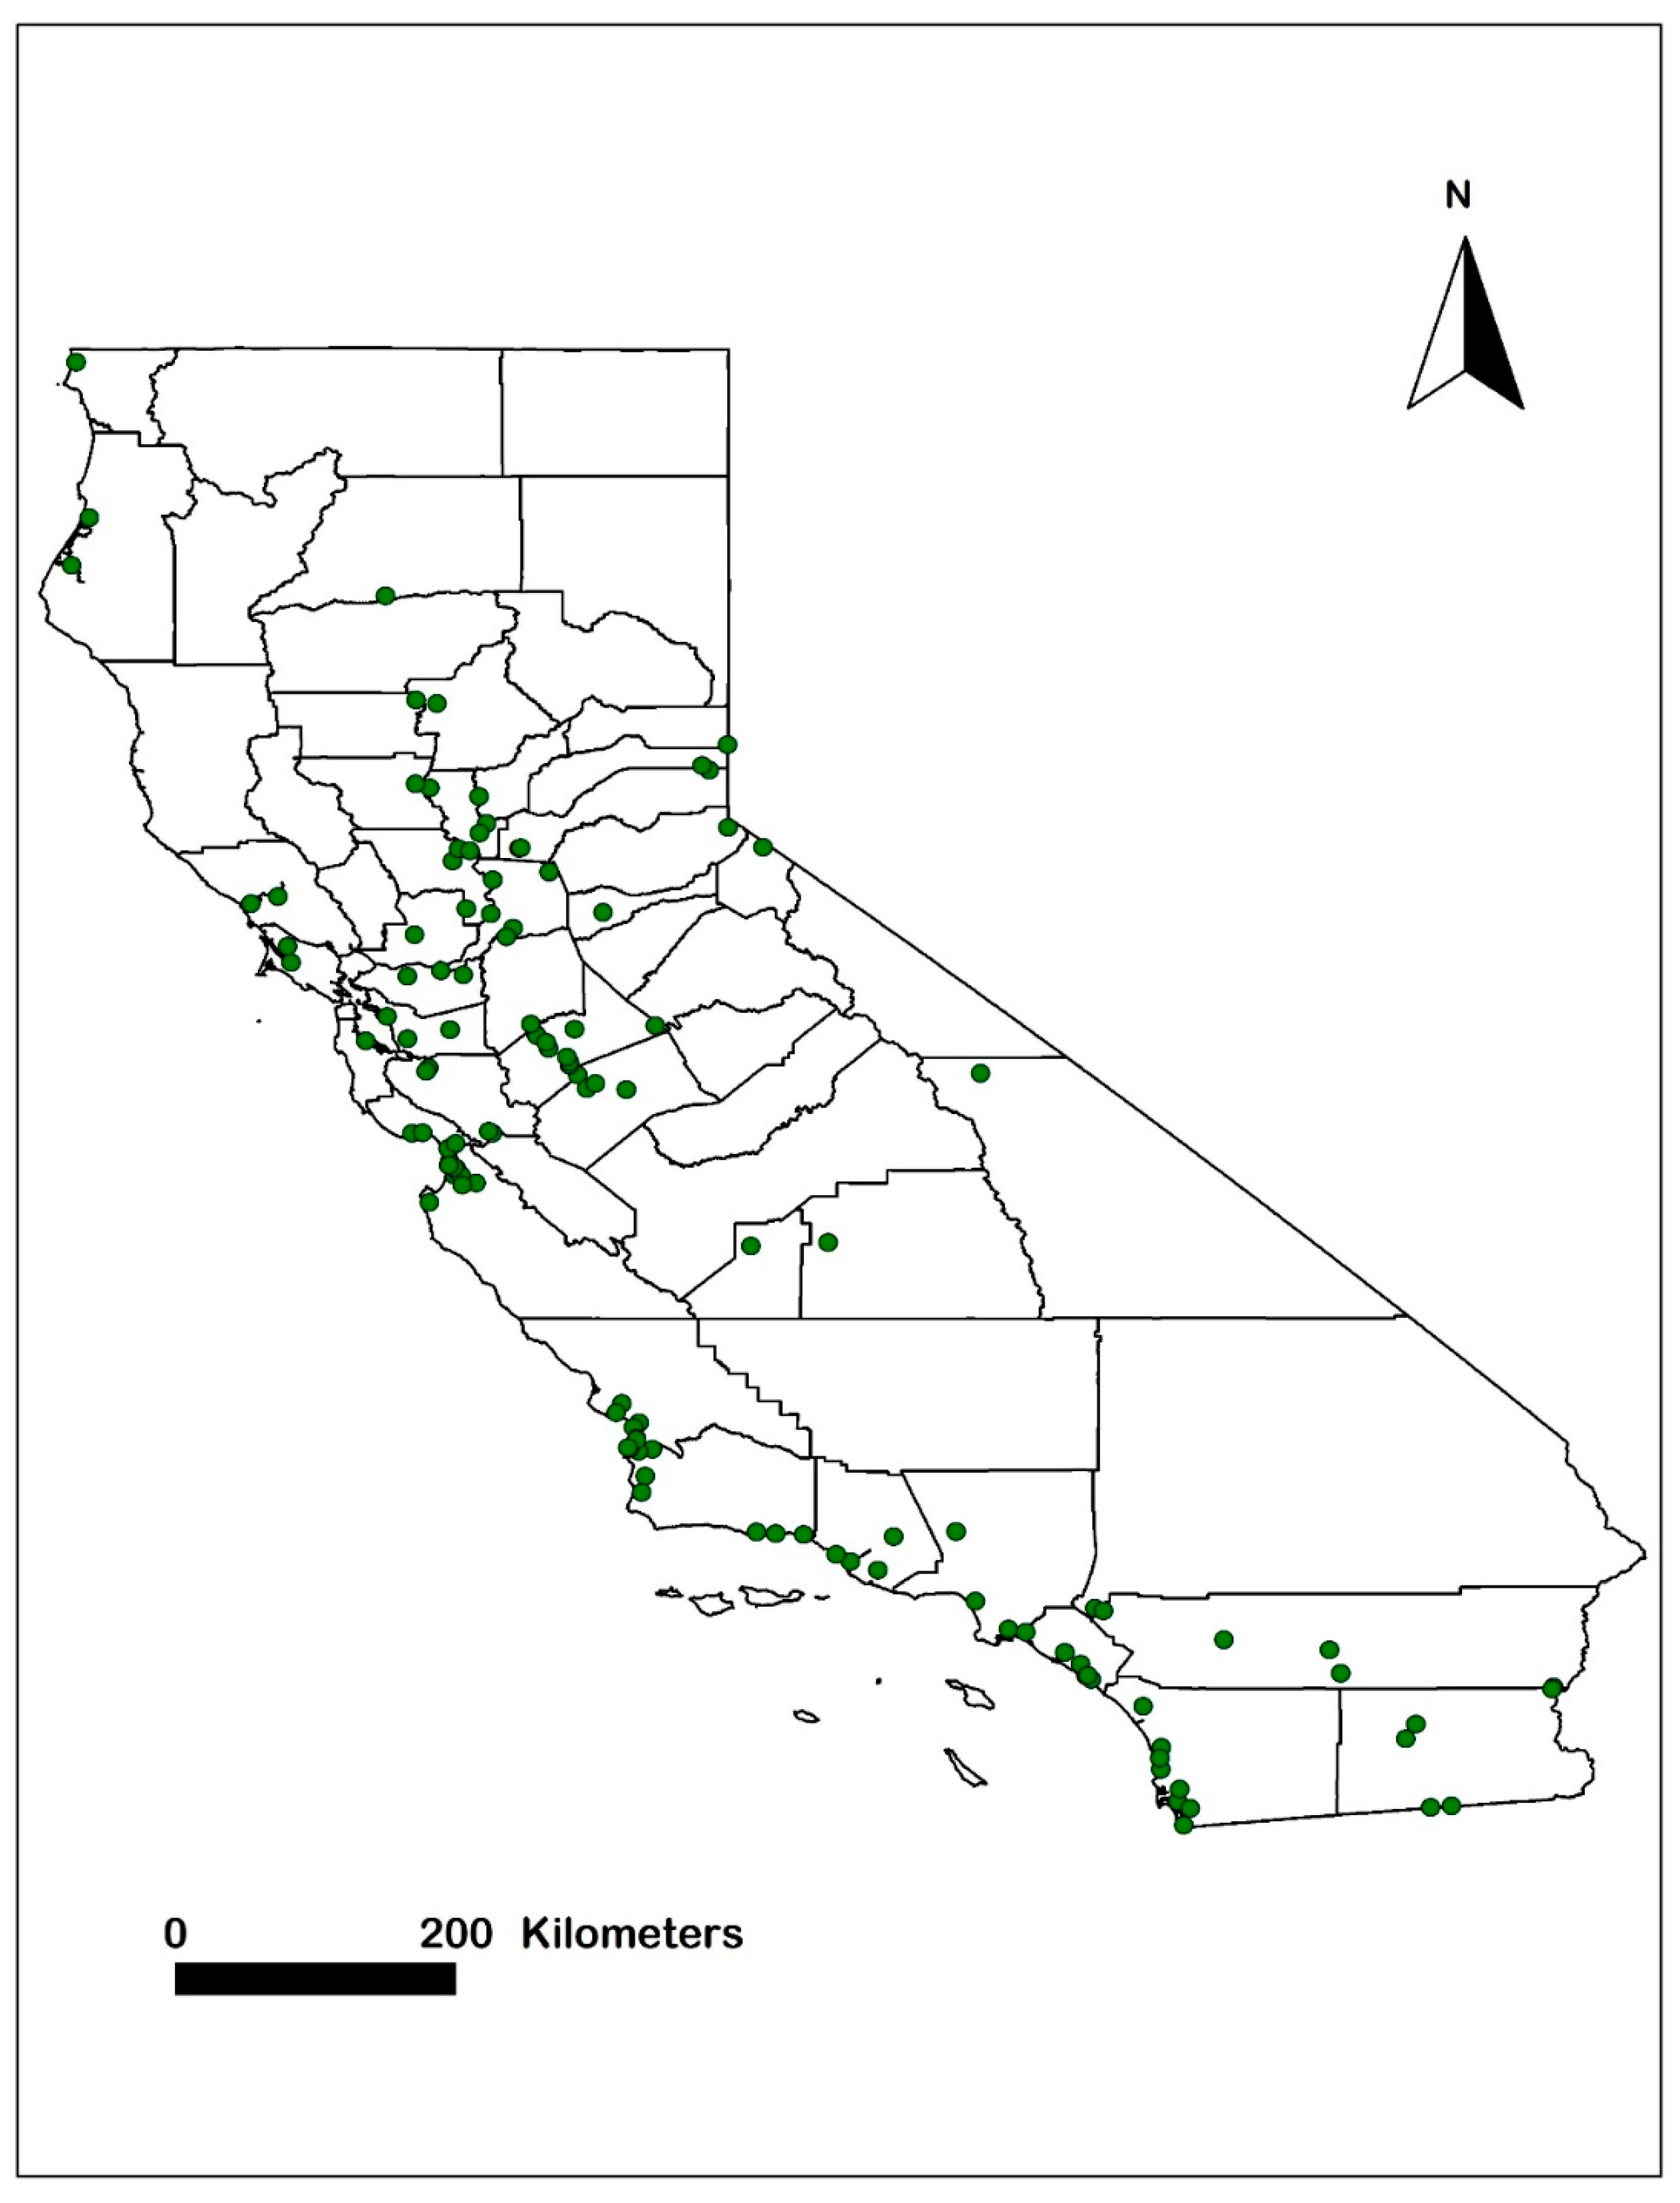
Figure 2.
Alameda Creek E of Alvarado Blvd (r2 = 0.773, p = 0.004).
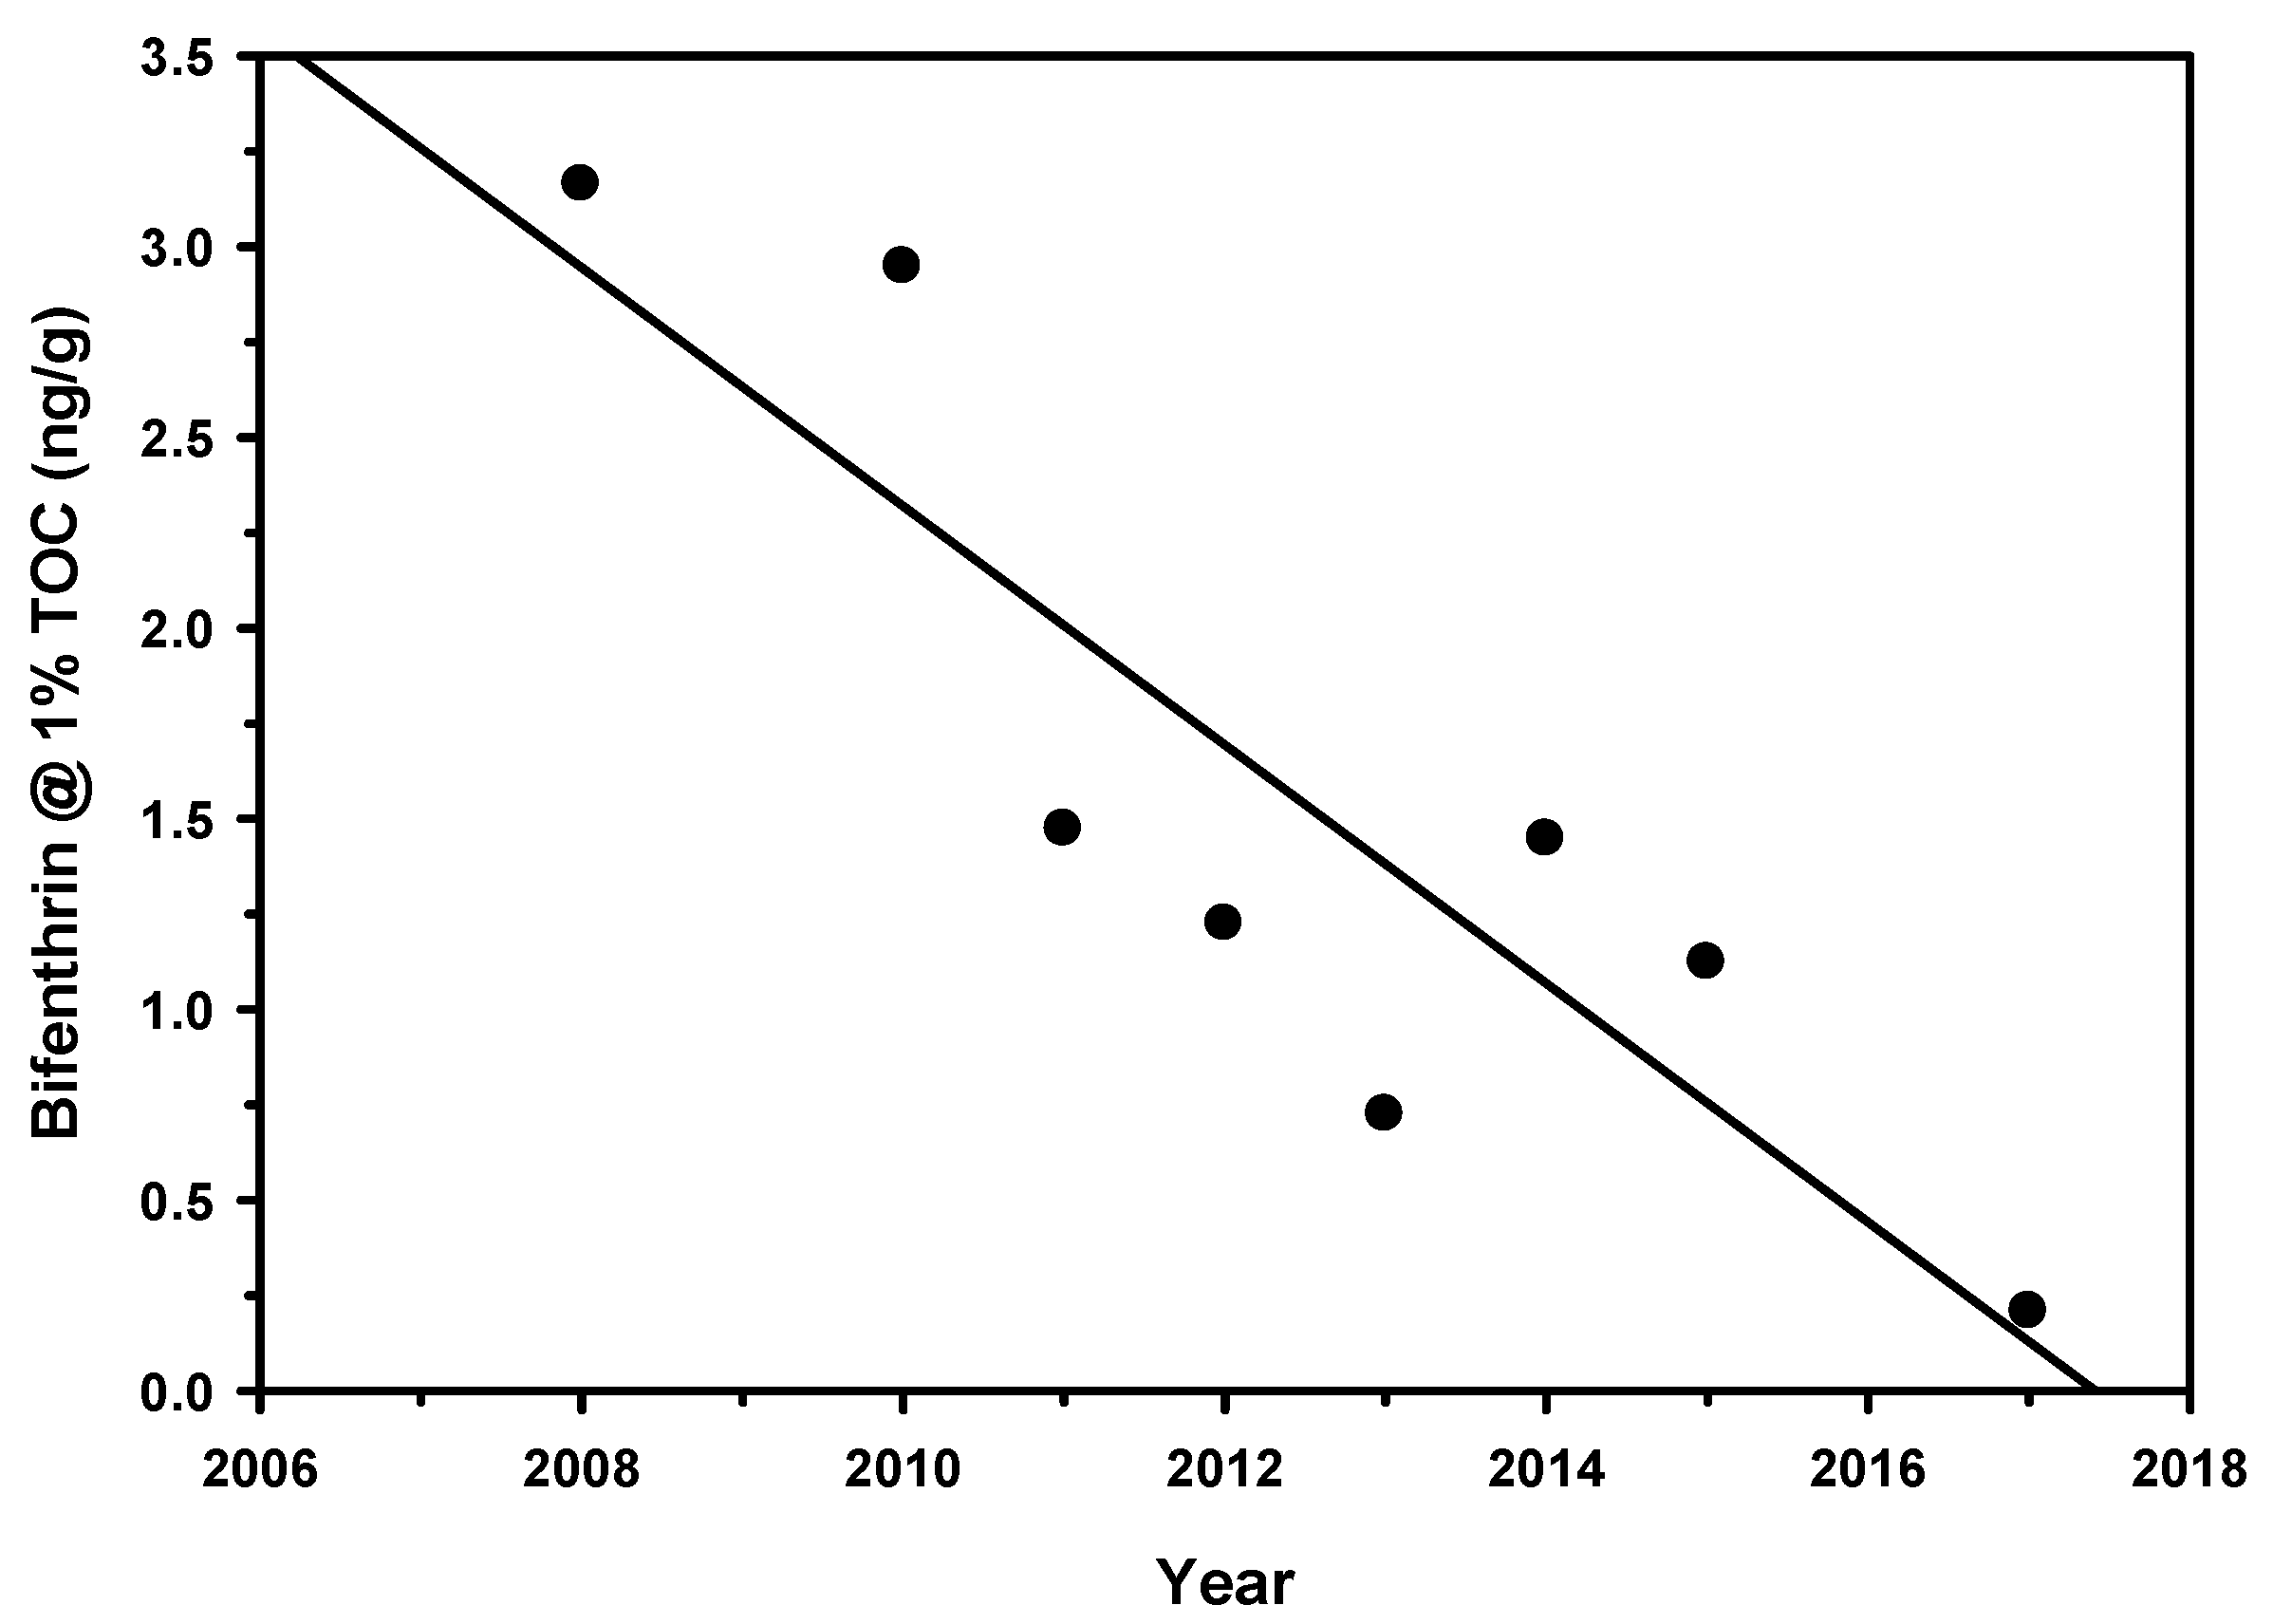
Figure 3.
Alamo River at International Boundary (r = −0.685, p = 0.025).
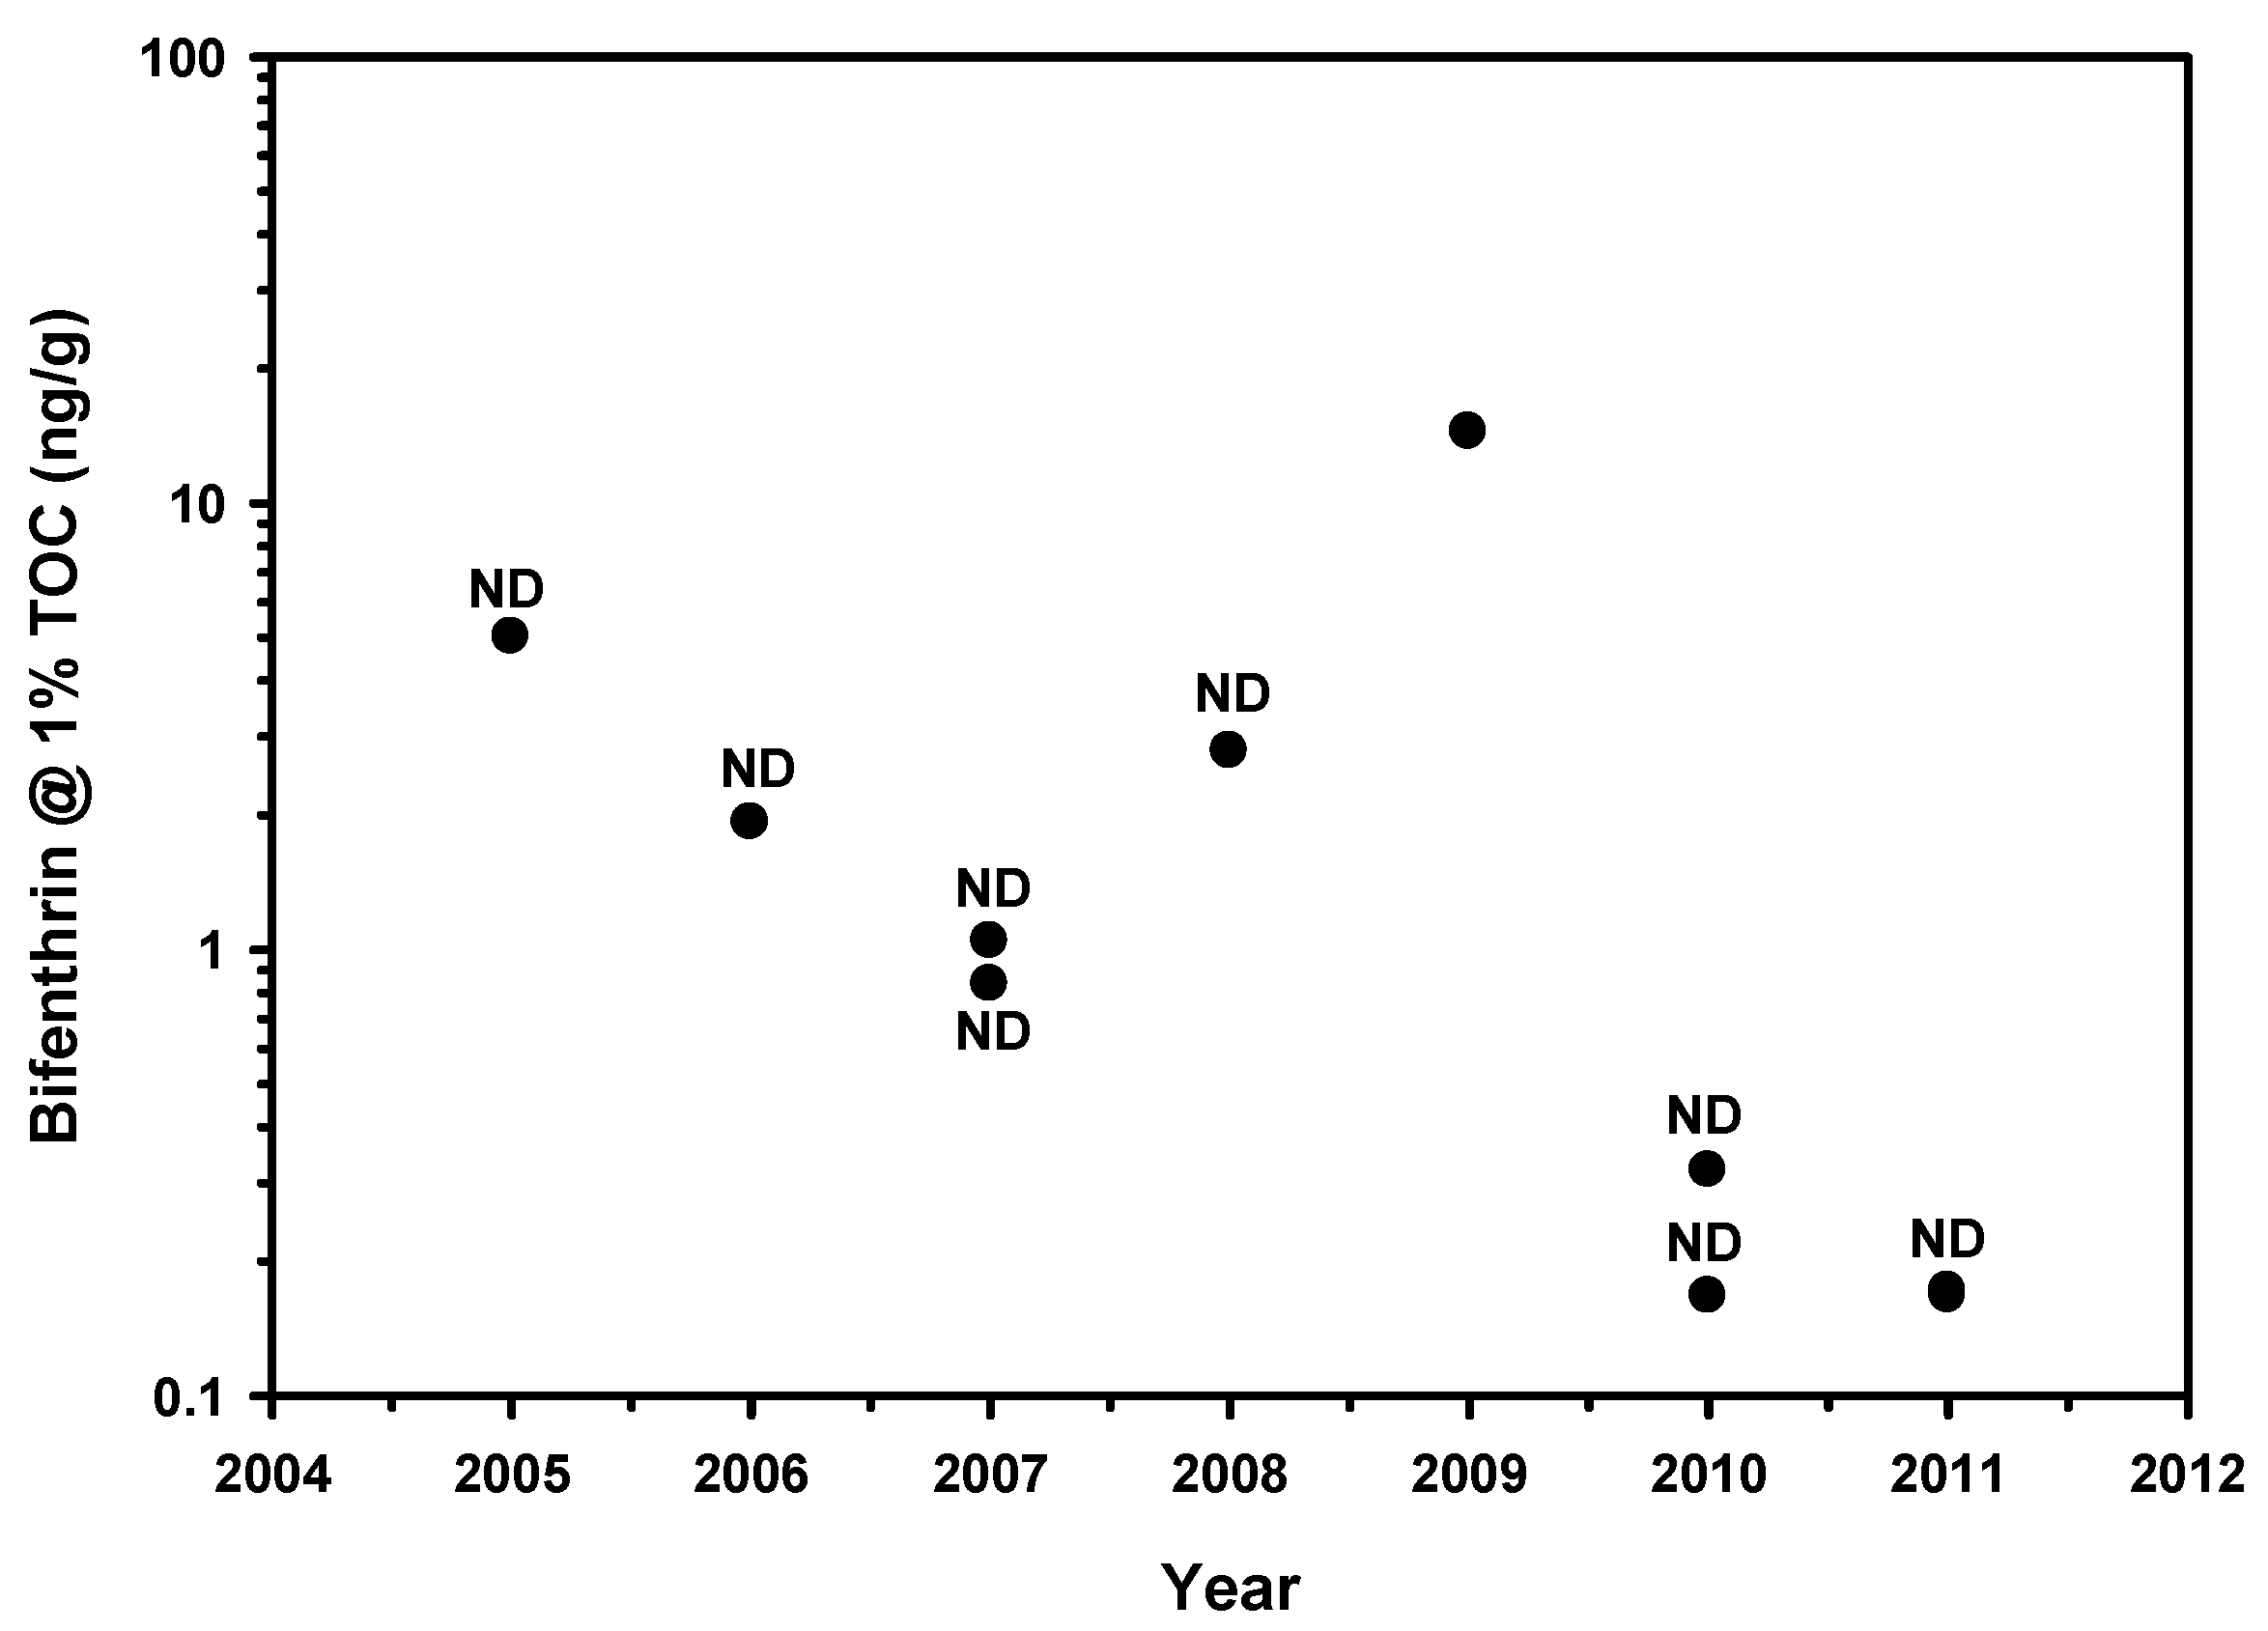
Figure 4.
Ballona Creek Downstream of Sawtelle (r2 = 0.439, p = 0.037).
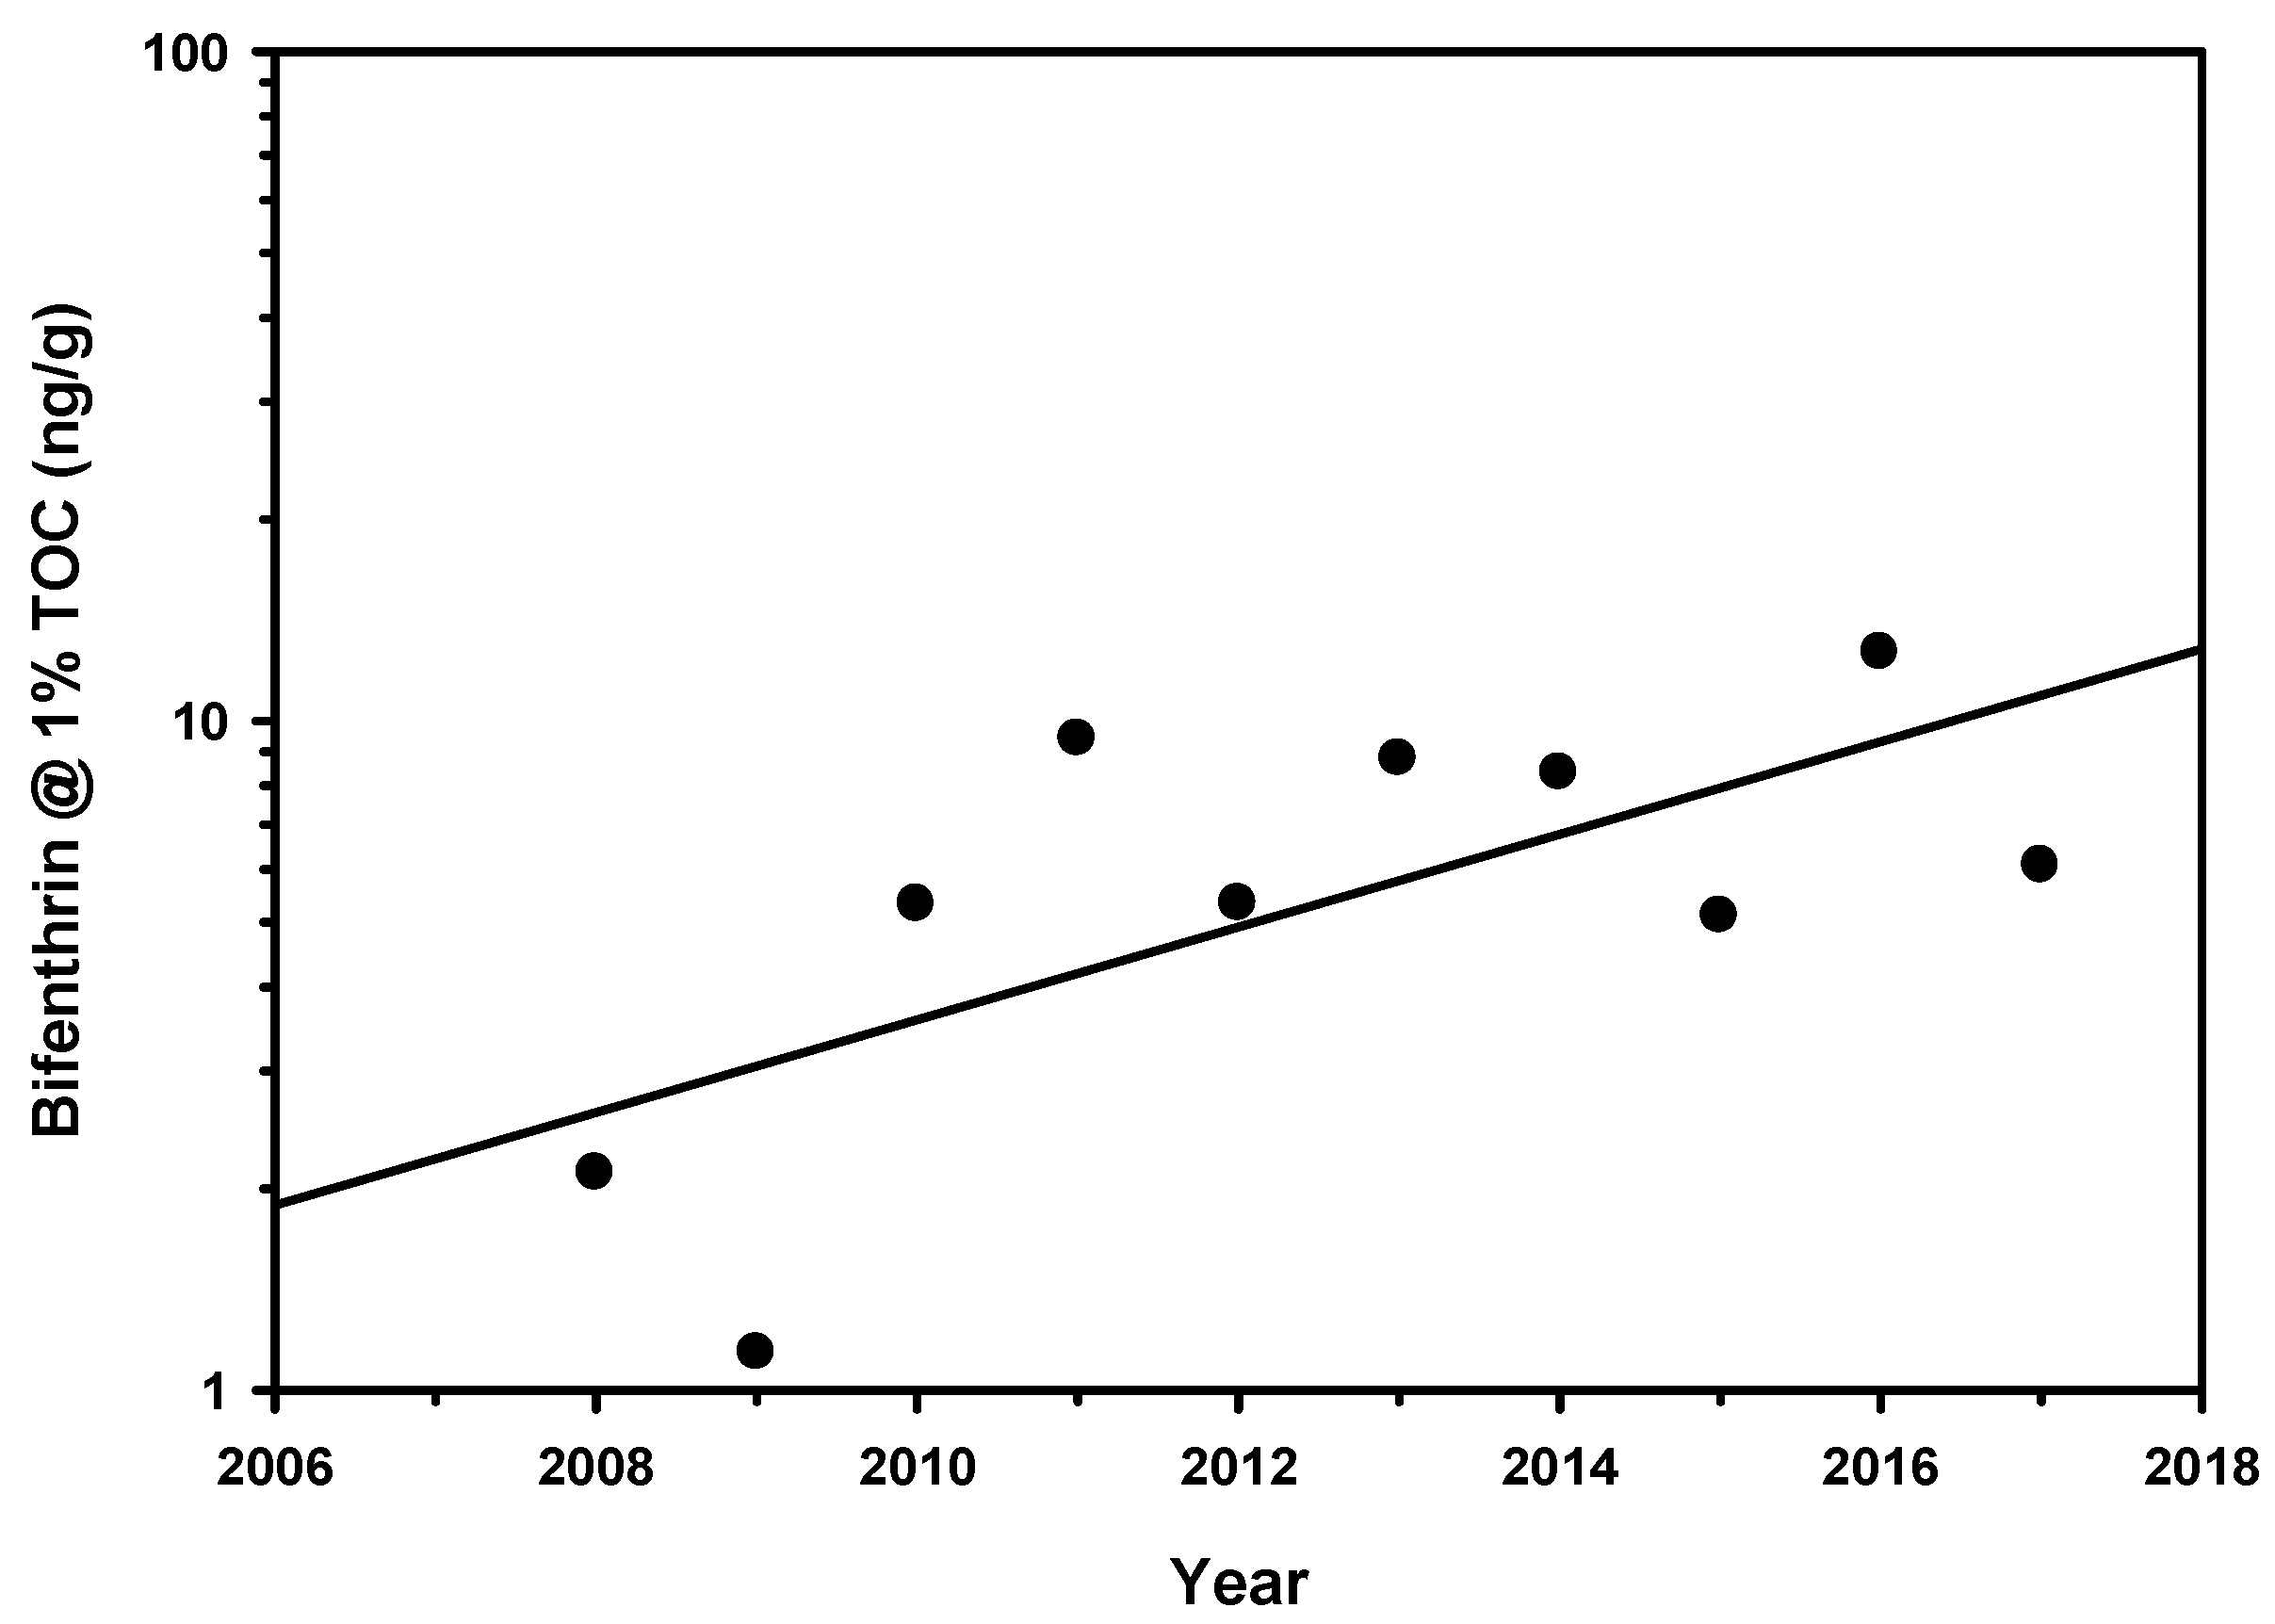
Figure 5.
Bear Creek near Bert Crane Road (r2 = 0.835, p = 0.004).
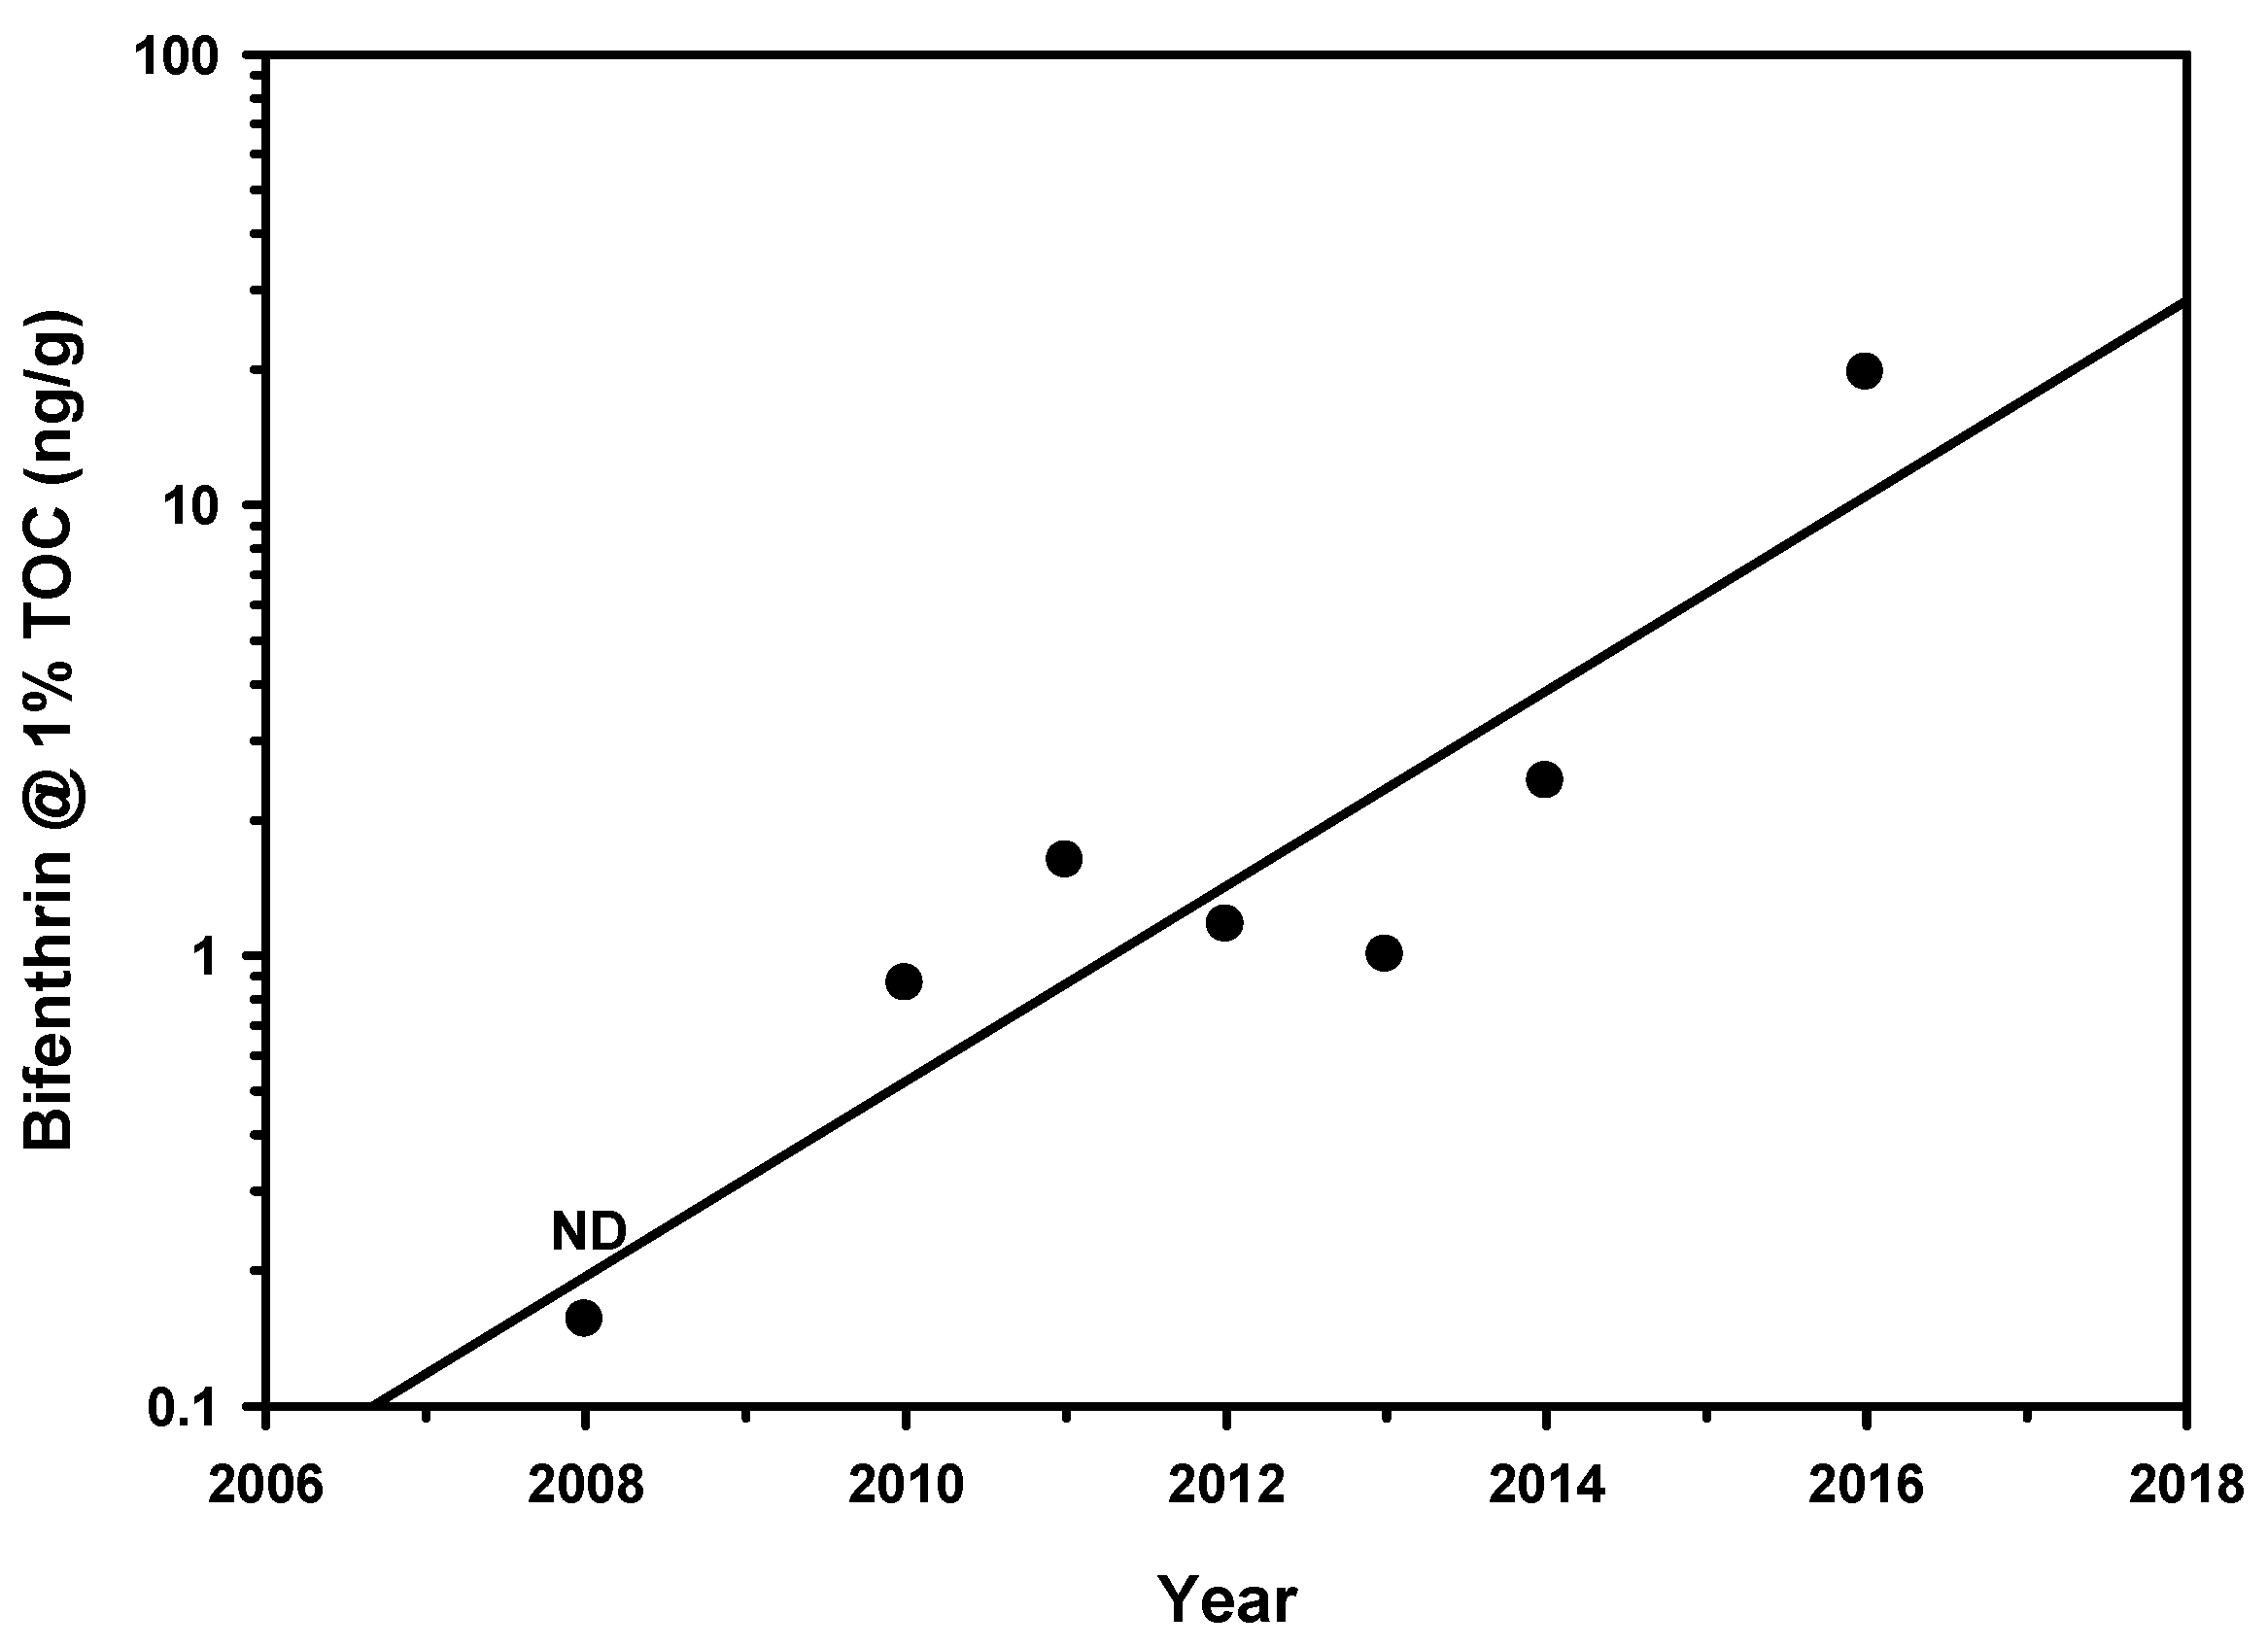
Figure 6.
Butte Slough Upstream of Pass Road Bridge (r2 = 0.612, p = 0.038).
Figure 7.
Calleguas Cr below Camrosa WWTP, Site 6 (r2 = 0.738, p = 0.003).
Figure 8.
Coachella Valley Stormchannel—Ave 52 (r2 = 0.633, p = 0.058).

Figure 9.
Colusa Basin Drn Upstream Knights Landing (r2 = 0.524, p = 0.066).
Figure 10.
Cosumnes River at Twin Cities Road (r2 = 0.391, p = 0.097).
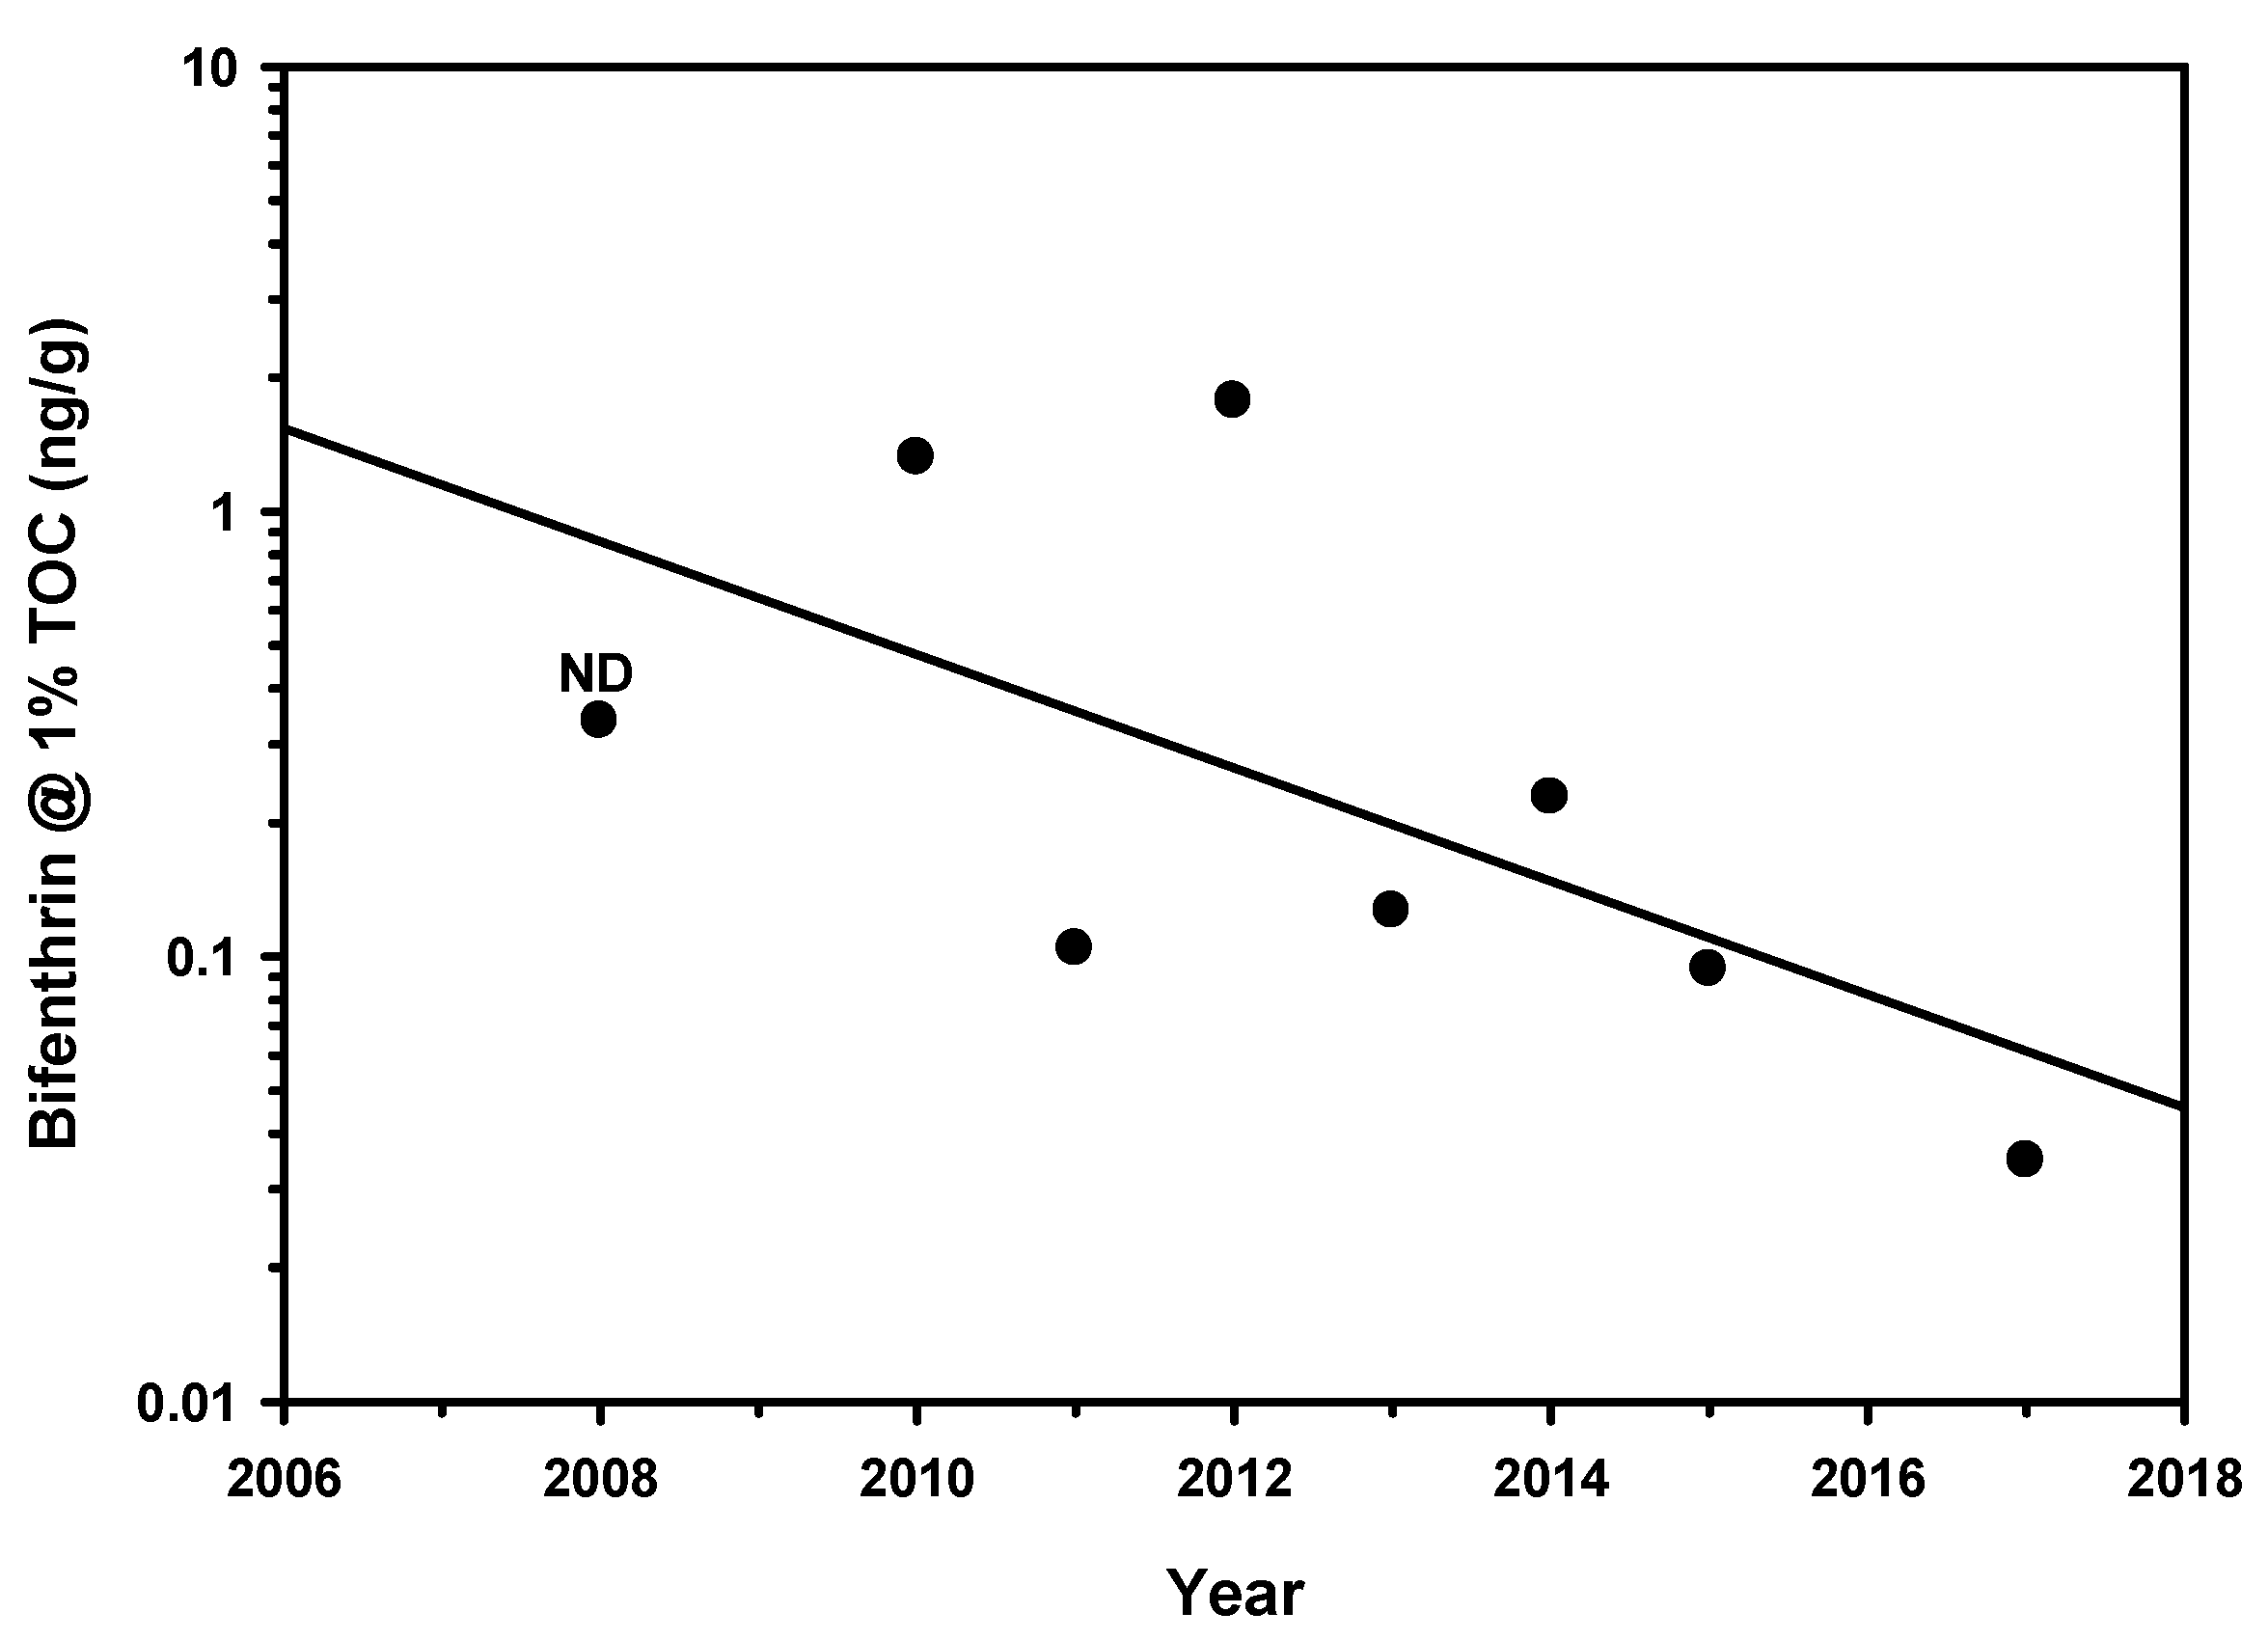
Figure 11.
Dual Storm Drain at Opal, Parkside Way (r2 = 0.577, p = 0.080).
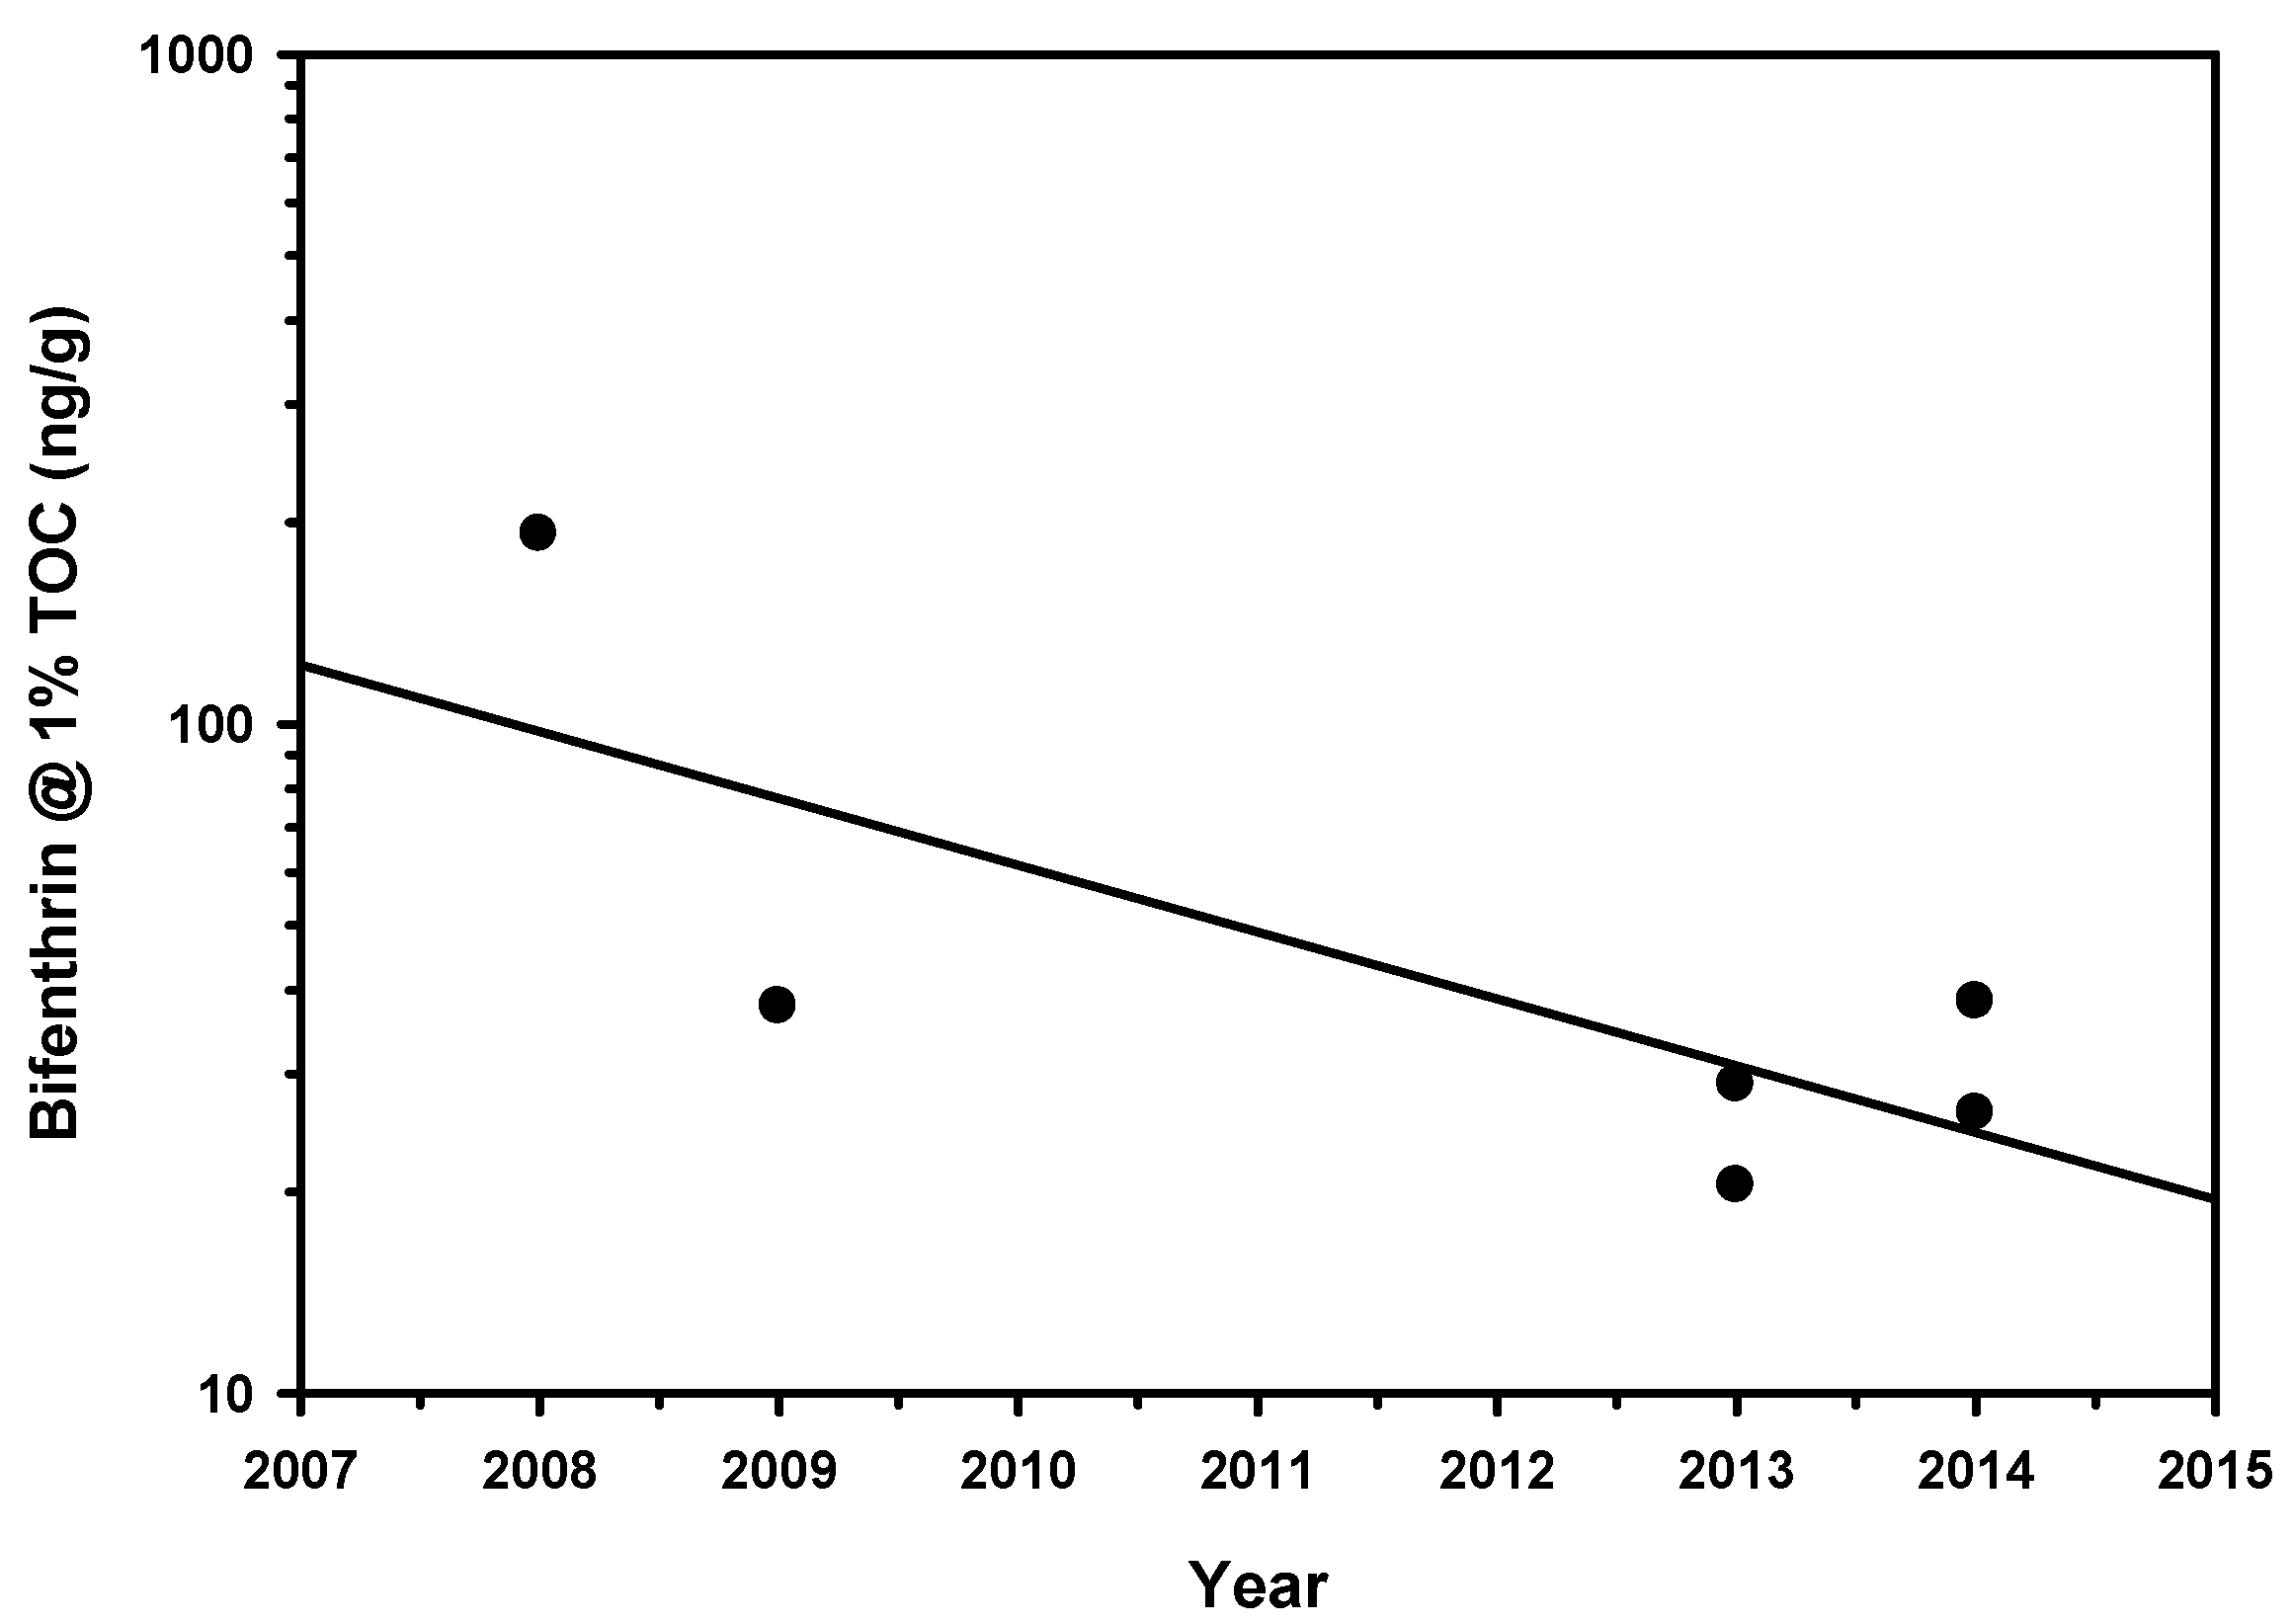
Figure 12.
Espinosa Slough upstream of Alisal Slough (r2 = 0.792, p = 0.007).

Figure 13.
Guadalupe Cr at USGS Station 11169025 (r2 = 0.362, p = 0.086).
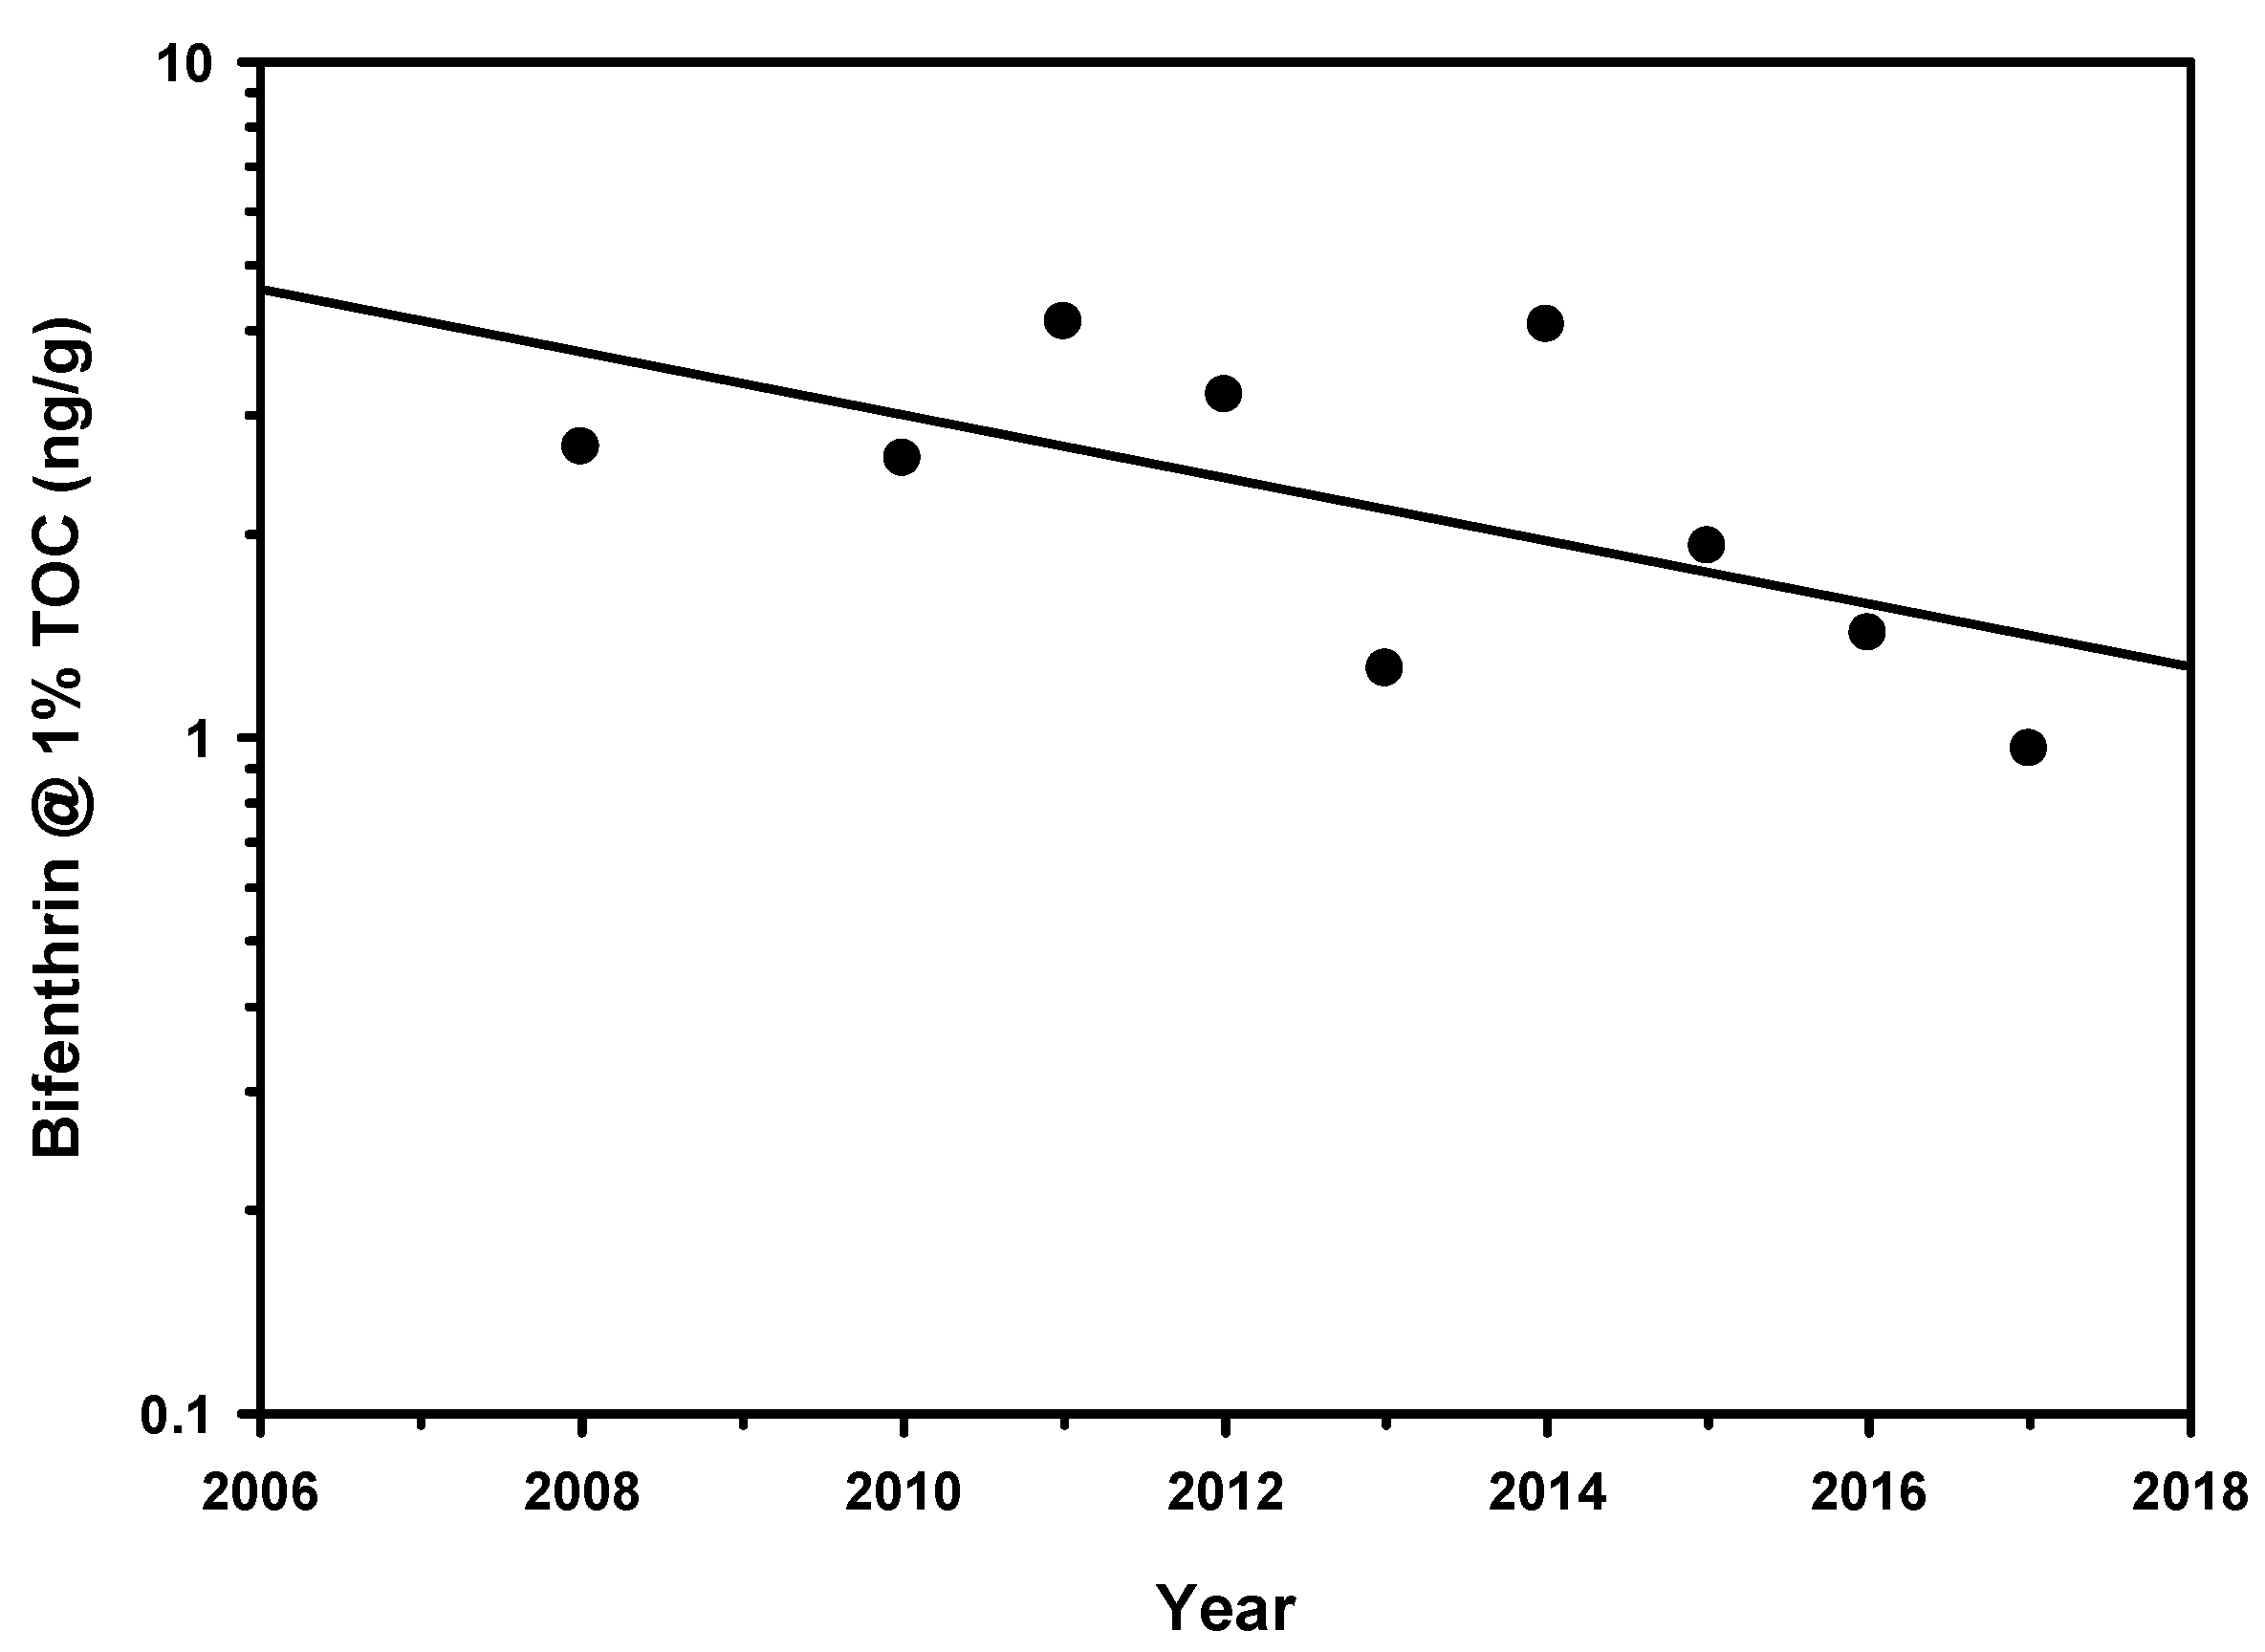
Figure 14.
Ingram Creek at River Road (r2 = 0.473, p = 0.009).
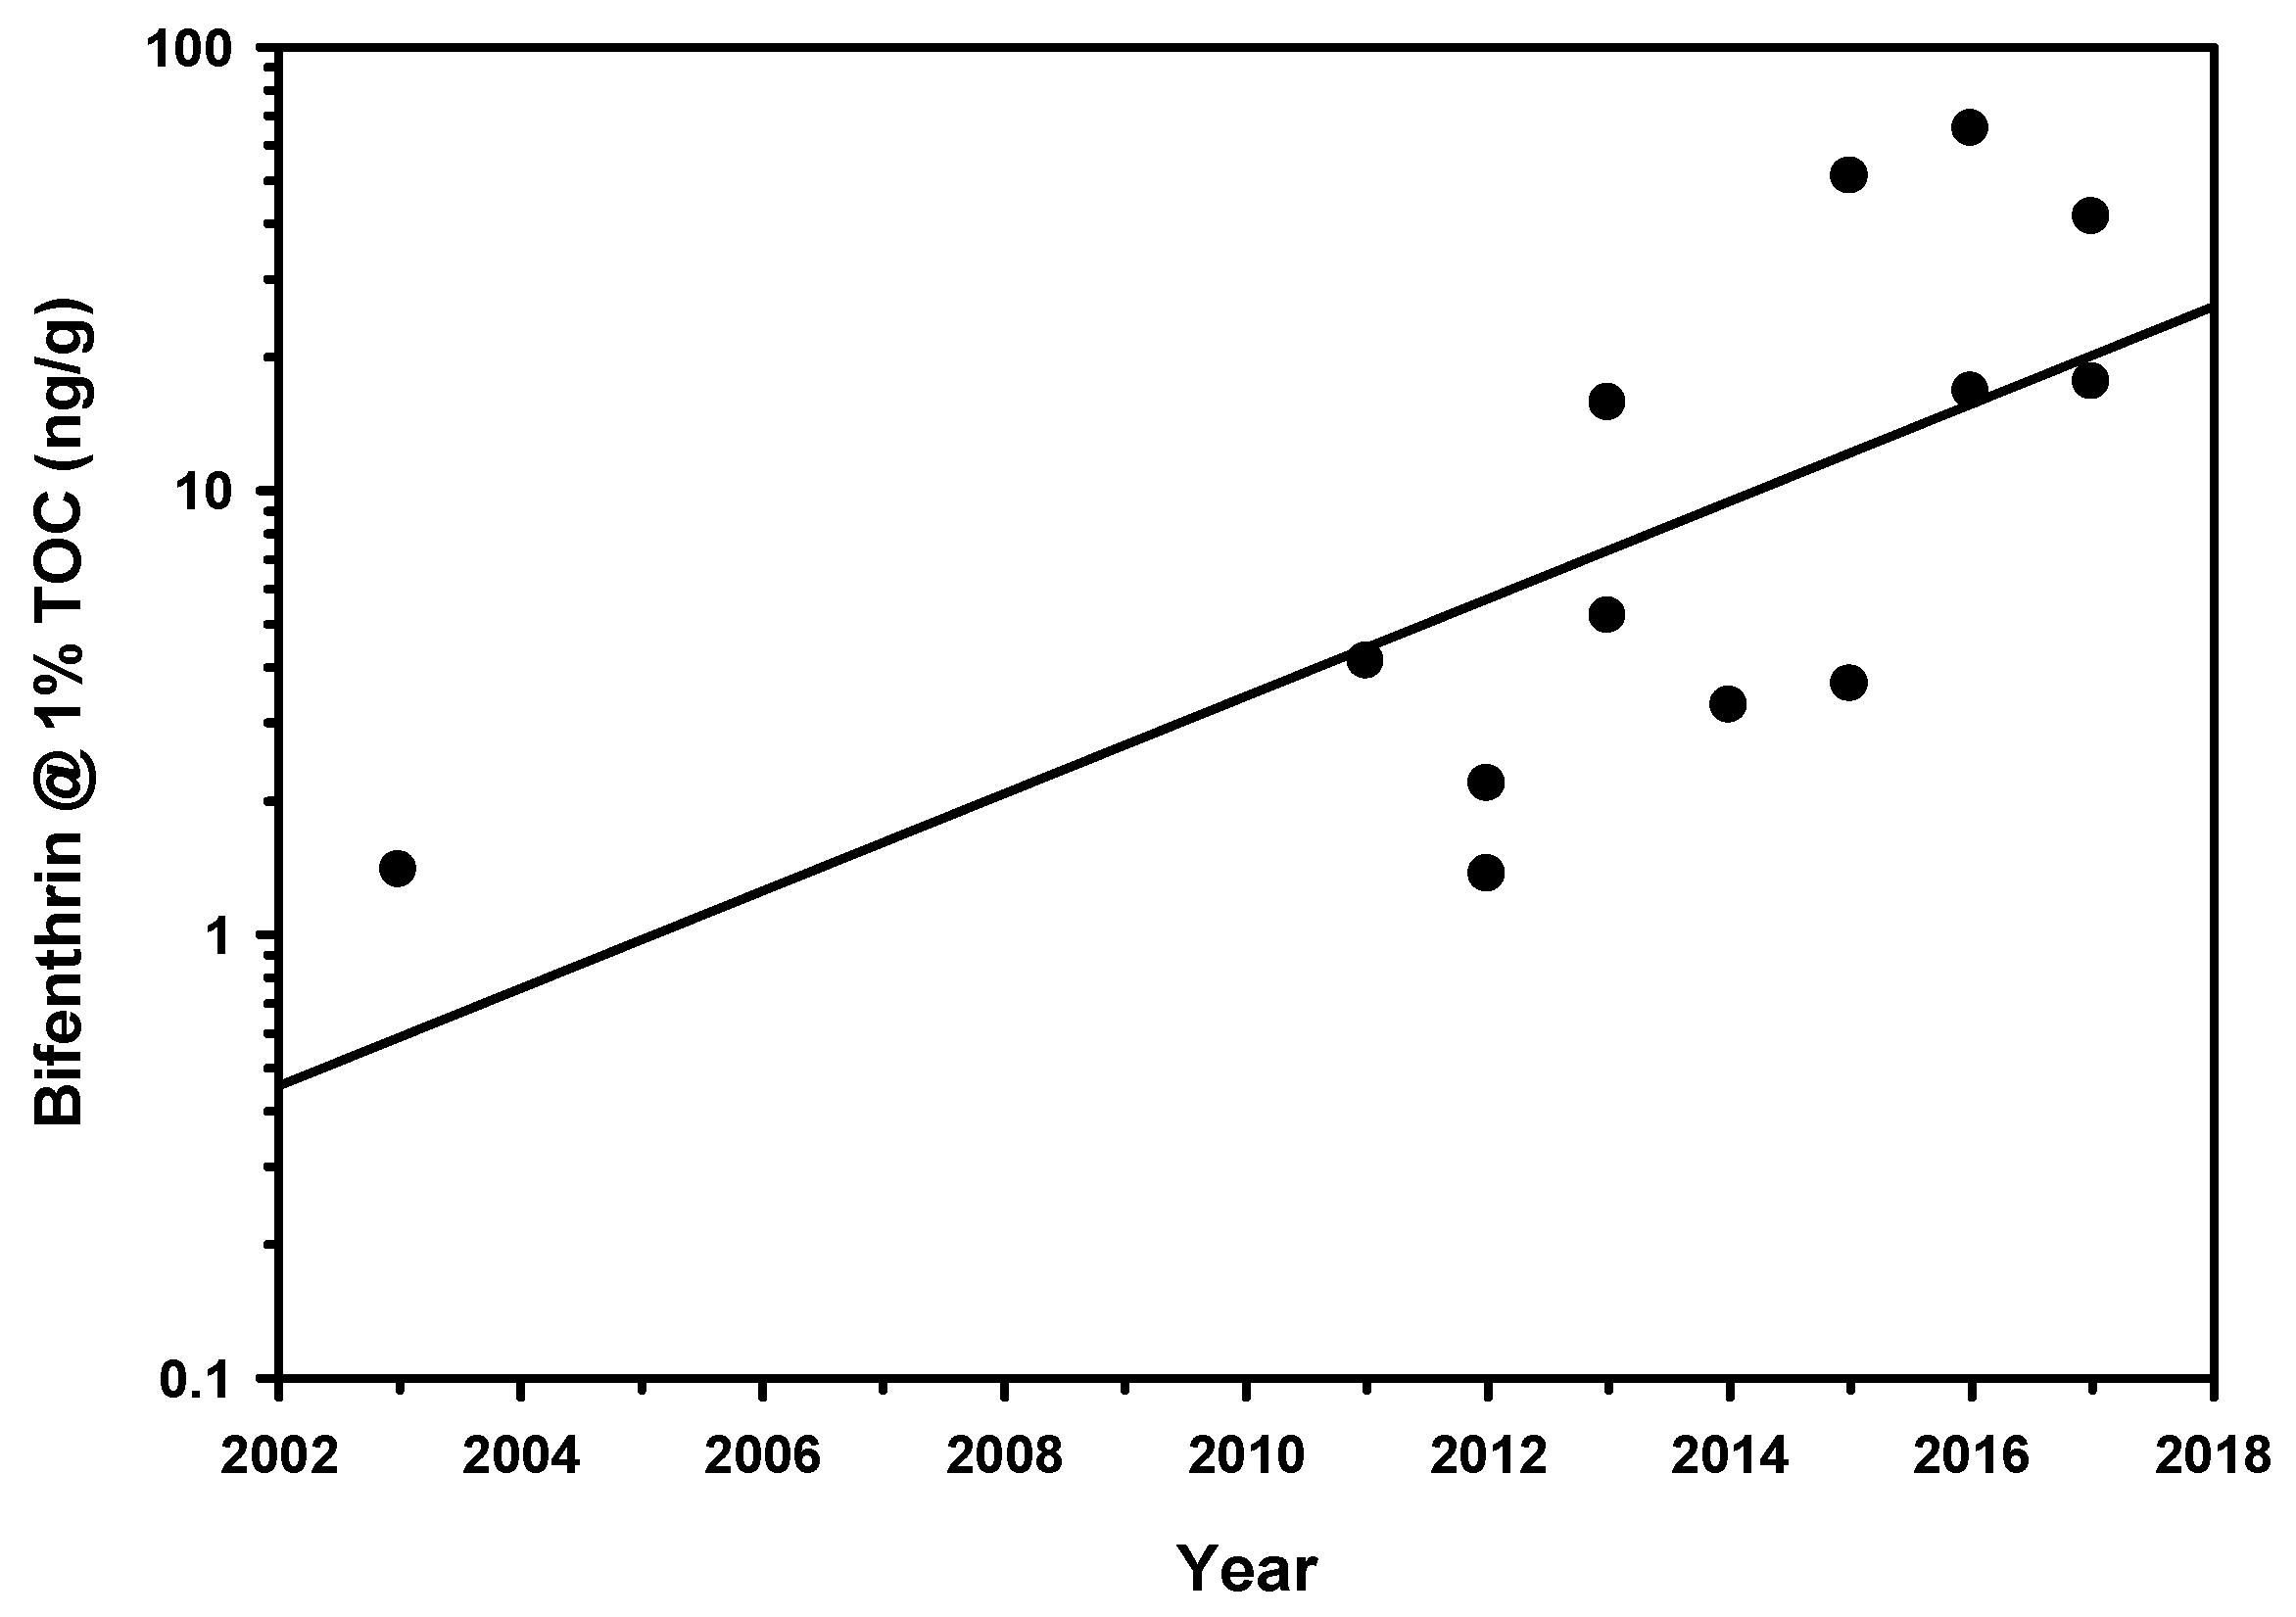
Figure 15.
Lagunitas Creek at Coast Guard Station (r2 = 0.535, p = 0.039).
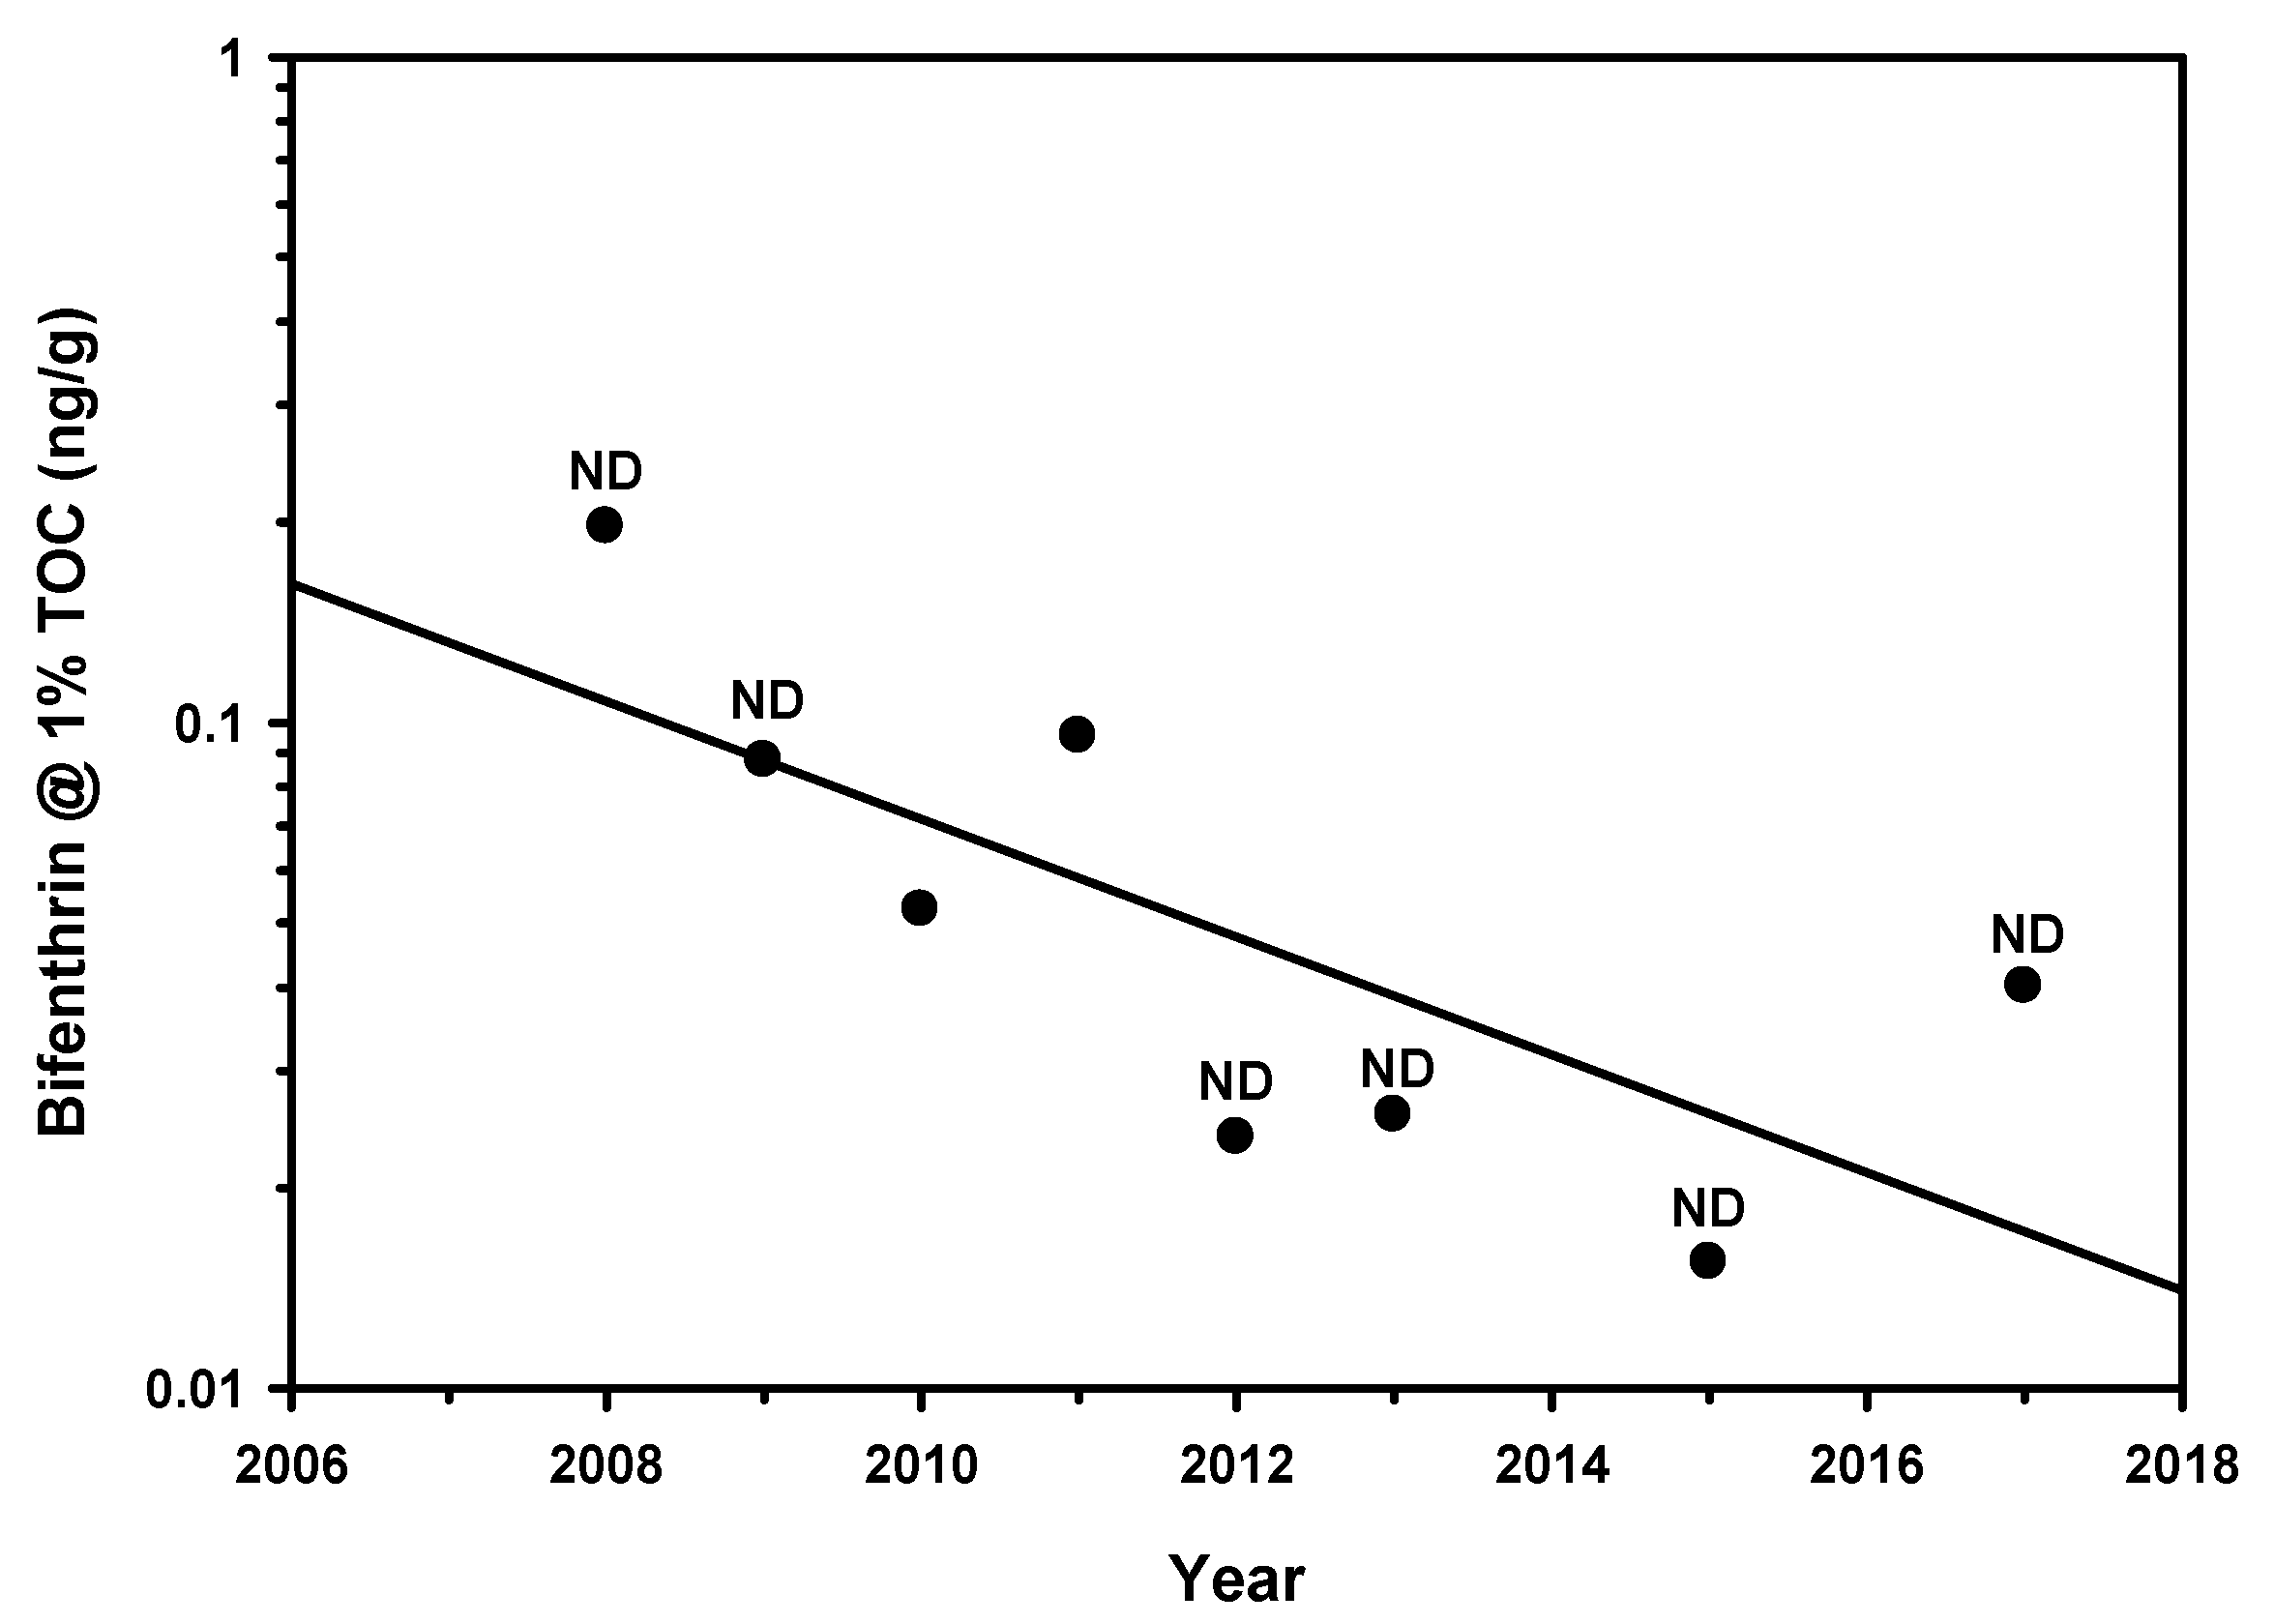
Figure 16.
Laurel Creek at Pintail Drive (r2 = 0.626, p = 0.011).
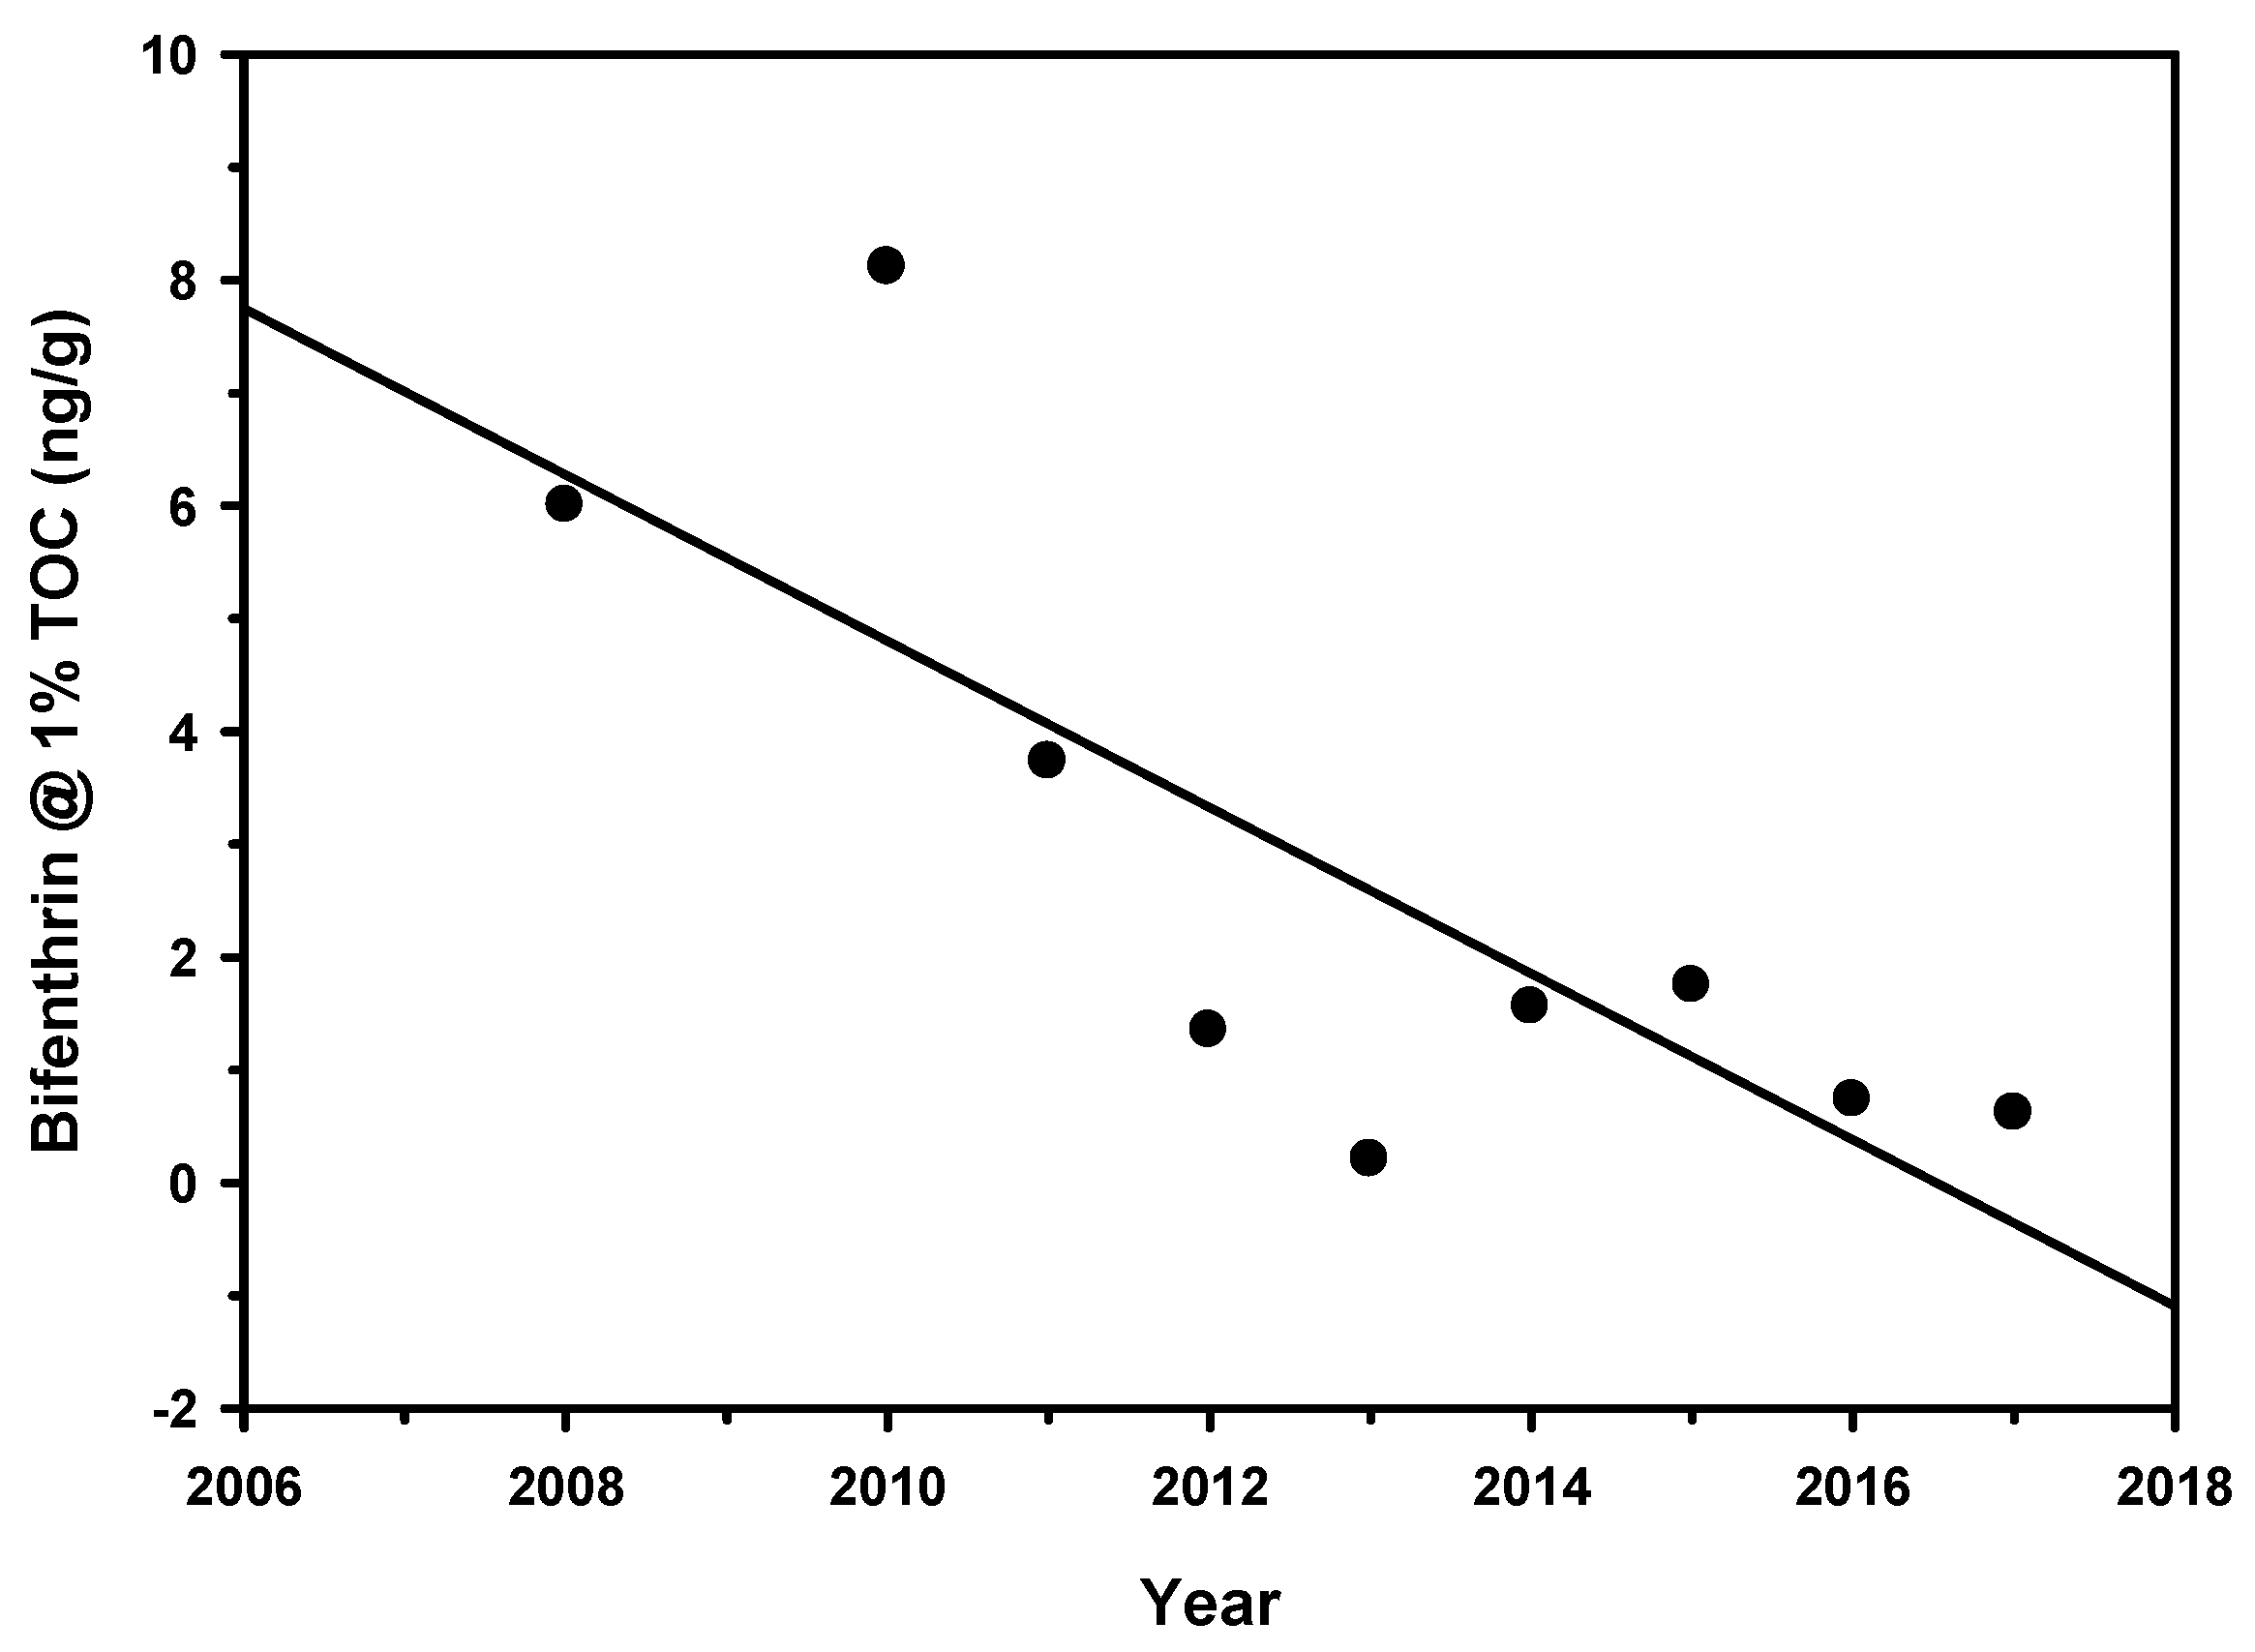
Figure 17.
Llagas Creek at Southside (r2 = 0.653, p = 0.052).
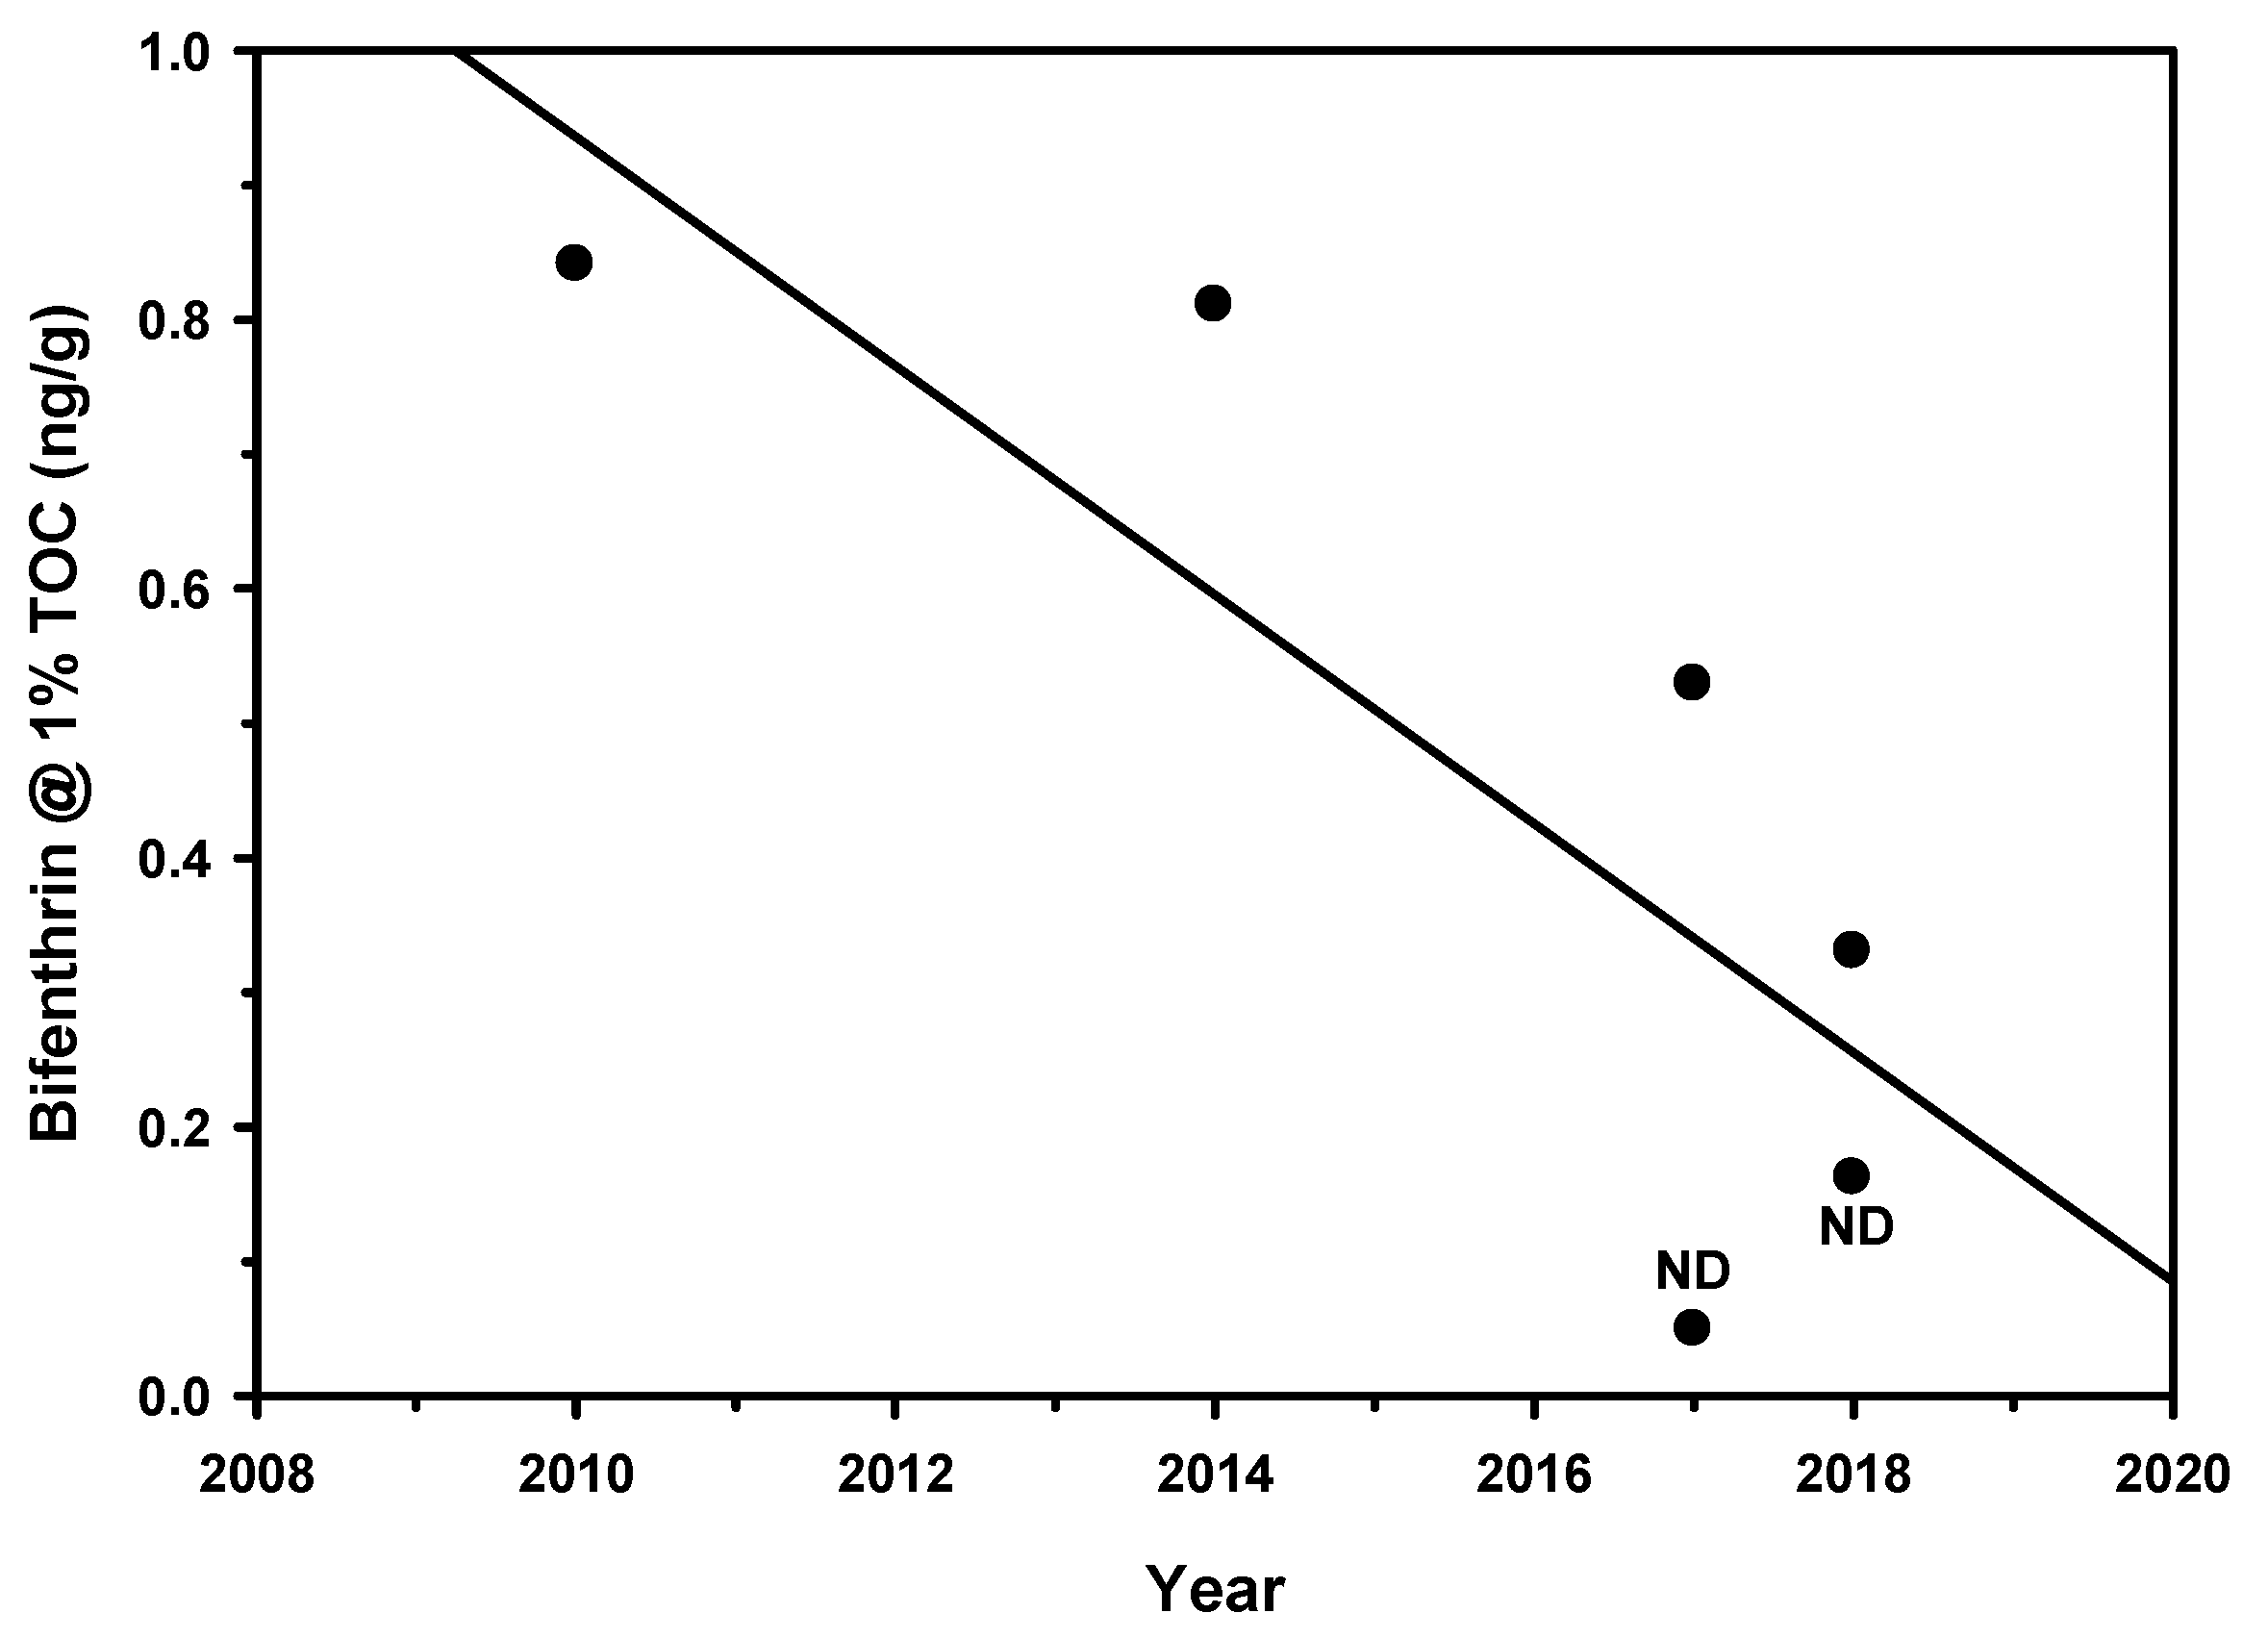
Figure 18.
Marsh Creek at East Cypress Crossing (r2 = 0.468, p = 0.029).

Figure 19.
Mokelumne River at New Hope Road (r2 = 0.721, p = 0.032).

Figure 20.
Orestimba Creek at River Road (r = 0.577, p = 0.006).
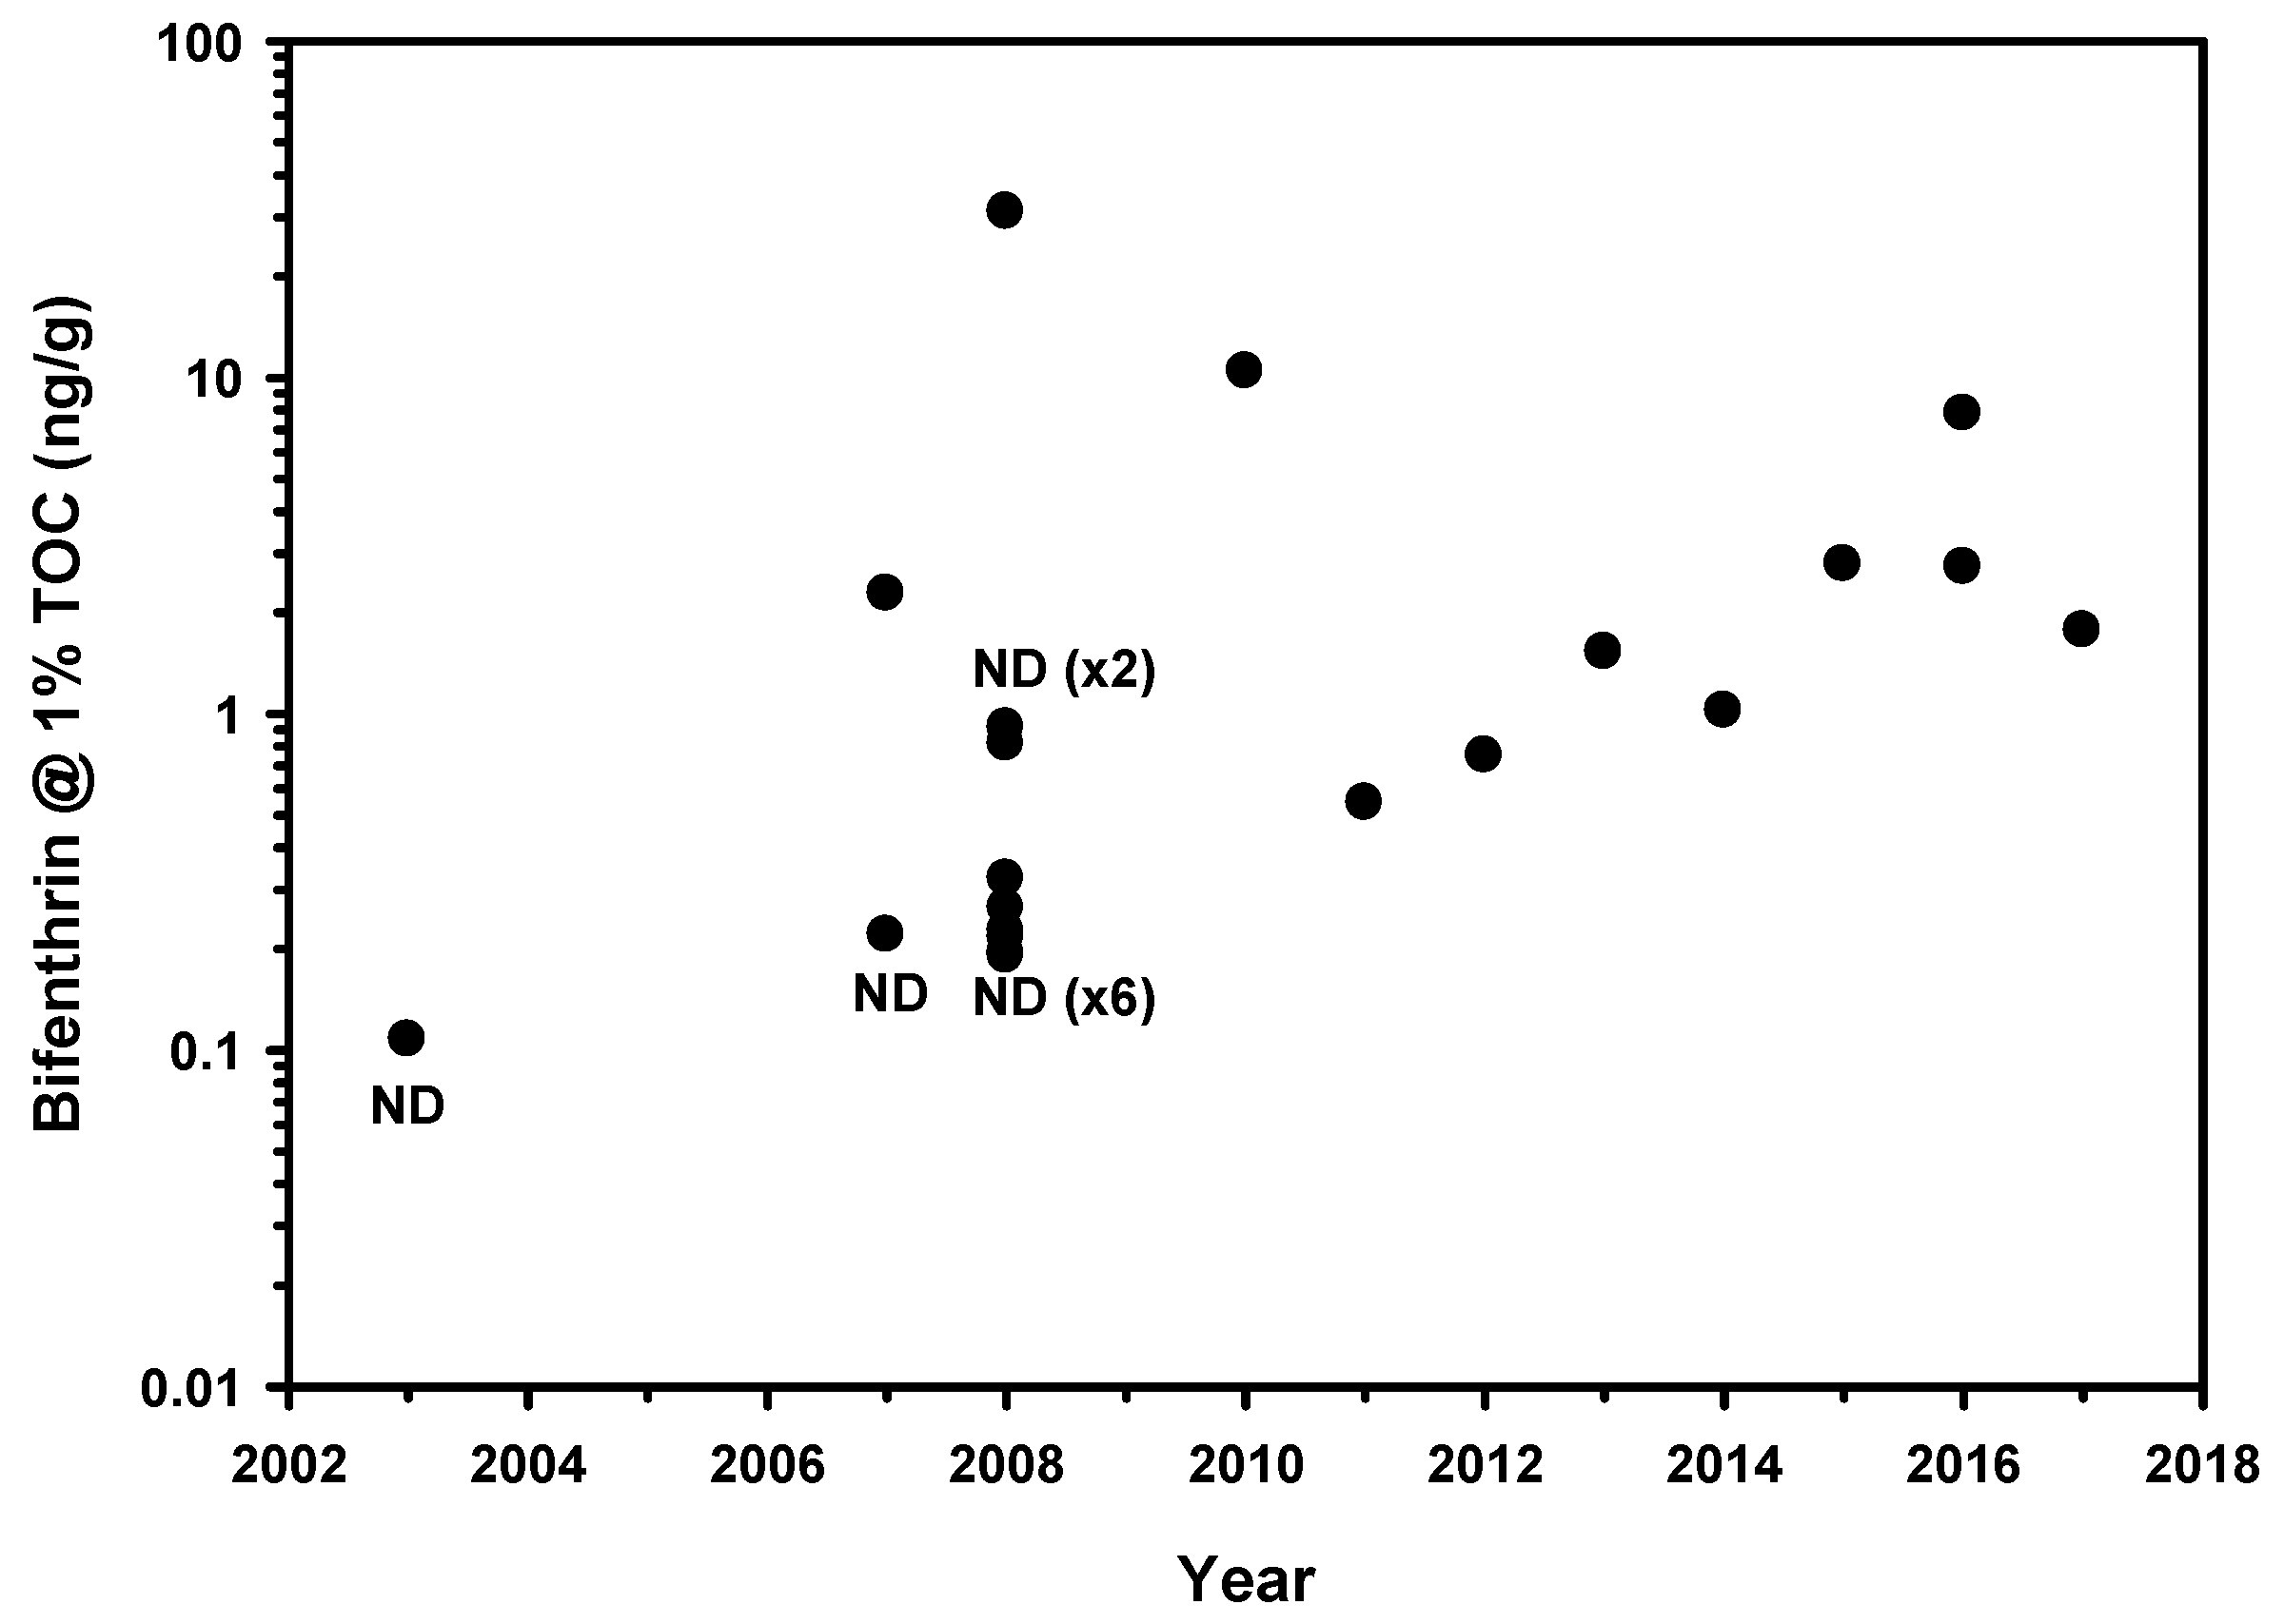
Figure 21.
Oso Flaco Creek at Oso Flaco Lake Road (r2 = 0.714, p = 0.017).

Figure 22.
Palo Verde Lagoon—LG1 (r2 = 0.325, p = 0.042).

Figure 23.
Salsipuedes Cr downstream of Corralitos Cr (r2 = 0.559, p = 0.053).
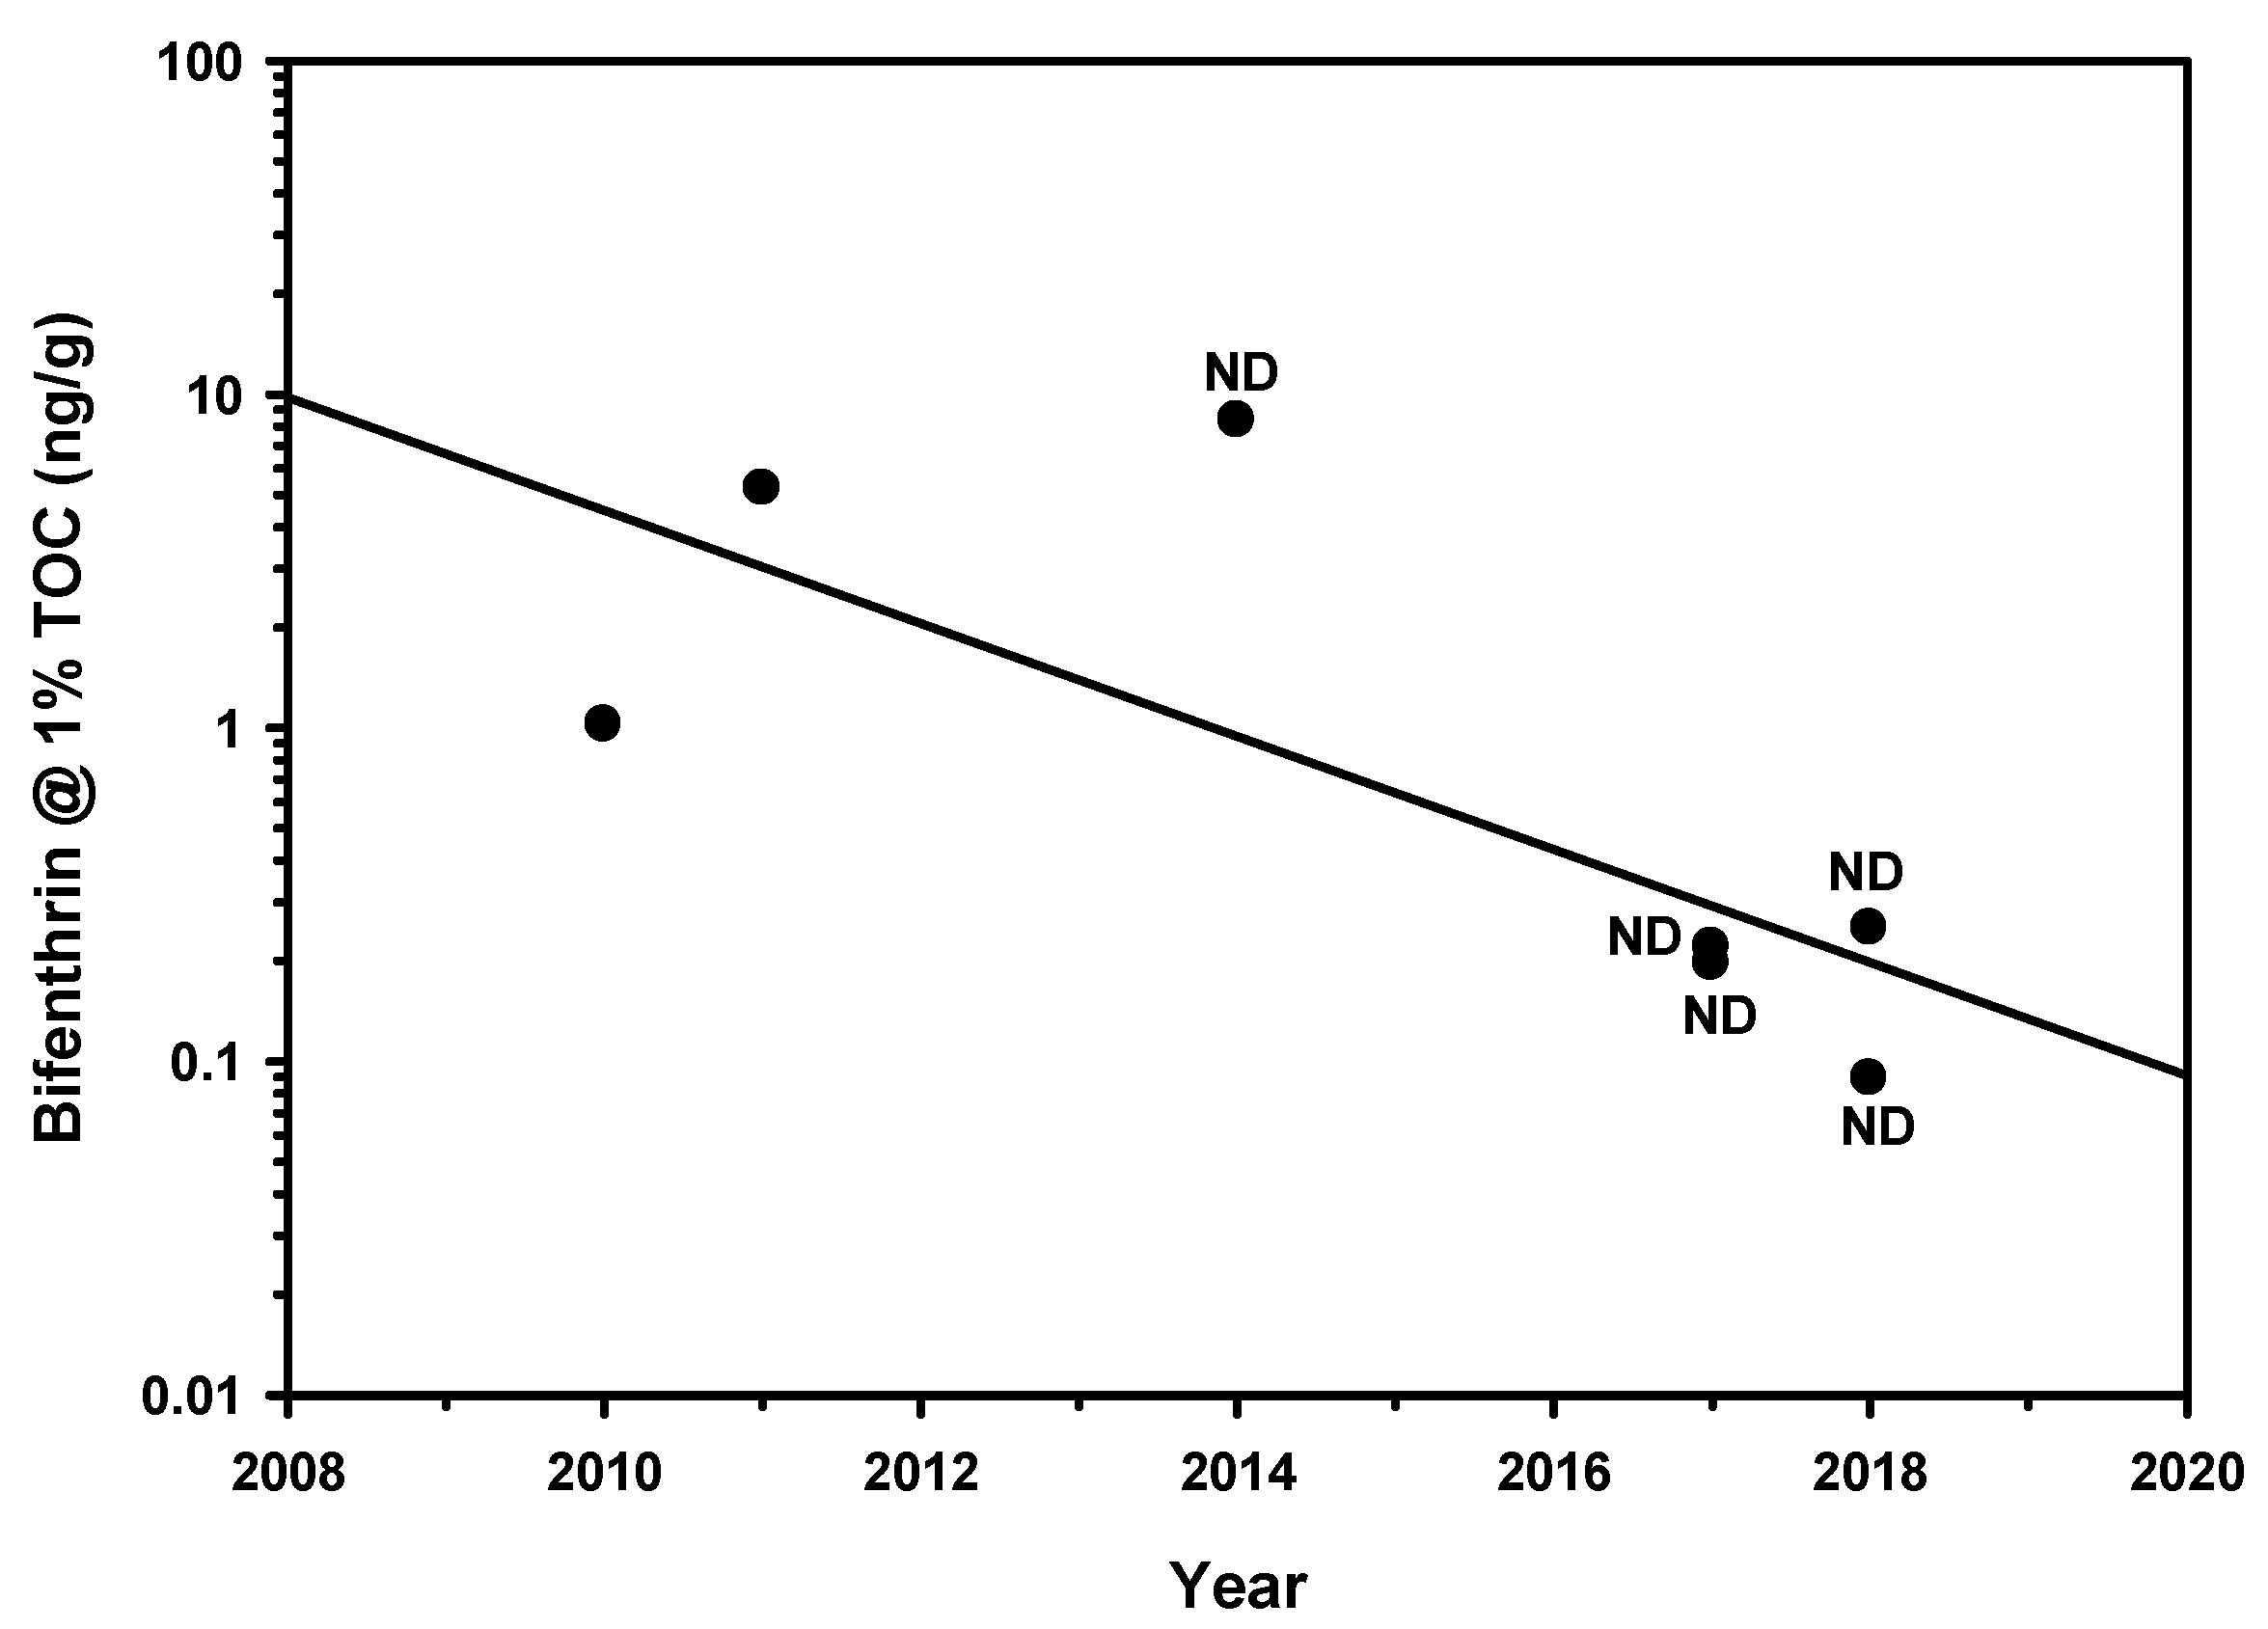
Figure 24.
San Luis Obispo Cr at San Luis Bay Drive (r2 = 0.466, p = 0.062).
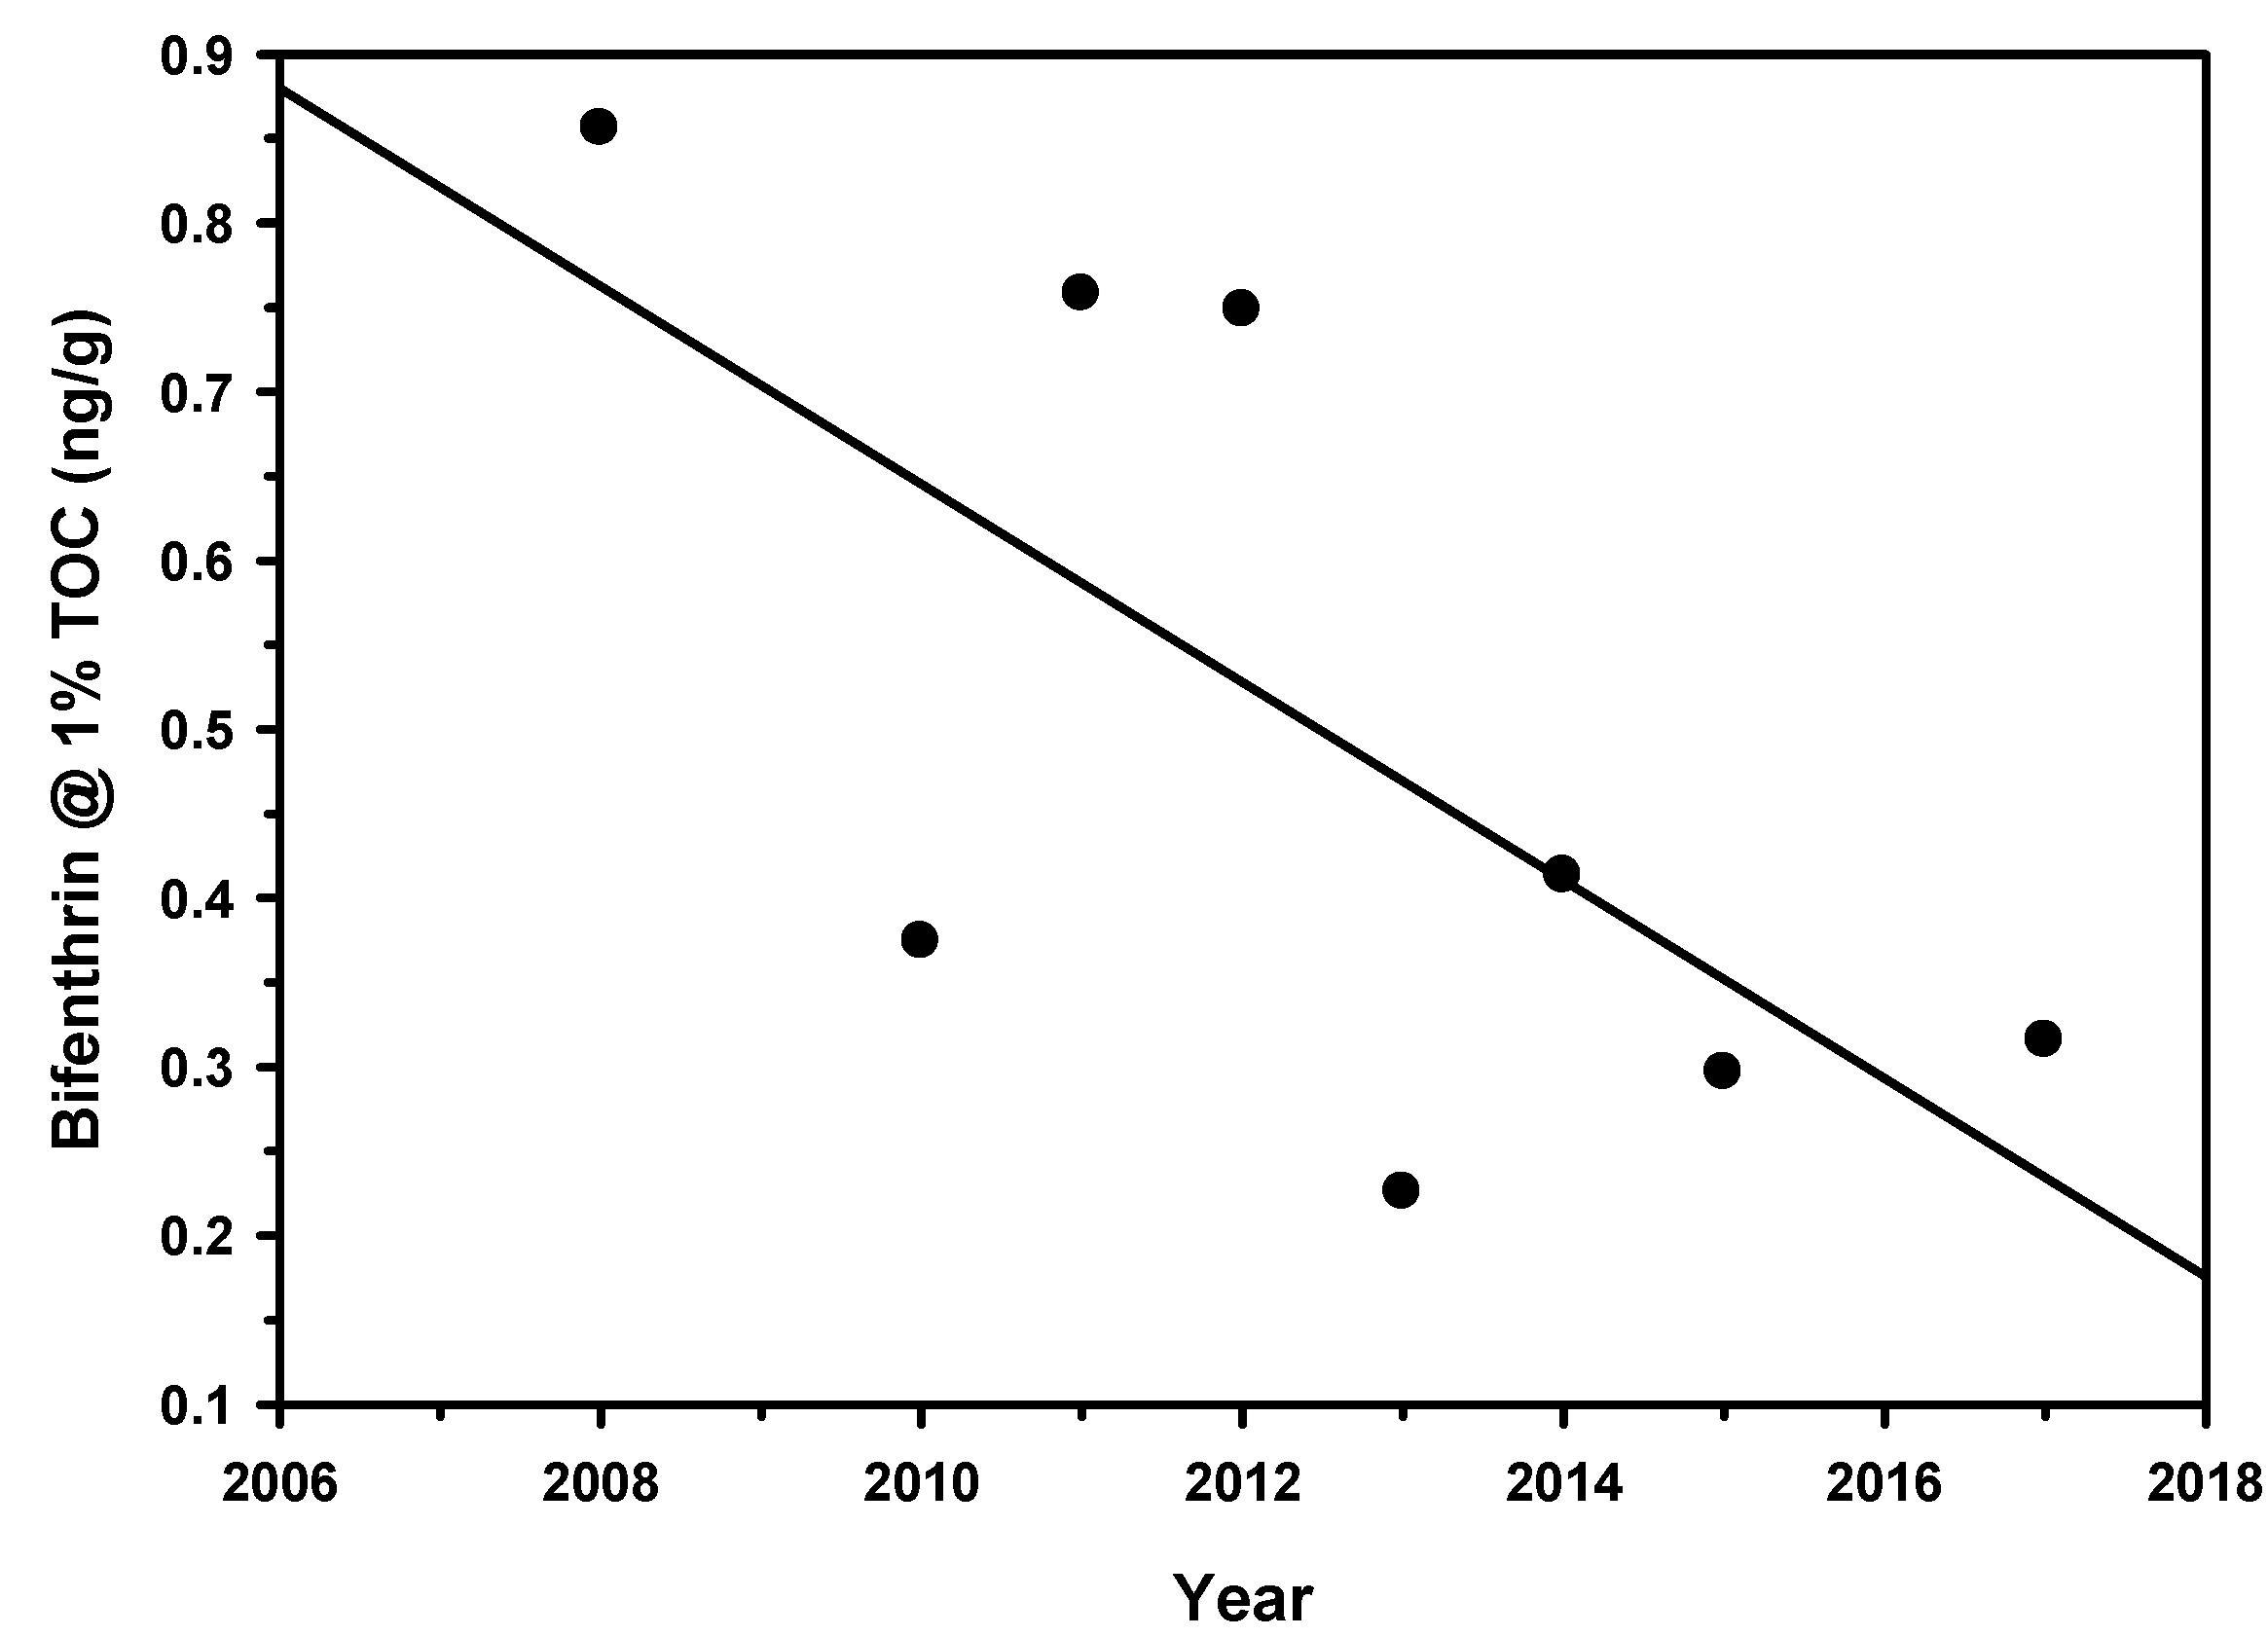
Figure 25.
Santa Clara River Estuary (r2 = 0.439, p = 0.074).
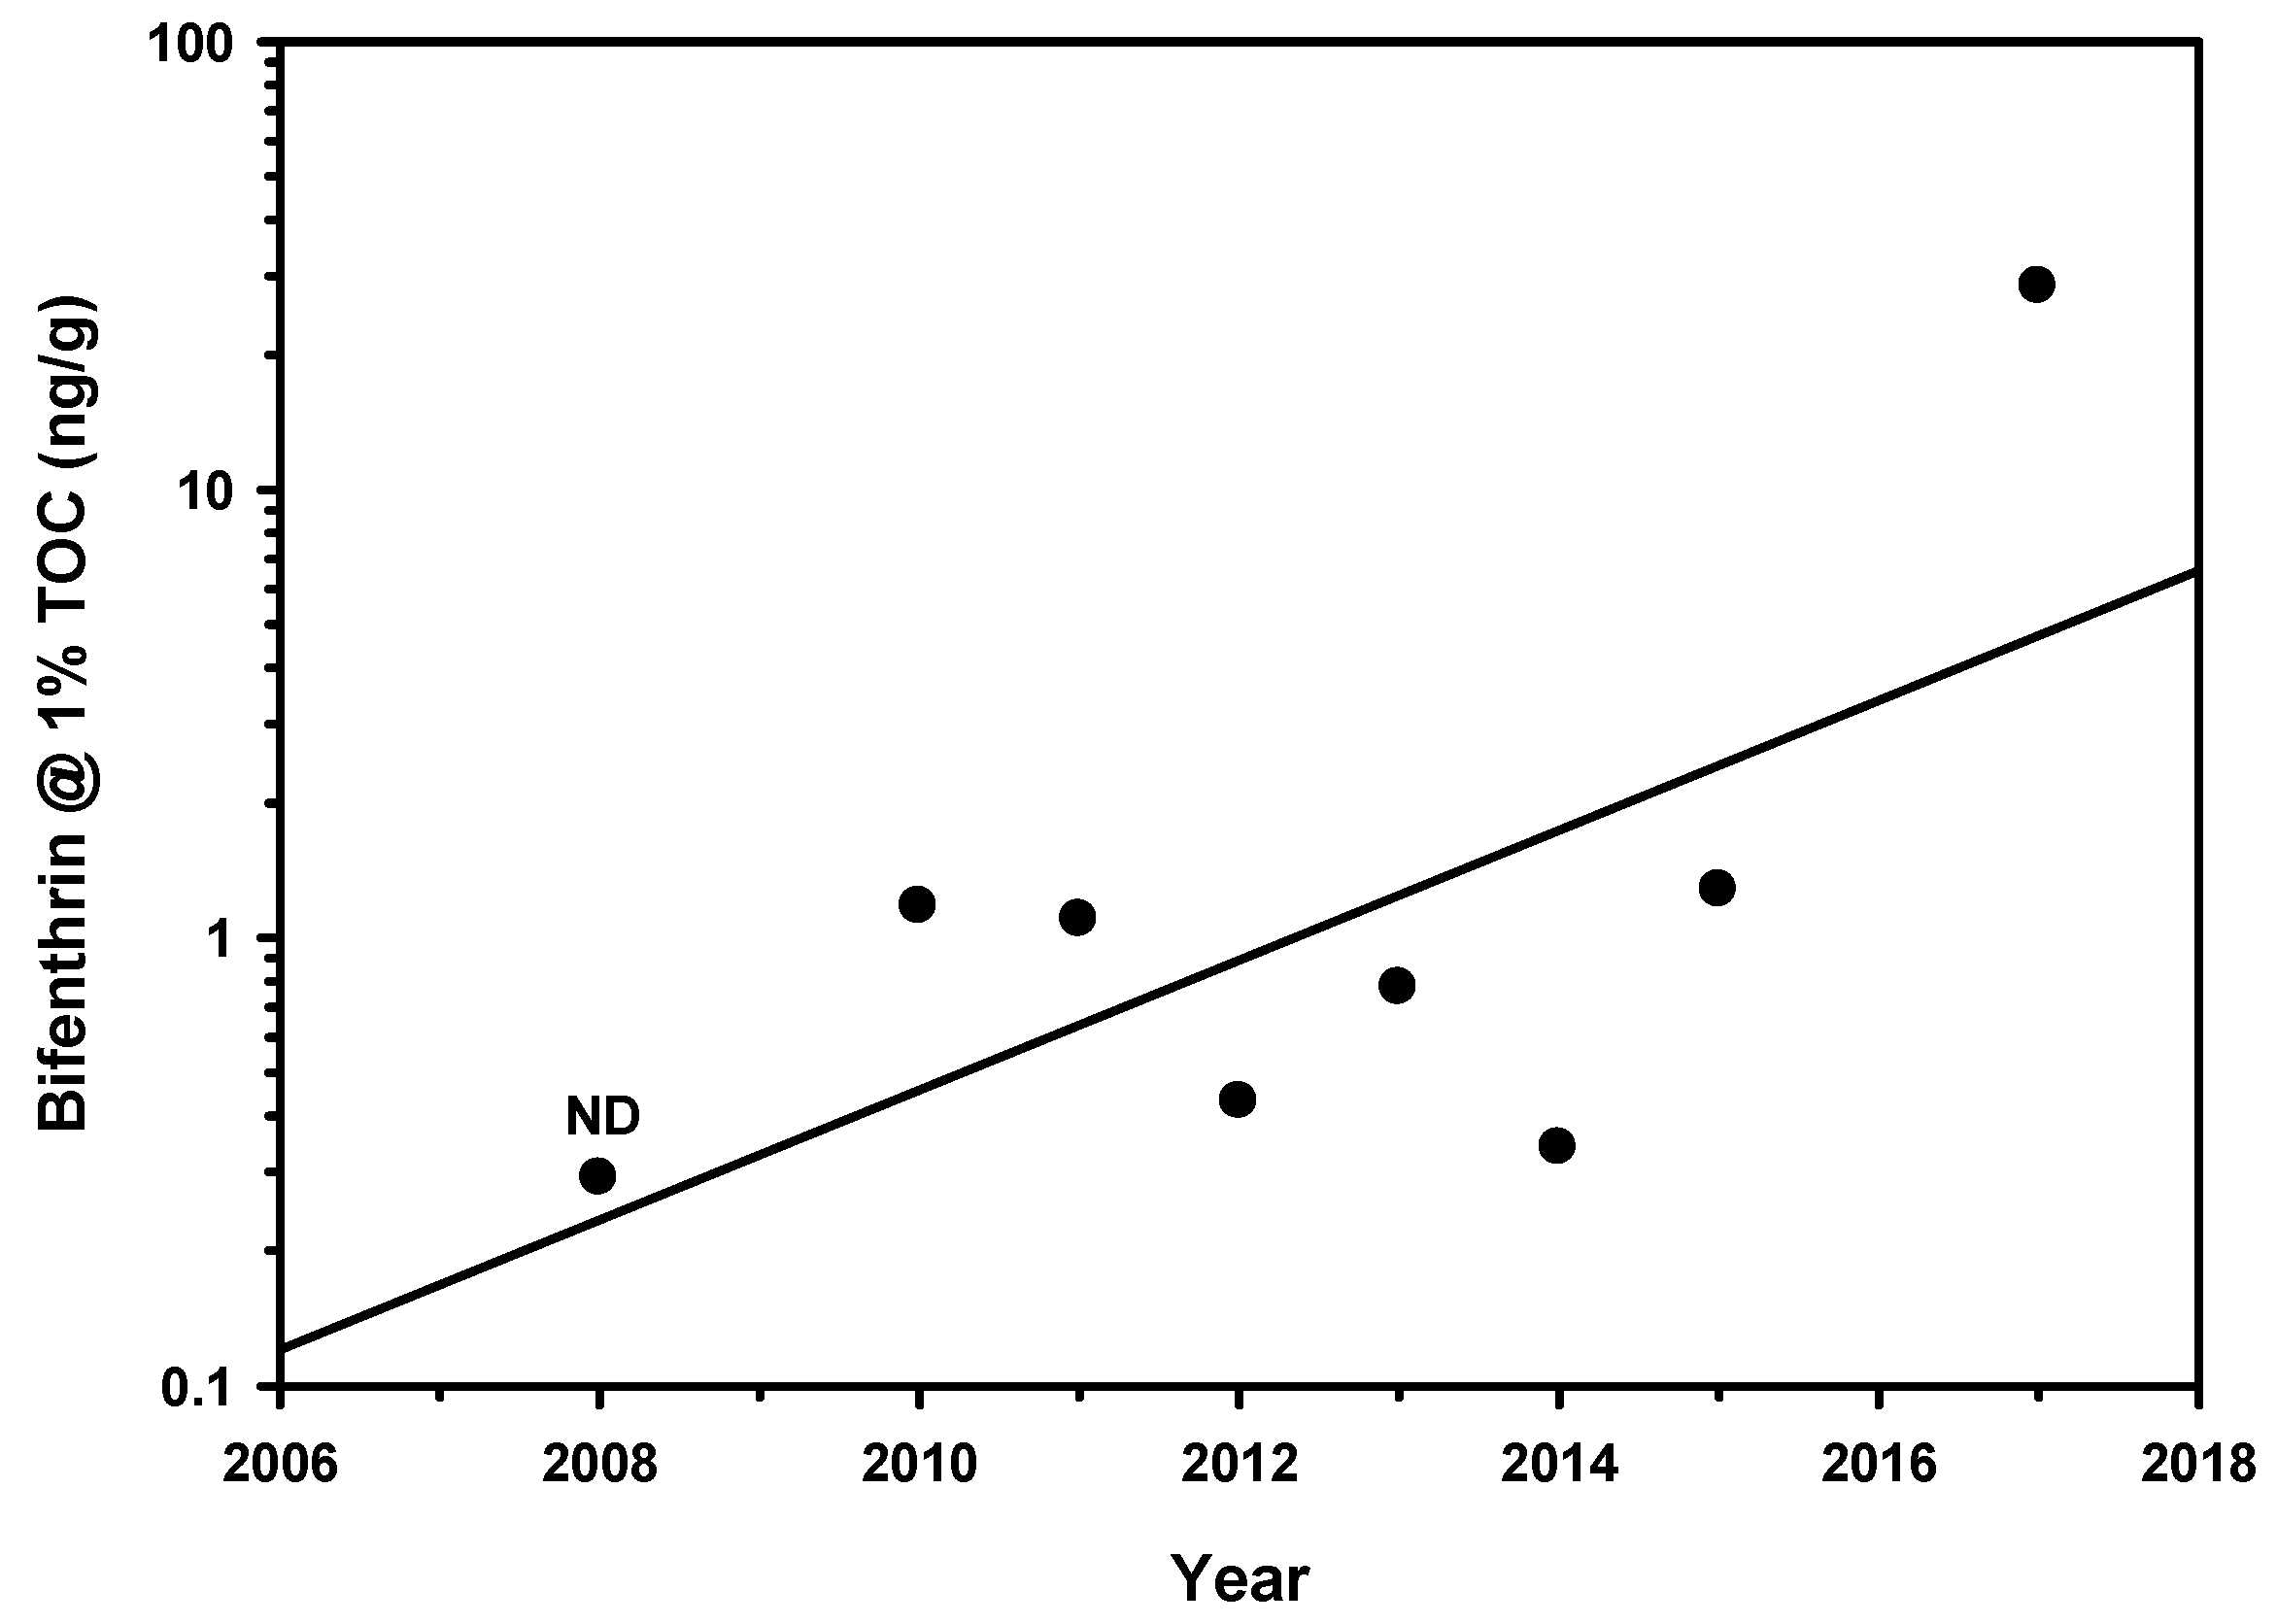
Figure 26.
Sutter Creek at Hwy 49 (r2 = 0.698, p = 0.038).
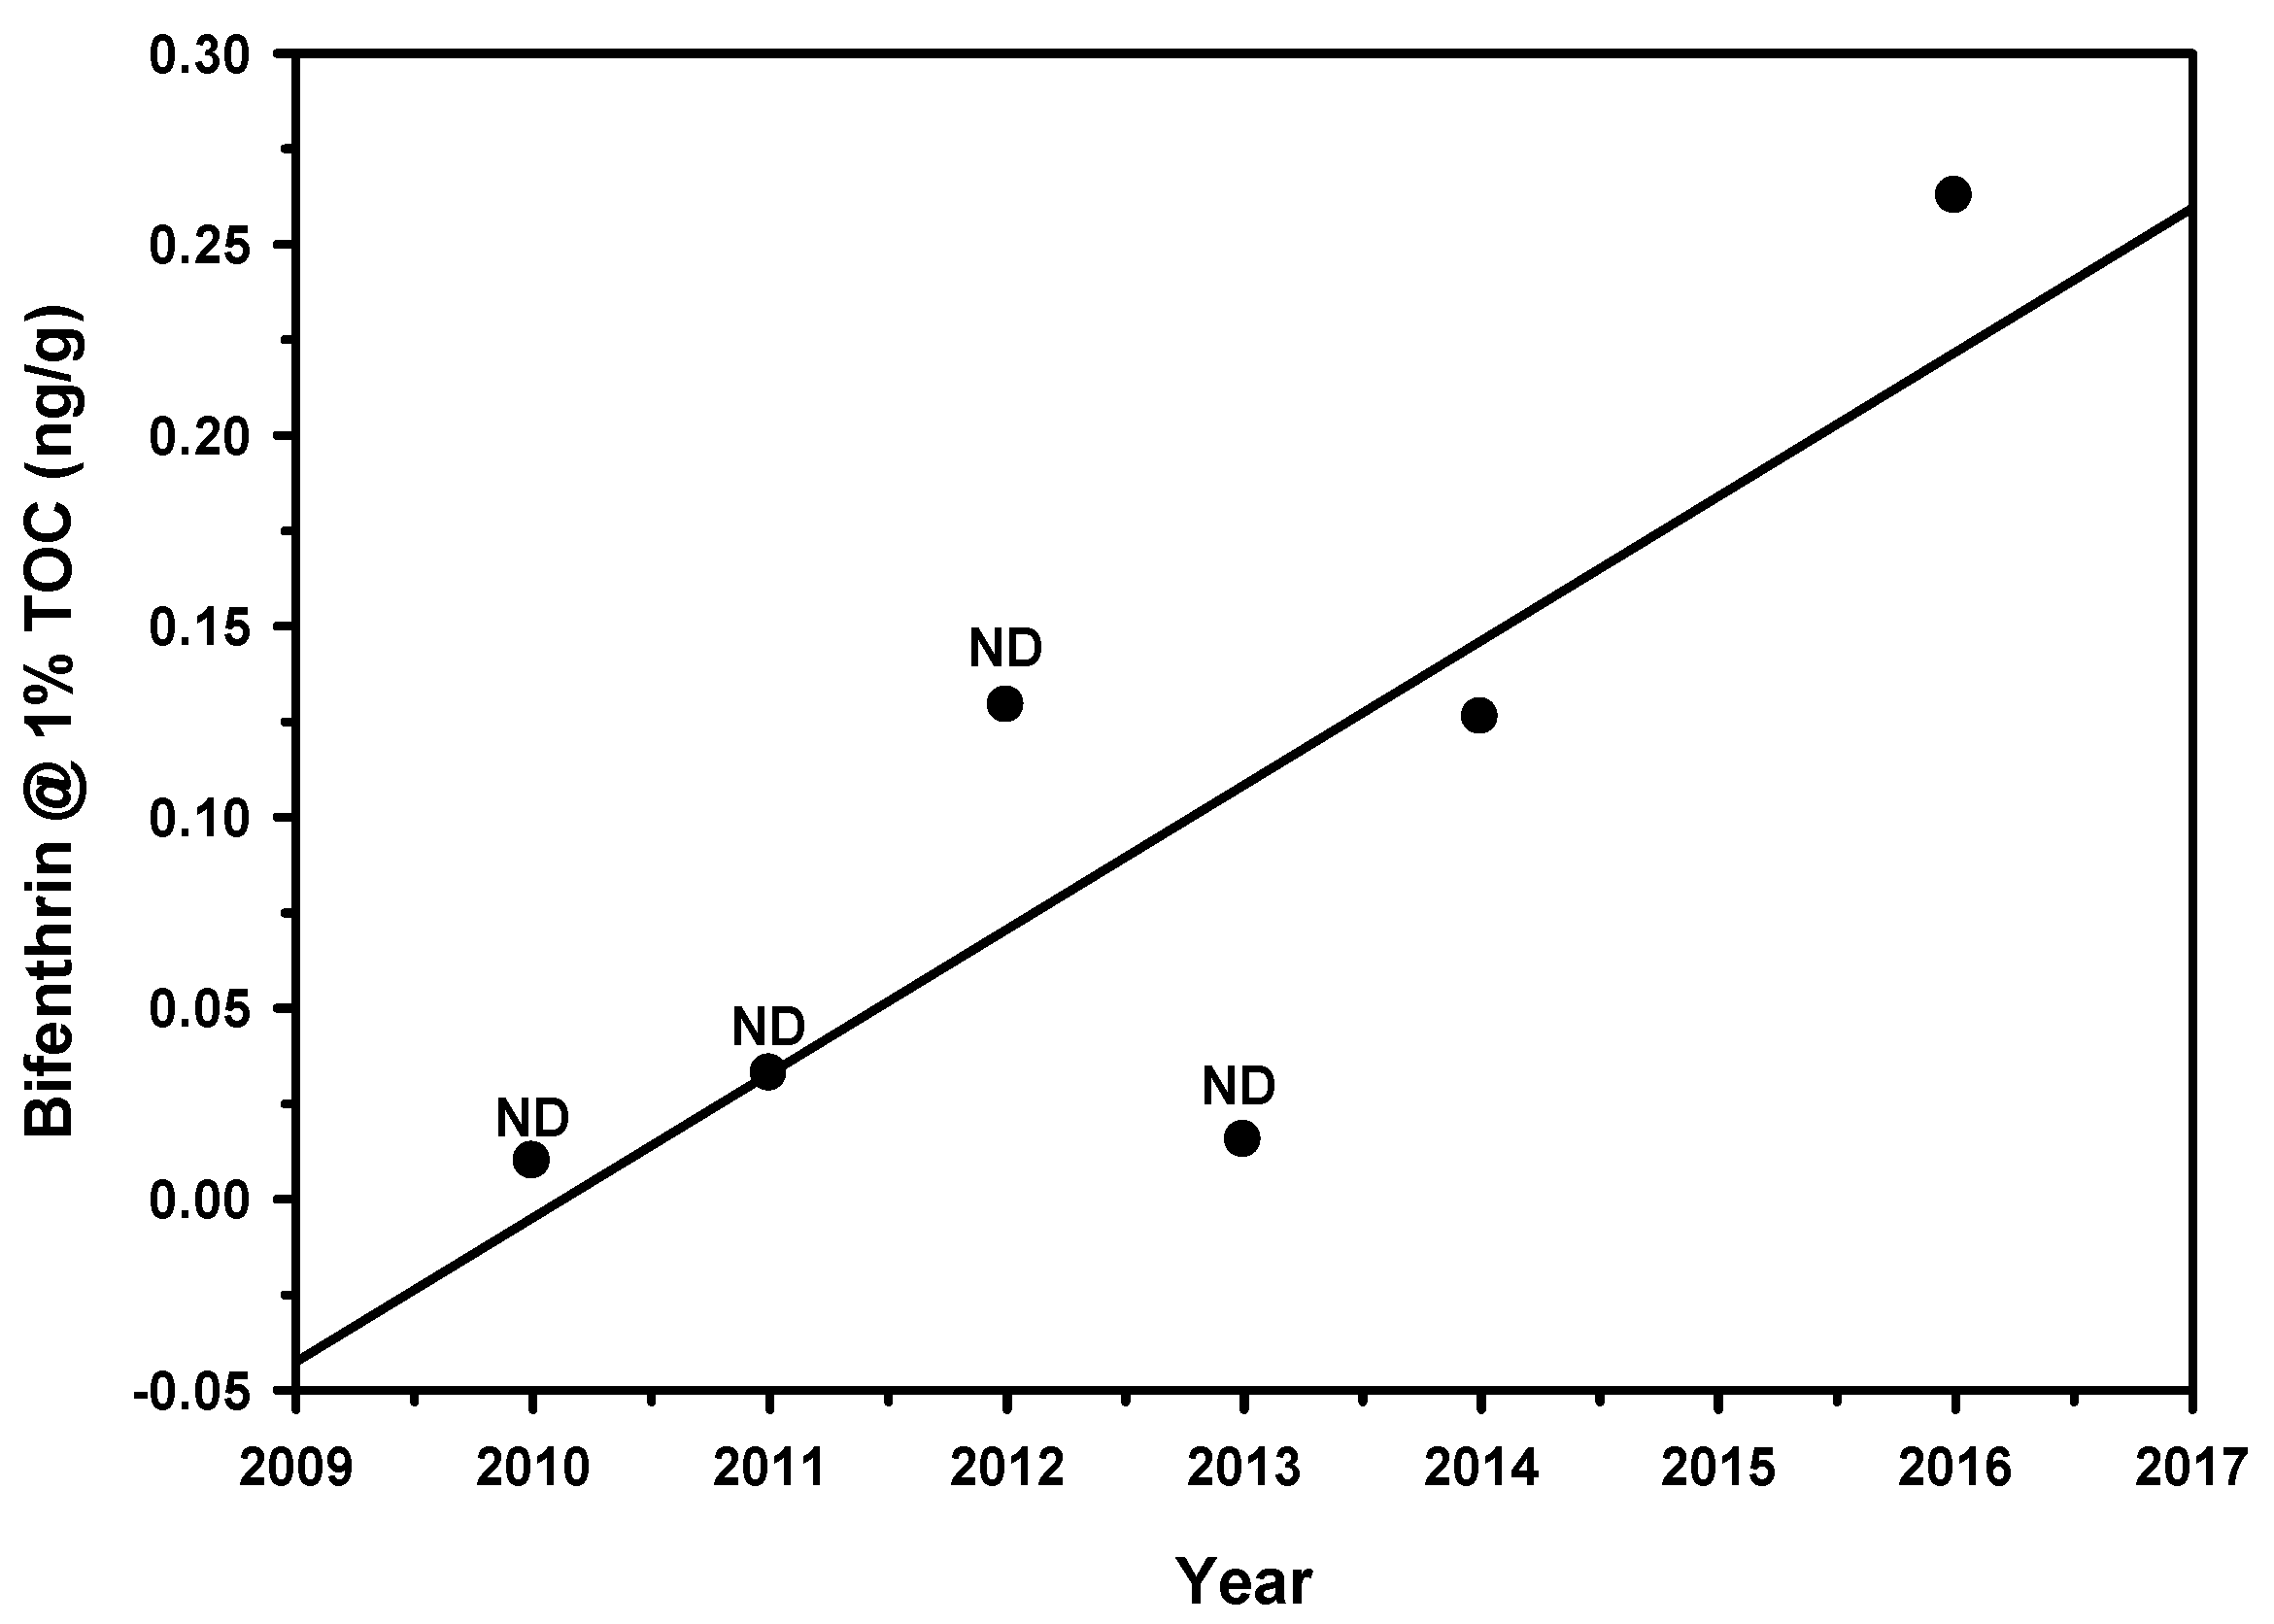
Figure 27.
Tembladero Slough at Monterey Dunes Way (r2 = 0.416, p = 0.044).
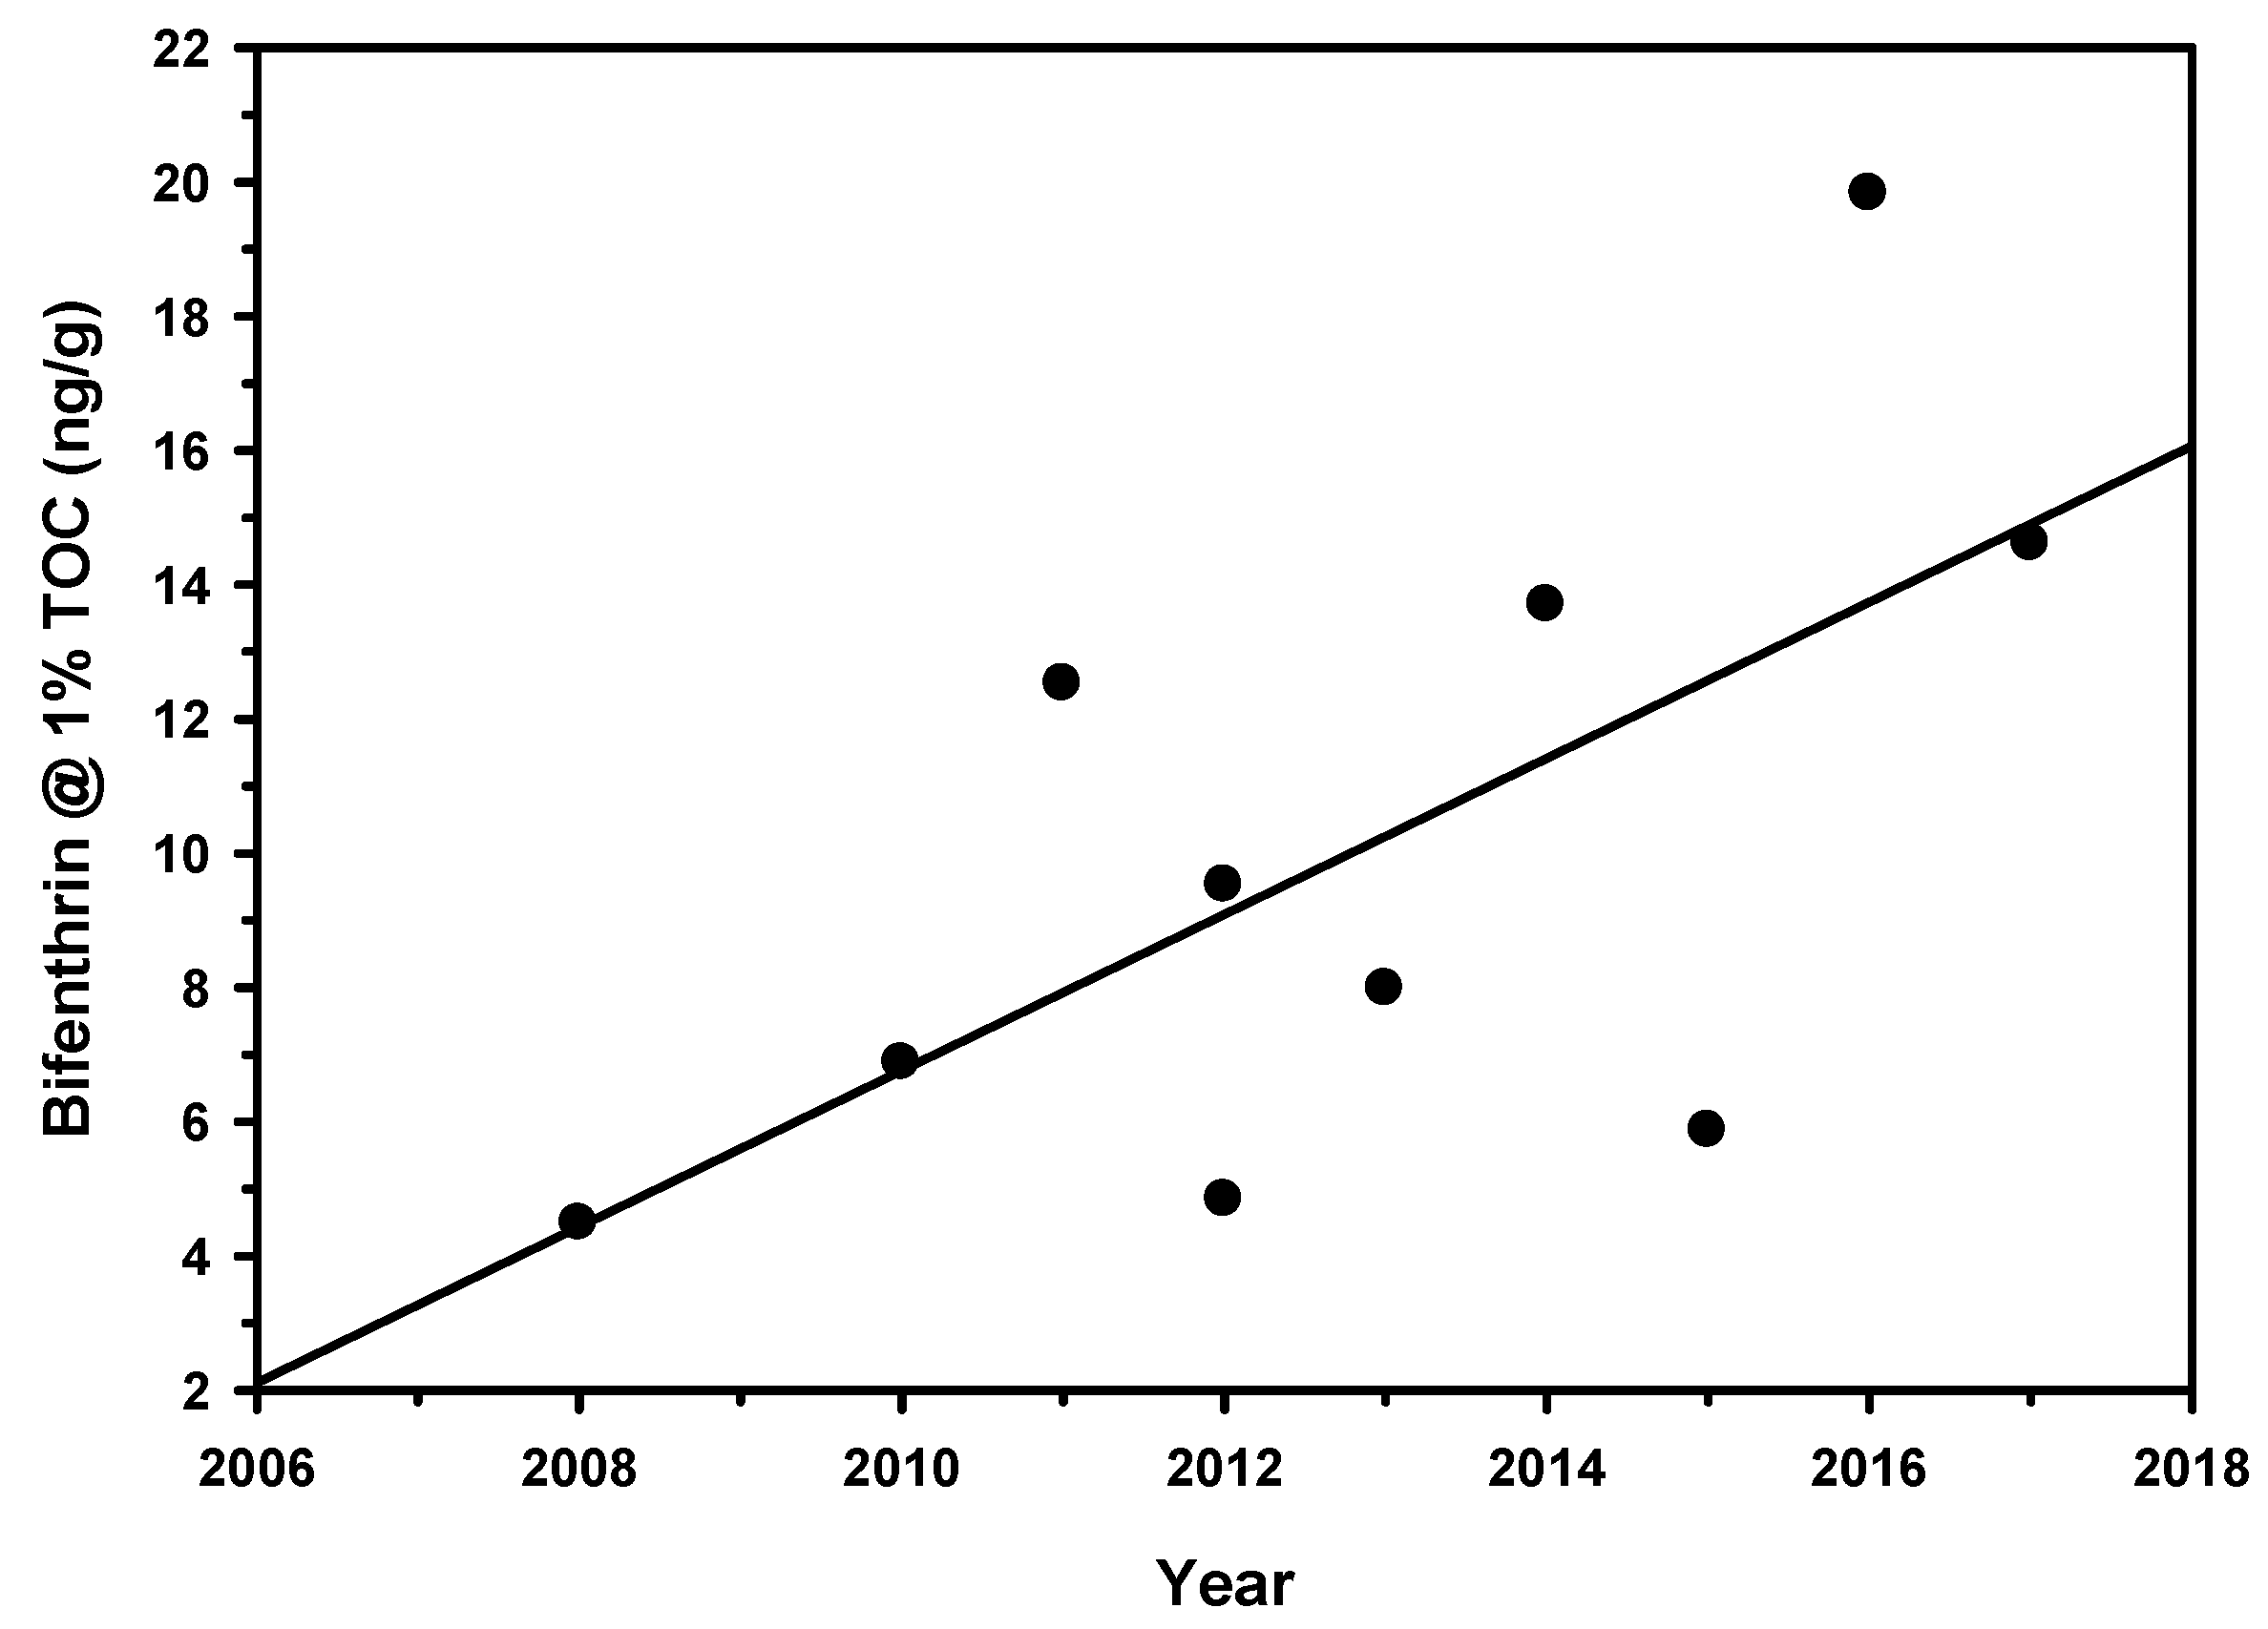
Figure 28.
Trout Creek (Truckee) near mouth (r2 = 0.677, p = 0.044).

Figure 29.
Walnut Creek at Concord Ave O.C. (r2 = 0.434, p = 0.054).
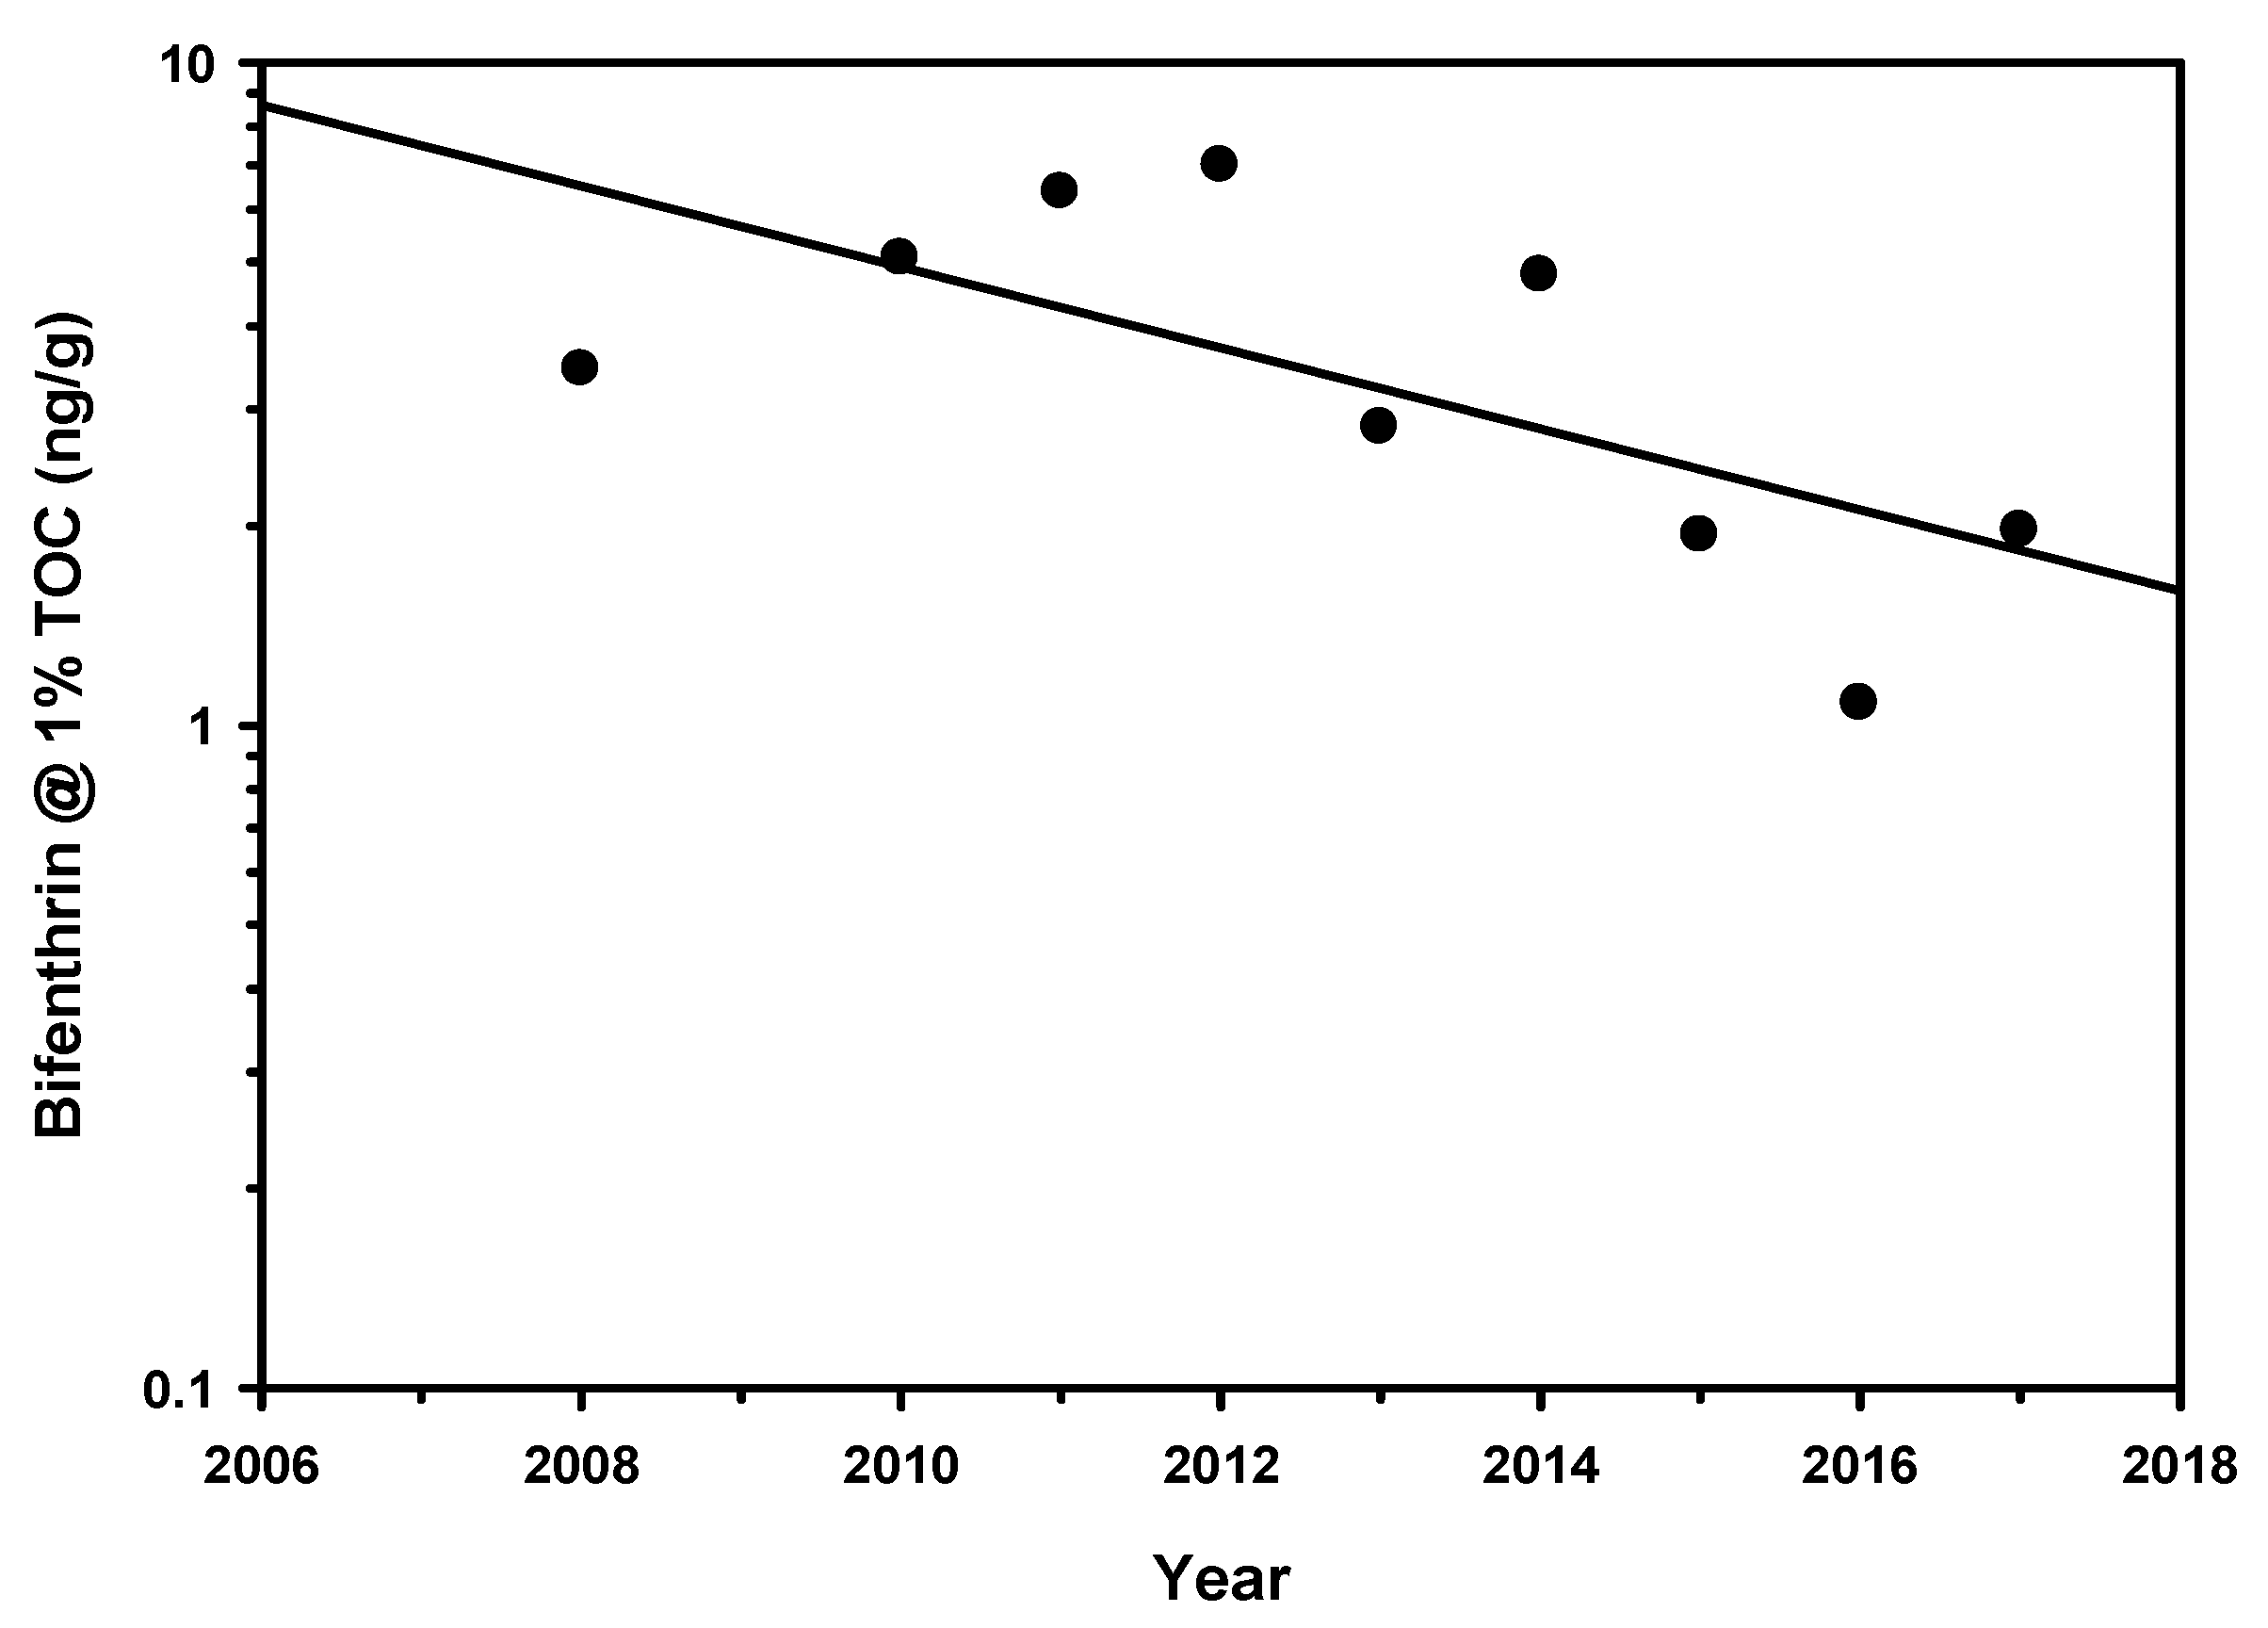
Figure 30.
Z-Drain—Dixon RCD (r2 = 0.376, p = 0.059).
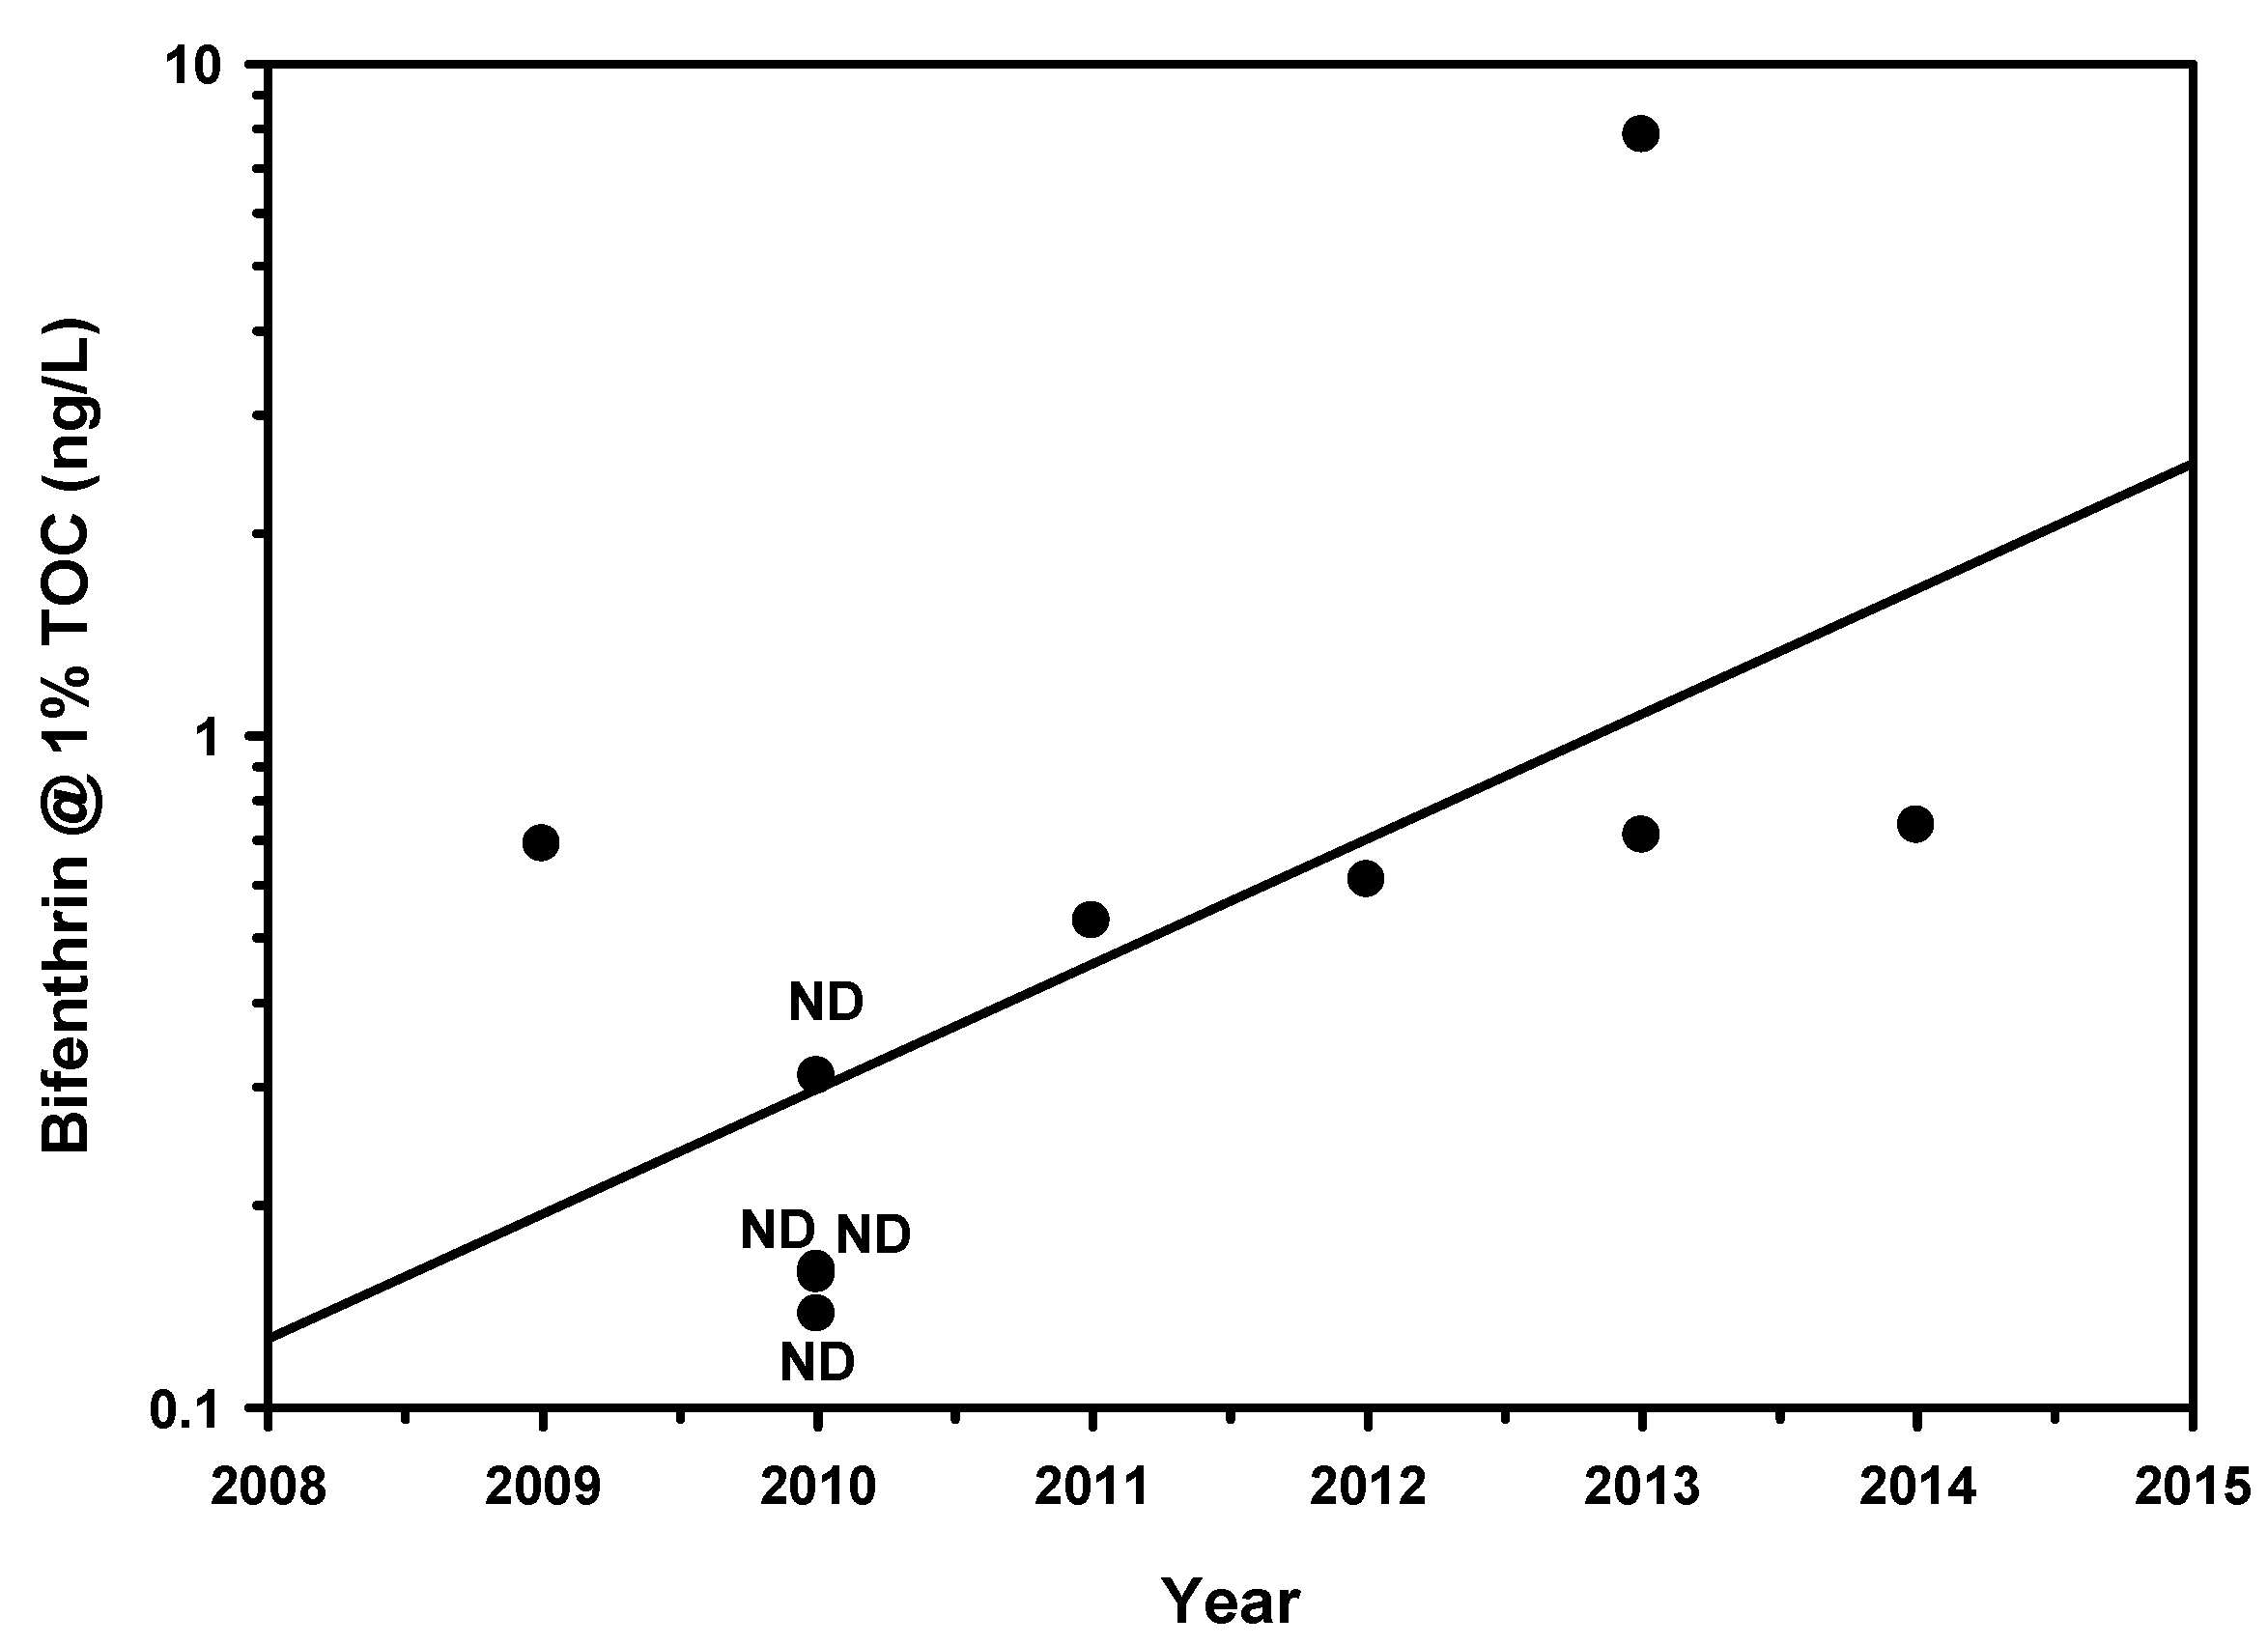
Figure 31.
Twenty-nine long term bifenthrin sediment sample sites with significant regressions or correlations from the statistical trends analysis. Red dots indicate long term sites with upward trends in bifenthrin concentrations over time and blue dots downward trend.
Figure 31.
Twenty-nine long term bifenthrin sediment sample sites with significant regressions or correlations from the statistical trends analysis. Red dots indicate long term sites with upward trends in bifenthrin concentrations over time and blue dots downward trend.
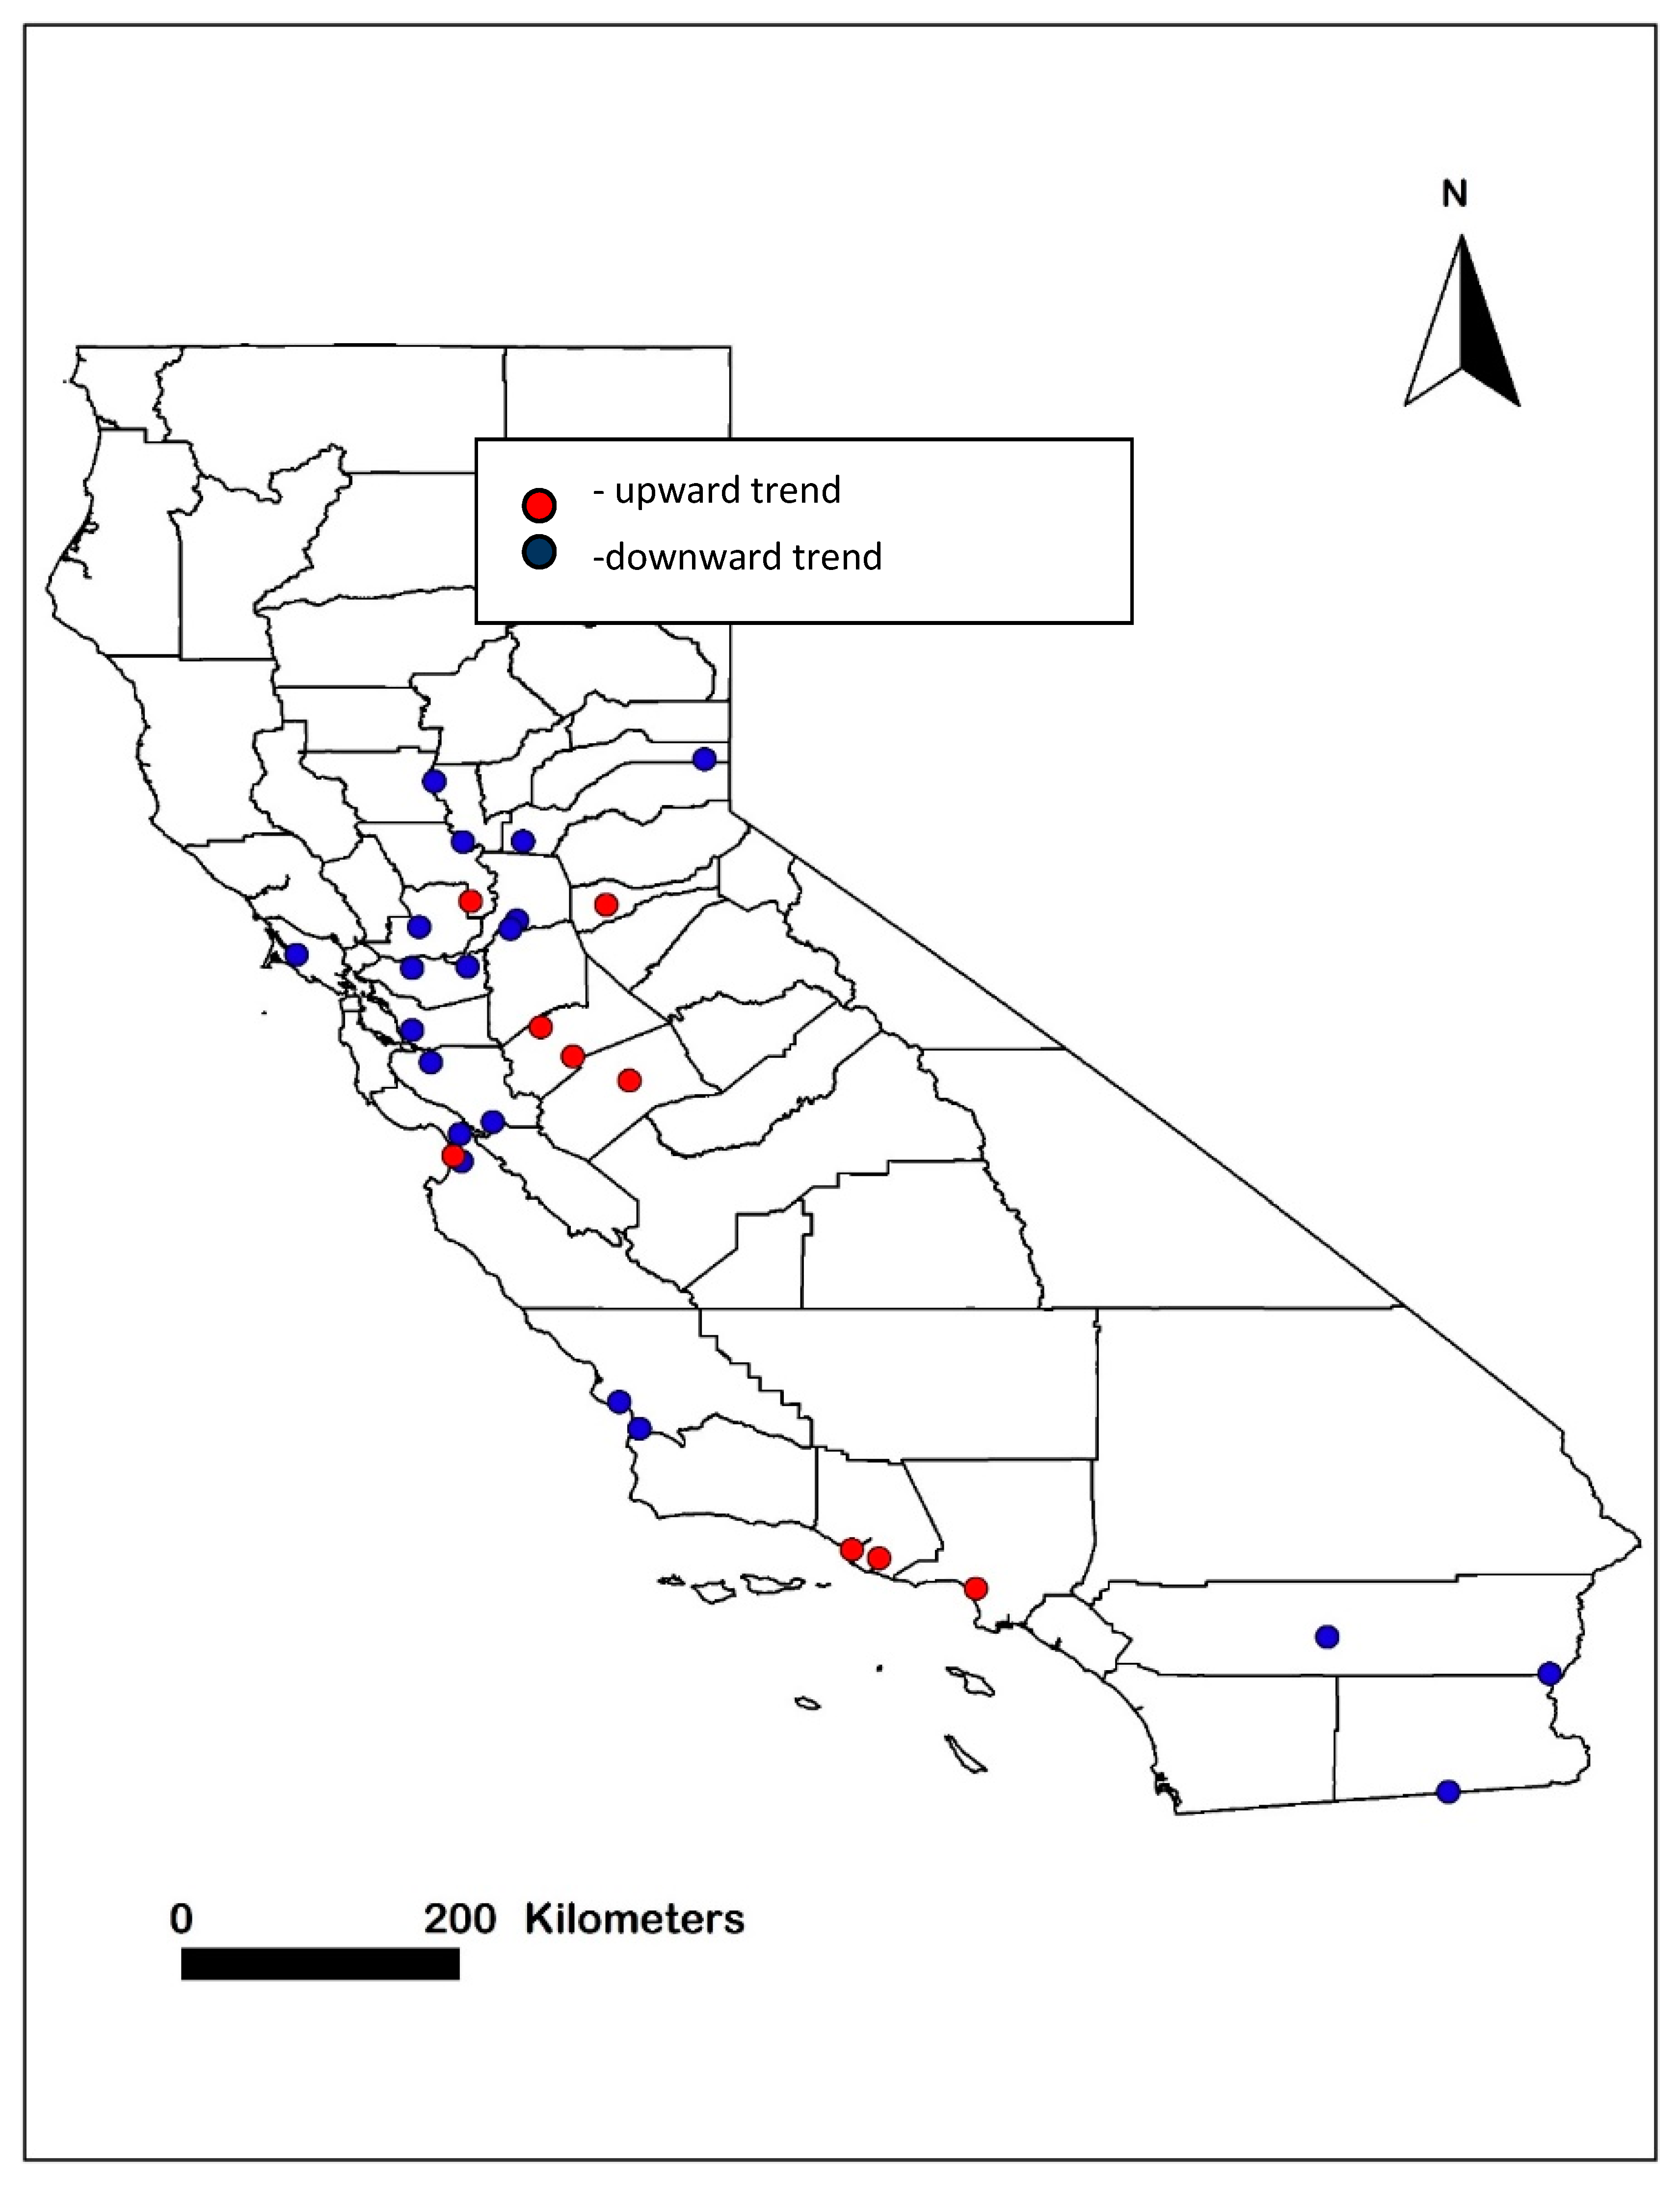
Figure 32.
Long term California sediment stream systems sampled for bifenthrin with ≥ 6 year time span, ≥6 total data points and at least three different sample sites from the 2001–2019 CEDEN and Hall et al. [8]. Locations presented are the means of the latitudes and longitudes for the individual sample sites from the stream system. The four sites presented in green had at least one detected value and the one site presented in blue was the only site with a significant regression (decreasing bifenthrin trend).
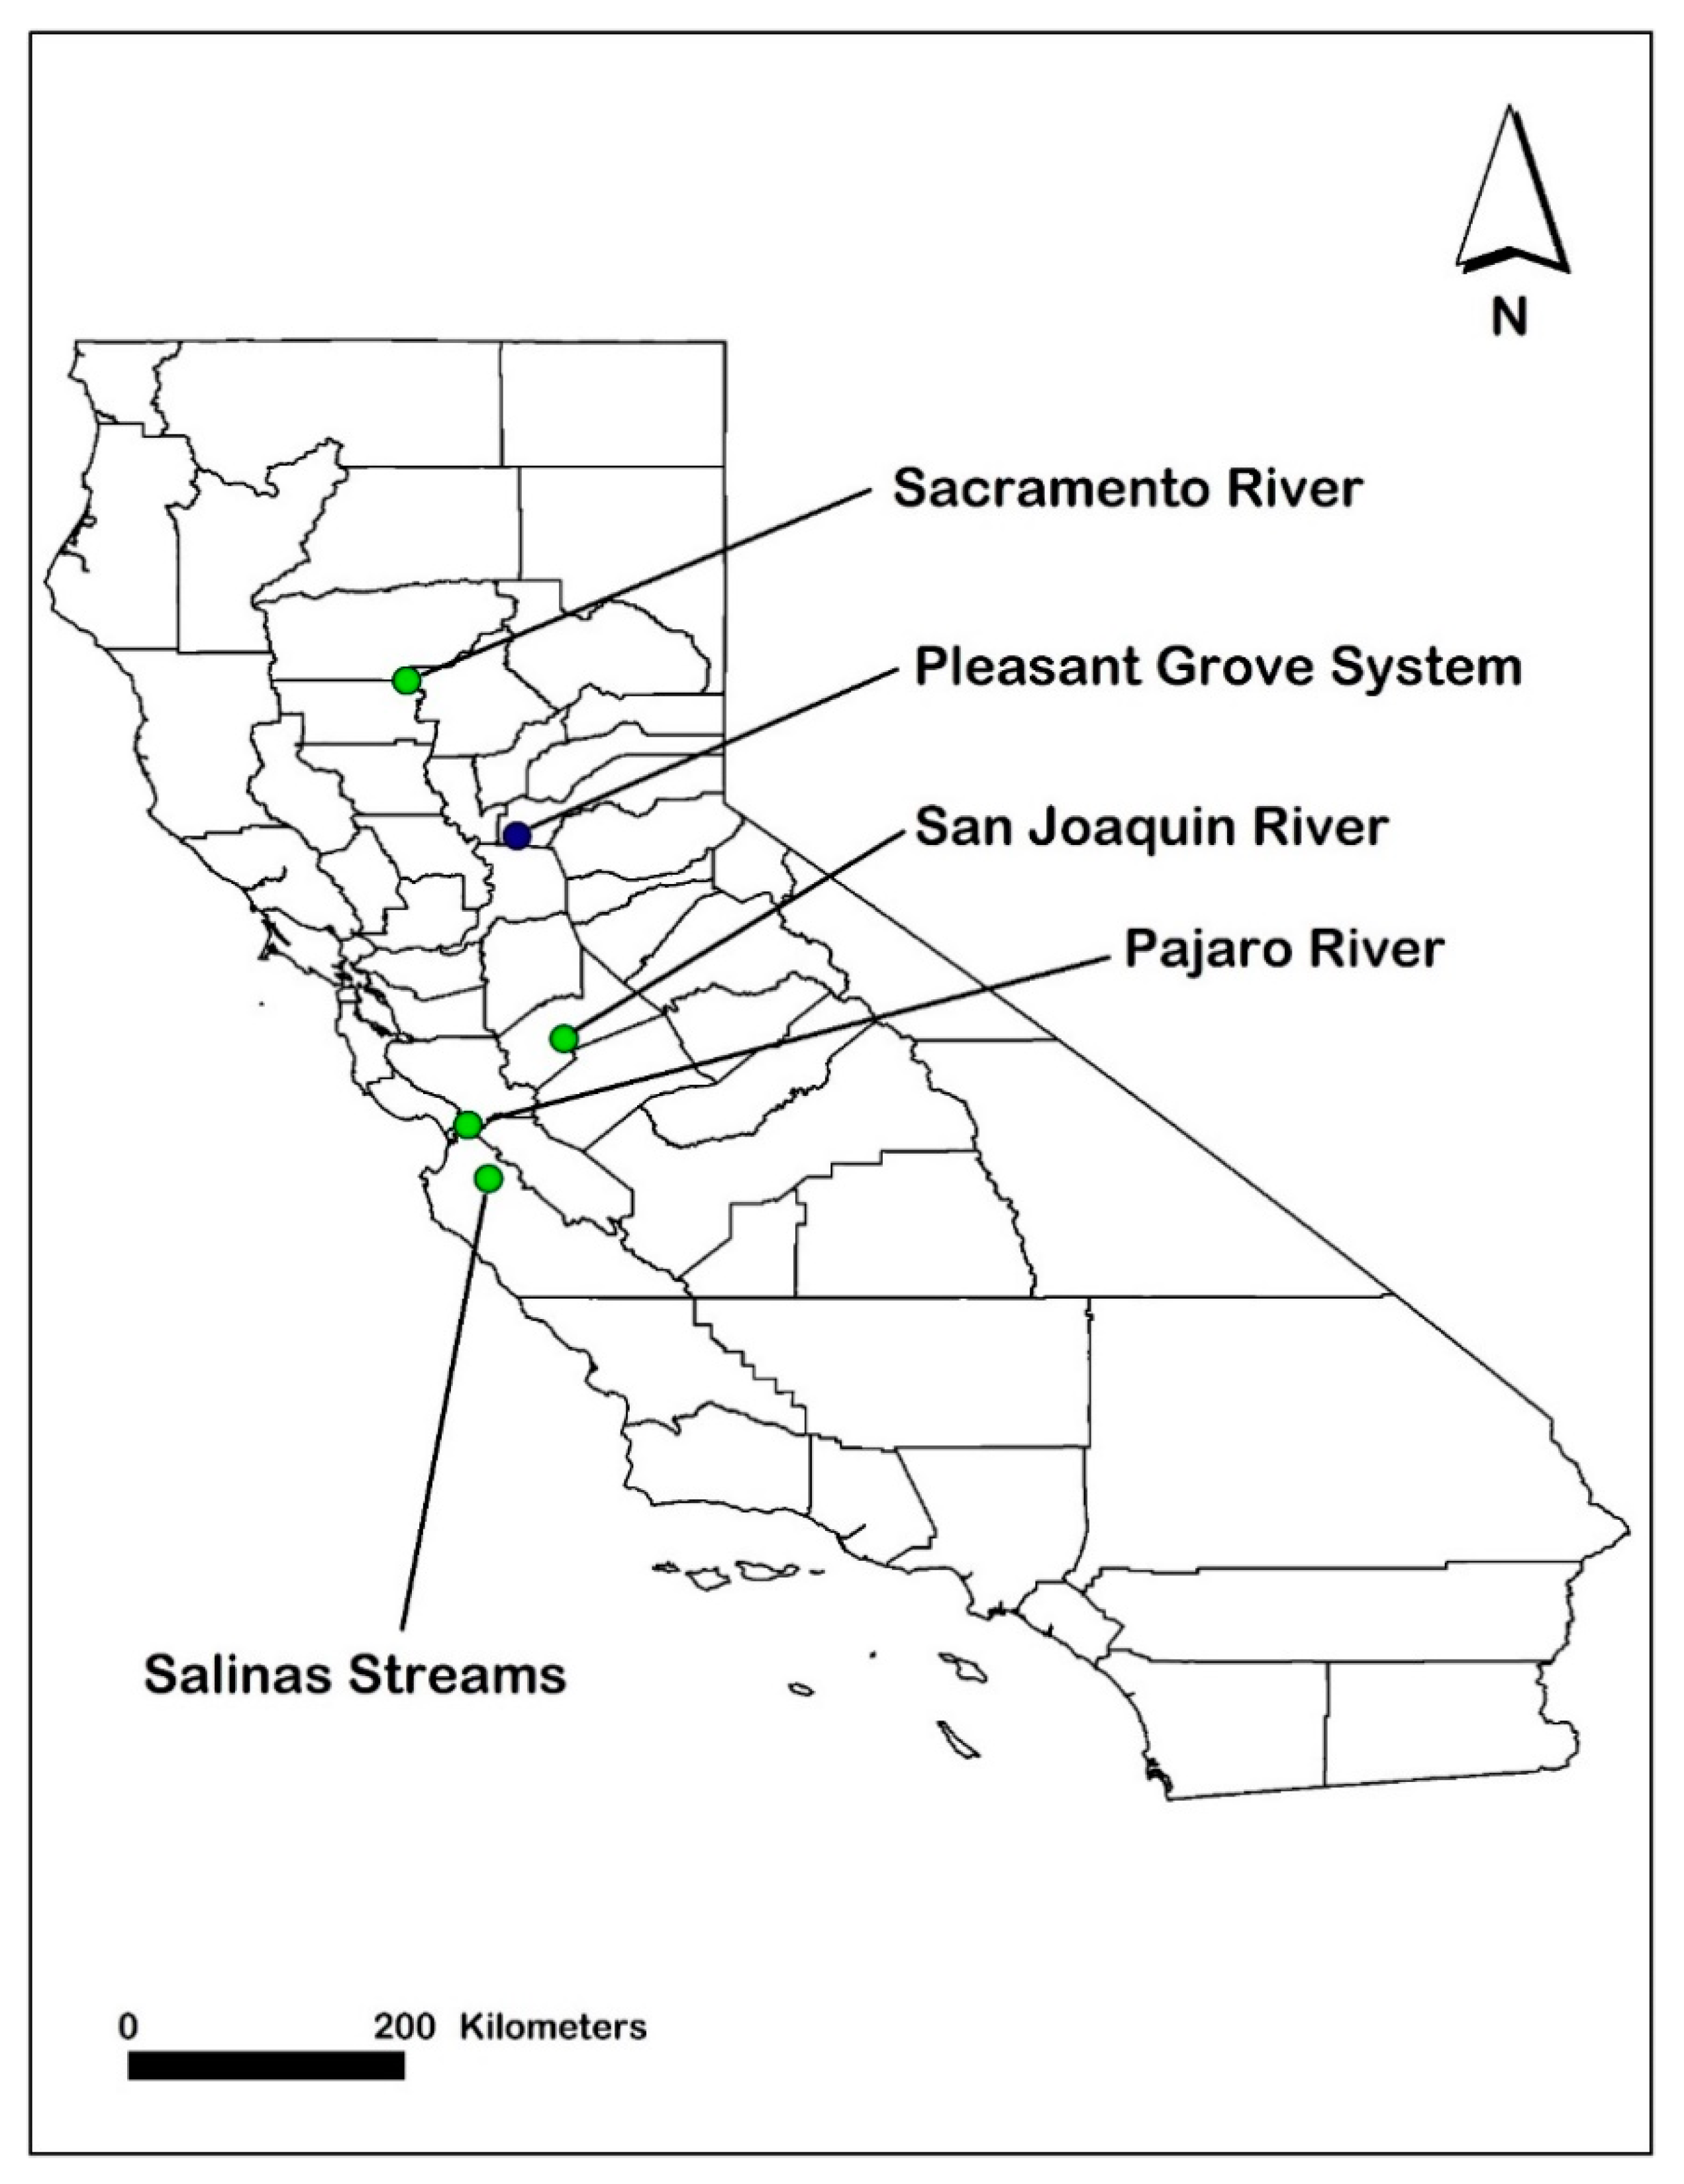
Figure 33.
Linear regression of bifenthrin annual mean sediment measurements normalized to 1% TOC from the Pleasant Grove long term stream system (21 sites total). The r2 = 0.330 and p = 0.082.
Figure 33.
Linear regression of bifenthrin annual mean sediment measurements normalized to 1% TOC from the Pleasant Grove long term stream system (21 sites total). The r2 = 0.330 and p = 0.082.


Table 1.
Twenty-nine long term California sediment sites with significant trends sampled for bifenthrin a (ng/g normalized to 1% TOC) from the 2001–2019 CEDEN dataset. The primary land use whether agriculture (Agr), urban (Urb) or mixed (Agr/Urb) is listed. The % non-detects (% ND) is also listed. Increasing or decreasing trends in bifenthrin concentrations over time are indicated in the trend slope column and a significant trend is indicated by a p value ≤ 0.10 with r2 ≥ 0.25 or r value ≥ 0.5. Log transformation of bifenthrin concentrations was used if necessary to improve the fit or power of the statistical analyses.
| Site Name | % | Land | Regression | Correlation | Trend | ||
|---|---|---|---|---|---|---|---|
| NDs | Use | r2 | p | r | p | Slope | |
| Alameda Creek E. of Alvarado Blvd | 0.0 | Urb | 0.773 | 0.004 | - | - | Down |
| Alamo River at International Boundary | 90.0 | Urb | - | - | −0.685 | 0.025 | Down |
| Ballona Creek Downstream of Sawtelle (Centinella) | 0.0 | Urb | 0.439 | 0.037 | - | - | Up |
| Bear Creek near Bert Crane Road | 14.3 | Agr | 0.835 | 0.004 | - | - | Up |
| Butte Slough upsteam of Pass Road Bridge | 0.0 | Agr | 0.612 | 0.038 | - | - | Down |
| Calleguas Creek Below Camrosa WWTP, Site 6 | 11.1 | Agr | 0.738 | 0.003 | - | - | Up |
| Coachella Valley Stormchannel (Ave 52) | 66.7 | Urb | 0.633 | 0.058 | - | - | Down |
| Colusa Basin Drain Upstream at Knights Landing | 0.0 | Agr | 0.524 | 0.066 | - | - | Down |
| Cosumnes River at Twin Cities Road | 12.5 | Agr | 0.391 | 0.097 | - | - | Down |
| Dual Storm Drain at Opal and Parkside Way b | 0.0 | Urb | 0.577 | 0.080 | - | - | Down |
| Espinosa Slough upstream of Alisal Slough | 0.0 | Agr | 0.792 | 0.007 | - | - | Down |
| Guadalupe Cr at USGS Gaging Station 11169025 | 0.0 | Urb | 0.362 | 0.086 | - | - | Down |
| Ingram Creek at River Road | 0.0 | Agr | 0.473 | 0.009 | - | - | Up |
| Lagunitus Creek at Coast Guard Station | 75.0 | Agr | 0.535 | 0.039 | - | - | Down |
| Laurel Creek at Pintail Drive | 0.0 | Urb | 0.626 | 0.011 | - | - | Down |
| Llagas Creek at Southside | 33.3 | Agr/Urb | 0.653 | 0.052 | - | - | Down |
| Marsh Creek at East Cypress Crossing | 0.0 | Agr/Urb | 0.468 | 0.029 | - | - | Down |
| Mokelumne River at New Hope Road | 0.0 | Agr | 0.721 | 0.032 | - | - | Down |
| Orestimba Creek at River Road | 47.6 | Agr | - | - | 0.577 | 0.006 | Up |
| Oso Flaco Creek at Oso Flaco Lake Road | 0.0 | Agr | 0.714 | 0.017 | - | - | Down |
| Palo Verde Lagoon (LG1) | 84.6 | Agr | 0.325 | 0.042 | - | - | Down |
| Salsipuedes Creek downstream of Corralitos Creek | 71.4 | Agr/Urb | 0.559 | 0.053 | - | - | Down |
| San Luis Obispo Creek at San Luis Bay Drive | 0.0 | Agr | 0.466 | 0.062 | - | - | Down |
| Santa Clara River Estuary | 12.5 | Agr/Urb | 0.439 | 0.074 | - | - | Up |
| Sutter Creek at Hwy 49 | 66.7 | Agr/Urb | 0.698 | 0.038 | - | - | Up |
| Tembladero Slough at Monterey Dunes Way | 0.0 | Agr | 0.416 | 0.044 | - | - | Up |
| Trout Creek (Truckee) near mouth | 33.3 | Agr | 0.677 | 0.044 | - | - | Down |
| Walnut Creek at Concord Ave O.C | 0.0 | Urb | 0.434 | 0.054 | - | - | Down |
| Z-Drain (Dixon RCD) | 40.0 | Agr | 0.376 | 0.059 | - | - | Up |
a Non-detected concentrations assigned a value of ½ the detection limit. b Dual Storm Drain at Opal and Parkside Way is within 50 m of Hall et al. [8] Pleasant Grove Creek site #8.
Table 2.
Regression analysis of five long term California sediment stream systems sampled for bifenthrin a (ng/g normalized to 1% TOC) from the 2001–2019 CEDEN and Hall et al. [8]. A stream system has at least three individual sample sites (within a named system) such that each site would have a time span ≥ 6 years with at least six individual years of mean data. Total number of sample sites per stream system as well as the primary land use (agriculture or urban) in the sampled area are also designated for those systems that had a significant regression equation. Increasing or decreasing trends in bifenthrin concentrations over time are indicated in the trend slope column and a significant trend would be indicated by a p value ≤ 0.10 with r2 ≥ 0.25. Log transformation of bifenthrin concentrations was used if necessary to improve the fit or power of the statistical analyses. Sites with significant trends are in bold type.
| Stream System Name | # of Sites Per | Primary | Regression | Trend | Sig. | |
|---|---|---|---|---|---|---|
| Stream System | Land Use | r2 | p | Slope | Trend | |
| Pajaro River | 4 | 0.013 | 0.752 | Up | No | |
| Pleasant Grove System b | 21 | Urban | 0.330 | 0.082 | Down | Yes |
| Sacramento River | 3 | 0.268 | 0.153 | Up | No | |
| Salinas Streams c | 17 | 0.082 | 0.365 | Up | No | |
| San Joaquin River | 3 | 0.145 | 0.399 | Down | No | |
© 2020 by the authors. Licensee MDPI, Basel, Switzerland. This article is an open access article distributed under the terms and conditions of the Creative Commons Attribution (CC BY) license (http://creativecommons.org/licenses/by/4.0/).
Share and Cite
MDPI and ACS Style
Hall, L.W., Jr.; Anderson, R.D. An Eighteen Year Temporal Trends Analysis of Bifenthrin Sediment Concentrations in California Waterbodies. Water 2020, 12, 2402. https://doi.org/10.3390/w12092402
AMA Style
Hall LW Jr., Anderson RD. An Eighteen Year Temporal Trends Analysis of Bifenthrin Sediment Concentrations in California Waterbodies. Water. 2020; 12(9):2402. https://doi.org/10.3390/w12092402
Chicago/Turabian StyleHall, Lenwood W., Jr., and Ronald D. Anderson. 2020. "An Eighteen Year Temporal Trends Analysis of Bifenthrin Sediment Concentrations in California Waterbodies" Water 12, no. 9: 2402. https://doi.org/10.3390/w12092402
Note that from the first issue of 2016, this journal uses article numbers instead of page numbers. See further details here.