Predicting River Flow Using an AI-Based Sequential Adaptive Neuro-Fuzzy Inference System


1
Department of Civil Engineering, Schulich School of Engineering, University of Calgary, Calgary, AB T2N 1N4, Canada
2
Department of Geomatics Engineering, Schulich School of Engineering, University of Calgary, Calgary, AB T2N 1N4, Canada
3
Resource Stewardship Division, Alberta Environment and Parks, University Research Park, Calgary, AB T2L 2K8, Canada
*
Author to whom correspondence should be addressed.
Water 2020, 12(6), 1622; https://doi.org/10.3390/w12061622
Submission received: 5 May 2020
/
Revised: 2 June 2020
/
Accepted: 3 June 2020
/
Published: 6 June 2020
(This article belongs to the Special Issue Droughts and Floods Assessment and Monitoring Using Remote Sensing and Geospatial Techniques)
Abstract
:Artificial intelligence (AI) techniques have been successfully adopted in predictive modeling to capture the nonlinearity of natural systems. The high seasonal variability of rivers in cold weather regions poses a challenge to river flow forecasting, which tends to be complex and data demanding. This study proposes a novel technique to forecast flows that use a single-input sequential adaptive neuro-fuzzy inference system (ANFIS) along the Athabasca River in Alberta, Canada. After estimating the optimal lead time between four hydrometric stations, gauging data measured near the source were used to predict river flow near the mouth, over approximately 1000 km. The performance of this technique was compared to nonsequential and multi-input ANFISs, which use gauging data measured at each of the four hydrometric stations. The results show that a sequential ANFIS can accurately predict river flow (r2 = 0.99, Nash–Sutcliffe = 0.98) with a longer lead time (6 days) by using a single input, compared to nonsequential and multi-input ANFIS (2 days). This method provides accurate predictions over large distances, allowing for flow forecasts over longer periods of time. Therefore, governmental agencies and community planners could utilize this technique to improve flood prevention and planning, operations, maintenance, and the administration of water resource systems.
1. Introduction
The modeling of large watersheds is challenging because of the complexity of hydroclimatic regimes due to intra- and inter-basin variations in topography, climatic patterns, land cover, basin drainage density, soil drainage capacity, and other associated factors. For example, simulated flows along the mainstream of rivers located in cold weather regions are usually more sensitive to climate data inputs, while in other cases, where the runoff cycle is interflow-dominated, the hydrologic response is more sensitive to the regional topography [1].
The Athabasca River Basin (ARB) has been subject to several hydrological studies over the past decade because of the increasing population and industrial/agricultural activities that this region has been experiencing over the past 40 years. There is particular interest in understanding the variability in the Athabasca River flow, because it represents an important resource for oil and gas extraction and operational processes, as well as agricultural irrigation. Changes in the magnitude of river flow and seasonality may lead to decreases in water supply, which will impact natural ecosystems, including freshwater species and streamside ecosystems that contribute to the rich floodplain forests [2,3,4]. These changes may also force alterations to water management regulations for multi-objective reservoirs [5,6,7]. Therefore, it is important to understand the temporal and spatial variability of current and future hydrologic regimes to provide for sustainable water resource management and monitoring programs.
River flow forecasting models can generally be divided into two main categories: process-driven models and data-driven models [8,9,10,11,12]. The former attempts to simulate the physical processes in a mathematical fashion within the watershed system, combining empirical and physical-based equations. Data-driven models are also called “black box” in nature, as they do not require knowledge of the underlying processes; they are solely based on empirical equations calibrated to field data. The main difference between process-driven and data-driven models is the representation of the governing processes and their data necessity. Toth et al. [13] employed a physical-based model called WATFLOOD to investigate the Athabasca River flow variability. Historical station-observed discharge records, along with temperature, precipitation, and topography data collected between 1965 and 1989, were used in this study as model inputs. The results showed that the estimated flow of the Athabasca River at Fort McMurray, in terms of the Nash–Sutcliffe coefficient, is 0.72 for model validation. A variable infiltration capacity (VIC) model implemented with the global circulation model (GCM) was used by Eum et al. [1] to forecast water flow along the Athabasca River. Inputs between 1979 and 2010 for discharge, climate, and vegetation–soil–runoff data were considered. The most accurate model was found to have a Nash–Sutcliffe coefficient equal to 0.84 and an RMSE equal to 166 m3/s. Rood et al. [2] opted for a simple interpolation approach to model the Athabasca River flow, using discharge data between 1957 and 2011 for Jasper, Hinton, Windfall, Athabasca, and Fort McMurray gauging stations. The model efficiency coefficients showed a model accuracy of 0.79. The physical-based model soil and water assessment tool (SWAT) was used by Shrestha et al. [14] to assess climate change impacts on freshwater resources for the ARB. The authors included snowpack, elevation band, groundwater, soil drainage, soil–vegetation slope, and pond/reservoir hydraulic conductivity data to forecast flow at Fort McMurray. A 0.91 Nash–Sutcliffe coefficient was estimated, which meant that this model was the most accurate approach in the existing literature, to our knowledge. Eum et al. [5] opted for VIC as their hydrological modeling approach. The authors considered hydrometric data between 1985 and 1997 for model calibration and the 1998–2010 period for model validation. Major data inputs for this model included: climate data (temperature and precipitation), snow accumulation, snowmelt, potential infiltration into frozen ground, land cover, and three different soil drainage layers. This study led to a Nash–Sutcliffe coefficient equal to 0.74 for the validation set for the Athabasca River at Fort McMurray. Similar results are reported by Droppo et al. [15]; the authors adopted the VIC model in an analogous fashion to Eum et al. [5], using climate (temperature and precipitation), snow accumulation, snowmelt, potential infiltration into frozen ground, land cover, and three different soil drainage layer data to perform flow forecasting of the Athabasca River at Fort McMurray. The Nash–Sutcliffe coefficient for this study was found to be 0.74, which is similar to the Eum et al. [5] study.
Even though physical-based models can provide a wider understanding of the separate hydrological processes that govern the watershed as a whole, data inputs may often be unavailable, expensive, and time consuming to collect. Moreover, some variables might still need to be obtained through model calibration. Thus, physical-based models can be difficult to operate and implement. Meanwhile, real-time forecasting can be simpler to manage by using data-driven models because sophisticated physical models often need a large amount of input data, potentially long computational times for model calibration, and skilled professionals to properly use the appropriate software. Data-driven models might be more suitable for understanding the underlying physical mechanisms that are not fully understood by physical-based models and in the case where input and output data are sufficiently available to assess the input–output relationship, while bypassing the physical explanation of their dependence [10].
This study adopts the adaptive neuro-fuzzy inference system (ANFIS) with different methods and compares the results with the existing literature to understand if it is possible to employ a data-limited modeling approach that can accurately forecast daily water flow at Fort McMurray. The ANFIS has been largely used in the literature for streamflow forecasting worldwide, primarily in mild and temperate areas. Anusree and Varghese [16] compared the performance of the ANFIS, artificial neural networks (ANN) and multiple nonlinear regression (MNLR) for predicting daily flow at the outlet of Karuvannur River Basin, India. The results showed that the ANFIS model predicts daily flow more accurately compared to the ANN and MNLR models. Sabzi et al. [17] investigated how data preprocessing and data mining techniques can improve the accuracy of streamflow predictive models, such as autoregressive integrated moving average (ARIMA), ANN, a hybrid model of ANN and ARIMA (ANN–ARIMA), and the ANFIS. The authors concluded that the ANFIS model achieved a superior streamflow prediction performance overall. Dariane and Azimi [18] successfully combined two ANFIS methods: subtractive (sub)-ANFIS and fuzzy C-means (FCM)-ANFIS to forecast streamflow in two sub-basins of the Urmia Lake Basin, which is located within two Azerbaijan provinces in northwest Iran. Poul et al. [19] adopted multi-linear regression (MLR), ANN, the ANFIS, and k-nearest neighbors (KNN) to predict the monthly flow in the St. Clair River between the US and Canada. The authors demonstrated that the performances of three nonlinear models of ANN, the ANFIS, and KNN were highly satisfying and that among them, the ANFIS model was superior. Ehteram et al. [20] used the ANFIS to predict the Aidoughmoush monthly streamflow in Iran. Their results demonstrated the high capability of the ANFIS in capturing the variability in streamflow based on different climatic indices inputs. The literature demonstrated that the ANFIS generally would perform more accurately than ANN for river flow forecasting. In fact, the ANFIS can overcome the disadvantages of ANN models, such as the disregard for data-related uncertainty, which leads ANN models to correlate inputs to outputs using a strict if–then set of rules. At the same time, ANN models are very efficient in adapting and learning. By using the learning capability of ANN and introducing ambiguity in the data inputs by fuzzification, the ANFIS can automatically generate fuzzy if–then rules and optimize its parameters from mathematical algorithms. More details regarding the ANFIS is provided in the Materials and Method section.
Three different methods were adopted in this study using the ANFIS: “Nonsequential”, “Sequential”, and “Multi-input”. The “Nonsequential ANFIS” uses flow data inputs from one station upstream to predict river flow at the station of interest located downstream. The “Sequential ANFIS” uses gauging data collected near the source to sequentially predict flow at different stations downstream. The “Multi-input ANFIS” simultaneously uses multiple gauged flow data located upstream to predict flow at the downstream station of interest.
Existing hydrological models for the ARB usually require a large amount of data in the form of explanatory variables for calibration. Moreover, physical hydrological models are often expensive and necessitate expert personnel in order to properly function. This study proposes a novel application of the ANFIS for streamflow forecasting in cold weather regions using a data-limited modeling approach that can accurately forecast daily water flow over an extended area.
2. Materials and Methods
2.1. Study Area and Data Source
The Athabasca River Basin is approximately 159,000 km2 and it represents about 24% of Alberta’s landmass. The Athabasca River is the second largest river in Alberta and its average flows are 2.79 × 10⁹ m3 at Jasper, 1.36 × 10¹⁰ m3 at Athabasca, and 2.09 × 10¹⁰ m3 at Fort McMurray, per year. The river originates at the Columbia Glacier in Jasper National Park, flowing northeast across Alberta for over 1300 km into Lake Athabasca (Figure 1). The upper reaches of the Athabasca River are located within a mountainous topography characterized by alpine, sub-alpine, and montane ecoregions. This area is historically significant as a waterway for First Nations and the fur trade, as well as the mapping of western Canada. For this reason, the portion of the Athabasca River located within Jasper National Park has been designated a Canadian Heritage River. Industrial developments such as forestry, open pit coal mines, limestone quarries, and growing agricultural areas are located in the middle portion of the Athabasca River Basin. The lower reaches of the Athabasca River begin at Fort McMurray and finish with the confluence of the Peace and Athabasca rivers with Lake Athabasca, forming a vast wetland called the Peace–Athabasca delta. This is known as one of the world’s most ecologically significant wetlands and has been designated as a Ramsar Convention wetland and a United Nations Education, Scientific and Cultural Organization (UNESCO) World Heritage Site [21,22]. The lower portion of the Athabasca river basin has undergone an extensive urban and industrial development over the past 40 years due to the extraction of energy resources, primarily oil and gas. Here, surface water assessment is crucial to understand what impact this development is having on the area, because the oil and gas industry relies on the water uptake from the Athabasca River for operational purposes. In addition, the growing energy sector results in specific land uses that influence surface water quality and, subsequently, affect settlements and a variety of people who live along the river.
Generally, the Athabasca River flow is influenced by the large variations in climatic conditions over the year, with long, cold winters and short, warm summers. Near the source of the river in Jasper, the months with the lowest average high temperature are December and January (−6 °C) while the warmest month is July (21 °C). The average precipitation is highest in July (69 mm) and lowest in April (29 mm). In Fort McMurray, closer to the mouth of the river, the month with the lowest average high temperature is January (−12.2 °C) while the warmest month is July (23.7 °C). The average precipitation is highest in July (80.7 mm) and lowest in January (0.4 mm). In cold regions, climatic conditions dictate a river’s water sources: there is no contribution of precipitation and snowmelt during the winter, while an abundant rainfall–runoff and snowmelt occur during spring and summer [23]. The large annual variability of water systems in cold weather regions represents a challenge in hydrological modeling. Thus, a data-driven modeling technique that can capture such variability, and bypasses the need to model the complex underlying hydrologic processes governing the flow at Fort McMurray, is selected.
Fort McMurray is the largest urbanized center in the Regional Municipality of Wood Buffalo. This area draws attention from around the world as the residential and commercial focal point of Canada’s oil sands industry. The Regional Municipality of Wood Buffalo counts 111,687 people over 66,361 km2, where approximately 82,724 people live in Fort McMurray [24,25]. This area is of global significance, as it represents the third largest oil deposit in the world. Although its significance has been recognized for decades, the economic and technological conditions necessary for commercial production have only been recently developed. Moreover, the strong demand for oil and gas, the population and economic growth around the community of Fort McMurray, and the tension between industrial development and environmental protection have attracted attention. Oil sands development requires large amounts of water and energy; the current surface water intake is two to five barrels of water to produce one barrel of oil by mining. The industrial processes used, and the large scale of oil sands development, can result in negative impacts on the aquatic environment if deliberate action is not taken to protect these ecosystems [26,27,28].
The historical average daily flow data from 1971 to 2014 were downloaded from the Water Survey of Canada (WSC) at four stations: Jasper (07AA002), Hinton (07AD002), Athabasca (07BE001), and below Fort McMurray (07DA001) [29]. These locations were selected based on the data consistency and completeness. Table 1 provides general information regarding the four gauging stations used in this study to calibrate and validate the models. To forecast flows at Fort McMurray, antecedent flows at Jasper, Hinton, and Athabasca, which are located along the Athabasca River, were used as independent variables. Two sets of calibration–validation data were selected to forecast river flow at Fort McMurray: (1) data between 1971 and 2000 were used to calibrate the models, while data from 2001 to 2014 were used for model validation and (2) data from odd years (i.e., 1971, 1973, 1975, …, 2013) were used to calibrate the models, while data from even years (i.e., 1972, 1974, 1976, …, 2014) were used for model validation. The results of these two different approaches should help to detect possible bias in the calibration data.
2.2. Methods
This study focuses on developing a hydrological model to forecast river flow using different methods to the ANFIS, a method that has been successfully used in hydrologic modeling because of its high capability in representing nonlinear natural systems [16,17,18,19,20,30,31,32,33]. The disadvantages of the ANFIS often include a large amount of input data, a long computational time and memory, and mathematical complexity. This study aims to simplify the use of the ANFIS for hydrological modeling, while maintaining a similar level of accuracy.
Figure 2 provides a conceptual diagram to show the methods considered in this study. After gathering data and pre-processing into calibrating and validating sets, the flow between stations was compared and correlated to identify the optimal lead time (n), which indicates the amount of time (in days) that is necessary for water to pass from a station upstream to another station downstream. Once the optimal lead time between stations was estimated, three different modeling methods were developed using the ANFIS: “Nonsequential”, “Sequential”, and “Multi-input”. Finally, the models were validated and their performance compared. Among the three types of models, the Sequential ANFIS represents a novel approach. The details and assumptions of these models are described in the following subsections.
2.2.1. Identification of Optimal Lead Time
A correlation analysis was carried out between the flow at Fort McMurray at time t and the flow at other gauging stations (i.e., Jasper, Hinton, and Athabasca) in order to determine the optimal lead time for each pair of stations. Time lags between 1 and 10 days (i.e., t-1, t-2, …, t-10) were considered in this analysis. The selection of 10 days was based on the different regimes within the catchment that primarily depend on regional rainfall, topography, and land use. As result, the runoff generated downstream would be influenced by upstream catchments. Considering more than 10 days would not provide much contribution on the catchment of interest. The highest correlation coefficient was considered as the optimal lead time between Fort McMurray and the other stations. Historical daily flow records at Jasper, Hinton, Athabasca, and Fort McMurray between 1971 and 2000 were used to determine the optimal lead time for the first approach, and between 1971 and 2014, only considering odd years (1971, 1973, 1975, …, 2013), for the second approach. By estimating the optimal lead time, it is possible to understand how far into the future a model can predict.
2.2.2. Models Calibration Using the ANFIS
Suparta and Alhasa [34] and Jang [35] thoroughly described the mechanisms and the mathematics underlying the ANFIS and how this technique is well-suited for highly nonlinear systems. This study considers the ANFIS using grid partitioning (supervised learning algorithm) and adopting the Takagi–Sugeno type inference system. A hybrid algorithm, which is a combination of a least squares estimator and the gradient descent method, is adopted. This means that, during the model training process, a forward (from Layer 1 to Layer 5) and backward (from Layer 5 to Layer 1) propagation algorithm (Figure 3) adjusts the parameters of the membership functions. The gradient descent method is used to find the nonlinear function minimum, resulting from the weights generated by the fuzzy rules.
Layer 1: For each input variable, there is a set of membership functions that contain function parameters. Each node generates an output that is a degree of membership value given by the input of the membership functions. In this study, membership functions are set as Gaussian distributions because it requires the least number of parameters for calibration compared to other membership function types and the smoothness of the curve allows for a more homogeneous trend in the validation phase.
where µ is the degree of membership functions for the given fuzzy set, x is one of the input variables, and a and b are the parameters of a membership function.
Layer 2: Every node is fixed (non-adaptive), and the circle node is labeled as Π. The output node results from the multiplication of incoming signals and is delivered to the next node. The T-norm operator with general performance (AND) is applied to obtain the output, because all the explanatory variables occur simultaneously.
where is the output that represents the firing strength of each rule, j represents each node in this layer, and indicates the various forms of membership functions.
Layer 3: Every node is fixed (non-adaptive), and the circle node is labeled as N. Each node represents the ratio between the j-th rule firing strength and the sum of all firing strengths. It is also called the normalized firing strength.
Layer 4: Every node is an adaptive node to an output, with a node function defined as follows:
where is the normalized firing strength from the previous layer and is a parameter in the node. The parameters in this layer are referred to as consequent parameters.
Layer 5: The single node is a fixed (non-adaptive) node that computes the overall output as the sum of all the incoming signals from the previous node. This circle node is labeled as ∑.
The first and the fourth layer contain the parameters that can be modified over time until the gradient descent converges to a minimum error. The first layer contains a nonlinear set of premise parameters, while the fourth layer includes linear consequent parameters. To update both parameter types, a learning algorithm is necessary so that they can adapt to the model’s environment. A hybrid algorithm is used in this study. The hybrid learning algorithm consists of two parts: the forward and the backward propagation. The premise parameters in the Gaussian function (a and b) must be steady in Layer 1. A recursive least square estimator (RLSE) method is applied to repair the consequent parameters in the fourth layer. After the consequent parameters are computed, the backward propagation allows for comparison between the generated output and the observed output through the adaptive network input of initial data. The error obtained during the comparison between the generated and actual output is propagated back to the first layer. At the same time, the premise parameters in Layer 1 are updated. One level of hybrid learning (one forward and one backward propagation) is called epoch. Using a hybrid learning algorithm, which combines RLSE and the gradient descent methods, the convergence can be reached faster than using the backward propagation algorithm only, because the dimensional search space of the error is reduced. More details regarding the ANFIS can be found in [36,37,38,39]. Figure 3 shows an example of the fuzzy reasoning mechanisms for this study using the “Multi-input” approach, which employs three input variables simultaneously for forecasting river flow. The “Nonsequential” and “Sequential” models only use one input variable, which simplifies the software’s computation exercise.
Three different methods were adopted in this study using the ANFIS: “Nonsequential”, “Sequential”, and “Multi-input”. The “Nonsequential ANFIS” predicts river flow at Fort McMurray using flow inputs from one single station upstream (i.e., Fort McMurray–Jasper, Fort McMurray–Hinton, and Fort McMurray–Athabasca, in three different sets). The “Sequential ANFIS” uses gauging data at Jasper, near the source, to predict flow at Hinton. Subsequently, the forecasted flow at Hinton is automatically entered to predict flow at Athabasca, which in turn is used to predict flow at Fort McMurray. The “Multi-input ANFIS” uses measured data at Jasper, Hinton, and Athabasca simultaneously to predict flow at Fort McMurray. Table 2 provides an overview of the ANFIS settings used per each model. Although the ANFIS codes could be replicated with any programming language, MATLAB® was adopted in this study with running times between 2 and 10 s using a regular laptop.
2.2.3. Model Validation
The developed models were compared in terms of performance by using quantitative statistical metrics, including the coefficient of determination (r2), the root mean square error (RMSE), and the Nash–Sutcliffe coefficient of efficiency (ENS). The estimated statistics were also used to compare model performance to the existing literature. The r2 indicates the goodness-of-fit between measured and predicted flow, while the RMSE is the normalized error represented by the distance between the predicted and the measured flow at Fort McMurray. ENS is a widely used statistic for assessing specifically the goodness of fit of hydrologic models. The quantitative statistical metrics are calculated as follows:
where, is the predicted flow; is the mean of the predicted flows; is the observed antecedent flow; is the mean of the observed antecedent flows; n is the number of observations. Note that the r2 ranges between 0 and 1, where 1 indicates a perfect fit between the observed and predicted values. The ENS can range between −infinity (−∞) and 1, where 1 corresponds to a perfect fit. Finally, RMSE should be close to zero to indicate good model performance and its magnitude can vary between +infinity (+∞) and −infinity (−∞).
3. Results and Discussion
3.1. Model Calibration and Validation
Figure 4 shows the annual hydrographs at the four gauging stations for model calibration and validation using two calibration–validation approaches, i.e., panels a–b show the calibration and validation hydrographs for Approach 1 (calibration data: 1971–2000, validation data: 2001–2014), while panels c–d show the calibration and validation hydrographs for Approach 2 (calibration data: 1971–2014 odd years, validation data: 1971–2014 even years).
Although the flow follows a similar trend in the four instances (see Figure 4), small changes in river flow over time can be detected. Figure 4a shows that between 1971 and 2000 the average daily flow during the colder months (i.e., January, February, March, and December, with no contribution from precipitation and snowmelt) at Fort McMurray is larger (194.73 m3/s) than that in Figure 4b for the 2001–2014 period (157.53 m3/s). At the same time, the average flow for the remaining months (i.e., April, May, June, July, August, September, October, and November) has the opposite trend, where the flow in Figure 4b (i.e., 920.02 m3/s) is larger than the flow in Figure 4a (i.e., 772.64 m3/s). Moreover, the springtime increase in discharge shown in Figure 4b is both later to start and faster to progress when compared to Figure 4a. This difference in flow between the calibration and validation datasets could potentially represent a limitation for flow forecasting at Fort McMurray. Using a different set of calibration–validation data that is not time dependent (calibration data: 1971–2014 odd years and validation data: 1971–2014 even years), shown in Figure 4c,d for calibration and validation, respectively, would probably overcome this limitation. The average daily flow during the colder months at Fort McMurray in Figure 4c (i.e., 178.58 m3/s) is similar to Figure 4d (187.28 m3/s), which shows a more similar base flow. The difference in flow detected during the remaining months is likely due to a different amount of snowmelt and precipitation between the calibration and validation data. There is also no sign of earlier springtime increase in the Figure 4c,d sets.
3.2. Identification of the Optimal Lead Time
A correlation analysis was performed to estimate the time (in days) required for a mass of water to flow from one station to another. This quantity is also called optimal lead time. The coefficients of determination were calculated by comparing the flow at Fort McMurray with the flow at station i (i = Jasper, Hinton, and Athabasca) at different time lags such as t (same day), t-1, t-2, …, t-10. A similar analysis was carried out for Approach 2. Table 3 shows the correlation parameters between each station from t to t-10 for Approach 1 and 2.
Between Jasper and Fort McMurray, r2 shows a poor correlation, where the highest coefficient of determination is observed at 5 days. Similar results indicate that between Hinton and Fort McMurray, the optimal lead time is 4 days. A strong correlation was found between Athabasca and Fort McMurray, where the highest r2 was 0.92 with two-day lead time. A similar correlation analysis was carried out between Jasper and Hinton and Hinton and Athabasca to estimate the optimal lead time between each station along the river. The optimal lead time between Jasper and Hinton is 1 day (r2 = 0.96), while that between Hinton and Athabasca is 3 days (r2 = 0.63). Figure 5 schematically summarizes the main findings in terms of how far in advance each developed model can predict flow at Fort McMurray. It should be noted that between Jasper and Fort McMurray, the best correlation was found at 5 days, while when summing the optimal lead time between each station (i.e., Jasper–Hinton = 1 day, Hinton–Athabasca = 3 days, and Athabasca–Fort McMurray = 2 days) the total optimal lead time is 6 days. This might be due to the actual optimal lead time between Jasper and Fort McMurray being in between 5 and 6 days (for Jasper-Fort McMurray, r2 = 0.504 at t-5 and r2 = 0.502 at t-6).
The correlation analysis performed on the calibration–validation datasets for Approach 2 showed results identical to those for Approach 1. This indicates that the optimal lead time is independent of the calibration dataset.
3.3. Evaluation of the Results
The performance of the developed models was compared and the results are summarized in Table 4. Overall, “Nonsequential Jasper–Fort McMurray” and “Nonsequential Hinton–Fort McMurray” can poorly predict river flow at Fort McMurray because, although their r2 values indicate a good correlation between the measured and predicted flow, the RMSE is considerably large in both approaches. A good performance is observed in the “Nonsequential Athabasca–Fort McMurray” model (ENS = 0.99 and RMSE = 49 m3/s for Approach 1 and ENS = 0.99, and RMSE = 46 m3/s for Approach 2), which can predict river flow at Fort McMurray over 2 days. Although this model is accurate, the limited predictive capability represents a disadvantage. The “Sequential” model helps to cope with this limitation, providing accurate predictions over 6 days (ENS = 0.98 and RMSE = 66 m3/s for Approach 1, and ENS = 0.99 and RMSE = 43 m3/s for Approach 2). Among the models proposed in this study, the most accurate is “Multi-input”, with ENS = 0.98 and RMSE = 39 m3/s using Approach 2. However, similarly to “Nonsequential Athabasca–Fort McMurray”, this model allows predictions over 2 days.
Figure 6 shows the hydrographs comparing the measured to the predicted flow at Fort McMurray using Approach 1. The scatter plots are shown in Figure 7. In general, the “Sequential” and “Multi-input” models perform more accurately during the springtime increase and late summer decrease than the “Nonsequential” models. The advantage of using the “Sequential” model is the higher predictive capability, as indicated in Figure 8. The “Nonsequential Athabasca–Fort McMurray” model is more accurate in predicting the base flow in the colder months, when there is no contribution of rainfall and snowmelt, while the “Multi-input” model could not perform as accurately. The scatter plots in Figure 7 show the low accuracy of the “Nonsequential” method using the Jasper and Hinton stations to predict river flow at Fort McMurray.
The results for Approach 2 are shown in Figure 8 in the form of annual hydrographs, and in Figure 9 as scatter plots. The predictive performance of the ANFIS improved in all methods (i.e., “Nonsequential”, “Sequential”, and “Multi-input”) adopted in this study when using a calibration dataset that is time independent. The “Multi-input” method was able to perform accurately during the colder months, which represents an improvement from Approach 1, shown in Figure 6. In addition, the “Nonsequential” models were capable of better predicting the late summer decrease when compared to Approach 1. Similar to Approach 1, the scatter plots in Figure 9 show the lower accuracy of the “Nonsequential” method when the Jasper and Hinton stations were used to predict river flow at Fort McMurray. Table 5 provides the results to show the inter-annual variations in terms of r2, ENS, and RMSE.
Generally, the ANFIS is superior to other modeling techniques reported in the literature to predict the Athabasca River flow at Fort McMurray. All the three methods used in this study, namely the “Nonsequential Athabasca–Fort McMurray”, “Sequential”, and “Multi-Input” ANFISs, performed better than other modeling techniques previously explored by other authors on the ARB, using both Approach 1 and 2. This indicates that the ANFIS is highly capable of capturing the nonlinearity of the natural river cycles over the year in cold weather regions, while bypassing the physical explanation of the input–output variables’ dependence. Not only can the ANFIS predict more accurately, it also uses a simpler set of input–output variables compared to the more complex dataset used by the VIC or SWAT, which employ a large amount of data for climate and runoff information to calibrate the model. Previous studies carried out in the ARB, which were discussed in the introduction section, show a lower performance in terms of Nash–Sutcliffe coefficient, compared to the method proposed in this paper. By using SWAT, Shresta et al. [14] achieved the highest accuracy level among past attempts found in the literature for the ARB, despite their highly data-demanding set of explanatory variables. Eum et al. [1] also showed a highly valuable modeling performance using a combination of VIC and GCM, although this approach could lead to longer computational times and more expensive budgets. The method proposed in this study shows that it is possible to achieve a higher accuracy when a limited number of inputs are employed, and a more simplistic input–output relationship is outlined. Interestingly, the use of the two calibration–validation dataset pairs (Approach 1 and 2) led to a difference in performance using the ANFIS for the three methods adopted in this study. This was also indicated by Zheng et al. [40], who investigated the statistical behavior of data splitting methods to achieve representative evaluation performance for flow forecasting [40,41,42]. Other modeling techniques should be investigated in a similar fashion to better understand the contribution of calibration–validation datasets on the accuracy of the model output. Finally, Approach 2 provided more accurate results for the three ANFIS methods, possibly because the model’s outcome is not influenced by time-dependent variables. For example, the variation in rainfall and snowmelt contributions, earlier springtime increases or late summer decreases, and the growing water uptake from the oil and gas industry from more recent years should be investigated and correlated to the river flow variations overtime.
4. Conclusions
This study used the adaptive neuro-fuzzy inference system (ANFIS), which is an artificial intelligence (AI) technique for machine learning, to forecast river flow at Fort McMurray, located on the lower reaches of the Athabasca River in Alberta, Canada.
Different techniques using the ANFIS were developed and compared to the existing literature. Initially, a correlation analysis was carried out between the flow at Fort McMurray and the flow at other gauging stations at different times. The highest correlation coefficient indicated the optimal lead time between Fort McMurray and the stations upstream. Three distinct techniques were then adopted: “Nonsequential”, “Sequential”, and “Multi-input”. Although the “Nonsequential” and “Multi-input” models were capable of accurately predicting river flow at Fort McMurray (r2 = 0.99, ENS > 0.98), they only allowed predictions with a two-day notice, while the “Sequential ANFIS” could forecast accurate flow regimes and allowed modeling with a six-day notice. Subsequently, a different set of calibration and validation data were adopted to perform the same analyses and compare the accuracy of the results. The latter approach provided more accurate results for the three ANFIS methods, possibly because the model’s outcome was not influenced by time-dependent variables (i.e., variation in rainfall and snowmelt contributions, earlier springtime increases or late summer decreases, and the growing water uptake from the oil and gas industry from more recent years).
In conclusion, the “Sequential” ANFIS modeling technique is recommended to forecast daily river flow at Fort McMurray because of its capability in capturing the nonlinearity of the natural river cycles over the year in cold weather regions, while bypassing the physical relationship of the input–output variables. This study thus demonstrates the successful application of the ANFIS for sequential river flow forecasting in cold weather over an extended geographical area. The simplistic approach and the lower computational resources and time required for this exercise could find a use of this model in assisting governmental agencies and communities to improve flood prevention and the planning of water resource systems, operations, maintenance, and administration.
Author Contributions
Conceptualization, C.B., G.A., J.A.D., A.G., and Q.K.H.; methodology, C.B. and G.A.; formal analysis, C.B., G.A., J.A.D., A.G., and Q.K.H.; writing—original draft preparation, C.B.; writing—review and editing, G.A., J.A.D., A.G., and Q.K.H.; supervision, G.A. and Q.K.H. All authors have read and agreed to the published version of the manuscript.
Funding
This research was partially funded by: (i) Alberta Environment and Parks through a grant to Q. Hassan and G. Achari; and (ii) Natural Sciences and Engineering Research Council of Canada Discovery Grant to Q. Hassan.
Acknowledgments
The authors would like to thank the Water Survey of Canada for providing us the historical average daily water flow data during the 1971 to 2014 period.
Conflicts of Interest
The authors declare no conflict of interest.
References
- Eum, H.-I.; Yonas, D.; Prowse, T. Uncertainty in modelling the hydrologic responses of a large watershed: A case study of the Athabasca River basin, Canada. Hydrol. Process. 2014, 28, 4272–4293. [Google Scholar] [CrossRef]
- Rood, S.B.; Stupple, G.W.; Gill, K.M. Century-long records reveal slight, ecoregion-localized changes in Athabasca River flows. Hydrol. Process. 2014, 29, 805–816. [Google Scholar] [CrossRef]
- Darwall, W.R.T.; Freyhof, J. Lost fishes, who is counting? The extent of the threat to freshwater fish biodiversity. Conserv. Freshw. Fishes 2015, 1–36. [Google Scholar] [CrossRef]
- Papadaki, C.; Soulis, K.X.; Muñoz-Mas, R.; Martinez-Capel, F.; Zogaris, S.; Ntoanidis, L.; Dimitriou, E. Potential impacts of climate change on flow regime and fish habitat in mountain rivers of the south-western Balkans. Sci. Total Environ. 2016, 540, 418–428. [Google Scholar] [CrossRef] [PubMed] [Green Version]
- Eum, H.-I.; Dibike, Y.; Prowse, T. Climate-induced alteration of hydrologic indicators in the Athabasca River Basin, Alberta, Canada. J. Hydrol. 2017, 544, 327–342. [Google Scholar] [CrossRef]
- Arthington, A.; Kennen, J.; Stein, E.D.; Webb, J.A. Recent advances in environmental flows science and water management-Innovation in the Anthropocene. Freshw. Biol. 2018, 63, 1022–1034. [Google Scholar] [CrossRef] [Green Version]
- Kuriqi, A.; Pinheiro, A.N.; Sordo-Ward, A.; Garrote, L. Influence of hydrologically based environmental flow methods on flow alteration and energy production in a run-of-river hydropower plant. J. Clean. Prod. 2019, 232, 1028–1042. [Google Scholar] [CrossRef]
- Fu, C.; James, A.L.; Yao, H. SWAT-CS: Revision and testing of SWAT for Canadian Shield catchments. J. Hydrol. 2014, 511, 719–735. [Google Scholar] [CrossRef]
- Hayat, H.; Akbar, T.A.; Tahir, A.A.; Hassan, Q.K.; Dewan, A.; Irshad, M. Simulating Current and Future River-Flows in the Karakoram and Himalayan Regions of Pakistan Using Snowmelt-Runoff Model and RCP Scenarios. Water 2019, 11, 761. [Google Scholar] [CrossRef] [Green Version]
- Veiga, V.B.; Hassan, Q.K.; He, J. Development of Flow Forecasting Models in the Bow River at Calgary, Alberta, Canada. Water 2014, 7, 99–115. [Google Scholar] [CrossRef] [Green Version]
- Pechlivanidis, I.G.; Jackson, B.M.; McIntyre, N.R.; Wheater, H.S. Catchment scale hydrological modelling: A review of model types, calibration approaches and uncertainty analysis methods in the context of recent developments in technology and applications. Glob. NEST J. 2011, 13, 193–214. [Google Scholar]
- Devia, G.K.; Ganasri, B.; Dwarakish, G. A Review on Hydrological Models. Aquat. Procedia 2015, 4, 1001–1007. [Google Scholar] [CrossRef]
- Toth, B.; Pietroniro, A.; Conly, F.M.; Kouwen, N. Modelling climate change impacts in the Peace and Athabasca catchment and delta: I—Hydrological model application. Hydrol. Process. 2006, 20, 4197–4214. [Google Scholar] [CrossRef]
- Shrestha, N.; Du, X.; Wang, J. Assessing climate change impacts on freshwater resources of the Athabasca River Basin, Canada. Sci. Total Environ. 2017, 601, 425–440. [Google Scholar] [CrossRef]
- Droppo, I.; Prowse, T.; Bonsal, B.; Dibike, Y.; Beltaos, S.; Krishnappan, B.; Eum, H.; Kashyap, S.; Shakibaeinia, A.; Gupta, A. Regional Hydroclimatic and Sediment Modeling: Oil Sands Monitoring Program; Technical Report Series; Government of Alberta: Edmonton, AB, Canada, 2018.
- Anusree, K.; Varghese, K. Streamflow Prediction of Karuvannur River Basin Using ANFIS, ANN and MNLR Models. Proc. Technol. 2016, 24, 101–108. [Google Scholar] [CrossRef] [Green Version]
- Zamani-Sabzi, H.; King, J.P.; Abudu, S. Developing an intelligent expert system for streamflow prediction, integrated in a dynamic decision support system for managing multiple reservoirs: A case study. Expert Syst. Appl. 2017, 83, 145–163. [Google Scholar] [CrossRef]
- Dariane, A.; Azimi, S. Forecasting streamflow by combination of a genetic input selection algorithm and wavelet transforms using ANFIS models. Hydrol. Sci. J. 2016, 61, 585–600. [Google Scholar] [CrossRef]
- Poul, A.K.; Shourian, M.; Ebrahimi, H. A Comparative Study of MLR, KNN, ANN and ANFIS Models with Wavelet Transform in Monthly Stream Flow Prediction. Water Res. Manag. 2019, 33, 2907–2923. [Google Scholar] [CrossRef]
- Ehteram, M.; Afan, H.A.; Dianatikhah, M.; Ahmed, A.N.; Fai, C.M.; Hossain, S.; Allawi, M.F.; El-Shafie, A.; Afan, F. Assessing the Predictability of an Improved ANFIS Model for Monthly Streamflow Using Lagged Climate Indices as Predictors. Water 2019, 11, 1130. [Google Scholar] [CrossRef] [Green Version]
- Athabasca River Basin Research Institute, Athabasca University: About the Athabasca River Basin. Available online: http://arbri.athabascau.ca/About-the-Athabasca-River-basin/Index.php (accessed on 27 March 2020).
- Regional Aquatics Monitoring Program (RAMP). Overview of Athabasca River Basin landscape. Available online: http://www.ramp-alberta.org/river/geography/basin+landscape.aspx (accessed on 27 March 2020).
- Government of Canada. Historical Climate Data. Available online: https://climate.weather.gc.ca/ (accessed on 27 March 2020).
- Regional Municipality of Wood Buffalo (RMWB). Census 2018. Available online: https://www.rmwb.ca/Municipal-Government/Census.htm (accessed on 27 March 2020).
- Regional Municipality of Wood Buffalo (RMWB). Fort McMurray. Available online: https://www.rmwb.ca/living/Communities/Fort-McMurray.htm (accessed on 27 March 2020).
- Regional Aquatics Monitoring Program (RAMP). Potential Effects of Oil Sands on Aquatic Ecosystems. Available online: http://www.ramp-alberta.org/resources/development/upgrading.aspx (accessed on 27 March 2020).
- Jones, N.F.; Pejchar, L.; Kiesecker, J.M. The Energy Footprint: How Oil, Natural Gas, and Wind Energy Affect Land for Biodiversity and the Flow of Ecosystem Services. Bioscience 2015, 65, 290–301. [Google Scholar] [CrossRef] [Green Version]
- Faramarzi, M.; Abbaspour, K.C.; Adamowicz, W.L.V.; Lu, W.; Fennell, J.; Zehnder, A.J.; Goss, G.G. Uncertainty based assessment of dynamic freshwater scarcity in semi-arid watersheds of Alberta, Canada. J. Hydrol. Reg. Stud. 2017, 9, 48–68. [Google Scholar] [CrossRef]
- Government of Canada. Water Survey of Canada. Available online: https://www.canada.ca/en/environment-climate-change/services/water-overview/quantity/monitoring/survey.html (accessed on 27 March 2020).
- Seo, Y.; Kim, S.; Kisi, O.; Singh, V.P. Daily water level forecasting using wavelet decomposition and artificial intelligence techniques. J. Hydrol. 2015, 520, 224–243. [Google Scholar] [CrossRef]
- Azad, A.; Farzin, S.; Kashi, H.; Sanikhani, H.; Karami, H.; Kisi, O. Prediction of river flow using hybrid neuro-fuzzy models. Arab. J. Geosci. 2018, 11, 718. [Google Scholar] [CrossRef]
- Bui, D.T.; Khosravi, K.; Li, S.; Shahabi, H.; Panahi, M.; Singh, V.P.; Chapi, K.; Shirzadi, A.; Panahi, S.; Chen, W.; et al. New Hybrids of ANFIS with Several Optimization Algorithms for Flood Susceptibility Modeling. Water 2018, 10, 1210. [Google Scholar] [CrossRef] [Green Version]
- Yaseen, Z.M.; Ebtehaj, I.; Bonakdari, H.; Deo, R.C.; Mehr, A.D.; Mohtar, W.H.M.W.; Diop, L.; El-Shafie, A.; Singh, V.P. Novel approach for streamflow forecasting using a hybrid ANFIS-FFA model. J. Hydrol. 2017, 554, 263–276. [Google Scholar] [CrossRef]
- Suparta, W.; Alhasa, K.M. Modeling of Tropospheric Delays Using ANFIS; Springer Science and Business Media LLC: Berlin/Heidelberg, Germany, 2016. [Google Scholar]
- Jang, J.-S. ANFIS: Adaptive-network-based fuzzy inference system. IEEE Trans. Syst. Man Cybern. 1993, 23, 665–685. [Google Scholar] [CrossRef]
- Walia, N.; Singh, H.; Sharma, A. ANFIS: Adaptive neuro-fuzzy inference system—A survey. J. Comput. Appl. 2015, 123, 32–38. [Google Scholar] [CrossRef]
- Hamdan, H.; Garibaldi, J. Adaptive neuro-fuzzy inference system (ANFIS) in modelling breast cancer survival. Int. Conf. Fuzzy Syst. 2010, 1–8. [Google Scholar] [CrossRef]
- Jang, J.-S.; Sun, C.-T. Neuro-fuzzy modeling and control. Institute of Electrical and Electronics Engineers (IEEE). Proc. IEEE 1995, 83, 378–406. [Google Scholar] [CrossRef]
- Mitra, S.; Hayashi, Y. Neuro-fuzzy rule generation: Survey in soft computing framework. IEEE Trans. Neural Netw. 2000, 11, 748–768. [Google Scholar] [CrossRef] [Green Version]
- Zheng, F.; Maier, H.R.; Wu, W.; Dandy, G.; Gupta, H.V.; Zhang, T. On Lack of Robustness in Hydrological Model Development Due to Absence of Guidelines for Selecting Calibration and Evaluation Data: Demonstration for Data-Driven Models. Water Resour. Res. 2018, 54, 1013–1030. [Google Scholar] [CrossRef]
- Biondi, D.; Freni, G.; Iacobellis, V.; Mascaro, G.; Montanari, A. Validation of hydrological models: Conceptual basis, methodological approaches, and a proposal for a code of practice. Phys. Chem. Earth Parts A/B/C 2012, 42, 70–76. [Google Scholar] [CrossRef]
- Brigode, P.; Oudin, L.; Perrin, C. Hydrological model parameter instability: A source of additional uncertainty in estimating the hydrological impacts of climate change? J. Hydrol. 2013, 476, 410–425. [Google Scholar] [CrossRef] [Green Version]
Figure 1.
Area of study inclusive of the four gauging stations used for data acquisition. The image shows the Athabasca River from source to Fort McMurray, which is located near the mouth.
Figure 1.
Area of study inclusive of the four gauging stations used for data acquisition. The image shows the Athabasca River from source to Fort McMurray, which is located near the mouth.
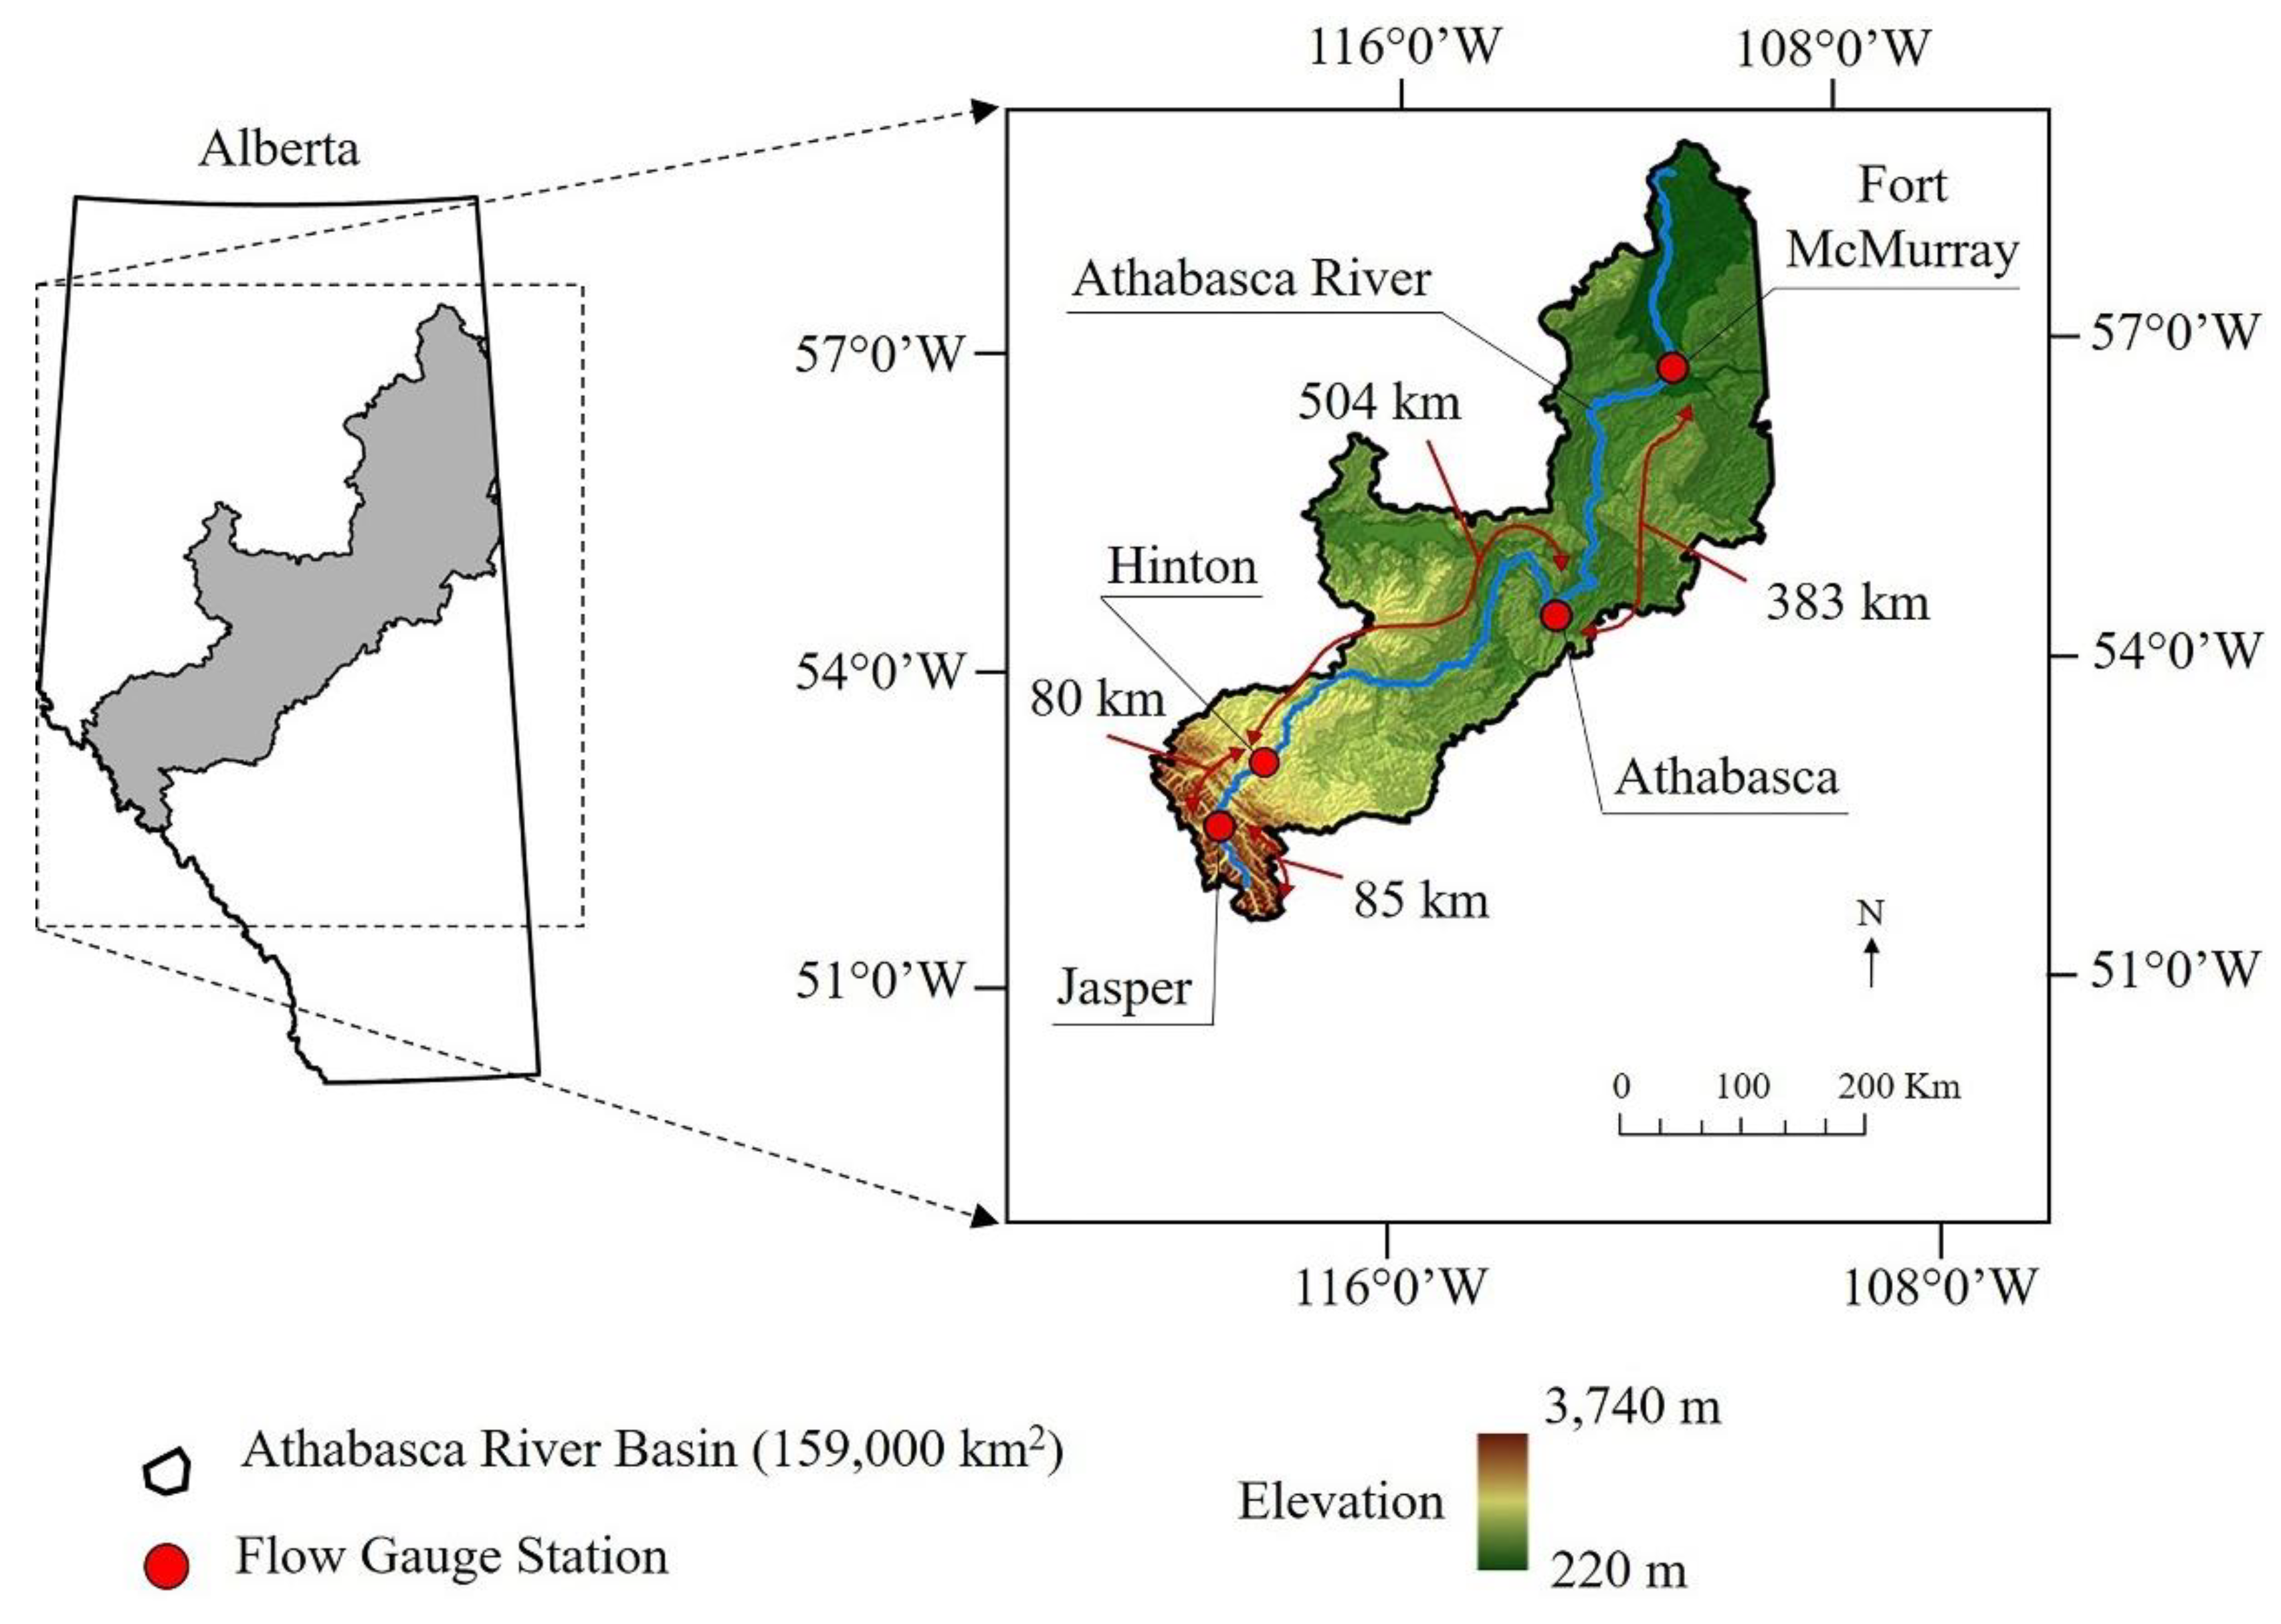
Figure 2.
Conceptual diagram of the approaches and methods adopted in this study.

Figure 3.
Example of the fuzzy reasoning mechanisms for this study using the “Multi-input” approach. V1, V2, and V3 are input variables i.e., river flow at Jasper, Hinton, and Athabasca). A, B, and C are the membership functions for each input variable. Π represents the firing strength of the fuzzy logic rules and N is the ratio between the i-th rule firing strength and the sum of all firing strengths. ∑ is the sum of all the incoming signals from the previous node.

Figure 4.
Average daily river flow at each gauging station during the period: (a) 1971–2000; (b) 2001–2014; (c) 1971–2014, odd years; and (d) 1971–2014, even years. (a,b) are the calibration and validation data for Approach 1, respectively; (c,d) are the calibration and validation data for Approach 2, respectively.

Figure 5.
Schematic representation of the models and their lead times.

Figure 6.
Hydrographs showing the results for the ANFIS models for Approach 1.

Figure 7.
Scatter plots showing the correlation between measured and predicted flow for the ANFIS models for Approach 1.
Figure 7.
Scatter plots showing the correlation between measured and predicted flow for the ANFIS models for Approach 1.

Figure 8.
Hydrographs showing the results for the ANFIS models for Approach 2.

Figure 9.
Scatter plots showing the correlation between the measured and predicted flow for the ANFIS models for Approach 2.
Figure 9.
Scatter plots showing the correlation between the measured and predicted flow for the ANFIS models for Approach 2.


Table 1.
Summary of the information for the four gauging stations used to gather hydrometric data along the Athabasca River for model calibration and validation.
Table 1.
Summary of the information for the four gauging stations used to gather hydrometric data along the Athabasca River for model calibration and validation.
| Station Name | Station ID | Latitude | Longitude | Drainage Area (km2) |
|---|---|---|---|---|
| Athabasca River near Jasper | 07AA002 | 52°54′36″ N | 118°03′31″ W | 3870 |
| Athabasca River at Hinton | 07AD002 | 53°25′27″ N | 117°34′09″ W | 9760 |
| Athabasca River at Athabasca | 07BE001 | 54°43′19″ N | 113°17′16″ W | 74,600 |
| Athabasca River below Fort McMurray | 07DA001 | 56°46′49″ N | 111°24′07″ W | 133,000 |
Table 2.
Overview of the Adaptive Neuro-Fuzzy Inference System (ANFIS) settings used per each model for the two different calibration–validation dataset approaches.
Table 2.
Overview of the Adaptive Neuro-Fuzzy Inference System (ANFIS) settings used per each model for the two different calibration–validation dataset approaches.
| Model Type | Input–Output | Membership Function Type and Number | Number of Epochs | Output Type |
|---|---|---|---|---|
| Approach 1: Calibration 1971–2000/Validation 2001–2014 | ||||
| Nonsequential | Jasper—Fort McMurray | Gauss, 6 | 230 | L |
| Hinton—Fort McMurray | Gauss, 4 | 300 | L | |
| Athabasca—Fort McMurray | Gauss, 4 | 320 | C | |
| Sequential | Jasper—Hinton—Athabasca—Fort McMurray | Gauss, 4—5—5 | 195—500—500 | L—L—C |
| Multi-input | Jasper/Hinton/Athabasca—Fort McMurray | Gauss, 4/3/5 | 300 | C |
| Approach 2: Calibration 1971–2014 odd years/Validation 1971–2014 even years | ||||
| Nonsequential | Jasper—Fort McMurray | Gauss, 6 | 150 | C |
| Hinton—Fort McMurray | Gauss, 4 | 220 | C | |
| Athabasca—Fort McMurray | Gauss, 4 | 215 | C | |
| Sequential | Jasper—Hinton—Athabasca—Fort McMurray | Gauss, 3—3—3 | 450—240—350 | C—C—C |
| Multi-input | Jasper/Hinton/Athabasca—Fort McMurray | Gauss, 3/3/3 | 350 | C |
L = linear, C = constant.
Table 3.
Summary of correlation parameters estimated for various station pairs to determine the optimal lead time using: (a) Approach 1, and (b) Approach 2.
Table 3.
Summary of correlation parameters estimated for various station pairs to determine the optimal lead time using: (a) Approach 1, and (b) Approach 2.
| (a) Approach 1: Calibration 1971–2000 | ||||||
| Day, t | Sample Size | Regression Equation, y = mx + c (r2) | ||||
| Jasper—Fort McMurray | Hinton—Fort McMurray | Athabasca—Fort McMurray | Jasper—Hinton | Hinton—Athabasca | ||
| t | 10,958 | 3.84x + 330.31 (0.492) | 2.23x + 281.01 (0.548) | 1.18x + 133.60 (0.873) | 1.76x + 18.18 (0.944) | 1.84x + 134.38 (0.592) |
| t-1 | 10,957 | 3.81x + 332.61 (0.485) | 2.24x + 280.38 (0.550) | 1.21x + 121.11 (0.914) | 1.78x + 16.79 (0.961) | 1.87x + 128.96 (0.613) |
| t-2 | 10,956 | 3.79x + 334.10 (0.481) | 2.25x + 277.82 (0.558) | 1.21x + 118.75 (0.922) | 1.75x + 19.14 (0.932) | 1.90x + 123.95 (0.632) |
| t-3 | 10,955 | 3.80x + 333.79 (0.482) | 2.28x + 273.60 (0.570) | 1.19x + 128.83 (0.888) | 1.70x + 23.24 (0.883) | 1.90x + 123.68 (0.633) |
| t-4 | 10,954 | 3.82x + 331.46 (0.488) | 2.29x + 270.73 (0.578) | 1.16x + 143.89 (0.839) | 1.66x + 27.15 (0.837) | 1.87x + 129.1 (0.612) |
| t-5 | 10,953 | 3.85x + 329.45 (0.494) | 2.28x + 272.49 (0.573) | 1.13x + 158.24 (0.794) | 1.62x + 30.46 (0.799) | 1.82x + 136.92 (0.583) |
| t-6 | 10,952 | 3.84x + 330.48 (0.491) | 2.25x + 278.39 (0.556) | 1.10x + 170.61 (0.755) | 1.59x + 33.28 (0.768) | 1.78x + 144.45 (0.555) |
| t-7 | 10,951 | 3.79x + 334.66 (0.479) | 2.21x + 285.91 (0.534) | 1.07x + 181.32 (0.723) | 1.56x + 35.68 (0.741) | 1.74x + 150.92 (0.532) |
| t-8 | 10,950 | 3.72x + 340.41 (0.462) | 2.16x + 293.26 (0.514) | 1.05x + 190.80 (0.695) | 1.54x + 37.78 (0.719) | 1.71x + 156.18 (0.513) |
| t-9 | 10,949 | 3.65x + 346.31 (0.446) | 2.12x + 299.79 (0.496) | 1.03x + 199.64 (0.669) | 1.52x + 39.71 (0.698) | 1.69x + 160.25 (0.499) |
| t-10 | 10,948 | 3.59x + 351.75 (0.431) | 2.09x + 305.20 (0.481) | 1.02x + 208.18 (0.645) | 1.49x + 41.55 (0.679) | 1.67x + 163.54 (0.499) |
| (b) Approach 2: Calibration 1971–2014 odd years | ||||||
| Day, t | Sample Size | Regression Equation, y = mx + c (r2) | ||||
| Jasper—Fort McMurray | Hinton—Fort McMurray | Athabasca—Fort McMurray | Jasper—Hinton | Hinton—Athabasca | ||
| t | 8030 | 4.11x + 280.31 (0.483) | 2.36x + 230.01 (0.549) | 1.24x + 102.34 (0.875) | 1.78x + 18.92 (0.927) | 1.89x + 106.44 (0.616) |
| t-1 | 8029 | 4.10x + 282.63 (0.486) | 2.36x + 228.89 (0.552) | 1.26x + 90.59 (0.914) | 1.79x + 17.79 (0.941) | 1.92x + 101.63 (0.635) |
| t-2 | 8028 | 4.08x + 284.14 (0.482) | 2.38x + 226.23 (0.560) | 1.27x + 87.47 (0.925) | 1.77x + 20.08 (0.913) | 1.94x + 97.41 (0.651) |
| t-3 | 8027 | 4.08x + 284.15 (0.482) | 2.40x + 222.36 (0.571) | 1.25x + 95.66 (0.897) | 1.72x + 23.94 (0.866) | 1.94x + 97.36 (0.652) |
| t-4 | 8026 | 4.10x + 282.64 (0.487) | 2.42x + 219.68 (0.579) | 1.22x + 108.88 (0.853) | 1.68x + 27.64 (0.822) | 1.91x + 102.38 (0.632) |
| t-5 | 8025 | 4.11x + 281.56 (0.490) | 2.41x + 221.11 (0.575) | 1.19x + 122.06 (0.810) | 1.64x + 30.74 (0.787) | 1.87x + 109.61 (0.604) |
| t-6 | 8024 | 4.10x + 283.02 (0.486) | 2.38x + 226.55 (0.559) | 1.16x + 134.05 (0.773) | 1.61x + 33.31 (0.758) | 1.83x + 116.80 (0.577) |
| t-7 | 8023 | 4.05x + 287.27 (0.474) | 2.33x + 233.81 (0.539) | 1.14x + 144.95 (0.739) | 1.58x + 35.51 (0.733) | 1.79x + 123.37 (0.553) |
| t-8 | 8022 | 3.98x + 293.11 (0.458) | 2.29x + 241.29 (0.519) | 1.12x + 154.82 (0.709) | 1.56x + 37.44 (0.712) | 1.75x + 129.12 (0.532) |
| t-9 | 8021 | 3.91x + 299.18 (0.441) | 2.25x + 248.36 (0.500) | 1.09x + 164.09 (0.682) | 1.54x + 39.29 (0.693) | 1.73x + 133.96 (0.515) |
| t-10 | 8020 | 3.84x + 304.9 (0.426) | 2.21x + 254.71 (0.484) | 1.07x + 173.16 (0.655) | 1.52x + 41.03 (0.674) | 1.70x + 138.20 (0.498) |
Table 4.
Summary of the results to show the models’ performance in terms of coefficient of determination (r2), Nash–Sutcliffe efficiency coefficient (ENS), root mean square error (RMSE), and predictive capability.
Table 4.
Summary of the results to show the models’ performance in terms of coefficient of determination (r2), Nash–Sutcliffe efficiency coefficient (ENS), root mean square error (RMSE), and predictive capability.
| Model Type | r2 | ENS | RMSE [m3/s] | Predictive Capability | |
|---|---|---|---|---|---|
| Approach 1: Calibration 1971–2000/Validation 2001–2014 | |||||
| Nonsequential | Jasper—Fort McMurray | 0.74 | 0.68 | 237 | 5 days |
| Hinton—Fort McMurray | 0.81 | 0.73 | 215 | 4 days | |
| Athabasca—Fort McMurray | 0.99 | 0.99 | 49 | 2 days | |
| Sequential | Jasper—Hinton—Athabasca—Fort McMurray | 0.98 | 0.98 | 66 | 6 days |
| Multi-input | Jasper/Hinton/Athabasca—Fort McMurray | 0.99 | 0.98 | 53 | 2 days |
| Approach 2: Calibration 1971–2014 odd years/Validation 1971–2014 even years | |||||
| Nonsequential | Jasper—Fort McMurray | 0.84 | 0.81 | 183 | 5 days |
| Hinton—Fort McMurray | 0.87 | 0.85 | 164 | 4 days | |
| Athabasca—Fort McMurray | 0.99 | 0.99 | 46 | 2 days | |
| Sequential | Jasper—Hinton—Athabasca—Fort McMurray | 0.99 | 0.99 | 43 | 6 days |
| Multi-input | Jasper/Hinton/Athabasca—Fort McMurray | 0.99 | 0.98 | 39 | 2 days |
Table 5.
Summary of statistical performance indices estimated for model predictions of inter-annual variations using: (a) Approach 1 (b) Approach 2.
Table 5.
Summary of statistical performance indices estimated for model predictions of inter-annual variations using: (a) Approach 1 (b) Approach 2.
| (a) Approach 1: Calibration 1971–2000/Validation 2001–2014 | |||||||
| Validation Year | Regression Equation, y = mx + c (r2) | ENS | RMSE [m3/s] | Validation Year | Regression Equation, y = mx + c (r2) | ENS | RMSE [m3/s] |
| 2001 | 0.67x + 265.55 (0.51) | 0.40 | 371.21 | 2008 | 0.91x + 87.35 (0.74) | 0.69 | 234.77 |
| 2002 | 1.57x − 14.27 (0.86) | −0.24 | 294.07 | 2009 | 1.16x + 24.81 (0.88) | 0.72 | 190.75 |
| 2003 | 1.05x + 55.93 (0.86) | 0.77 | 188.26 | 2010 | 1.36x − 58.26 (0.85) | 0.41 | 230.67 |
| 2004 | 0.89x + 45.85 (0.77) | 0.75 | 254.55 | 2011 | 0.49x + 218.27 (0.75) | 0.64 | 471.08 |
| 2005 | 0.81x − 10.44 (0.82) | 0.74 | 254.55 | 2012 | 0.65x + 124.24 (0.82) | 0.75 | 307.49 |
| 2006 | 1.33x − 48.72 (0.74) | 0.15 | 266.10 | 2013 | 0.53x + 168.89 (0.77) | 0.64 | 440.13 |
| 2007 | 0.58x + 198.89 (0.55) | 0.54 | 389.44 | 2014 | 0.79x + 96.36 (0.76) | 0.76 | 242.92 |
| (b) Approach 2: Calibration 1971–2014 odd years/Validation 1971–2014 even years | |||||||
| Validation Year | Regression Equation, y = mx + c (r2) | ENS | RMSE [m3/s] | Validation Year | Regression Equation, y = mx + c (r2) | ENS | RMSE [m3/s] |
| 1972 | 0.60x + 179.76 (0.77) | 0.70 | 353.08 | 1994 | 0.85x + 128.74 (0.89) | 0.88 | 170.11 |
| 1974 | 0.52x + 183.69 (0.69) | 0.54 | 480.40 | 1996 | 0.61x + 112.05 (0.86) | 0.69 | 374.13 |
| 1976 | 0.70x + 143.48 (0.57) | 0.53 | 328.23 | 1998 | 1.12x + 52.95 (0.75) | 0.45 | 253.13 |
| 1978 | 0.70x + 76.25 (0.75) | 0.67 | 312.82 | 2000 | 1.01x + 164.00 (0.83) | 0.61 | 247.81 |
| 1980 | 0.65x + 153.92 (0.68) | 0.65 | 333.83 | 2002 | 1.53x + 66.13 (0.84) | −0.69 | 343.80 |
| 1982 | 0.64x + 200.96 (0.75) | 0.74 | 307.15 | 2004 | 0.90x + 107.44 (0.80) | 0.78 | 206.82 |
| 1984 | 0.94x + 56.12 (0.80) | 0.78 | 199.60 | 2006 | 1.30x + 32.13 (0.73) | −0.08 | 299.97 |
| 1986 | 0.56x + 224.96 (0.63) | 0.61 | 394.78 | 2008 | 0.88x + 174.58 (0.70) | 0.58 | 273.30 |
| 1988 | 0.94x + 177.73 (0.82) | 0.68 | 241.49 | 2010 | 1.37x + 8.82 (0.88) | 0.25 | 260.42 |
| 1990 | 0.62x + 172.89 (0.81) | 0.75 | 322.99 | 2012 | 0.63x + 203.96 (0.79) | 0.76 | 305.67 |
| 1992 | 1.26x + 19.80 (0.78) | 0.26 | 265.56 | 2014 | 0.76x + 182.60 (0.72) | 0.71 | 266.34 |
© 2020 by the authors. Licensee MDPI, Basel, Switzerland. This article is an open access article distributed under the terms and conditions of the Creative Commons Attribution (CC BY) license (http://creativecommons.org/licenses/by/4.0/).
Share and Cite
MDPI and ACS Style
Belvederesi, C.; Dominic, J.A.; Hassan, Q.K.; Gupta, A.; Achari, G. Predicting River Flow Using an AI-Based Sequential Adaptive Neuro-Fuzzy Inference System. Water 2020, 12, 1622. https://doi.org/10.3390/w12061622
AMA Style
Belvederesi C, Dominic JA, Hassan QK, Gupta A, Achari G. Predicting River Flow Using an AI-Based Sequential Adaptive Neuro-Fuzzy Inference System. Water. 2020; 12(6):1622. https://doi.org/10.3390/w12061622
Chicago/Turabian StyleBelvederesi, Chiara, John A. Dominic, Quazi K. Hassan, Anil Gupta, and Gopal Achari. 2020. "Predicting River Flow Using an AI-Based Sequential Adaptive Neuro-Fuzzy Inference System" Water 12, no. 6: 1622. https://doi.org/10.3390/w12061622
Note that from the first issue of 2016, this journal uses article numbers instead of page numbers. See further details here.