1. Introduction
Distribution system (DS) deficiencies may play a role in the occurrence of waterborne disease outbreaks [
1]. Ageing of pipeline infrastructure is going to become more problematic over time by increasing the probability of experiencing sustained low/negative pressure conditions in the network (pipe breaks), leading to possible intrusion from points of leakage. Assessment of public health risk associated with such type of events may be achieved through modeling. While reliable hydraulic and water quality models can be used to simulate ingress of contaminated water and its propagation into a network, the use of quantitative microbial risk assessment (QMRA) models is required to estimate the potential health risk. QMRA and management approaches can contribute in bringing safer water to consumers [
2].
Modeling of water quality under pressure deficient conditions. Integration of pressure-driven hydraulic analysis into QMRA models is required for a more accurate risk analysis of water contamination resulting from accidental intrusion under sustained pressure-deficient conditions (PDCs). In such conditions, a reliable estimation of intrusion points, contamination mass rate entering the DS, and fate/transport of contamination through the network cannot be achieved using traditional demand driven-analysis (DDA) models such as EPANET 2 [
3]. Pressure-driven analysis (PDA) was coupled to single species water quality modeling to optimize management strategies (e.g., flushing and isolation actions) by minimizing the mass of consumed contaminant [
4,
5,
6]. A more detailed literature review on hydraulic and water quality modeling under sustained PDCs can be found elsewhere [
7].
Applications of QMRA to drinking water DSs. Despite evidence of drinking water DS deficiencies causing infectious waterborne diseases [
8,
9], the majority of QMRA work has been devoted to assessing risk of drinking water treatment failures [
2]. Viñas et al. [
10] and Hamouda et al. [
11] presented detailed literature reviews on QMRA models applied to microbial contaminants in drinking water DSs. Besner et al. [
12] developed a conceptual model to assess the public health risk associated with intrusion events. QMRA models have been applied to real DSs to evaluate the infection risk associated with the presence of viruses resulting from intrusion events caused from transient PDCs [
13,
14,
15]. Standard QMRA models consider the water is consumed randomly at any time or at fixed times during the day [
14,
16,
17]. The timing of water withdrawals for drinking purpose is an important factor when assessing the probability of infection as a result of intrusion events and may not be the same as the timing of the total consumption [
17,
18]. An improved QMRA that integrates the consumer’s behavior (probability density functions (PDFs) of the numbers of glasses and the volume consumed, and kitchen tap use) was developed and applied to assess the infection risk associated with contamination after main repairs [
18,
19]. They investigated the impact of different parameters such as the location of contamination and the times of valve openings on the infection risk with various pathogens (
Campylobacter,
Cryptosporidium,
Giardia and rotavirus), in the absence of any disinfectant residual. Schijven et al. [
20] also considered consumer behavior to estimate the infection risk from ingestion of contaminated water or inhalation of contaminated aerosol droplets in the case of intentional contamination of different durations and seeding concentrations in a DS.
Improving estimations of the infection risks due to sustained pressure deficient conditions requires numerical approaches that produce realistic estimations of nodal ingress volumes, predictions of propagation throughout the network, and integration of the consumer’s behavior during and after pressure losses. Besner et al. [
16] emphasized the necessity of performing PDA instead of DDA to simulate the infection risk associated with PDCs in future studies. Besides low pressure, the presence of external contamination and pathways are essential for intrusion to occur [
21]. Adjusting the presence of potential pathway for intrusion based on the state of decay of the piping has been proposed [
22,
23].
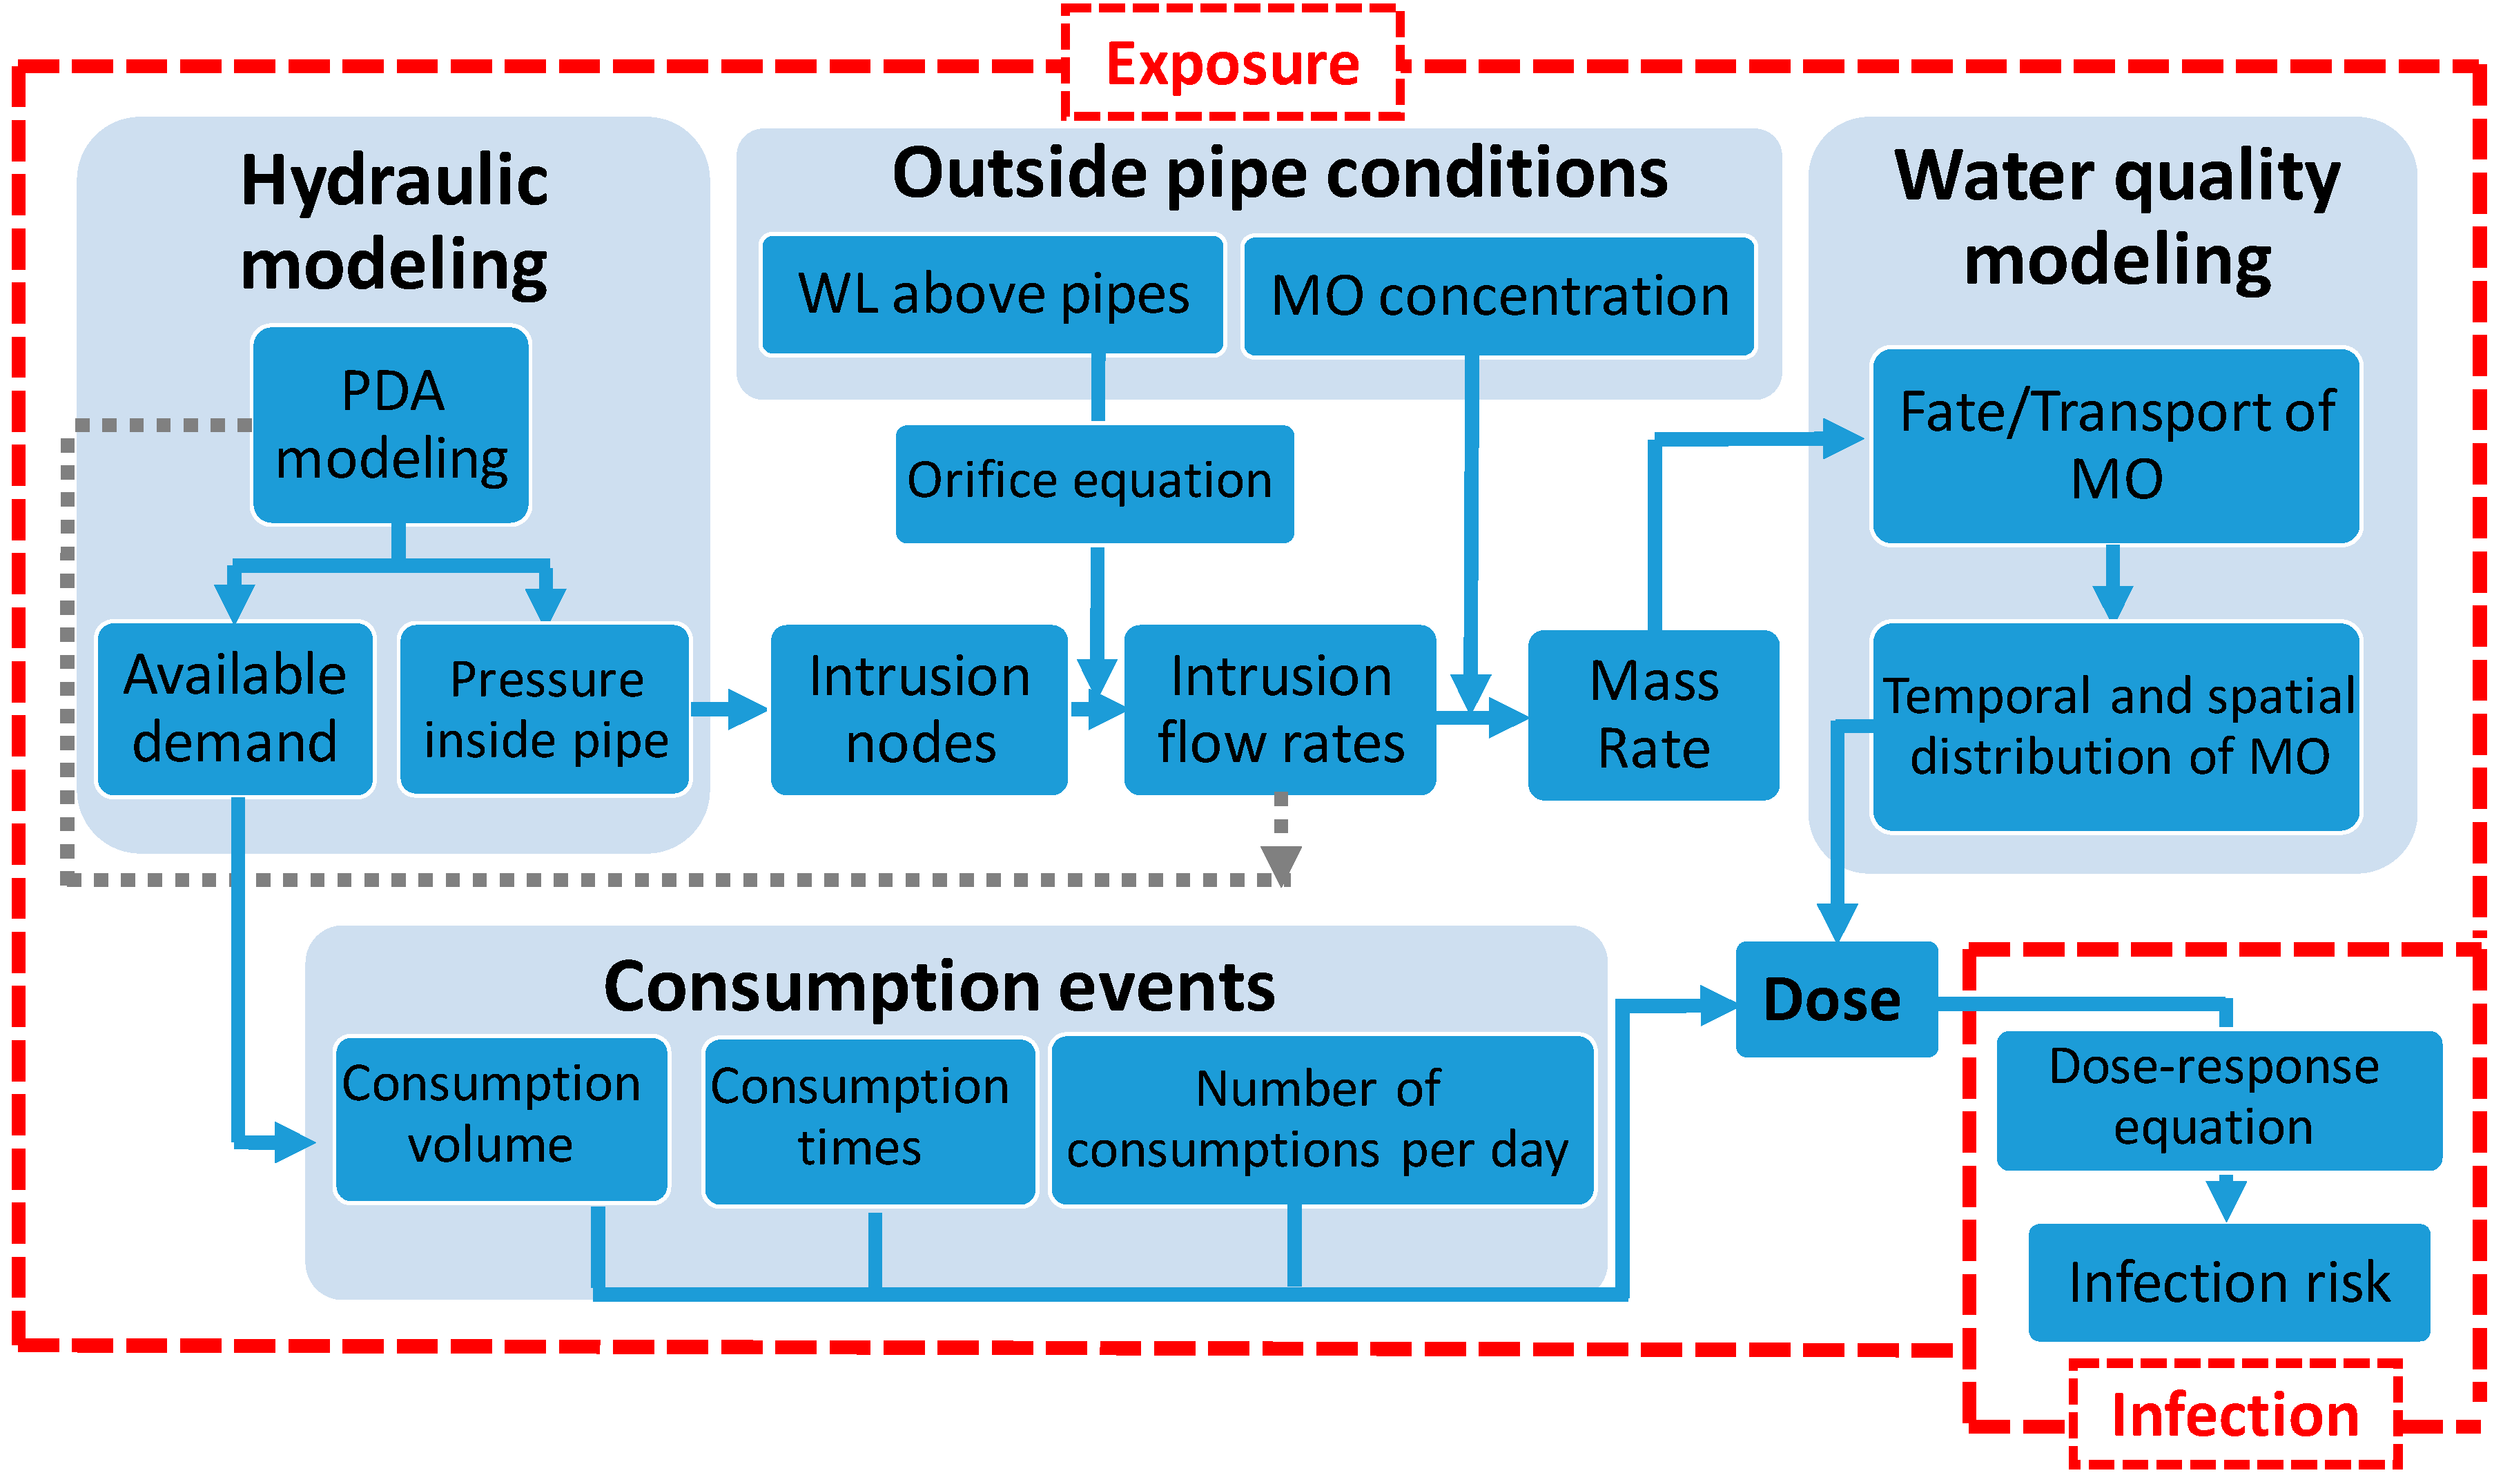
The primary objective of this work was to estimate the infection risk associated with accidental intrusion through leakage points into a DS as a result of unplanned sustained low/negative pressure events (24 h, 10 h, and 1 h). To achieve this goal, several original improvements to the various models were made. First, the QMRA model developed by Blokker et al. [
18] was customized and linked with water quality calculations based on a pressure-driven hydraulic analysis. Then, the estimated contamination mass rate at each intrusion node was adjusted by the assigned leakage demand (proxy for pipe age and material) and the pressure values during PDCs, computed using PDA. Finally, to better simulate the consumers behavior during low-pressure conditions, the consumption of tap water was adjusted based on demand availability (no demand or <5%) on the infection risk. The secondary objective of this work was to propose a basis for the analysis of risk to guide the definition of areas subjected to a boil water advisory or corrective actions. To achieve this goal, we assessed the potential use of the temporal (daily versus event) and spatial distribution of nodal risks to determine the location and the duration of advisories. To the knowledge of the authors, no study so far has quantified the infection risk of accidental intrusion resulting from sustained PDCs, using realistic PDA to adjust intrusion volume for nodal pressure, perform water quality analysis and integrate the impact of demand availability on the consumption during pressure drops.
3. Results
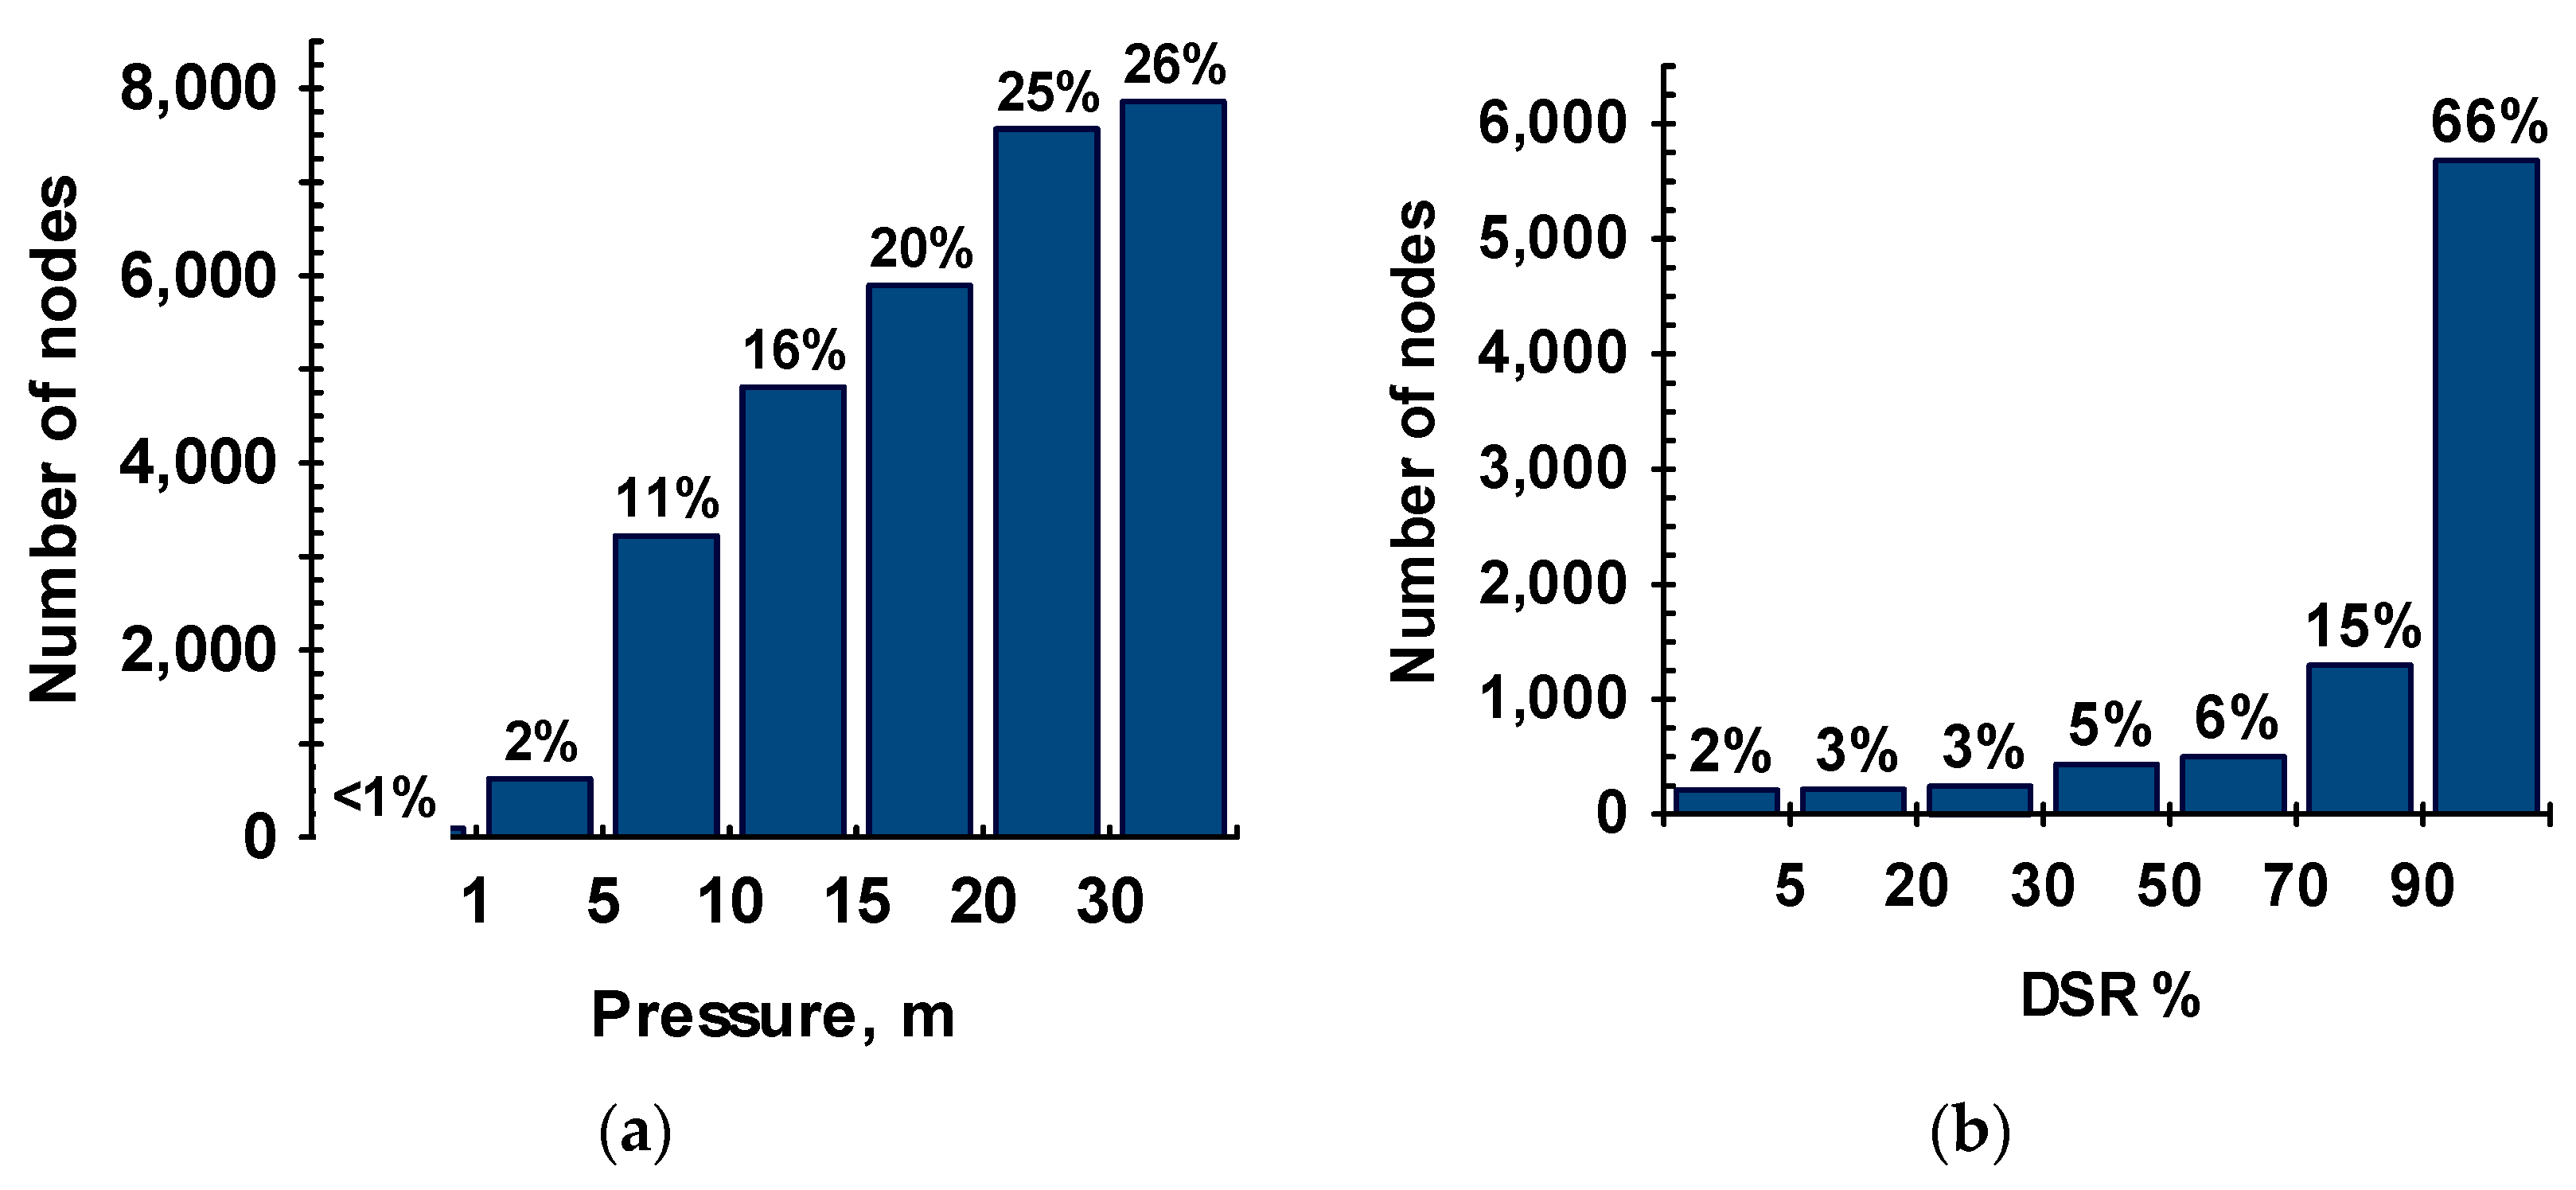
Estimating ingress volumes. Histograms of nodal pressures and demand satisfaction ratios (DSRs: available nodal demand divided by the required demand) using PDA are illustrated in
Figure 2. Fewer than 1% of the nodes (93 nodes) were prone to intrusion as they experienced pressures less than 1 m under PDCs, which corresponded to the set pressure head above pipes. For about 30% of the nodes, the pressure was less than or equal to the required pressure value assumed in this study for full demand satisfaction (15 m). The DSRs for these nodes are shown in
Figure 2b, excluding nodes with no required demand.
Figure 2b shows that 1103 nodes have a DSR of less than 50% during depressurization.
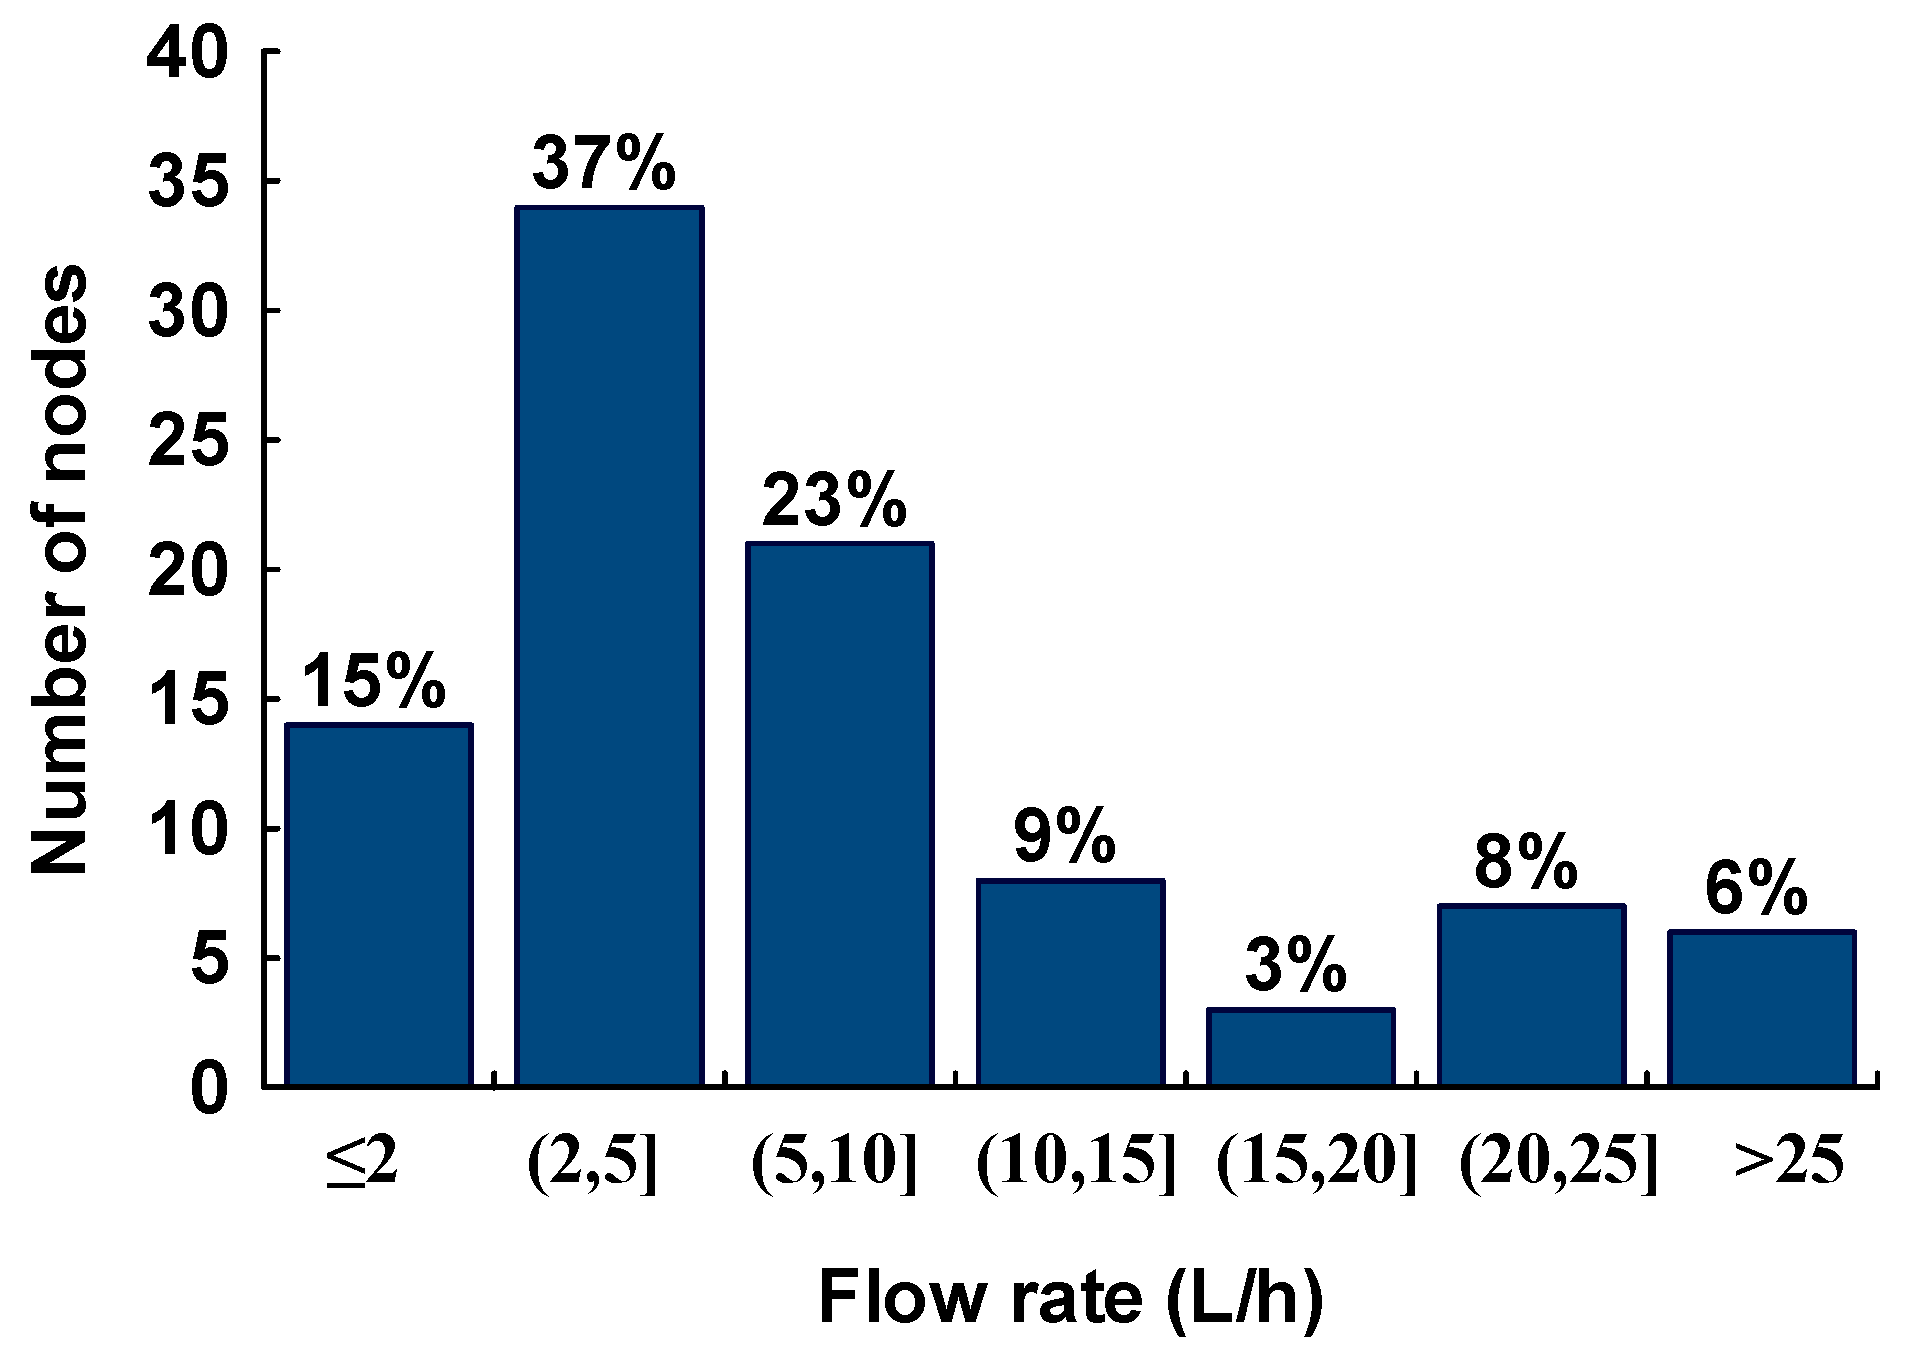
The distribution of intrusion flow rates at the ingress nodes is illustrated in
Figure 3. The maximum flow rate was 56 L/h and about half of the nodes had an intrusion flow rate less than 5 L/h. The contaminated water entered the network at a flow rate of 804 L/h through all the leakage orifices. For the scenarios of 10 and 24 h PDCs, the intrusion flow rate at each node remained constant during the event because of the use of a constant demand. As the 1 h event, with daily consumption pattern, was assumed to occur at the peak demand hour, the nodal intrusion flow rates also corresponded to those shown in
Figure 3.
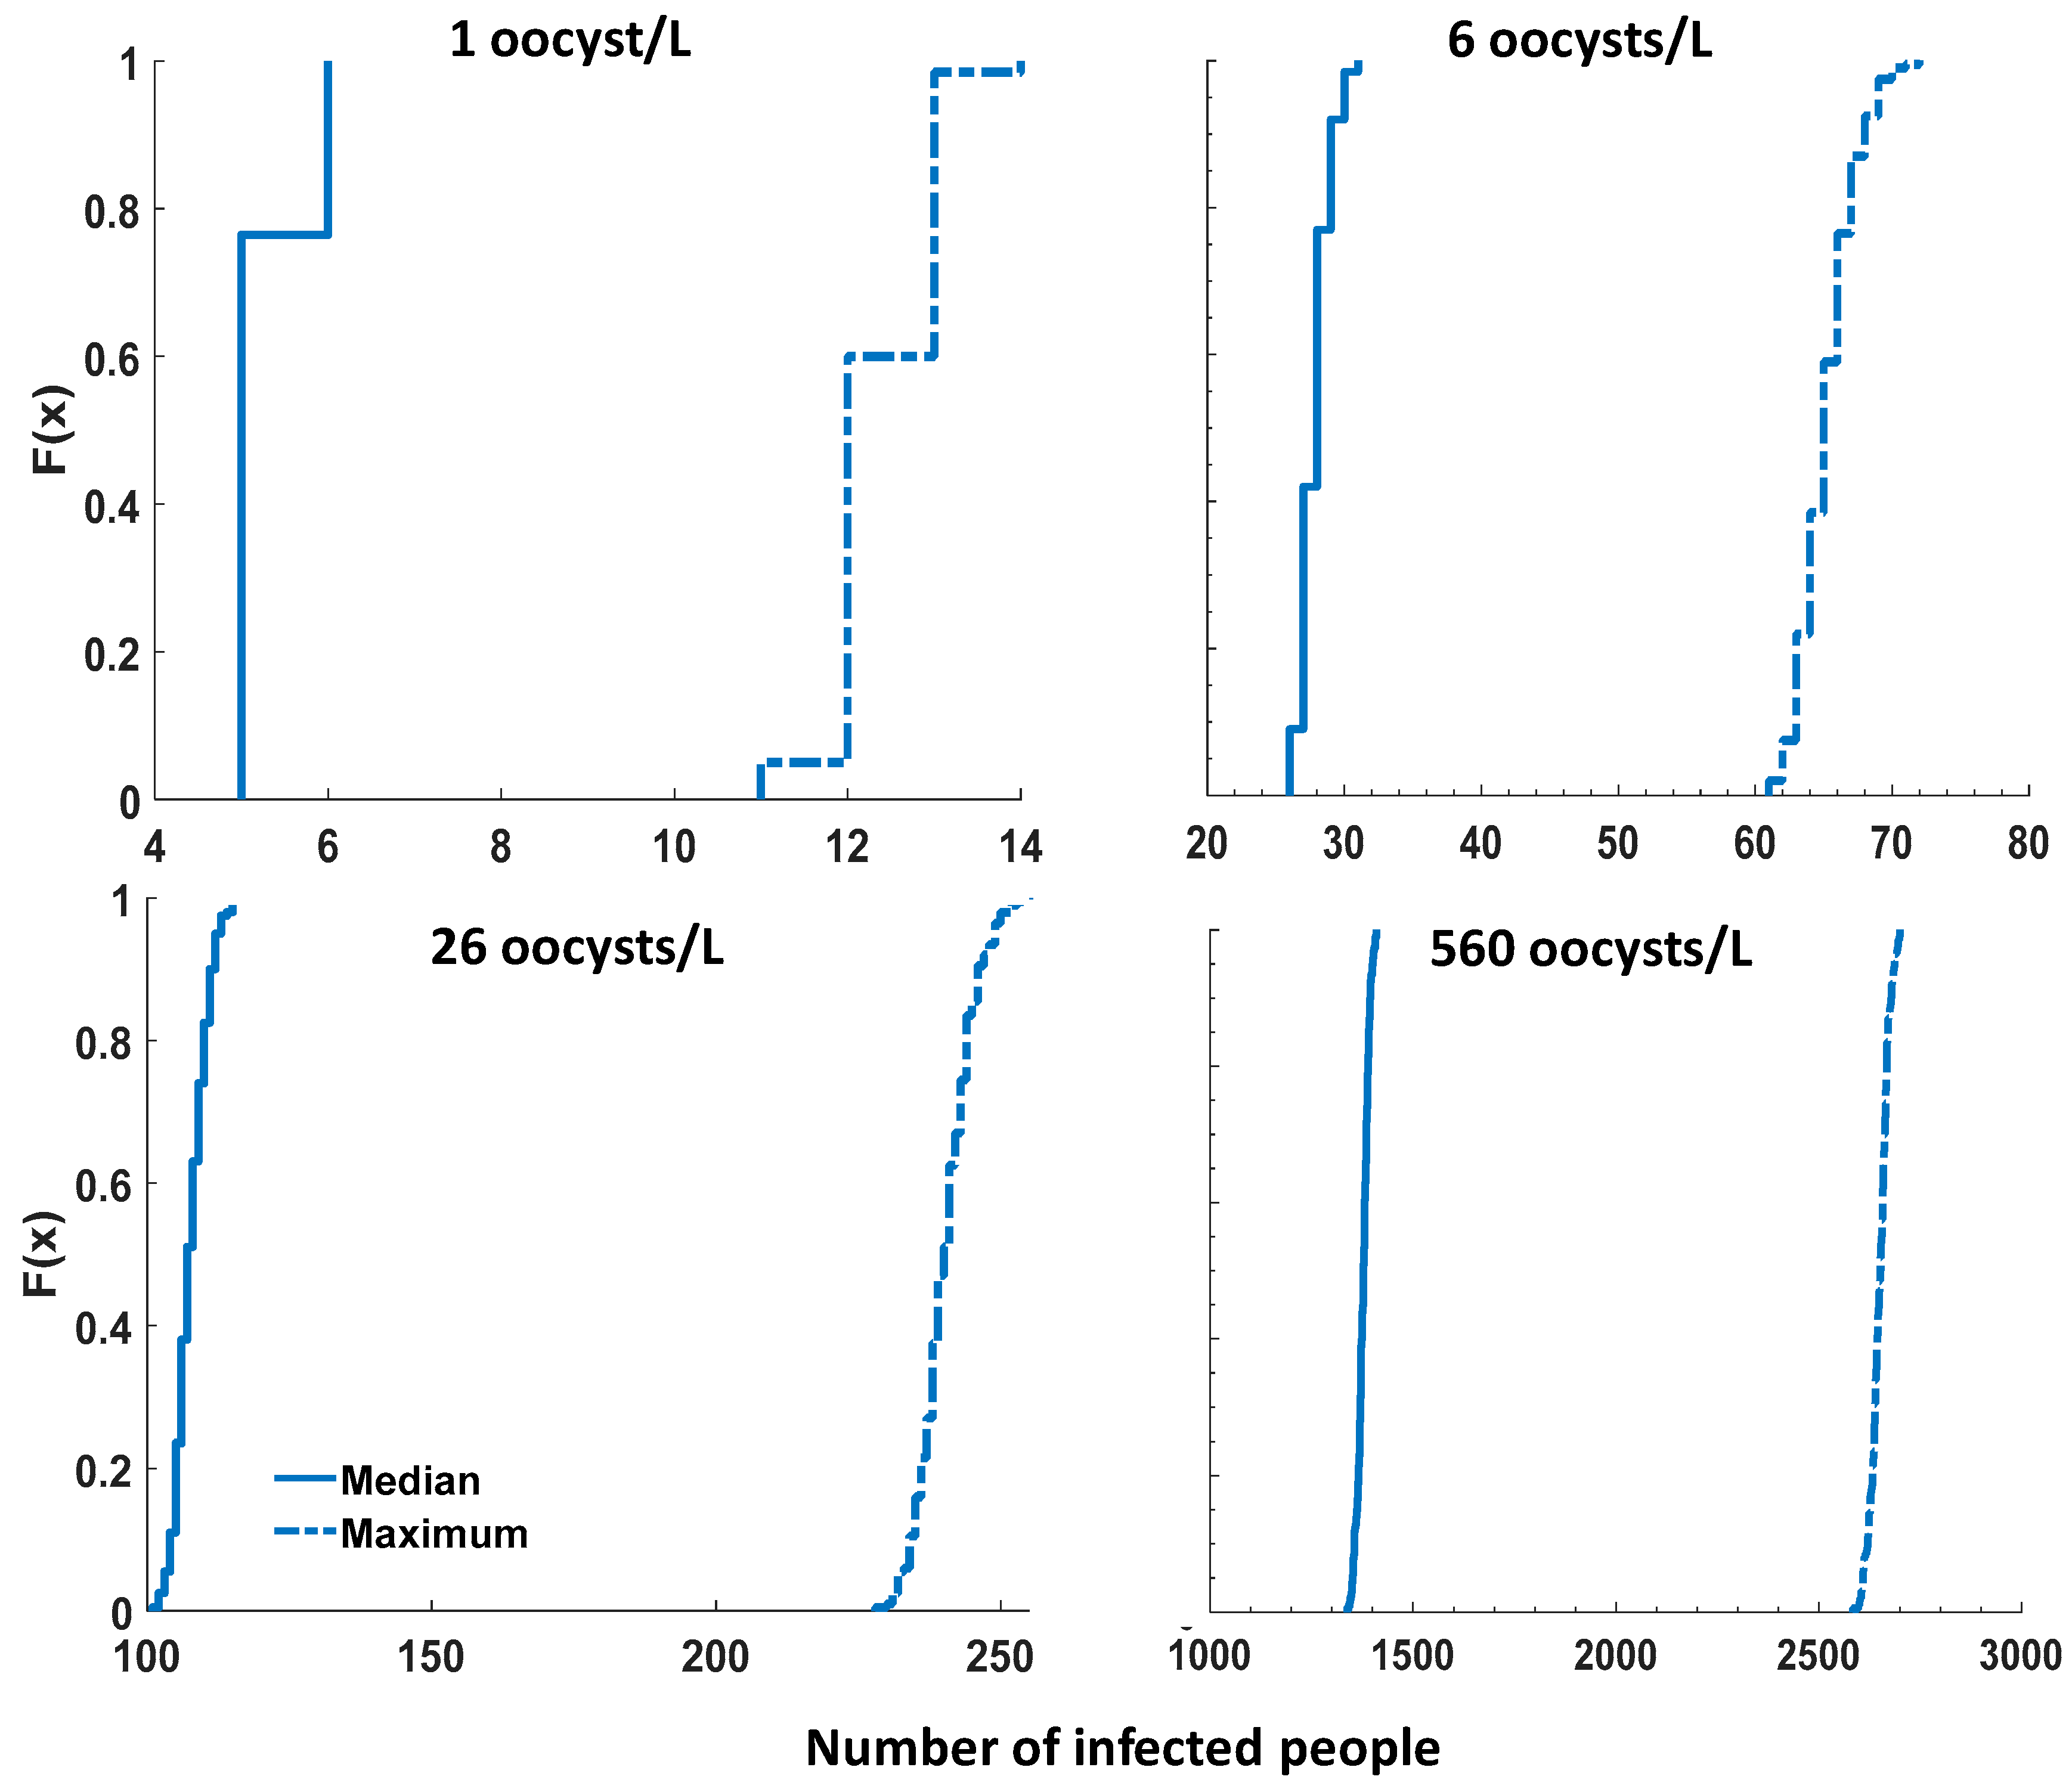
Concentrations of pathogens in sewage. To cover different consumption behaviors, 200 Monte Carlo simulations were carried out for each scenario of
Cryptosporidium concentration in sewage (1, 6, 26, and 560 oocysts/L). The resulting cumulative probability distributions of the number of infected people are plotted in
Figure 4. In this figure, the solid lines correspond to the median infection risk, and the dotted lines are the maximum infection risk. For all concentrations, the number of infected people associated to the maximum infection risk was increased by about two folds compared to the median infection risk. For the concentration of 560 oocysts/L, 50% of the consumption events led to at least 1378 (2652) infected people considering the median (maximum) infection risk. As expected, the number of infected people increased when the
Cryptosporidium concentration increases from 1 to 560 oocysts/L.
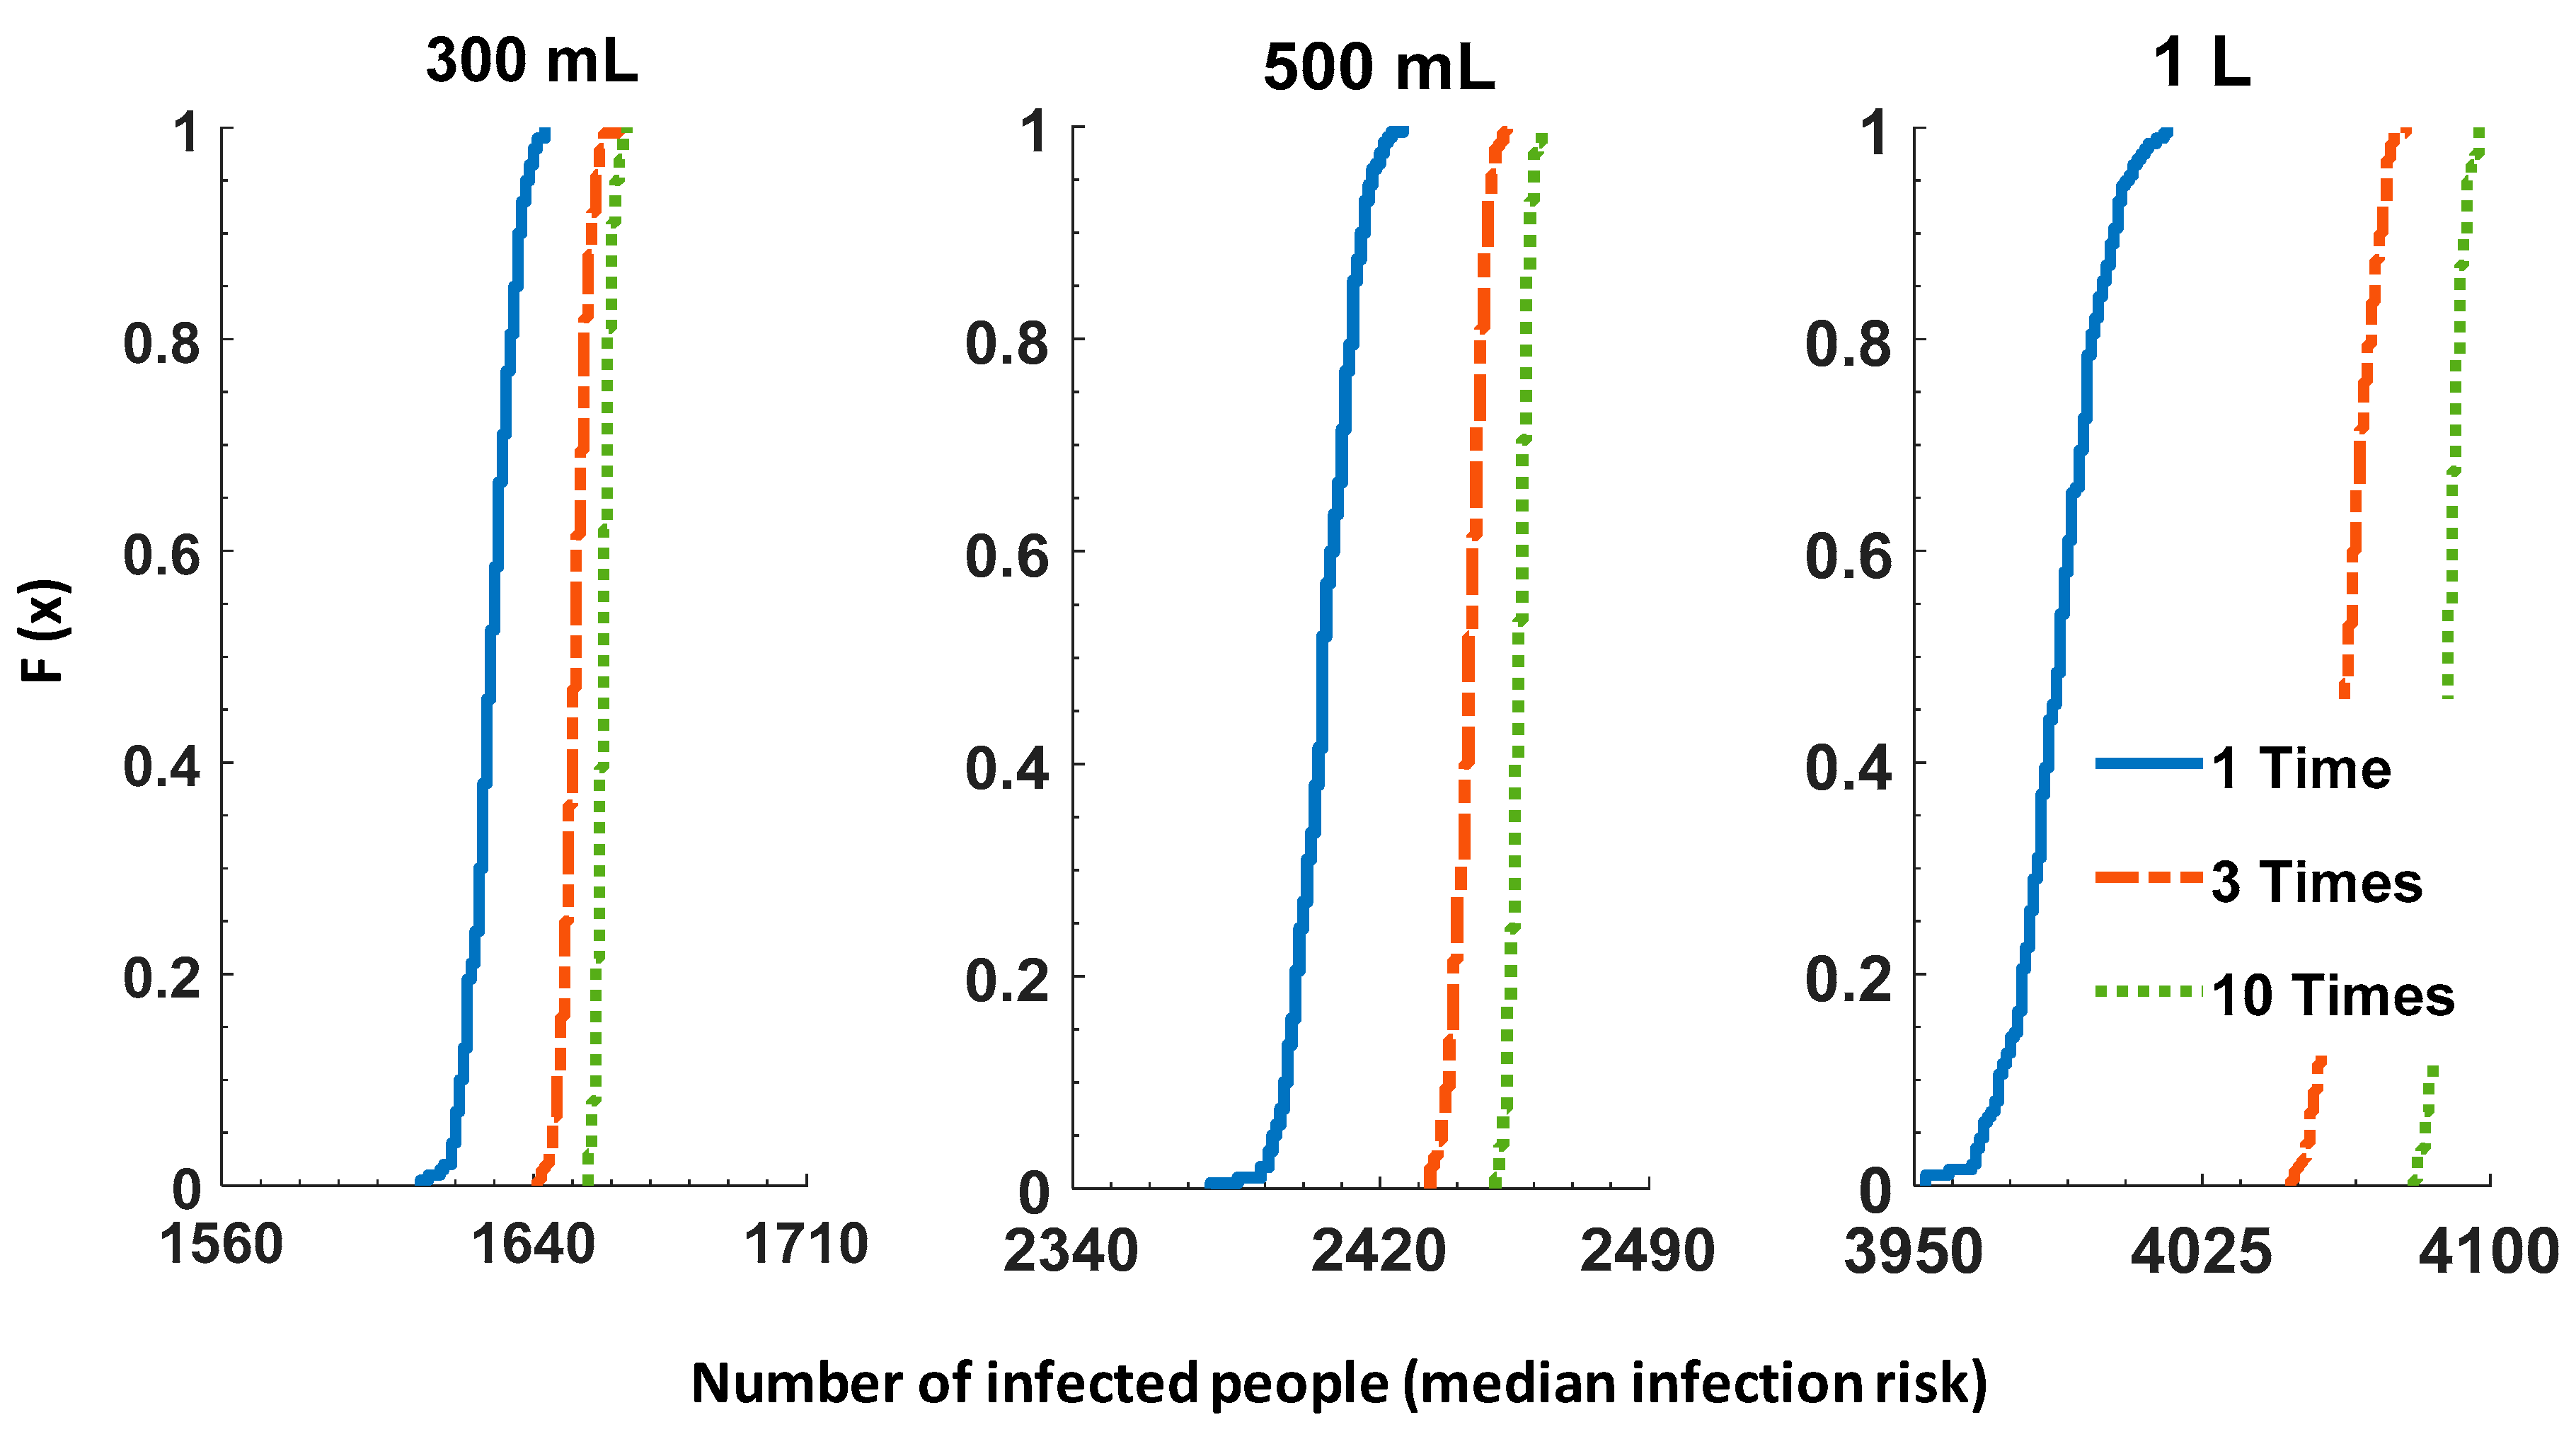
Consumption behavior.Figure 5 shows the sensitivity of the number of infected people over the four-day observation period to the volume of consumption (300 mL, 500 mL or 1 L per day per person) and number of glasses per day (1, 3, or 10). A total of nine scenarios were considered with a
Cryptosporidium concentration of 560 oocysts/L and 24 h of PDCs. As expected, lower volumes of unboiled tap drinking water per person per day largely reduced the infection risk. By decreasing the volume by half (500 mL), the number of infected people decreased by 40%; decreasing the volume to 300 mL reduced the risk further by about 60%. By increasing the number of glasses per day from 1 to 3, 19 more people were likely to be infected for a 300 mL volume, and this value became 62 for a 1 L consumption volume per day per person (based on the values of F(x) = 1).
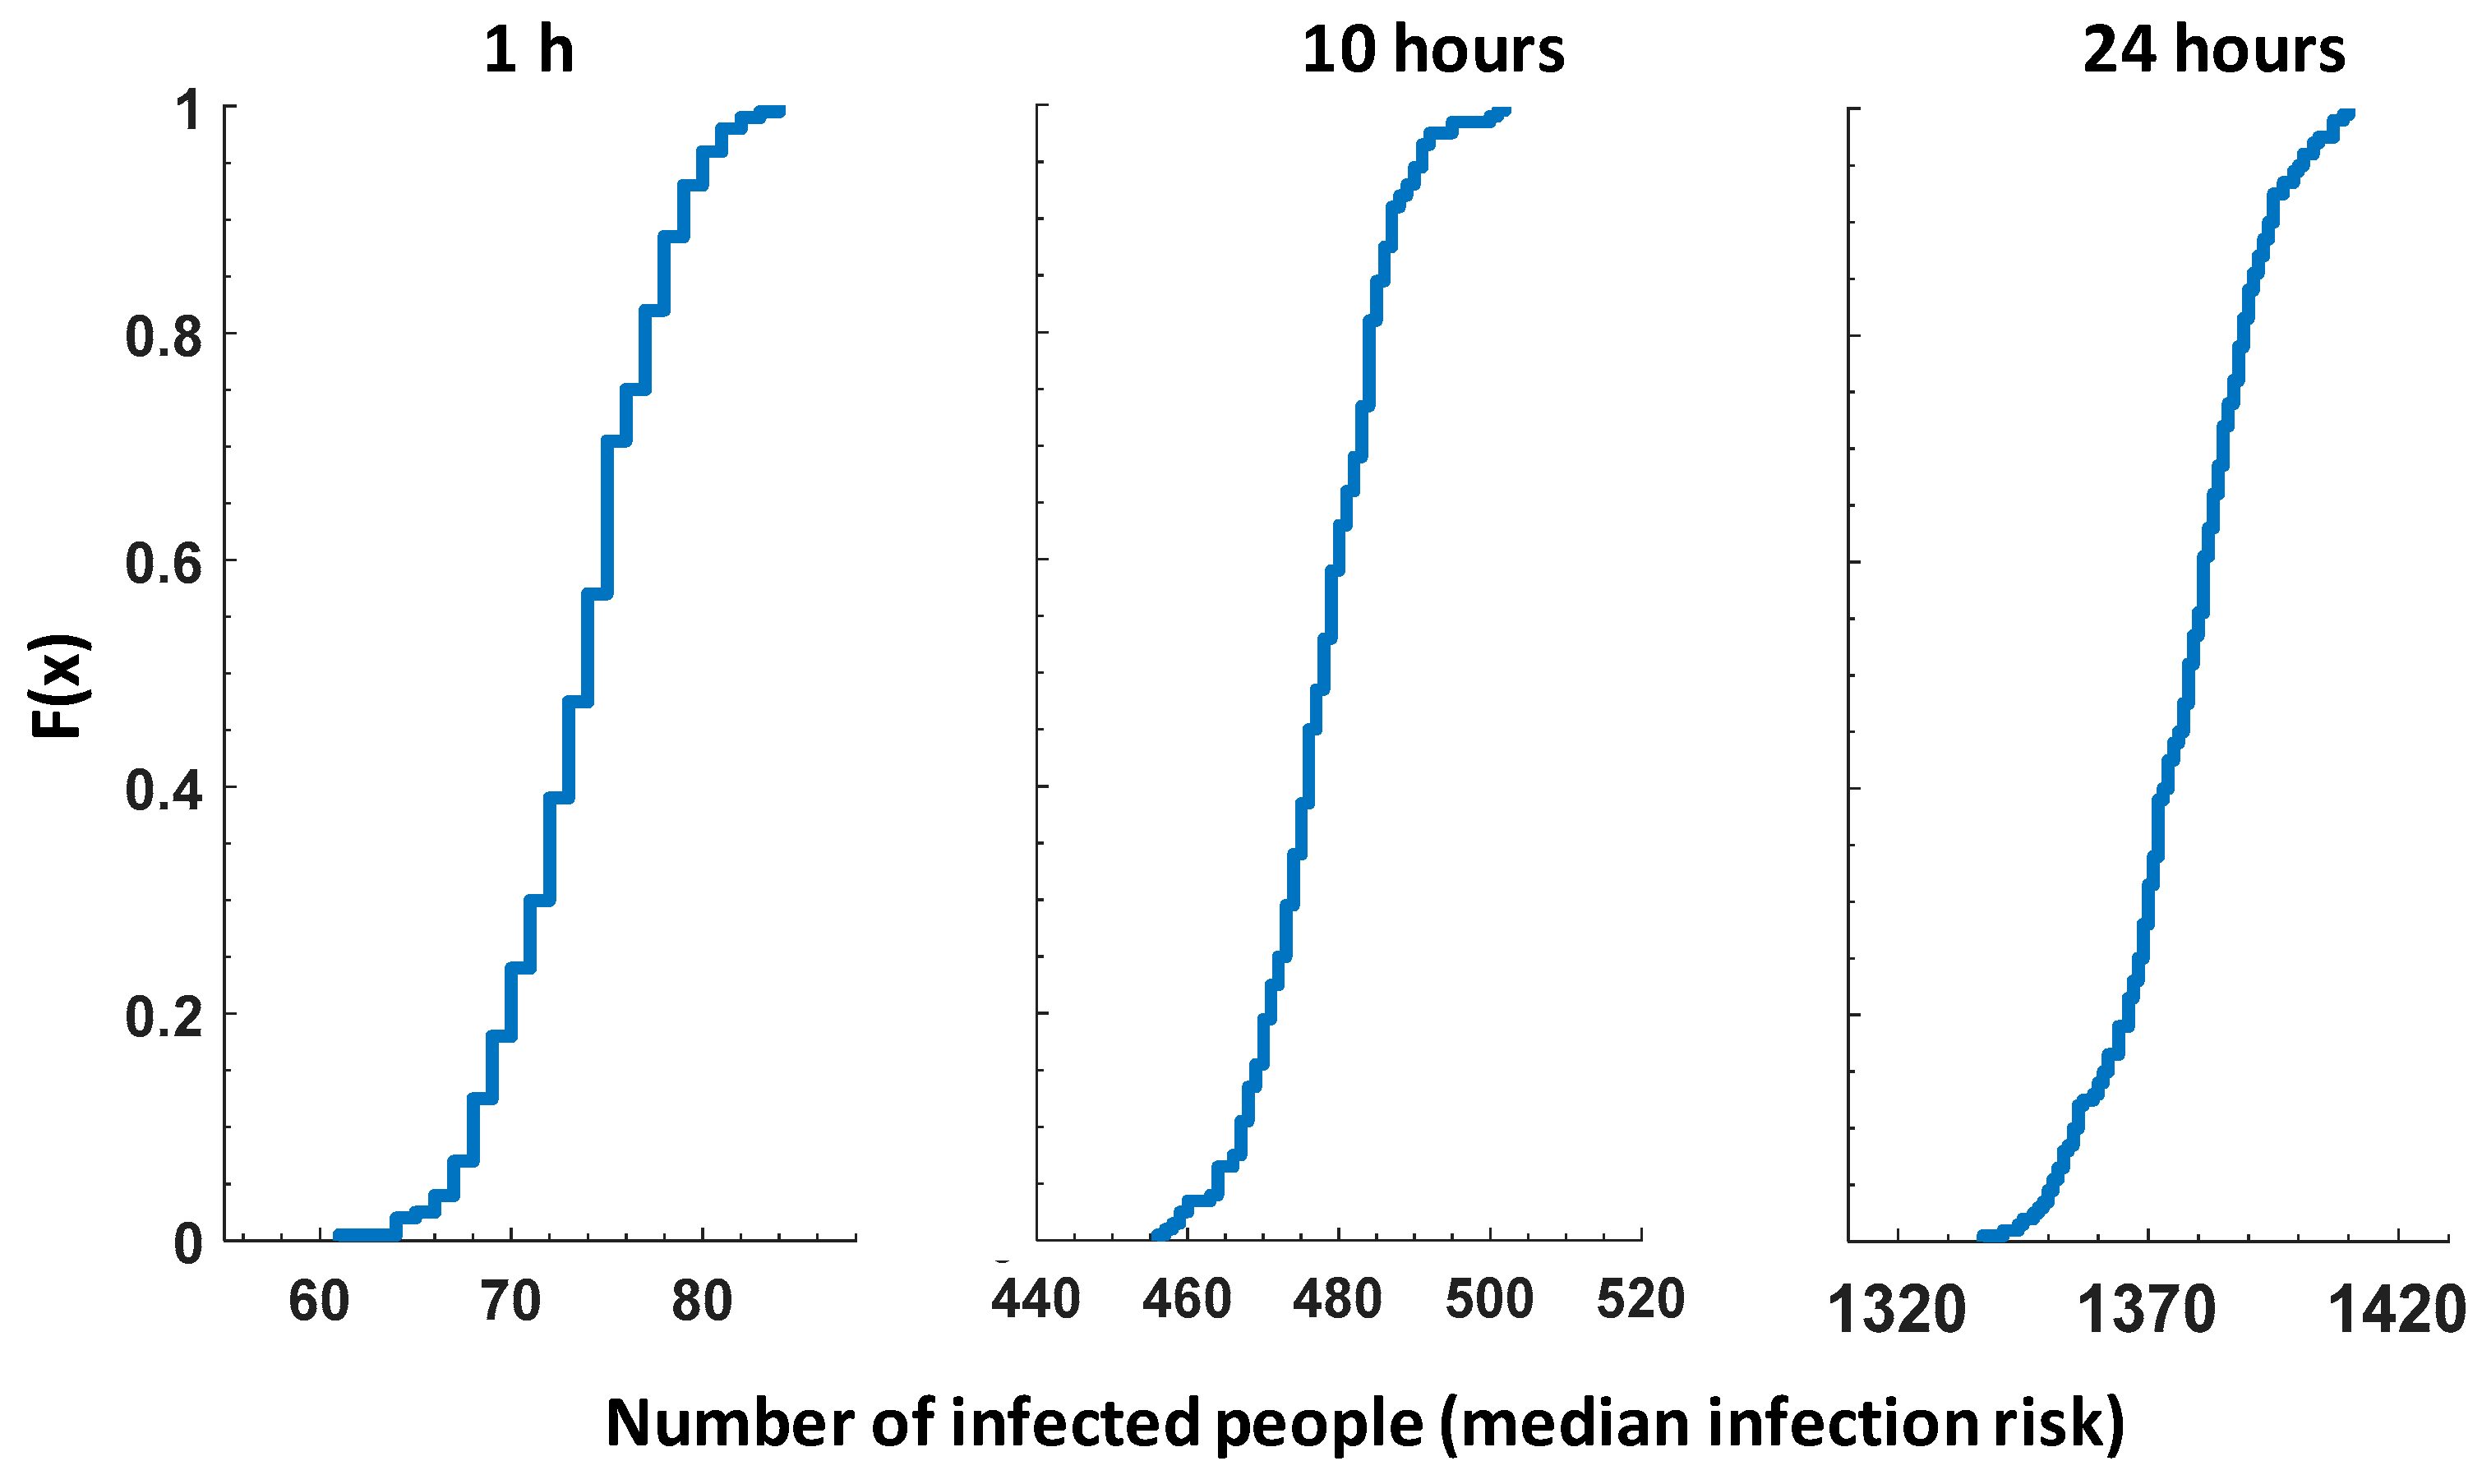
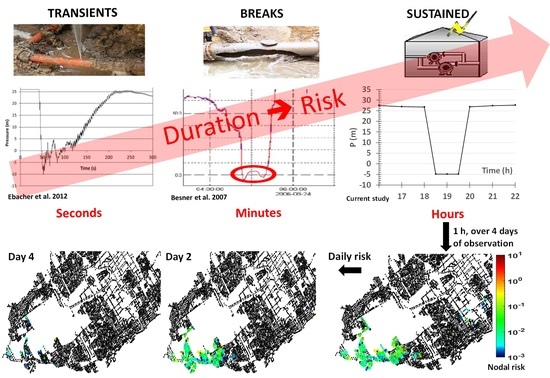
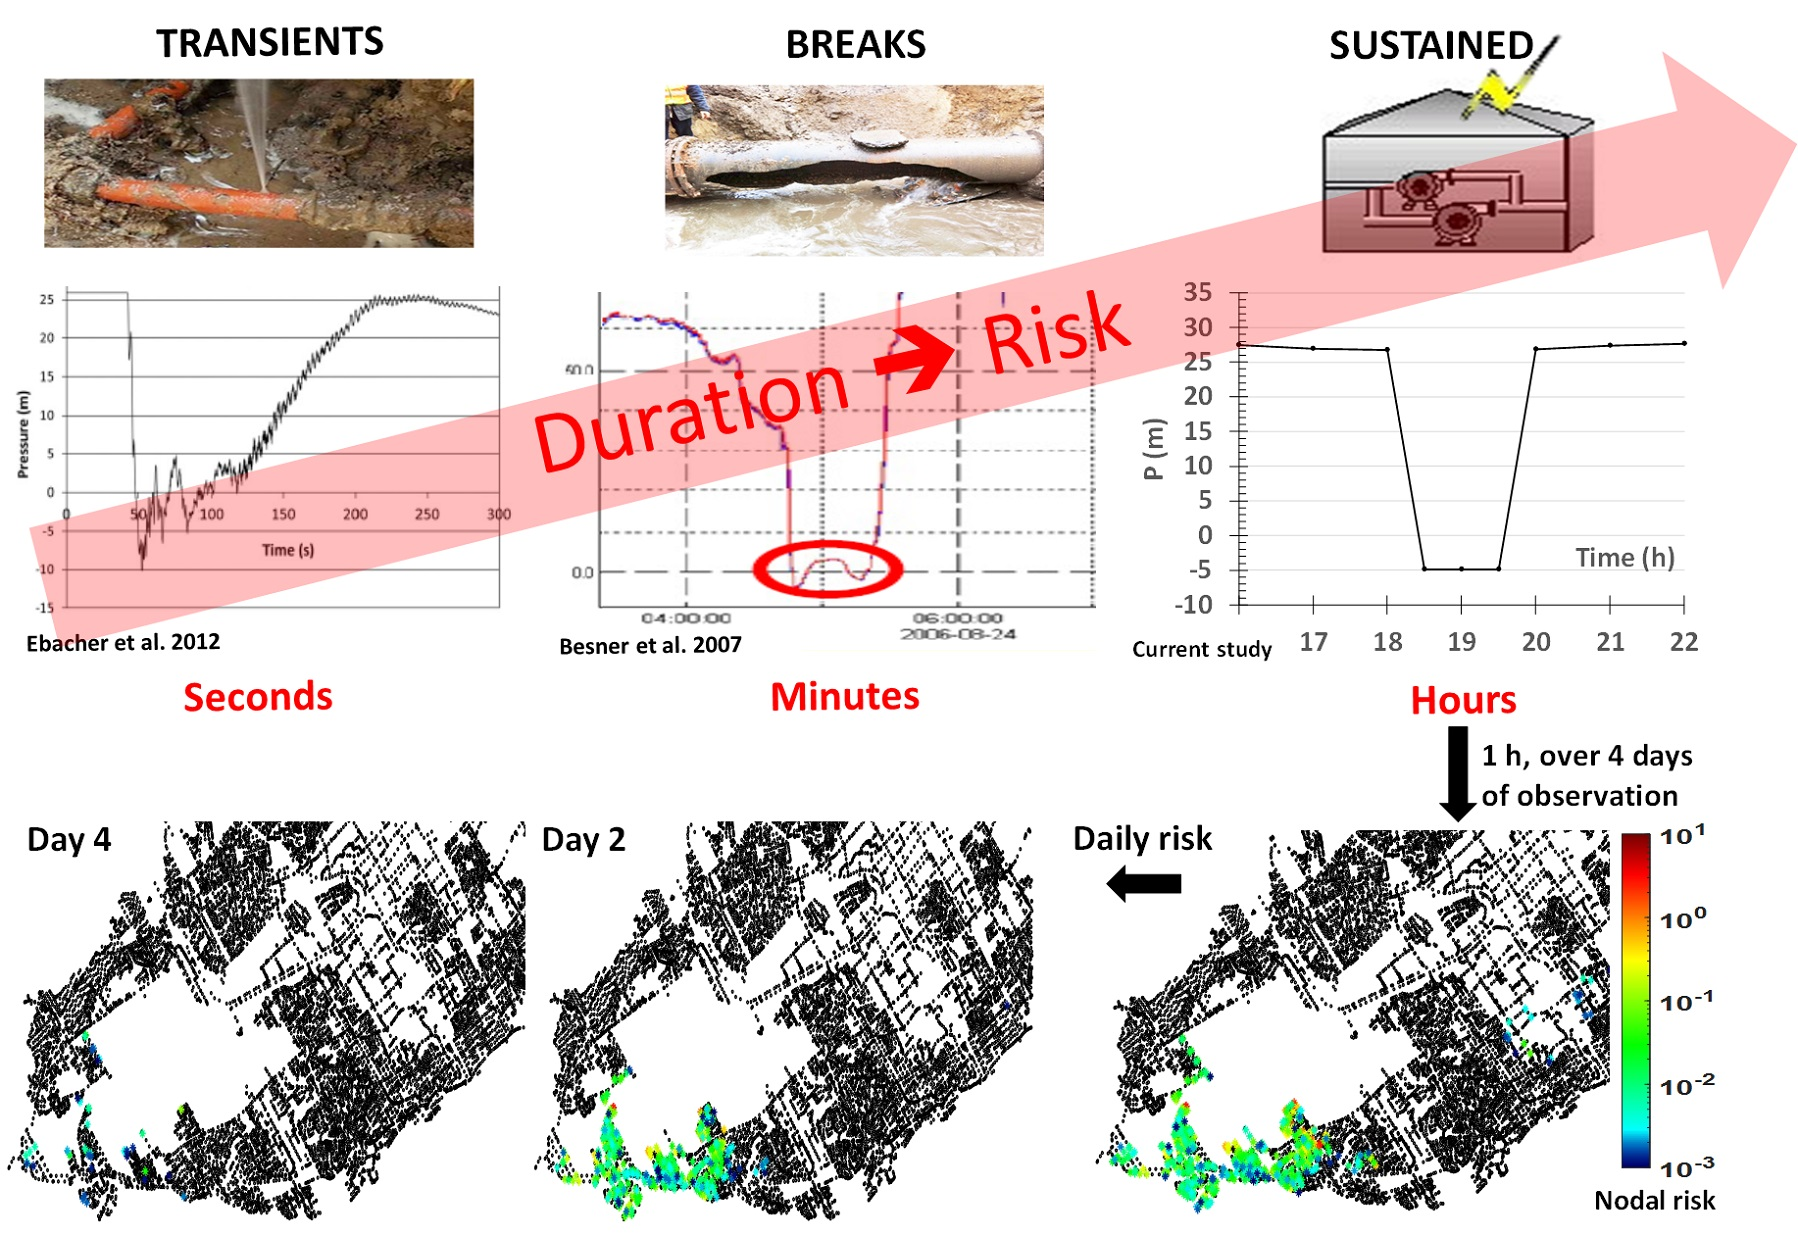
Duration. Shorter duration PDCs can take place in real networks because of WTP shutdowns, pipe breaks or fire flows. The cumulative probability distribution of the number of infected people for 200 random consumption behaviors is shown for different durations of PDCs: 1, 10, and 24 h (
Figure 6). In all scenarios, the timing of the event was adjusted so that the network experienced low/negative pressures at the peak consumption time (i.e., 19:00) of the first day. A significant dependence of the infection risk with the intrusion duration was observed: a lower maximum number of infected people (84) was observed for a 1-h intrusion compared to 502 and 1410 for 10 and 24 h intrusion events, respectively.
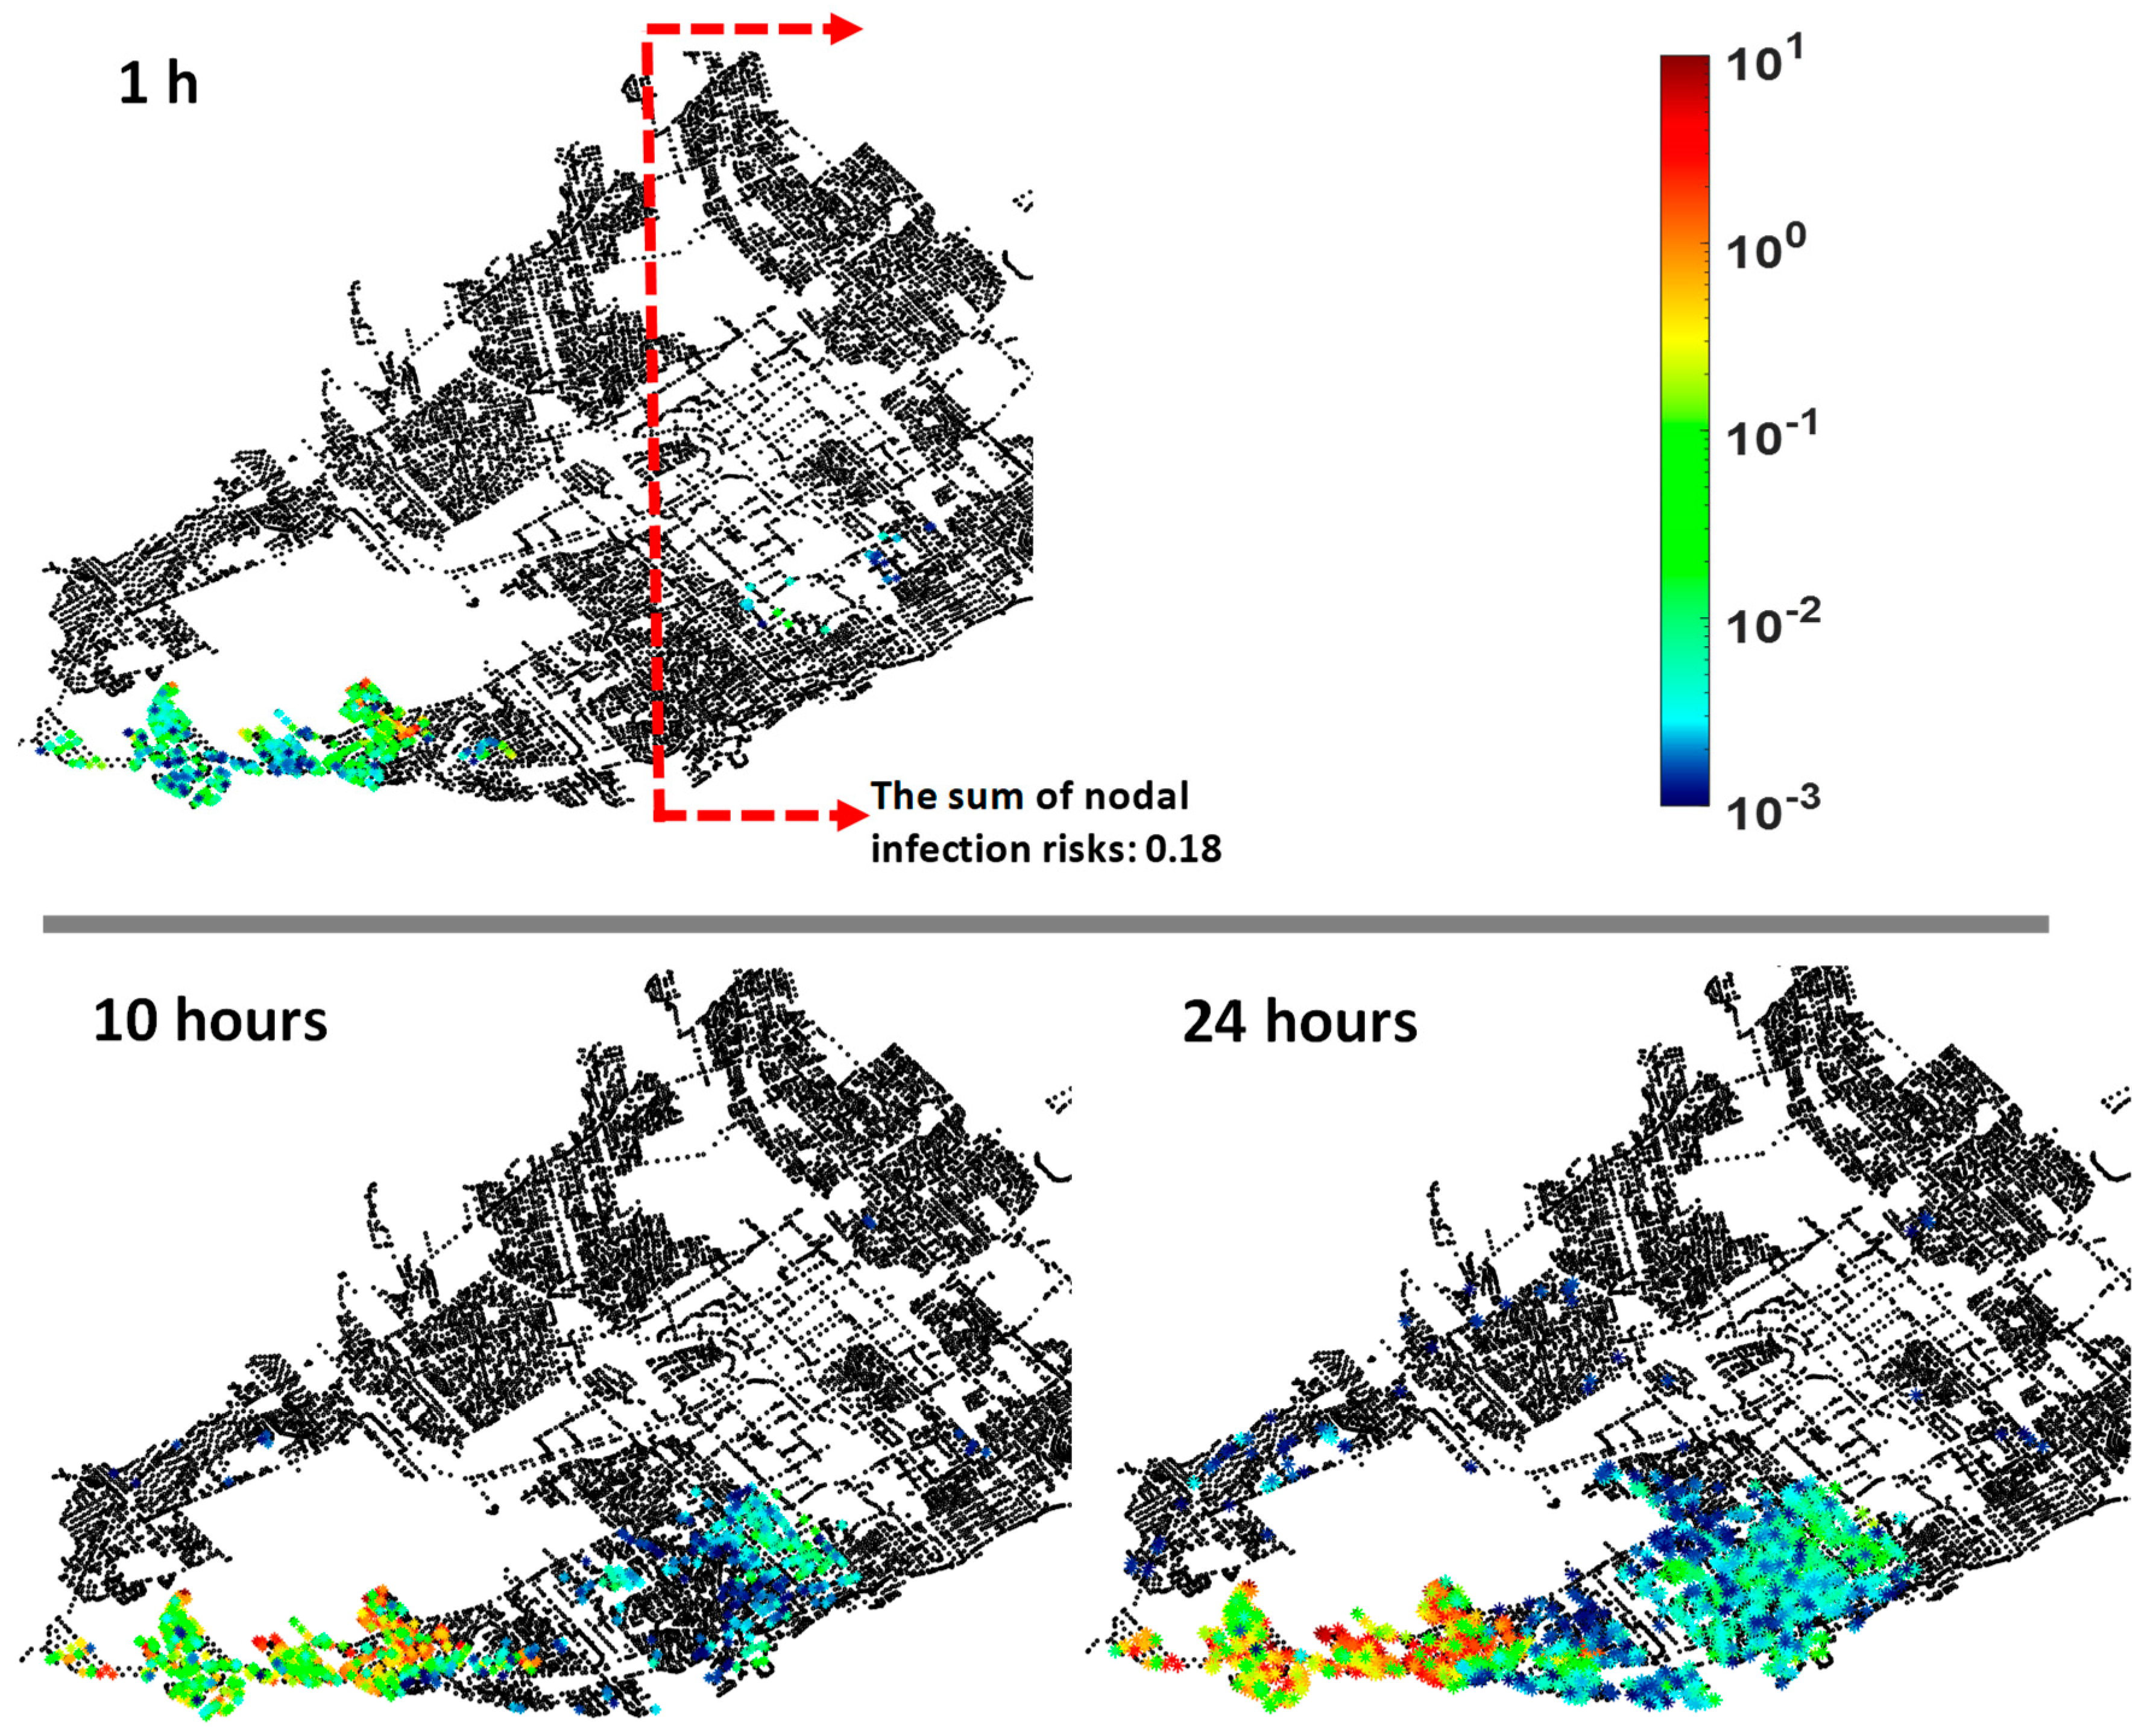
Spatial distribution of nodal infection risk. Besides the number of infected people under PDCs, the temporal and geographical distribution of infection risk is also essential in defining appropriate preventive/corrective actions. In this regard, the probability of infection of the individuals who were assigned to the same node were summed up to predict the nodal risk.
Figure 7 shows the spatial distribution of risk for above-mentioned scenarios corresponding to the consumption events with the maximum number of infected people (F(x) = 1 in
Figure 6). As shown, with increasing duration of intrusion event, not only the nodal risks are were, but also larger areas were at risk.
Daily risk for the 1-h event with daily demand patterns. For the prior analyses, demand was considered constant during the day and equal to the peak hour demand (i.e., 19:00) in the hydraulic model. The reason is that adjusting different intrusion volumes and nodes at each hour of the duration of PDCs using PDA would be computationally intensive. However, we investigated a 1 h PDCs/intrusion using the daily water consumption pattern in the hydraulic model to assess its impact on the infection risk. Over four days of observation, the maximum number of infected people increased to 99 (
Figure S3) with demand patterns compared to 84 with a constant demand in the hydraulic model (
Figure 6, 1 h).
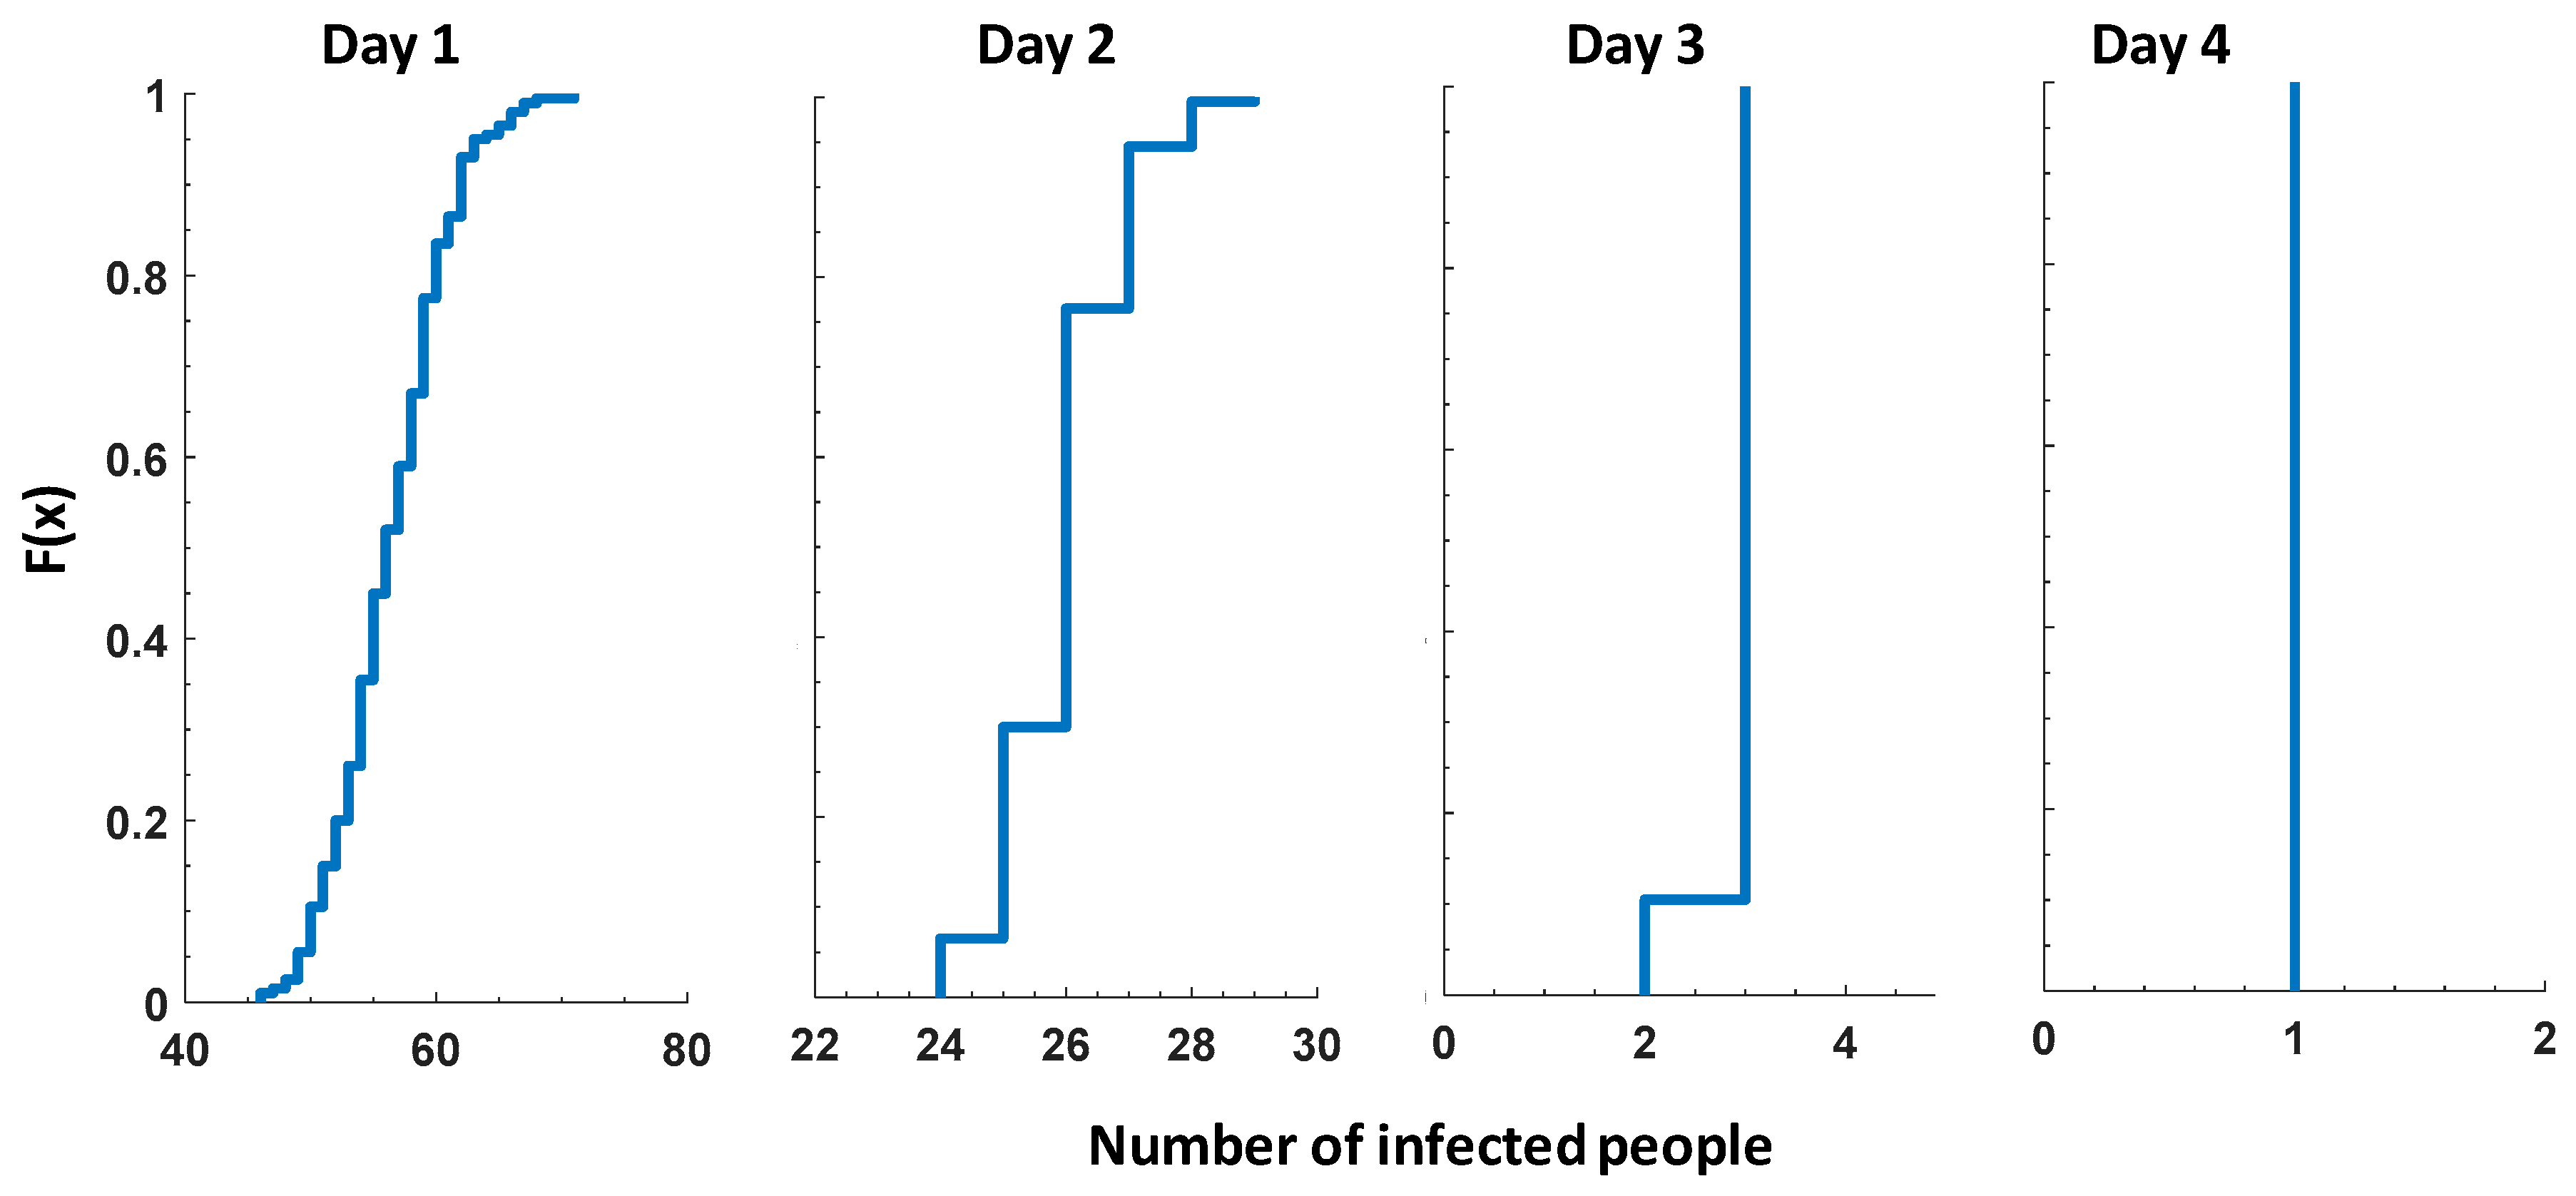
Figure 8 illustrates the daily probability of the number of people infected by
Cryptosporidium according to different consumption behaviors for the day that intrusion occurred (at 18:30) and the three days post-intrusion. The day after the event, the maximum number of infected people was reduced by 59% as compared to the event day. It indicates that, over time, the contaminated water left the network as large volumes of water were used for purposes other than drinking, such as toilet flushing and industrial usage. The maximum numbers of infected people for Days 1–4 were 71, 29, 3 and 1, respectively.
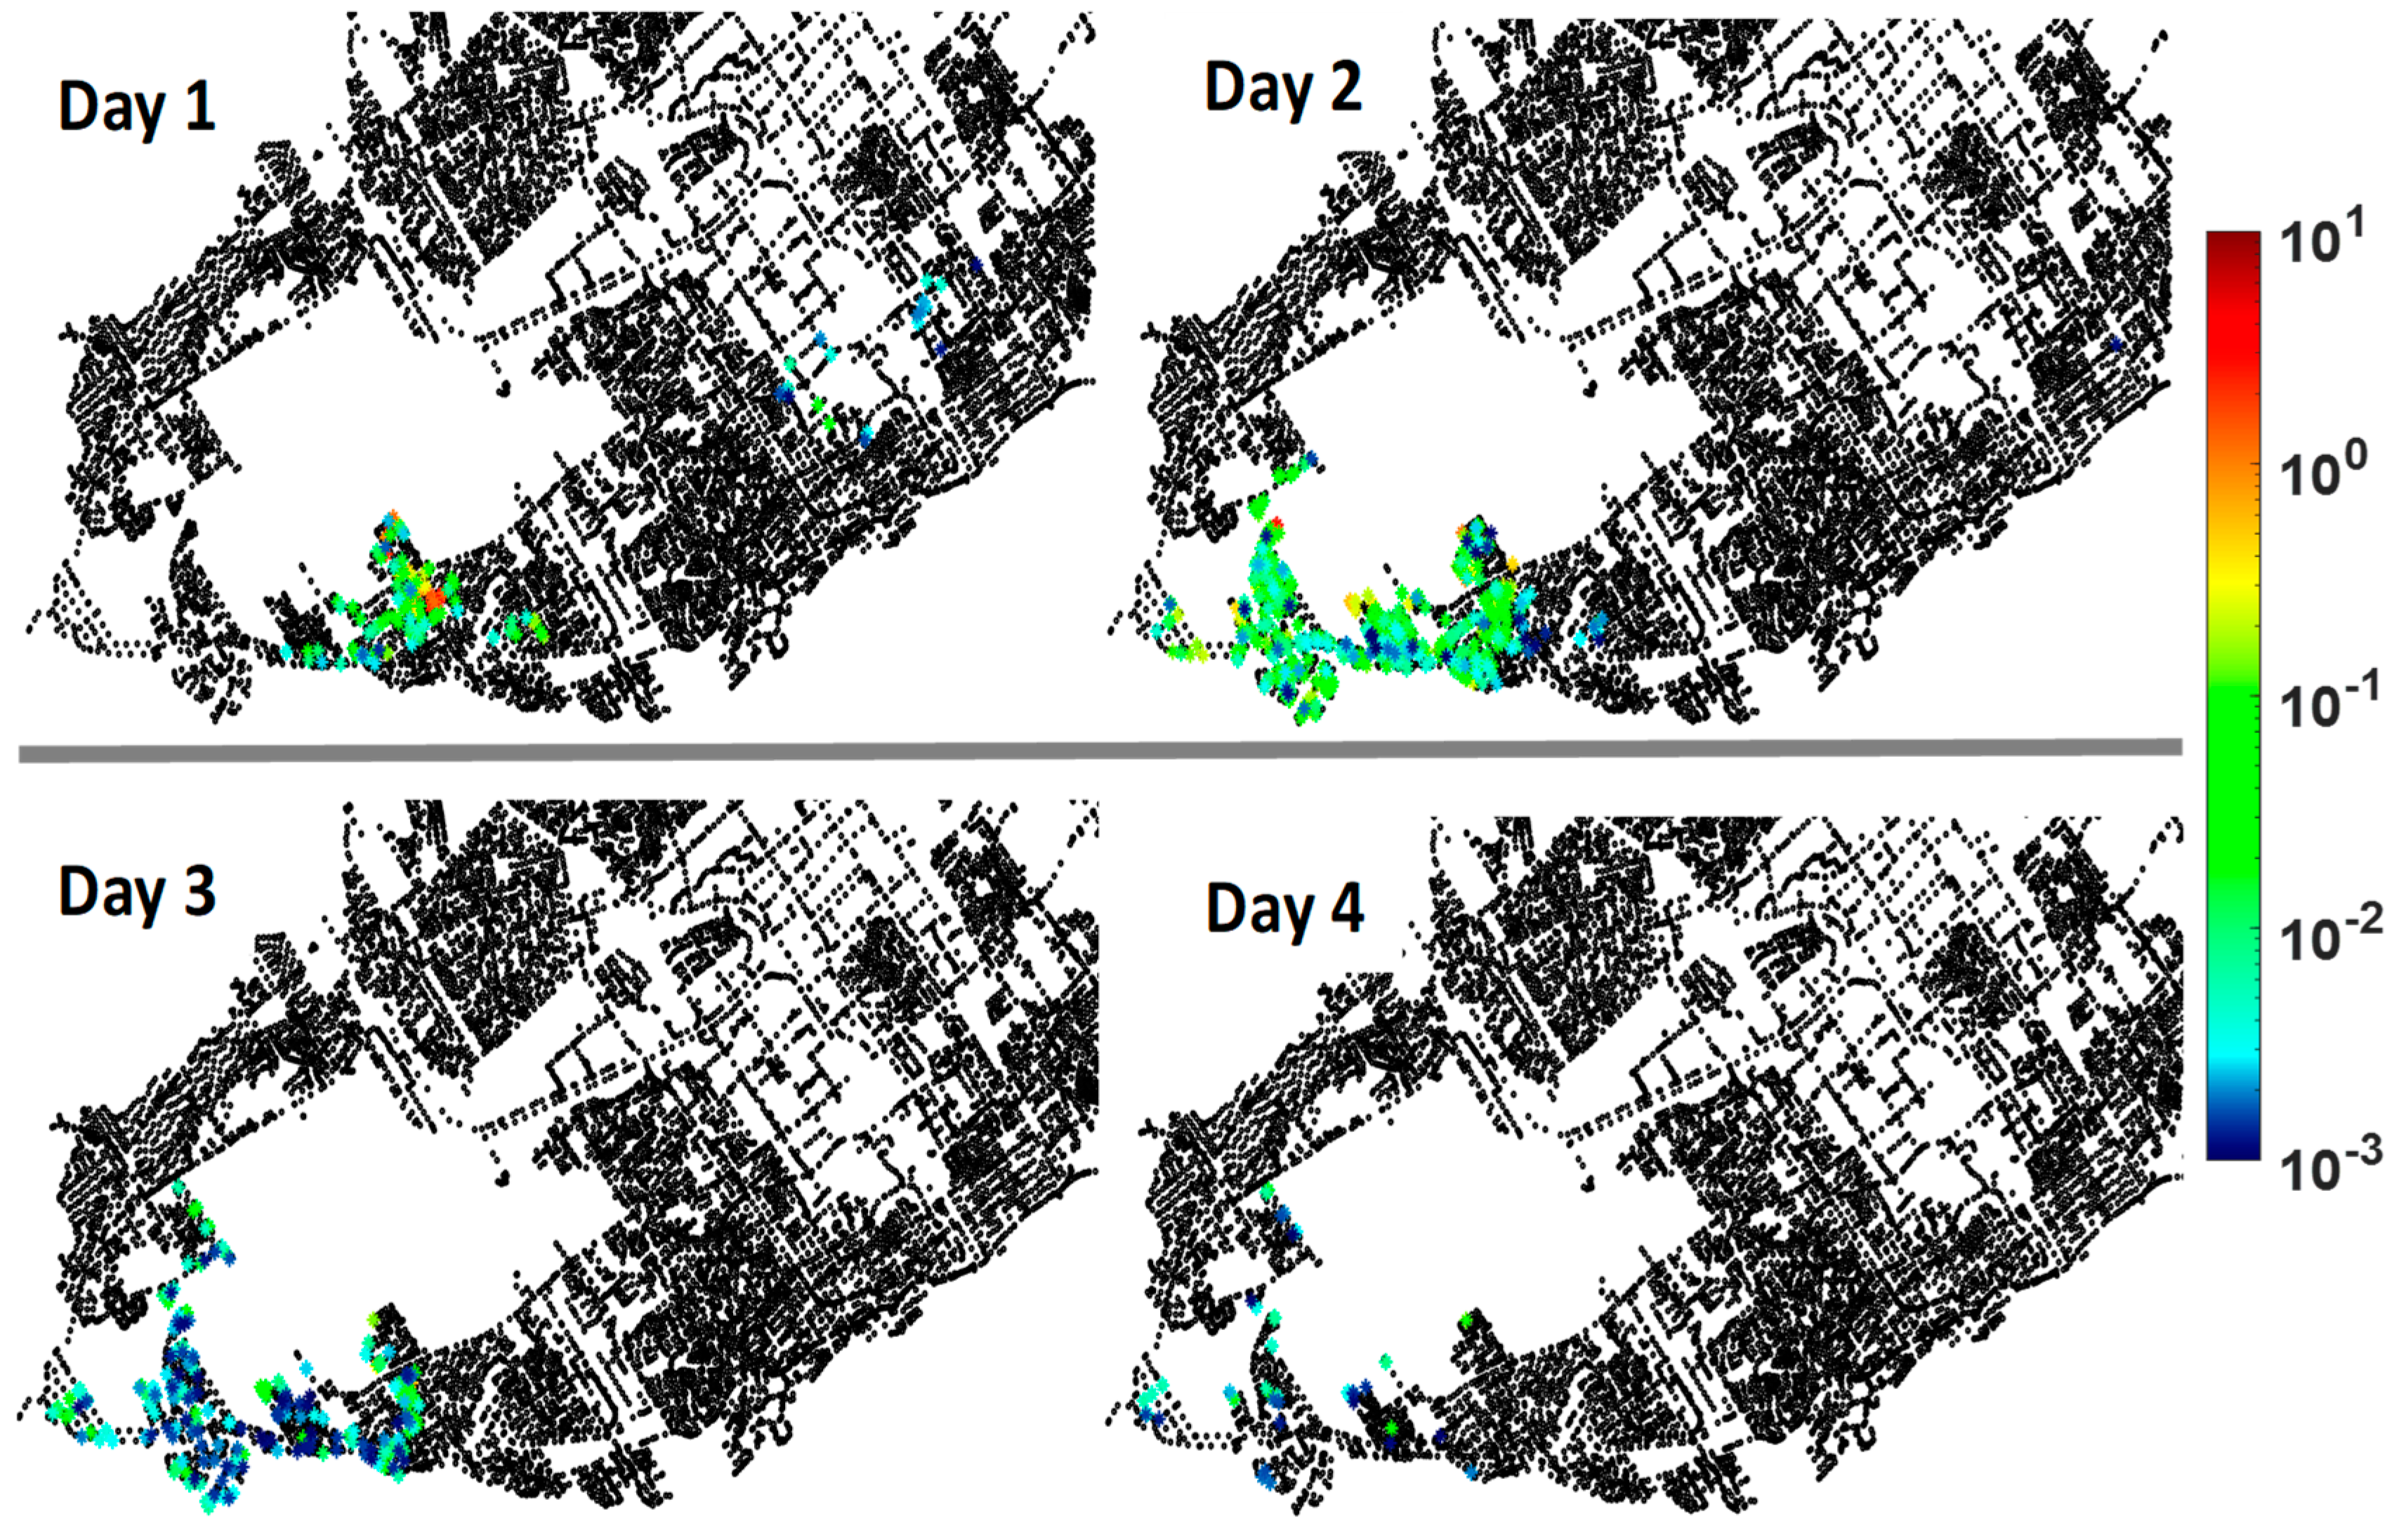
For Days 1–4, the total nodal risk corresponding to the consumption event with the maximum number of infected people (F(x) = 1 in
Figure 8) was estimated, and the spatial distribution is plotted in
Figure 9. The number of nodes at high risk decreased from Day 1 to Day 4 as well as the extent of the areas at risk. At the end of the first day, when the intrusion ended, the nodal infection was ≤ 1 × 10
−7 at 29,754 nodes and higher than 1 × 10
−4 at 123 nodes. Only 16 of the nodes showed total nodal risks equivalent to more than one person. On Day 2, the total number of infected people through the whole network decreases to 29 compared to 71 for Day 1, but the number of nodes with an infection risk ≤ 1 × 10
−7 was lower compared to Day 1. The reason is that
Cryptosporidium oocysts reached more nodes in the network on Day 2, but at lower concentrations as the ingress volume became diluted and flushed out. On Day 2, the nodal infection risk was more than one only at four nodes. On Days 3 and 4, the nodal infection risk was below one for all the nodes.
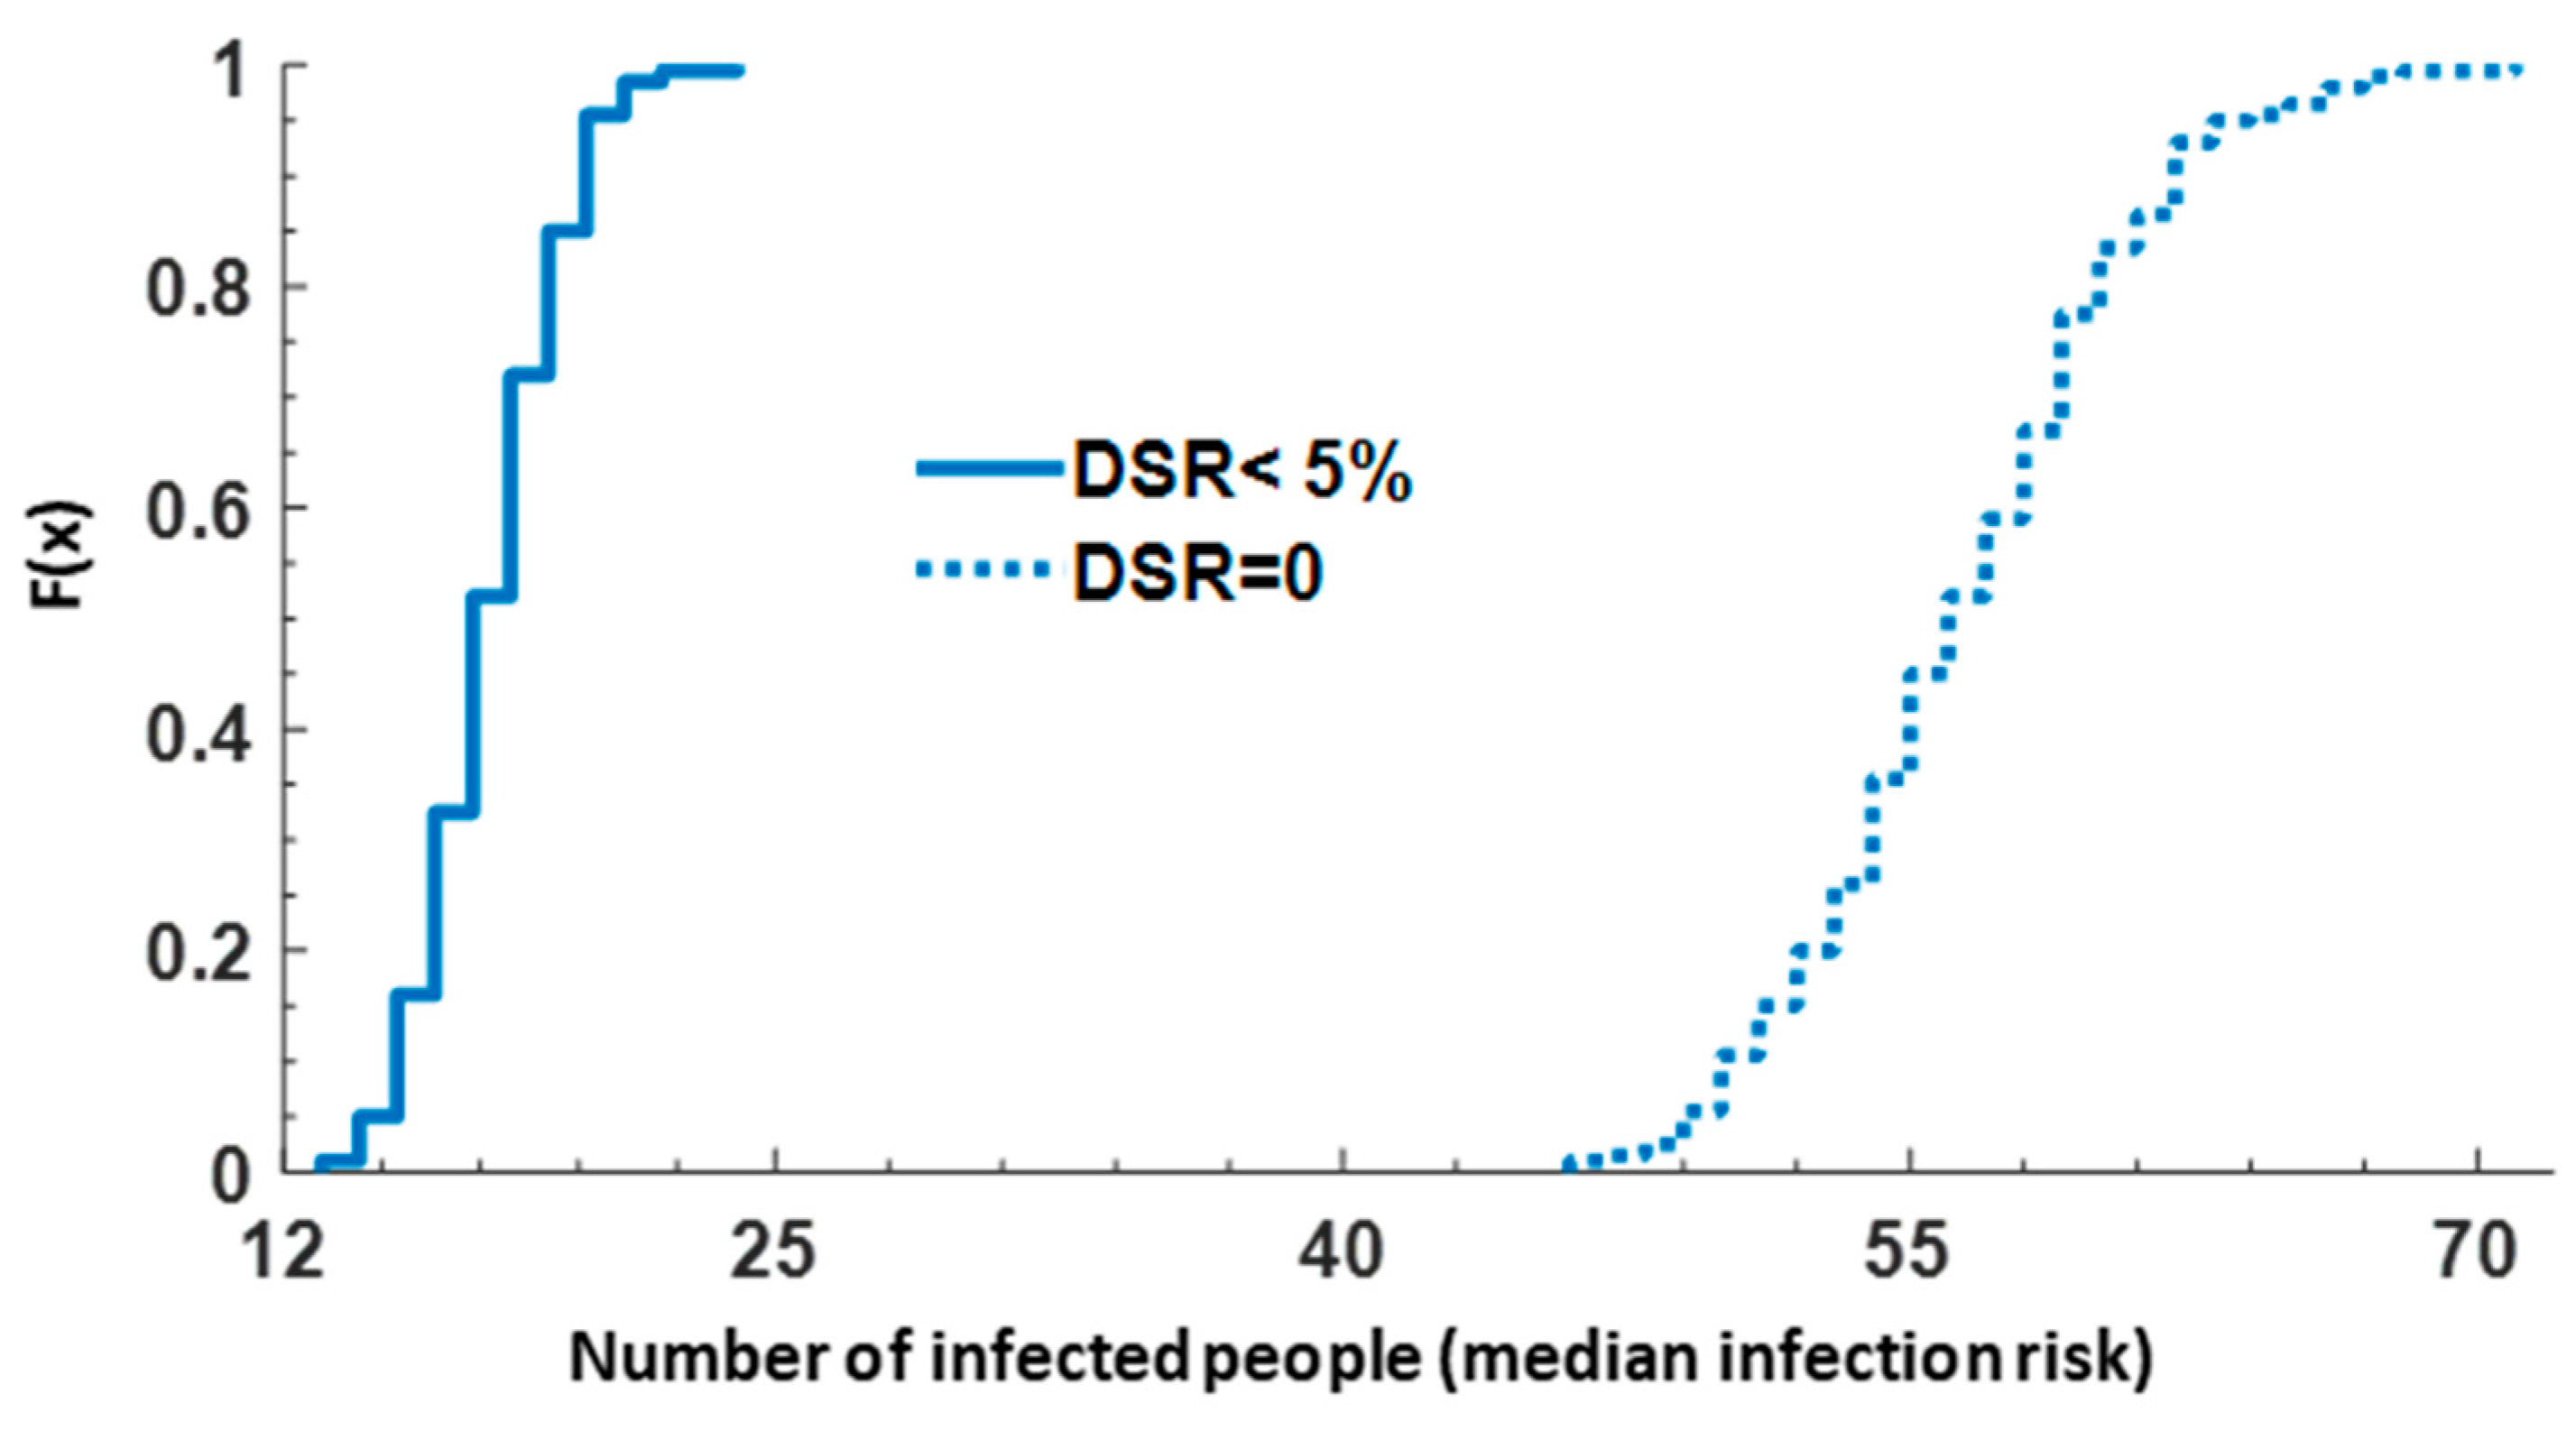
Impact of demand satisfaction ratio on risk. In all simulations, when the DSR (pressure ≤ 0) became zero at a node, the kitchen tap use was set to zero. To study the influence of the DSR (shown in
Figure 2b) on the risk, the situation where no consumption happened at nodes with a DSR less than 5% was also modeled (
Figure 10). For this investigation, the number of infected people following a 1-h PDCs/intrusion was computed on the day that intrusion occurred. As expected, the number of infected people decreased when the consumption only occurred at the nodes with a DSR ≥ 5% during low/negative pressure conditions (
Figure 10).
4. Discussion
Impact of event duration on the spatial distribution of risk in the network. During an intrusion event, the intrusion risk was determined by several factors such as the intrusion volume, pathogen concentration, network hydraulics, fate and transport of the contaminants and consumers’ behavior. The volume of contaminated water entering the network is a function of the duration of the event. For the events with 1, 10 and 24 h of sustained depressurization, the estimated intrusion volumes through all leak openings were 0.8, 8 and 19 m
3, respectively. Using the orifice equation, some studies have produced estimates of the intrusion volumes through leakage points for transient PDCs [
1,
13,
22]. The total intrusion volumes resulting from a momentary pump shutdown for different intrusion conditions through leakage orifices and submerged air vacuum valves (AVVs) ranged from 10 to 360 L in the same network [
22]. In contrast, these authors also showed that the maximum volume entering through a single submerged AVV during a transient could be about 95 times larger than the maximum volume entering through a single leakage orifice (227 L versus 2.4 L). In their study, the modeled intrusion volume was driven by the global leakage rate (5% versus 40%) and pressure differential. However, as these authors also stated, the orifice size at a given node should reflect the local leakage demand. Using Monte Carlo simulations, Gibson et al. [
23] investigated the impact of head differences, diameter of orifices, pipe age (number of holes), and low pressure duration on the intrusion volumes during transient negative pressure events. For a 25-year-old pipe, the probability of an intrusion volume greater than 10 L was low (1%), while it increased to 70% for a 150-year-old pipe.
In the current study, the orifice size at each node was considered proportional to the assigned nodal leakage demand in the calibrated model under normal operating conditions as described in detail by Hatam et al. [
27]. In the test DS, leakage demand reflects the state of pipes; older areas with aging cast iron being the dominant pipe material has higher leakage and thus offers more potential entry points for contaminated water. In this study, the effect of soil–leak interactions was ignored and the exponent in the orifice equation was considered equal to the theoretical value (0.5) that is valid for fixed leak openings. It was confirmed that the variation of the area of round hole with pressure is negligible and therefore the leakage exponent was close to 0.5 [
28,
29]. However, for longitudinal slits that have large head-area slope, a modified orifice equation should be used in which the leakage exponent can change within 0.5 to 1.5 [
30].
In this study, long durations of PDCs were considered as opposed to relatively short durations of low and negative pressures. Sustained PDCs are reported in the literature due to transmission main repairs [
12,
31] and can happen during power outages. This type of event may be less frequent than transient pressure fluctuations, but of graver consequences, as shown by the potentially larger intrusion volumes. The duration of transient negative or low pressures is a key factor affecting the virus infection risks estimated by QMRA [
13,
14,
15]. As expected, for the simulated sustained PDCs, the number of infected people for the three different intrusion durations showed strong dependency on the intrusion duration (
Figure 6), as it determines the total amount of
Cryptosporidium oocysts introduced into the network. The maximum number of infected people was reduced to less than half when the intrusion duration decreased from 24 h (1410) to 10 h (502), and even more so if the event only lasted 1 h (84). Our results are in agreement with those of Schijven et al. [
20], who used QMRA to investigate the impact of intentional contamination. Exposed persons were increased by 2–3 folds when the duration of the injection of contaminants increased from 10 to 120 min.
More importantly, in this study, we showed that the duration determined the areas with high pathogen concentrations corresponding to a potentially significant infection risk. The geographical distribution of the nodal risk shown in
Figure 7 emphasizes the importance of considering the duration of PDCs/intrusion when issuing sectorial boil water advisories (BWA) as well as other preventive/corrective actions. For 24 and 10 h intrusion events, the zones at risk were more or less the same with different risk levels. However, for a much shorter duration of intrusion (1 h), the zones at elevated risk were significantly reduced (
Figure 8). The arbitrary cutoff line in
Figure 8 can be used to compare the summation of the total risks at nodes in different zones affected by contaminated ingress water. On its right side, a very small cumulative risk of 0.2 infection for the 1 h intrusion was observed; this risk increased to 1.4 and 3.5 for the intrusion events of 10 and 24 h, respectively. These values include all low nodal risks (≤ 1 × 10
−3), which are not plotted in
Figure 7 for clarity.
Concentration of Cryptosporidium in ingress water. There are scarce data on the actual concentrations of pathogens in ingress water. Concentrations of pathogens in ingress water could range from those found in wastewater, representing a high-risk scenario of ingress directly from undiluted sewage [
26], to the much lower concentrations measured in trench water, urban groundwater or runoff [
32,
33]. The number of infected people increased from 6 to 1410 when
Cryptosporidium concentrations increased from 1 to 560 oocysts/L (
Figure 4, median) for the worst-case consumption event (out of 200) (F(x) = 1). In agreement with our results, the contaminant concentration outside the pipe ranked among the top factors in previous QMRA studies [
13,
15,
18,
34]. When using the maximum dose–response relationship rather than the median relationship to account for uncertainties, the maximum number of infected people increased about two folds (
Figure 4). The magnitude of differences between the median and maximum dose–response relationships is a critical factor to consider as recent evidence suggests that even higher dose–response values for
C. hominis should be considered [
2,
25]. Therefore, both the concentrations and the selection of the dose–response will contribute to uncertainty [
2].
Consumption behavior. Standard QMRA models usually consider only one consumption event per day [
14,
15] or a constant volume of consumption per day for every person at fixed hours [
16,
21]. For the 24 h scenario, the amount of water consumed daily from the kitchen tap had a huge impact on the maximum number of infected people, with decreases of ~40% and 60% when consumption was reduced from a baseline of 1 L/day to 500 mL/day and 300 mL/day, respectively. The model was also sensitive, but to a lesser degree, to the number of glasses per day for a fixed volume (
Figure 5). Increasing the number of glasses per day from 1 to 10 increased the overall infection risk (by up to 2%) for the 24-h scenario. This rise was more pronounced for larger consumption volumes (
Figure 5). Impact of the number of glasses per day was most noticeable when switching from a single consumption event to 3 or 10 consumption events. Blokker et al. [
18] and Van Abel et al. [
35] also observed that three ingestion volumes per day result in higher numbers of infected people compared to only one withdrawal of the total volume per day.
Several studies have investigated and integrated probabilistic models to better represent the consumers’ behavior into QMRA models, including PDFs of volume of unboiled tap water, number of glasses per day, volume per glass, timing of consumption, and household water usage [
17,
18,
20,
36]. Blokker et al. [
18] fully integrated consumers’ behavior using a Poisson distribution for the number of glasses per person per day and a lognormal distribution for the ingested volume per glass and the kitchen tap use. This model was applied to investigate various scenarios of fecal contamination resulting from DS repairs and the potential for preventive actions to mitigate risks of infection. In this study, we used the Blokker model to investigate accidental intrusion due to sustained low/negative pressure event of various durations, adding 200 simulations to quantify the range of risks corresponding to different consumers’ behavior. The differences between the numbers of infected people for minimum (F(x) = 0) and maximum (F(x) = 1) probabilities in
Figure 8 reveal the potential impact of consumers’ behavior for a specific event. The ranges were widest for the first day (from 71 to 46 people, 35% reduction) compared to the following days. The variations observed were less important in the scenarios of 10 and 24 h (
Figure 6). Understanding the uncertainty associated with a combination of plausible behaviors appears important.
Impact of daily demand. The diurnal consumption patterns result in variable intrusion volumes and numbers of intrusion nodes during different hours of the day because of the variations in nodal pressure values. In this study, the demand was set to peak hour demand, which could lead to overestimation of intrusion volumes if system pressure was not decreased for night flows. On the other hand, fixed peak water demand overestimated the flushing of contaminants from the network by leakage, commercial, industrial, institutional demands, etc. during periods of low human consumption, resulting in an underestimation of the risk. With the scenario of 1 h PDCs/intrusion which incorporates daily demand patterns in the hydraulic model, it was shown that the underestimation was about 15%, which we consider to be acceptable (
Figure 6 compared to
Figure S3).
Integrating demand availability from PDCs. The novelty of this work lies in the coupling of the PDA and QMRA. Unlike DDA, PDA permits identification of areas with demand shortage, allowing for more realistic estimations of consumption based on water availability at the tap during pressure losses. For example, consuming at a DSR of 5% and less would mean that the filling time would increase by more than 20-fold. As shown on
Figure 10, the number of infected people on Day 1 decreased sharply from 71 to 24 (65%) if only consumers at nodes with DSR >5% during low/negative pressures were considered. It should be noted that limitations to consumption only occur during the low-pressure conditions. Furthermore, the extent of these differences depends on the consumption time, and the duration and timing of the event. The results shos that restricting drinking water consumption during periods of low or intermittent flow would greatly reduce risks. Therefore, utilities and health authorities could consider educating people not to consume water during these periods of low flow. Further study is needed to define a minimal DSR criteria based on the amount of reduction in infection risk.
Implication for risk management. The nodal risks considered the contaminant transport in the network and the probability of coincidence of passage of contaminants at the tap and consumption. However, the spatial and temporal distribution of total nodal risks also reflected the distribution of the population between nodes (
Figure 7 and
Figure 9). The areas in which to issue a BWA, and those where corrective actions (e.g., flushing) would be effective, can be determined using nodal risk values in reference to an acceptable risk level.
QMRA models have been used to evaluate the efficacy of different mitigation strategies such as BWAs, flushing, and disinfection for reducing the infection risk after main break repairs/transient pressures [
14,
18,
34]. Yang et al. [
34] showed that flushing at >0.9 m/s reduced infection risks by 2–3 logs for norovirus,
E. coli O157:H7 and
Cryptosporidium. For viral and bacterial pathogens, disinfection with a CT of at least 100 mg·min/L using free chlorine was required after flushing to decrease the risk below the USEPA yearly microbial risk target value (1 × 10
−4) [
37]. Issuing a system-wide BWA that decreased by 80% the average number of glasses of unboiled water consumed led to a four-fold reduction in the number of infected people [
18].
Estimating the daily risk, instead of the event risk, after an intrusion event can guide risk management decisions. The spatial distribution of risk as shown in
Figure 9 is a key factor to define the boundaries and duration of sectorial BWAs.
Figure 8 and
Figure 9 show the contribution of each day to the total event risk over the four-day period. Notably, for the 1-h intrusion, delaying necessary preventive/corrective actions up to 5 h from the start of the intrusion may result in the infection of up to 71 people. After that 5-h mark, a BWA or other preventive/corrective actions would still offer protection for about 33 additional people (sum over the three following days). The reduced benefit of late interventions on the fourth day was evident with only one equivalent infection prevented. Timely response to sustained PDCs is therefore essential and can be achieved by improving sampling strategies using enhanced numerical model [
27] and equipping the DS with multiple online pressure sensors and water quality sensors. The duration of the BWA could be adjusted depending on the corrective actions implemented to meet the acceptable risk level for an event.
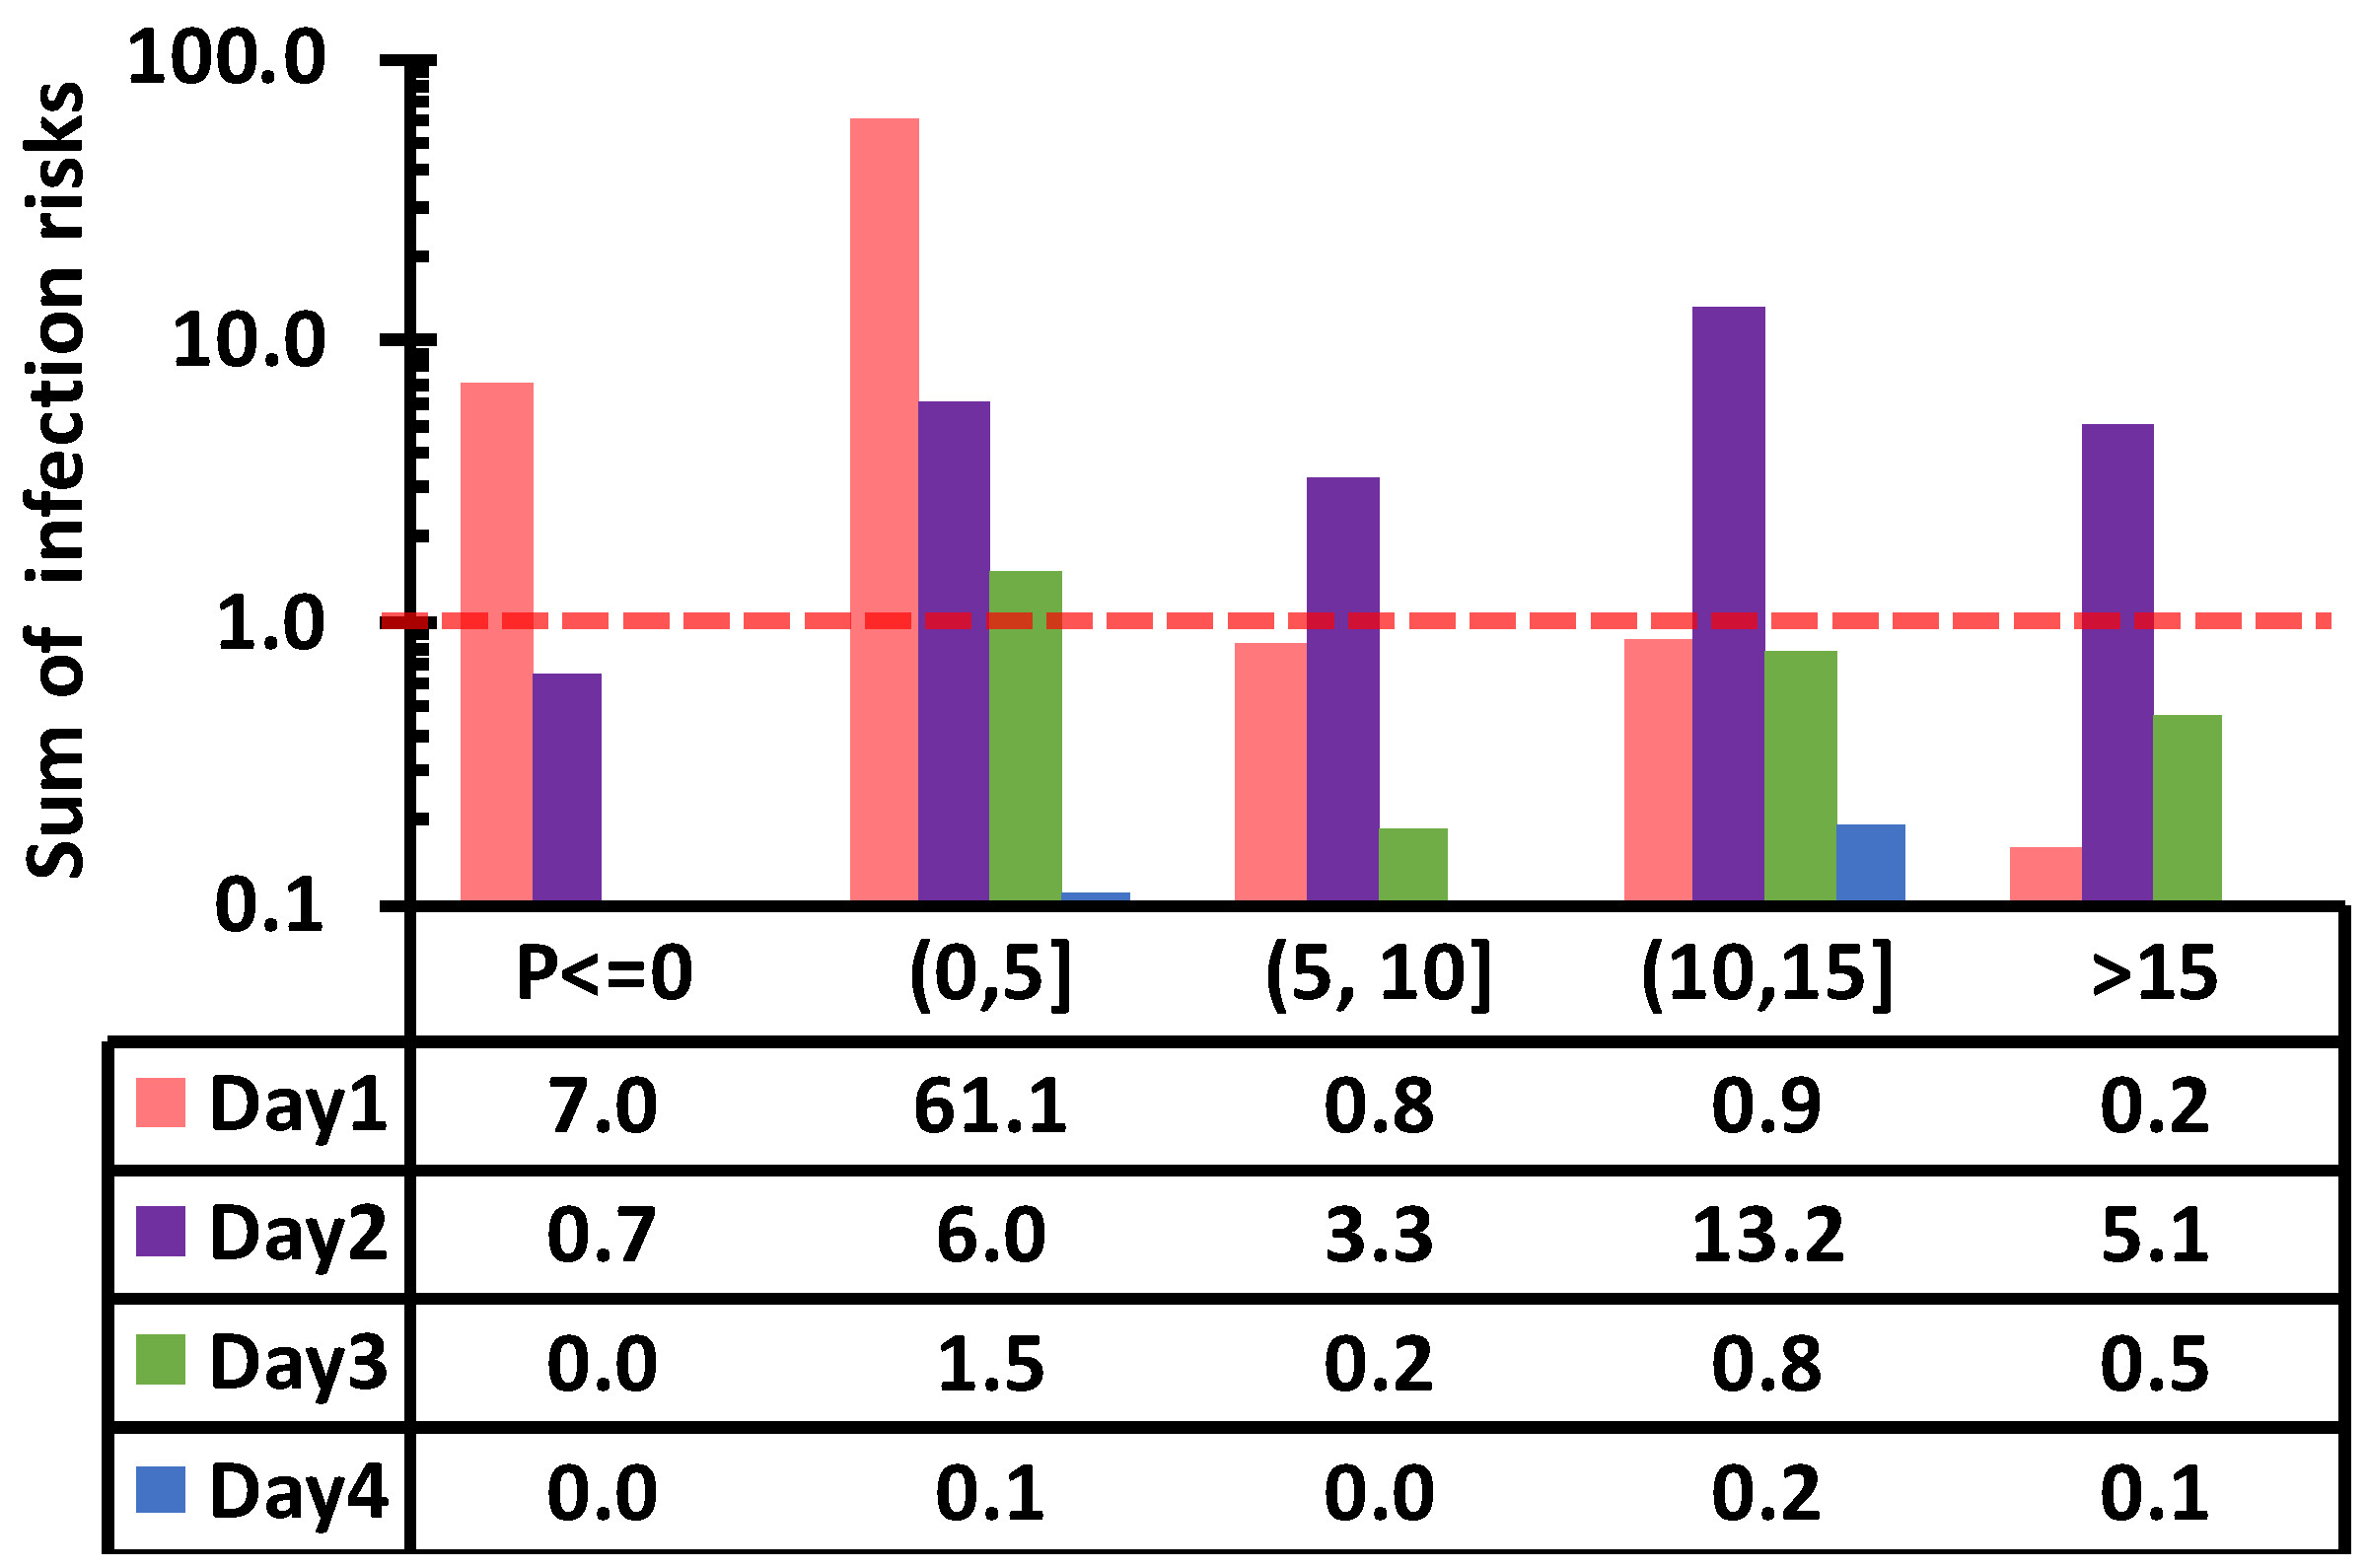
Figure 11 offers insights into whether pressure during PDCs can be used to determine areas to target for preventive/corrective actions. Pressure during the PDCs determine the extent of intrusion. However, whether contaminants will travel from low-pressure nodes to higher pressure nodes (based on pressure during PDCs) is determined by water paths during normal and PDCs. This was clearly illustrated by the fact that, for the 1-h PDCs, consumption of tap water at nodes other than negative pressure nodes resulted in 63, 28, 3, and 1 infected people on Days 1–4, respectively. This showed that the benefits of avoiding consumption at negative nodes (based on the pressure values under PDCs) after the PDCs was limited, as these values for the whole network, including negative nodes, were 71, 29, 3 and 1, respectively. Even with a pressure criterion of 15 m, the number of infected people on Day 2 would be significant (6) (
Figure 11). These results are consistent with the study by Hatam et al. [
27] who showed that
E. coli can be transported to higher pressure zones (up to ~40 m) in the absence of disinfectant residuals during a 5-h PDCs/intrusion. Our results emphasize that issuing sectorial BWAs based only on pressure is not adequate to protect the population against infection, even for the scenario of 1-h PDCs/intrusion with a high
Cryptosporidium concentration (560 oocyst/L). The simulation of the fate and transport of contaminants is necessary to define an effective sectorial BWA.
In future work, reporting the hourly risk, instead of the daily risk, could be helpful to utilities to define preventive/corrective actions and timely response. In this study, the PDCs occurred at 18:30 on Day 1, therefore some of the daily demands were already satisfied before the intrusion event. The timing of the event impacts the infection risk, which needs to be investigated in future studies. Blokker et al. [
18] showed limited effect for timing of repairs.
Although the field validation of the transport of pathogens and indicators appears desirable, it is however not feasible to conduct in complex operating distribution systems. Such validation would require extensive monitoring during intentional extended loss of pressure events and monitoring of infections by an epidemiological investigation that utilities and health authorities will not allow. The conservative modelling presented in this study nevertheless demonstrates the value of numerical tools combined to QMRA to quantify risk and assist utilities and regulators.

 ,
, 