Climate Change Impact on the Frequency of Hydrometeorological Extremes in the Island of Crete


1
School of Environmental Engineering, Technical University of Crete, 73100 Chania, Greece
2
Energy and Environment Institute, University of Hull, Cottingham Rd, Hull HU6 7RX, UK
*
Author to whom correspondence should be addressed.
Water 2019, 11(3), 587; https://doi.org/10.3390/w11030587
Submission received: 18 January 2019
/
Revised: 16 March 2019
/
Accepted: 19 March 2019
/
Published: 21 March 2019
(This article belongs to the Section Water Resources Management, Policy and Governance)
Abstract
:Frequency analysis on extreme hydrological and meteorological events under the effect of climate change is performed in the island of Crete. Data from Regional Climate Model simulations (RCMs) that follow three Representative Concentration Pathways (RCP2.6, RCP4.5, RCP8.5) are used in the analysis. The analysis was performed for the 1985–2100 time period, divided into three equal-duration time slices (1985–2010, 2025–2050, and 2075–2100). Comparison between the results from the three time slices for the different RCMs under different RCP scenarios indicate that drought events are expected to increase in the future. The meteorological and hydrological drought indices, relative Standardized Precipitation Index (SPI) and Standardized Runoff index (SRI), are used to identify the number of drought events for each RCM. Results from extreme precipitation, extreme flow, meteorological and hydrological drought frequency analysis over Crete show that the impact of climate change on the magnitude of 100 years return period extreme events will also increase, along with the magnitude of extreme precipitation and flow events.
1. Introduction
Extreme events, such as meteorological droughts, hydrological droughts, extreme flow and extreme precipitation events are becoming more intense and frequent due to climate change [1], and are significantly affecting several Mediterranean basins [2]. The frequency of such events, as well as the magnitude of events with specific return period, is expected to change in the future due to climate change. To examine the frequency variation of extremes, the events were divided in two categories (i) extremes due to increased precipitation and/or flow within watersheds and (ii) extremes due to a decrease in precipitation, such as meteorological and hydrological drought.
Several studies have extensively analysed in the past extreme hydro-meteorological phenomena attributed to extreme flow and extreme precipitation in several Mediterranean watersheds in Crete. Iordanidou et al. [3] found that the characteristics of cyclone tracks are strongly correlated with variable intensity precipitation in Mediterranean, providing valuable forecasting information on rainfall extremes, which are subsequently strongly related to flood occurrence [4]. Flocas et al. [5] analysed the seasonality of historical floods’ hydro-meteorological characteristics in Crete, revealing valuable information within the context of flood occurrence in the island. It is evident that extreme flood events are frequently threatening several Mediterranean basins, and therefore, several methods used for the flood impact analysis and flood mapping [6,7,8,9]. The question is to learn more about the future characteristics of such extremes due to climate change, throughout the island of Crete.
Extensive drought conditions are also observed lately in multiple occasions and the effect of climate change is expected to intensify both the magnitude and frequency of such events [10] presenting a serious water scarcity threat. Specifically, in the Mediterranean, regional and global climate simulations project an increase in duration and intensity of droughts [11] for different drought indices [10,12]. Specifically, for the island of Crete, there are individual studies which stress the need for confronting this significant threat. For example, the upcoming water scarcity impact of climate change is already apparent in the Cretan watersheds, i.e., in Koiliaris river basin [13] and in Geropotamos river basin [14,15]. These studies provided the future drought conditions according to several climate change scenarios in the specific watersheds and are significant tools in the hands of policy makers in order to form drought management practices at the basin scale. However, the main question is what is the impact of climate change in drought conditions at the regional scale, i.e., the whole island of Crete. Koutroulis et al. [12] provided a spatiotemporal assessment of meteorological drought for the island of Crete by indicating that the spatial distribution of precipitation produces improved and significant drought warnings. Since they did not include climate change impact on their analysis, this study is going to fill the specific drought analysis gap.
To examine the frequency of drought events, knowledge of the drought indices are necessary. In the present study, a series of standardized drought indices were used, i.e., the Standardized Precipitation Index (SPI) and the Standardized Runoff index (SRI) that are recommended by the World Meteorological Organization for drought characterization [16]. SPI and SRI have been used extensively for drought condition assessment [17,18,19]. Herein, drought is identified through the relative SPI and SRI, a variation of SPI and SRI that allows for comparisons between different time slices, by using a baseline period [20]. Frequency analysis under climate change can provide significant information concerning the impact of climate change on the magnitude and the probability of the occurrence of extreme meteorological and hydrological events in the future. Specifically, past flood frequency analysis research was focused on specific case studies [21,22,23,24], by using the precipitation output from climate models as input to lumped or distributed hydrological models in order to route the surface flow. Subsequently, the models compute surface runoff and stream flow as well as their spatial and temporal distributions [21]. The resulting flow and precipitation time series are processed for further analysis.
The main key objective of the specific study is to investigate the future insight of hydro-meteorological extremes in Crete. Therefore, an integrated frequency analysis of extreme rainfall, extreme flow and meteorological and hydrological drought events are performed in the Mediterranean island of Crete for the 1985–2100 time-period, taking into account the climate change impact. More specifically, the modified physically based distributed Karst-SWAT hydrologic model has been set up on the island of Crete (352 sub-basins in total) and it is used in order to simulate the future hydrologic conditions in this Mediterranean region dominated by karstic formations [25,26]. The projected bias-corrected climate time series from different RCM simulations are used as input to the hydrologic model for the simulation of the projected runoff in the study sub-basins. The projected runoff and precipitation time series for every sub-basin are calculated for every studied RCM simulation and for the climate period 1985–2100. The respective daily precipitation and runoff time series data of the 352 studied sub-basins, are properly formatted to perform an extreme rainfall and flow frequency analysis, respectively, while in drought frequency analysis, SPI and SRI drought indices are used instead.
In summary, the three main objectives of this paper are (a) to examine the variability of drought indices throughout Crete, (b) to study the frequency of extreme meteorological and hydrological events and (c) to estimate their magnitude and probability of occurrence and to identify areas of high risk in extreme hydrological and meteorological events occurrence. This kind of study may effectively contribute in the strategic and sustainable management planning of Mediterranean hot spots, such as the island of Crete, that are frequently affected by extremes or are prone to hydro-meteorological extremes. The results from this approach could provide appropriate adaptation plans to confront successfully climate change impacts in locations where the risk of extreme events’ occurrence is high. In the context of climate change, it is significant to design and carry out risk-based decision-making and policymaking especially in areas of high risk due to potential extremes.
2. Materials and Methods
2.1. Study Area and Data
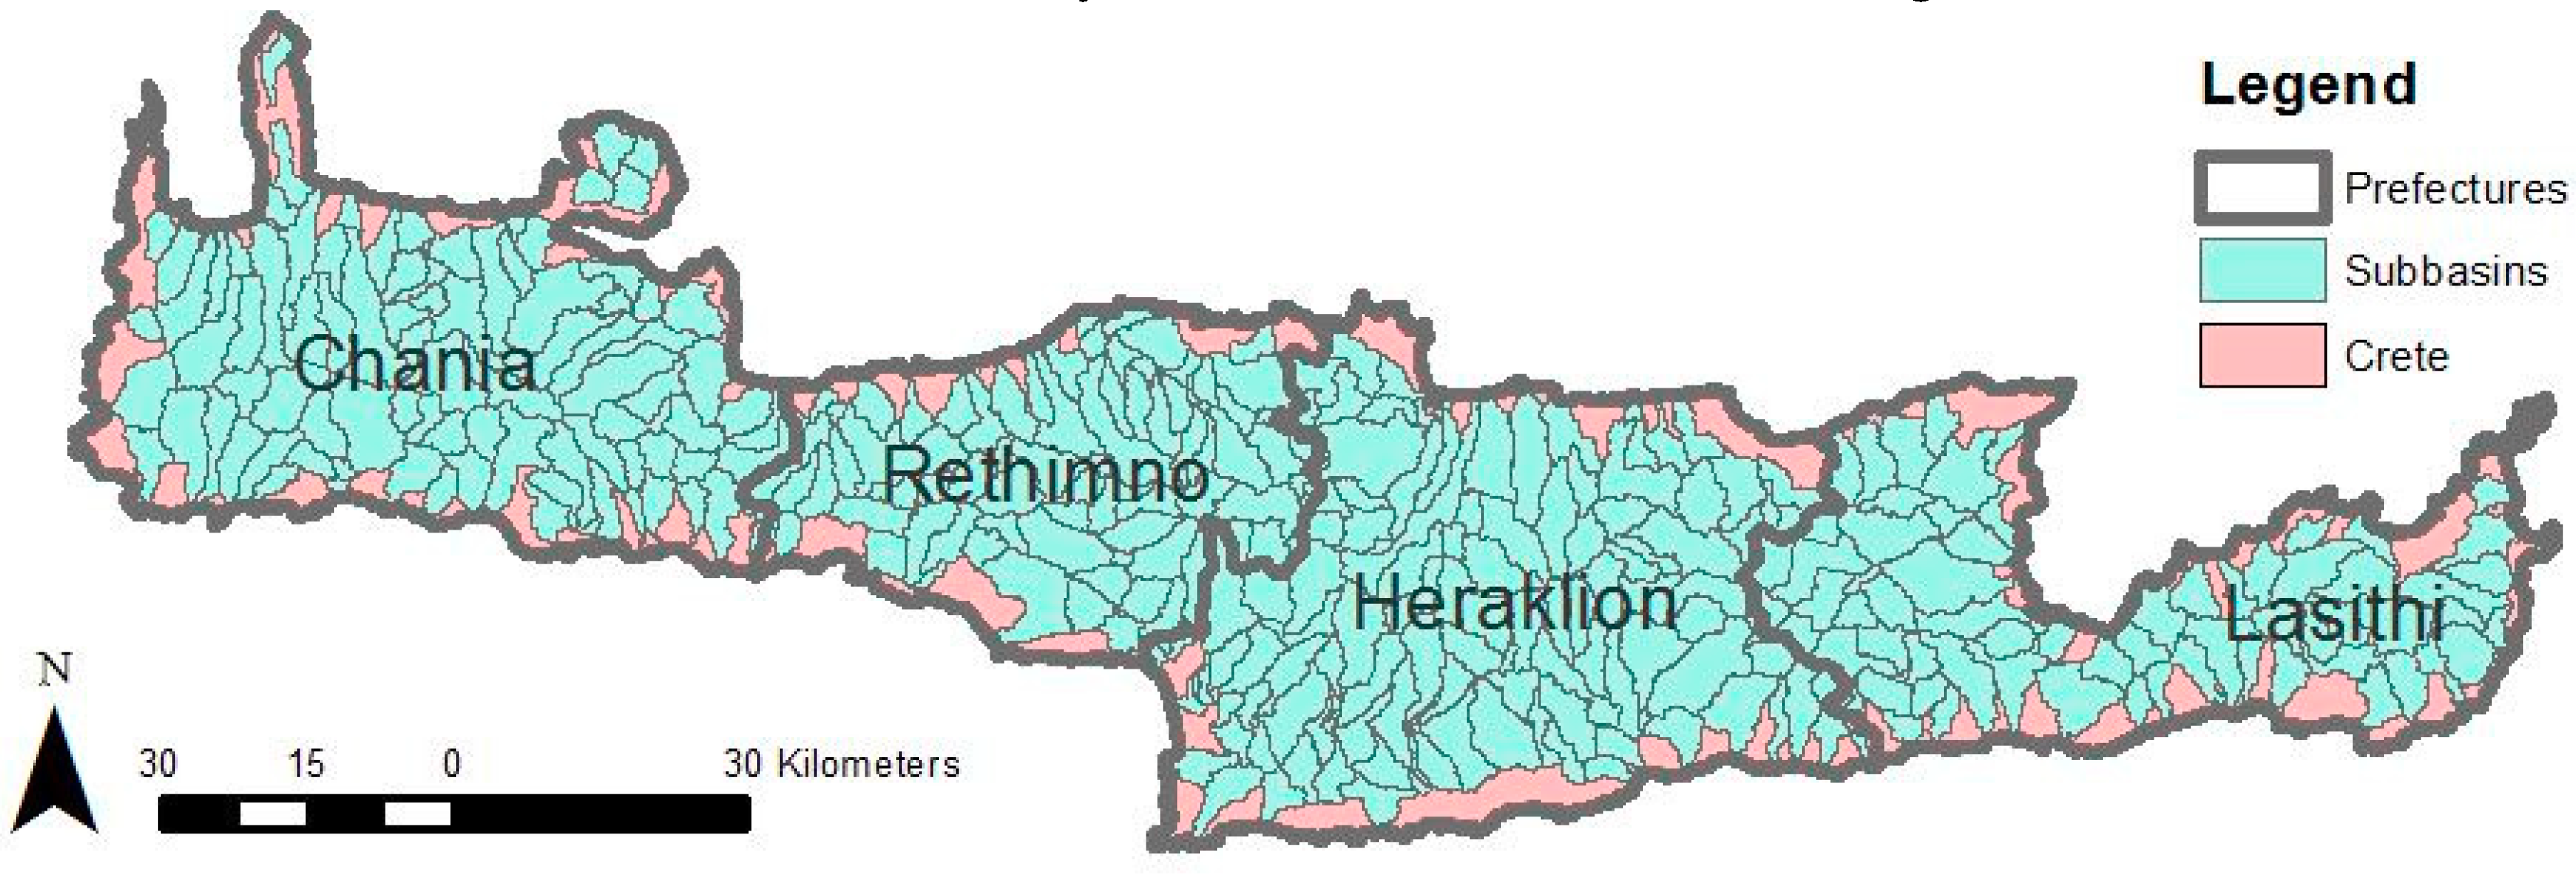
The island of Crete is located in the southern part of Greece and it has a characteristic Mediterranean climate, prone to meteorological and hydrological extremes. It consists of four Prefectures, Chania, Rethimno, Heraklion and Lasithi, west to east, covering a total area of 8336 km2 (Figure 1). The landscape of Crete follows the general pattern of Greek landscape consisting of mountainous terrain with mean elevation at 460 m and annual precipitation varying mainly with the elevation, longitude and latitude [27]. The mean annual precipitation is estimated as 750 mm and varies from 440 mm in the east (southeast-elevation: 10 m) to 2188 mm in west (northwest-elevation: 740 m), decreases in west–east direction by as much as 400 mm on average [28].
Due to its geographical location and geological/geomorphological characteristics, Crete is prone to limited water availability; therefore water resources’ management is a crucial issue. The seasonal variations in water demand are mainly attributed to tourism and irrigation needs, whereas dry summers hinder stable satisfaction of water demand on the island. Moreover, due to high temperatures, water losses through evapotranspiration are significant. Due to pending climate change, precipitation events are expected to be less in number and of increased intensity, making the island prone to extreme drought and flood events attributed to extreme precipitation or increased flow [10].
The meteorological data used in this study included the daily precipitation from 69 meteorological stations and the temperature from 21 stations spanning from 1961 to 2010. Historical data were provided from the Water Resources Department of the Decentralized Administration of the Region of Crete. The local historical records from the meteorological gages were used in the bias correction process of the climate data derived from several Regional Climate Model (RCM) simulations. A novel bias correction method, named Multi-segment Statistical Bias Correction-MSBC, is based on quantiles matching [29] and was used for the statistical bias correction of precipitation data. This method addresses the problem of incomplete adjustment of a theoretical distribution to precipitation data, aiming to reduce the error in precipitation mean and standard deviation. In addition, to correct the bias error in temperature data, the quantile mapping method is used [30]. The above bias correction methods are already proven to effectively improve any input time series data [29,30,31], therefore, within this article the bias-corrected input is directly used to estimate the impact of climate change in drought and frequency analysis estimations for the 352 study basins.
An ensemble of as many climate models as possible is required in order to cover a wide range of climate sensitivities into hydrological projections. The results from 11 EURO-CORDEX RCMs–GCMs at 0.11 degree horizontal resolution (∼12.5 km) simulations were selected, corresponding to the EURO-CORDEX mandatory simulations [31], in order to derive the projected climate precipitation and temperature time series. EURO-CORDEX generally, produces an ensemble of downscaled climate simulations, based on three different climate emission scenarios called Representative Concentration Pathways (RCPs). RCPs are used for the description of the potential future socio-economic development depending on the potential amount of GHGs concentration emitted in the future to the atmosphere. For EURO-CORDEX experiment three mitigation scenarios are extensively investigated, i.e., RCP2.6, RCP4.5, and RCP8.5, which correspond to low, intermediate, and high emissions of GHGs, respectively. These scenarios describe the range of possible values of climate forcing due to changes in radiative forcing at the end of the twenty-first century (+2.6, +4.5, and +8.5 W/m2, respectively) [32]. More specifically, in this study, the 11 MSBC time series correspond to two, five and four simulations for RCP2.6, RCP4.5, and RCP8.5 scenarios, respectively. The 11 RCMs–GCMs of this analysis are shown in Table 1.
The integrated analysis of the reliability of the 11 EURO-CORDEX climate models’ simulation data when compared to the observation data is presented for 69 meteorological stations of the island of Crete in AQUAMAN [25]. In addition, a synoptic EURO-CORDEX data reliability analysis is also performed for some of the 69 meteorological stations used [33]. Due to uncertainty in the future climate prediction, a climate model ensemble assessment is recommended against assessment using individual models in order to cover a wide range of climate sensitivities into hydrological projections [33].
The projected meteorological time series for the RCM simulations were used by Karst-SWAT hydrological model in order to simulate the projected conditions of the case study of the Island of Crete. The modified Karst-SWAT hydrologic model has been set up [34] and it was furtherly processed in order to predict the future hydrological conditions in a large Mediterranean region with karstic formations, i.e., the island of Crete [25,26]. The hydrologic model simulates the surface and karstic spring runoff, irrigation needs as well as interpolates the precipitation in every one of 352 derived sub-basins, in the island of Crete. The model was calibrated for the period 1961–2009 [25,26].
The projected climate time series from the different RCM simulations were used as input to the Karst-SWAT model for the hydrological simulation of the projected runoff of all the 352 sub-basins. According to hydrologic model results, a significant decrease in both surface and karstic spring flows is expected [25]. A full description of the bias correction procedure [29] for the specific data and the details about how the hydrological model was developed, is presented in AQUAMAN [25] and Nerantzaki et al. [26].
The projected runoff and precipitation time series for every sub-basin were calculated and extensively processed for every studied RCM simulation and for the climate period 1985–2100 [25]. The objective of this study was to use these time series for extreme event frequency analysis and their management. The total climate period of the analysis was divided into three equal time slices: 1985–2010 (baseline period), 2025–2050, and 2075–2100.
2.2. Methods
The bias corrected climate data, and the Karst-SWAT hydrological model provided the precipitation and flow data that is used in calculating the two drought indices for every sub-basin of the total 352 sub-basins and for the whole climate period. In addition, the drought, extreme flow and extreme precipitation frequency analysis was performed for the same period. A MATLAB code developed for this study enables simultaneous calculations to be performed for the drought indices and frequency analysis of the Karst-SWAT model results in the 352 study sub-basins for the baseline period and the two future time slices.
2.2.1. Drought Indices
Standardized indices are widely used in drought prediction and identification. In this study, SPI and SRI indices are used. SPI is an easy index to implement and it provides information on the variability of the precipitation [35,36,37]. SPEI is very similar to SPI. It is based on precipitation and temperature data, and has the advantage of combining multiscalar character with the capacity to include the effects of temperature variability on drought assessment [38]. SPEI takes into account the evapotranspiration, which theoretically will be increased in the future due to the increase of temperature. However, in this study, the results revealed quite similar results for SPEI and SPI, and due to saving space reasons, the presentation of the SPI results alone within this scientific analysis is deemed to be more significant. SRI is an extension of SPI and it is significant for hydrological drought characterization [39] by using runoff data instead of precipitation. This index gives an immediate estimation of the drought magnitude, incorporating hydrologic and meteorological processes that influence the volume and timing of streamflow [39]. Relative SPI and SRI drought indices are evaluated in a monthly time step requiring data of at least 20–30 years. By using relative drought indices, a direct comparison between the future conditions and the current ones is possible. The calculation procedure is the same for the two indices following the methodology developed by [35,36,37], which consists of two main steps. First, the monthly data are fitted to a gamma distribution and then they are normalized, so that the mean value of the new time series is zero over a specified time period. In this work, when calculating the relative standardized indices, the gamma distribution is fitted to the data corresponding to the baseline period (1985–2010), in order to compare the current with the future drought conditions [20]. The index is calculated for various time scales, representing different drought impacts to the system. In smaller time scales (3–12 months), the indices are used to describe short-term drought events that have a severe impact on the agricultural sector. In time scales of 12–24 months these indices are used in water management and climate studies. The objective of this study is to examine the variation of extreme events with mid and long term duration under climate change, therefore the 12 month time scale is used. Droughts in this time scale are known to cause severe problems in the study area. SPI and SRI indices values can be divided into 7 categories (Table 2). Positive SPI values exhibit heavier precipitation/runoff than the climatic average for the study area, while negative values exhibit drought conditions with less precipitation/runoff than the normal [40].
2.2.2. Frequency Analysis
Frequency analysis is used in estimating the probability of occurrence of extreme events (i.e., meteorological and hydrological droughts, extreme flow and precipitation events). The objective is to relate the magnitude of the extreme hydrological or meteorological events to their frequency or probability of occurrence, using an appropriate probability distribution. An event with Τ years return period occurs statistically once in Τ years. Its magnitude is inversely proportional to its occurrence frequency, thus, extreme events occur less frequently.
The first step of the analysis involves the isolation of unique extreme event data. The Annual Maximum (AM) methodology is used in this study for the final selection of the time series dataset, where only the maximum value of every year is included into the final time series [44,45]. However, a common drawback in this method is that it overlooks information, such as the second or third maximum value of a year, which may be greater than the first maximum of another year, but ensures the selection of at least one independent event per year. Therefore, the AM series consist of independent values, identically distributed [45,46].
A theoretical distribution is fitted to the acquired dataset and the distribution’s parameters are accurately estimated. For the parameter estimation, several methods can be used (i.e., method of moments, method of L-moments, method of maximum likelihood, method of least squares) [44]. The Maximum likelihood is selected for this process due to its computational simplicity and its convergence capabilities. In addition, several theoretical probability distributions are used for the frequency analysis of extreme hydrological and meteorological events, such as Log-normal (LN), Pearson type III (PIII), Log-Pearson type III (LPIII), Gumbel, Generalized Extreme Value (GEV), and Weibull distributions, which use annual maximum (AM) time series.
The AM series, i.e., discharge, drought indices or precipitation, were at first selected, that is, the first most severe event of each year. In this way, the samples were representative of the hydrologic events population, for example the extreme flow in the study area. Consequently, frequency analysis was performed in MATLAB for the time slices 1985–2010, 2025–2050 and 2075–2100 in the 352 study sub-basins.
3. Results
For the time slice 1985–2009, both observed and simulated results were available. Therefore, a cross comparison of the drought indices, flow and precipitation data was performed in order to ensure the consistency of the data used within this period. The simulated parameters precipitation, flow volume, SPI and SRI, as well as their frequency analysis results, were very close to the observed data, concluding that the climate model projections are consistent and can be comparable as long as the current climate is set as baseline. In case of extreme precipitation and flow, AM series can be calculated straight from the time series data, by identifying the maximum daily precipitation and flow. However, in case of drought, the data do not indicate drought conditions, therefore, the use of drought indices has been deemed necessary, in order to determine the respective AM series for meteorological and hydrological drought.
3.1. Drought Indices
For the eleven RCMs simulations, relative SPI and SRI indices were calculated using the Karst-SWAT model results for the historical period (1985–2010) and for the two subsequent future time slices (2025–2050 and 2075–2100). Historical period (1985–2010) was considered as a reference period. The parameters of gamma distribution were calculated for the baseline period (1985–2010) and consequently drought indicators for the two other time slices were calculated using the baseline distribution’s parameters. The chosen time scale for the drought indices’ results presentation was 12 months, since droughts with mid and long term duration are identified to cause the most serious problems in the study area.
3.1.1. Relative SPI
According to SPI index and depending on the severity of each RCM model, the number of meteorological drought events and their duration is expected to increase in both future time slices, compared to the current conditions. In Table 3 the mean number of months per year with drought conditions in Crete for all the studied RCMs are presented.
In the majority of the cases (Table 3), the number of months with drought per year is increased. For RCP2.6 scenario the increase is initially lower than the two other scenarios and for the time slice 2075–2100, the number of months with drought per year is reduced compared to the reference period, 1985–2010. In RCP4.5 an increase on the number of months with drought occurs during the first projection time slice, which then either decreases or increases slightly depending on the climate model. In RCP8.5 there is a steady increase in number of months with drought per year, which in the worst case reaches 4.9 months per year in the period 2075–2100.
As all models represent different scenarios and initial conditions, the results can vary significantly, even within the same RCM. In presenting the results the average between the RCMs simulations within the same RCP scenario is used.
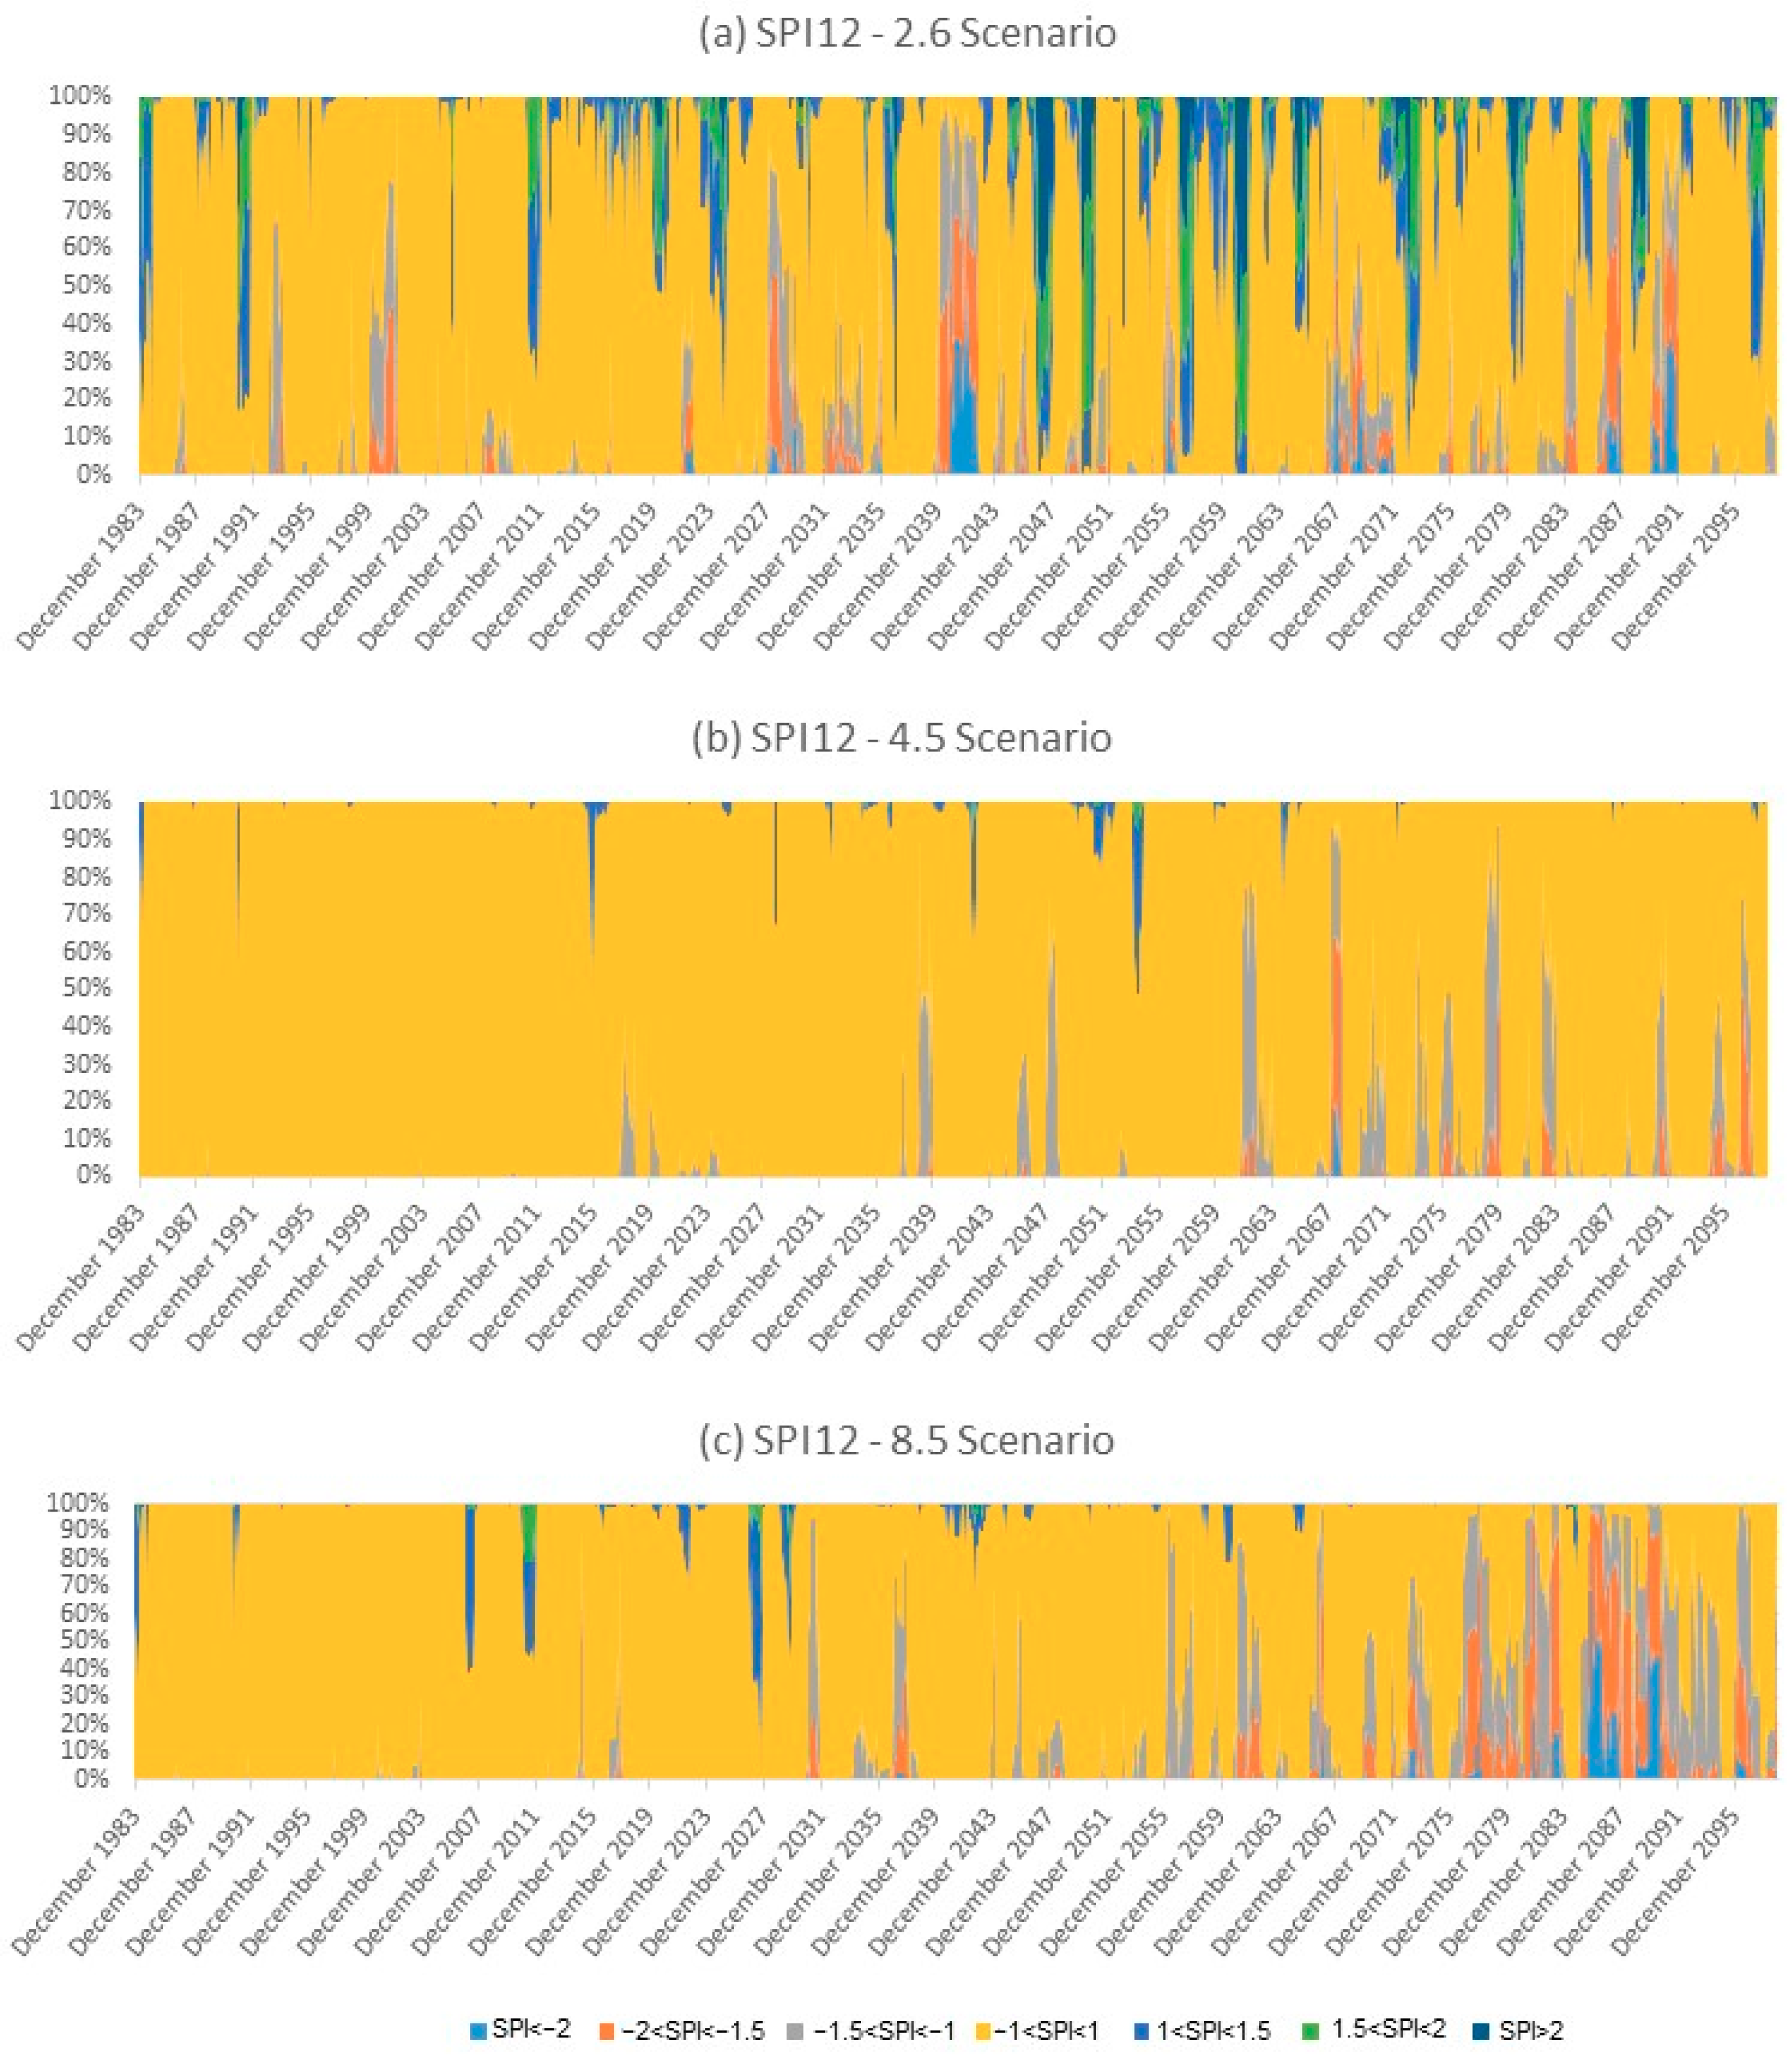
For all the study sub-basins there was a declining trend in SPI12 index values with the largest decrease appearing in RCP8.5, as expected, while in RCP2.6 the trend was small with a slight decrease by the end of 2100. For the island of Crete, the percentage of its area that corresponds to the SPI12 index categories, for RCP2.6, RCP4.5 and RCP8.5, are presented in Figure 2.
In Figure 2a (average of RCP2.6 scenarios), there is a balance between wet and dry years, while some extensive drought conditions are also depicted (light blue colour). In Figure 2b (average of RCP4.5 scenarios) especially in the first two time slices, the results of five models often contradict each other and as a result the average value in most cases is within the range −1 to 1, in which the conditions are considered normal. In the third time slice (2075–2100) an increased number of drought events is observed compared to the first two. For the average of RCP8.5 scenarios (Figure 2c), which is the worst-case scenario, it is apparent that extreme drought conditions are expected in the entity of Crete in sub-periods that belong to the third future time slice compared to the current situation.
For the largest part of Crete, the mean 2075–2100 time slice value of SPI12 index for the median climate model is expected to fall at least one drought index category, while the remaining sub-basins will fall either two categories or none. Areas that change index category and particularly areas that change more than one categories are expected to undergo major changes in the prevailing conditions in a short time and therefore the effects of climate change will be more severe.
3.1.2. Relative SRI
Similarly, to SPI relative SRI index is calculated using as input parameter the flow output of Karst-SWAT model for each sub-basin, to determine the hydrological drought. For the different RCM simulations and for all the study periods, the average months with hydrological drought per year are shown in Table 4.
In Table 3 and Table 4 the months per year with drought are demonstrated for SPI and SRI cases, respectively. It is notable that in RCP2.6 scenarios the months per year with drought are increased on average at about 100% for both time slices (2025–2050, 2075–2100) for SPI, whereas for SRI the increases are on average about 350% and 330% for 2025–2050 and 2075–2100 time slices, respectively. In RCP4.5 scenarios, the months per year with drought are increased on average about 115% and 145% for 2025–2050 and 2075–2100 time slices, respectively, for SPI. In the same scenarios, for SRI the increases are on average about 330% and 390% for 2025–2050 and 2075–2100 time slices, respectively. Finally, in RCP8.5 scenarios, the months per year with drought are increased on average at about 406% and 990% for 2025–2050 and 2075–2100 time slices, respectively, for SPI. In the same scenarios, for SRI the increases are on average about 240% and 620% for 2025–2050 and 2075–2100 time slices, respectively. However, these results are depicting average percentages for the scenarios’ sets. If the analysis should be made separately for every scenario, the results then could depict decreases in months per year with drought. For example, HadGEM2-ES-r1 in RCP4.5 scenario, depicts a decrease in months with drought of −1% and −5% for 2025–2050 and 2075–2100, respectively, compared to the baseline. Therefore, it is very important to decide the way in which such results should be handled, based always on the researcher’s view. In this paper, the use of average percentages is appropriate, since they depict a general future increase of the months per year with drought for RCP4.5 and RCP8.5 and for both time slices.
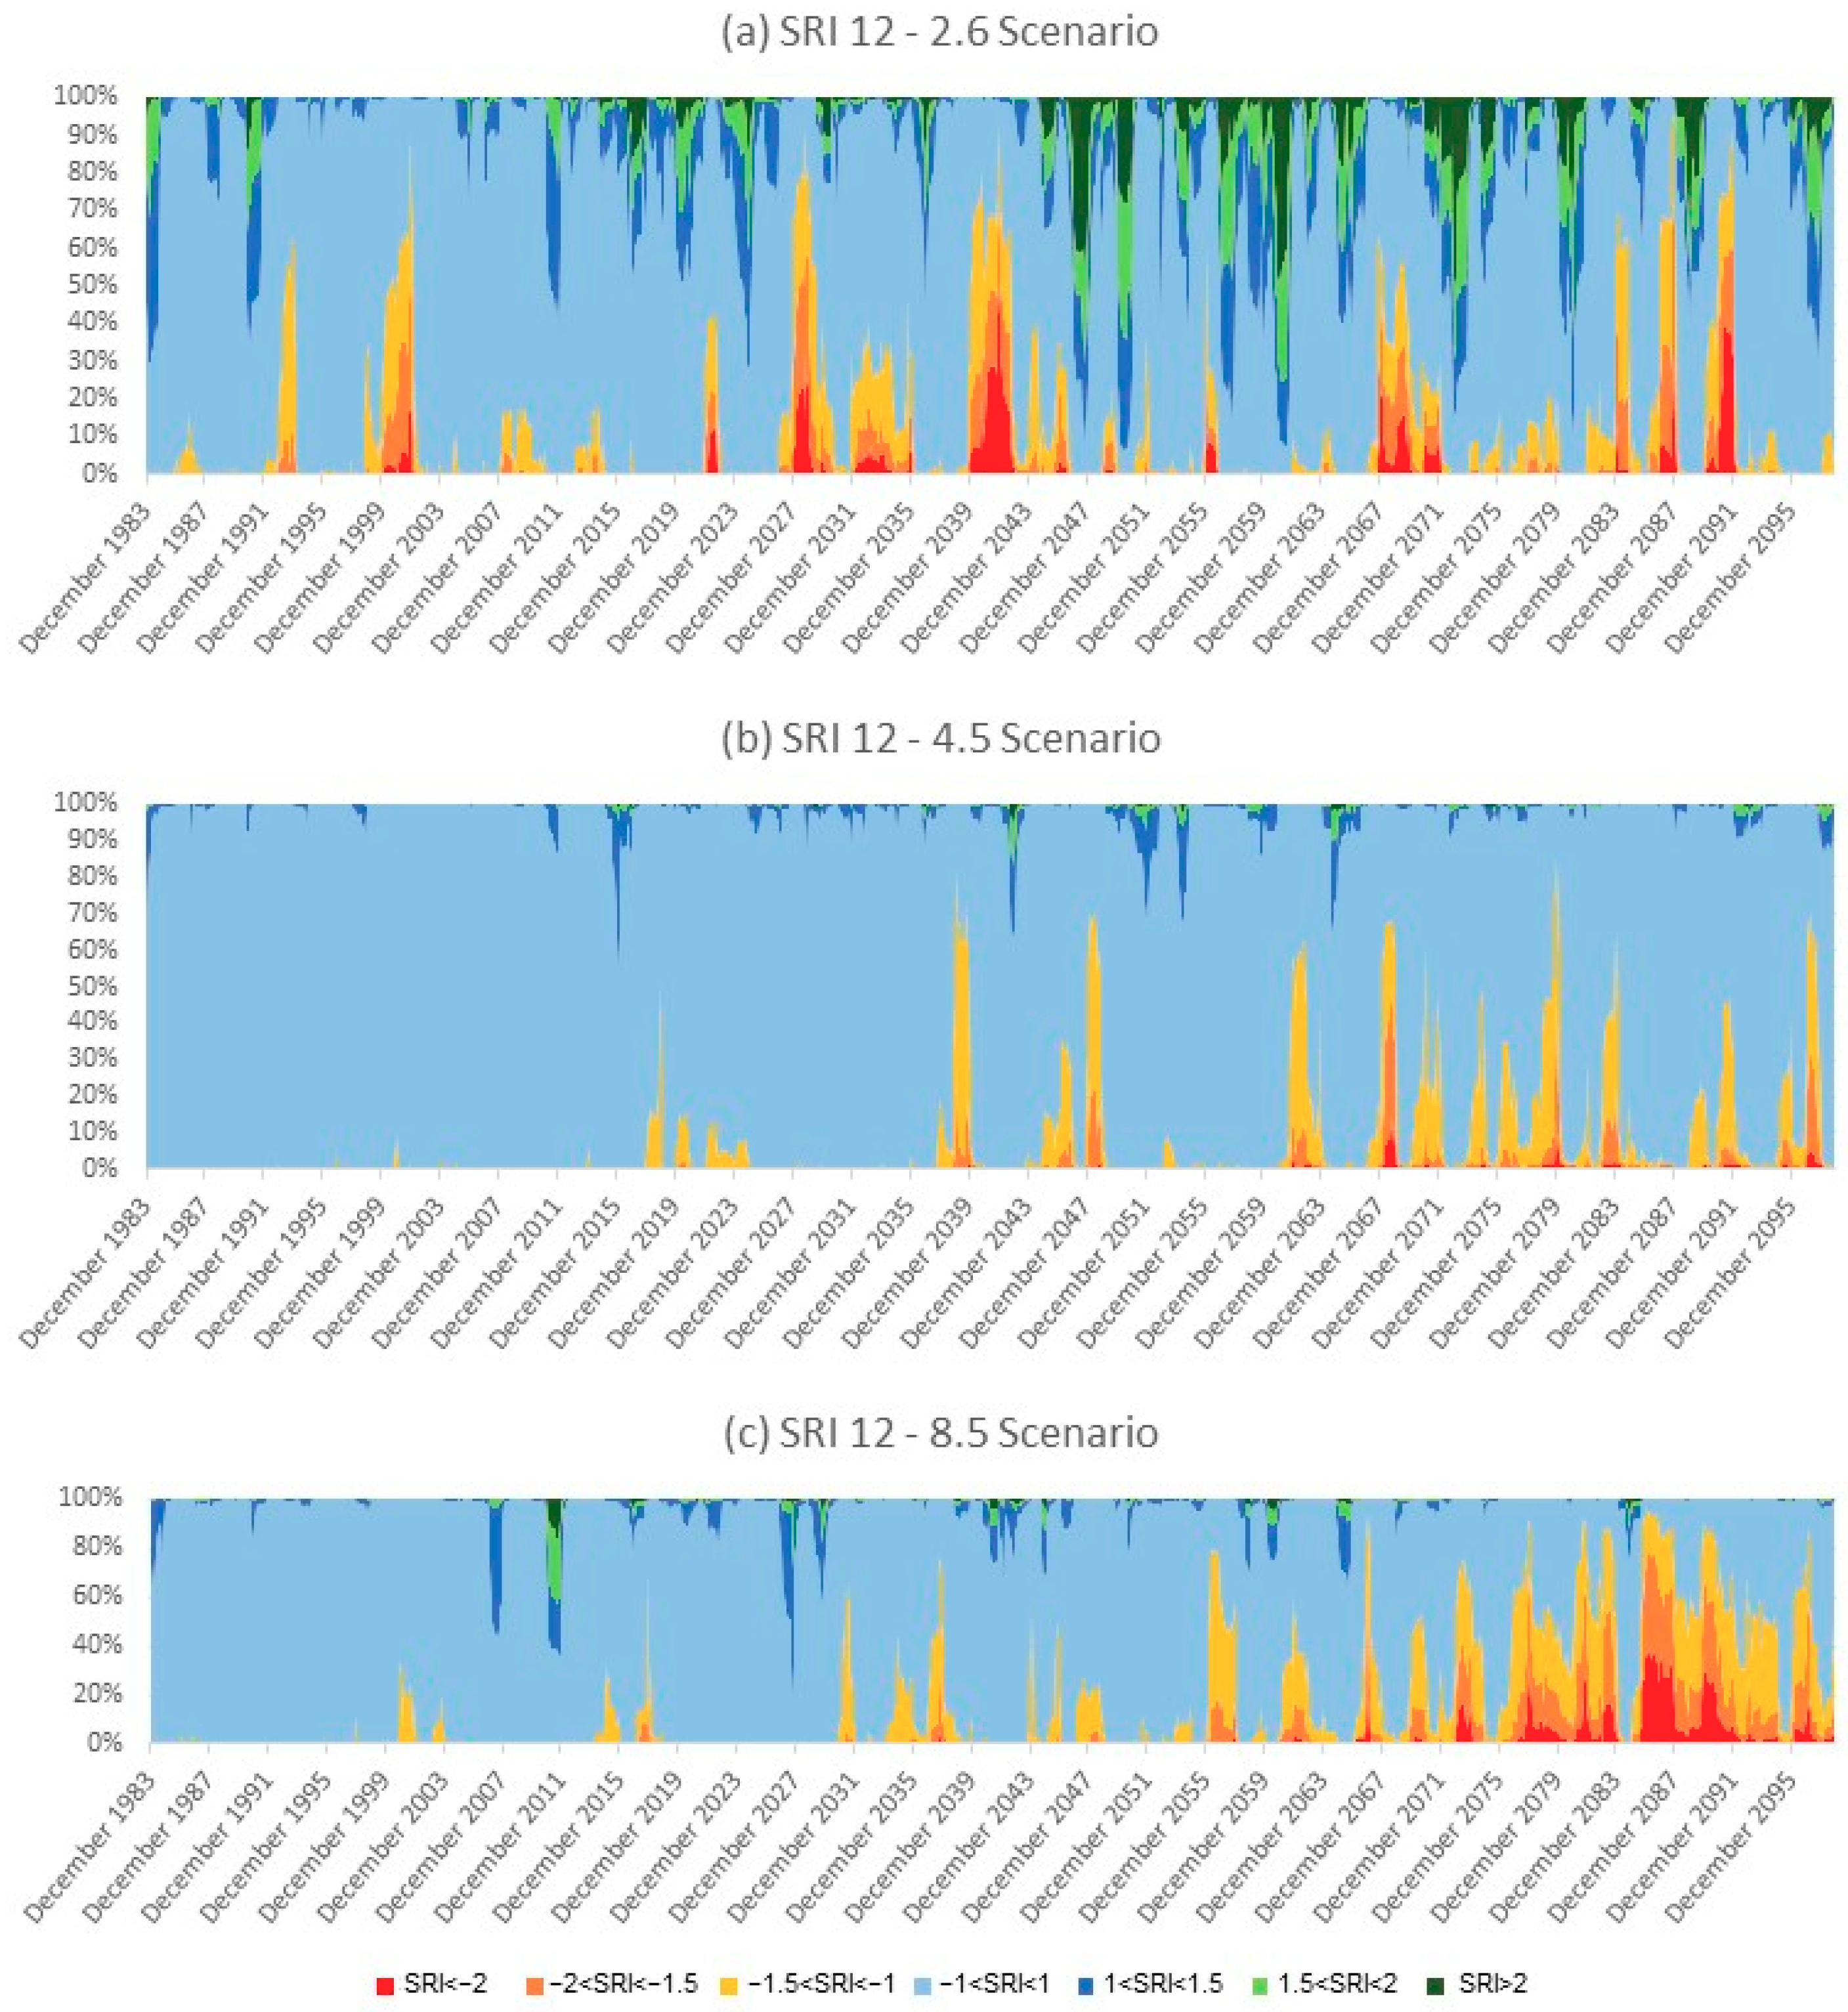
For the island of Crete, the percentage of its area, which corresponds to the SRI12 index categories, for the mean RCP2.6, RCP4.5 and RCP8.5 scenarios, results are shown in Figure 3.
Similarly, to SPI12, in the mean RCP2.6 value there is a balance between dry and wet periods, while models following the RCP8.5 scenario demonstrate a larger increase in the duration and number of drought events throughout Crete.
For the largest part of Crete, the average of all the SRI12 index derived from the RCM simulations will fall one category, 54 basins will fall two categories and three basins will face a downgrade of three categories. These three basins are expected to have a large reduction in runoff and consequently a large impact on their water availability.
3.2. Frequency Analysis
The frequency analysis’ results of meteorological and hydrological drought, extreme flow and precipitation are presented for the 100 years return period. The GEV distribution provided best fit to the data, among a set of several distributions (Gumbel, Weibull, Poisson). The frequency analysis’ results take place for each sub-basin separately, and the mapping of the results is made within GIS without taking into account any other parameter that affects the spatial distribution of each examined variable.
3.2.1. Hydrological Drought Frequency Analysis
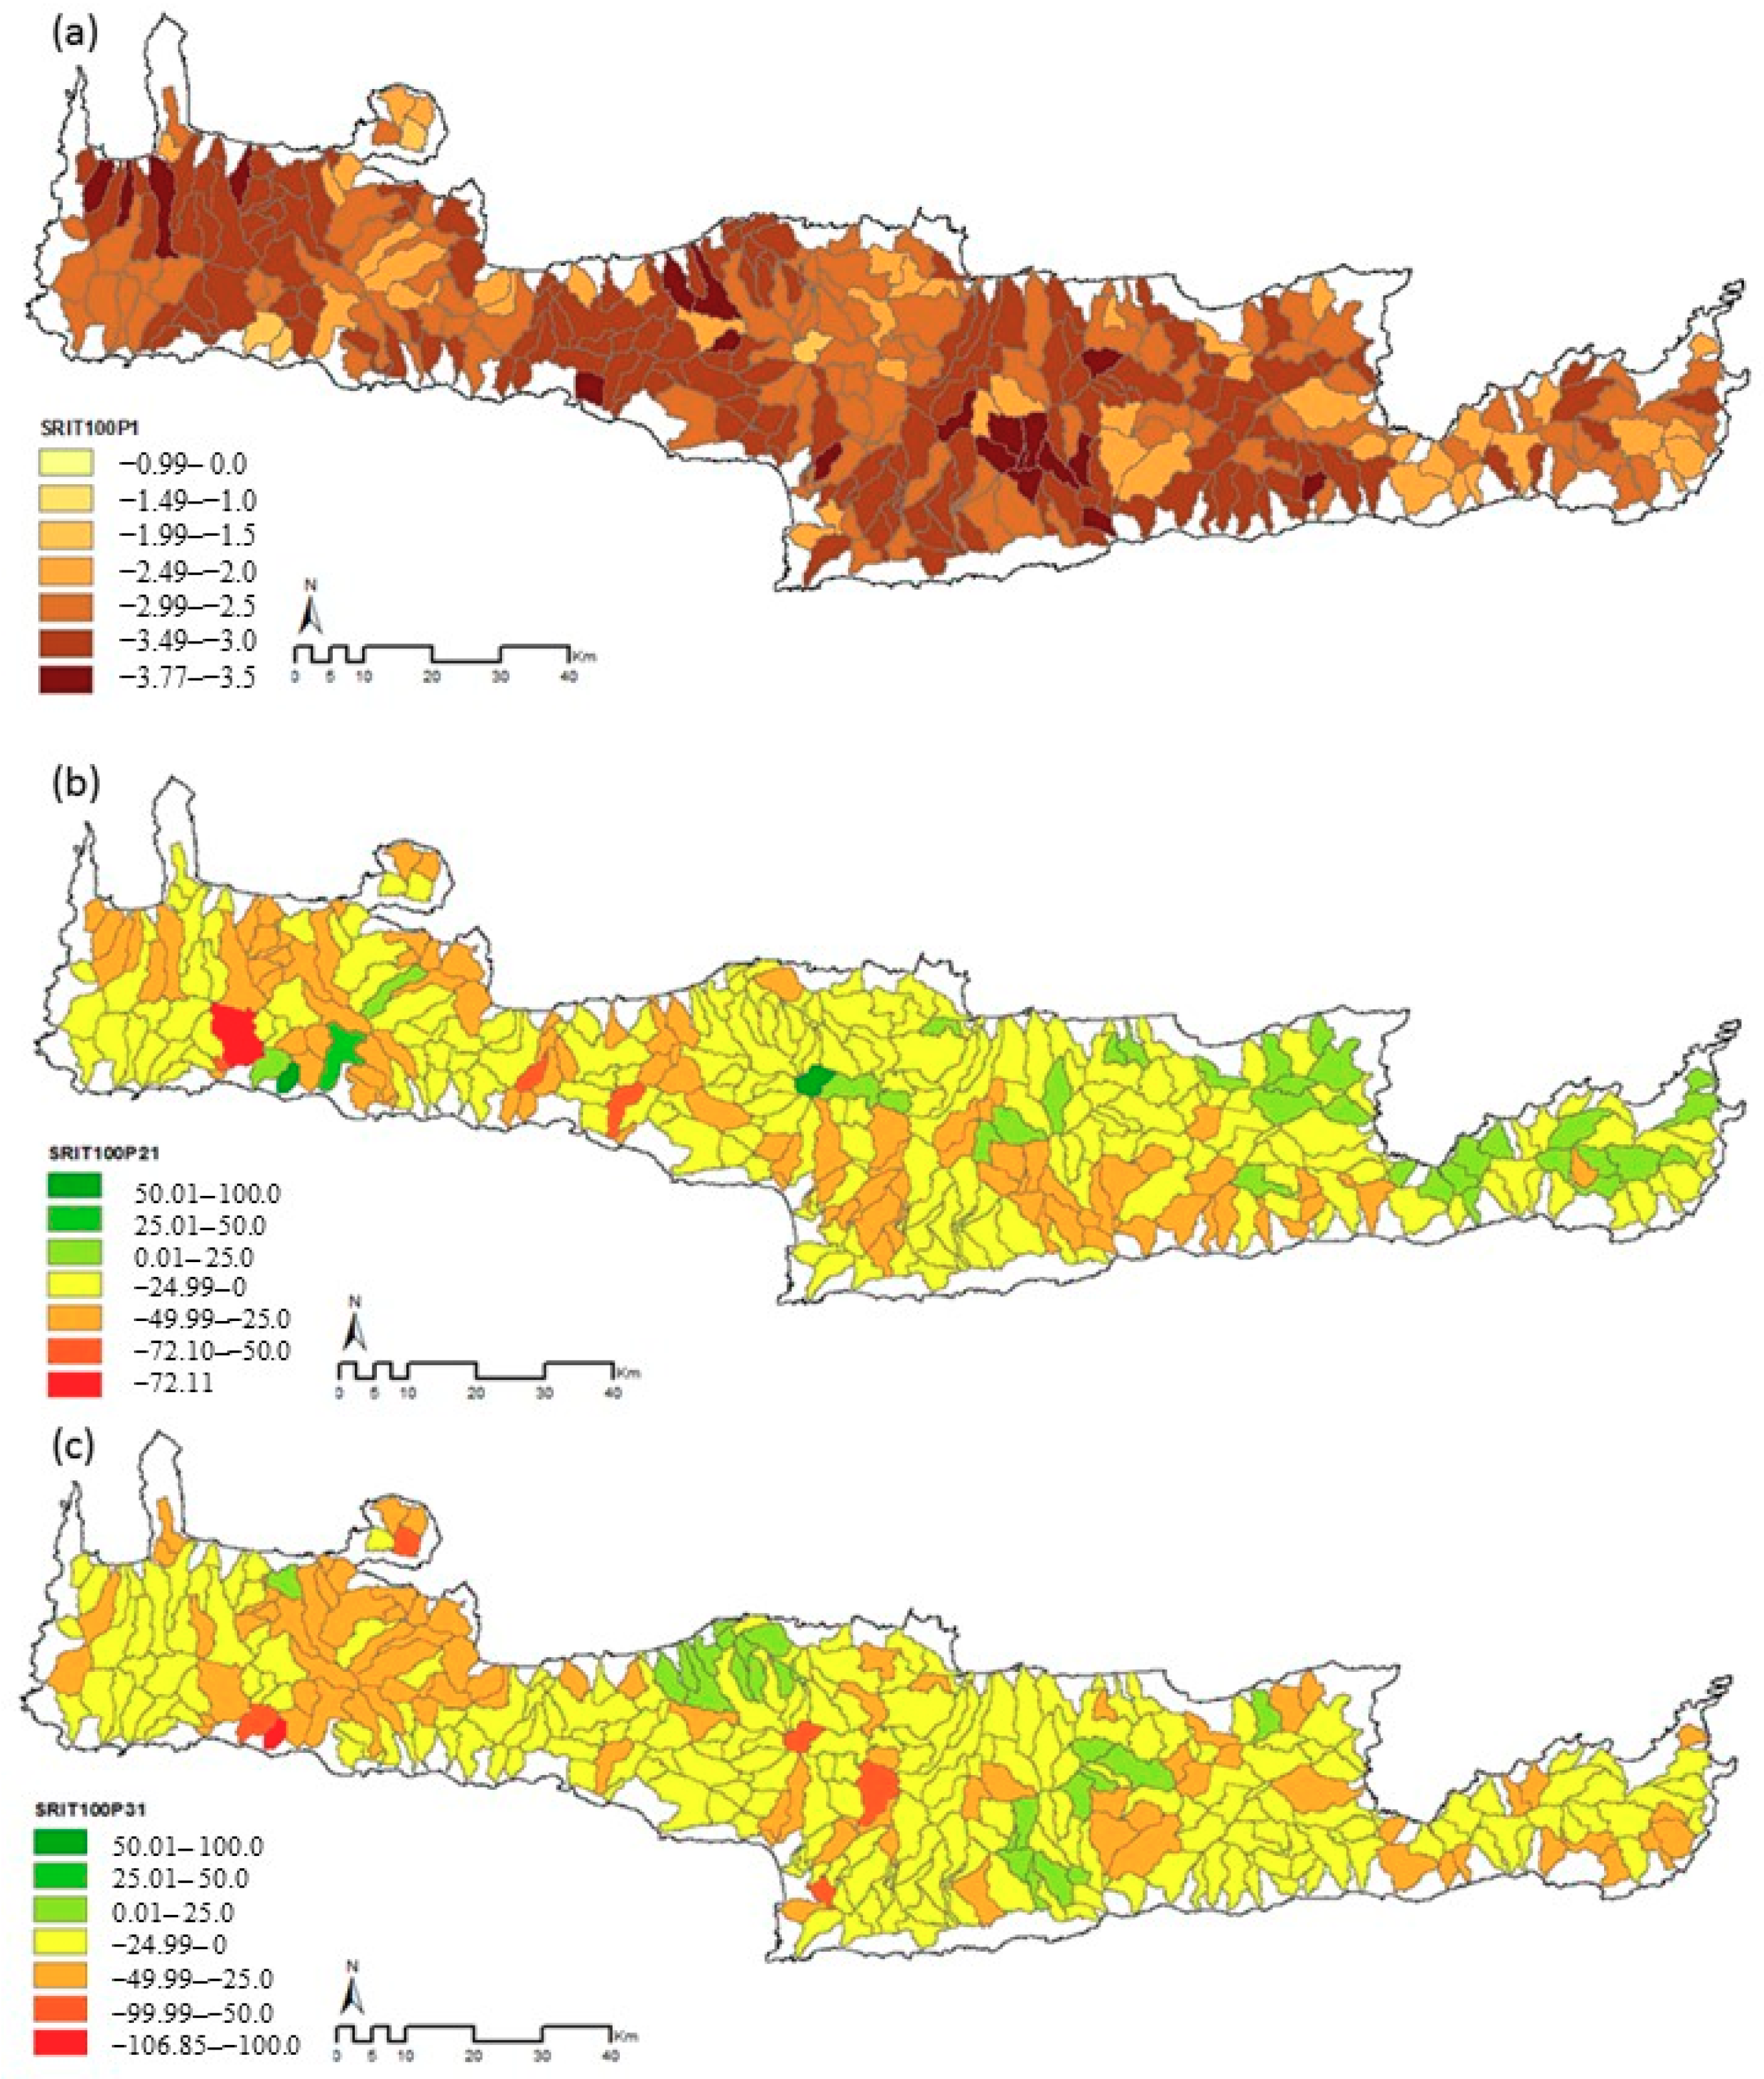
The hydrological drought frequency analysis under climate change is carried out by analysing the results of the annual minimum SRI index. These values indicate the annual potential extreme hydrological drought that is expected to prevail in the future in certain areas of Crete due to climate change. For T = 100 years return period, Figure 4 show the relative percentage of change of the SRI index following the median scenario results for the future time slices 2025–2050 (Figure 4b) and 2075–2100 (Figure 4c), both compared to the baseline window of 1985–2010 (Figure 4a). Due to the large amount of data involved, the average value of the SRI index was used as representative of all the different RCMs. Normally an average value would be used; however, the meaning of the average value in climate change studies is most valuable when used as the average of the different RCM values. However, this process will produce a large number of layouts for each study period and for each studied extreme event category, therefore the median value of all RCMs simulations is used as the most representative.
The majority of sub-basins may face severe hydrological drought conditions in the range of 0–40% decrease in SRI for both study periods when compared to the baseline time slice. For the first time slice, the minimum SRI among all the sub-basins is −4.1, dropping at −5.57 and −4.81 at the second and third time slice accordingly. Following the same trend the average SRI values are −3.1, −3.5 and −3.47 for the 1st, 2nd and 3rd time slice respectively. The SRI reduction vary on average up to 20%; reaching 40% in individual areas. Hydrological drought conditions of higher severity are expected on the island of Crete in the 2075–2100 time slice compared to the baseline in the largest part of the island.
3.2.2. Meteorological Drought Frequency Analysis
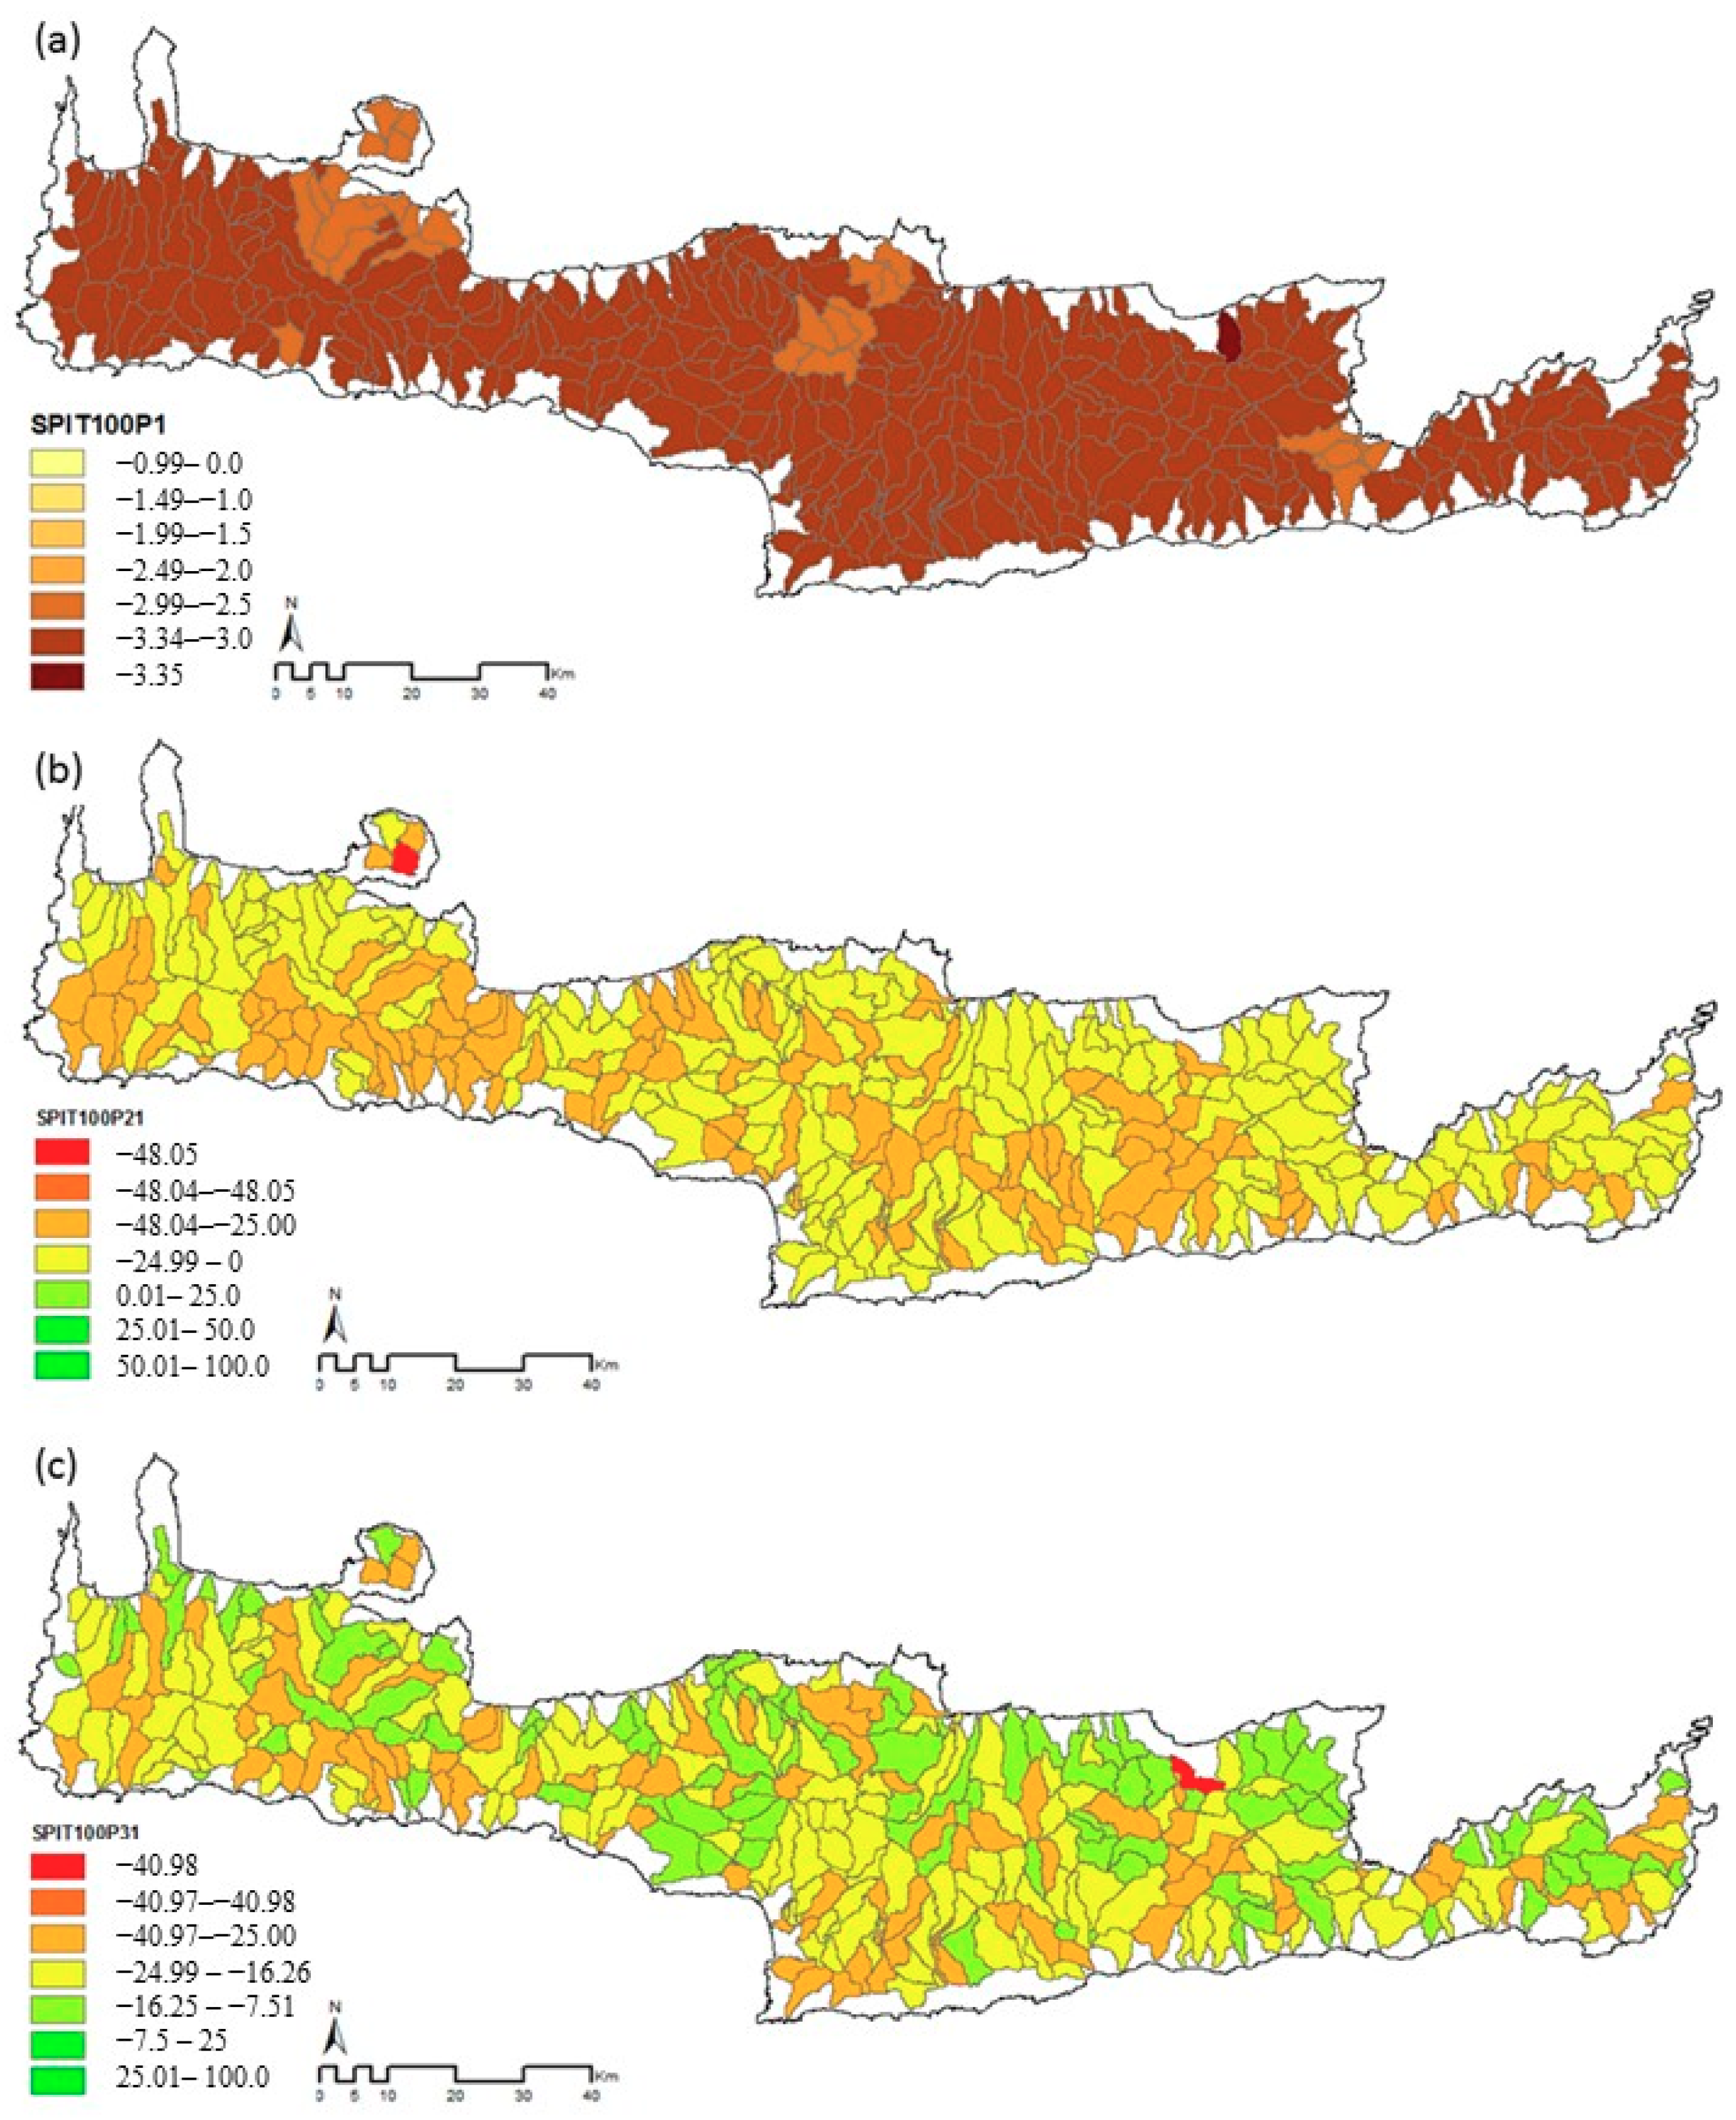
The meteorological drought frequency analysis under climate change is performed by analysing the annual minimum time series of SPI values. These values indicate the potential extreme meteorological drought that is expected to prevail in certain areas of Crete due to climate change. For T = 100 years return period, Figure 5 present the relative percentage of change of SPI following the median scenario results for the future time slice 2025–2050 (Figure 5b) and the future time slice 2075–2100 (Figure 5c), both compared to the baseline scenario 1985–2010 (Figure 5a).
The meteorological drought conditions are expected to be severe in the entire island both for the second and third time slice. It is also noteworthy the magnitude of potential meteorological drought risk in western Crete (Chania Prefecture) both in the second and the third time slice for T = 100 years, where the meteorological drought condition changes reach a 43% reduction on SPI for both future time slices compared to the baseline scenario. Please note that the southern part of Heraklion Prefecture the magnitude of SPI index values with T = 100 years declines about 25–41% (third time slice), compared to the baseline period. For the first time slice the minimum SPI among all the sub-basins is −3.7, dropping at −4.4 and −4.2 at the second and third time slice accordingly. Orange colour in Figure 5 indicates that the magnitude of the potential meteorological drought event with 100 years return period is decreasing significantly mainly in Chania Prefecture at the 2025–2050 time slice. Less severe meteorological drought conditions are expected for the Chania Prefecture at the 2075–2100 time slice, compared to the baseline scenario. At 2025–2050 time slice, meteorological drought extremes are expected to be milder in the eastern Crete, compared to the baseline period. For the same area at the 2075–2100 time slice, the magnitude of potential meteorological drought events are expected to be severe.
3.2.3. Extreme Precipitation Frequency Analysis
The extreme precipitation frequency analysis under climate change is carried out by analysing the results of the annual maximum daily precipitation. These values indicate the potential extreme precipitation that will take place in Crete due to climate change. The results are presented for 100 years return period (Figure 6), in terms of relative percentage of change in magnitude for the periods 2025–2050 (Figure 6b) and 2075–2100 (Figure 6c) compared to the baseline period (Figure 6a), respectively. Red dots represent the current precipitation network of meteorological stations.
Green colour covers the biggest part of the island during the time slice 2025–2050 and indicates that the magnitude of the potential extreme precipitation event will decrease up to 20% compared to the baseline time slice. This is due to the general reduction of precipitation in the region simulated by the climate models. However, at the 2075–2100 time slice the northwestern part of the Island of Crete expects a 25–50% increase in the magnitude of the potential rainfall event, compared to the baseline scenario. The severity of the potential T100 event is increasing in the 2075–2100 time slice compared to the baseline period. The blue dots define the meteorological gauges network already established in the study area. It is obvious that more stations should be installed in multiple locations in order to provide more accurately distributed information leading to better future climate predictions.
3.2.4. Extreme Flow Frequency Analysis
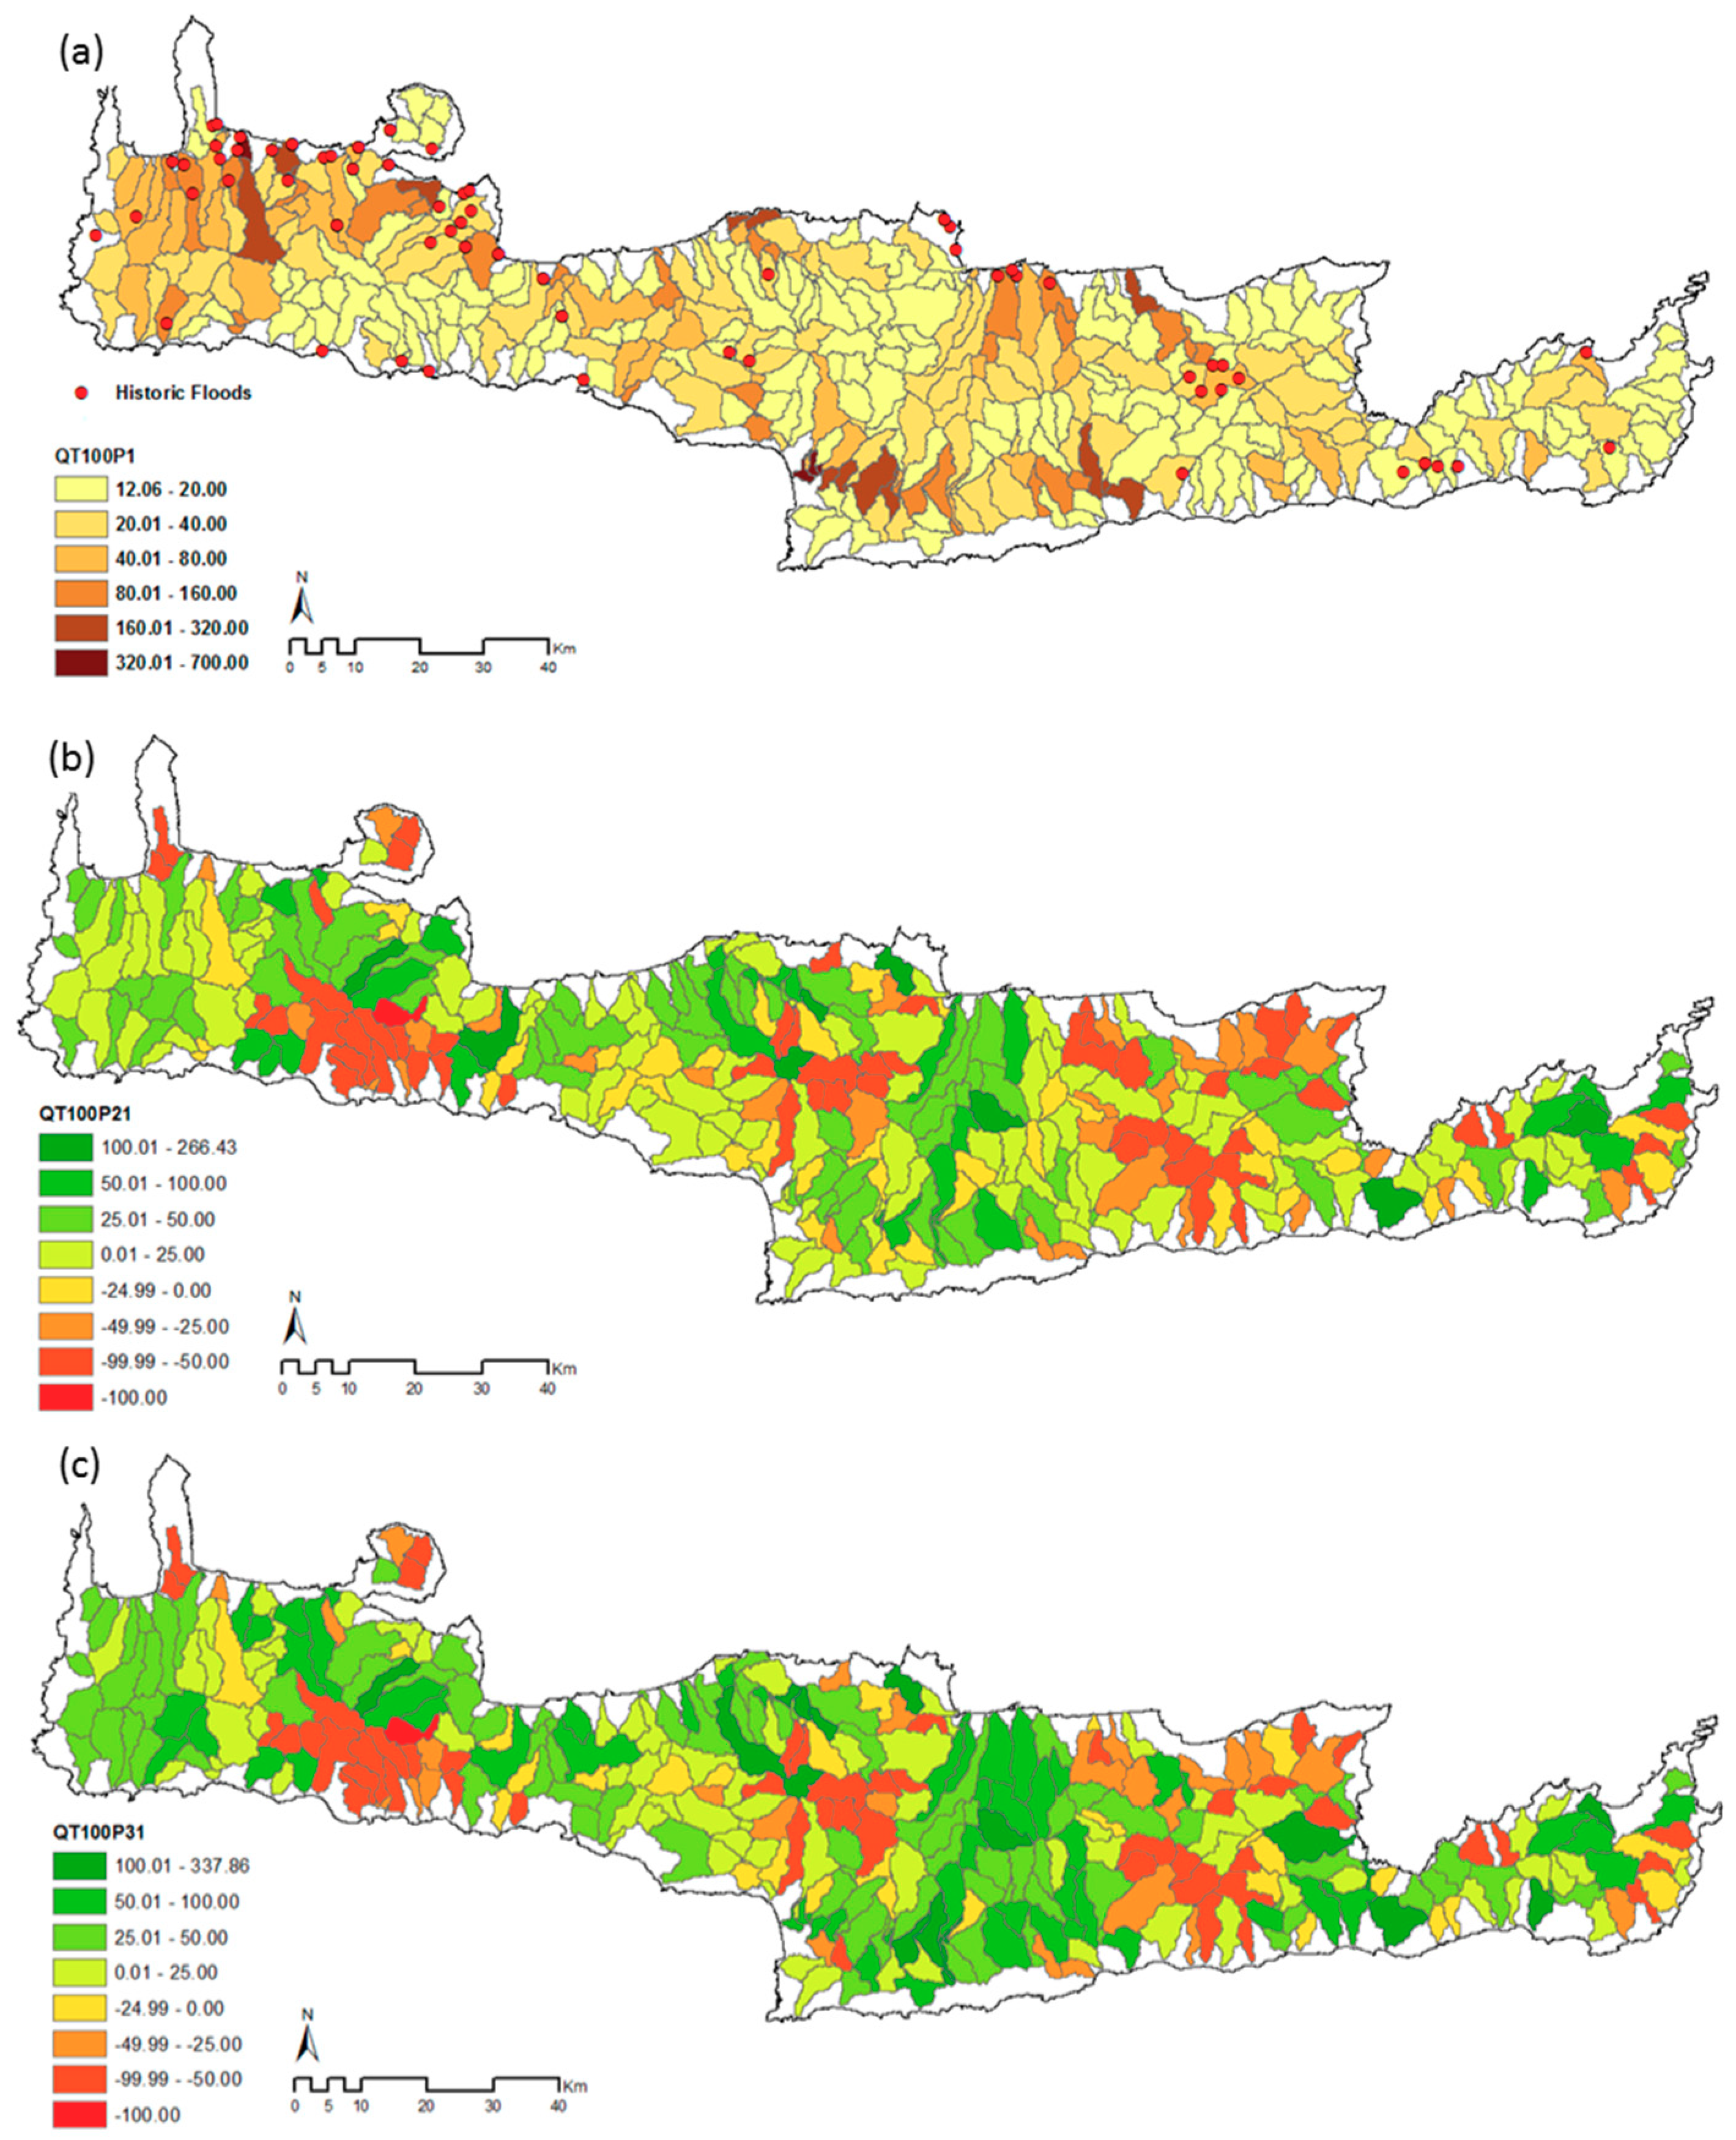
Extreme flow frequency analysis under climate change is carried out by analysing the annual maximum runoff derived by the hydrological model in every sub-catchment. These values indicate the potential extreme flow in certain areas of Crete due to climate change. The results are presented for T = 100 years return period (Figure 7), in terms of relative percentage of change in magnitude for the periods 2025–2050 (Figure 7b) and 2075–2100 (Figure 7c) compared to the baseline period (Figure 7a). Due to the large amount of data involved, the maps present the median model value runoff results as representative of all the different RCMs. The magnitude of flow events with T = 100 years does not differ greatly between the three time slices. Red dots define areas where historical flood events attributed to extreme flow have been recorded.
In Figure 7, Messara region (in the south of Heraklion Prefecture) shows an increasing trend, reaching 50% in extreme flow events during the third time slice compared to the baseline slice. Special attention must be given in the results for T = 100 years return period in several sub-basins in the southern and northern part of Heraklion Prefecture, as well as in the northern part of Chania Prefecture. Some of these areas have already experienced intense flood events and have been identified as potential areas of high flood risk (red dots, Figure 7) attributed to increased flow within the sub-basin. Moreover, in almost all the areas affected by floods in the past the magnitude of T100 is expected to increase.
It is expected that the magnitude of the potential extreme flow event is increased up to 50% in the northern part of Chania Prefecture for both time slices compared to the baseline scenario. It is notable that in these specific areas are prone to flooding, since historic flood events have been already recorded. However, there are areas (noted by red colour) where the magnitude of the potential extreme flow event is decreasing at about 50%. In any case flood events are heavily affected by local conditions, such as the topography of the sub-basin, the slope etc. For this reason, sub-basins where an increase in T = 100 years flood magnitude is predicted, must be studied separately in order to draw safe conclusions.
4. Discussion
The impact of climate change on droughts, floods and extreme precipitation events is studied in this paper. Results on drought extreme events indicate that the probability of occurrence for both meteorological and hydrological drought is particularly high on the island of Crete. Depending on the severity of each RCM simulation of specific RCPs, different behaviour is shown in drought indicators. Particularly for RCP2.6 and RCP4.5 both indices had an increase in the average number of months with drought per year, for the time slice 2025–2050, while in 2075–2100 this number slightly decreases. In RCP8.5, the average number of months with drought per year is continuously increasing. Moreover, for both indicators, extended drought periods throughout Crete are expected, depicting stronger effects during 2075–2100 especially for the RCP8.5 scenario.
Overall, in Crete an increase in the number and intensity of droughts is expected. For 100 years return period, SRI index indicates severe hydrological drought conditions in the largest part of the Island of Crete for the 2075–2100 time period. Extreme meteorological drought events with 100 years return period are expected mainly in Chania Prefecture for the 2025–2050 time period, whereas the condition is milder in the western part for the 2075–2100 time period. In the eastern part, the meteorological drought extremes are not severe at 2025–2050 time slice, where the SPI index increases in some places. However, the situation at 2075–2100 time period for the specific area is getting worse, since the magnitude of the potential meteorological drought events is getting more severe, compared to the baseline period, 1985–2010. The above results are in good agreement with the respective SPI analysis within Koutroulis et al. [12], where it was concluded that more than half of the total area of Crete is about to experience drought conditions during 28%, 69%, and 97% of the 2010–2040, 2040–2070, and 2070–2100 periods, respectively.
Considering these results, policy makers and stakeholders should be able to draw plans and measures, appropriate for each sub-basin individually, in order to minimize the risks linked to extreme future events. Nevertheless, Koutroulis et al. [12] have already stated the urgent need for the development of strategic water management and preparedness plans in all drought-prone areas in order to help mitigate most of the resulting adverse effects. These policy plans should take into consideration both the indices and magnitude of T = 100 year events, as well as any particularities within the study sub-basins.
Regarding extreme precipitation frequency analysis, at the time slice 2025–2050, the magnitude of the potential extreme rainfall event is decreased by up to 20% compared to the baseline time slice. However, at the time slice 2075–2100 the north-western part of the Island of Crete expects a 25–50% increase in the magnitude of the potential rainfall events, compared to the baseline scenario. The severity of the potential event is increasing in 2075–2100 time slice compared to the baseline period. Regarding extreme flow frequency analysis, it is expected that the magnitude of the potential flood event with T = 100 years return period to be increased up to 50% in the northern part of Chania Prefecture for both time slices compared to the baseline. It is notable that in these specific areas are prone to flooding, since historic flood events have been already recorded in the past. However, there are areas (noted by red colour) where the magnitude of the potential flood event is decreasing about 50%. Flood frequency analysis denotes individual sub-basins, in which future events are expected to be severe. Extreme precipitation and flood magnitude results should be evaluated separately at the sub-basin scale in order to determine the limit above which the flowrate/precipitation cause problems to the corresponding sub-basin. Different magnitude of events can cause disproportion problems to different sub-basins, therefore the impact of events should be identified in according to the characteristics and particularities of each sub-basin. In addition, the established network of rain gauges may indicate the locations where more stations should be installed in order to provide more accurate spatio-temporal information and consequently better future climate predictions. In addition, historic flood points indicate the areas already prone to flooding, which should be carefully managed. All the above, could contribute to the suitable designing of a good emergency management practice in many areas of Crete.
5. Conclusions
In the present paper, a frequency analysis of a series of extremes is performed in the island of Crete. When studying extreme precipitation events and extremes attributed to increased flow in a sub-basin it is possible to use the climate model results and hydrological model results correspondingly. In the case of drought, the corresponding drought indices (SPI for meteorological drought and SRI for hydrological drought) are first calculated. The methodology followed in the present work can be a useful decision tool for policymaking and strategic planning, since areas of high potential risk in the occurrence of extreme hydrological and meteorological events are due to climate change. Nevertheless, the valuable information provided in this work could be part of the management plans of Crete against drought, flood and extreme precipitation hazards in order to adopt the appropriate and effective methods to tackle the climate change impact. However, it is advisable to perform additional regional analysis in areas prone to extreme hydro meteorological hazards. For example, flood predictions in a watershed scale and under a sub-daily time step could provide improved estimations of the upcoming risks.
Author Contributions
Conceptualization, E.T., A.E.V. and I.T.; Methodology, E.T. and A.E.V.; Software, E.T.; Validation, E.T. and A.E.V.; Formal Analysis, E.T. and A.E.V.; Investigation, E.T. and A.E.V.; Writing-Original Draft Preparation, E.T. and A.E.V.; Writing-Review & Editing, E.T., A.E.V. and I.T.; Visualization, E.T. and A.E.V.; Supervision, I.T.; Funding Acquisition, I.T.
Funding
The research reported in this paper was supported by the projects EEA -AQUAMAN and H2020-IMPREX (Grant agreement 641811).
Acknowledgments
The authors would like to thank the members of the Hydrogeochemical Engineering and Soil Remediation laboratory in Technical University of Crete, Prof. Nikolaidis Nikolaos, PhD candidates Nerantzaki Sofia and Efstathiou Dionysis for providing the Karst-SWAT model simulation results. The authors would also like to thank Dr. Grillakis M.G. for his crucial and fundamental contribution to the bias correction process of the climate dataset used in this article.
Conflicts of Interest
The authors declare no conflict of interest.
References
- IPCC. Climate Change 2014: Impacts, Adaptation, and Vulnerability. Part A: Global and Sectoral Aspects. Contribution of Working Group II to the Fifth Assessment Report of the Intergovernmental Panel on Climate Change; Cambridge University Press: Cambridge, UK; New York, NY, USA, 2014. [Google Scholar]
- Koutroulis, A.G.; Grillakis, M.G.; Daliakopoulos, I.N.; Tsanis, I.K.; Jacob, D. Cross sectoral impacts on water availability at +2 °C and +3 °C for east Mediterranean island states: The case of Crete. J. Hydrol. 2016, 532, 16–28. [Google Scholar] [CrossRef] [Green Version]
- Iordanidou, V.; Koutroulis, A.G.; Tsanis, I.K. Mediterranean cyclone characteristics related to precipitation occurrence in Crete, Greece. Nat. Hazards Earth Syst. Sci. 2015, 15, 1807–1819. [Google Scholar] [CrossRef] [Green Version]
- Flocas, H.A.; Tsanis, I.K.; Katavoutas, G.; Kouroutzoglou, J.; Iordanidou, V.; Alexakis, D.D. Climatological aspects of cyclonic tracks associated with flood events in Crete, Greece. Theor. Appl. Climatol. 2017, 130, 1163–1174. [Google Scholar] [CrossRef]
- Koutroulis, A.G.; Tsanis, I.K.; Daliakopoulos, I.N. Seasonality of floods and their hydrometeorologic characteristics in the island of Crete. J. Hydrol. 2010, 394, 90–100. [Google Scholar] [CrossRef]
- Alexakis, D.D.; Mexis, F.-D.K.; Vozinaki, A.-E.K.; Daliakopoulos, I.N.; Tsanis, I.K. Soil Moisture Content Estimation Based on Sentinel-1 and Auxiliary Earth Observation Products. A Hydrological Approach. Sensors 2017, 17, 1455. [Google Scholar] [CrossRef] [PubMed]
- Vozinaki, A.-E.K.; Karatzas, G.P.; Sibetheros, I.A.; Varouchakis, E.A. An agricultural flash flood loss estimation methodology: The case study of the Koiliaris basin (Greece) February 2003 flood. Nat. Hazards 2015, 79, 899–920. [Google Scholar] [CrossRef]
- Tsanis, I.K.; Seiradakis, K.D.; Daliakopoulos, I.N.; Grillakis, M.G.; Koutroulis, A.G. Assessment of GeoEye-1 stereo-pair-generated DEM in flood mapping of an ungauged basin. J. Hydroinform. 2014, 16, 1–18. [Google Scholar] [CrossRef]
- Koutroulis, A.G.; Tsanis, I.K. A method for estimating flash flood peak discharge in a poorly gauged basin: Case study for the 13–14 January 1994 flood, Giofyros basin, Crete. J. Hydrol. 2010, 385, 150–164. [Google Scholar] [CrossRef]
- Tsanis, I.K.; Koutroulis, A.G.; Daliakopoulos, I.N.; Jacob, D. Severe climate-induced water shortage and extremes in Crete. Clim. Chang. 2011, 106, 667–677. [Google Scholar] [CrossRef]
- Kovats, R.S.; Valentini, R.; Bouwer, L.M.; Georgopoulou, E.; Jacob, D.; Martin, E.; Rounsevell, M.; Soussana, J.-F. Climate Change 2014: Impacts, Adaptation, and Vulnerability. Part B: Regional Aspects. Contribution of Working Group II to the 5th Assessment Report of the IPCC; Cambridge University Press: Cambridge, UK; New York, NY, USA, 2014; pp. 1267–1326. [Google Scholar]
- Koutroulis, A.G.; Vrochidou, A.-E.K.; Tsanis, I.K. Spatiotemporal Characteristics of Meteorological Drought for the Island of Crete. J. Hydrometeorol. 2011, 12, 206–226. [Google Scholar] [CrossRef]
- Nikolaidis, N.P.; Bouraoui, F.; Bidoglio, G. Hydrologic and geochemical modeling of a karstic Mediterranean watershed. J. Hydrol. 2013, 477, 129–138. [Google Scholar] [CrossRef]
- Paparrizos, S.; Maris, F.; Weiler, M.; Atzarakis, A. Analysis and mapping of present and future drought conditions over Greek areas with different climate conditions. Theor. Appl. Climatol. 2018, 131, 259–270. [Google Scholar] [CrossRef]
- Tsanis, I.K.; Apostolaki, M.G. Estimating Groundwater Withdrawal in Poorly Gauged Agricultural Basins. Water Resour. Manag. 2009, 23, 1097–1123. [Google Scholar] [CrossRef]
- WMO. World Meteorological Organization Standardized Precipitation Index User Guide; WMO-No. 1090; Svoboda, M., Hayes, M., Wood, D., Eds.; WMO: Geneva, Switzerland, 2012. [Google Scholar]
- Bandyopadhyay, N.; Bhuiyan, C.; Saha, A.K. Heat waves, temperature extremes and their impacts on monsoon rainfall and meteorological drought in Gujarat, India. Nat. Hazards 2016, 82, 367–388. [Google Scholar] [CrossRef]
- Thomas, T.; Jaiswal, R.K.; Galkate, R.; Nayak, P.C.; Ghosh, N.C. Drought indicators-based integrated assessment of drought vulnerability: A case study of Bundelkhand droughts in central India. Nat. Hazards 2016, 81, 1627–1652. [Google Scholar] [CrossRef]
- Sahoo, R.N.; Dutta, D.; Khanna, M.; Kumar, N.; Bandyopadhyay, S.K. Drought assessment in the Dhar and Mewat Districts of India using meteorological, hydrological and remote-sensing derived indices. Nat. Hazards 2015, 77, 733–751. [Google Scholar] [CrossRef]
- Dubrovsky, M.; Svoboda, M.D.; Trnka, M.; Hayes, M.J.; Wilhite, D.A.; Zalud, Z.; Hlavinka, P. Application of relative drought indices in assessing climate-change impacts on drought conditions in Czechia. Theor. Appl. Climatol. 2009, 96, 155–171. [Google Scholar] [CrossRef]
- Duan, J.G.; Bai, Y.; Rivera, D.E.; Meixner, T. Framework for incorporating climate change on flood magnitude and frequency analysis in the upper Santa Cruz River. J. Hydrol. 2017, 549, 194–207. [Google Scholar] [CrossRef]
- Shamir, E.; Megdal, S.B.; Carrillo, C.; Castro, C.; Chang, H.I.; Chief, K.; Corkhill, F.E.; Eden, S.; Georgakakos, K.P.; Nelson, K.M.; et al. Climate change and water resources management in the Upper Santa Cruz River, Arizona. J. Hydrol. 2015, 521, 18–33. [Google Scholar] [CrossRef] [Green Version]
- Chen, Z.; Grasby, S.E. Reconstructing river discharge trends from climate variables and prediction of future trends. J. Hydrol. 2014, 511, 267–278. [Google Scholar] [CrossRef]
- Li, J.; Lei, Y.; Tan, S.; Bell, C.D.; Engel, B.A.; Wang, Y. Nonstationary Flood Frequency Analysis for Annual Flood Peak and Volume Series in Both Univariate and Bivariate Domain. Water Resour. Manag. 2018, 32, 4239–4252. [Google Scholar] [CrossRef]
- AQUAMAN. Impacts of Climate Change on Water Resources Management in Crete; Technical Report SAE075/8 AQUAMAN; Innovative Solutions to Climate Change Adaptation and Governance in the Water Management of the Region of Crete Deliverable 2; AQUAMAN: Crete, Greece, 2016; Chapter 4. (In Greek) [Google Scholar]
- Nerantzaki, S.D.; Efstathiou, D.; Giannakis, G.V.; Kritsotakis, M.; Nikolaidis, N.P.; Grillakis, M.G.; Koutroulis, A.; Tsanis, I.K. Climate change impact on water resources management in the island of Crete. Hydrol. Sci. J. 2019. under review. [Google Scholar]
- Naoum, S.; Tsanis, I.K. A Multiple Linear Regression GIS Module using Spatial Variables to Model Orographic Rainfall. J. Hydroinform. 2004, 6, 39–56. [Google Scholar] [CrossRef]
- Vrochidou, A.-E.K.; Tsanis, I.K. Assessing precipitation distribution impacts on droughts on the island of Crete. Nat. Hazards Earth Syst. Sci. 2012, 12, 1159–1171. [Google Scholar] [CrossRef] [Green Version]
- Grillakis, M.G.; Koutroulis, A.G.; Tsanis, I.K. Multisegment statistical bias correction of daily GCM precipitation output. J. Geophys. Res. Atmos. 2013, 118, 3150–3162. [Google Scholar] [CrossRef] [Green Version]
- Grillakis, M.G.; Koutroulis, A.G.; Daliakopoulos, I.N.; Tsanis, I.K. A method to preserve trends in quantile mapping bias correction of climate modeled temperature. Earth Syst. Dyn. 2017, 8, 889–900. [Google Scholar] [CrossRef]
- Boberg, F.; Christensen, O.B.; Dell’Aquila, A.; Fox Maule, C.; Jacob, D.; Gobiet, A.; Hänsler, A.; Kotova, L.; Mendlik, T.; Pfeifer, S.; et al. D5.1 Report on the Definition of IMPACT2C Mandatory Climate Simulations and Method Applications; Project No. 282746, IMPACT2C; HZG: Geesthacht, Germany, 2015. [Google Scholar]
- Van Vuuren, D.P.; Edmonds, J.; Kainuma, M.; Riahi, K.; Thomson, A.; Hibbard, K.; Hurtt, G.C.; Kram, T.; Krey, V.; Lamarque, J.F.; et al. The representative concentration pathways: An overview. Clim. Chang. 2011, 109, 5–31. [Google Scholar] [CrossRef]
- Vozinaki, A.-E.K.; Tapoglou, E.; Tsanis, I.K. Hydrometeorological impact of climate change in two Mediterranean basins. Int. J. River Basin Manag. 2018, 16, 245–257. [Google Scholar] [CrossRef]
- Malagò, A.; Efstathiou, D.; Bouraoui, F.; Nikolaidis, N.P.; Franchini, M.; Bidoglio, G.; Kritsotakis, M. Regional scale hydrologic modeling of a karst-dominant geomorphology: The case study of the Island of Crete. J. Hydrol. 2016, 540, 64–81. [Google Scholar] [CrossRef] [Green Version]
- McKee, T.B.; Doesken, N.J.; Kleist, J. The relationship of drought frequency and duration to time scales. In Proceedings of the Eighth Conference on Applied Climatology, Anaheim, CA, USA, 17–22 January 1993; pp. 179–184. [Google Scholar]
- McKee, T.B.; Doesken, N.J.; Kleist, J. Drought Monitoring with Multiple Time Scales. In Proceedings of the 9th Conference on Applied Climatology, Dallas, TX, USA, 15–20 January 1995; American Meteorological Society: Boston, MA, USA, 1995; pp. 233–236. [Google Scholar]
- Mukherjee, S.; Mishra, A.; Trenberth, K.E. Climate Change and Drought: A Perspective on Drought Indices. Curr. Clim. Chang. Rep. 2018, 4, 145–163. [Google Scholar] [CrossRef]
- Vicente-Serrano, S.M.; Beguería, S.; López-Moreno, J.I. A multiscalar drought index sensitive to global warming: The standardized precipitation evapotranspiration index. J. Clim. 2010, 23, 1696–1718. [Google Scholar] [CrossRef]
- Edwards, D.C.; McKee, T.B. Characteristics of 20th Century Drought in the United States at Multiple Time Scales; Climatology Report Number 97-2; Colorado State University: Fort Collins, CO, USA, 1997. [Google Scholar]
- Shukla, S.; Wood, A.W. Use of a standardized runoff index for characterizing hydrologic drought. Geophys. Res. Lett. 2008, 35. [Google Scholar] [CrossRef] [Green Version]
- Ming, B.; Guo, Y.; Tao, H.; Liu, G.; Li, S.; Wang, P. SPEIPM-based research on drought impact on maize yield in North China Plain. J. Integr. Agric. 2015, 14, 660–669. [Google Scholar] [CrossRef]
- Hao, Z.; Hao, F.; Singh, V.P.; Xia, Y.; Ouyang, W.; Shen, X. A theoretical drought classification method for the multivariate drought index based on distribution properties of standardized drought indices. Adv. Water Resour. 2016, 92, 240–247. [Google Scholar] [CrossRef]
- Erhardt, T.M.; Czado, C. Standardized Drought Indices: A Novel Uni- and Multivariate Approach. 2015. Available online: https://arxiv.org/pdf/1508.06476.pdf (accessed on 20 March 2019).
- Bezak, N.; Brilly, M.; Šraj, M. Comparison between the peaks-over-threshold method and the annual maximum method for flood frequency analysis. Hydrol. Sci. J. 2014, 59, 959–977. [Google Scholar] [CrossRef] [Green Version]
- Chow, V.T.; Maidment, D.; Mays, L.W. Applied Hydrology; McGraw Hill: New York, NY, USA, 1988. [Google Scholar]
- Kite, G.W. Frequency and Risk Analyses in Hydrology; Water Resources Publications: Fort Collins, CO, USA, 1977. [Google Scholar]
Figure 1.
Study area.
Figure 2.
Temporal distribution of SPI12 index as a percentage of Crete under each RCP2.6 (a), RCP4.5 (b) and RCP8.5 (c) categories.
Figure 2.
Temporal distribution of SPI12 index as a percentage of Crete under each RCP2.6 (a), RCP4.5 (b) and RCP8.5 (c) categories.
Figure 3.
Temporal distribution of SRI 12 index as a percentage of Crete under each RCP2.6 (a), RCP4.5 (b) and RCP8.5 (c) categories.
Figure 3.
Temporal distribution of SRI 12 index as a percentage of Crete under each RCP2.6 (a), RCP4.5 (b) and RCP8.5 (c) categories.
Figure 4.
Hydrological drought frequency analysis under climate change using GEV distribution for Τ = 100 years and for study periods (a) 1985–2010 (baseline period), (b) 2025–2050 (relative percentage change from the baseline), (c) 2075–2100 (relative percentage change from the baseline).
Figure 4.
Hydrological drought frequency analysis under climate change using GEV distribution for Τ = 100 years and for study periods (a) 1985–2010 (baseline period), (b) 2025–2050 (relative percentage change from the baseline), (c) 2075–2100 (relative percentage change from the baseline).
Figure 5.
Meteorological frequency analysis under climate change using GEV for T = 100 years return period and for study periods (a) 1985–2010 (baseline period), (b) 2025–2050 (relative percentage change), (c) 2075–2100 (relative percentage change).
Figure 5.
Meteorological frequency analysis under climate change using GEV for T = 100 years return period and for study periods (a) 1985–2010 (baseline period), (b) 2025–2050 (relative percentage change), (c) 2075–2100 (relative percentage change).
Figure 6.
Extreme precipitation frequency analysis under climate change using GEV distribution for Τ = 100 years and for study periods (a) 1985–2010 (baseline period), (b) 2025–2050 (relative percentage change), (c) 2075–2100 (relative percentage change).
Figure 6.
Extreme precipitation frequency analysis under climate change using GEV distribution for Τ = 100 years and for study periods (a) 1985–2010 (baseline period), (b) 2025–2050 (relative percentage change), (c) 2075–2100 (relative percentage change).
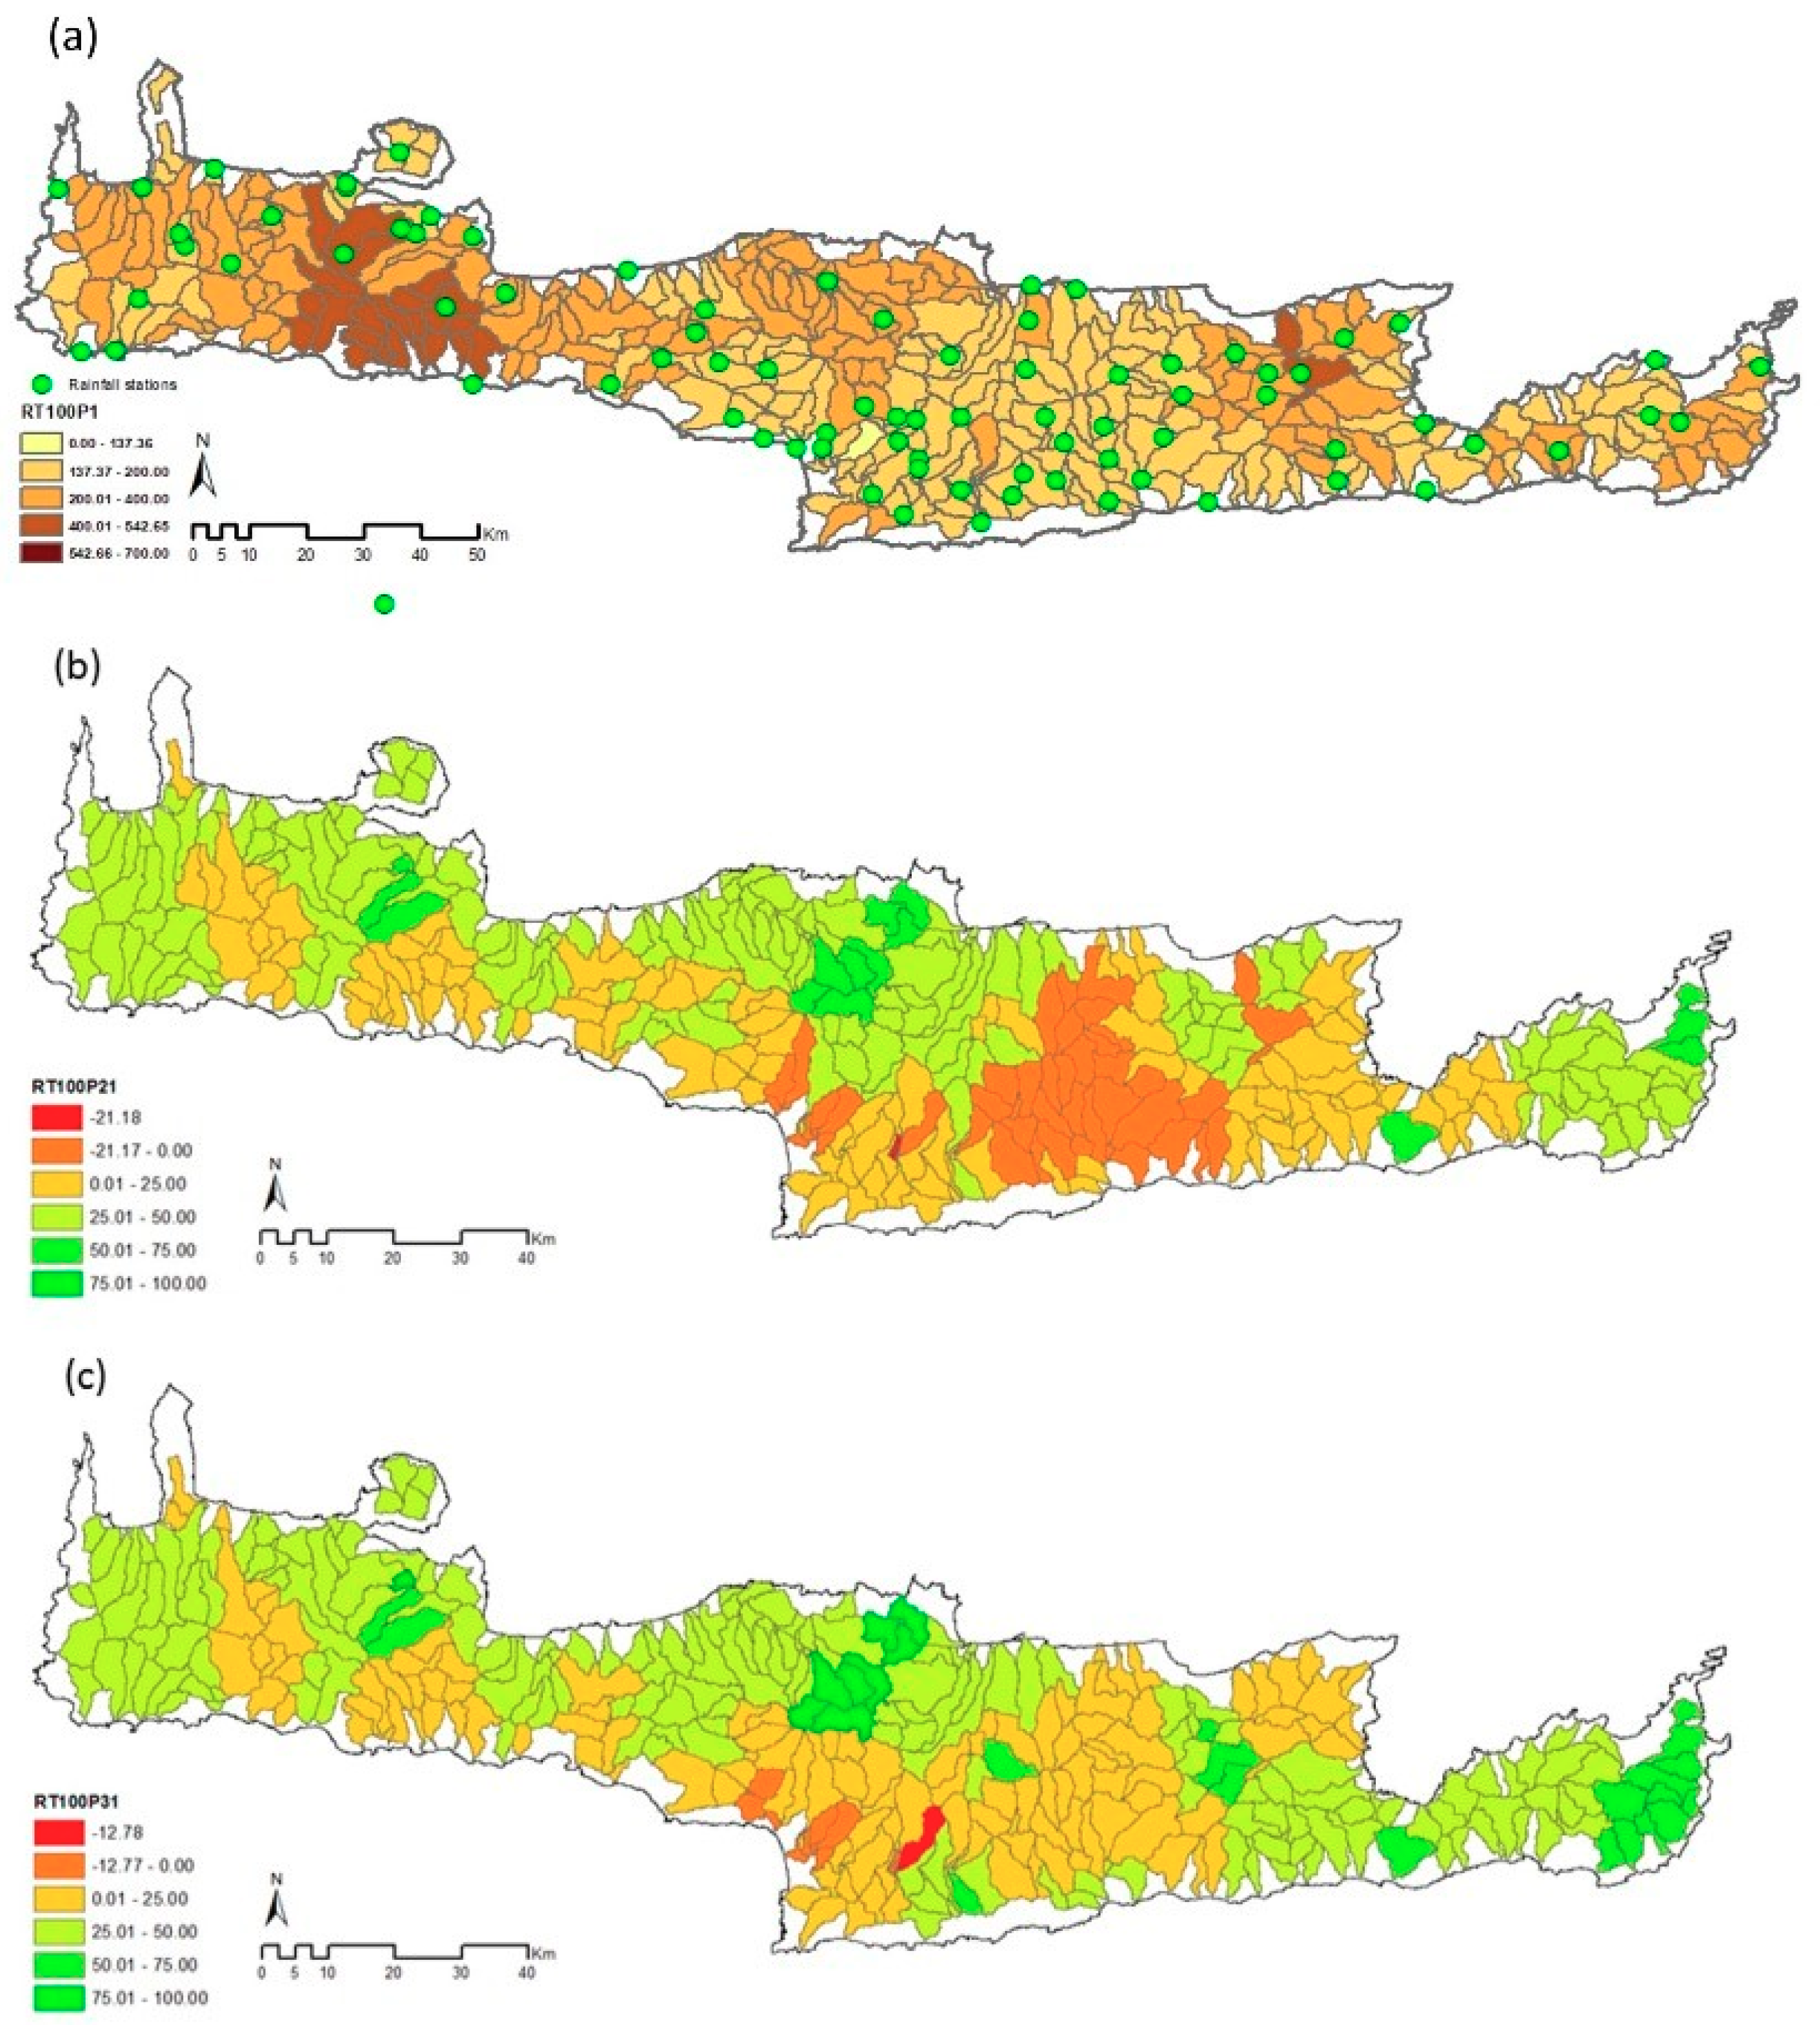
Figure 7.
Flow frequency analysis under climate change using GEV distribution for Τ = 100 years return period and for study periods (a) 1985–2010 (baseline period), (b) 2025–2050 (relative percentage change), (c) 2075–2100 (relative percentage change).
Figure 7.
Flow frequency analysis under climate change using GEV distribution for Τ = 100 years return period and for study periods (a) 1985–2010 (baseline period), (b) 2025–2050 (relative percentage change), (c) 2075–2100 (relative percentage change).

Table 1.
The 11 climate projections used in this study.
| RCM | Driving GCM | RCP |
|---|---|---|
| CSC-REMO | MPI-ESM-LR-r1 | 2.6 |
| 4.5 | ||
| 8.5 | ||
| SMHI-RCA4 | EC-EARTH-r12 | 2.6 |
| 4.5 | ||
| 8.5 | ||
| SMHI-RCA4 | HadGEM2-ES-r1 | 4.5 |
| 8.5 | ||
| KNMI-RACMO22E | EC-EARTH-r1 | 4.5 |
| 8.5 | ||
| IPSL-INERIS-WRF331F | IPSL-CM5A-MR-r1 | 4.5 |
| Index Value | Characterization |
|---|---|
| 2.0+ | Extremely wet |
| 1.5 to 1.99 | Very wet |
| 1.0 to 1.49 | Moderately wet |
| −0.99 to 0.99 | Near normal |
| −1.0 to −1.49 | Moderately dry |
| −1.5 to −1.99 | Severely dry |
| −2 and less | Extremely dry |
Table 3.
Mean number of months with drought conditions per year (SPI12 < −1.5).
| RCP Category | Climate Model | Months per Year with SPI 12 < −1.5 | |||
|---|---|---|---|---|---|
| GCM | RCM | 1985–2010 | 2025–2050 | 2075–2100 | |
| RCP 2.6 | MPI-ESM-LR-r1 | CSC-REMO | 0.58 | 1.15 | 1.36 |
| EC-EARTH-r12 | SMHI-RCA4 | 0.7 | 1.45 | 1.23 | |
| RCP 4.5 | MPI-ESM-LR-r1 | CSC-REMO | 0.47 | 1.92 | 1.78 |
| IPSL-CM5A-MR-r1 | IPSL-INERIS-WRF331F | 1.16 | 1.2 | 2.64 | |
| HadGEM2-ES-r1 | SMHI-RCA4 | 0.82 | 0.81 | 0.91 | |
| EC-EARTH-r1 | KNMI-RACMO22E | 0.49 | 1.03 | 1.59 | |
| EC-EARTH-r12 | SMHI-RCA4 | 0.79 | 2.01 | 1.44 | |
| RCP 8.5 | MPI-ESM-LR-r1 | CSC-REMO | 0.36 | 1.39 | 3.92 |
| HadGEM2-ES-r1 | SMHI-RCA4 | 0.62 | 1.19 | 2.54 | |
| EC-EARTH-r1 | KNMI-RACMO22E | 0.09 | 1.15 | 2.13 | |
| EC-EARTH-r12 | SMHI-RCA4 | 0.95 | 1.59 | 4.81 | |
Table 4.
Mean number of months with drought per year (SPI12 < −1.5).
| RCP Category | Climate Model | Months per Year with SRI 12 < −1.5 | |||
|---|---|---|---|---|---|
| GCM | RCM | 1985–2010 | 2025–2050 | 2075–2100 | |
| RCP 2.6 | MPI-ESM-LR-r1 | CSC-REMO | 0.18 | 1.21 | 1.14 |
| EC-EARTH-r12 | SMHI-RCA4 | 0.58 | 1.42 | 1.33 | |
| RCP 4.5 | MPI-ESM-LR-r1 | CSC-REMO | 0.12 | 1.71 | 1.73 |
| IPSL-CM5A-MR-r1 | IPSL-INERIS-WRF331F | 1.03 | 1.45 | 3.17 | |
| HadGEM2-ES-r1 | SMHI-RCA4 | 0.6 | 0.57 | 1.19 | |
| EC-EARTH-r1 | KNMI-RACMO22E | 0.62 | 0.8 | 1.39 | |
| EC-EARTH-r12 | SMHI-RCA4 | 0.56 | 2.1 | 1.47 | |
| RCP 8.5 | MPI-ESM-LR-r1 | CSC-REMO | 0.32 | 1.7 | 3.99 |
| HadGEM2-ES-r1 | SMHI-RCA4 | 0.94 | 1.26 | 2.69 | |
| EC-EARTH-r1 | KNMI-RACMO22E | 0.21 | 1.12 | 1.61 | |
| EC-EARTH-r12 | SMHI-RCA4 | 0.79 | 1.41 | 4.6 | |
© 2019 by the authors. Licensee MDPI, Basel, Switzerland. This article is an open access article distributed under the terms and conditions of the Creative Commons Attribution (CC BY) license (http://creativecommons.org/licenses/by/4.0/).
Share and Cite
MDPI and ACS Style
Tapoglou, E.; Vozinaki, A.E.; Tsanis, I. Climate Change Impact on the Frequency of Hydrometeorological Extremes in the Island of Crete. Water 2019, 11, 587. https://doi.org/10.3390/w11030587
AMA Style
Tapoglou E, Vozinaki AE, Tsanis I. Climate Change Impact on the Frequency of Hydrometeorological Extremes in the Island of Crete. Water. 2019; 11(3):587. https://doi.org/10.3390/w11030587
Chicago/Turabian StyleTapoglou, Evdokia, Anthi Eirini Vozinaki, and Ioannis Tsanis. 2019. "Climate Change Impact on the Frequency of Hydrometeorological Extremes in the Island of Crete" Water 11, no. 3: 587. https://doi.org/10.3390/w11030587
Note that from the first issue of 2016, this journal uses article numbers instead of page numbers. See further details here.