Article

Evaluation of Water Governance Processes Required to Transition towards Water Sensitive Urban Design—An Indicator Assessment Approach for the City of Cape Town

1
Department of Civil Engineering and Future Water Research Institute, University of Cape Town, Private Bag X3, Rondebosch 7701, South Africa
2
KWR Watercycle Research Institute, Groningenhaven 7, 3430 BB Nieuwegein, The Netherlands
3
Copernicus Institute of Sustainable Development Utrecht University, Princetonlaan 8a, 3508TC Utrecht, The Netherlands
*
Author to whom correspondence should be addressed.
Water 2019, 11(2), 292; https://doi.org/10.3390/w11020292
Submission received: 21 December 2018 / Revised: 22 January 2019 / Accepted: 31 January 2019 / Published: 7 February 2019
(This article belongs to the Special Issue The Challenges of Water Management and Governance in Cities)

Abstract

:
In the face of water related risks resulting from climate change and rapid urbanization, water resources in South African cities have increasingly come under pressure. Following the most recent drought period (2015–2018), local authorities such as the City of Cape Town are being tasked with restructuring policy to include climate change adaptation strategies to adapt more adequately and proactively to these new challenges. This paper describes an evaluation of the water governance processes required to implement Water Sensitive Urban Design (WSUD) in Cape Town—with a specific focus on the barriers to, and opportunities for, those processes related to wastewater treatment, flood risk and the pressing issue of water scarcity. The City Blueprint Approach (CBA) was selected as the indicator assessment approach for this task. The CBA is a set of diagnostic tools comprising the Trends and Pressures Framework, the City Blueprint Framework and the Governance Capacity Framework. This was applied to Cape Town based on in-depth interviews and publicly available information. The analysis revealed that smart monitoring, community knowledge and experimentation with alternative water management technologies are important when considering uncertainties and complexities in the governance of urban water challenges. We conclude that there is potential for Cape Town to transition to a water sensitive city through learning from this experimentation and by implementing WSUD strategies that address water scarcity following the shifts in governance caused by the 2015–2018 drought.

1. Introduction

Cities globally are more and more becoming hotspots for risk and disaster [1], mainly as a result of rapid urbanization, population growth and the impacts of climate change. South Africa is a semi-arid country, with rainfall being seasonal and distributed unevenly [2]. It experiences a rainfall average of less than 500 mm/year (compared to a global average of 869 mm), making it the 30th driest country in the world [2,3]. Increasing water demand is also putting pressure on the allocation and management of water resources in South African cities [3]. Recently (2015–2018), a country-wide drought resulted in severe water shortages in many parts of South Africa, most notably affecting the Western Cape province and the City of Cape Town (CoCT). In early 2018, with the main storage dams predicted to decline to critically low levels, the city announced plans for “Day Zero”, that is, the stage at which water storage levels reached 13.5%, when the municipal water supply would largely be shut off.
Local authorities are increasingly being tasked with restructuring policy to include climate change adaptation strategies to deal more adequately and proactively with these new challenges. Conventional, top-down and fragmented water management paradigms are no longer able to adequately address water challenges in the current context of uncertainty and complexity [4]. A shift towards adaptive approaches to urban water management has been proposed in order to address these complexities whilst ensuring the satisfactory delivery of water services to citizens [4]. One such approach is termed Water Sensitive Urban Design (WSUD), which encompasses all aspects of the urban water cycle including stormwater management, wastewater treatment and water supply, and “represents a significant shift in the way water and related environmental resources and water infrastructure are considered in the planning and design of cities…” [5]. The principles of WSUD have gained importance in terms of guiding cities around the world in the socio-technical transformations of conventional approaches needed to aid transitions towards becoming Water Sensitive Cities [6,7].
Applying and implementing WSUD principles in South African cities is challenging owing to factors such as fragmented institutional structures within municipalities (e.g., different local government departments working in “silos”), social constraints, as well as financial and human resource limitations [8]. Water challenges often transcend administrative boundaries and involve many different departments and/or organizations each with different responsibilities and interests; therefore, a problem-oriented diagnostic analysis is required instead of focusing on individual water management departments only [9]. In this paper, we analyse the overall management and governance (at a local authority level using the CoCT as a case study) of some of the major water challenges that characterise urban South Africa. We aim to contribute to a better understanding of the barriers to, and opportunities for, improving the governance capacity to address the pressing issues of water scarcity, wastewater treatment and flood risk in South African cities. These particular challenges were selected based on their links to integrated urban water cycle management as the main principle of WSUD [6]. To achieve this aim, the City Blueprint Approach (CBA) was selected as an appropriate means of evaluating the required governance processes for a water sensitive Cape Town. The CBA is an indicator assessment tool comprising the Trends and Pressures Framework (TPF), the City Blueprint Framework (CBF) and the Governance Capacity Framework (GCF) [9,10]. The current (2015–2018) water crisis and history of frequent flood events (particularly in low-lying informal areas) in Cape Town exemplify the relevance of this analysis and may also provide valuable insights for other cities in South Africa dealing with similar water challenges. Hence, the overall objective of this paper is to identify where the CoCT can improve its water governance processes in its transition to a Water Sensitive City.
This paper first provides a detailed explanation of the methods undertaken in applying the CBA to Cape Town. Secondly, the paper presents the results of the CBF and the GCF assessments of water scarcity, flood risk and wastewater treatment respectively. The discussion provides a critical refection on the results and presents the implications for Cape Town’s transition towards water sensitivity. We conclude with the most significant points in the water governance analysis.

2. Materials and Methods

The City Blueprint Approach was selected as an appropriate means to fulfill the research aim of evaluating the water governance processes required to implement Water Sensitive Urban Design (WSUD) in Cape Town. The CBA comprises the TPF, CBF and GCF (see Figure 1). It was developed by the KWR Watercycle Research Institute in cooperation with Utrecht University, The Netherlands [11] and acknowledges that every city has its own social, financial and environmental setting in which water managers have to operate.
Other examples of assessment frameworks that aim to enhance cities’ transitions towards being water sensitive include, inter alia, the Water Sensitive Cities (WSC) Index by the Cooperative Research Centre for Water Sensitive Cities and the Principles for Water Sensitive Cities by the International Water Association (IWA). The development of the WSC Index involved multiple development phases aimed at improving its functionality, including the prototyping of the Index as applied to two local authorities in Melbourne, Australia. The feedback from the two pilot studies was used to improve its functionality, usability, benefits and reliability [12]. Unlike the WSC Index and the CBA, the IWA Principles do not provide a sustainable water management assessment for cities; instead the principles provide a framework which is intended to guide city officials to implement and develop their urban water visions and strategies for water sensitive transitions [13].
The benefit of using the CBA in this assessment relates to the fact that it was first applied to 45 cities in 27 countries before undergoing a critical revision based on the learning experiences obtained during this process [14]. This revision included: (1) the updating of existing indicators; (2) ensuring that individual indicators make an equal contribution to the final score (sustainability measurement); (3) ensuring that indicator results are easy to understand by the end-user; and (4) developing a separate supplementary framework which supports the undertaking of the main framework. The improved tool which emanated from the revision was applied to the CoCT and forms part of a larger study to further assess the feasibility of this approach.
The TPF comprises 12 descriptive indicators and eight additional sub-indicators divided into social, environmental and financial categories. Each indicator is scaled from 0 to 4 points, where a higher score represents a higher urban pressure or concern. For seven indicators and sub-indicators a scoring method is applied based on international quantitative standards. These include the WHO [15] scoring for burden of disease as well as the World Bank’s scoring for primary education, political instability, unemployment, poverty, and inflation [16,17,18,19]. Finally, the scoring system for groundwater scarcity and surface water scarcity from the FAO [20] was adopted. These international standardized indicators are available for most countries. The TPF indicator score is based on the city’s score amongst all available country scores. As such, all available country scores were ranked and linearly standardized on a scale from 0 to 4 points. An equation that best fitted this ranking (lowest correlation coefficient: r = 0.97) was used to calculate the 0–4 point score for the CoCT. These scores are not normative and only provide an indication of urban pressures with respect to global trends.
The CBF consists of twenty-five indicators, which are divided into seven comprehensive categories: (1) water quality; (2) solid waste; (3) basic water services; (4) wastewater treatment; (5) infrastructure; (6) climate robustness; and (7) governance. Each indicator is scored on a scale from 0 (low performance) to 10 (high performance). The calculation method for each indicator is publicly available [10,21]. Data for the Cape Town assessment was sourced online, predominantly from publicly available reports, local policy documents sourced from the city’s website, as well as through interviews with city officials. The geometric mean of all 25 indicators, the Blue City Index (BCI) was also calculated. Detailed information on indicator selection and scoring methods for both the TPF and the CBF are provided by Koop & Van Leeuwen [10,14], whereas data requirements, data sources and examples are provided on the EIP Water website [21].
The GCF consists of nine categories each with three indicators, which together were used to determine the governance capacity required to address three selected water challenges: water scarcity, flood risk and wastewater treatment (as will be outlined in the discussion section). Each of the 27 indicators was scored according to a Likert scale to gauge the subjective opinions and values of respondents and the analysis of the publicly available documents [9]. The scale ranges from very encouraging (++) to very limiting (--). A detailed description of each indicator’s pre-defined question is provided in Table 1. For the indicator-specific Likert scale and link to the literature, we refer to [21]. The scoring for each indicator was based on three steps:
  • A preliminary score was given and substantiated by argumentation based on publicly available reports, local policy documents, local legislation and online articles.
  • Based on a stakeholder analysis, the main actors involved in each of the water challenges were selected and interviewees were selected accordingly. In-depth interviews were recorded and used to improve the written substantiation in order to refine each indicator score. A total of nine separate in-depth interviews were conducted, five of which were with city officials, two with academics and another two with local water experts. The interview questions focused on three themes relating to knowledge, management practices and implementing capacity.
  • Interviewees were asked to provide constructive feedback, additional arguments and information sources to further improve the accuracy of the indicator scores.
Although the methods employed helped to fulfil the research aim, there were still unavoidable limitations to the research. Firstly, the data for this research was gathered during the time when the CoCT was experiencing a severe water crisis (2017). For this reason, organizing and scheduling interviews with city officials proved to be a challenging task. Scheduling interviews depended on the availability of respondents and their willingness to participate in the study. During the data collection period, city officials were especially busy and therefore only a limited number were able to participate. For this reason, secondary data sources, discussions with other interviewees and follow up emails were also relied on for information. In addition, it is acknowledged that the interview responses may have been influenced in some way by the ongoing water crisis. Despite this being the case, all responses from the respondents offered an extremely valuable contribution to this research.
The scoring of the qualitative indicators of the GCF by the researcher was to some degree subjective, thus increasing the potential danger of the indicators not being scored accurately. With the intention of ensuring that this process was carried out as effectively as possible, the justification for each indicator score as well as the sources used to score the indicator was recorded by the researcher. This information was reviewed by the supervisor of this research as well as an academic from the KWR Watercycle Research Institute.

3. Results

3.1. Trends and Pressures of Cape Town

Table 2 shows the scores of each of the twelve indicators of the TPF, ranging from 0 to 4 (0 indicating the lowest degree of concern and 4 the highest degree of concern). The TPF indicators for Cape Town that scored between 2.5 and 3.5, that is, representing areas of concern, were burden of disease, water scarcity, sea water intrusion and salinization, river peak discharges, and inflation.
Fresh water scarcity is an important factor, as Cape Town relies primarily on surface water sources and water scarcity can negatively impact the socio-economic aspects of a city [8]. It has the potential to affect human health by increasing the burden of disease. A score of 3 was reported for the salinization and/or seawater intrusion indicator, highlighting the fact that Cape Town’s groundwater sources are vulnerable to salinization. Together with seawater intrusion, this can influence the salinity of groundwater and thus the water quality of freshwater aquifers. This is especially important in the CoCT as the City’s future water supply augmentation plans include groundwater abstraction. The indicator score for river peak discharges indicates that flood risk is also an area of concern for water management in Cape Town. Floods have social, economic and environmental consequences; this includes loss of human life; increase in water-borne diseases as well as damage to infrastructure. This may result in certain economic activities coming to a halt as well as disruption of service delivery such as electricity, wastewater treatment, health care, education and the supply of clean water. Indicators that received scores between 3.5 and 4, representing increasing levels concern, were economic pressure and unemployment. The City’s unemployment rate scored as a significant area of concern for Cape Town and has an impact on the ability of low-income citizens to afford and pay for water and sanitation services, which is an important revenue stream that enables the CoCT to implement projects and programs such as water-infrastructure maintenance. The TPF assessment provided insights into the environmental, social and economic aspects of Cape Town, over which the city has limited influence, although they do provide the context within which the city water managers must operate.

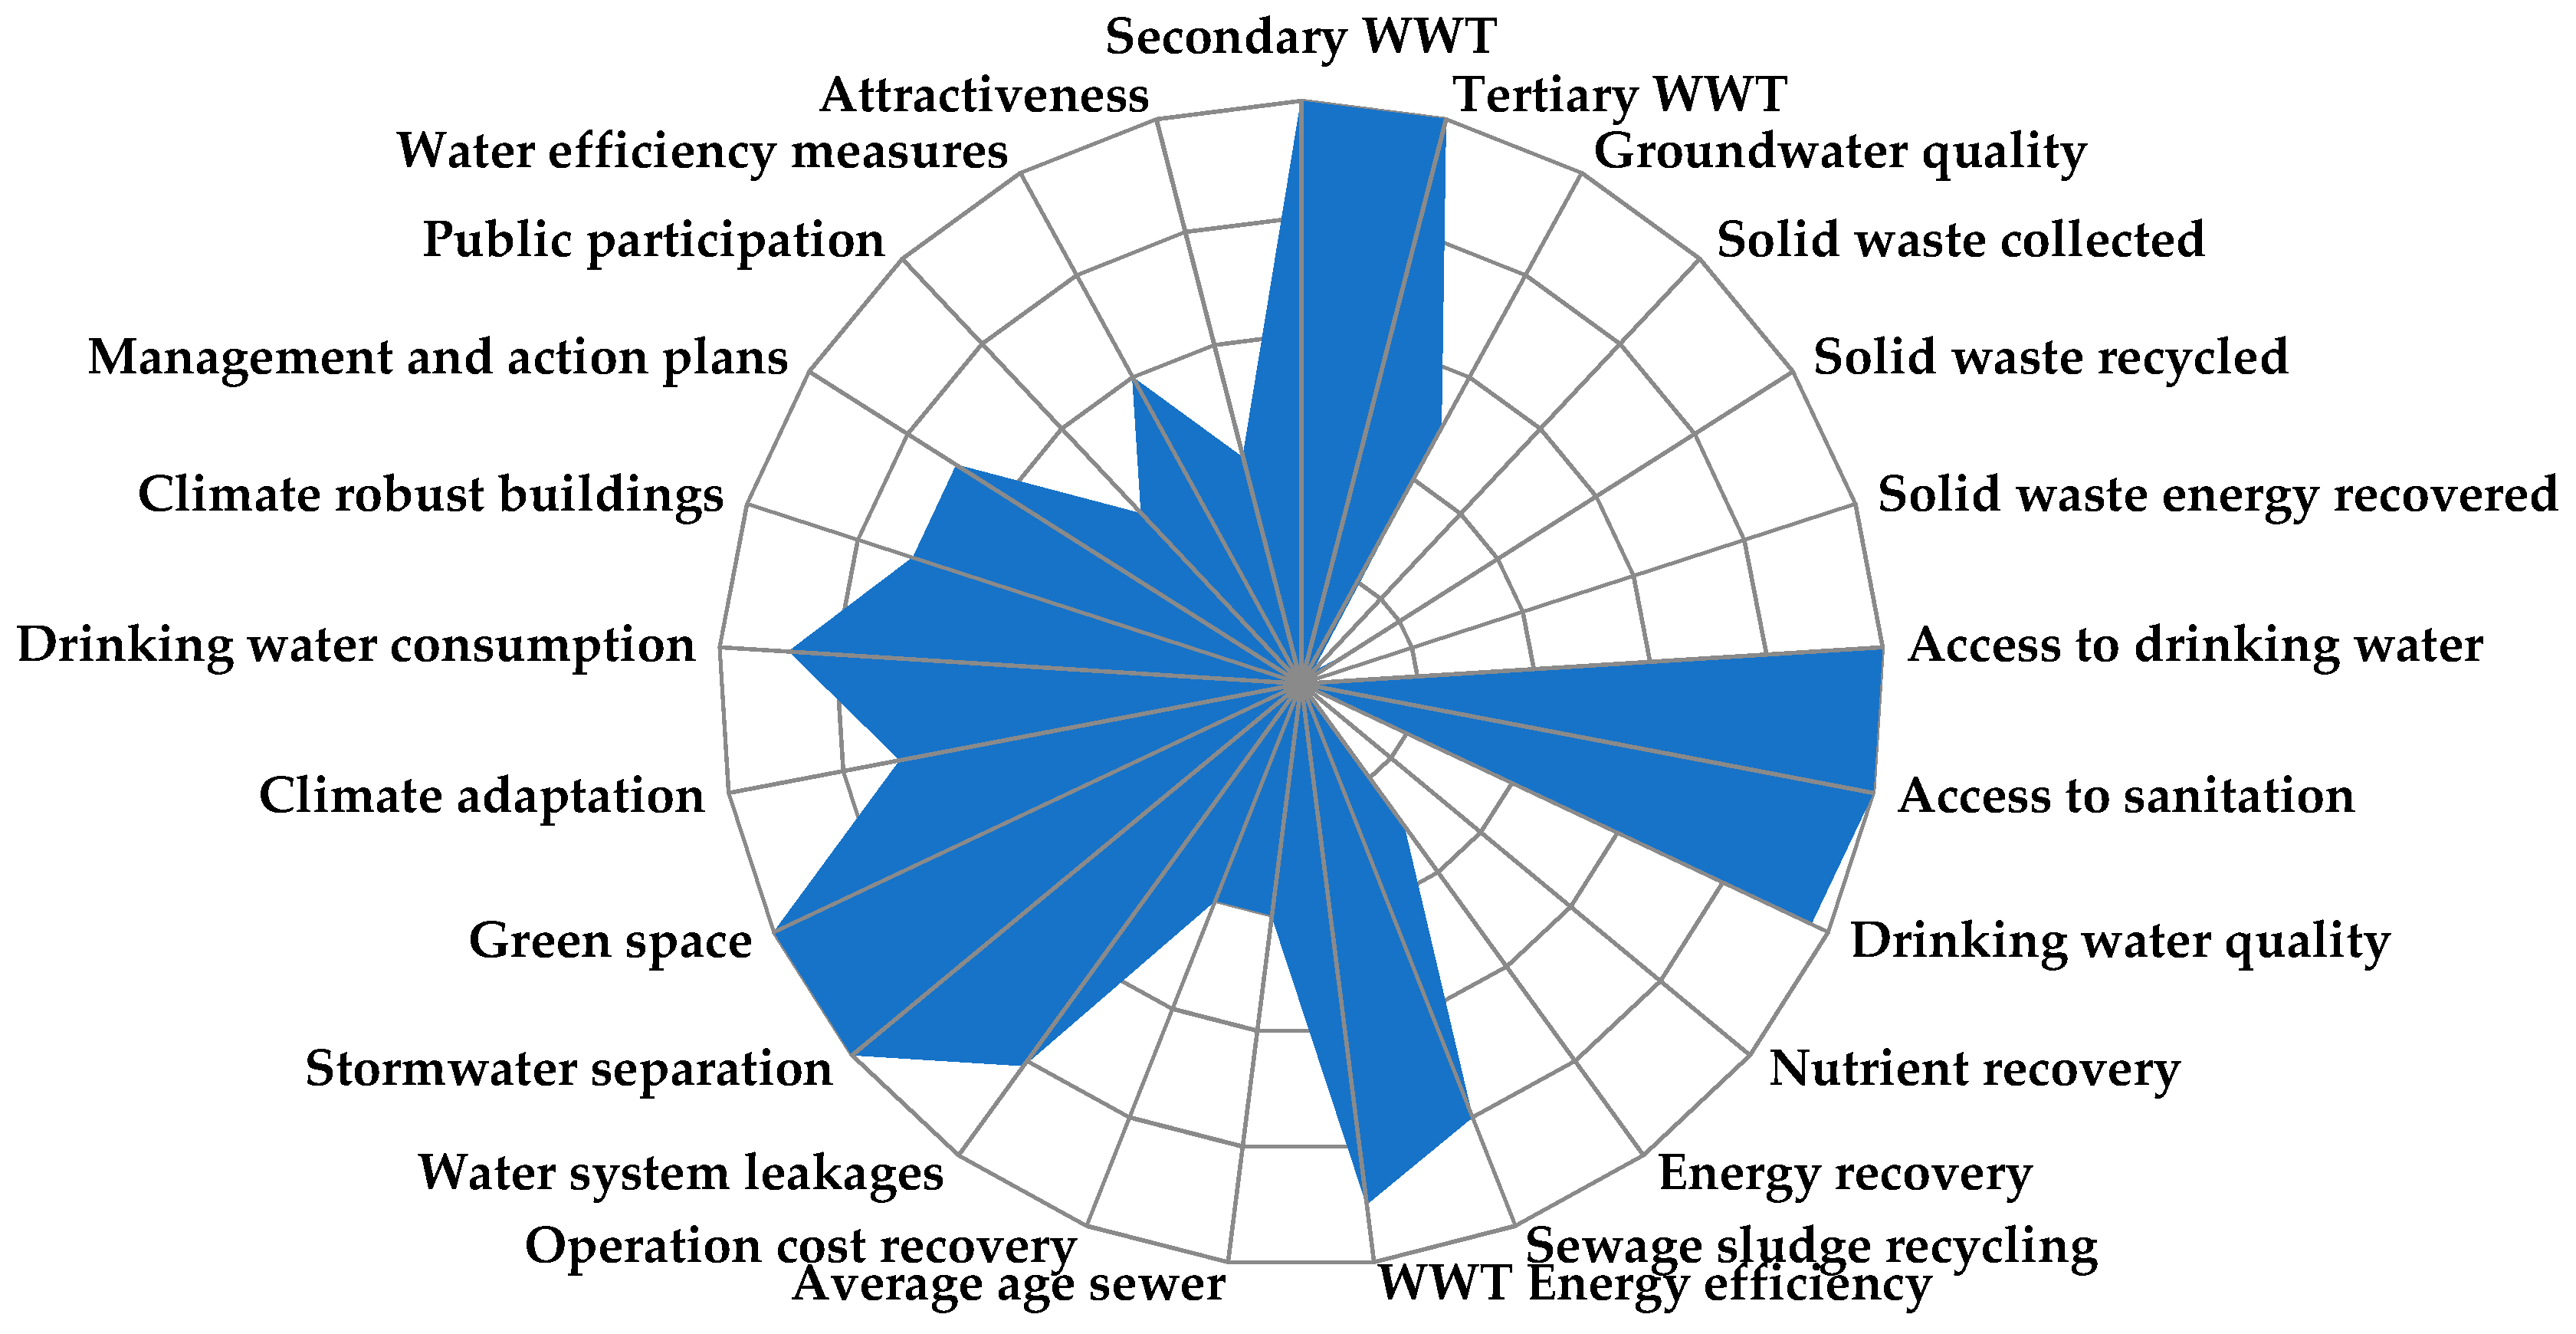
3.2. City Blueprint of Cape Town

The CBF scores are presented in Figure 2, which gives an indication of the management of Cape Town’s water cycle. Figure 2 shows the scores for each of the twenty-five indicators, ranging from 0 at the center of the circle increasing outwards to 10. The overall city score (Blue City Index) of 4.9 reflects the fact that Cape Town is currently categorized as a water efficient city (according to Koop & Van Leeuwen [14].
The CBF assessment presents a snapshot of the performance of Cape Town’s water system to illustrate the strengths and weaknesses of Cape Town’s water management. The City scored relatively well on leakage control as only 9% of water is lost through system leakages, compared to the national South African average of 25% [22], as well as international cities such as Quito, Ecuador which are losing around 30% [23]. Similarly, Cape Town performs well on the delivery of services, scoring 100% for access to sanitation and drinking water, as well as on the percentage of wastewater/sewage that is treated. All sewage generated in the city is treated to some level at one of 23 wastewater treatment works—delivered either through formal sewage networks, or through alternative collection systems for informal settlements, such as chemical, portable and container toilets. Notwithstanding these high levels of wastewater treatment, the fact that Cape Town has low energy and nutrient recovery levels from these treatment processes highlights a major area for improvement. At present there is energy recovery at only one of the City’s wastewater treatment plants, with methane biogas from the anaerobic digesters used on site. Currently there is no nutrient recovery as a separate item from wastewater treatment processes; nutrients are contained in the sludge which is used for agricultural processes or taken to landfill. There is considerable room to improve the city’s solid waste treatment, as only ~10% of the city’s waste is recycled [24]). Another potential area of concern is the fact that sewer networks in Cape Town are 40 years old on average [25]. This increases the probability for blockages and leakages in sewers and substantially increases the costs to refurbish and replace the extensive underground network over the next decade.

3.3. GCF Analysis of Cape Town

Table 3 shows the scores for the GCF assessment for Cape Town for each of the twenty-seven indicators, based on the responses to interview questions and publicly-available information. The analysis of the CBF for Cape Town provided a basis for the selection of the three water challenges that were analyzed in depth using the GCF. Although Cape Town scores well on access to drinking water and drinking water consumption (Figure 2), the current water crisis draws attention to the specific need to analyze and understand the governance of water scarcity in Cape Town. Similarly, in spite of adequate access to water and sanitation services in informal settlements (Figure 2), drainage and flood risk remain serious issues of concern; we therefore deemed it important to further analyze the governance of flood risk in Cape Town.
Furthermore, the CBF results show that there is room for improvement in energy recovery from wastewater treatment. Given these points, an in-depth analysis of the governance of water scarcity, flood risk and wastewater treatment is important as these challenges have an effect on the varying needs of society such as flood protection, human and environmental health, and water resources.

4. Discussion

The focus of this paper is on the governance capacity of water scarcity, flood risk and wastewater treatment in Cape Town, hence the findings of the GCF assessment for Cape Town for the three water management challenges are provided in the sections that follow.

4.1. Water Scarcity

Cape Town is a coastal city in South Africa, with a Mediterranean-type climate, causing it to experience hot, dry summers and mild, wet winters. The city relies heavily on winter rainfall as 98% of Cape Town’s water supply is supplied by surface water sources from 6 major dams on the outskirts of the city [26]. The current water crisis has resulted in most governance processes related to water scarcity in the city being in a constant state of change during the course of 2017/18. For this reason, the results of the governance assessment of water scarcity in Cape Town reveal the current situation and may not be representative of a typical year—even though it provides a useful “worst case” scenario assessment.
A respondent who is a former employee of the CoCT expressed that water scarcity was not sufficiently high on the city’s agenda before 2017. This is despite the fact that climate change research has consistently placed emphasis on the possibilities of changing rainfall patterns in the Western Cape/Cape Town region, with likely adverse impacts on water resource availability for the region [27,28]. Consequently, the City’s management ambitions before the drought were largely focused on service delivery objectives such as providing water service points (taps) in informal settlements and maintenance of infrastructure. This is reflected in the CoCT’s annual Water Services Development Plan [22]. In addition, a respondent who is a city official stated that planning for water supply management for the year 2017 was based on a best-case scenario of receiving optimal rainfall. This indicates that unchanging situations were assumed and therefore planning for severe drought conditions was limited. Cape Town therefore scored as 0 (indifferent) for indicator 5.1 ambitious and realistic management of water scarcity. This is also due to the fact that long-term goals to augment the city’s water supply by using groundwater, methods of desalination and water reclamation for potable use have been part of water resources planning processes since June 2007 as part of the Western Cape Water Reconciliation Strategy [29], however there are no signs that these long-term plans are being supported by intermittent targets. This resulted in the city being forced to implement plans for augmentation in a short time span of six to eighteen months in the face of the current drought. This has proven to be a learning opportunity, as reflected in the fact that Cape Town has recently adopted a new water management scenario termed the “New Normal” in which the city has been classified as a permanent drought region. Consequently, the city will no longer exclusively rely on surface water sources, and resilience to climatic uncertainty is being pursued in its future planning.
Cape Town’s low score on indicator 5.1 ambitious and realistic management further reveals that although the city scored as + (encouraging) on both indicator 3.1 smart monitoring and 3.3 cross-stakeholder learning these two governance aspects were not used to enhance planning and decision making to reduce the city’s long-term vulnerability to drought events. Similarly, the city scored as + (encouraging) on indicator 3.3 Cross-stakeholder learning as respondents stated that cross-stakeholder learning is valued, and results are incorporated to enhance optimal decision making. For instance, various University of Cape Town-related research initiatives with the City, such as Mistra Urban Futures, FRACTAL and Climate Change Think Tank, which facilitate better understanding of issues of climate change and sustainability at the city scale between city officials and academics, have been undertaken. Such cross-stakeholder learning initiatives involve a two-way learning system between academics and city officials through innovative knowledge sharing practices. Despite the fact that such programs do not continue indefinitely due to issues such as lack of funding (indicator 8.3), nevertheless, the knowledge from such research-based initiatives is still useful to enhance decision making on urban sustainability issues such as water scarcity in Cape Town and could be applied to other cities in the country. The GCF results also help to illustrate that although Cape Town scored well on access to drinking water, water scarcity in the City is in fact still a serious challenge.

4.2. Flood Risk

Flooding is a common phenomenon during Cape Town’s rainy season, particularly in informal settlements and expansive low-lying areas such as the Cape Flats, which are prone to extreme flooding events. For this reason, there is a great sense of urgency to address flood risk in Cape Town. Enhancing community knowledge and including local communities in addressing flood risk is high on the agenda for local authorities. An annual multi-departmental ‘Winter Readiness Program’ led by the City’s Disaster Risk Management Centre (DRMC) is run before the onset of each rainy season. The program aims to implement various measures to mitigate flood risk during the season whilst raising awareness and increasing community involvement. Practical tips such as how to raise flooring in homes and diverting flood water away from shacks are distributed to residents of informal settlements. While planning for the 2016 rainy season, 34 high flood risk areas including informal settlements were identified for running the program. A component of the program focuses on clearing stormwater infrastructure of solid waste to ensure its functionality. Community members are employed to litter-pick and remove sand from drainage systems and the banks of channels. In 2017, 1805 temporary jobs were created and R35 million (approximately $2.4 million) was spent on these cleaning programs. Information regarding flood risk is also distributed on the city’s website. The city’s DRMC compiled a series of educational pamphlets named the “Flood-wise pamphlets” which are also made available on the website. These address issues such as understanding the causes of flooding, practical solutions to prevent flooding and health issues related to flooding. Hence Cape Town scored as + (encouraging) on the indicators belonging to the category “awareness” (Table 3).
In addition to the CoCT making strides in addressing flood risk in informal settlements, the city’s stormwater department has also devised two policies, the Management of Urban Stormwater Impacts Policy (MUSIP) [30] and the Flood Plain and River Corridor Management Policy (FPRCMP) [31], which aim to address the challenge of flood risk in formal developments and quality of stormwater runoff from developments. For this reason, Cape Town scores as + (encouraging) on indicator 5.2 Discourse embedding as the city uses different methods to address flood risk in different contexts. The MUSIP aims to “minimize the undesirable impacts of stormwater runoff from developed areas by introducing WSUD principles to urban planning...” [30]. The objective of the policy is for all Greenfield development sites, Brownfield development sites > 50,000 m2 and Brownfield development sites < 50,000m2 with a total impervious surface > 15% of site to include a Sustainable Drainage Systems (SuDS) component which achieves the objectives set out by the policy. The FPRCMP aims to “manage development adjacent to watercourse and wetlands taking cognizance of the flood regime…” [31]. The policy objective is to set back developments beyond floodplain zones, geomorphological buffers and ecological zones as per the conditions and requirements of the policy. The development of the MUSIP and the FPRCMP illustrates that there is a growing understanding of the complexity and uncertainty related to flood risk and awareness that the development of innovative approaches is crucial. Hence Cape Town also scores as + (encouraging) on indicators 5.1 Ambitious and Realistic Management and 5.3 Management Cohesion.
The MUSIP provides a degree of freedom to agents of change to explore new alternatives and to seize more high-risk opportunities. This is revealed by the City’s score for condition 6 Agents of change as + (encouraging). Entrepreneurial agents, that is, consultants who design and implement SuDS technologies in new developments, are essentially given the freedom to experiment with alternative technologies when implementing these, as the policy does not prescribe what technologies are to be installed. The policy only requires effective technologies which adhere to the policy’s SuDS objectives, thereby creating an enabling environment for implementation. This will aid in driving change as respondents emphasize that experimentation is crucial in legitimizing alternative technologies which may be otherwise doubted. Despite the fact that the MUSP and the FPRCMP have been developed to stimulate desired behavior and discourage undesired behavior, the implementation of these policies (indicator 9.2 statutory compliance) remains difficult for various reasons. For instance, local government lacks the human resources to check compliance to policy on the ground. Also, in developments where SuDS are successfully installed maintenance of technologies proves to be difficult resulting in ineffective performance.

4.3. Wastewater Treatment

Sixty-six percent of the water consumed by Cape Town ends up at twenty-three wastewater treatment works from where the final treated effluent is discharged back into the environment (CoCT, 2017). The wastewater undergoes treatment processes to ensure that the effluent released into rivers, the ocean and other water bodies meets prescribed standards. Ensuring that the quality of the effluent is of acceptable quality to be discharged into the environment requires rigorous monitoring of the process and functioning of the wastewater treatment systems. The city scored as + (encouraging) on indicator 3.1 smart monitoring with regard to the governance of wastewater treatment. The GCF reveals that smart monitoring is essential in ensuring that other governance aspects such as statutory compliance (indicator 9.2), preparedness for risk and adequate service delivery (indicator 9.3) are carried out successfully.
The quality of the effluent being discharged from the wastewater treatment works in Cape Town is monitored by the City on a continuous basis and the results are provided in the annual Water Services Development Plan. Effluent quality is also reported in accordance with the National Department of Water and Sanitation’s (DWS) license requirements by way of the Green Drop certification program for wastewater treatment works nationwide. The Green Drop system is an incentive-based method which grants Green Drop Status to Water Service Authorities (in this case the CoCT) based on their level of compliance with wastewater legislation and other best practices as required by DWS. The most recent Green Drop report was published in 2014, in which Cape Town scored a Green Drop status of 89.7% (Good) based on compliance to Green Drop criteria at all of the City’s wastewater treatment facilities [32]. Not only is smart monitoring applied to wastewater effluent quality, but a register of non-compliance incidents at wastewater treatment facilities is also included in the annual Water Services Development Plan [22]. The register provides a clear definition of the problem, the cause of the problem and remedial actions taken. The precautionary principle is adopted for dealing with risks such as non-compliance incidents, as a departmental Risk Management Register is compiled for the water and sanitation department where action plans are provided for potential risks. This has resulted in Cape Town scoring as + (encouraging) on indicator 9.3 Preparedness. Continuous monitoring of wastewater effluent quality and monitoring of non-compliance incidents enhances the city’s preparedness in dealing with both sudden and gradual deviations in wastewater treatment processes.
Continuous monitoring of effluent is also important, as effluent is only being discharged into the environment. Approximately 8% of the total volumes of treated wastewater are currently re-used by more than 160 industrial and commercial customers [26]. The CoCT has been promoting the re-use of treated effluent by using an incentive-based method of selling treated water at a price lower than that of potable water. The drought crisis has prompted the city to plan to increase the percentage of treated effluent being used. Not only this, another important area of focus for the city is reclamation of potable water from treated effluent in order to augment drinking water supplies. Wastewater treatment processes are therefore also being used to promote conservation of the City’s limited potable water supply. Hence Cape Town scores as encouraging for indicator 7.1 Room to maneuver, as the city has the opportunity to develop alternatives to address water scarcity in the city.

5. Conclusions

The City Blueprint assessment of Cape Town illustrates the importance of considering uncertainties and complexities in the governance processes related to urban water challenges. The governance of wastewater treatment and that of flood risk in Cape Town already embraces uncertainties, and as a result the level of preparedness to deal with unexpected disaster and risk is deemed adequate. On the other hand, consideration of the uncertainty and complexity in the governance of water scarcity has been lacking over the years. This is revealed by the City’s attempts to implement augmentation schemes in a short time span of six to eighteen months during 2017/18 to address the water crisis. Our study has also revealed that information transparency and access to information by the public, through social media, posters in public spaces and on the City’s website, plays an important role in educating the public about water challenges and can be used as a tool to encourage behavioral change regarding water scarcity. Although the CoCT makes a concerted effort to ensure that information and knowledge is disseminated to the public, most information is only available online, for example through the ‘Water Dashboard’ feature provided on the City’s website, which may limit some citizen’s access to information. With this being said, it is recommended that information be provided in places which are easily and frequently accessed by the public such as schools and shops. In the same light, this point suggests reflection of the GCF methodology which mainly considers the type of knowledge which is available to the public without considering the fact that communication platforms can limit access to information.
Furthermore, the GCF illustrates the potential for Cape Town to adopt the principles of WSUD. The ‘non-conventional’ nature of WSUD options, such as the use of nature-based solutions and green infrastructure for water supply, stormwater management and wastewater treatment, means that local authorities may deem it more risky than conventional (grey) water infrastructure. Therefore, successful implementation of policies such as the Management of Urban Stormwater Impacts Policy and the Flood Plain and River Corridor Management Policy, which are already underpinned by principles of WSUD, can be used to give more credibility to the approach. It is crucial for a South African city like Cape Town “to determine what water sensitivity means in SA taking into account poverty, inequality, lack of services and context specific challenges” [33]. This assessment has shown that great effort has already been made in the CoCT to embed local context into addressing water challenges, thus illustrating the potential for a transition towards water sensitivity. Lastly, the drought is causing a shift in governance processes related to water scarcity and has resulted in the adoption of a new management scenario, the ‘New normal’. There is therefore potential for the principles of WSUD to be implemented in new strategies relating to water scarcity in Cape Town.

Author Contributions

Conceptualization, B.M., S.K. and K.v.L.; methodology, B.M., S.K., K.C.; software, S.K.; formal analysis, B.M.; investigation, B.M.; resources, K.C.; data curation, B.M.; writing—original draft preparation, B.M.; writing—review and editing, S.K., K.v.L., K.C.; supervision, K.C.; project administration, K.C.; funding acquisition, K.v.L., K.C.

Funding

This project was partially funded by the South African Water Research Commission (WRC) as part of Project K5/2413—Development and management of a Water Sensitive Design Community of Practice program. Part of this research was also funded by the POWER project. The European Commission is acknowledged for Funding POWER in H2020-Water under Grant Agreement No. 687809.

Acknowledgments

This paper would not have been published without the support provided by the programme committee of the International Young Water Professionals Conferences (www.iwaywpconference.org) organized by IWA, WISA and YWP-ZA.

Conflicts of Interest

The authors declare no conflict of interest. The funders had no role in the design of the study; in the collection, analyses, or interpretation of data; in the writing of the manuscript, or in the decision to publish the results.

References

  1. Wamsler, C.; Brink, E.; Rivera, C. Planning for climate change in urban areas: From theory to practice. J. Clean. Prod. 2013, 50, 68–81. [Google Scholar] [CrossRef]
  2. Friedrich, E.; Pillay, S.; Buckley, C.A. Carbon footprint analysis for increasing water supply and sanitation in South Africa: A case study. J. Clean. Prod. 2009, 17, 1–2. [Google Scholar] [CrossRef]
  3. National Water Resource Strategy: Water for an Equitable and Sustainable Future; Department of Water Affairs: Pretoria, South Africa, 2013; Volume 53, pp. 1689–1699.
  4. Ferguson, B.C.; Frantzeskaki, N.; Brown, R.R. A strategic program for transitioning to a Water Sensitive City. Landsc. Urban Plan. 2013, 117, 32–45. [Google Scholar] [CrossRef]
  5. Fletcher, T.D.; Shuster, W.; Hunt, W.F.; Ashley, R.; Butler, D.; Arthur, S.; Trowsdale, S.; Barraud, S.; Semadeni-Davies, A.; Bertrand-Krajewski, J.L.; et al. SUDS, LID, BMPs, WSUD and more—The evolution and application of terminology surrounding urban drainage. Urban Water J. 2015, 12, 525–542. [Google Scholar] [CrossRef]
  6. Wong, T.H.F.; Brown, R.R. The water sensitive city: Principles for practice. Water Sci. Technol. 2009, 60, 673–682. [Google Scholar] [CrossRef] [PubMed]
  7. Rijke, J.; Farrelly, M.; Brown, R.; Zevenbergen, C. Configuring transformative governance to enhance resilient urban water systems. Environ. Sci. Policy 2013, 25, 62–72. [Google Scholar] [CrossRef]
  8. Armitage, N.; Fisher-Jeffes, L.; Carden, K.; Winter, K.; Naidoo, V.; Spiegel, A.; Mauck, B.; Coulson, D. Water Sensitive Urban Design (WSUD) for South Africa: Framework and Guidelines; WRC Report TT 558/14; Water Research Commission: Pretoria, South Africa, 2014; pp. 1–58. [Google Scholar]
  9. Koop, S.H.A.; Koetsier, L.; Van Doornhof, A.; Reinstra, O.; Van Leeuwen, C.J.; Brouwer, S.; Dieperink, C.; Driessen, P. Assessing the governance capacity of cities to address challenges of water, waste and climate change. Water Resour. Manag. 2017, 31, 3427–3443. [Google Scholar] [CrossRef]
  10. Koop, S.H.A.; Van Leeuwen, C.J. Assessment of the sustainability of water resources management: A critical review of the City Blueprint approach. Water Resour. Manag. 2015, 29, 5649–5670. [Google Scholar] [CrossRef]
  11. Koop, S.H.A.; Van Leeuwen, C.J. The challenges of water, waste and climate change in cities. Environ. Dev. Sustain. 2017, 19, 385–418. [Google Scholar] [CrossRef]
  12. Beck, L.; Brown, R.; Chesterfield, C.; Dunn, G.; de Haan, F.; Lloyd, S.; Rogers, B.; Urich, C.; Wong, T. Beyond benchmarking: A water sensitive cities index. OzWater 2016, 16, 10–12. [Google Scholar]
  13. Internation Water Association. Principles for Water Wise Cities; Internation Water Association: London, UK, 2016. [Google Scholar]
  14. Koop, S.H.A.; Van Leeuwen, C.J. Application of the improved city blueprint framework in 45 municipalities and regions. Water Resour. Manag. 2015, 29, 4629–4647. [Google Scholar] [CrossRef]
  15. WHO Metrics: Disability-Adjusted Life Year (DALY). 2018. Available online: https://www.who.int/healthinfo/global_burden_disease/metrics_daly/en/ (accessed on 20 December 2018).
  16. World Bank Primary Completion Rate, Total (% of Relevant Age Group). 2012. Available online: http://data.worldbank.org/indicator/SE.PRM.CMPT.ZS/countries/1W-AO?display=default (accessed on 20 December 2018).
  17. World Bank Worldwide Governance Indicators. 2013a. Available online: http://info.worldbank.org/governance/wgi/indexaspx#faq (accessed on 20 December 2018).
  18. World Bank Inflation, Costumers Price (Annual %). 2013b. Available online: http://data.worldbank.org/indicator/FP.CPI.TOTL.ZG (accessed on 20 December 2018).
  19. World Bank Unemployment Total (% of Total Labor Force) (Modelled ILO Estimate). 2014. Available online: http://data.worldbank.org/indicator/SL.UEM.TOTL.ZS (accessed on 20 December 2018).
  20. FAO Food and Agriculture Organization of the United Nations: AQUASTAT Database. 2015. Available online: http://www.fao.org/nr/water/aquastat/data/query/index.html;jsessionid=B022D1C2732DF571D2A384B57E0128D6 (accessed on 20 December 2018).
  21. European Commission European innovation Partnership on Water. 2017. Available online: http://www.eip-water.eu/City_Blueprints (accessed on 20 February 2018).
  22. City of Cape Town: Water Services Development Plan—IDP Water Sector Input Report; City of Cape Town: Cape Town, South Africa, 2016.
  23. Schreurs, E.; Koop, S.; van Leeuwen, K. Application of the City Blueprint Approach to assess the challenges of water management and governance in Quito (Ecuador). Environ. Dev. Sustain. 2017, 20, 509–525. [Google Scholar] [CrossRef]
  24. National Waste Information Baseline Report; Department of Environmental Affairs, Republic of South Africa: Pretoria, South Africa, 2012.
  25. Madonsela, B.; University of Cape Town, Cape Town, South Africa. Respondent 5. Personal communication, 2018.
  26. Water Services and the Cape Town Urban Water Cycle; City of Cape Town: Cape Town, South Africa, 2017.
  27. Ziervogel, G.; Shale, M.; Du, M. Climate change adaptation in a developing country context: The case of urban water supply in Cape Town. Clim. Dev. 2010, 2, 94–110. [Google Scholar] [CrossRef]
  28. Mukheibir, P.; Ziervogel, G. Developing a Municipal Adaptation Plan (MAP) for climate change: The city of Cape Town. Environ. Urban. 2007, 19, 143–158. [Google Scholar] [CrossRef]
  29. Western Cape Water Supply System: Reconciliation Strategy Study; Department of Water and Sanitation: Pretoria, South Africa, 2007.
  30. Management of Urban Stormwater Impacts Policy; City of Cape Town: Cape Town, South Africa, 2009.
  31. Floodplain and River Corridor Management Policy; City of Cape Town: Cape Town, South Africa, 2009.
  32. Green Drop Progress Report 2014; Department of Water & Sanitation: Pretoria, South Africa, 2014.
  33. Fisher-Jeffes, L.; Carden, K.; Armitage, N.P.; Spiegel, A.; Winter, K.; Ashley, R. Challenges Facing Implementation of Water Sensitive Urban Design in South Africa. In Proceedings of the 7th Conference on Water Sensitive Urban Design, Mebourne, Australia, 20–23 February 2012; pp. 1–8. [Google Scholar]
Figure 1. City Blueprint Approach (Koop & Van Leeuwen, 2017 [11]).
Water 11 00292 g001
Figure 2. City Blueprint Framework analysis for Cape Town. Various components of urban water management are integrated into a framework of 25 indicators that are scored from 0 (low performance: inner circle) to 10 (high performance: outer circle). The overall score, the Blue City Index is 4.9.
Water 11 00292 g002
Table 1. Overview of pre-defined questions to be answered by the researcher based on a triangular approach consisting of three steps: (1) literature review; (2) in-depth interviews with selected experts; and (3) feedback procedure. The full details of the Likert scoring are provided at [21].
IndicatorPre-Defined Question
1.1 Community knowledgeTo what extent is knowledge regarding the current and future risks, impacts, and uncertainties of the water challenge dispersed throughout the community and local stakeholders which may results in their involvement in decision-making and implementation?
1.2 Local sense of urgencyTo what extent do actors have a sense of urgency, resulting in widely supported awareness, actions, and policies that address the water challenge?
1.3 Behavioural internalizationTo what extent do local communities and stakeholders try to understand, react, anticipate and change their behaviour in order to contribute to solutions regarding the water challenge?
2.1 Information availabilityTo what extent is information on the water challenge available, reliable, and based on multiple sources and methods, in order to meet current and future demands so as to reveal information gaps and enhance well-informed decision-making?
2.2 Information transparencyTo what extent is information on the water challenge accessible and understandable for experts and non-experts, including decision-makers?
2.3 Knowledge cohesionTo what extent is information cohesive in terms of using, producing and sharing different kinds of information, usage of different methods and integration of short-term targets and long-term goals amongst different policy fields and stakeholders in order to deal with the water challenge?
3.1 Smart monitoringTo what extent is the monitoring of process, progress, and policies able to improve the level of learning (i.e., to enable rapid recognition of alarming situations, identification or clarification of underlying trends)? Or can it even have predictive value?
3.2 EvaluationTo what extent are current policy and implementation continuously assessed and improved, based on the quality of evaluation methods, the frequency of their application, and the level of learning?
3.3 Cross-stakeholder learningTo what extent are stakeholders open to and have the opportunity to interact with other stakeholders and deliberately choose to learn from each other?
4.1 Stakeholder inclusivenessTo what extent are stakeholders interact in the decision-making process interaction (i.e., are merely informed, are consulted or are actively involved)? Are their engagement processes clear and transparent? Are stakeholders able to speak on behalf of a group and decide on that group’s behalf?
4.2 Protection of core valuesTo what extent: (1) is commitment focused on the process instead of on early end-results? (2) do stakeholders have the opportunity to be actively involved? (3) are the exit procedures clear and transparent? (All three ensure that stakeholders feel confident that their core values will not be harmed.)
4.3 Progress and variety of optionsTo what extent are procedures clear and realistic, are a variety of alternatives co-created and thereafter selected from, and are decisions made at the end of the process in order to secure continued prospect of gain and thereby cooperative behaviour and progress in the engagement process?
5.1 Ambitious and realistic managementTo what extent are goals ambitious (i.e., identification of challenges, period of action considered, and comprehensiveness of strategy) and yet realistic (i.e., cohesion of long-term goals and supporting flexible intermittent targets, and the inclusion of uncertainty in policy)?
5.2 Discourse embeddingTo what extent is sustainable policy interwoven in historical, cultural, normative and political context?
5.3 Management cohesion To what extent is policy relevant for the water challenge, and coherent regarding: (1) geographic and administrative boundaries; and (2) alignment across sectors, government levels, and technical and financial possibilities?
6.1 Entrepreneurial agents To what extent are the entrepreneurial agents of change enabled to gain access to resources, seek and seize opportunities, and have influence on decision-making?
6.2 Collaborative agentsTo what extent are actors enabled to engage, build trust and collaboration, and connect business, government, and other sectors, in order to address the water challenge in an unconventional and comprehensive way?
6.3 Visionary agentsTo what extent are actors in the network able to manage and effectively push forward long-term and integrated strategies which are adequately supported by interim targets?
7.1 Room to manoeuvre To what extent do actors have the freedom and opportunity to develop a variety of alternatives and approaches (this includes the possibility of forming ad hoc, fit-for-purpose partnerships that can adequately address existing or emerging issues regarding the water challenge)?
7.2 Clear division of responsibilitiesTo what extent are responsibilities clearly formulated and allocated, in order to effectively address the water challenge?
7.3 AuthorityTo what extent are legitimate forms of power and authority present that enable long-term, integrated and sustainable solutions for the water challenge?
8.1 AffordabilityTo what extent are water services and climate adaptation measures available and affordable for all citizens, including the poorest?
8.2 Consumer willingness to payHow is expenditure regarding the water challenge perceived by all relevant stakeholders (i.e., is there trust that the money is well-spent)?
8.3 Financial continuationTo what extent do financial arrangements secure long-term, robust policy implementation, continuation, and risk reduction?
9.1 Policy instrumentsTo what extent are policy instruments effectively used (and evaluated), in order to stimulate desired behaviour and discourage undesired activities and choices?
9.2 Statutory complianceTo what extent is legislation and compliance, well-coordinated, clear and transparent and do stakeholders respect agreements, objectives, and legislation?
9.3 PreparednessTo what extent is the city prepared (i.e. there is clear allocation of responsibilities, and clear policies and action plans) for both gradual and sudden uncertain changes and events?
Table 2. Trends and Pressures Framework analysis for Cape Town. Indicator scores range from 0 to 4 (0 indicating the lowest degree of concern and 4 the highest degree of concern).
CategoryIndicatorsSub-IndicatorsIndicator Scores
1. Social pressures1. Urbanization rate 1.725
2. Burden of disease 3
3. Education rate2.45
4. Political instability2.104
2. Environmental pressures5. Water scarcity 5.1 Fresh water scarcity3
5.2 Ground water scarcity1
5.3 Salinization and/or seawater intrusion3
6. Flood risk6.1 Urban drainage flood1
6.2 Sea-level rise0
6.3 River peak discharges3
7. Water quality 7.1 Surface water quality0.632
7.2 Biodiversity1.28
8. Heat risk0.4
3. Financial pressures9. Economic pressure3.54
10. Unemployment rate4.1
11. Poverty rate1.81
12. Inflation rate 3.17
Table 3. Governance Capacity Framework assessment for Cape Town. Each indicator is scored according to a Likert scale: -- very limiting; - limiting; 0 indifferent; + encouraging; ++ very encouraging.
CategoryIndicatorsWater ScarcityFlood RiskWastewater Treatment
1. Awareness1.1 Community knowledge0++0
1.2 Local sense of urgency++++
1.3 Behavioral internalization0+-
2. Useful knowledge2.1 Information availability++++
2.2 Information transparency 0++
2.3 Knowledge cohesion0++
3. Continuous learning3.1 Smart monitoring+0+
3.2 Evaluation-00
3.3 Cross-stakeholder learning+++
4. Stakeholder engagement processes4.1 Stakeholder inclusiveness-00
4.2 Protection of core values000
4.3 Progress and variety of options+0+
5. Management ambition5.1 Ambitious and realistic management0+++
5.2 Discourse embedding-++
5.3 Management cohesion+++
6. Agents of change6.1 Entrepreneurial agents 0++
6.2 Collaborative agents++++++
6.3 Visionary agents0++
7. Multi-level network potential7.1 Room to manoeuver+++
7.2 Clear division of responsibilities000
7.3 Authority+++
8. Financial viability8.1 Affordability0--
8.2 Consumer willingness to pay+++++
8.3 Financial continuation0-+
9. Implementing capacity9.1 Policy instruments00+
9.2 Statutory compliance0-+
9.3 Preparedness0+++

