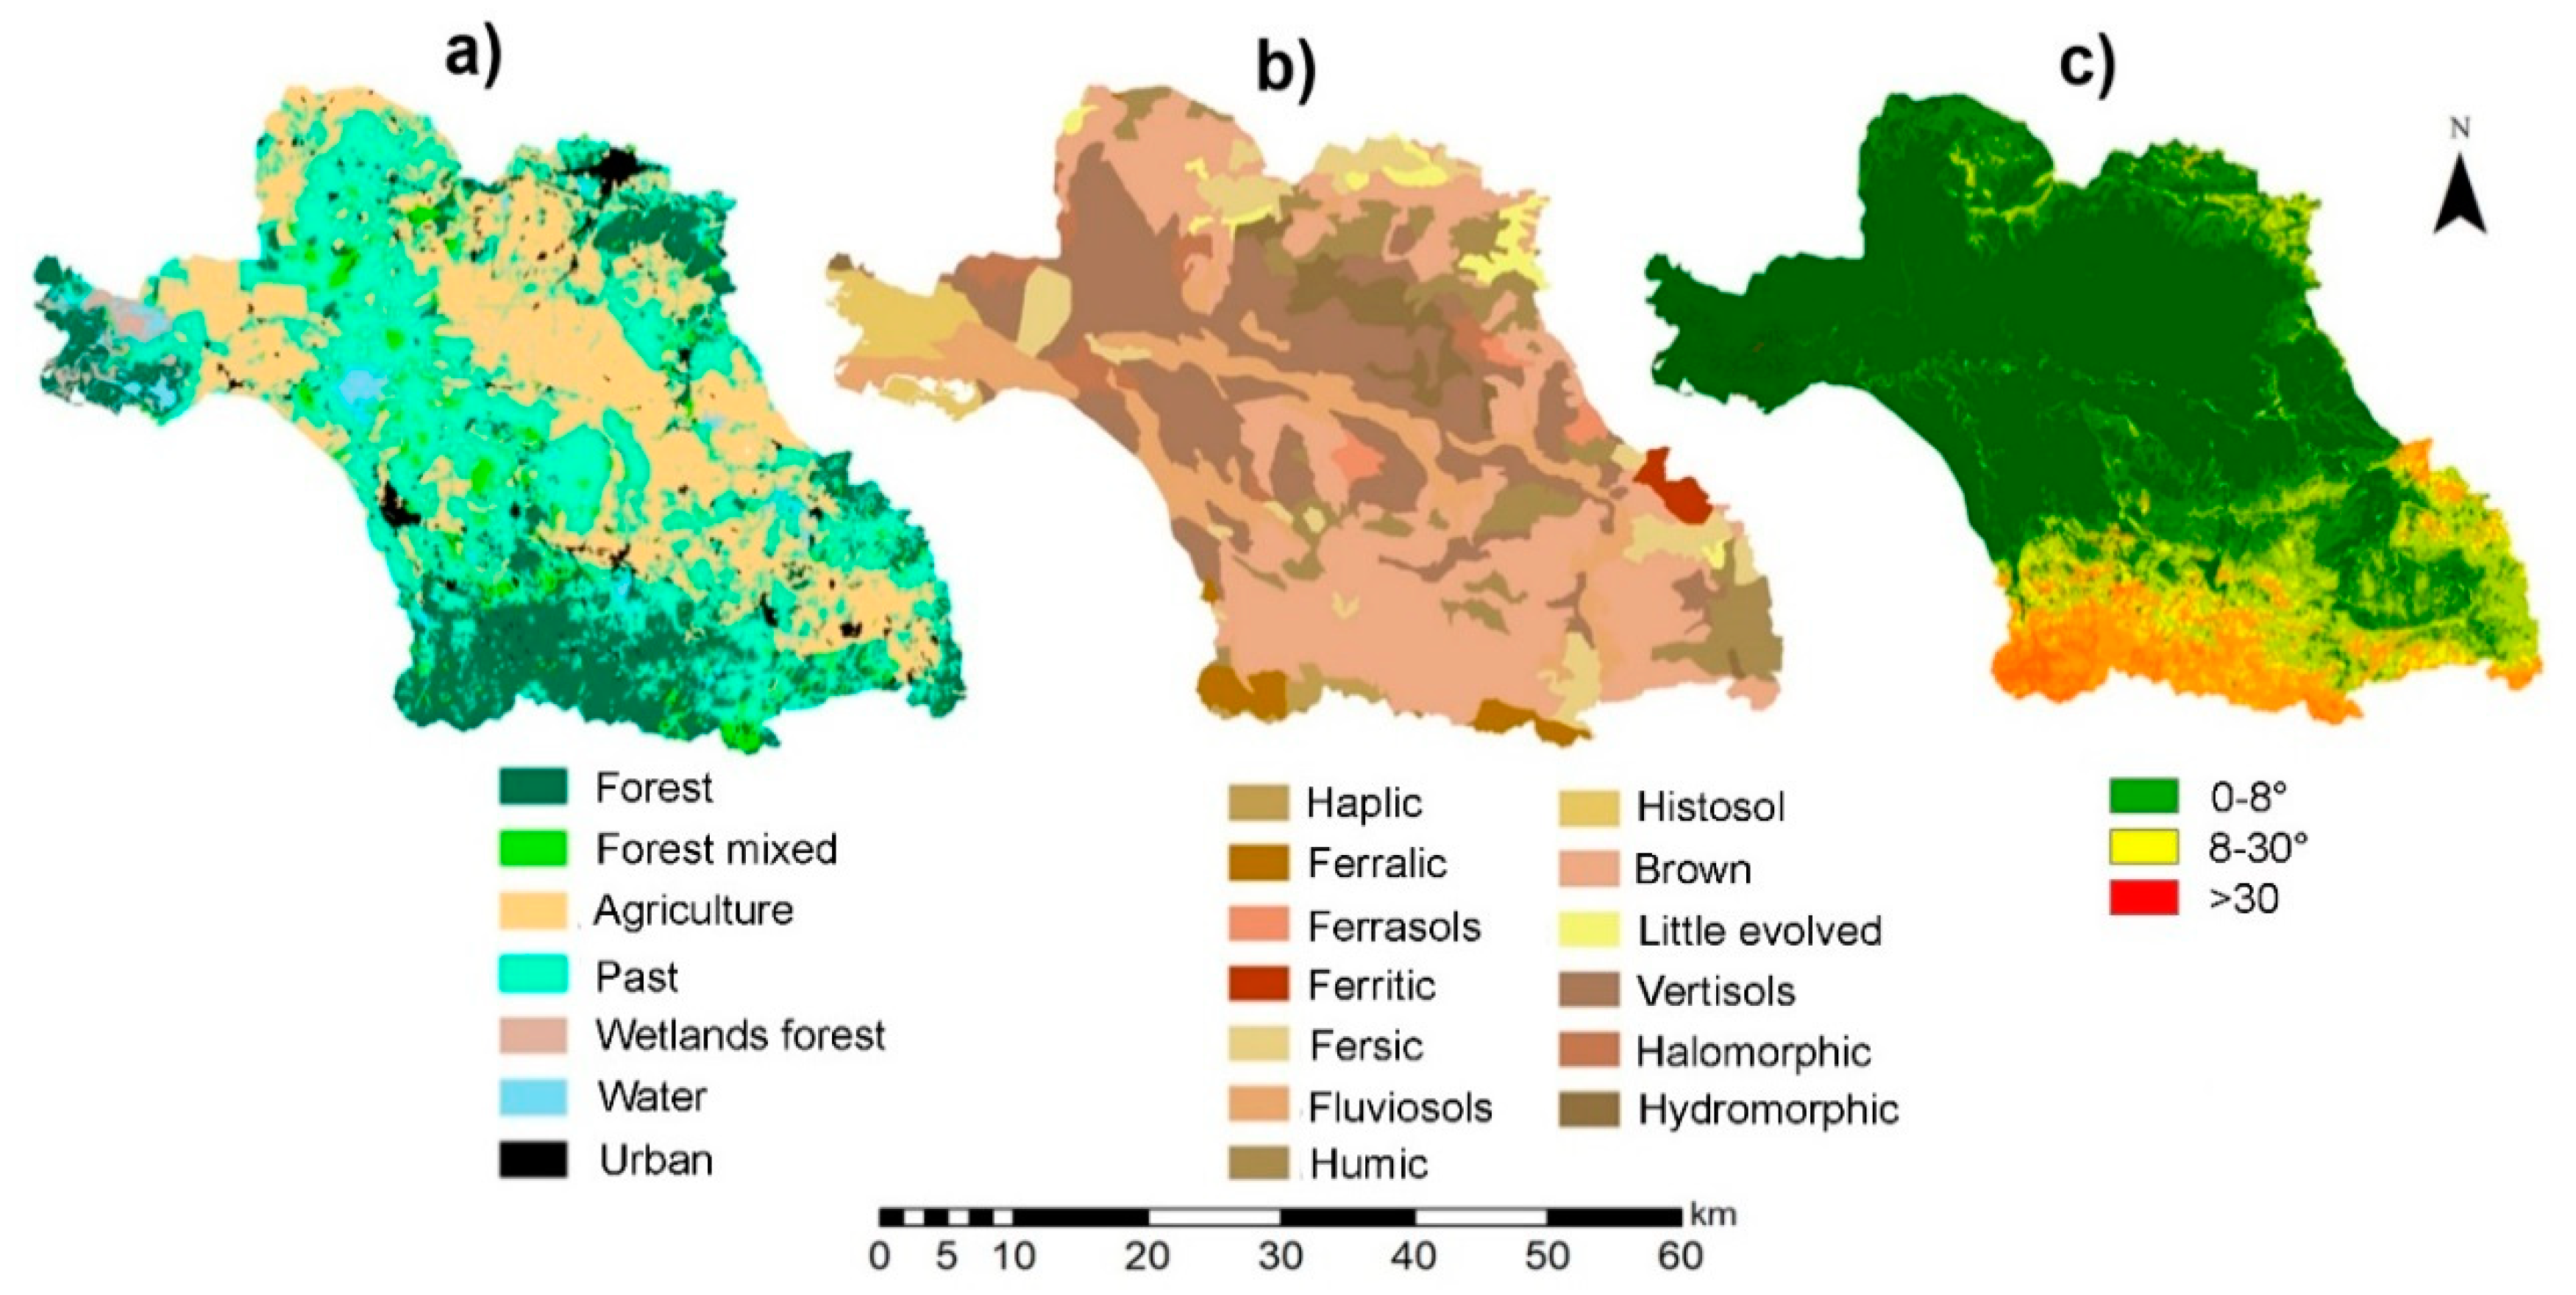
3.1. Modeling Approach
Table 2 lists the initial ranges of 17 SWAT model parameter values and their final simulated values for each subbasin. The sensitivity analyses showed that five parameters were the most sensitive for the region based on a low
p-value (≤0.05) of a
t-test: Initial curve number (II) value (CN2), available water capacity (SOL_AWC), saturated hydraulic conductivity (SOL_K), channel effective hydraulic conductivity (CH_K2), and baseflow alpha factor for bank storage (ALPHA_BNK). Other studies also found these parameters as relevant for hydrological modeling in different basins around the world [
60,
61]. The high sensitivity of CN2 and SOL_AWC revealed the importance of the surface runoff in the hydrology of the subbasins, which was expected considering the characteristics of the subbasins. Although the other parameters initially selected in
Table 2 showed lower sensitivity, with
p values between 0.1 and 0.05, they were kept in the calibration process due to their importance for groundwater and surface runoff, an argument also emphasized by White and Chaubey [
62].
The parameter values estimated by SWAT were within physically reasonable ranges and described the hydrological processes in La Fuente and Las Coloradas according to the precipitation and streamflow observations. The calibrated final values obtained helped identify the differences between the two subbasins. As expected, the curve number (CN) was an important parameter for streamflow production, and the variations between the two subbasins could be attributed to the physical settings. La Fuente subbasin has lower infiltration capacities and higher runoff production potential at mid-elevations as compared with Las Coloradas subbasin. The differences in the soil evaporation compensation factor (ESCO), the baseflow recession coefficient (ALPHA_BF), and the groundwater “revap” coefficient (GW_REVAP) (
Table 2) between subbasins can be also linked to physiographic variations.
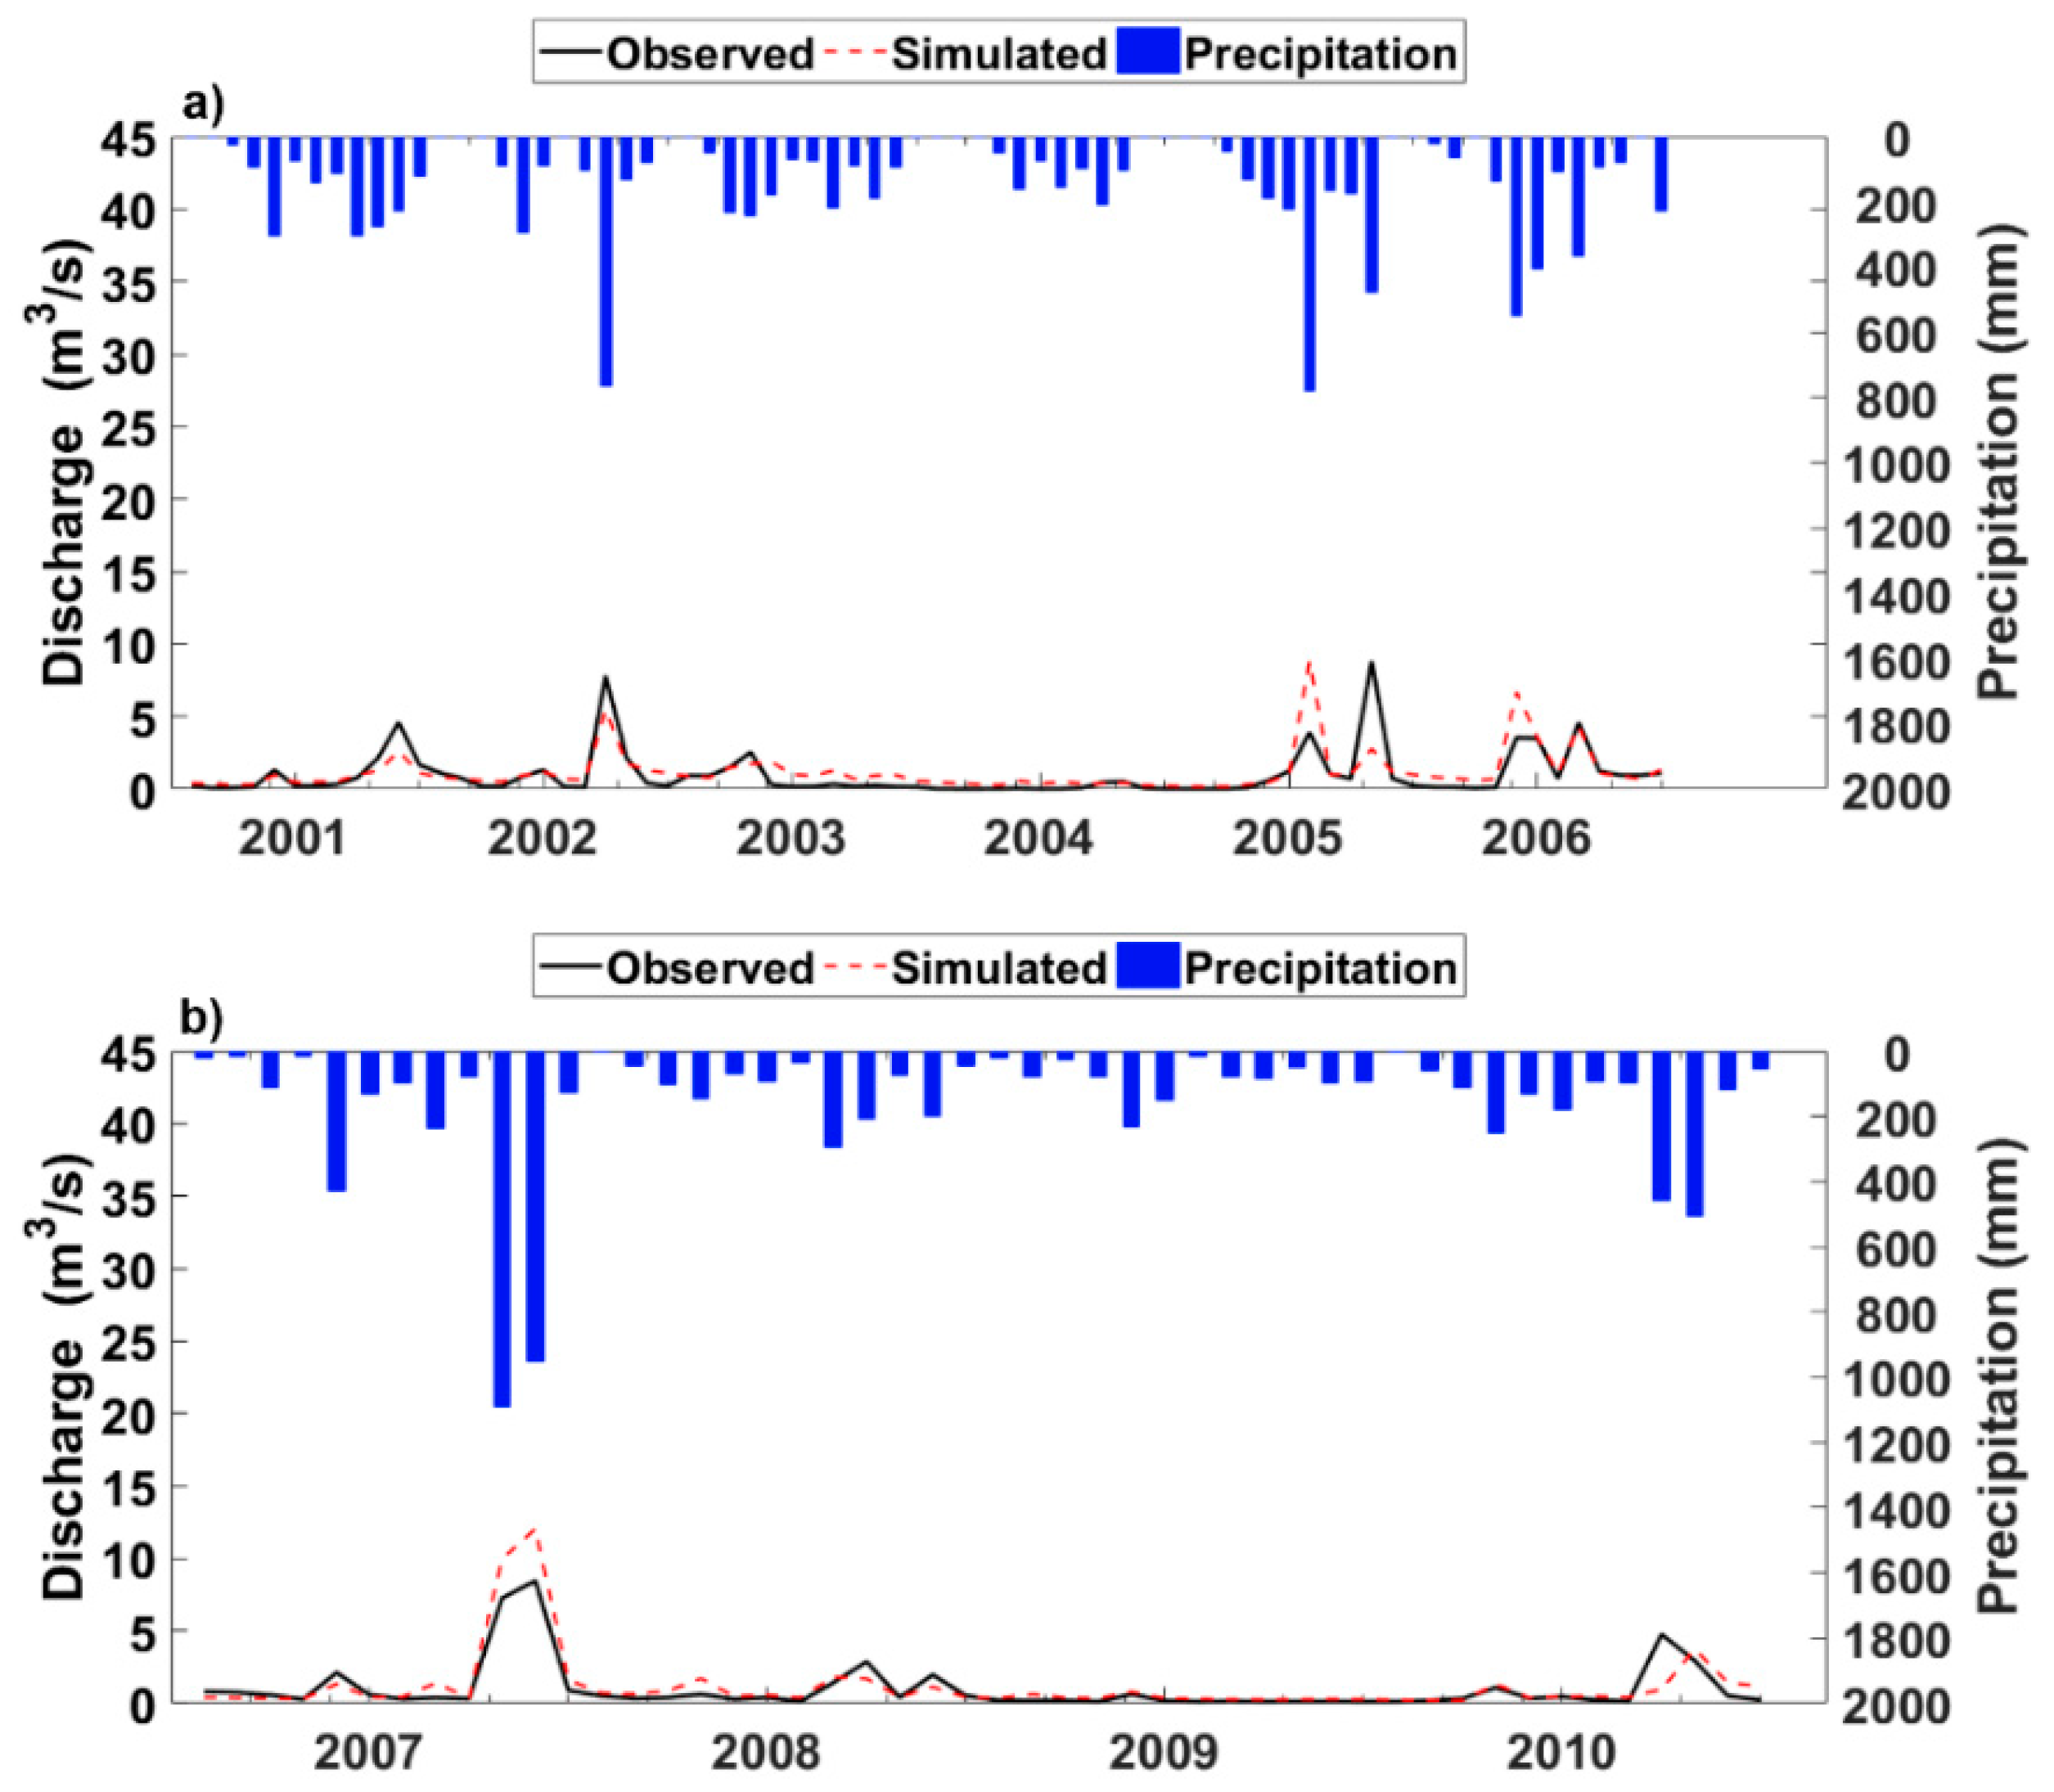
Simulated and observed discharges at the mid-altitude La Fuente subbasin during calibration and validation periods are shown in
Figure 3. During calibration, the SWAT simulation reproduced the observed discharges and their variation in time but tended to overestimate the streamflow during dry periods. This overestimation may indicate that the model is not entirely capturing the dynamics of the groundwater components [
1] or is not simulating adequately the evapotranspiration capacity of the vegetation [
21]. The inaccuracy of the model performance during dry periods may be also associated with the objective function (
NSE) used to calibrate the model, which tends to rely more on model performance during flood events [
63]. In line with these results, SWAT has been shown to be weak when simulating low flows in other regions [
64,
65].
Model performance metrics for La Fuente and Las Coloradas subbasins are shown in
Table 3. For La Fuente subbasin, according to the
NSE (=0.67), the calibration is “good” [
48] and the validation period is “very good” with an
NSE = 0.86. The
PBIAS based on monthly values in La Fuente shows a slight streamflow underestimation (−4%) in the calibration and underestimation (−15%) during the validation period. The low magnitudes of
PBIAS correspond to a “good” performance rating for the model in both periods [
48]. The R
2 values for discharge are 0.67 for calibration and 0.86 for validation, corresponding to model performance ratings of “good” and “very good”, respectively [
48]. Although this does not occur frequently, some authors have also reported a statistical improvement in the validation period [
66].
Figure 4 shows the simulated and observed monthly discharges at the high-altitude Las Coloradas subbasin during the calibration and validation periods. In general, the simulated discharges compared well to the observations, although some of the low flow periods were not well captured, as also noted earlier in La Fuente subbasin (
Figure 3). On the other hand, peak flows tended to be overestimated in some extreme precipitation events (>500 mm/month), especially during the validation period (
PBIAS 34%,
Table 3). During this period, precipitation was significantly larger (i.e., more than 200 mm) (
Figure 4b) than the largest two peaks (i.e., ~800 mm) of the calibration period (
Figure 4a). One possible explanation for the overestimation is that the calibration did not cover the most extreme rainfall events of the entire period, resulting in a poor performance during the validation. The overestimation of maximum flows for rainy periods in basins with very rapid hydrological responses has been also reported by some authors in other climates [
67]. Consistent with the
PBIAS and the monthly skills of
NSE (0.54) and R
2 (0.50), the performance of the calibration can be described as “satisfactory” [
48]. During the validation period, the statistical metrics yielded a worse performance than the calibration, as seen in
Table 3, but still satisfactory according to Van Liew et al. [
49]. It is common for the statistical skill of the validation period to be worse than the calibration period, because the model parameters are optimized for the calibration [
48]. In general, the performance over the two subbasins calibration periods ranges from “good” to “satisfactory” according to Moriasi et al. [
48] criteria. La Fuente subbasin yielded a better model statistical performance than the Las Coloradas subbasin in all evaluated metrics (higher R
2 and
NSE and lower absolute
PBIAS). Especially noticeable is the better
NSE value during validation (0.85 in La Fuente vs. 0.45 in Las Coloradas). The main reason for a worse statistical performance in Las Coloradas may rely on the lack of accuracy in the simulation of most of the flow peaks, while in La Fuente several peaks showed a near-perfect fit.
NSE is very sensitive to the accuracy in a high flows simulation, because it tends to rely on the peaks of the calibrated variable [
63].
Despite the validation results in the subbasin Las Coloradas, we consider that the calibration model predicts the baseline flow reasonably well; thus, the model is adequate to analyze the future changes in the hydrology of the basin based on climate change scenarios [
68].
The model predictions in both subbasins ensured a proper simulation for the two periods, as shown in
Table 4. However, better simulations of the mean annual streamflow were achieved in La Fuente subbasin characterized by higher streamflows than in Las Coloradas subbasin located at a higher altitude. The observed mean annual flow rate in La Fuente was 18.22 m
3/s, while SWAT simulated 17.50 m
3/s in the calibration period. In the validation period, the observed flow rate was 25.24 m
3/s, and the simulated mean annual streamflow was 22.42 m
3/s. This similarity was the result of tuning the CN2, SOL_AWC, and SOL_K parameters during the calibration, which allowed for an improved simulation of infiltration and surface discharge for this subbasin.
Calibration in Las Coloradas was complicated as extreme precipitation events produced large overestimation of streamflows. We attempted to improve the model performance by changing the initial range of the threshold water depth in the shallow aquifer (GWQMN) and some surface parameters such as the soil available water capacity (SOL_AWC), the soil moist bulk density (SOL_BD), the soil saturated hydraulic conductivity (SOL_K), and the Manning’s “n” coefficient for overland flow (OV_N).
Table 2 shows the initial ranges finally chosen following the recommendations of Abbaspour et al. [
23], when large peaks of streamflow are overestimated. The results for Las Coloradas show a mean annual stream flow rate of 13.83 m
3/s, while the observed was 11.58 m
3/s. During the validation period, the observed mean streamflow rate was 11.56 m
3/s, while SWAT simulated 15.50 m
3/s. The annual discharges for both calibration and validation periods (
Table 4,
Figure 5b,d) continue to overestimate the streamflow, especially in Las Coloradas, as seen also in
Table 3.
In addition to the temporal variations of the streamflow, the model provides estimates of the main water balance and flow components in the two subbasins; these results are shown in
Table 5. In La Fuente subbasin, actual evapotranspiration (AET) represented 38% and 37% of the total precipitation (P) during the calibration and validations periods, respectively. Total runoff (TotalQ) accounted for by 40% and 39% of the water input via P during the calibration and validation periods, respectively. The major component of the discharge was the lateral flow (LATQ), while the relevance of surface (SURQ), and groundwater (GWQ) flows were minor. The results were similar in Las Coloradas subbasin, where AET represented 47% and 49% of P during the calibration and validation periods, respectively, while the relative contribution of TotalQ to the water balance was equivalent to 35% and 33% of P during the calibration and validation periods, respectively (
Table 5). Again, LATQ was the main flow component, followed by SURQ. Considering SWAT functioning, aquifer and soil storage together may account for the percentage of P unexplained by AET and TotalQ in the simulations [
36].
Regarding the flow components, the hydrological behavior observed in the two subbasins is typical of mountainous landscapes with steep slopes that favor direct runoff (i.e., SURQ and LATQ). This is also observed in other tropical basins [
69] where similar results are reported. The higher contribution of GWQ in La Fuente than in Las Coloradas may be explained by its lower slopes, which might favor higher recharge. Because the water balance and flow components are in agreement with the expected values of such variables in the study area, the model can be further used for the evaluation of climate change scenarios.
3.2. Analysis of Historical Simulations
Figure 5 shows the interannual variation of annual precipitation and streamflow for La Fuente and Las Coloradas subbasins for the 1970–2010 baseline period; the mean annual precipitation in La Fuente is approximately 200 mm higher than in Las Coloradas (
Table 1). This, together with the larger surface runoff production in La Fuente, favors a larger annual streamflow (16.9 m
3/s) than in Las Coloradas (10.8 m
3/s). During the baseline period, precipitation, and streamflow in the subbasins did not show a significant trend, but these were characterized by large interannual variability, which could be related to tropical cyclone activity and the contribution of ENSO to winter precipitation [
6]. The boreal winter dry season precipitation (November–April) in the subbasins is statistically significant, correlated (0.46;
p < 0.05) with the November–January Oceanic El Niño Index (ONI), so El Niño years tend to favor larger winter precipitation in the region. The correlation between precipitation and streamflow in Las Coloradas (
r = 0.81) is larger than in La Fuente (
r = 0.54), likely due to hydrological differences among the subbasins. While the simulated annual streamflow for both subbasins is similar to the observations, as reflected by the high correlation values in La Fuente (
r = 0.89) and Las Coloradas (
r = 0.92), a systematic positive bias is noted in the annual streamflow simulation in Las Coloradas.
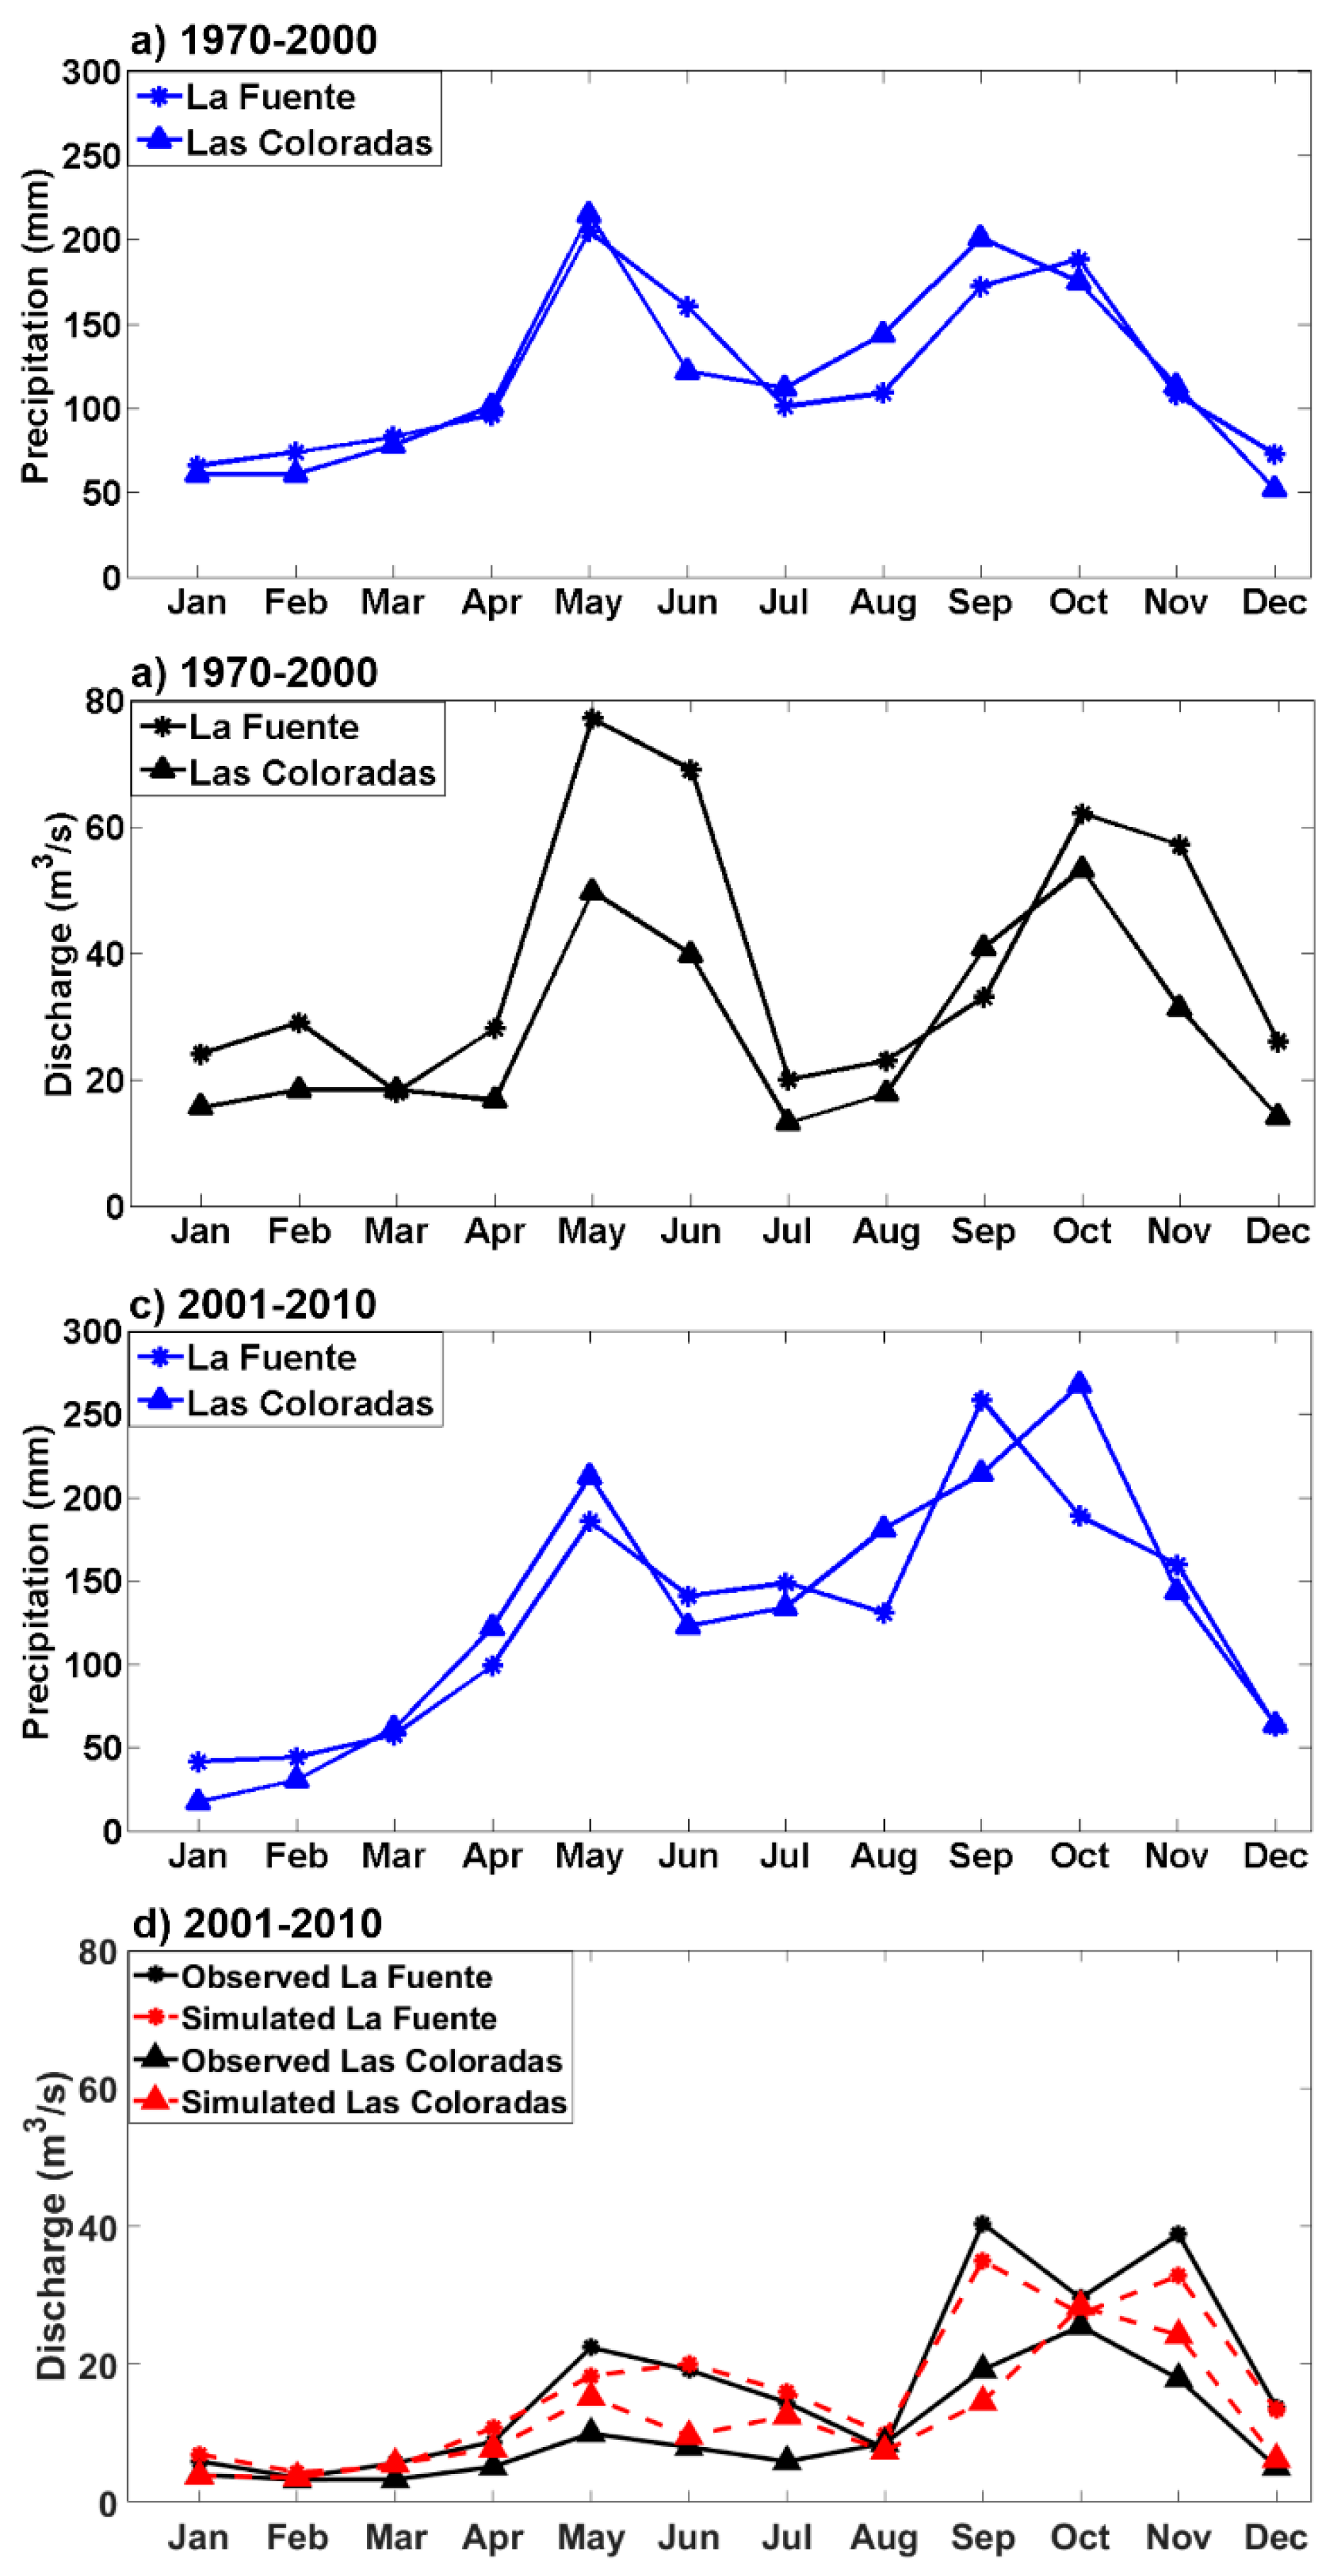
Annual cycles of precipitation and streamflow for the baseline (1970–2010) and the calibration and validation (2001–2010) periods are shown in
Figure 6. Precipitation is characterized by a bimodal distribution with peaks in May and October during the rainy season and a mid-summer drought (MSD) in July. In the 2001–2010 period, there is a slight decrease in winter precipitation at the beginning of the year, but the annual cycle is more intense at the end of the summer in comparison with the baseline period (1970–2000).
The annual streamflow cycle for the 1970–2000 period shows the highest discharges in May and October, when the most important precipitations are received, and smaller flows in the dry season from November to April. During 2001–2010, there are significantly lower discharges in all months, which are well simulated by SWAT. Causes for the reduction of the discharge in the recent period may be partially explained by changes in land use [
28]. Satellite images of the land uses for 1970–2000 and 2001–2010 show large areas of deforestation and land-use changes to agriculture in the most recent period. In the last months of the rainy season, a second peak of rainfall and of the streamflow occur after the MSD, but the discharge is still lower than during the first period (1970–2000). In general, the model captures well the streamflow seasonality, although in Las Coloradas the model shows a general tendency to overestimate during the summer months and in La Fuente to underestimate in some months of the year.
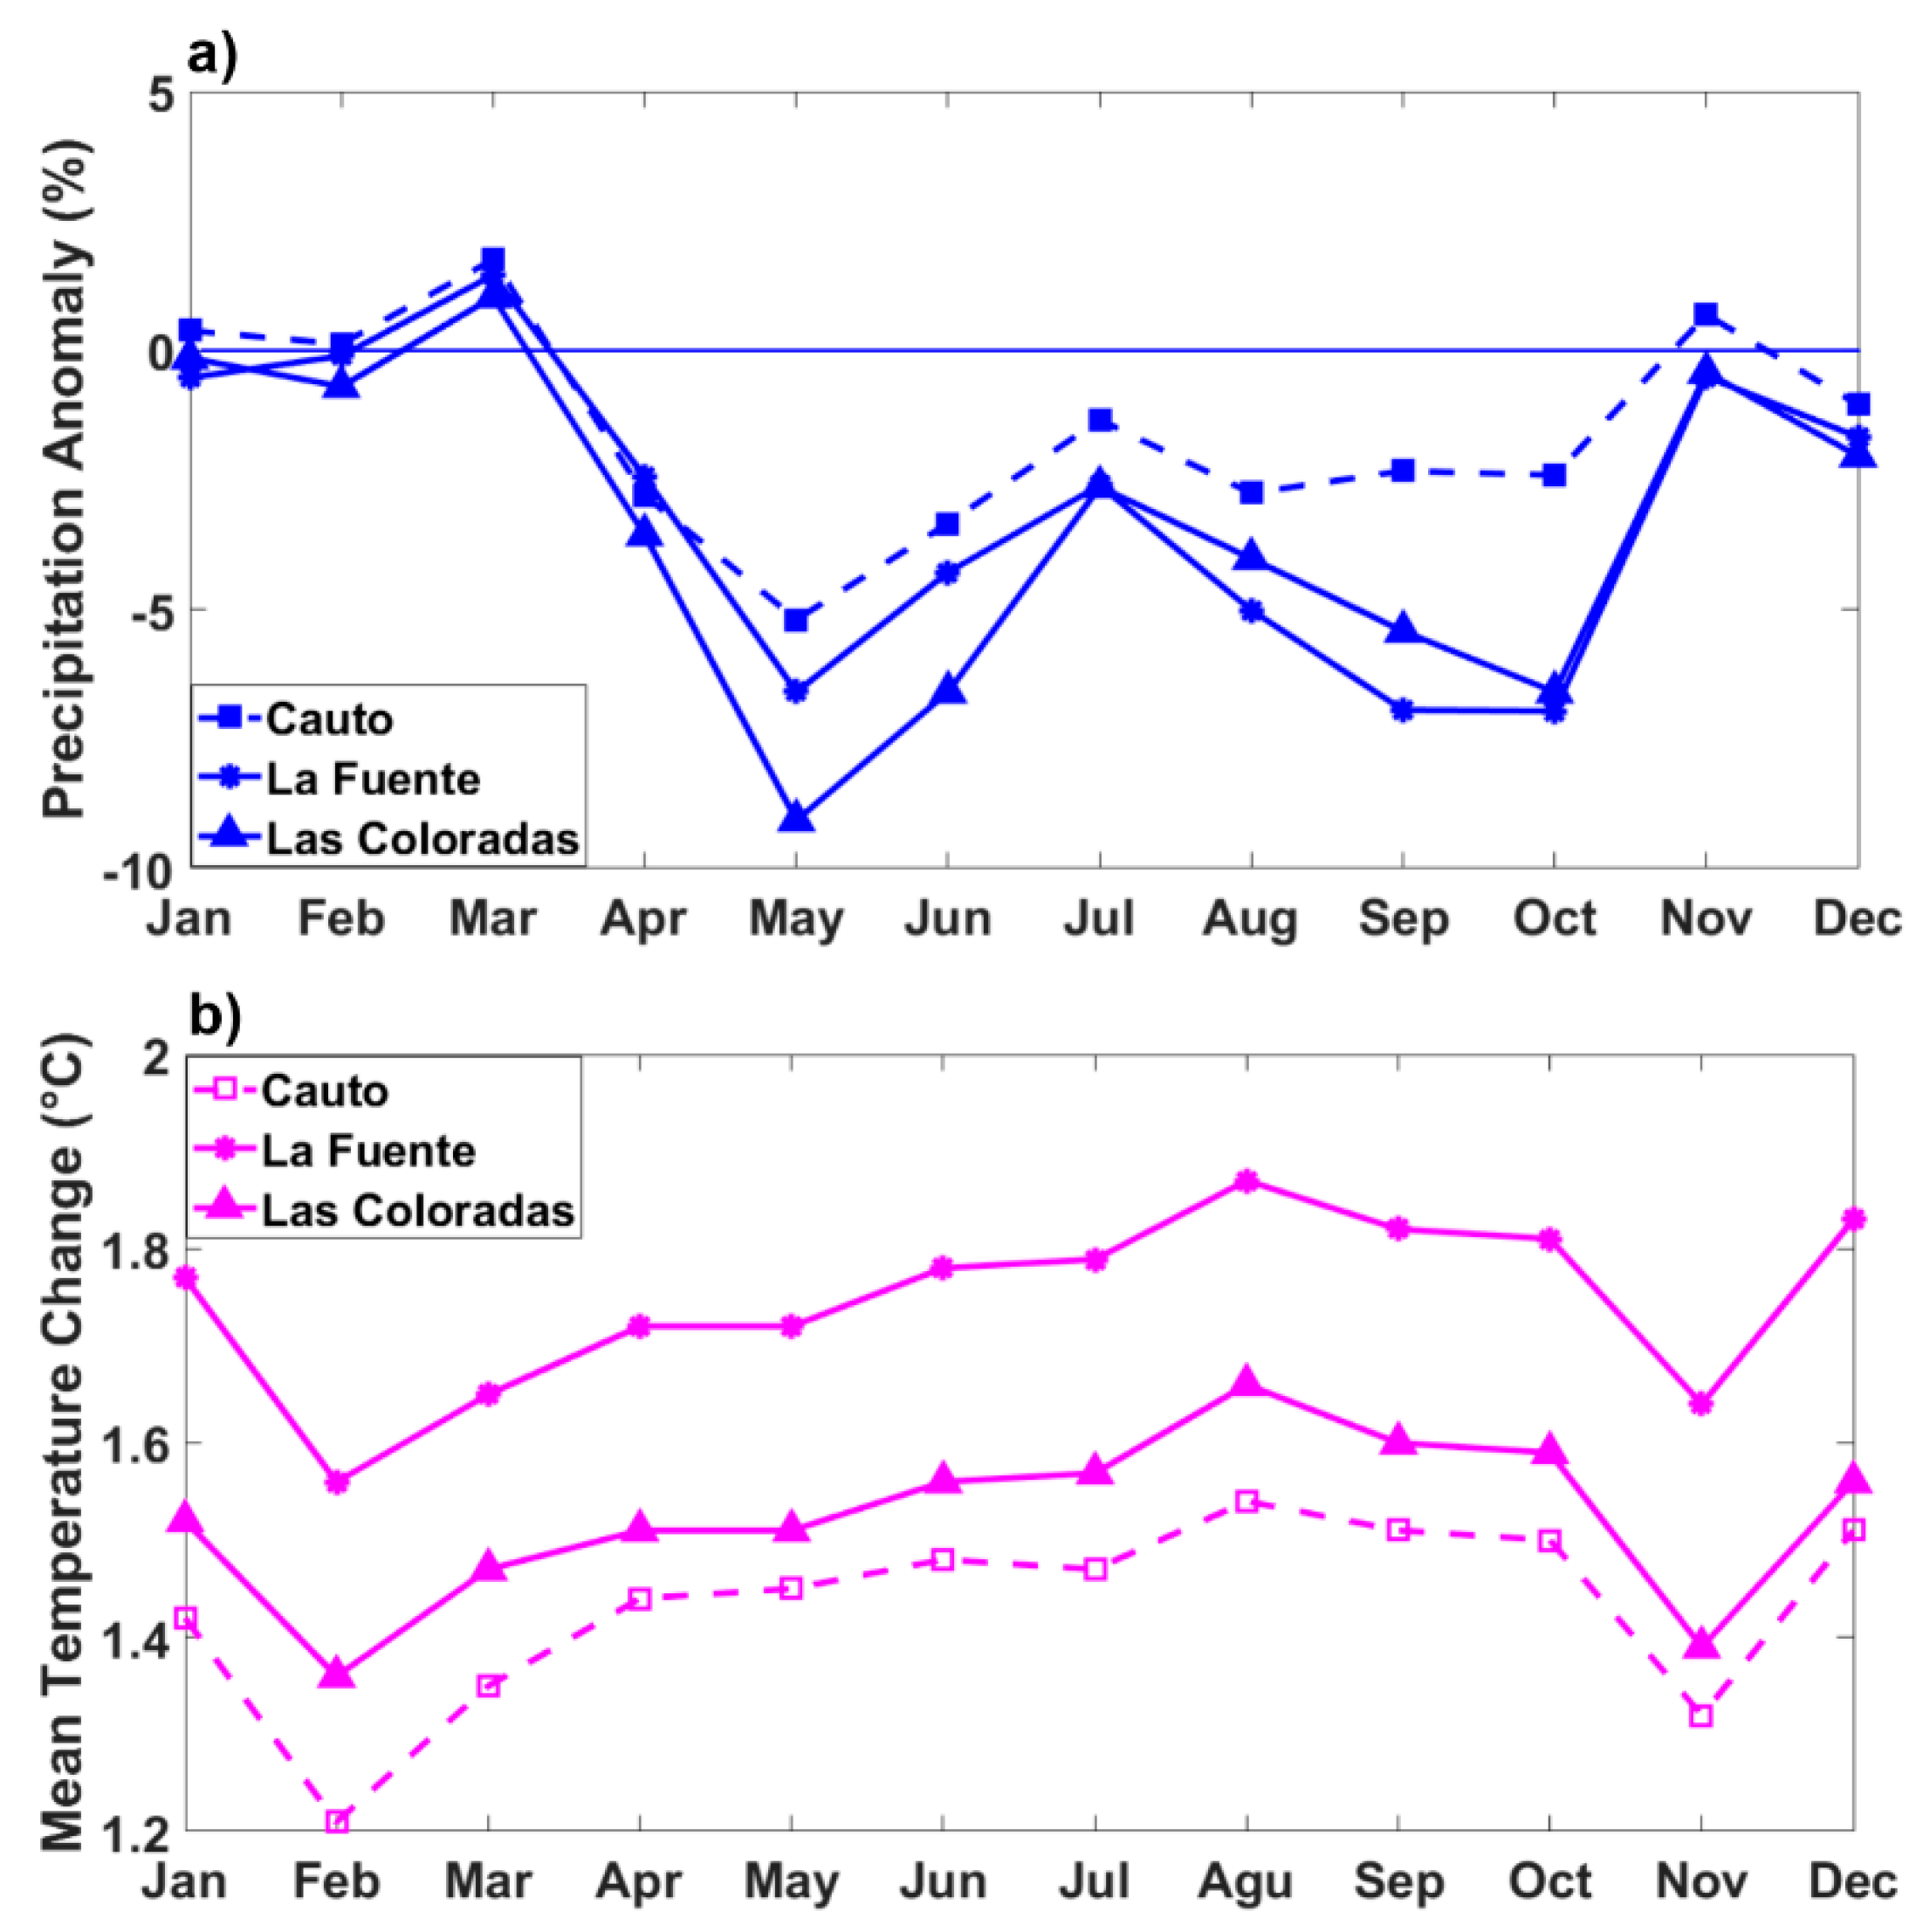
3.4. Impact of Climate Change on Hydrology
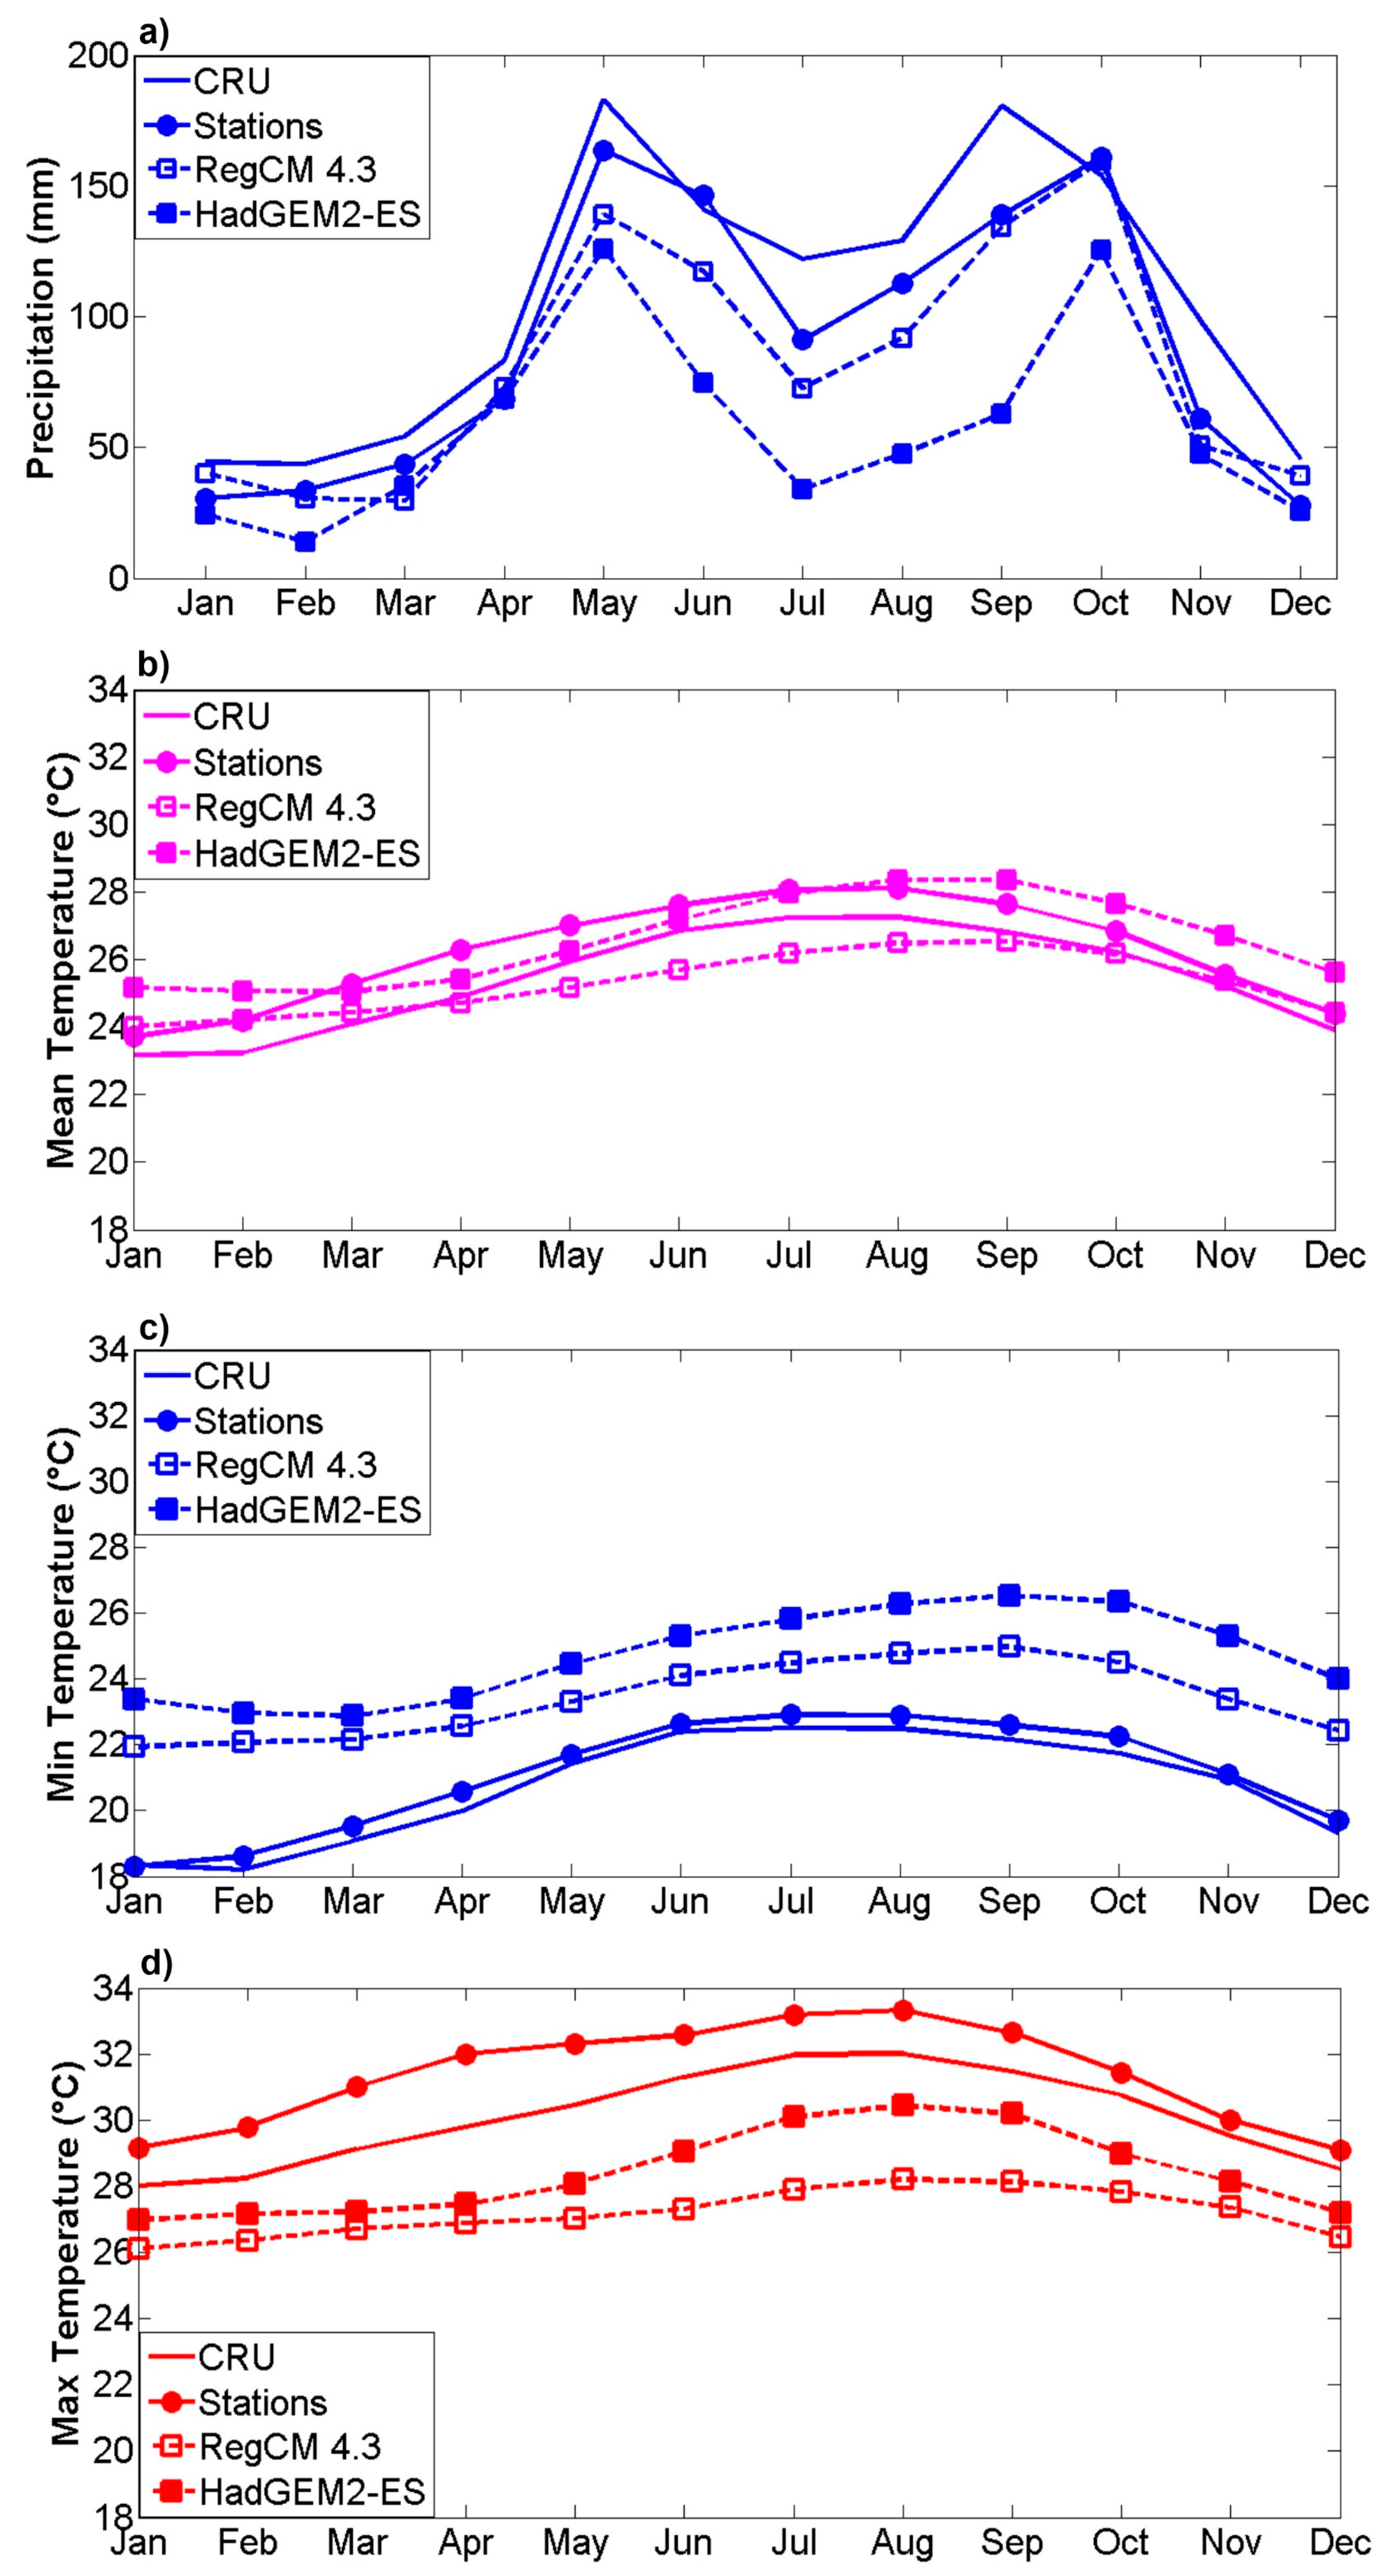
Figure 8 shows the future changes (2015–2039 relative to 1970–2000) of precipitation and temperature in the Cauto River basin and in the subbasins derived from RegCM4.3 under the most extreme climate scenario (RCP 8.5). The projections suggest a drier rainy season from May to October and a slight increase of precipitation in March, at the end of boreal winter. The future scenarios for temperature are all positive, but the increase is greater in summer than in winter (>1.4 °C), which could have significant effects on the total streamflow. The mean climate during 2015–2039 is projected to be drier (−18%) and warmer (+1.5 °C) relative to 1970–2000 (
Table 6). These results are consistent with prior studies that show a significant reduction of summer rainfall in the Caribbean region [
70,
71,
72] and in the Cauto River basin [
73]. The projected changes in winter precipitation are small and positive, which could be related to possible increases in the frequency and intensity of the ENSO-related events [
5,
6].
Table 6 also shows the projected changes of temperature and precipitation for 2070–2096 relative to 1970–2000 under the RCP 8.5 scenario in the Cauto river basin. These results suggest a significant increase of temperature (+3.3 °C) and a possible reduction in annual precipitation of −25%. The 21st century trends of temperature and precipitation in the region suggest potential negative impacts in the streamflow, as described below for the near future.
Table 7 shows the historical and future scenarios of the water balance components in the two subbasins. The annual precipitation may decrease between 36% and 41%, but RegCM4.3 showed 15% underestimation during the historical period with respect to the station data (
Figure 7a), and bias correction was not applied to precipitation before running SWAT. Under these considerations, future scenarios from SWAT for 2015–2039 suggest that the total flow (TotalQ) in La Fuente and Las Coloradas subbasins could be reduced by −53% and −61%, respectively (
Table 7). These results are consistent with other studies from the Caribbean region that project a reduction of streamflow during the wet season [
74]. These findings are also in line with Arnell [
75], who reported a similar behavior in other Caribbean islands.
Potential evapotranspiration (PET) increases slightly in the RCP 8.5 scenario associated with the mean temperature increase. Despite this increase in PET, AET decreases in La Fuente (−25%) and in Las Coloradas (−31%). Such a reduction is associated with lower soil water availability for evapotranspiration due to a reduction in precipitation (especially during summer,
Figure 9). However, the percentage of precipitation lost through AET is expected to increase in the future scenario (
Table 7). From this analysis, it is clear that decreases in the hydrological components are associated with the projected changes in precipitation (reduction) and temperature (increase). Other studies have also pointed out that hydrological components are especially sensitive to a decrease in precipitation and high temperatures [
76,
77].
Total aquifer recharge could also decrease up to −52% in La Fuente and −63% in Las Coloradas in 2015–2039 compared with the baseline period. Accordingly, groundwater flow contribution to streamflow is expected to decrease (71% in the La Fuente and 64% in Las Coloradas,
Table 7). The reduction of precipitation and the higher percentage of water loss via AET may explain this process.
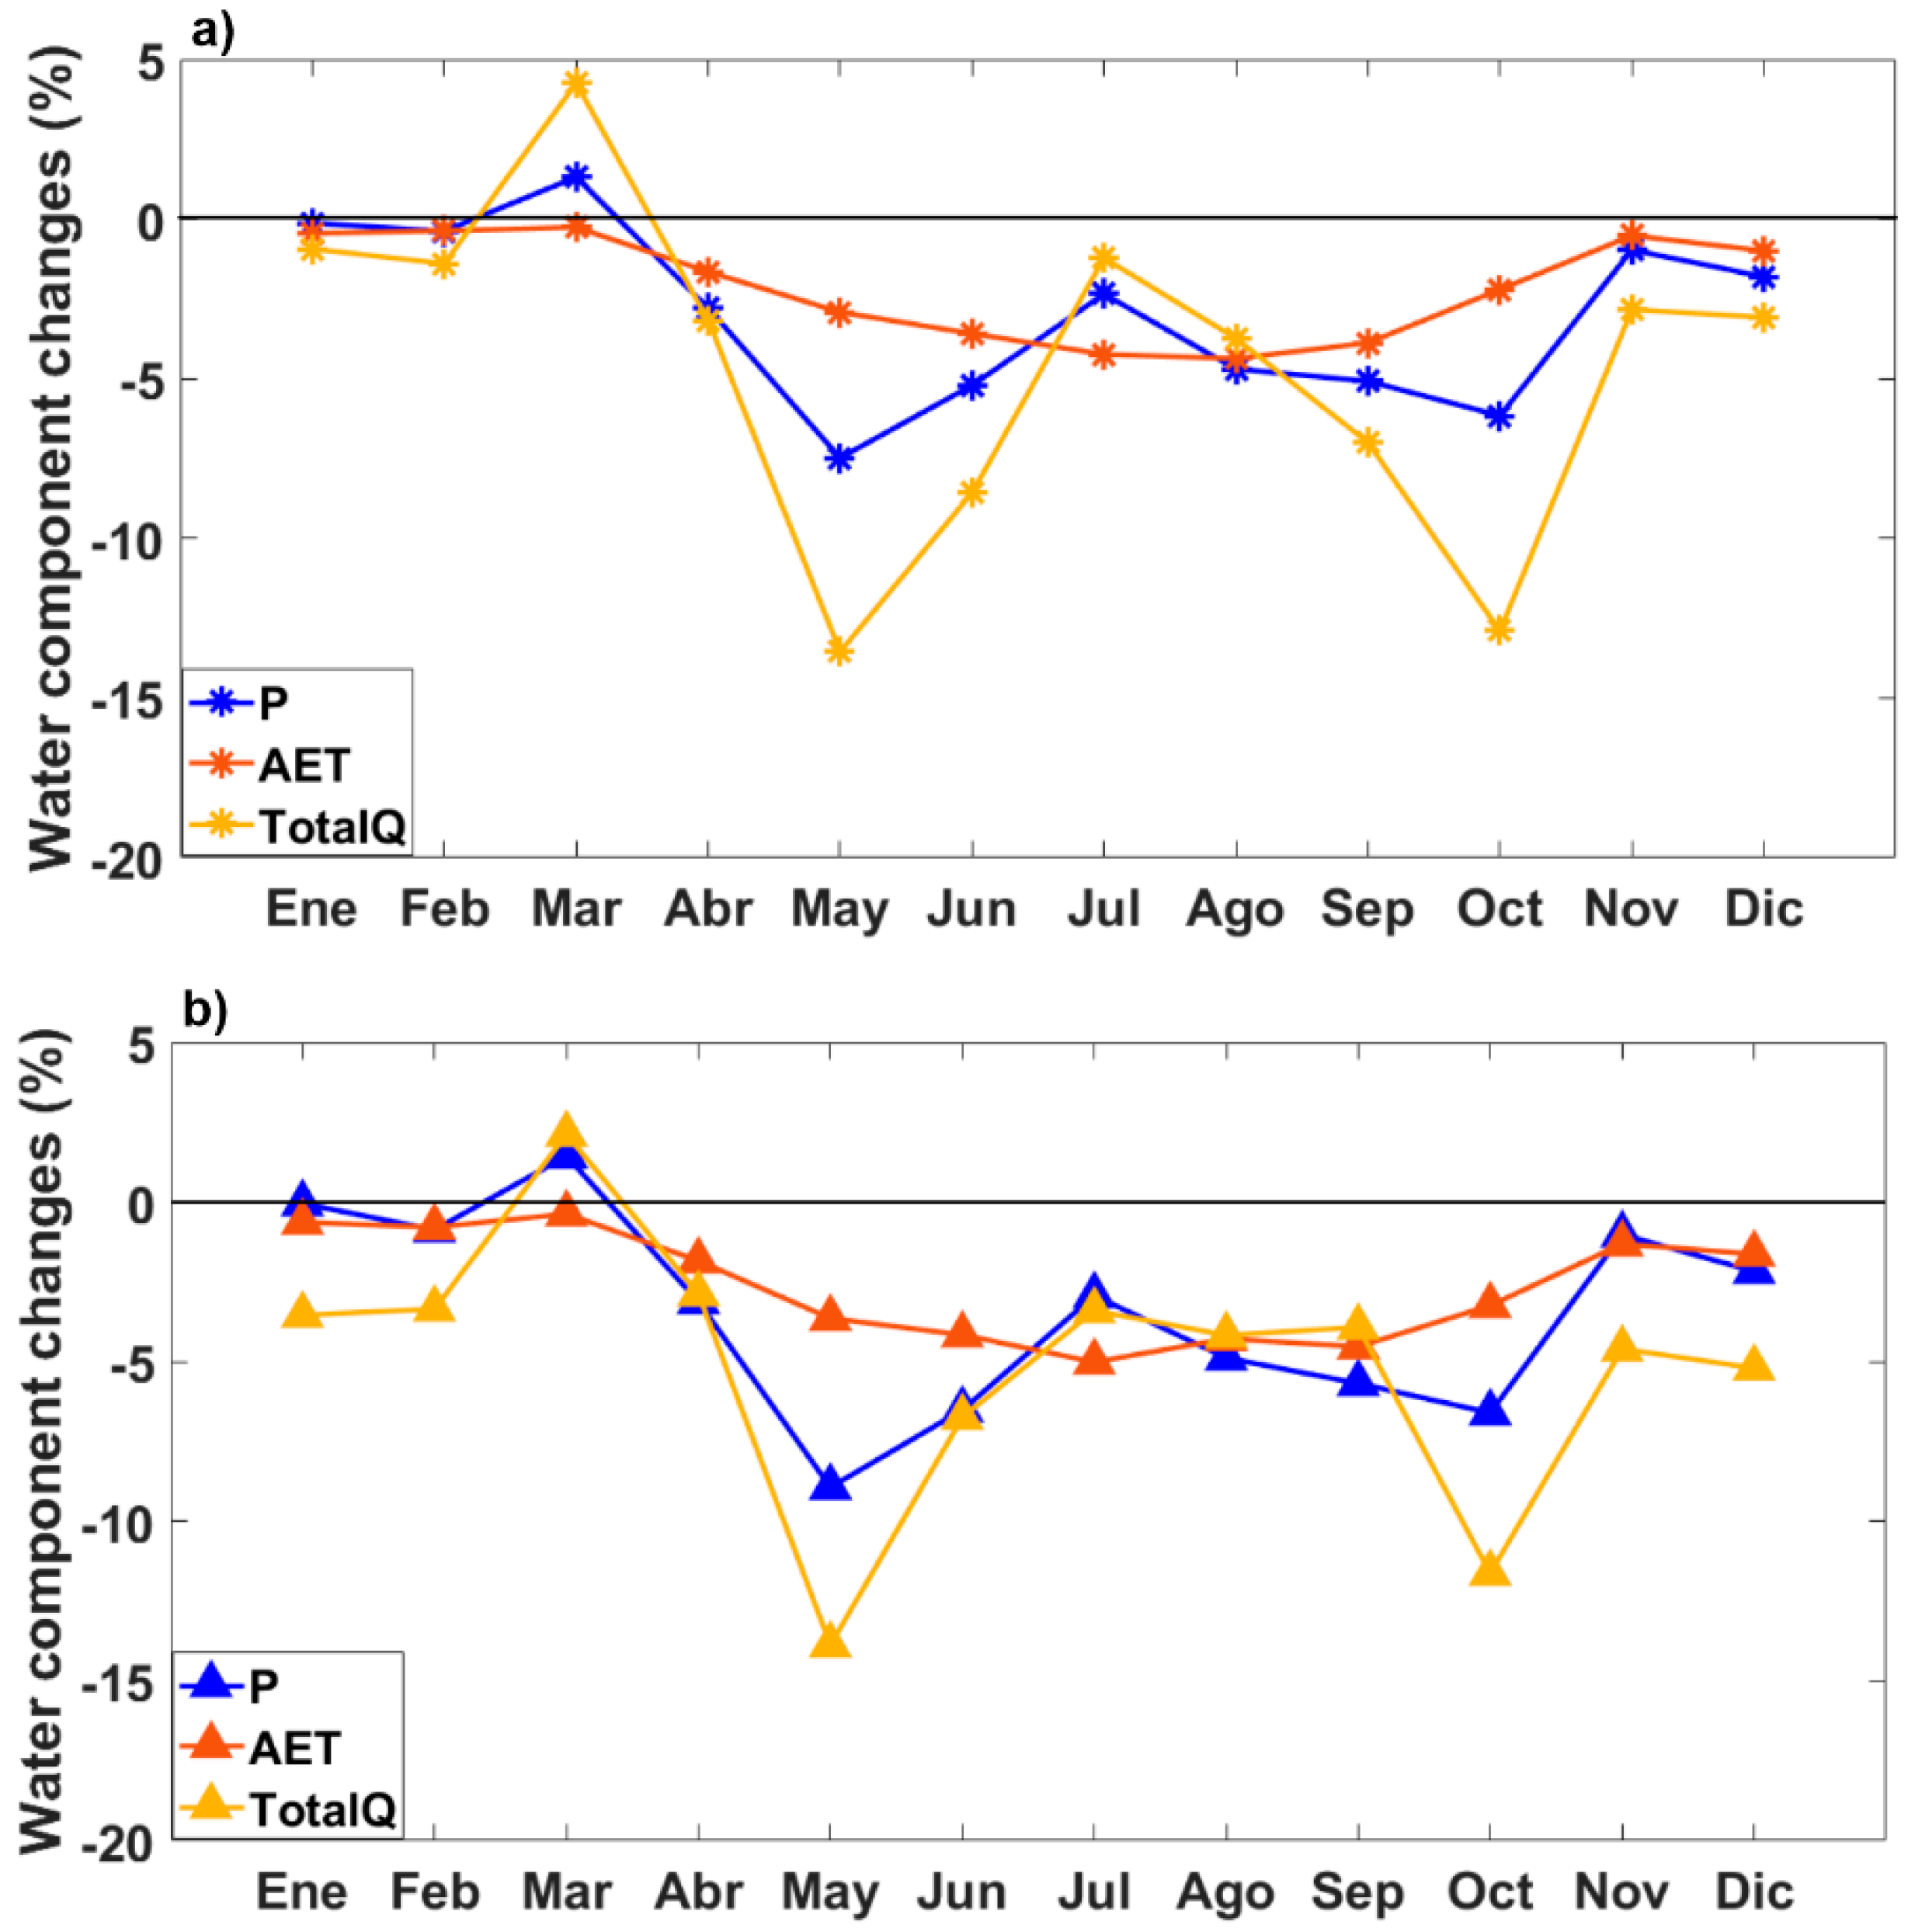
In the annual cycle, the projections of the water balance components show different seasonal responses (
Figure 9). The largest positive and negative changes are observed in the TotalQ component in the subbasins. This indicates the high sensitivity of surface runoff to changes in precipitation input, especially during the summer. An interesting observation from
Figure 9 is that evapotranspiration is less sensitive to precipitation, with a moderated set of changes in its behavior throughout the year. AET is especially reduced from spring to early autumn when P is expected to decrease. The reduction of P is more noticeable in the summer, consistent with the precipitation projections for the Caribbean [
70,
71]. This reduction and the increase of temperature could affect the aquifer recharge in the subbasins during the summer in the near future. In winter, the precipitation change is small, with a minor increase (decrease) in March (December). These changes would affect negatively the TotalQ, especially in May and October, as seen in
Figure 9.
3.5. Total Water Storage
Total water storage (TWS) obtained from the monthly water balance as TWS = P − (TotalQ + AET) is shown in
Figure 10 for the baseline period and the future scenario. The TWS equation is simple and has been used for various purposes [
78,
79]. In a recent paper, Thapa et al. [
80] demonstrated that basin-scale estimates of TWS with SWAT are successful. Their study focused on the use of three hydrological models (SWAT, HBV, and BTOPMC) to analyze the water balance components and their temporal and seasonal variations. SWAT was better than the other models, and it captured well the flow patterns in most of the seasons. For the Cauto River basin, TWS shows positive values during the rainy season (May–October) and negative ones during the dry season (
Figure 10). Negative storage is also observed in July during the MSD season. A generally good agreement was found between TWS and rainfall in the two subbasins. During the baseline period, TWS varied from +45 mm to −7 mm in the La Fuente subbasin, while in Las Coloradas, TWS varied from +57 mm to −26 mm. This implies that La Fuente subbasin is able to store slightly more water in the rainy season, which is then used during the dry season, whereas the faster runoff response in Las Coloradas impedes a larger storage in the rainy season and releases less during the dry periods.
In the near future, the annual cycle of TWS is similar to the baseline period, but it is lower during the summer (
Figure 10a,b); a positive value in early winter (January, February, and March) is seen in both subbasins. This behavior in storage could be related to the projected significant decrease of precipitation during the summer and a slight increase of precipitation during boreal winter (
Figure 8). On average, annual TWS could fluctuate in the future from +30 mm to −2 mm in La Fuente and from +35 mm to −12 mm in Las Coloradas subbasin. TWS data provides an important source of information for the hydrological cycle simulation in the subbasins and may give a rough estimate of the hydrologic variables for the future. However, these scenarios should be taken with caution, because they are based on a single RCM; moreover, RegCM4.3 has its own uncertainties based on the historical biases in the basin described in
Section 3.3. Thus, these scenarios represent a possible future, and the methodology serves as a guidance for future hydro-climatic studies in the region.

 ,
, 


