Article

Salinity and Marine Mammal Dynamics in Barataria Basin: Historic Patterns and Modeled Diversion Scenarios

The Water Institute of the Gulf, 1110 River Road S., Baton Rouge, LA 70802, USA
*
Author to whom correspondence should be addressed.
Water 2018, 10(8), 1015; https://doi.org/10.3390/w10081015
Submission received: 22 May 2018 / Revised: 7 July 2018 / Accepted: 24 July 2018 / Published: 31 July 2018

Abstract

:
Understanding spatiotemporal patterns of salinity in Barataria Basin in coastal Louisiana is important to better understand and manage operations of existing and proposed freshwater and sediment diversions from the Mississippi River into the estuary. In this study, a comprehensive salinity dataset was compiled which covered the entire basin and included data from 1990 through 2015. The data were aggregated into daily mean salinity timeseries across Barataria Basin at a variety of spatial scales and used to analyze historic patterns. Simulations were conducted with two hydrodynamic models, the Integrated Compartment Model (ICM) and Delft3D. The Delft3D model output was overlaid with observed geo-tagged locations of bottlenose dolphins that were sampled from the southwest quadrant of the basin. The ICM simulations were used to assess the impact of existing freshwater and proposed sediment diversion projects which reintroduce riverine water into the estuary. The salinity in the uppermost portions of the basin is sensitive primarily to the existing freshwater diversion, whereas additional flows from a proposed sediment diversion result in additional freshening. The lowermost region of the basin is most sensitive to the proposed sediment diversion; however, the magnitude varies by diverted flow volumes and assumed sea levels in the Gulf of Mexico.

1. Introduction

Barataria Basin is an estuary located west of the Mississippi River delta, which is wetland dominated (Figure 1). The area of the basin is approximately 6300 km2 [1] and is 120 km long with the southern portion being tidally influenced [2]. The basin contains 1791 km2 of water [3], and the most prominent water bodies are Barataria Bay, Caminada Bay, Hackberry Bay, Little Lake, Lake Salvador, Lake Cataouatche, and Lac des Allemandes (listed from most Gulfward to most upstream). Salinity is a defining characteristic of an ecosystem like Barataria Basin, which is impacted by a variety of factors including upstream watersheds, weather patterns and tides [1,4]. Human impacts have caused a variety of changes to salinity throughout the basin with levees reducing fresh water input and canals allowing for added saltwater intrusion [4,5]. Land loss through direct and indirect human action is drastically changing the structure of the basin and in turn the salinity [5,6]. Restoration projects such as current and proposed diversions will reintroduce fresh water into the basin, pushing the saline water further south while maintaining and growing land areas [1,5]. Inoue et al. [1] found that the mid-basin region with the steepest salinity gradients was impacted the most by diversions.
Historical salinity data in Barataria Basin was compiled from 1990–2015. This was collected from a range of institutions including Coastwide Reference Monitoring System (CRMS), U.S. Geological Survey (USGS), Louisiana Department of Environmental Quality (LDEQ), and Louisiana Department of Wildlife and Fisheries (LDWF). This data was compiled and analyzed to better assess historic trends of salinity.
To supplement observational data, numerical simulations of hydrologic and salinity conditions within Barataria Basin have been conducted, which can provide additional insights and allow researchers and coastal managers to gain a fuller understanding of temporal and spatial salinity patterns. While no numerical simulation is divorced from model error and an array of uncertainties, observational data contains intrinsic errors, spatial variability, and uncertainty as well [7], which can be further magnified by mismatches between the respective spatial scales of observational and model-derived data.
These salinity models are important for understanding basin dynamics, but more importantly, can be used to interpret impacts within the basin under a future in which the large-scale hydrologic and habitat restoration projects proposed in the state of Louisiana’s Coastal Master Plan (CMP) are constructed. The CMP, a habitat restoration and flood risk-reduction plan, was assessed via a suite of models which simulate many estuarine processes, of which salinity is one of the primary drivers for simulated marsh plant communities and predicted habitat suitability for a variety of fish and shellfish. For this study, observational salinity data was compiled and analyzed to assess long-term salinity trends measured in Barataria Basin and to quantify periodic freshening in which salinity levels throughout the basin are depressed and remain low for extended periods of time.
While individual fish and wetland vegetation species currently included in restoration planning models [8,9,10] respond to a variety of salinity dynamics, a single salinity concentration threshold of 8 ng/kg (1 ng of dissolved salinity per 1 kg of water is equivalent to one part per thousand, or ppt, a traditional measurement of salinity concentration) was used here due to it corresponding reasonably well with the salinity preferences of bottlenose dolphins [3], a species not included in the aforementioned restoration models. This study will focus on developing a means to compare both observed and modeled salinity dynamics (relative to the 8 ng/kg threshold) to observed locations of bottlenose dolphins in Barataria Basin. The 8 ng/kg threshold concluded by Hornsby et al. [3] was based on telemetry data collected by Wells et al. [11], which was specifically designed to evaluate impacts of the 2010 BP oil spill on the animals and not structured to link and understand the animal behavior/movement relative to the salinity regime. The tagging was done in the same region of Barataria Basin as other research [12,13,14,15] and shows the behavior of the animals tagged, but all may have excluded dolphins in south eastern and/or northern parts of the basin.
The method outlined will provide a hybrid approach between direct modeling of fishery response to salinity stressors driven by restoration and diversion projects [8,9,16,17], general habitat (e.g., not fishery-specific) modeling [10,18,19] and observational studies focused on either habitat or species-level response to controlled field experiments [20,21,22,23,24].
The future health and resilience of estuarine systems is a complex ecological issue dependent on many environmental drivers which can include access to intermittent freshwater sources, nutrient availability and salinity intrusion [25]. Freshwater diversions have been used in several estuarine systems to restore proper salinity and nutrient dynamics to impaired ecosystems [26,27] and have been proposed as viable restoration projects in coastal Louisiana for several decades [28]. Relatively recent implementation of hydrologic restoration projects in the past 20 years (e.g., the Davis Pond and Caernarvon fresh water diversion projects) and advances in computational resources have resulted in numerous observational and numerical studies which have examined the potential impacts and efficacy of these proposed diversions in restoring the Barataria Basin and other Louisiana estuaries to prevent further degradation and, in some cases, restore the estuaries to a more natural (e.g., pre-degradation) state [1,2,9,16,17,19,22]. These previous studies in coastal Louisiana largely focus either solely on the hydrodynamics of the proposed freshwater diversions or simulate low trophic level species or the entire foodweb. This study will instead model the hydrodynamics and assess the salinity dynamics of Barataria Basin with respect to observed marine mammal movements (e.g., bottlenose dolphins). While this is not a process-based mammalian model, this study will aim to develop an approximate correlative approach to assess potential dolphin habitat in Barataria Basin with salinity thresholds under scenarios with and without freshwater and sediment diversions.
A single salinity threshold is likely inadequate in fully assessing the impact of fresh water pulsing on the Barataria Basin estuary, and a holistic analysis will require an interdisciplinary approach including at a minimum: hydrologists, engineers, biologists and ecologists. The aim of this analysis, however, is to demonstrate the model capabilities and accuracies, and to assess the sensitivity of salinity in Barataria Basin to an array of historic and future hydrologic conditions in the Mississippi River and Barataria Basin and place it in a context with respect to existing fresh water diversions currently impacting Barataria Basin as well as proposed restoration projects currently in the engineering design and permitting process.

2. Materials and Methods

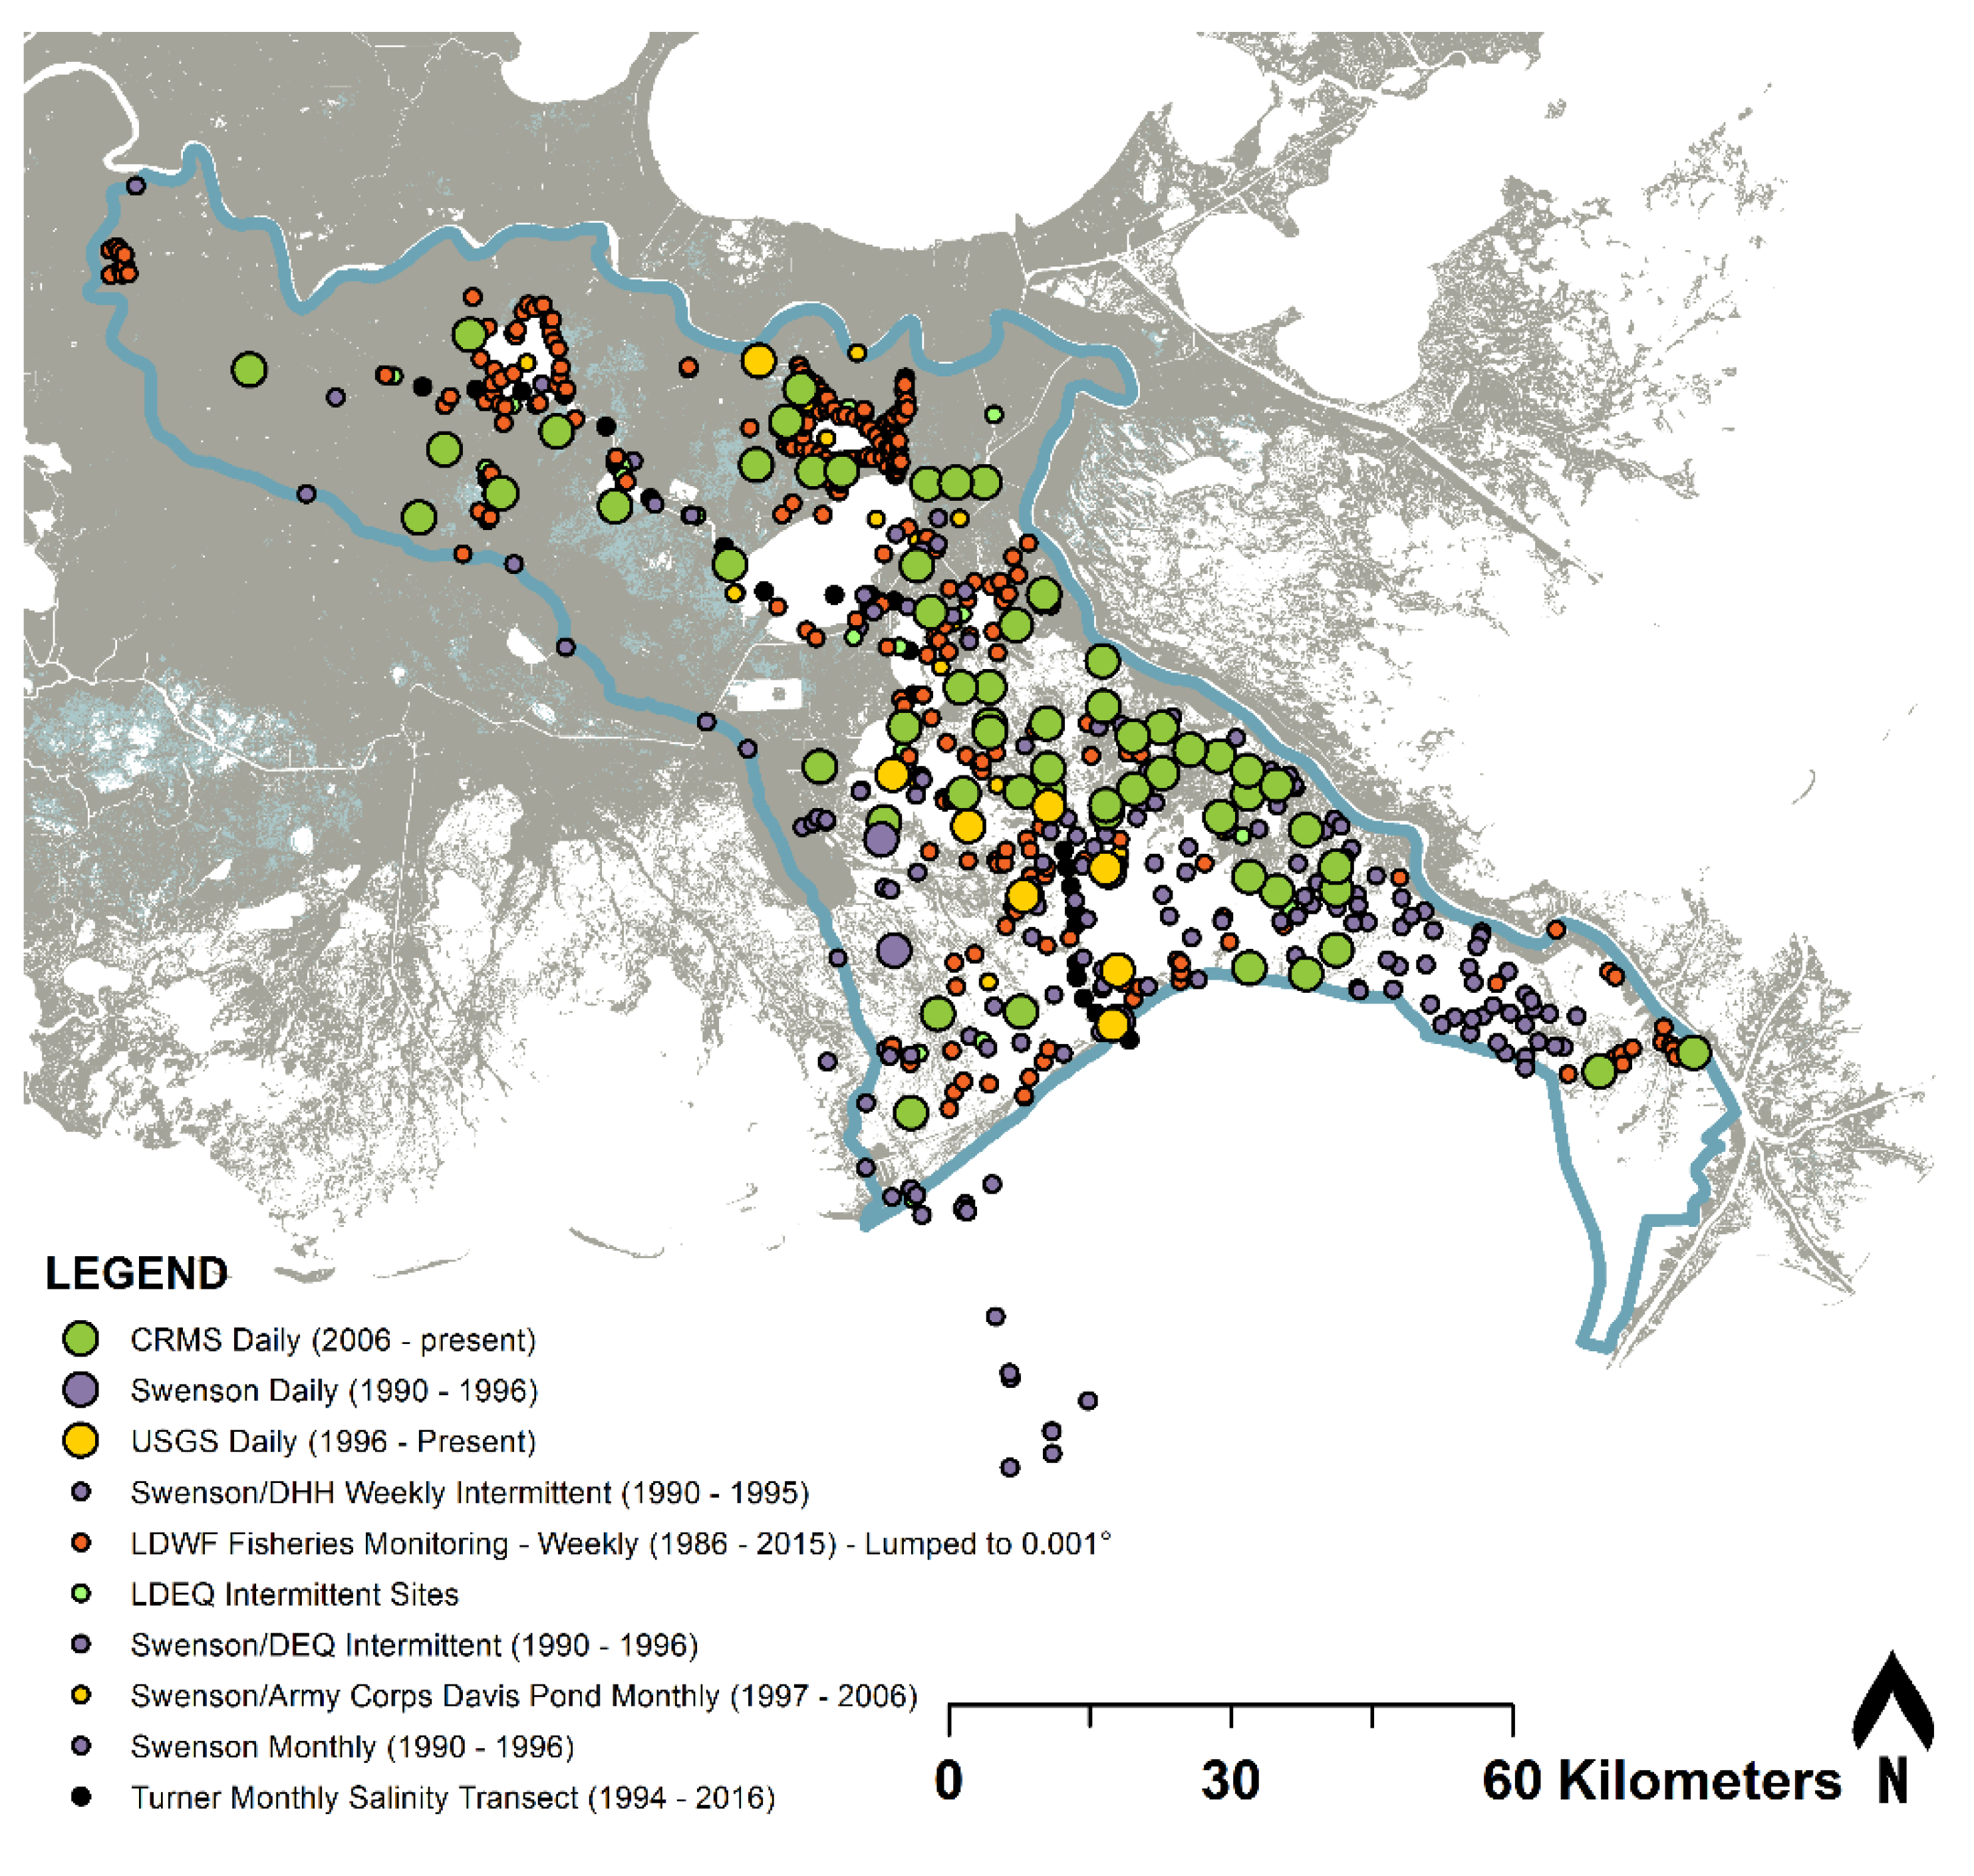
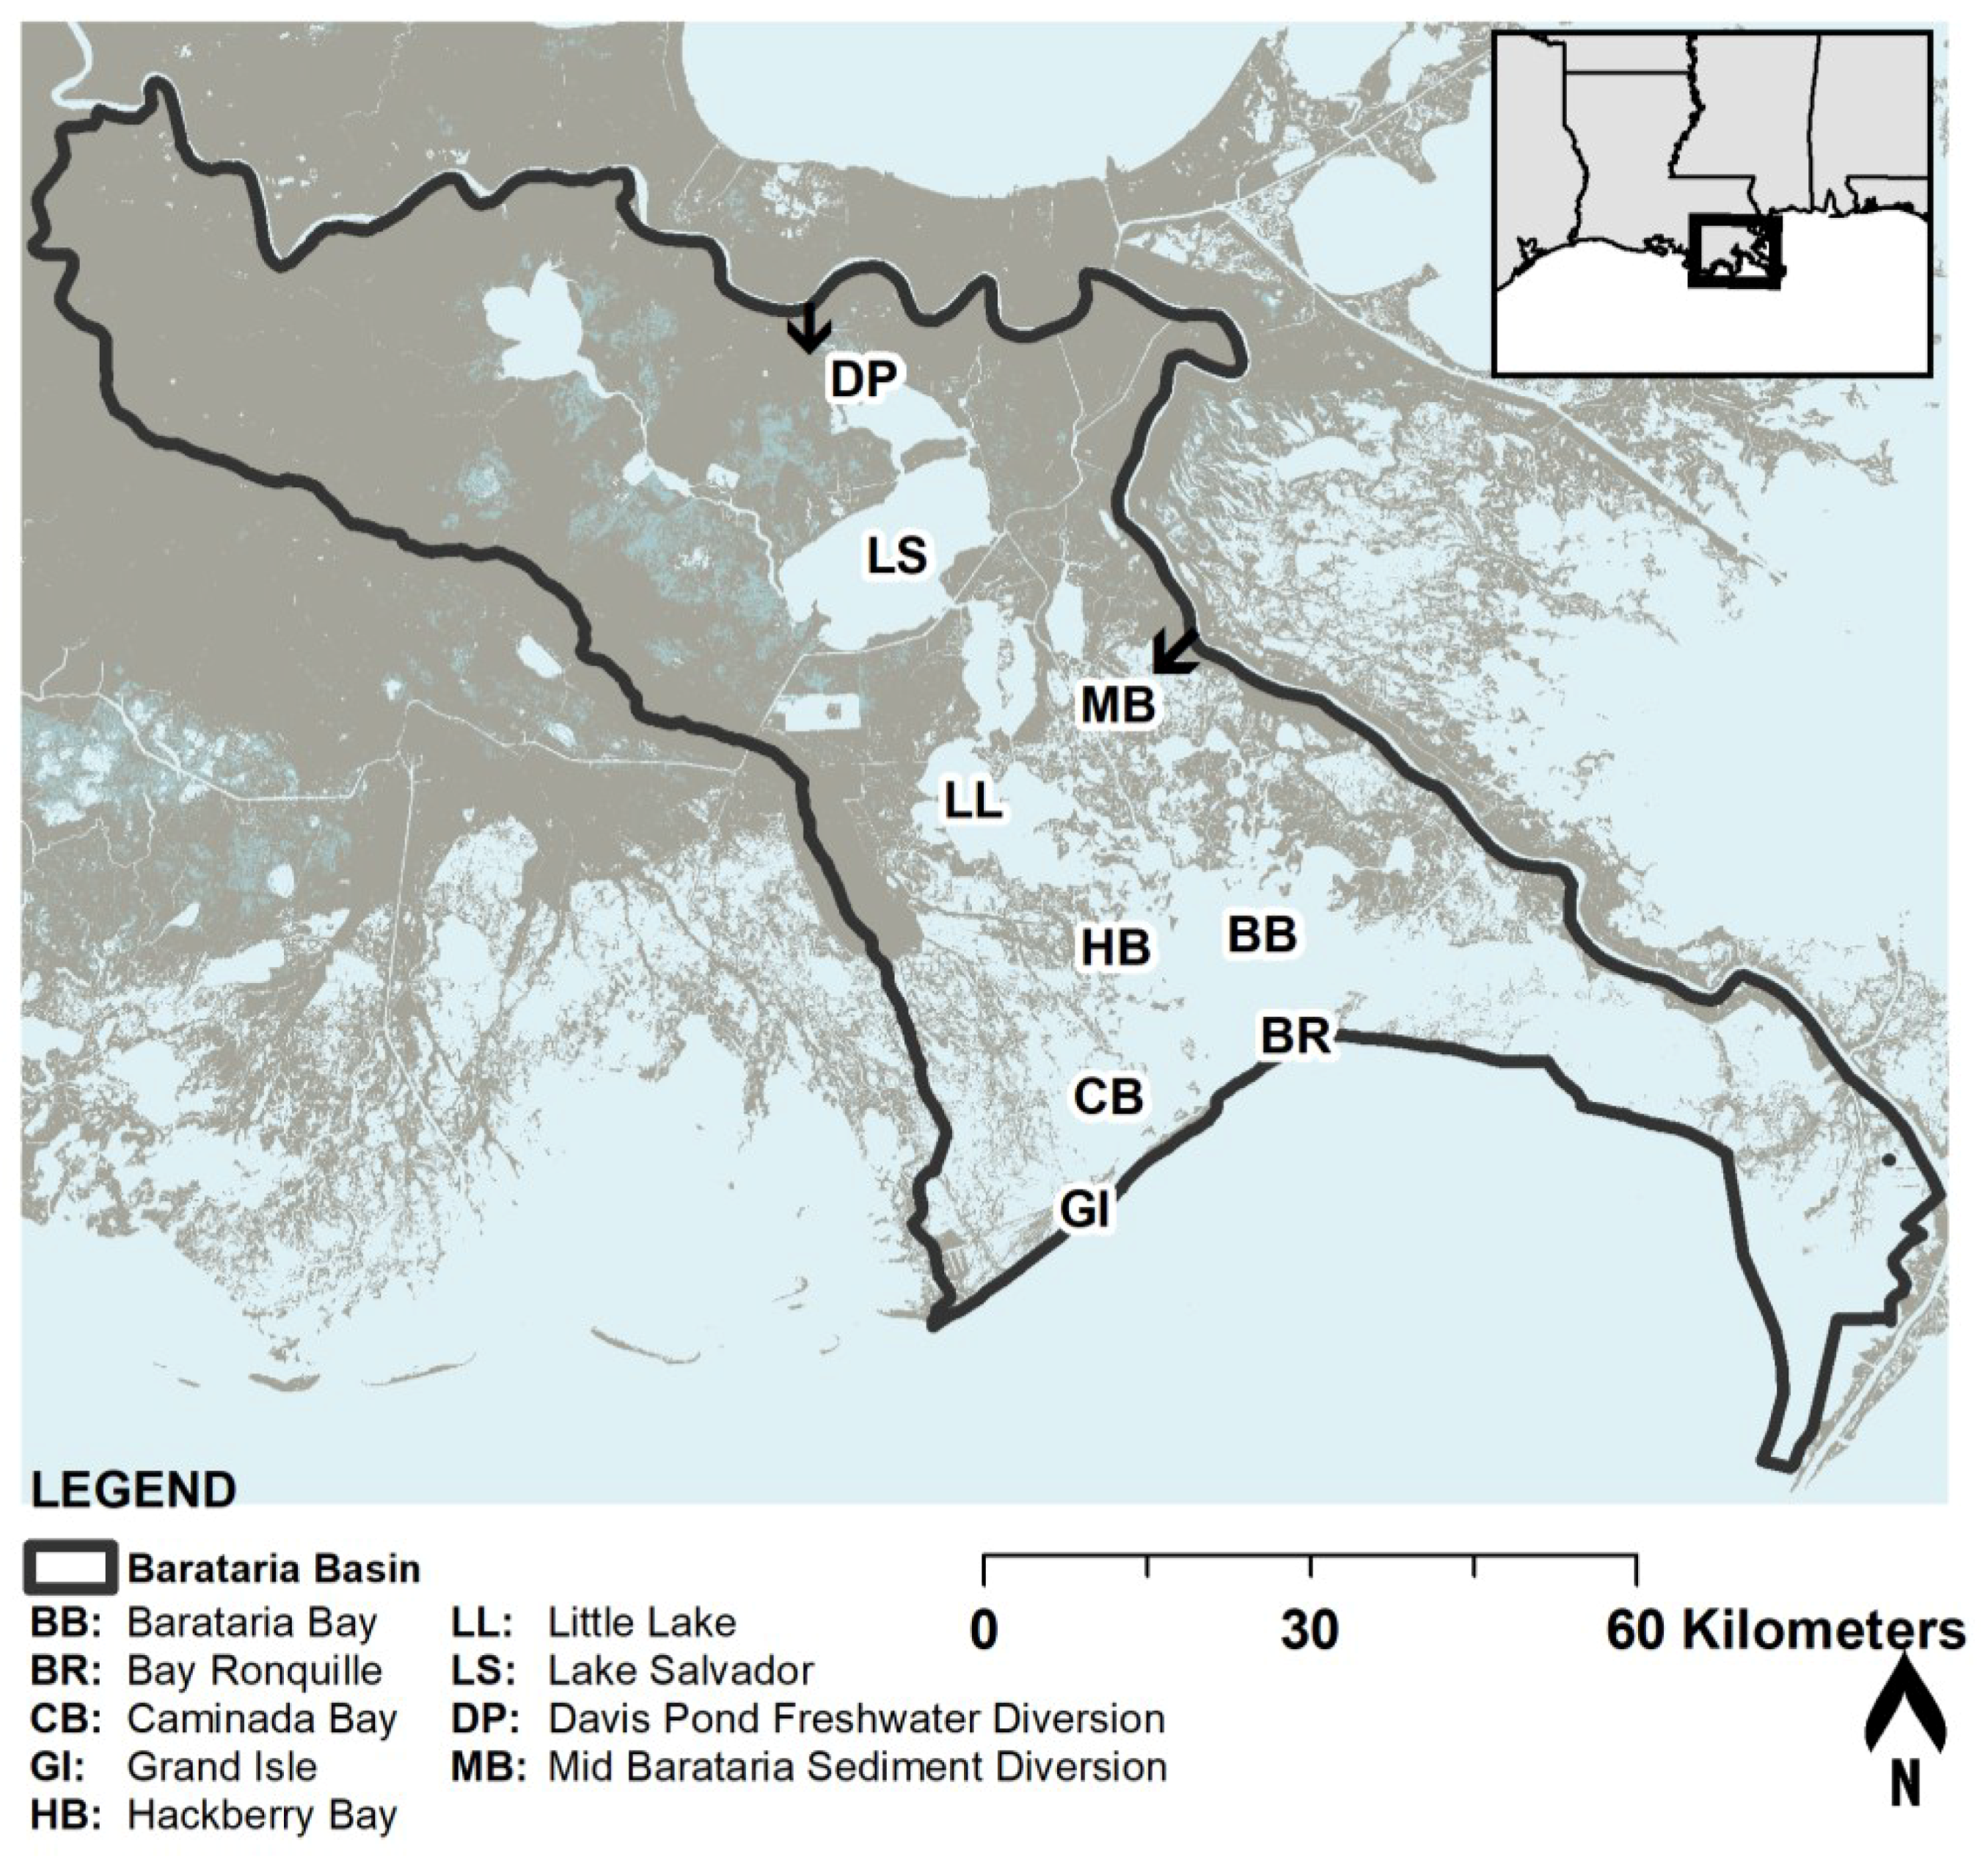
2.1. Historic Salinity Data

The historic salinity data was collected from a variety of stations in Barataria Basin. Any sampling frequency was incorporated in the collection ranging from daily, to weekly, to monthly, to a few times per year. The agencies where the data was collected and respective temporal coverage included: LDEQ (1990–2015), USGS (1996–2015), CRMS (2006–2015), Louisiana Department of Wildlife and Fisheries (LDWF) fish sampling (1990–2015). The LDEQ, USGS, and CRMS data sources were all publicly available data and were downloaded from respective agency websites. Additional data was provided through professors Erick Swenson and Gene Turner at Louisiana State University [29] which included: Louisiana Offshore Port Services (LOOP) (1990–1996), United States Army Corps of Engineers (USACE) (1997–2006), Department of Health and Hospitals (DHH) (1990–1996), LDWF stations (1990–1996) and Turner Transect (1994–2016). Except for the LDWF fish sampling data, the location of each sample point remained unchanged throughout each dataset; each data point collected for the LDWF fish sampling data (which was provided by the Louisiana Coastal Protection and Restoration Authority, CPRA) varied in location depending upon where the boat-based fish sampling was conducted. Therefore, the thousands of fish sample data collection locations were aggregated into points to the nearest 0.001 degree of latitude and longitude, a spatial resolution of approximately 100 m. Each sampling location included in this analysis is shown in Figure 2.
The only daily stations from 1990 to 1996 were LDWF stations. In 1996, two daily USGS stations started and that number expanded as the years went on. Daily CRMS monitoring kicked off in 2006 and grew to what it is today over the next few years. Some data were variable in collection frequency depending on the time of year, ranging from weekly to monthly. This included the DHH data and the LDWF fish monitoring. Monthly data sets included the LOOP data, the Turner Transect and the USACE sites. The data set that was the least frequent was the LDEQ data where individual stations were more often than annual, but less than monthly.
The monitoring locations with continuous (e.g., daily) data available, the largest dots in Figure 2, were analyzed to assess spatial patterns in long-term mean salinities, as well cycles of periodic freshening. Periodic freshening in Barataria Basin, was defined as the number of days in a year where the salinity concentration was below a defined threshold concentration and remained below it for two consecutive days and five consecutive days. Looking at both the long-term trends and periodic freshening is essential to differentiating areas that remain fairly consistent in salinity and areas that fluctuate due to either weather or river effects. This baseline information is also extremely important to compare to the various model runs, especially where hydrologic restoration and diversion projects are simulated.
In addition to this analysis of continuous data, the weekly, monthly, and intermittent data was also included by developing a daily time series of all data averaged across different regions. The first step in this spatial averaging was to aggregate all salinity observations for a given day into regional means, where the region was first defined by the model node boundaries used in the hydrologic subroutine of the 2017 Louisiana CMP models [30]. These model nodes vary in size but have an average area of 36 km2 in Barataria Basin downstream of the Gulf Intracoastal Waterway (GIWW) (these model compartments/nodes can be seen in the Results section of this report). After developing a time series for each model compartment/node, the daily mean values were further aggregated into 12 zones across Barataria Basin. The zones used for calculating mean daily salinity values were selected from the boundaries of the hydrologic compartments, which were originally delineated following natural hydrologic pathways and constrictions. Compartments were grouped into regions from the upper most portions of the basin to just Gulfward of the barrier islands. The Barataria Waterway navigation channel was chosen as an east-west divider; the twelve zones are listed in Table 1 and shown in Figure 3.

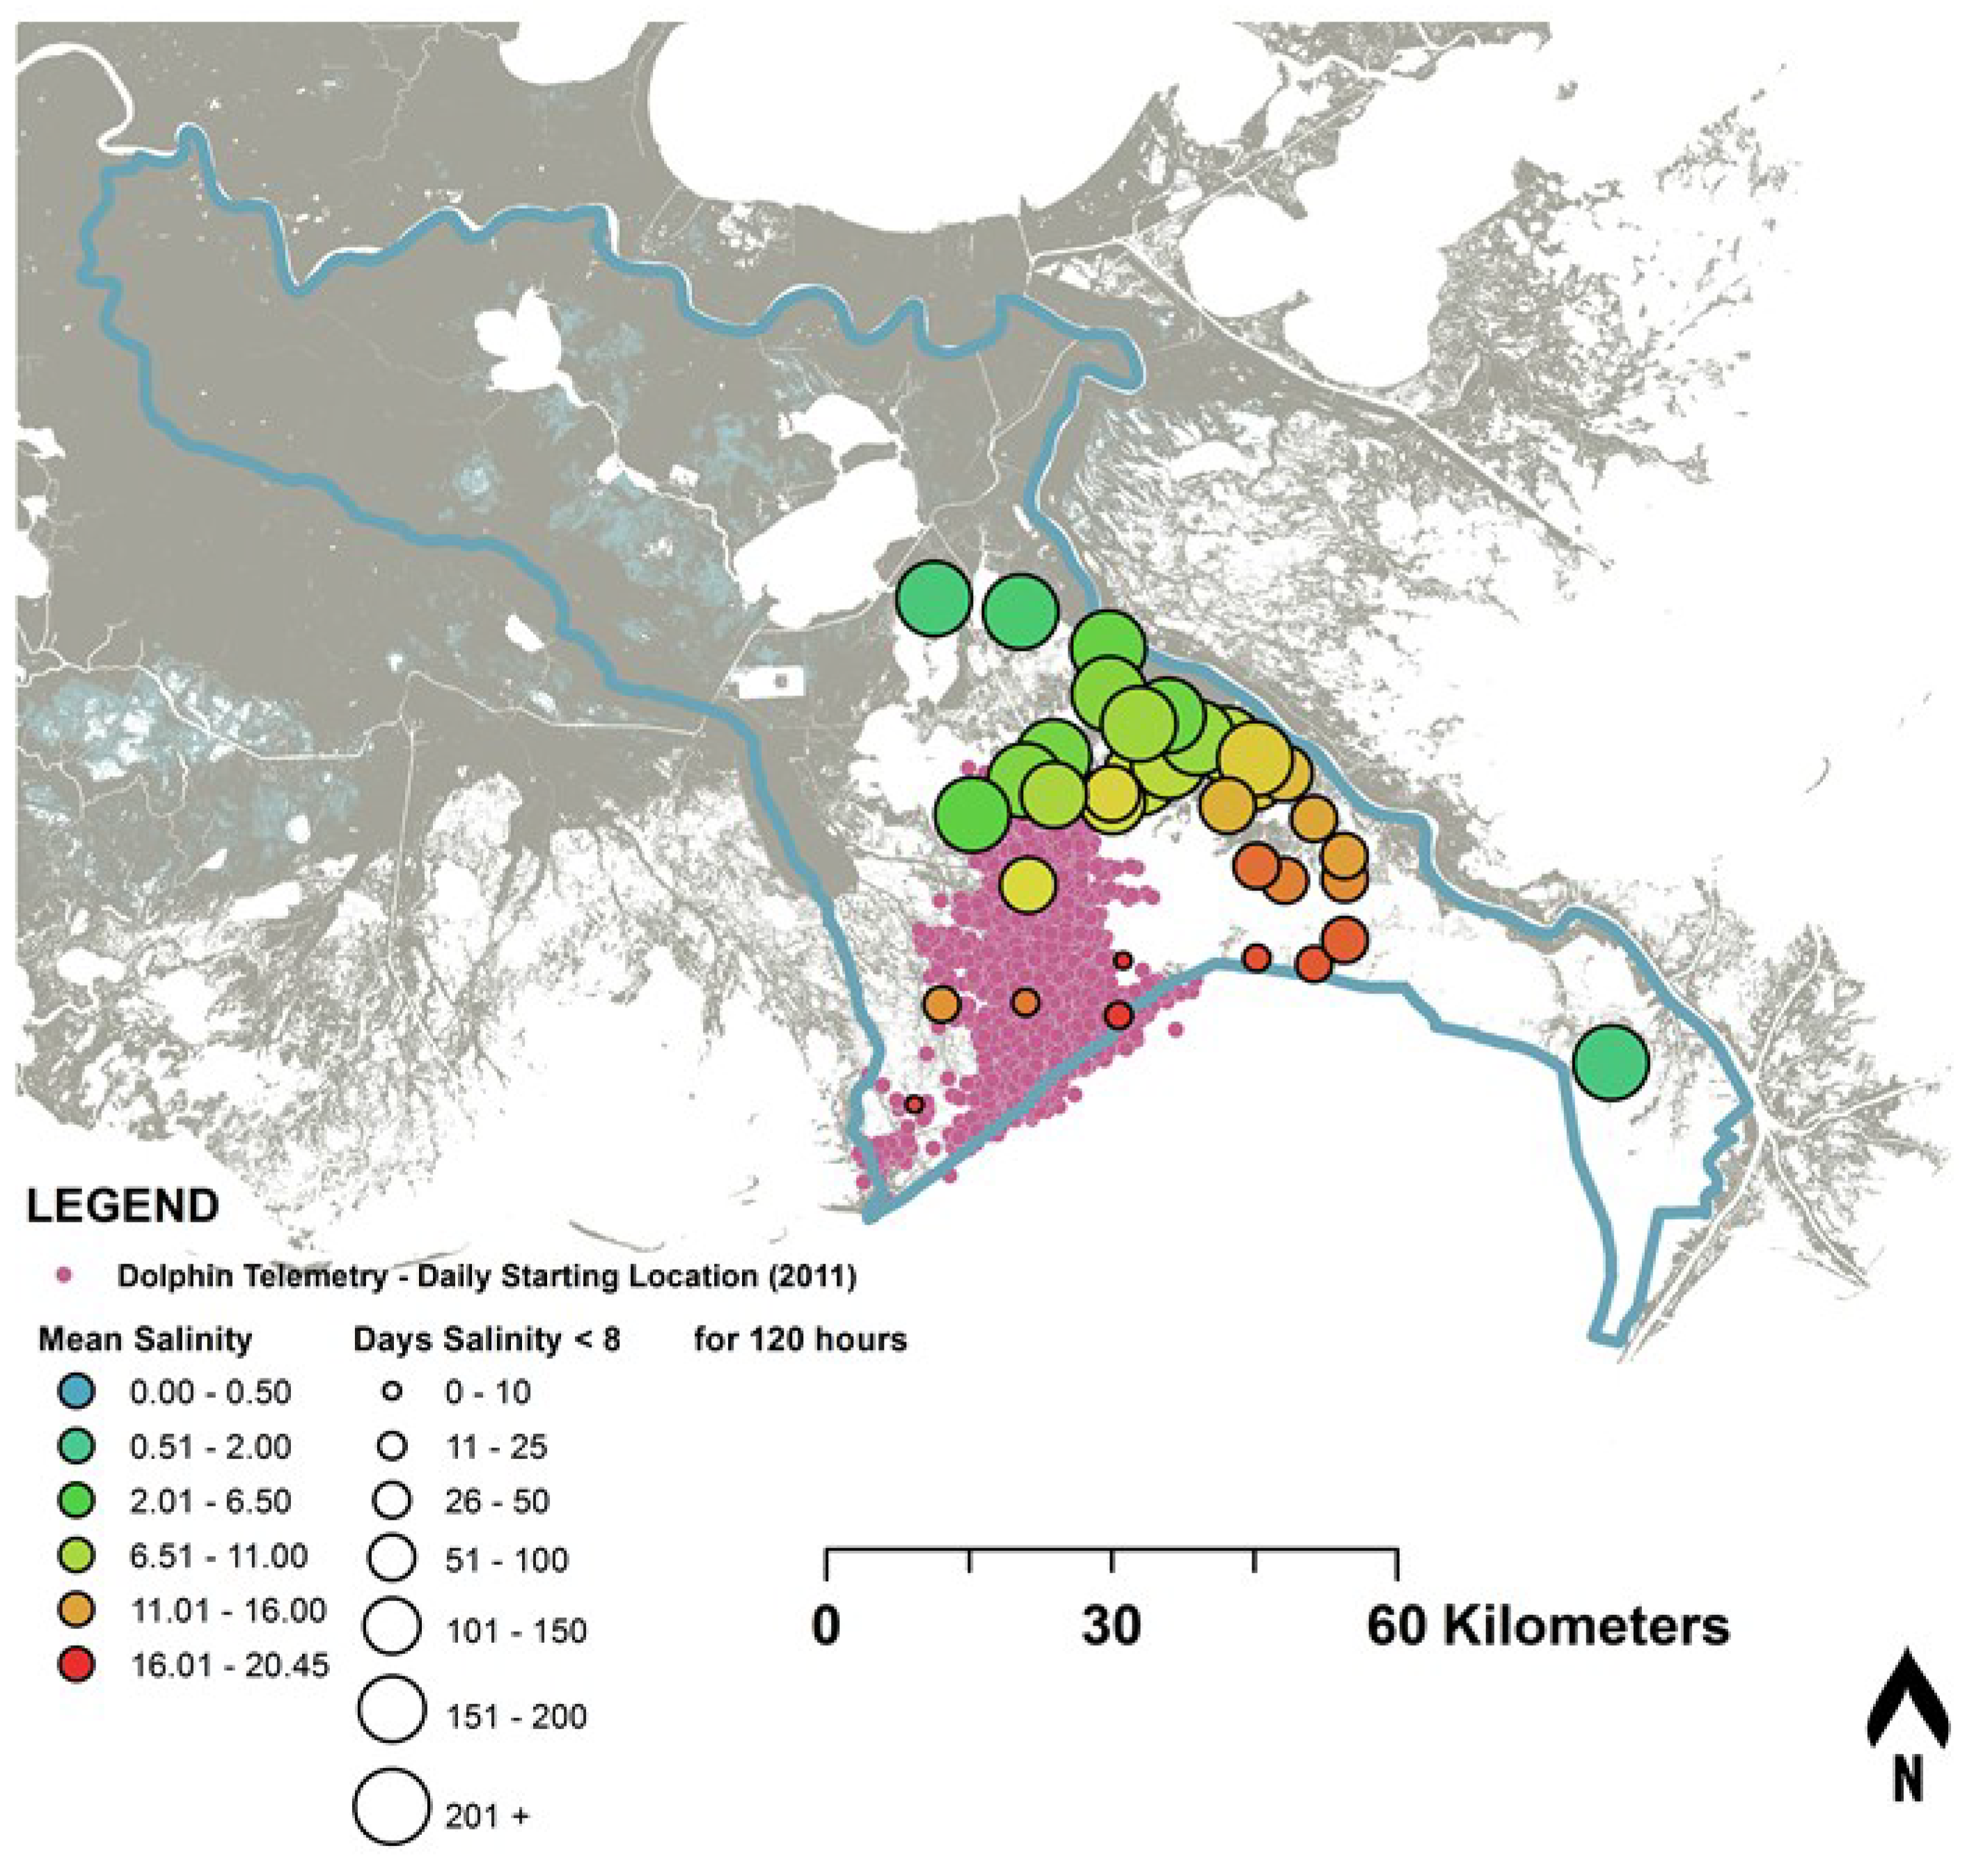
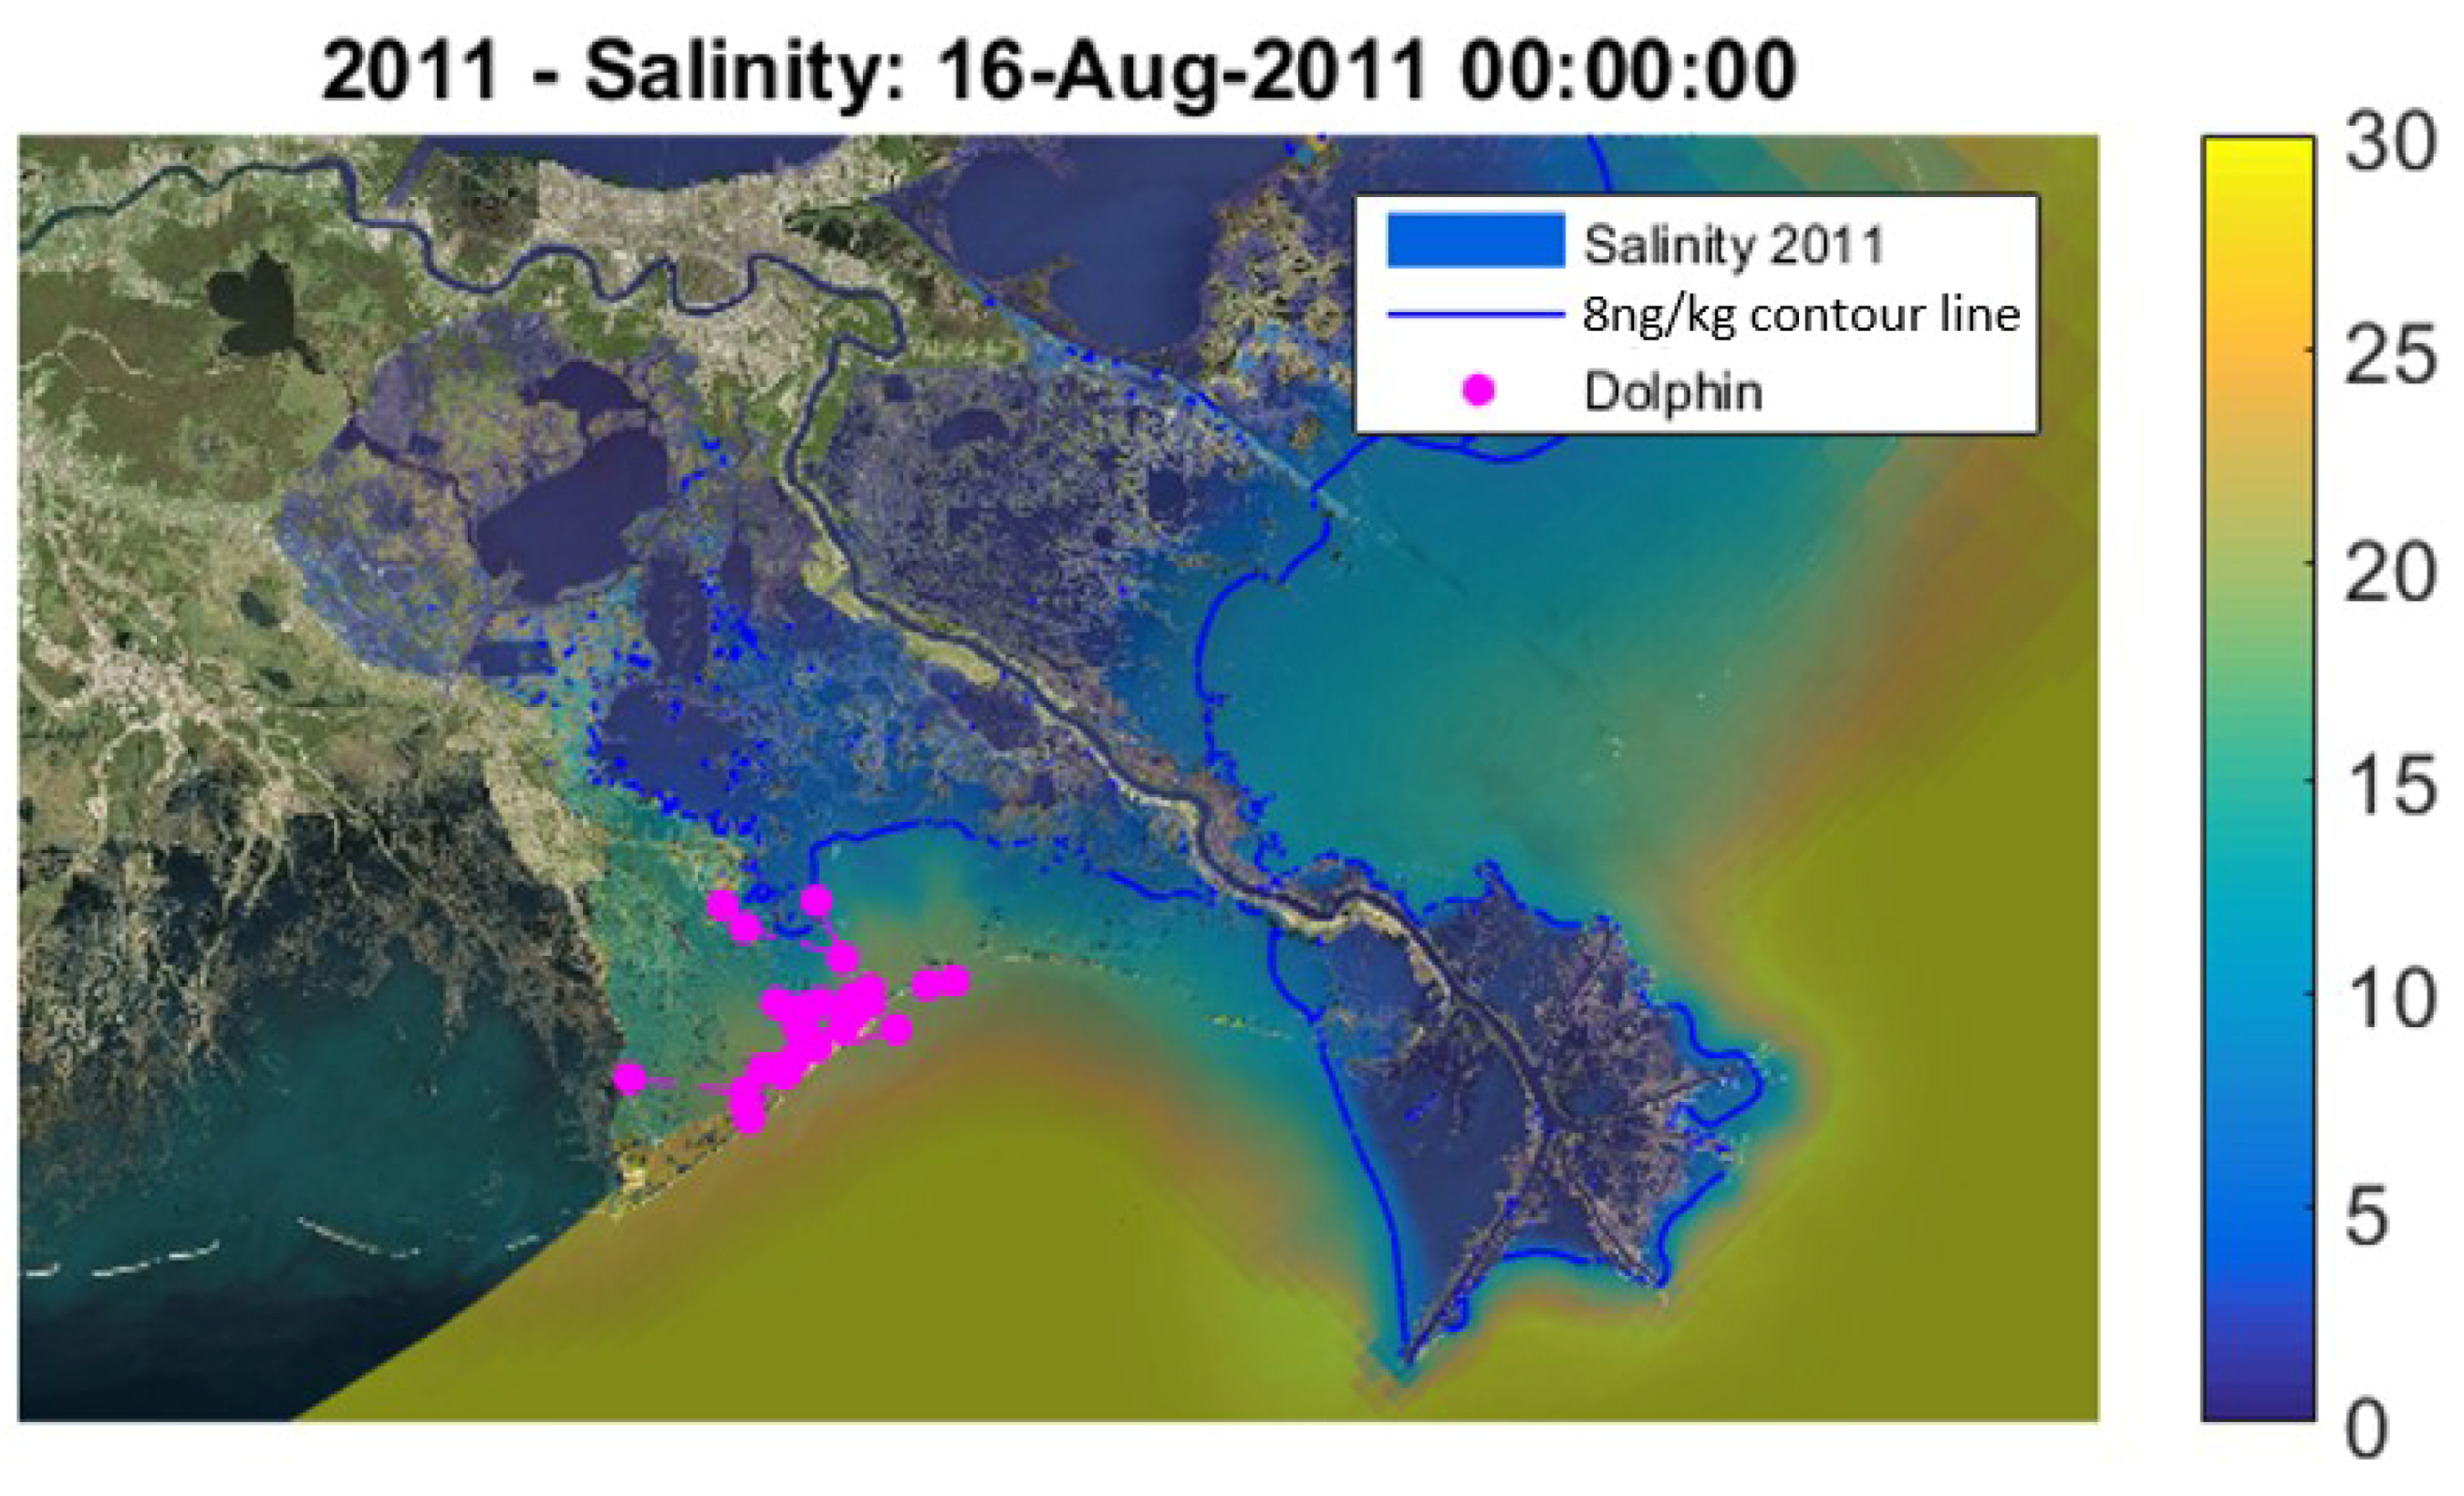
2.2. Dolphin Location Data

The historic and modeled salinity data were spatiotemporally analyzed for freshening events and compared to the observed locations of 44 tagged dolphins within Barataria Basin from 2011 to 2014. Wells et al. [11] tagged dolphins in the southwestern portion of Barataria Basin, focusing on the barrier islands of Grand Isle and Grand Terre as well as marsh islands slightly to the north in order to focus on impacts of the Deepwater Horizon oil spill on dolphin behavior. It should be emphasized that to fully understand the relationship between salinity trends and dolphin travel patterns, a more comprehensive tagging program where the sampling covers the entirety of the basin is needed. The analysis presented here, should be viewed as a framework and an approach to visually and quantitatively compare salinity spatiotemporal patterns and dolphin travel trends.
This dolphin location data was collected with fin-mounted telemetry tags which could transmit a dolphin’s location up to 250 times per day, for approximately 240 days with <500 m error radius; all data were transmitted via the Argos Data Collection and Location System [11]. For this study, the daily starting and ending locations for tagged individual dolphins were mapped against the observed and modeled salinity data.

2.3. Description of Models

In addition to the historical analysis of salinity monitoring data, hydrodynamic models were initialized to assess both historic conditions and future conditions under a variety of hydrologic management scenarios. Two different models were used for this study: The Integrated Compartment Model (ICM) and a basin-wide Delft3D model, both of which were developed for coastal restoration planning and monitoring efforts in coastal Louisiana. The ICM includes many of the physical processes that are in the basin-wide Delft3D model; however, it is at a coarser spatial resolution. This allows for computationally efficient simulations of multiple decades of the basin under a variety of environmental and operational scenarios, whereas the Delft3D model allows for detailed, high-resolution (both temporal and spatial) analysis of salinity dynamics.

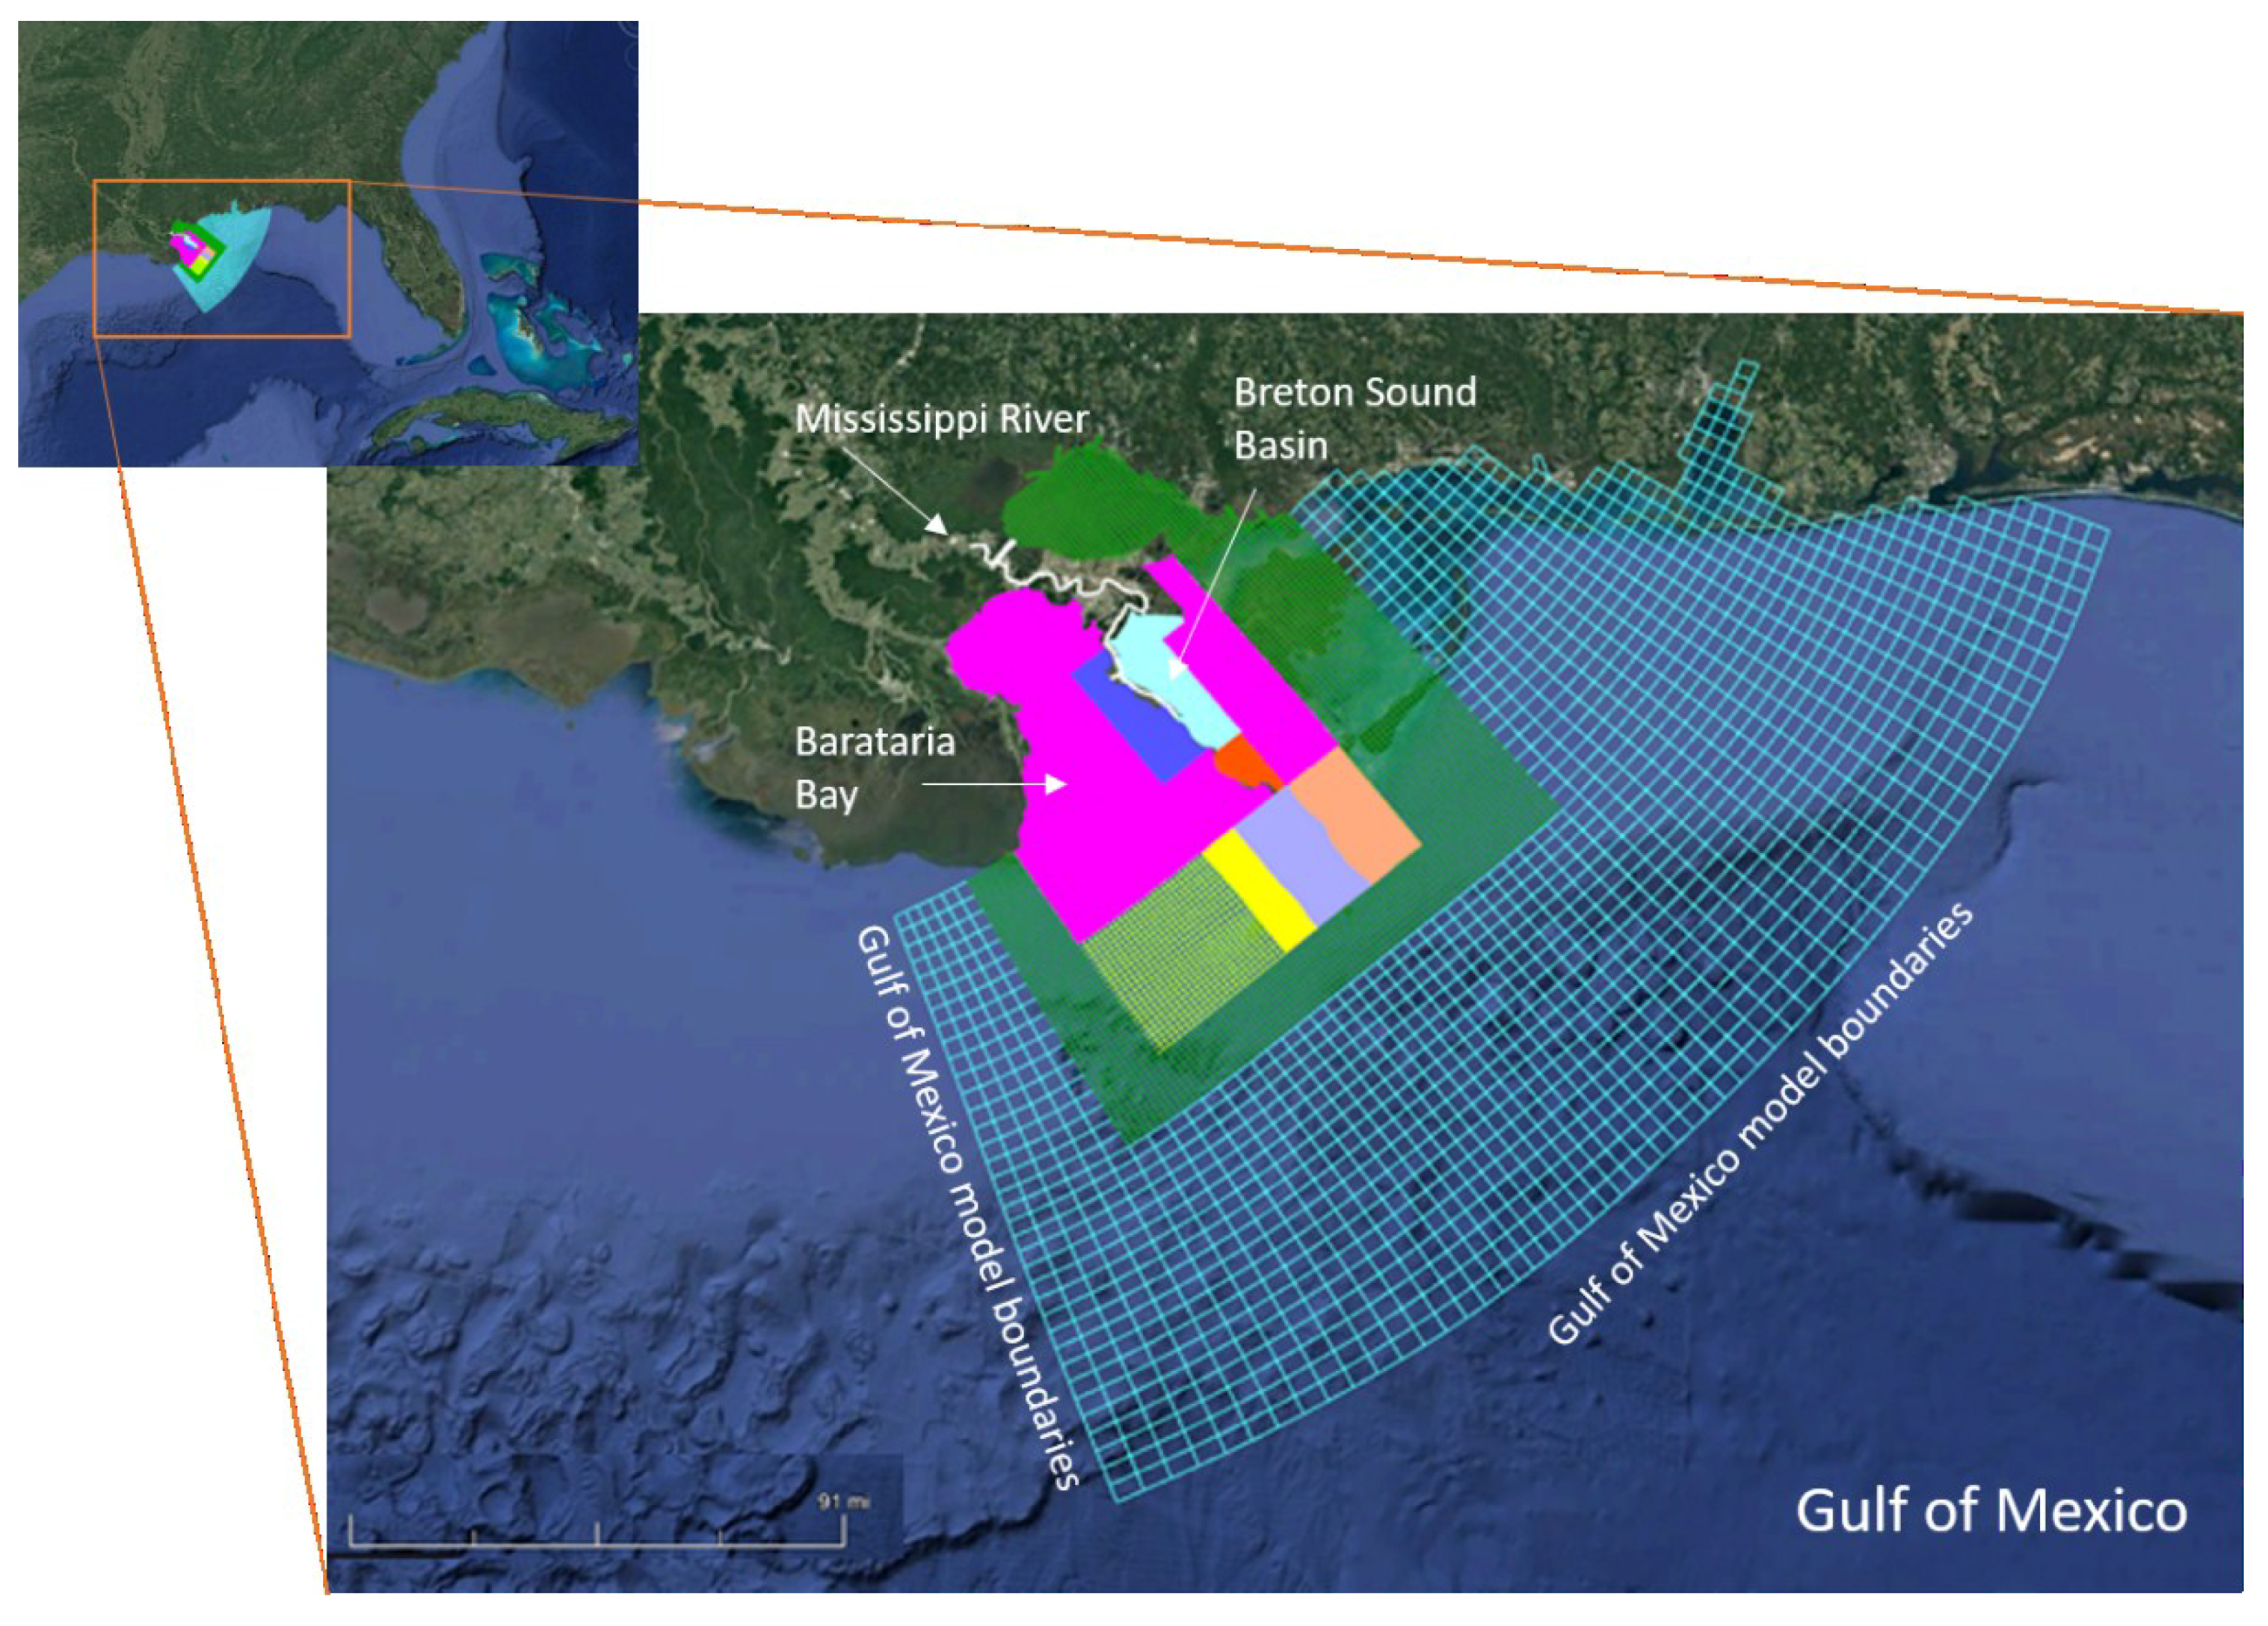
2.3.1. ICM Overview and Boundary Conditions

The ICM was developed for the 2017 CMP and contains four main subroutines representing: estuarine hydrology and hydraulics (ICM-Hydro), barrier island morphology (ICM-BIMODE), marsh and wetland forest vegetation dynamics (ICM-LAVegMod) and coastal wetland elevation change and morphology (ICM-Morph). These four subroutines provide internal feedback to one another at an annual time step and are used to provide monthly inputs to a fisheries biomass model (ICM-EWE) and annual inputs to numerous ecosystem service models that assess habitat suitability for a variety of fish, shellfish, and wildlife species (ICM-HSI). ICM-Hydro is a mass-balance link-node model that simulates (at a 30-s model time step) hydrodynamics, water quality, and sediment distribution in the open water, marsh, and upland (e.g., not tidally influenced) areas of coastal Louisiana [18,30]. ICM-LAVegMod simulates wetland vegetation cover as a function of seasonal hydrology (water level, water level variability and salinity) and the presence or absence of vegetation suitable for the predicted hydrologic niche present [10]. ICM-Morph predicts vertical elevation change as a function of subsidence as defined as a scenario-based forcing [31], inorganic sediment deposition as predicted by ICM-Hydro and organic accretion as a result of the predominant vegetation types present as predicted by ICM-LAVegMod. Saline-tolerant marsh types may collapse due to inundation stress if persistently inundated and inundation-tolerant marsh and forest types may collapse if subjected to an extended period of elevated salinity. Open water areas that are exposed to high rates of sediment deposition may gain in elevation until the surface is exposed during the average tidal cycle, at which point the model allows emergent vegetation to establish and convert the previously open water to marsh land [30,32,33]. Barrier island processes simulated by ICM-BIMODE include profile elevation changes as a function of storm surge and wave overwash, subsidence, breaching, and long-shore processes parameterized from long-term wave, tide, and sea level rise parameters [34].
Prior to use for modeling future scenarios in the 2017 CMP development process, all ICM subroutines underwent a robust model calibration and validation exercise. Brown et al. [35] discuss the procedures followed in depth and provide summary model performance statistics for both the 4-year calibration period (2010–2013) and the 4-year period used for model validation (2006–2009). While the model errors from all subroutines are important in assessing confidence in model-predicted land areas and the impact of the projects included in the 2017 CMP [36], the primary model outputs pertinent to this analysis of salinity dynamics in Barataria Basin are: water flow patterns and salinity concentrations. Please refer to the Supplemental Material for more discussion; additionally, time series plots and further discussion are available in Brown et al. [35].
The ICM is driven by time series data representing atmospheric, riverine, and coastal boundary conditions. All major rivers and creeks tributary to the Louisiana coastal zone are included; publicly available observed data were used to build historic input hydrographs and rating curves were used to fill any missing data. Observed precipitation, potential evapotranspiration, and observed water surface elevations from tidal stations in the Gulf of Mexico comprised the non-riverine boundary condition data. Observed salinity measurements from shipborne monitoring campaigns in the Gulf were used to develop a representative salinity boundary condition off-shore in the Gulf of Mexico [37].

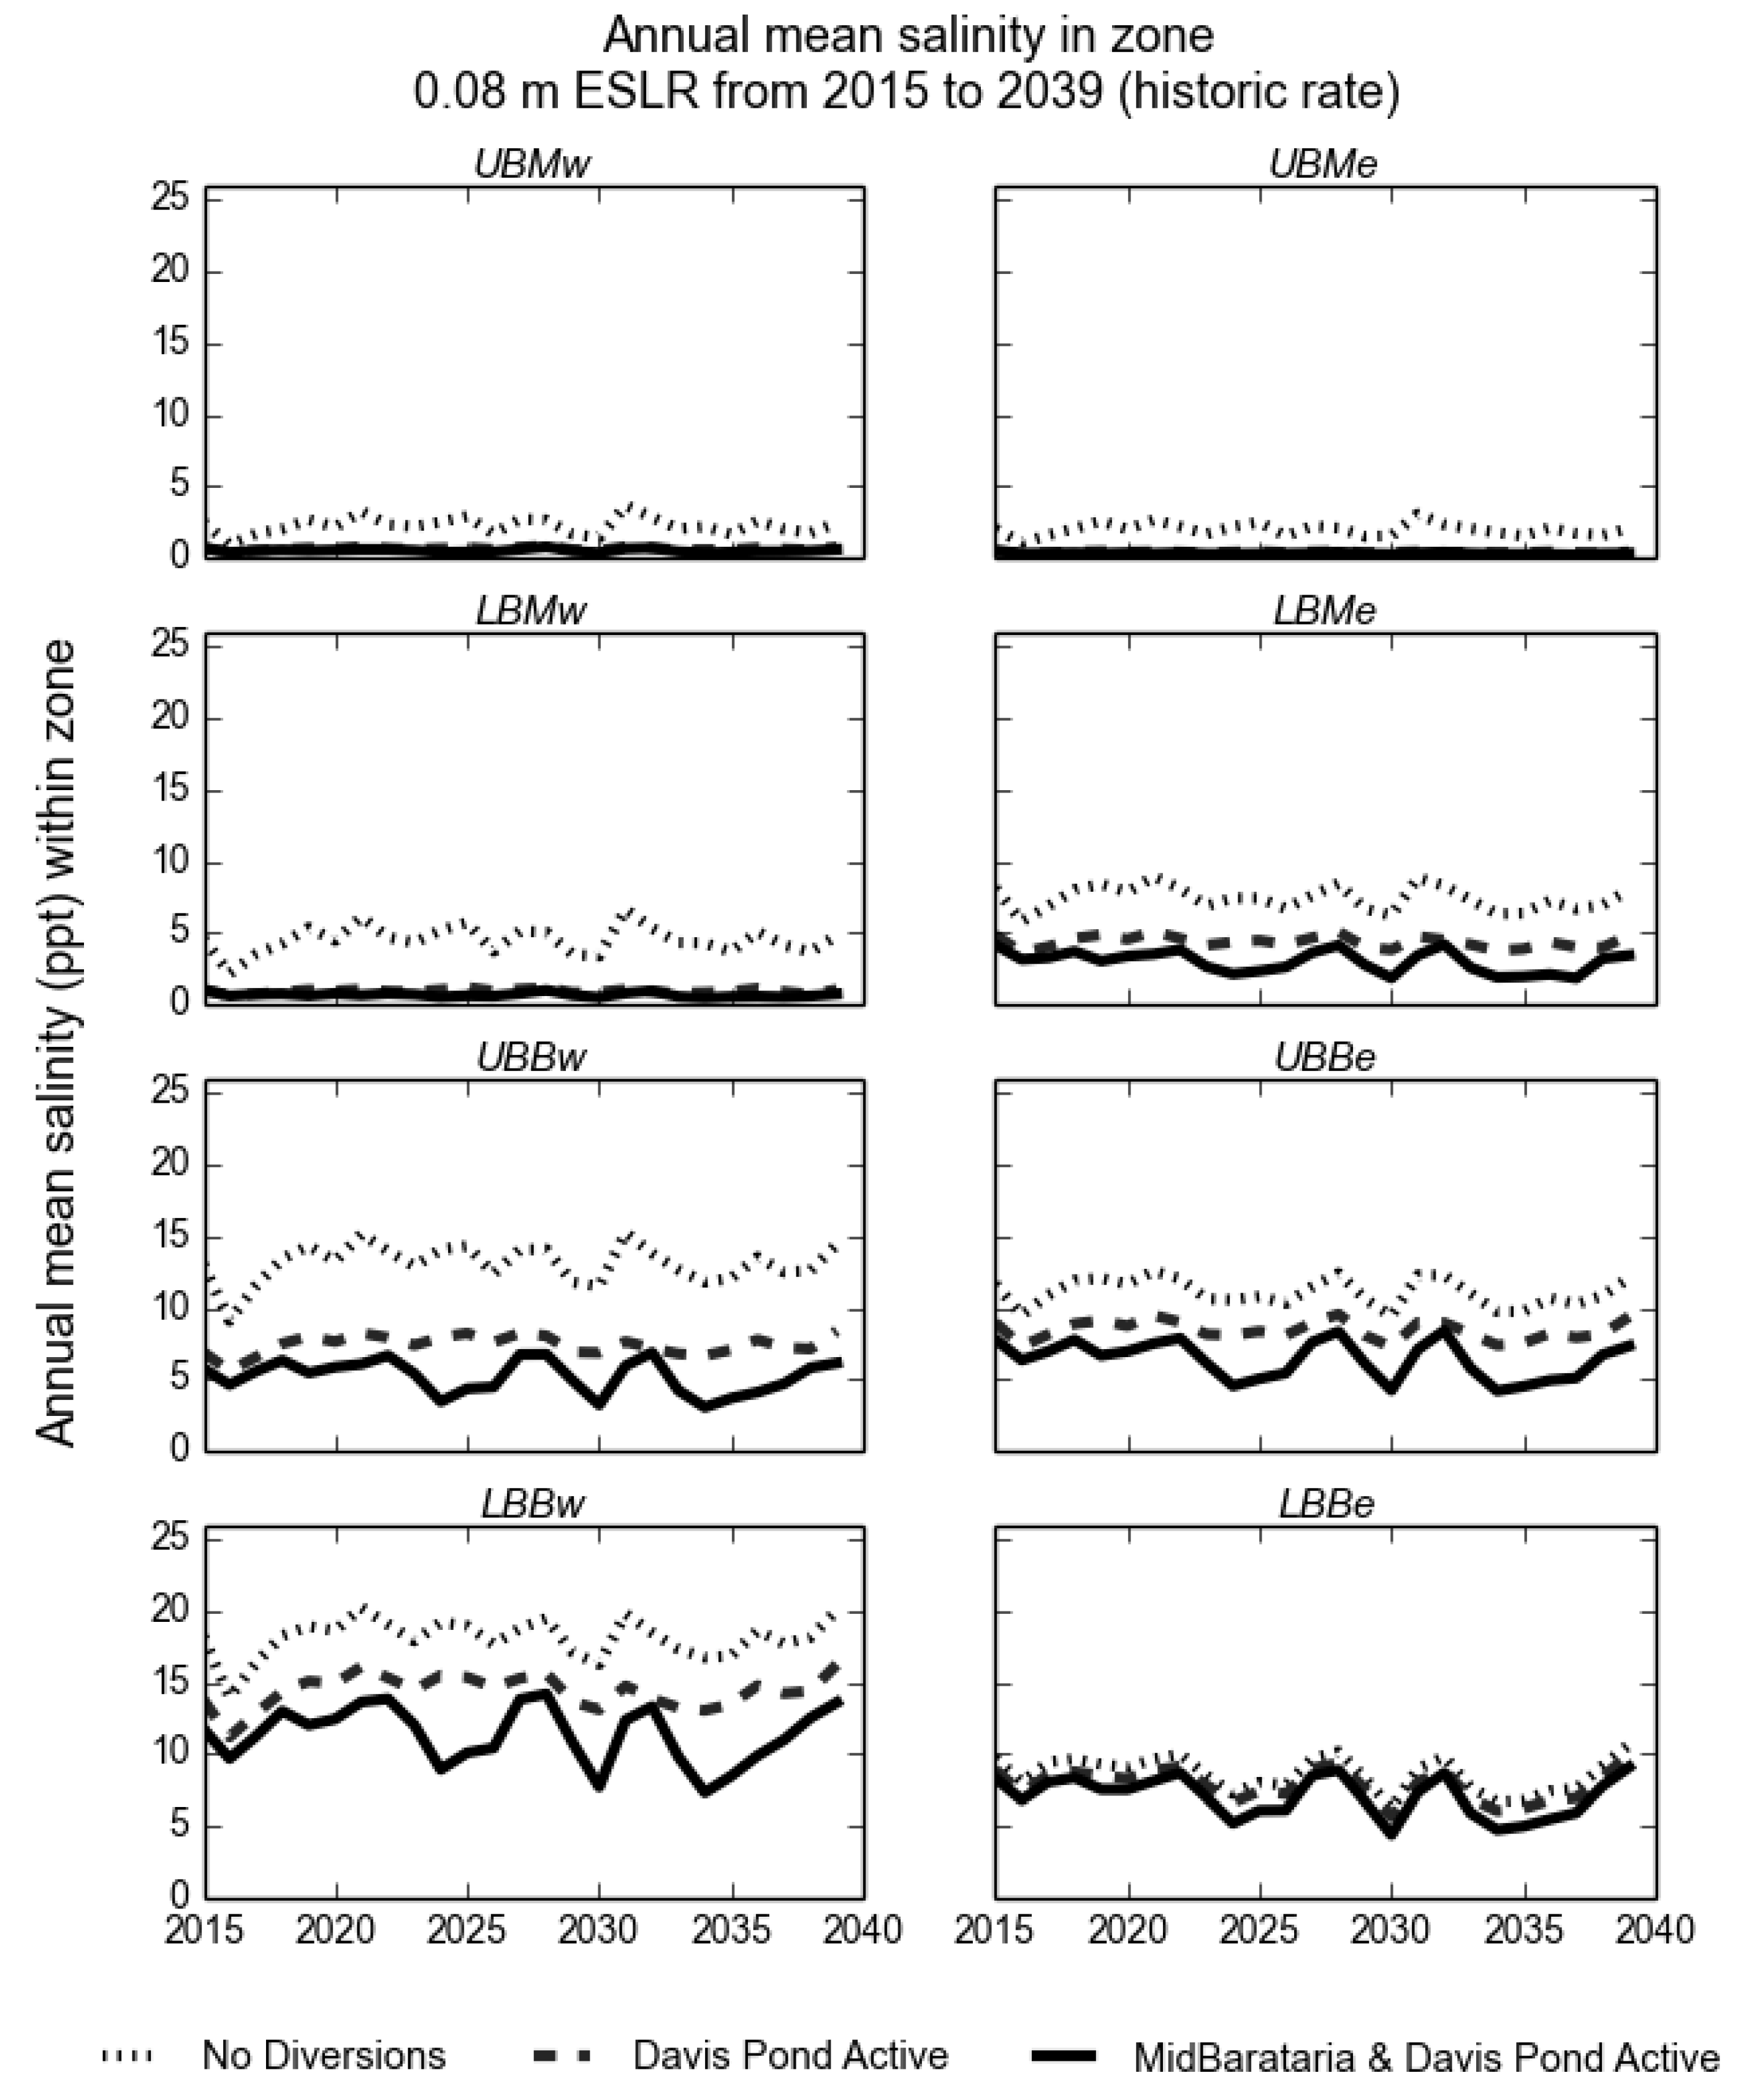
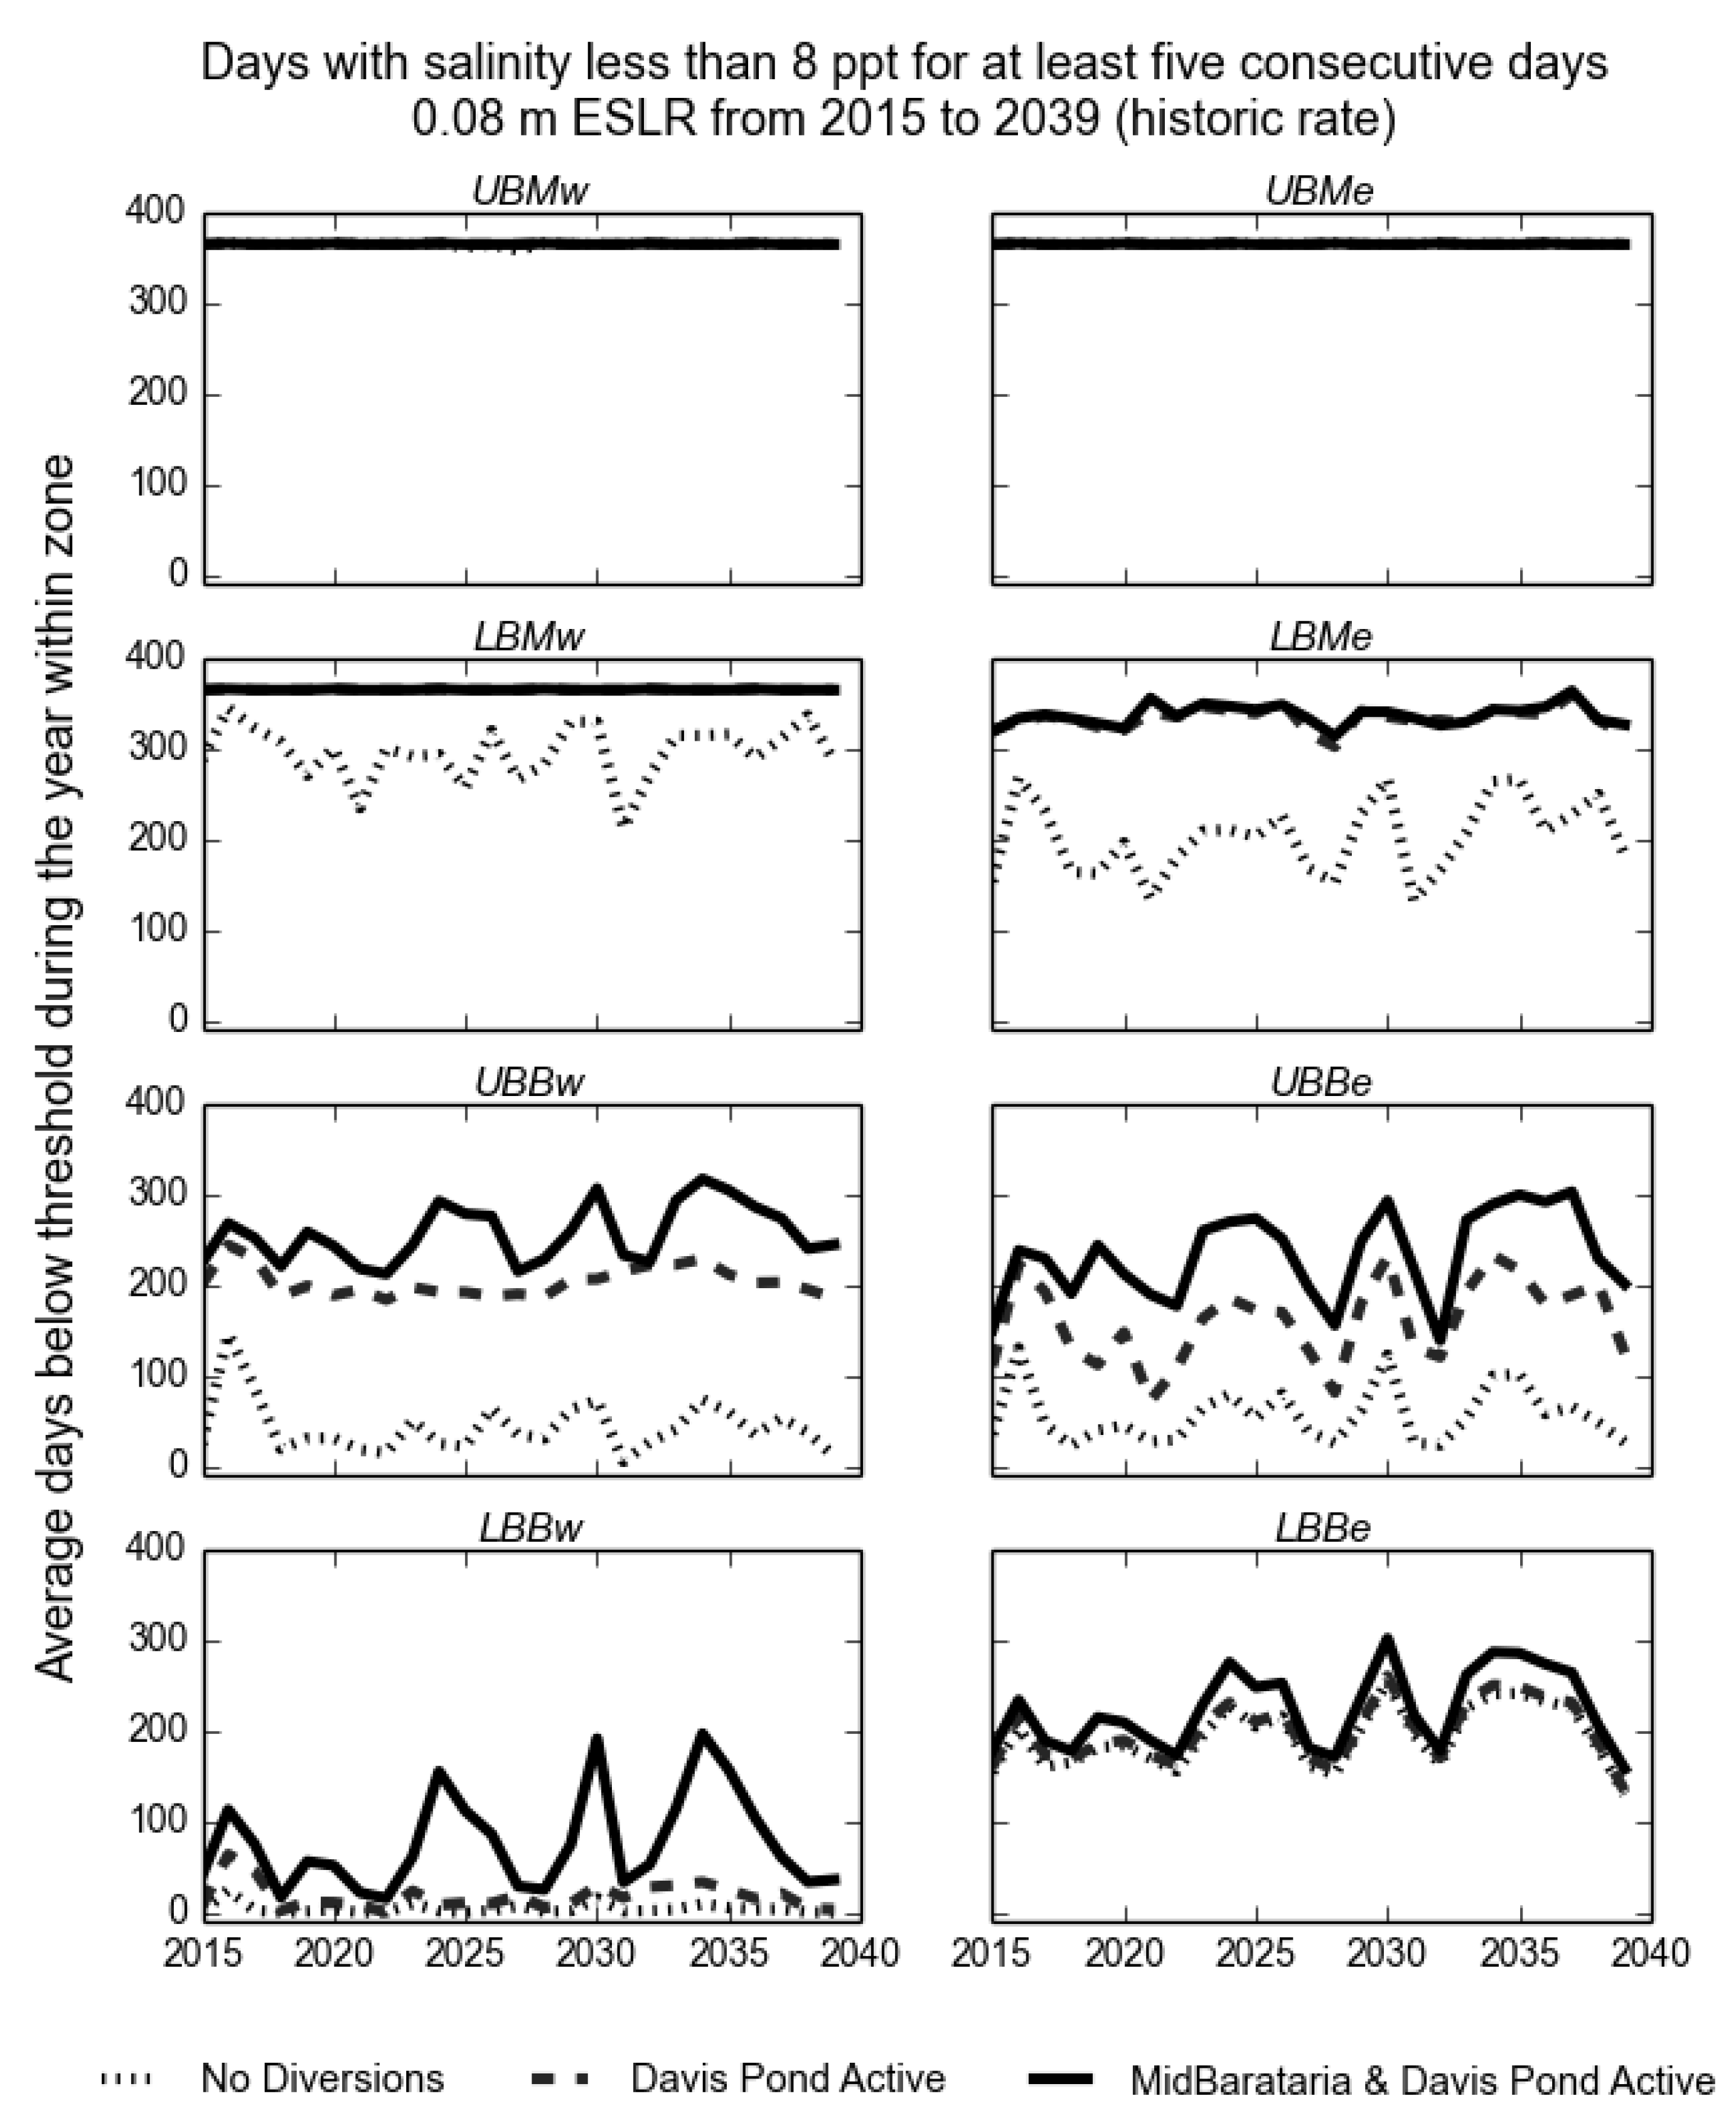
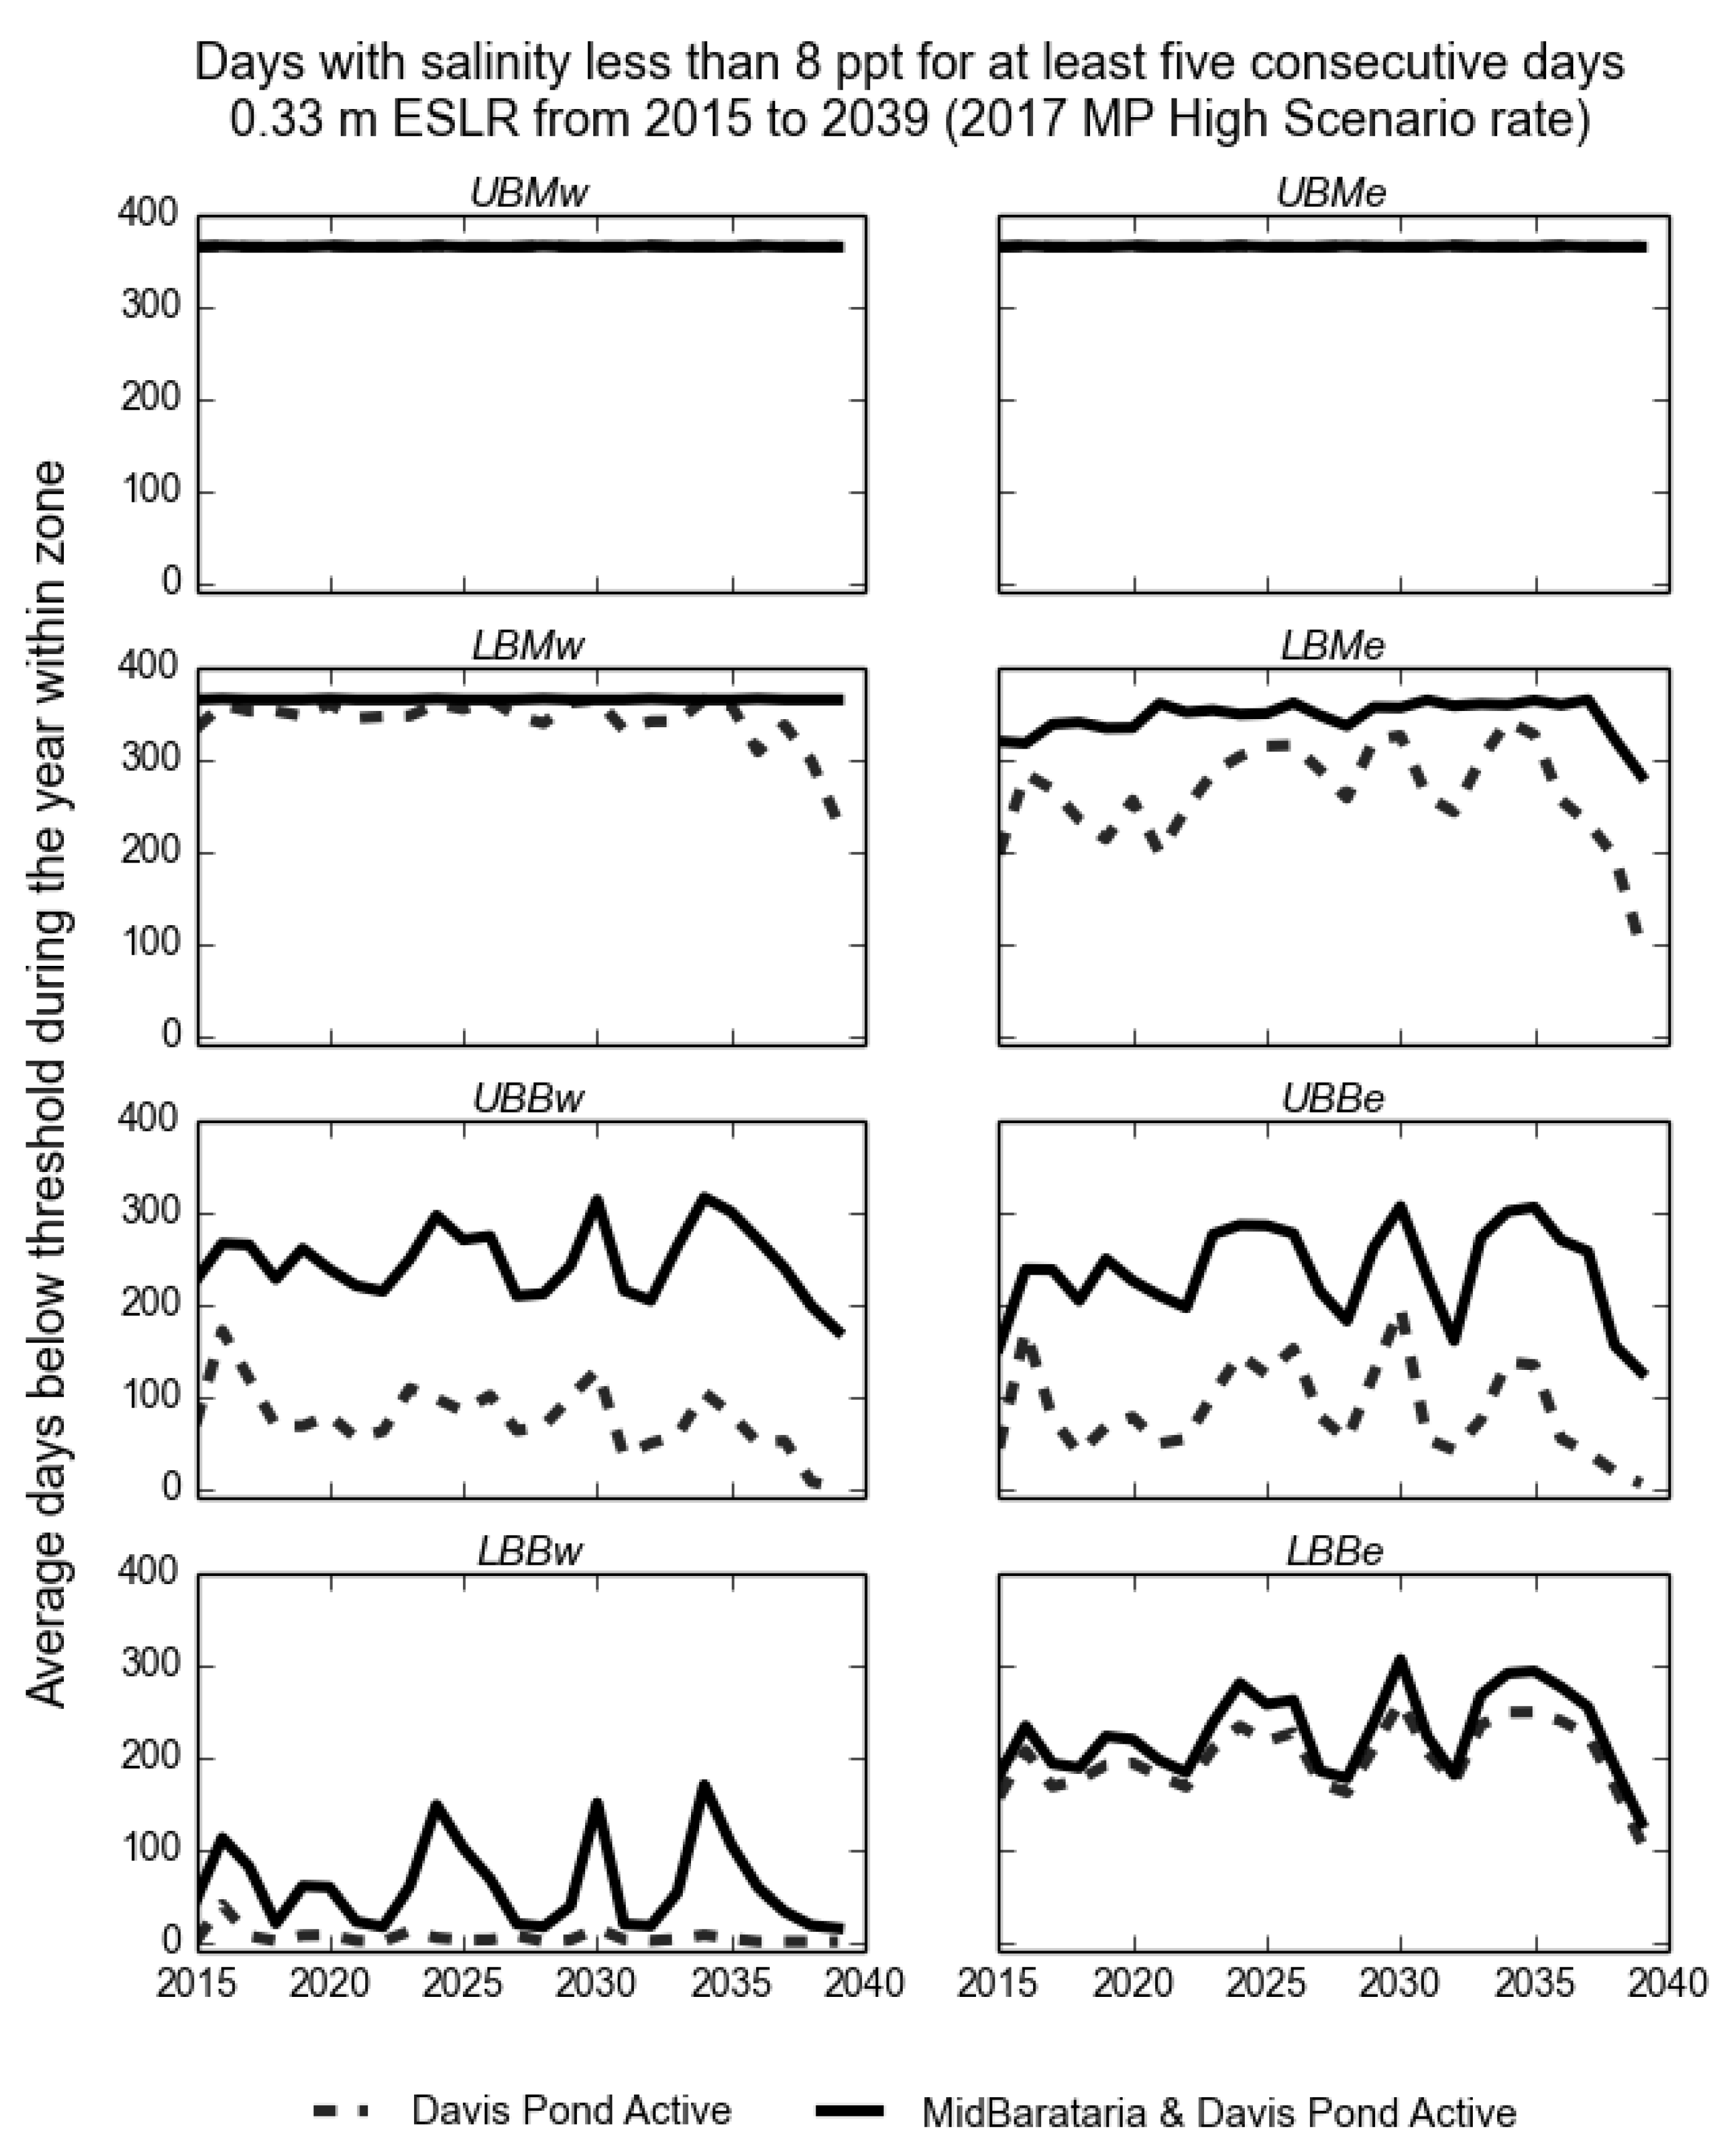
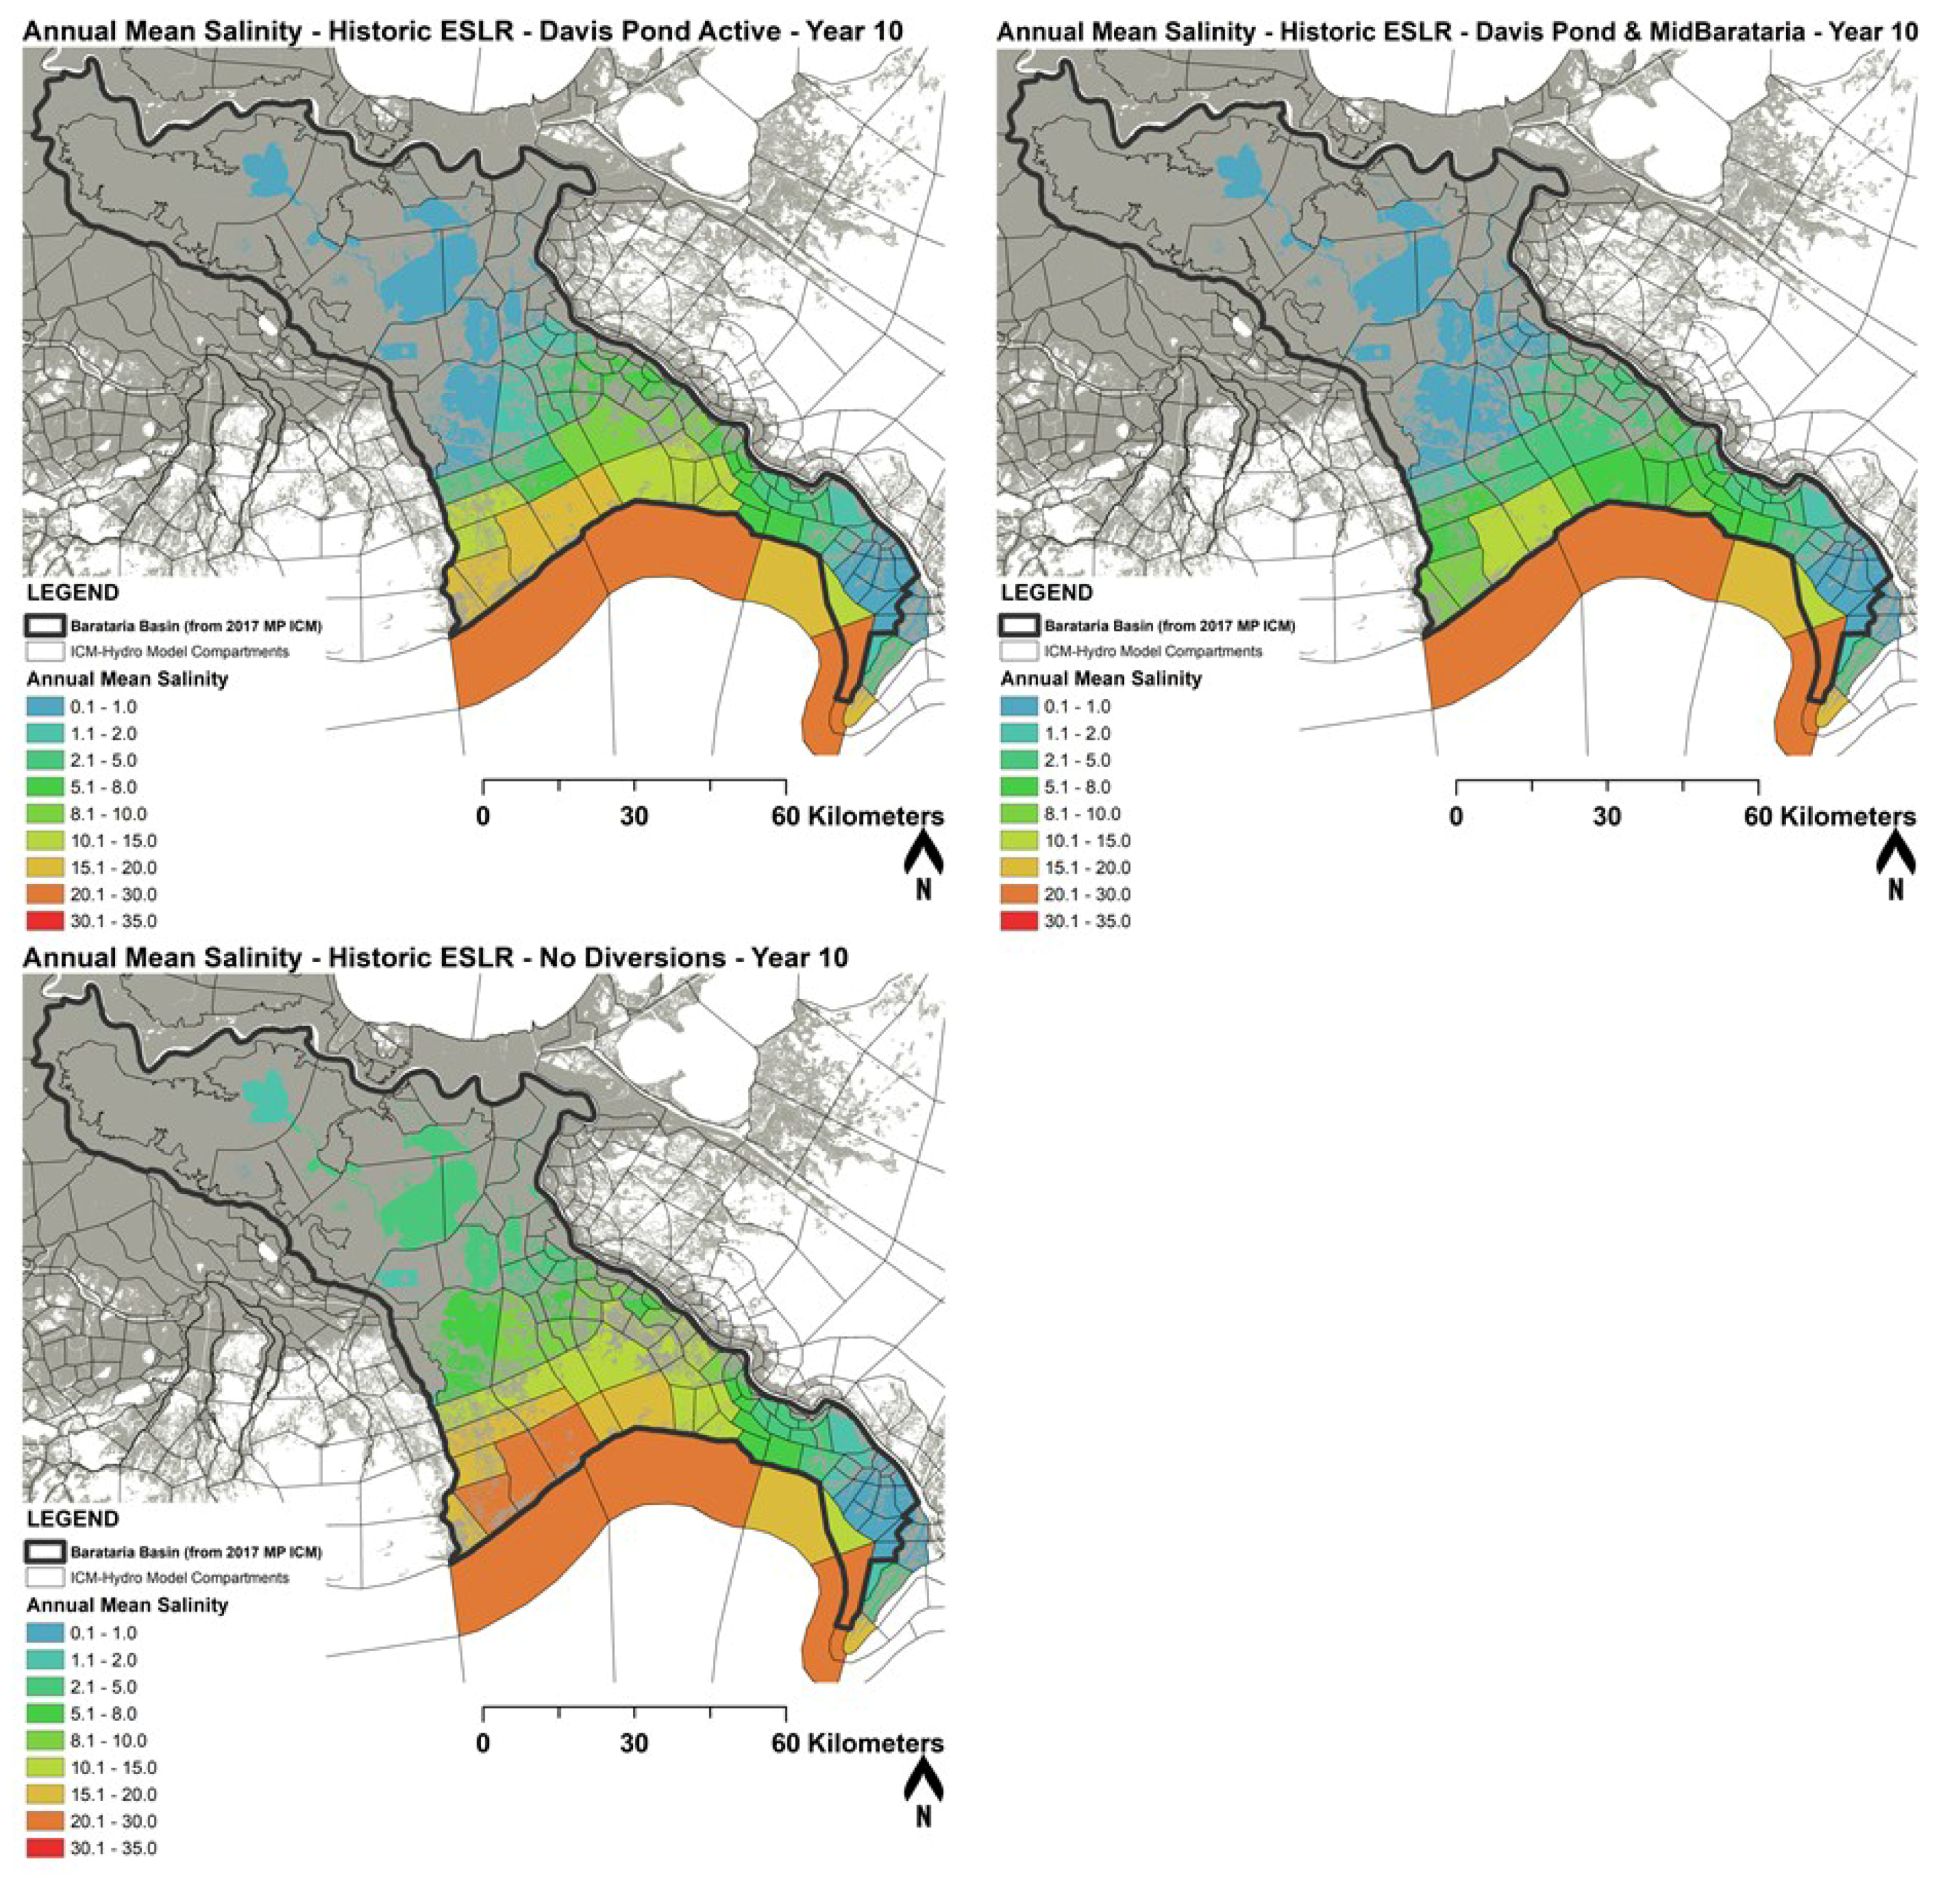
2.3.2. Scenarios Analyzed with the ICM

To provide insight into salinity dynamics beyond the spatially and temporally confined observational data, five numerical simulations of salinity were conducted with the ICM; one of which was a hindcast, and four of which were projections into the future.
The observed boundary conditions for a period from 1990 through the end of 2014 were compiled (as described above) and used to simulate a hindcast of salinity within the ICM. This scenario utilized observed riverine hydrographs and contained observed discharge flowrates for the Davis Pond fresh water diversion located in the upper portion of Barataria Basin. A detailed data set describing the initial landscape for the year 1990 was not available; therefore, the full suite of ICM subroutines was not utilized for this first simulation. Rather, only ICM-Hydro was run on the present (e.g., 2014) landscape as initially developed for the 2017 CMP development process [38]. The only tidal observation station in the Gulf of Mexico with a full dataset covering the 1990–2014 period was to the extreme western boundary of the ICM domain at Sabine Pass. Therefore, the data filling methodology described above (utilizing NOAA-predicted tidal levels and observed ESLR) were used for a large portion of the boundary conditions prior to 2006. While this allows for a detailed prediction of the past, it is not as robust as the calibration and validation exercises previously conducted, and therefore is termed a “hindcast” period, as opposed to a true simulation of the observed record.
In addition to the hindcast simulation, three scenarios were run assessing the impact of fresh water diversions off the Mississippi River into Barataria Basin under the historic sea level rise rate of 0.08 m ESLR over the past 25 years, as defined by Sweet et al. [39]. The three scenarios simulated under historic ESLR conditions were:
  • Only the Davis Pond fresh water diversion is activated and is operated on the salinity-based control rules defined in its operational control plan [40].
  • Both the Davis Pond fresh water diversion and the Mid-Barataria sediment diversion were activated. The Davis Pond diversion used the same operational control as above, and the Mid-Barataria diversion utilized an operational regime optimized to maximize the sediment-to-water ratio in diverted flows (e.g., get the most sediment with the least amount of water).
  • The final scenario tested under historic sea level rise rates was a simulation where neither Mid-Barataria sediment diversion nor Davis Pond fresh water diversion was activated.
Details of each scenario simulated are provided in the Supplementary Materials.
To contrast these three conservative scenarios (e.g., larger freshening impact of diversions under lower ESLR), a final scenario was tested which included the operation of both Mid-Barataria and Davis Pond (with the same operational rules described above), but assessing the salinity response if higher rates of both ESLR and subsidence are to be realized over the next 25 years. To test this sensitivity to higher relative sea level rise (RSLR), the High Scenario from the 2017 CMP analysis was used. This scenario assumes higher rates of subsidence (50th percentile values) and a ESLR rate of 0.33 m over 25 years, which due to an acceleration term equates to 0.83 m over the 50-year planning horizon used for the 2017 CMP, and 2.0 m by the end of the 21st century [31,41]. This final scenario simulated was compared directly to the High Scenario Future without Action model output developed for the 2017 CMP analysis [42].

2.3.3. Delft3D Overview and Boundary Conditions

A Delft3D basin-wide model developed for previous efforts was used for this study [43,44,45,46]. D-FLOW has been used to simulate the hydrodynamic (e.g., water level, water flow velocities, and salinity). Detailed description of the formulations and equations used in D-FLOW can be found online in the Delft3D User’s Manual [47].
The model domain, shown in Figure 4, includes the lower part of the Mississippi River, its receiving basins (i.e., Barataria and Breton Sound Basins), Lake Ponchartrain and a small part of the Gulf of Mexico. This allows the model to correctly capture longshore currents and the Mississippi River plume to circulate within the Gulf without being influenced by the model boundaries [44]. The model domain has been split into 12 subdomains, by using the Delft3D domain decomposition technique (see Figure 4). The resolution of the model is spatially variable: The coastal and delta subdomains have a high resolution (close to 125 m), while the open water subdomain has a coarser resolution (close to 5 km). In this way, the computational time has been kept reasonable without compromising the resolution of the model in the coastal and delta areas.
The hydrodynamic calibration of the Delft3D model consisted of adjusting model parameters until a reasonable agreement was achieved against field observations. Water level, water discharge, salinity, and temperature predicted from the model were compared to observed data, both in the Mississippi River and in Barataria and Breton Sound Basins. Statistical analyses and visual inspection of the model output were conducted to assess model performance. USGS, USACE, National Oceanographic and Atmospheric Administration (NOAA), and CRMS field observations have been used to calibrate and validate the model [45]. Please refer to Supplementary Materials for further discussion of model data and boundary conditions.

3. Results

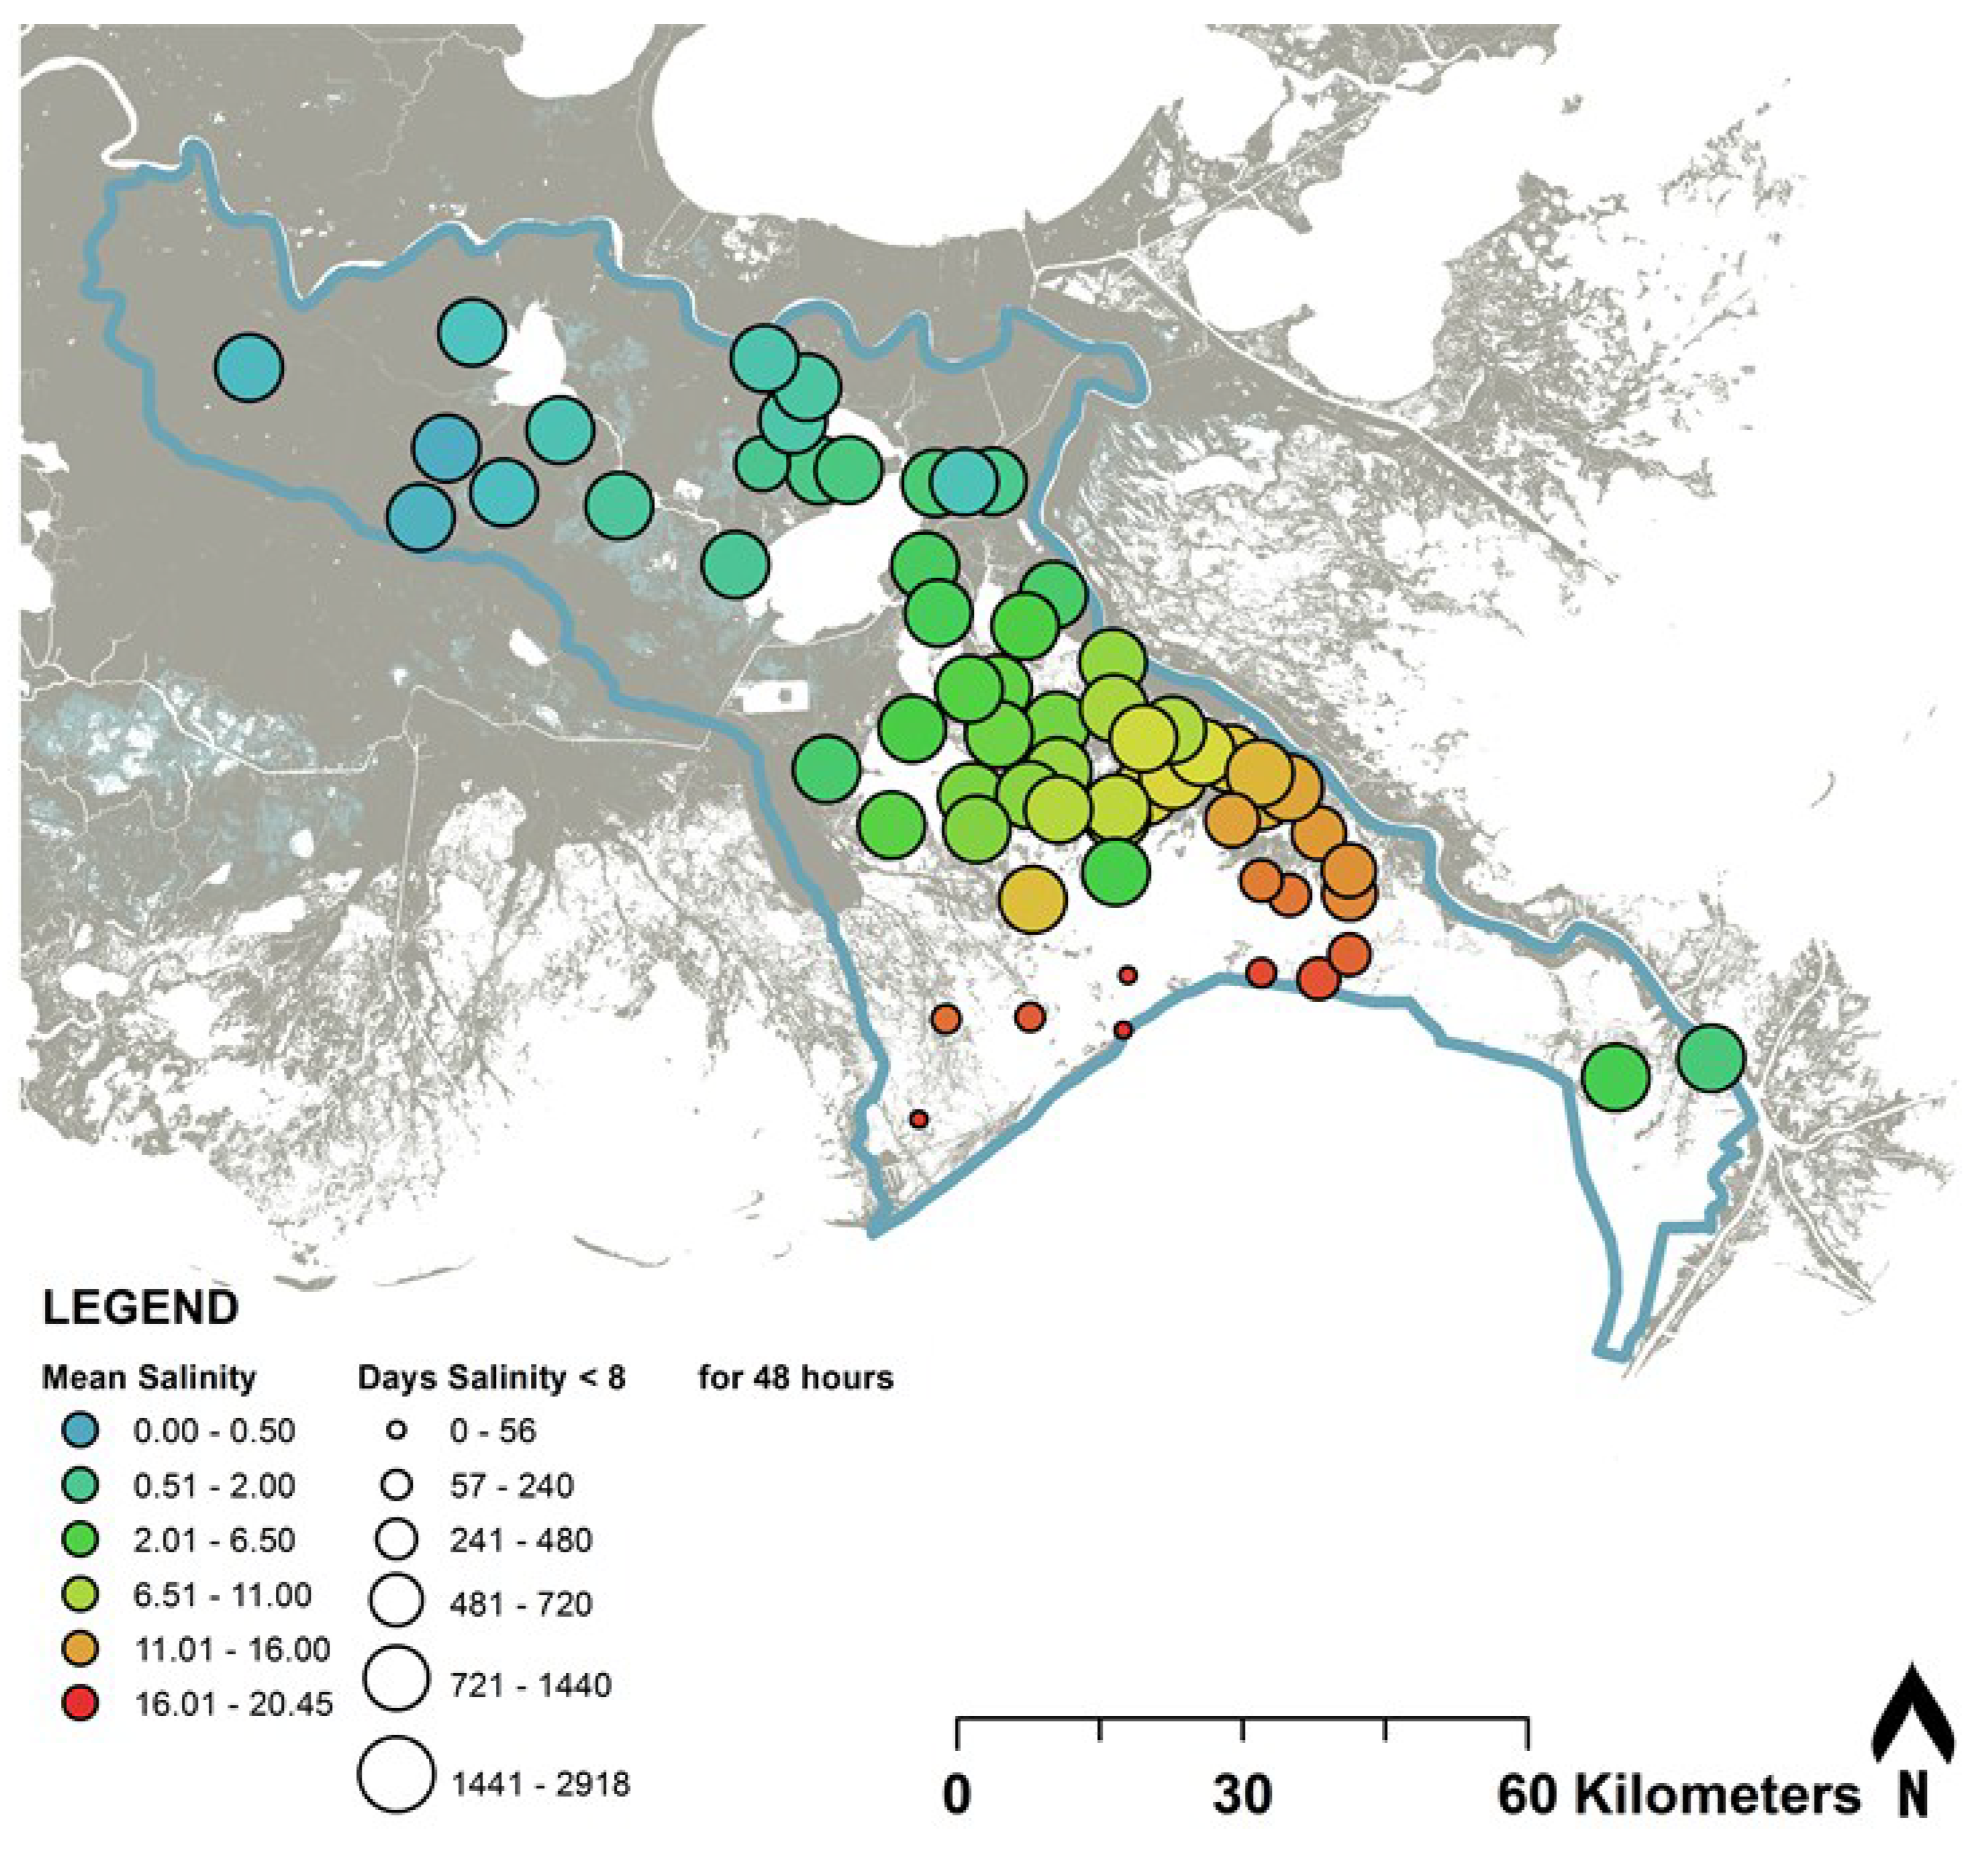
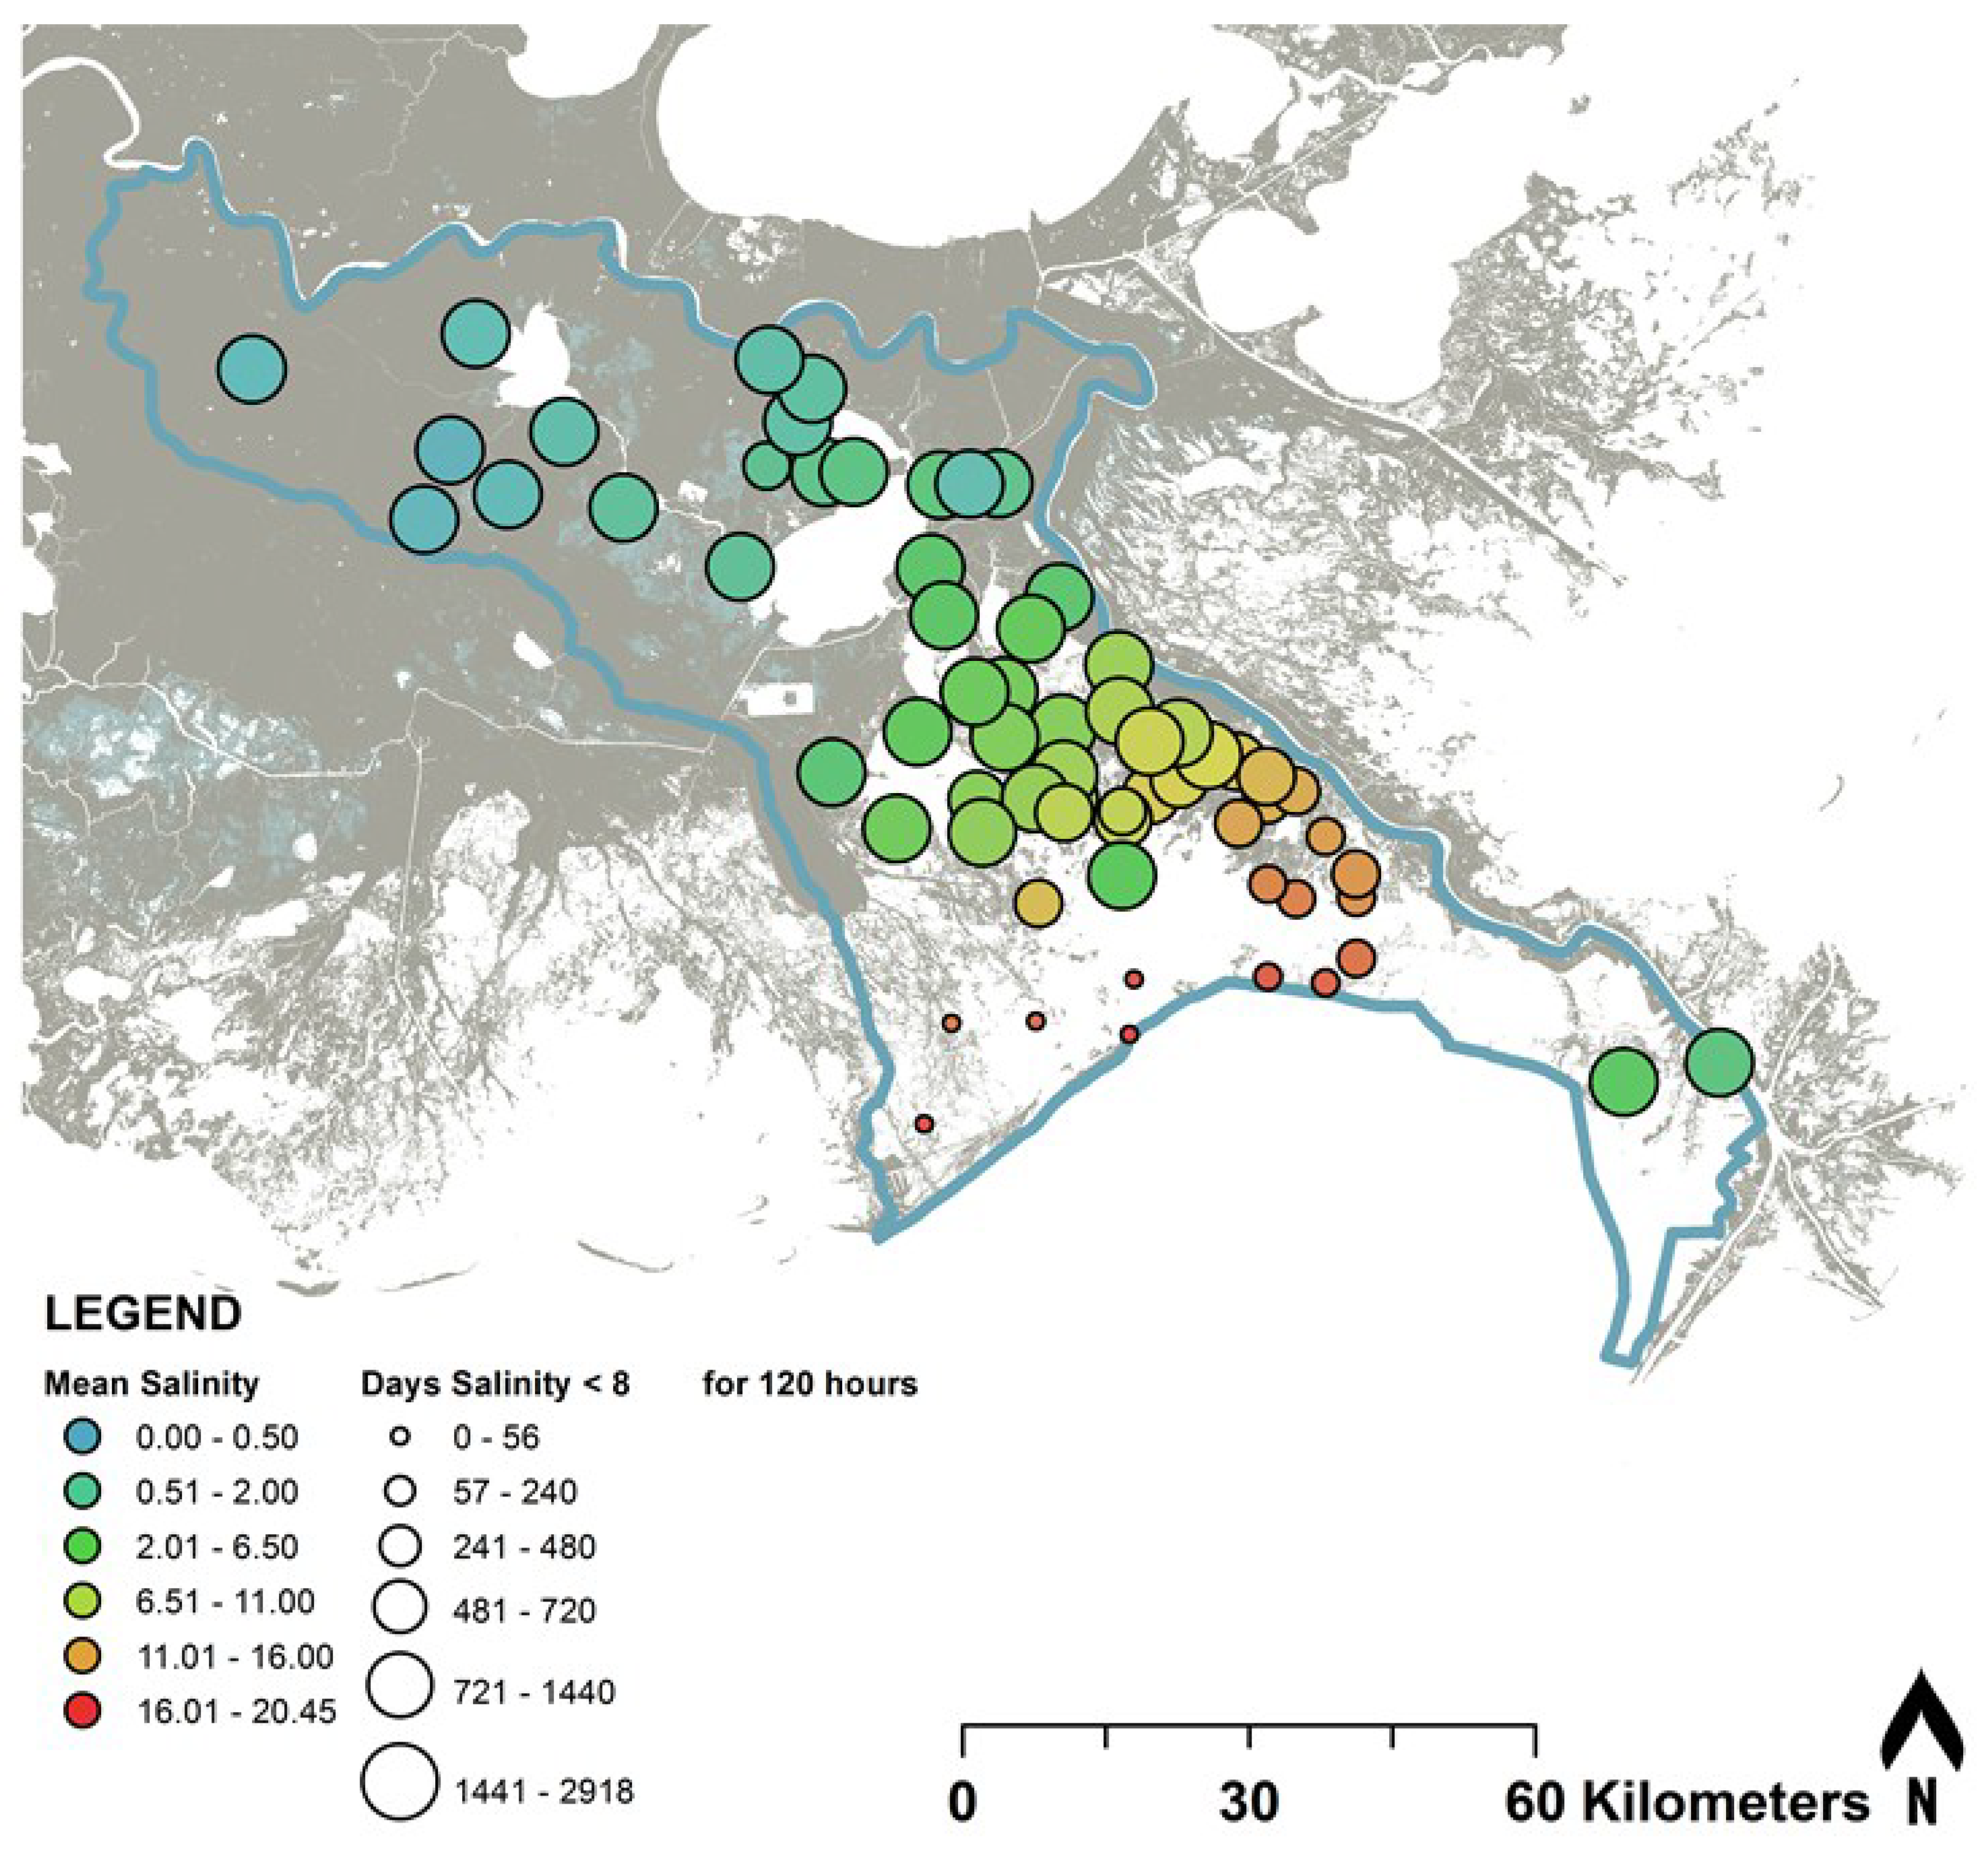
3.1. Historic Trends—Observational Data Analysis

Based upon the 8 ng/kg threshold analysis of continuous (e.g., hourly or daily) salinity observational data, there is a distinct area in the southwestern portion of Barataria Basin, west of the Barataria Waterway, in which salinity values remain elevated with limited periods of freshening relative to the rest of Barataria Basin. From 2008 through 2015, three stations closest to Grand Isle and within Caminada Bay have experienced less than 56 days in which the salinity was less than 8 ng/kg for at least 48 consecutive hours; and two additional stations were below this fresh threshold for less than 240 times over this 8-year period (Figure 5). The latter two stations, while showing a higher number of 48-h fresh periods than the other three, do not show this trend when the longer, 120-h threshold is assessed (Figure 6).
The long-term trends with respect to fresh periods below 8 ng/kg, as shown for 2008 through the end of 2015 (Figure 5 and Figure 6), does not change dramatically when a single year is examined, as can be seen from the observation sites with data for 2011 (Figure 7). Even though 2011 was a flood year within the Mississippi River (Figure 8), the spatial variability with respect to fresh events lasting at least 120 consecutive hours does not differ much from the long-term patterns. Southwestern portions of Barataria Basin near Grand Isle and Caminada Bay are still consistently less prone to periodic freshening than regions further up-basin.
The region north and west of Grand Isle is the primary region in which dolphins were tagged and observed to have been located in 2011 (Figure 7). Even though salinity patterns on the eastern side of Barataria Waterway, closer to Bay Ronquille, are similar in magnitude with respect to both annual mean salinity and periodic freshening, the tagged dolphins did not appear to cross Barataria Waterway to access these similarly saline waters. This is potentially indicative of salinity not being the only driver of observed dolphin movements during 2011. Furthermore, there is a substantial number of dolphin observations in the upper portions of northwest Barataria Bay, within Hackberry Bay, and encroaching upon Little Lake. Salinity observations in this region show long-term mean salinity values of less than 6.5 ng/kg with over half of the year subjected to periods of salinity lower than 8 ng/kg for at least 120 consecutive hours.
In addition to the stations with continuous observations, the regional daily means calculated from all available salinity observations (regardless of time step) were aggregated to the ICM-Hydro compartments. Annual mean salinity by model compartment is shown here for 3 years, representing three distinct hydrologic signals: 2006, a year with low flows in the Mississippi River; 2010, a year with average flow in the Mississippi River; and 2011, a year with high river flows. The Mississippi River hydrographs for these selected years are shown in Figure 8. The observed salinity data averaged for each ICM model compartment, as well as the modeled hindcast are shown in Figure 9, for a higher-than-average river year, 2011 (figures for additional years are provided in the Supplementary Materials). Regardless of hydrographic conditions in the Mississippi River, there is limited impact upon annual mean salinities in Lake Salvador and other areas upstream of the GIWW; annual mean salinities in this region are consistently at or below approximately 2.0 ng/kg. Compartment-averaged observed salinity in the western side of the basin near Little Lake and Hackberry Bay (the LBMw zone—see Table 1 and Figure 3) indicates a sensitivity to Mississippi River flows with an increase in annual mean salinity during the 2006 low flow year; however, there was not much difference in this region between the wet and average years. The sensitivity to the 2006 low flow year is also evident in the southwestern portion of Barataria Basin closer to Grand Isle and Caminada Bay; the UBBw and LBBw zones. These regions experienced annual mean salinities greater than 20.0 ng/kg during the 2006 low flow year, whereas the salinities were lower during the average and wet years. The trends in the southeastern portion of the basin (UBBe and LBBe zones) are consistent with the southwestern side of the basin. However, the differences between low river and other years decreases further up-basin and closer to the river.

3.2. Model Runs—Scenario Outputs

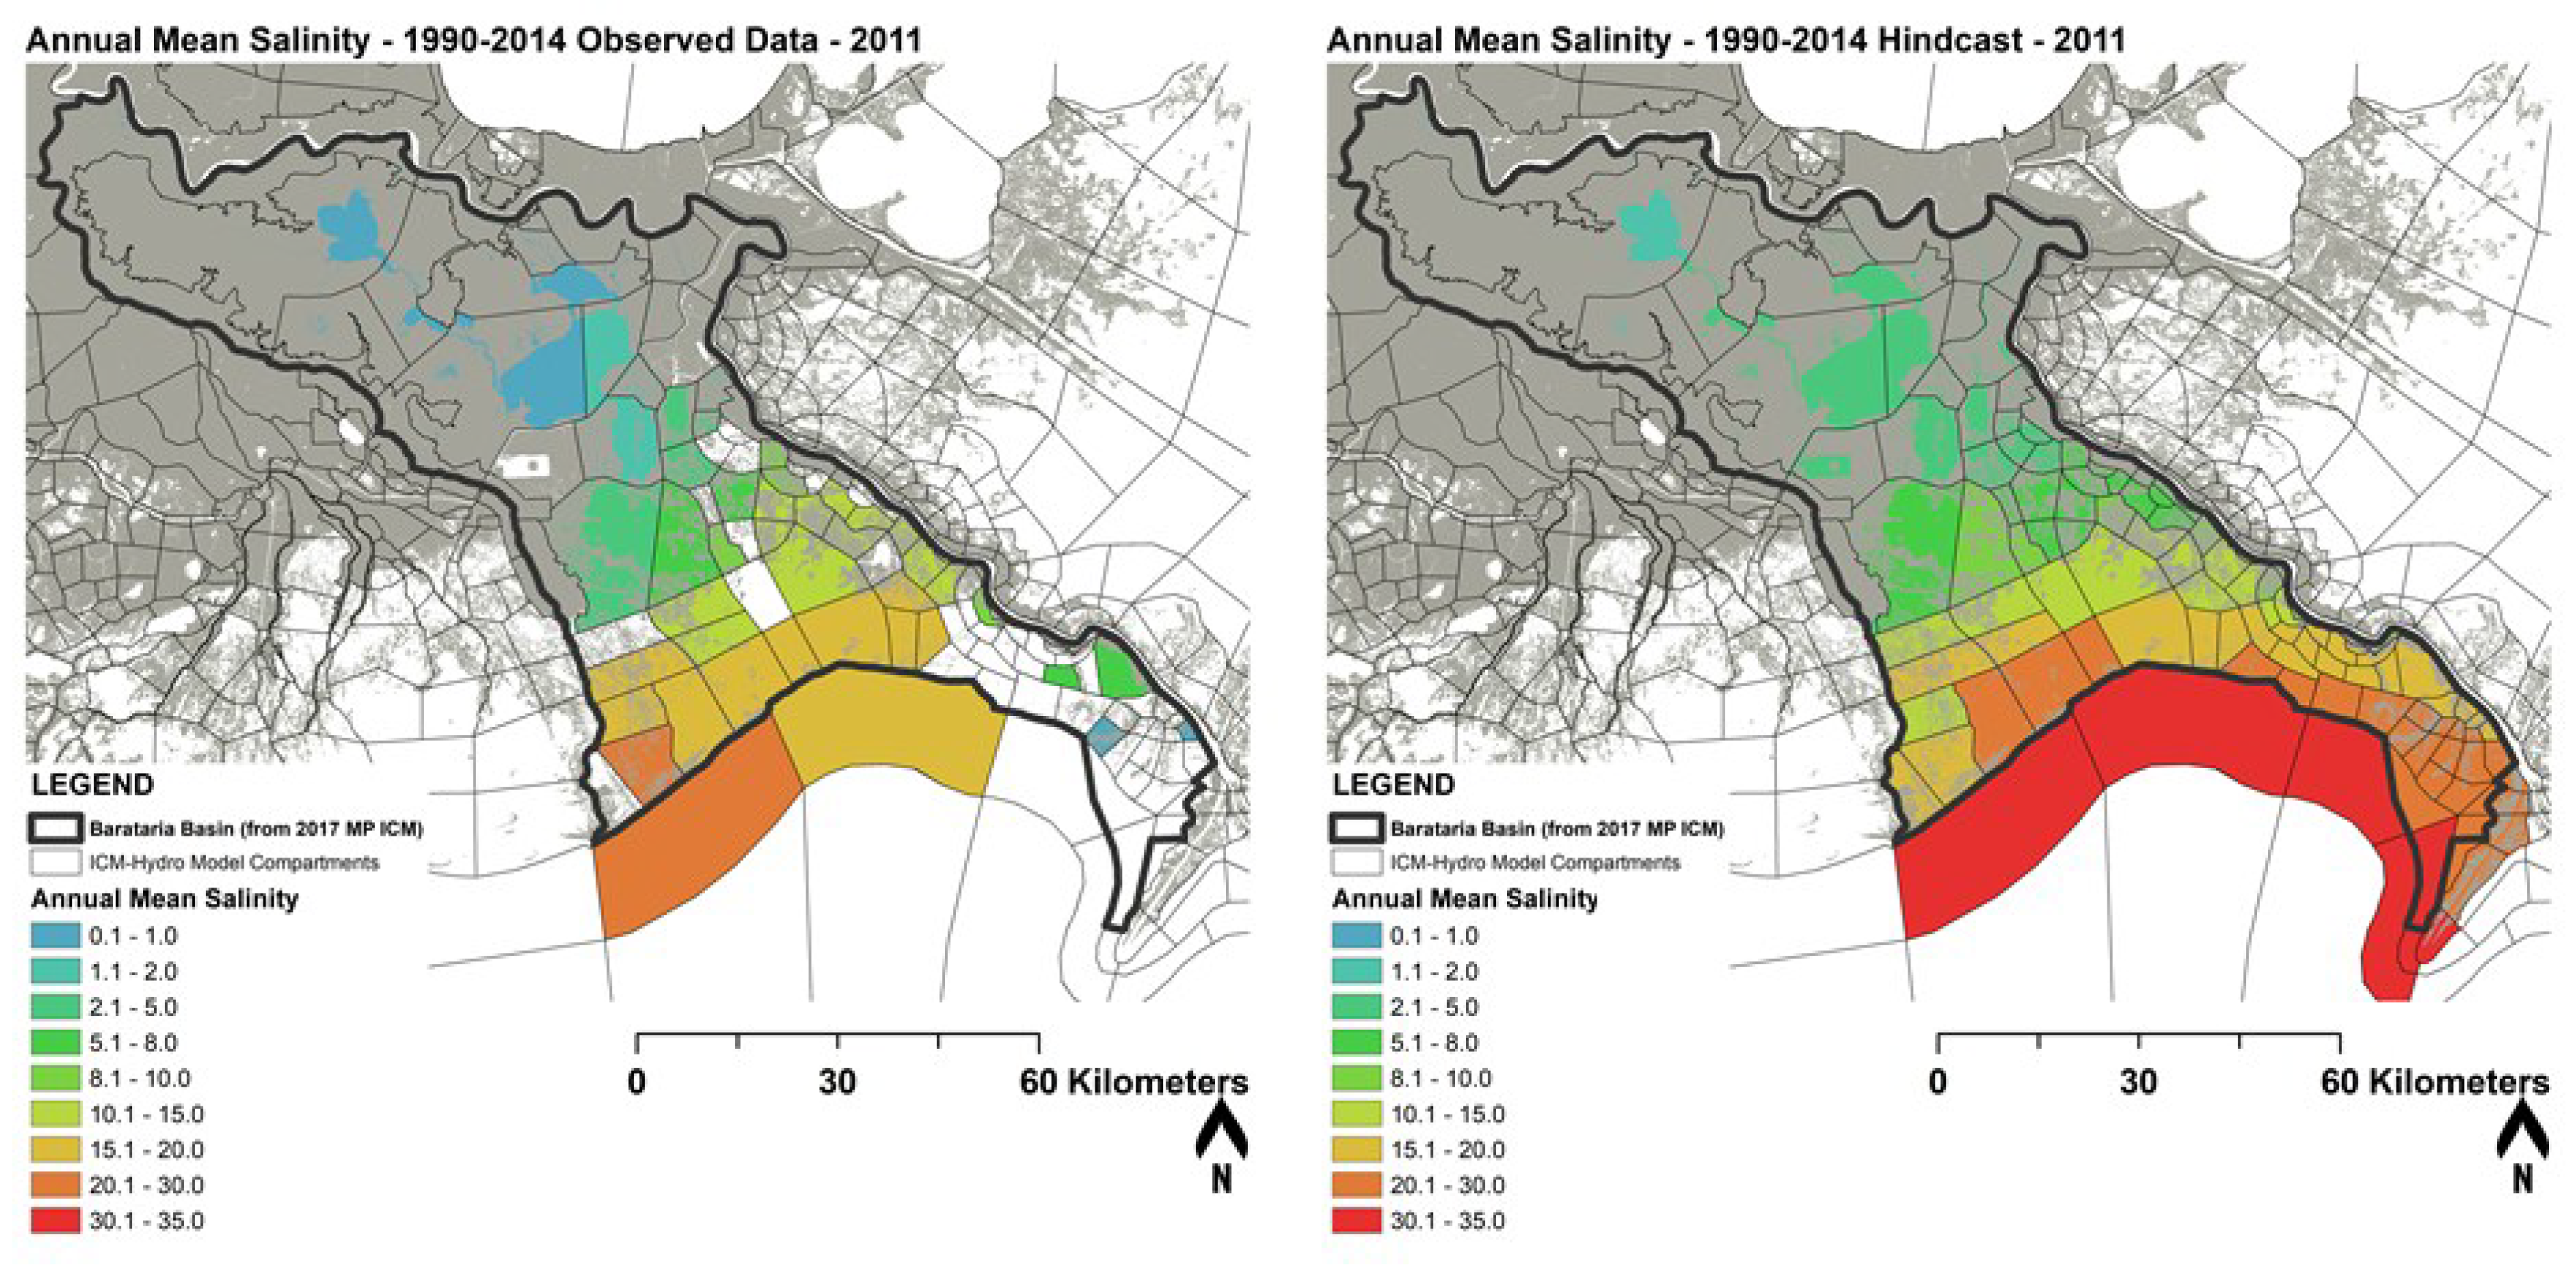
3.2.1. ICM Results—Hindcast Period

Of the five scenarios analyzed with the ICM, the hindcast period provides a comparison to the historic observational data that can best lead to an assessment of the model performance in the Barataria Basin. While Brown et al. [34] indicated that model performance is good for overall model-to-observed error, it appears as if the modeled salinity may be a bit over-predicted in the upper portions of Barataria Basin. The ICM-predicted salinity in Lake Salvador is over 5.0 ng/kg during a low flow year, whereas the observed salinity in this region was approximately 2.0 ng/kg (figures provided in Supplementary Material). This model trend continues for a higher-than-average river year (Figure 9) with an apparent over-prediction of salinity in the uppermost portions of Barataria Basin within the ICM. Other regions of the ICM domain appear to be more consistent with the observational data; particularly in the southwestern portion of the Basin (LBBw, UBBw) where the same general responses to low and non-low river years seen in the observational data is also evident in the ICM hindcast.
Differences between the hindcast outputs and observed data aside, the general salinity gradient in both north-south and east-west directions are fairly well captured by the ICM and will provide a useful tool to assess salinity patterns in Barataria Basin under the various hydrologic management scenarios tested by this analysis’ suite of scenarios. Further analysis of the model hindcast performance is included in the discussion section below.

3.2.2. ICM Results—Impact of Diversions under Various Future Conditions and Operational Regimes

Three simulations were conducted under a future scenario where ESLR rates were set equal to 0.08 m over 25 years, equal to the observed rate of change between 1993 and 2016 [39]. When simulating a future 25 years under historic sea level rise rates, the Davis Pond diversion results in a substantial reduction in annual mean salinities throughout the western portions of upper Barataria Basin, when operated under the assumed control rules. For example, Lake Salvador annual mean salinity is less than 1.0 ng/kg with Davis Pond active and between 2.0 and 5.0 ng/kg if it is not active. This impact increases further south into Little Lake and Hackberry Bay, with an increase from less than 1.0 ng/kg to over 5.0 ng/kg in the former location.
The trend of far-reaching salinity reductions (e.g., in Little Lake and Hackberry Bay) due to the inclusion or exclusion of Davis Pond is evident in numerous model years, as shown spatially in Figure 10 for year 10 of the future simulation (figures for year 25 are provided in Supplementary Materials). The time series of these impacts by salinity summary zone are also provided for annual mean salinity values (Figure 11) and for the number of days in a year in which the salinity is below the 8 ng/kg threshold for at least 120 consecutive hours (Figure 12).
The operation of Davis Pond reduces annual mean salinity values across the entire Barataria Basin (Figure 11) and an examination of periodic freshening via the 120 consecutive hours below 8 ng/kg threshold (Figure 12), indicates the amount of time below this threshold appears to substantially increase in all but the most upstream portions of the basin (UBMw and UBMe), which show a slight reduction in annual mean salinity but are always beneath the 8 ng/kg threshold, regardless of whether the Davis Pond diversion is active or not.
A notable exception to these trends in both annual mean and periodic freshening is the LBBe zone, which does not show a strong response to the Davis Pond diversion. This is most likely due to the proximity of LBBe to the Birdsfoot Delta and Mississippi River distributary channels which likely overwhelm any impact from the operation of Davis Pond.
Like the modeled Davis Pond diversion, the Mid-Barataria diversion appears to have relatively far-reaching impacts upon salinity throughout Barataria Basin. However, the impact is minimal in the upper portions of Barataria Basin, with respect to both the annual mean salinity and the amount of time below 8 ng/kg. The four regions of marsh areas upstream of Barataria Basin (UBMw, UBMe, LBMw and LBMe) all show nearly identical results to the simulation in which only Davis Pond was activated. In other words, any impact on salinity in these zones is of the same magnitude as an impact that could be expected from solely operating Davis Pond at its operationally allowed maximum flow rates. While Davis Pond showed some salinity impacts in areas further Gulfward (zones UBBw, UBBe, LBBw), the addition of the Mid-Barataria sediment diversion would substantially decrease annual mean salinities (Figure 11) while increasing the amount of time these regions would experience, at least 120 consecutive hours below 8 ng/kg (Figure 12).
The impact of Mid-Barataria diversion was also assessed in a simulation with higher rates of ESLR and subsidence. The results from this simulation, shown in Figure 13, with respect to days in each year under the 8 ng/kg threshold for at least 120 h, were essentially identical in the uppermost portions of Barataria Basin (UBMw and UBMe zones) when compared to the Mid-Barataria diversion operated under historic rates of ESLR and subsidence (Figure 12). The river hydrograph (and subsequent diversion hydrograph) were identical to the historic sea level rise simulations, and the impact of the diversion in the lower marsh zones (LBMw and LBMe) was unchanged for the first 20 years of the simulation with the diversion active. However, in the last 5 years of the simulation, the simulation with only Davis Pond active started to see a decrease in the number of days beneath the 8 ng/kg threshold. This decrease is also evident in LBMe with the diversion active, but LBMw did not see a similar decrease. This decrease in periodic freshening is evident in the last 5 years of the simulation in all of the other zones (UBBw, UBBe, LBBw and LBBe) for both the simulation with and without an active Mid-Barataria diversion.

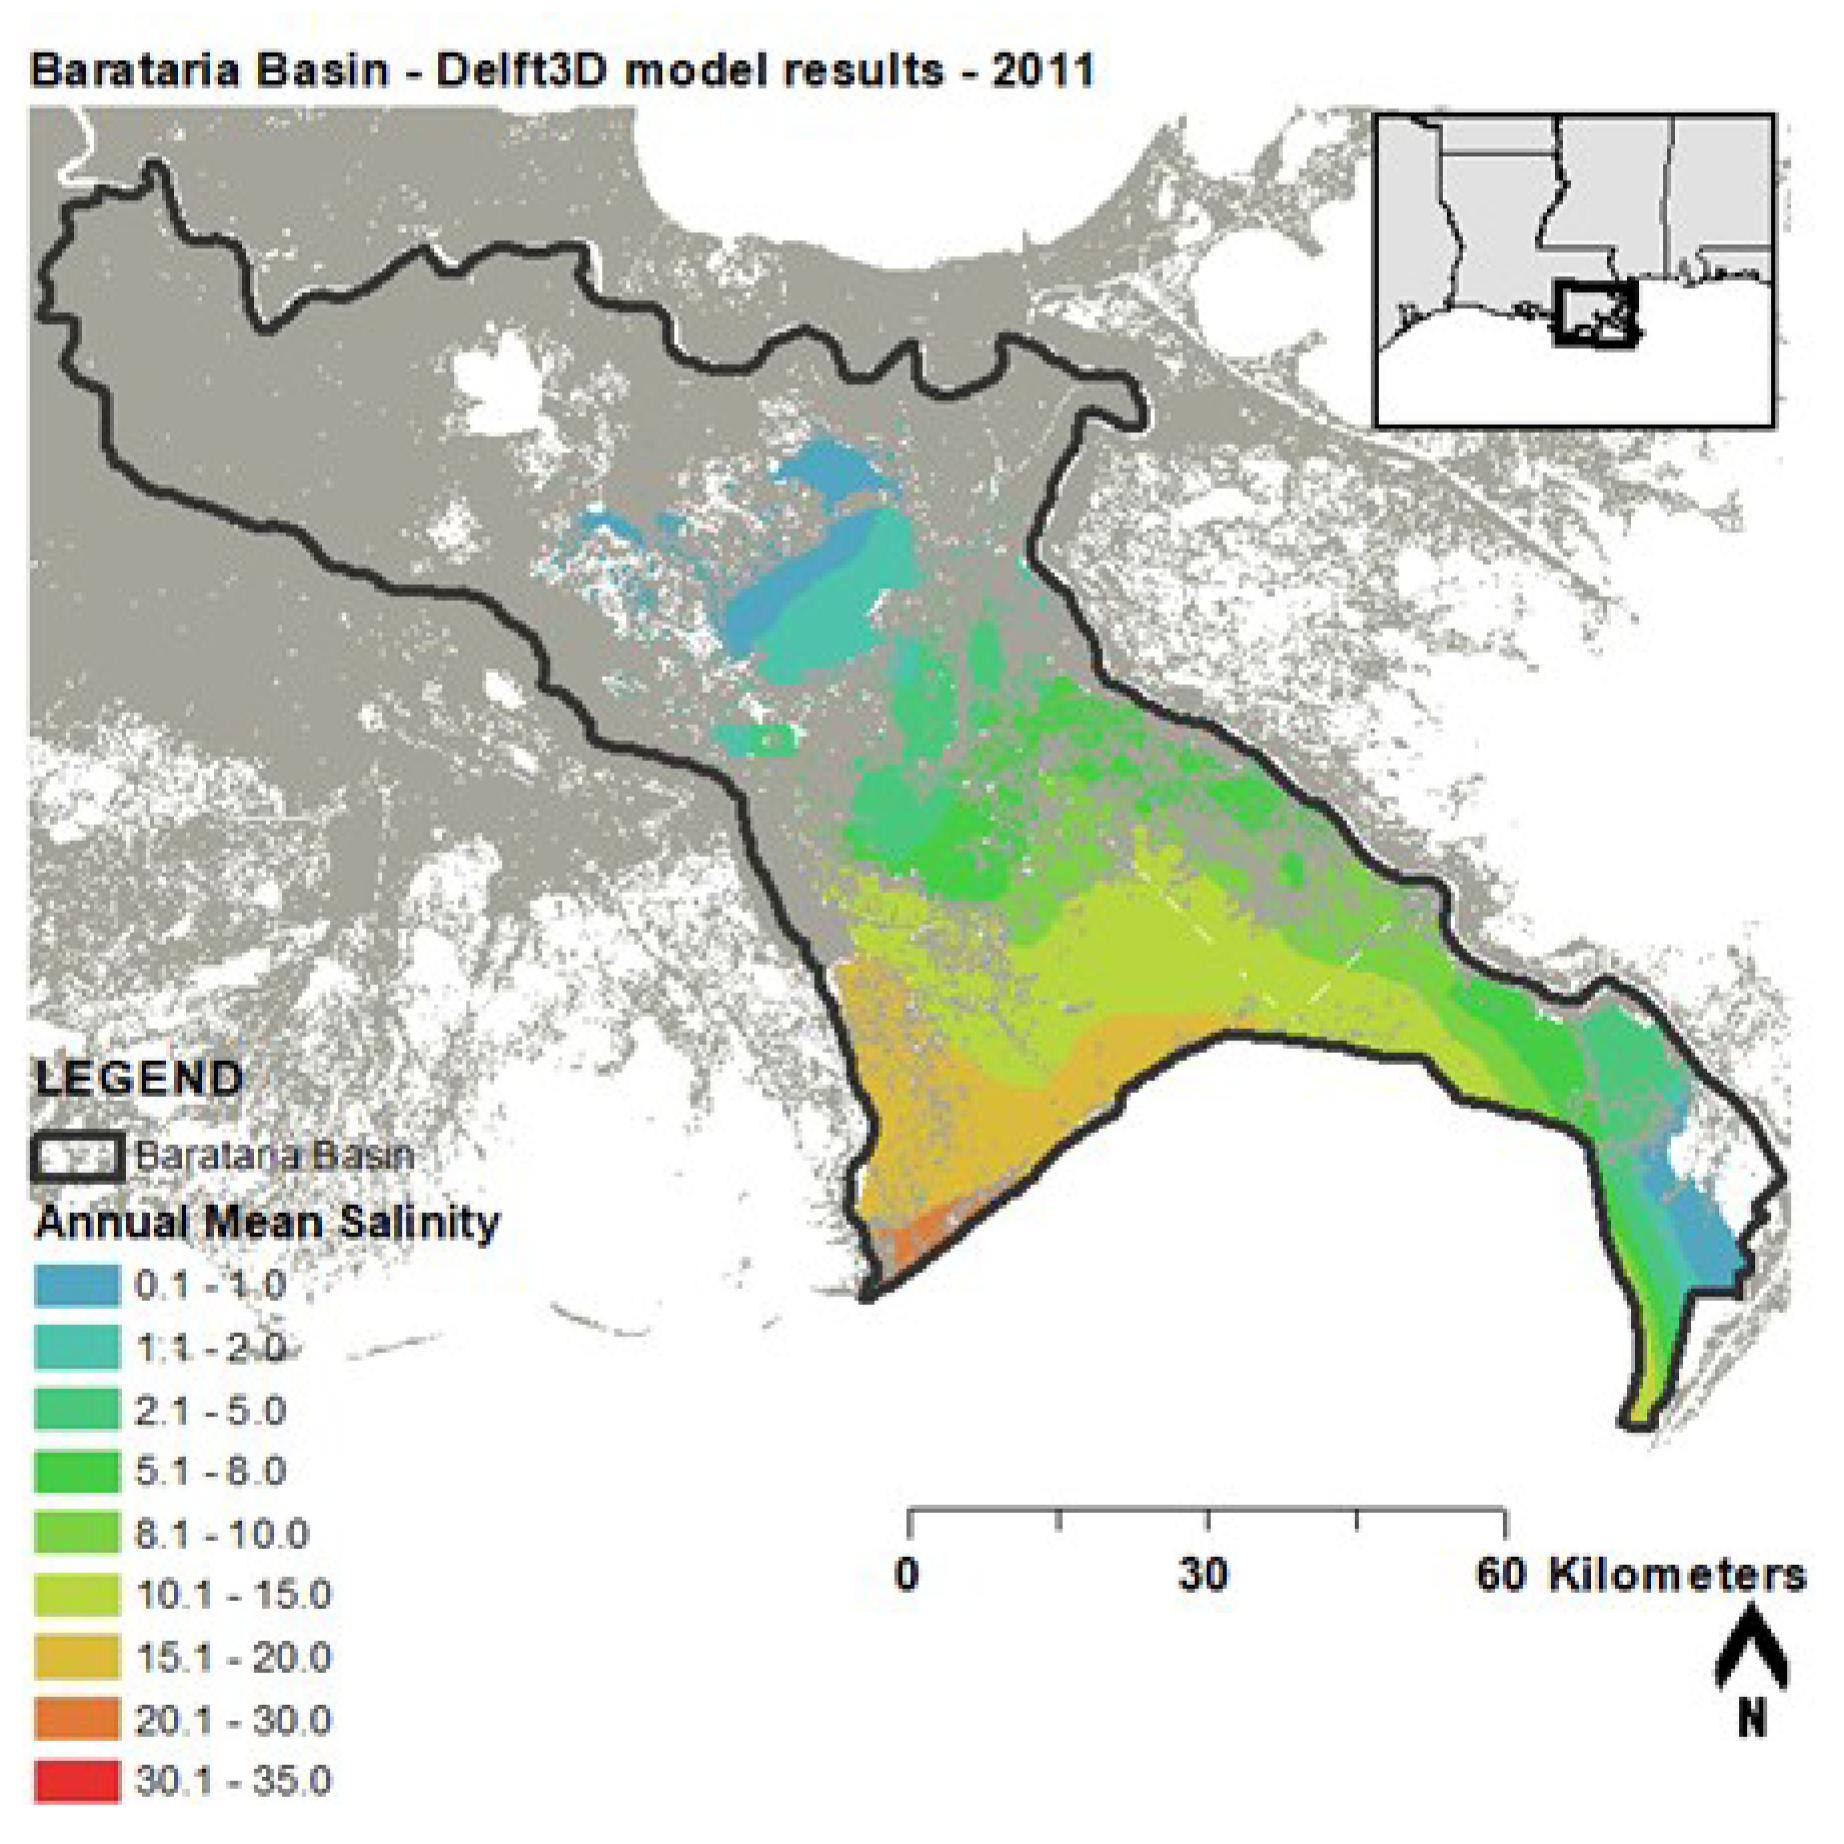
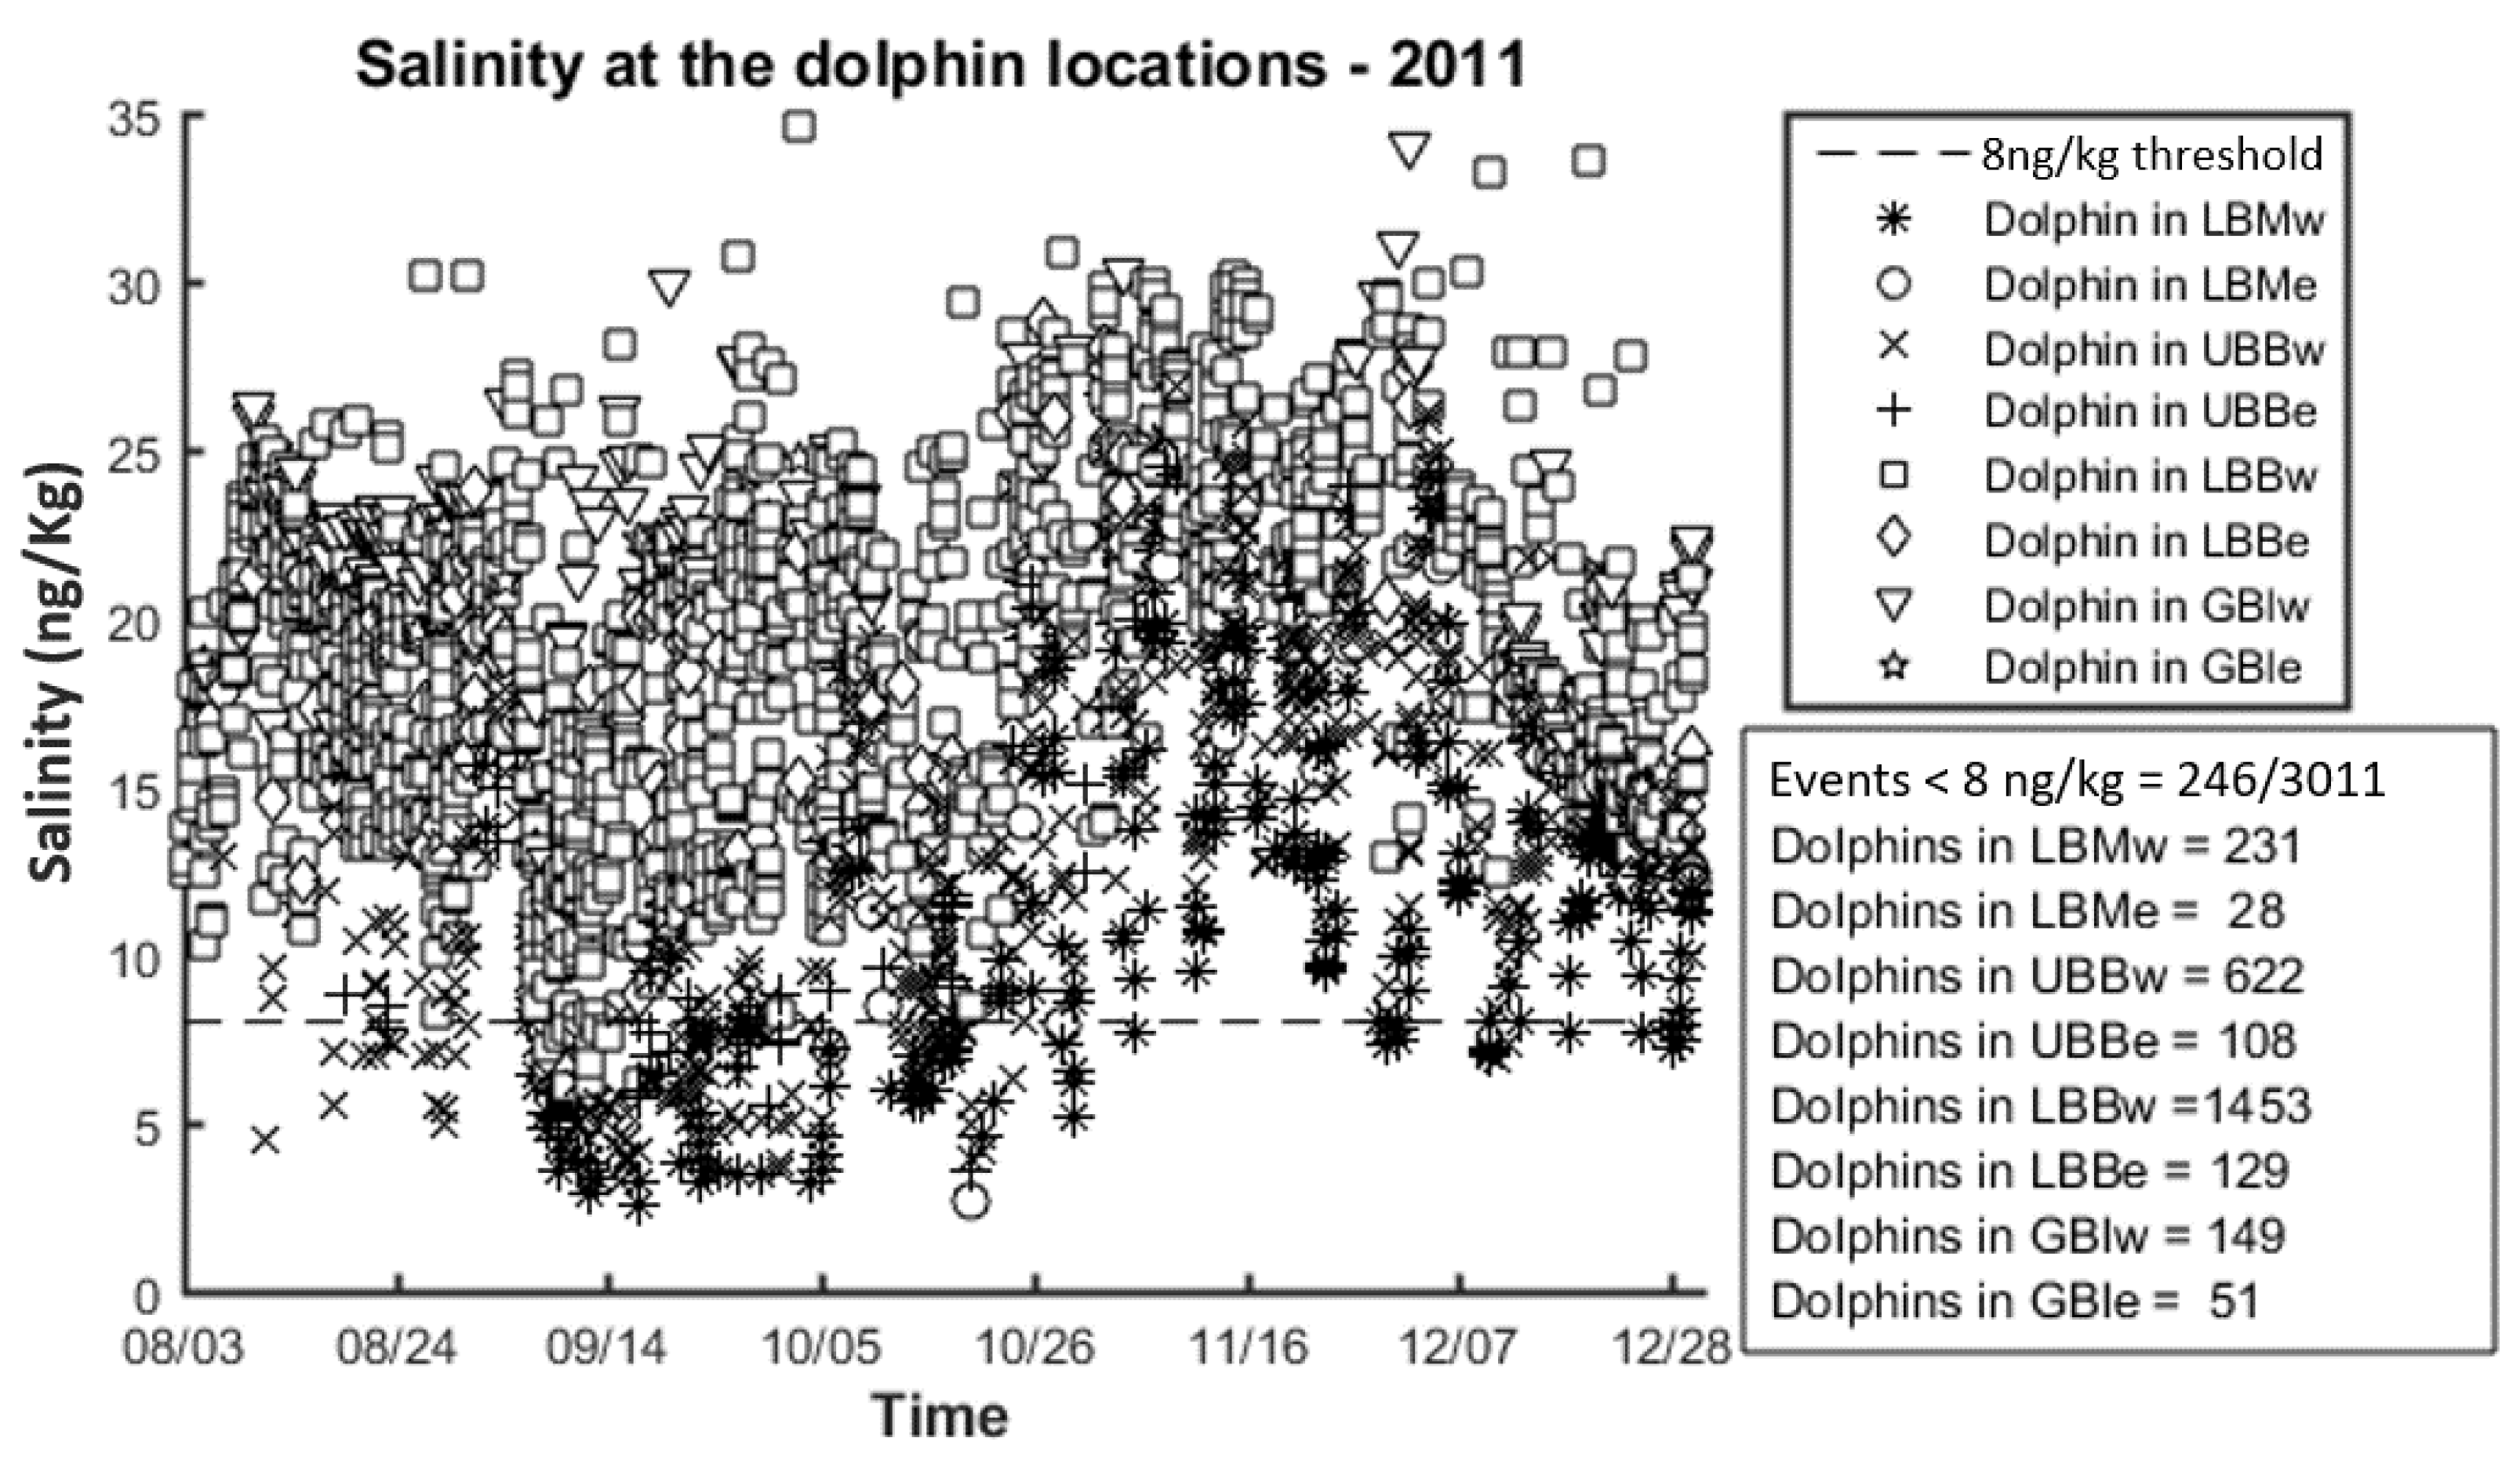
3.2.3. Delft3D Results

The Delft3D model has a higher spatial resolution than the ICM model and can provide a wider coverage in both space and time than the observational data. Therefore, it was used to simulate spatial patterns of salinity in Barataria Basin and was compared more in depth to the observed dolphin location/telemetry data. Four years for which dolphin location data were available were simulated with the Delft3D model; in particular 2011, 2012, 2013 and 2014. The Mississippi River discharge for these four modeled years is shown in Figure 14.
The Delft3D-predicated annual mean salinity for 2011, a high river year, is shown in Figure 15. The upper portion of the modeled Barataria Basin indicates a transition of increasing salinity across Lake Salvador with fresher regions in the northwest of the lake at less than 1 ng/kg. The salinity gradient increases regularly downstream in the basin with the highest salinity values in the southwestern corner of Barataria Basin near Caminada Bay and Grand Isle; these areas are west of the Barataria Waterway and are furthest from any sources of freshwater coming from the Mississippi River.
Daily average model salinity animations and maps for the four model years (2011–2014) were generated and compared to the daily dolphin positions in order to understand the salinity conditions preferred by these marine mammals. The animations are provided as supplemental data to this report and are available online (see Supplementary Material section). A static map is shown as an example of this output in Figure 16. The blue contour lines represent the 8 ng/kg threshold, where daily mean salinity upstream of this contour is less than 8 ng/kg, and the locations downstream (e.g., Gulfward) have modeled daily mean salinity greater; the pink dots represent the dolphin locations. Unlike the earlier analyses of observational data, the duration of salinity values less than 8 ng/kg is not included in the Delft3D analysis; rather, the images produced are a snapshot in time and space of both model-predicted salinity concentration and observed dolphin location.
In addition to the daily animations of salinity/dolphin location provided in the Supplementary Materials, Figure 17 shows a spatiotemporal analysis where the modeled salinity concentration was extracted each day for the exact locations at which dolphins were observed to be at on the respective day. The 8 ng/kg threshold is shown in the graphs in order to highlight when the dolphins were in a fresh area (<8 ng/kg) and when they were in a more saline environment. Each plot reports the number of events when the dolphins were in a “below 8 ng/kg” environment. The number of recorded telemetry data varies over time, so it is hard to define a clear pattern, but overall about 7% of the points are in a “below 8 ng/kg” environment. An additional dimension added to these figures is the basin zone (LBBe, UBBw, etc. as shown in Figure 3) in which each observed dolphin location fell in; these zones are depicted by marker shape in the figures.

4. Discussion

4.1. Historic Trends

The region southwest of Barataria Basin is the only portion that shows a distinct difference between the 48- and 120-h threshold periods (Figure 5 vs. Figure 6), a response that is consistent with the fact that these stations exhibit some of the highest long-term mean salinity concentrations and are also farthest away from any substantial source of fresh water (e.g., the Birdsfoot Delta, or the Davis Pond fresh water diversion). There are additional fresh water diversions which send flow from the Mississippi River into lower Barataria Basin (e.g., Naomi and West Pointe a la Hache siphons); however, the diverted flowrates in these structures are very small and do not appear to result in meaningful reductions in salinity for any extended period of time on the western side of Barataria Waterway.
The dolphin telemetry data collection done by Wells et al. [11] targeted the southwestern area of Barataria Basin in order to assess impacts from the BP oil spill on the local dolphin population. Other research [13,14,15] focused more generally on dolphin population behavior and environmental characteristics and studied similar regions of the basin; but for this telemetry analysis to be a true salinity assessment, the sampling program would need to survey dolphins in all areas of the basin. Notwithstanding the limitations of the sampling data used in this analysis, the visuals (spatial maps and time series analyses) are presented here to offer a framework and a systematic approach to shed light on the relationship between the spatiotemporal salinity variability and the dolphins’ travel patterns. The tagging program and data used in this research to illustrate the utility of this framework were not specifically designed to examine the salinity impacts on the travel patterns of dolphins. Therefore, the visuals presented cannot be used to draw conclusions; but rather illustrates how the approach can be used to understand that relationship.
Utilizing a specific salinity threshold (8 ng/kg in this case) appears to be a reasonably effective mechanism to link the transition from fresh to saline environment with a dolphin location when it is mapped as the summation of days in a year (or longer). However, this long-term-mean-based analysis appears to either miss transient temporal patterns (e.g., dolphins enter upper Barataria Basin in between fresh periods) or there may be some periods in which dolphins stay in locations that are below 8 ng/kg for some amount of time. These patterns not captured via the 5-day threshold analysis are examined in higher resolution with the Delft3D model results.

4.2. ICM Discussion

The ICM-predicted hindcast model reasonably captured the salinity gradients in Barataria Basin, with some differences in basin response to changing riverine conditions as represented by dry, wet, and flood years in the Mississippi River. While some of the differences in salinity and sensitivity to river hydrographs between the observational data and the model hindcast may be due to model error and uncertainties, some portion of the difference is likely attributable to: The assumed and calculated boundary conditions in the ICM hindcast simulations, the assumed flowrates on the lower river siphon structures (Naomi and West Pointe a la Hache), as well as error and data gaps within the observational dataset that may result in a poor representation of the annual mean salinity. In 2006, the CRMS observational network was just coming on line, and a large portion of the annual mean salinity calculated for 2006 is likely from discrete data sources that may have missed important periods of higher salinity that could have resulted in an underrepresentation of annual mean salinity concentrations. It is also important to note that the original model calibration and validation period only included CRMS and USGS continuous data stations. An additional calibration procedure could be conducted on this newly expanded data set of observed salinity concentrations; however, further model calibration was beyond the scope of this analysis.
The three historic sea-level-rise simulations examined the impact of the constructed Davis Pond freshwater diversion and the proposed Mid-Barataria sediment diversion with respect to a future in which neither of these projects are operated.
The spatial impact of the Davis Pond operations within the model correspond well to the salinity isohalines and monitoring locations utilized for operating Davis Pond [40]. While this spatial pattern is inherently influenced by the salinity monitoring points that were provided to the ICM-Hydro subroutine as control points, the scale of the model results is well bounded by the actual operational control plan implemented by practitioners since 2002.
While the footprint of salinity reduction in Barataria Basin appears to be well matched to the control points and isohaline locations defined in the operational plan, the magnitude of salinity reduction as modeled here may be greater than actually realized in the past observations, which is unproveable due to a lack of a control study. However, analysis of diverted flow volumes, estuarine basin volumes, and basin flushing times indicate that from 2002 through 2005, only 17% of the Barataria Basin volume was exchanged due to Davis Pond [48]. This 17% exchange occurred from an average operation of 40 days per year with the maximum diverted flowrate rarely exceeding 50 cms. The observed record for Davis Pond used in the hindcast model run was much more limited in discharge rate than the assumed operational plan allows for; average discharge from 2002 through 2005 was 13 cms, 4.5% of the operational maximum allowable discharge of 283 cms [48]. Since the beginning of 2011, the observed flow record from the USGS indicates that the operational maximum flowrate of 283 cms (10,000 cfs) has only been reached in six events, with no diversion events reaching this maximum rate since March of 2015. The model does not have the ability to have a manually variable flowrate, nor is the diversion discharge a function of the levels in the Mississippi River (an important hydraulic variable in diverted rates). During the 25-year simulation in which only Davis Pond was active, the salinity control thresholds were met 74% of the time, an increase in magnitude and total duration open, which was an average of 44% of the time from September 2002 through September 2005 [48]. The modeled future scenarios with assumed Davis Pond operations are therefore diverting a volume of fresh water substantially greater in volume and for longer duration than operators have traditionally followed in the past.
The magnitude of these salinity decreases (and increase in duration below 8 ng/kg) is dependent upon the flows in the Mississippi River; periodic spikes in the number of days below 8 ng/kg in Figure 12 corresponds with years of higher river flow in the Mississippi River. The amount of flow diverted through the Mid-Barataria structure increases linearly with river flow. Therefore, the diverted flow into Barataria Basin, and the subsequent reduction in salinities, will fluctuate rather significantly in the southwestern portion of Barataria Basin as a function of the Mississippi River hydrograph and diverted flow volumes.
The relative sensitivity of the UBBw, UBBe and LBBw zones to the Mid-Barataria diversion is consistent with previous findings that regions mid-estuary with steep salinity gradients may be the most influenced by potential diversion projects [1,19]. Areas that are predominantly fresh such as the upper marsh zones (UBMw and UBMe) have very low salinity values, regardless of whether any diversions are implemented or not; any additional fresh water inflow will have minimal impact. The lower marsh zones (LBMw and LBMe) are impacted by Davis Pond and any additional fresh water input from Mid-Barataria diversion makes little to no difference in further reducing the already reduced salinities in these zones.
In the upper portions of the bay, while there is some impact from Mid-Barataria diversion under historic rates of ESLR, it appears as if the bulk of fresh periods in the UBBw zone can be attributed to the Davis Pond diversion (Figure 12). The periodic freshening threshold criteria is met approximately 20 days in a year if no diversions are active and increases to approximately 200 days in a year if only Davis Pond is active. Adding the Mid-Barataria diversion increases this to an average of approximately 250 days in a year, with some years experiencing over 300 days with salinity less than 8 ng/kg for at least 120 consecutive hours.
In the adjacent zone to the east, UBBe, the relative impacts of Davis Pond and Mid-Barataria diversions are approximately equal (each subsequent diversion increases the amount of time below 8 ng/kg for 120 h by approximately 100 days in each year). In the most southwestern zone (LBBw), Davis Pond has a limited impact on periodic freshening and Mid-Barataria is the primary driver for periodic freshening, particularly during high river years when the number of days below 8 ng/kg for 120 h increases to over 100 from near zero when only Davis Pond (or no diversion) is active. When the river, and subsequent diversion flow is lower, the increase in periodic freshening in LBBw is much lower.
Under higher rates of RSLR, there is an increase in salinity in most of the modeled zones (Figure 13), even with the Mid-Barataria diversion active. These increases are consistent with the simulations conducted by Alymov et al. [49] for the development of the 2017 CMP. The higher RSLR scenario shows significant increases in both water levels and salinities throughout the Louisiana coastal zone, with or without restoration projects (including the Mid-Barataria sediment diversion). The magnitude of these increases changes through time due to an acceleration term on the ESLR rates. The further out the simulation year, the greater the difference between historic sea level rise rates (a constant rate of 0.08 m over 25 years; 0.0032 m/year) and the high rate, which has an exponentially increasing sea level rise rate for a total increase of 0.33 m by year 25.
Under the historic scenarios, the uppermost portions of Barataria Basin show essentially no difference in days above the 8 ng/kg salinity threshold whether only Davis Pond or both Davis Pond and Mid-Barataria diversion are active (UBMw, UBMe, LBMw, LBMe in Figure 12). Under the higher RSLR scenario (Figure 13) this is not the case; Davis Pond diversion alone is unable to prevent an increase in days above 8 ng/kg in both LBMw and LBMe zone. These results indicate that if higher rates of ESLR are to occur in future decades, the existing freshwater diversions into Barataria Basin at Davis Pond may be inadequate in maintaining present-day salinity dynamics.
It should be emphasized that the above discussion regarding the relative impacts of Mid-Barataria and Davis Pond diversions is predicated on the operational rules being modeled for both. As previously discussed, the reliance on the Davis Pond operational flow plan appears to divert a substantial amount of water that has not been historically diverted. However, the observational data indicates a sensitivity to dry conditions (low river year of 2010 in Figure 9) which follows the same general patterns of salinity response to the diversions. The Mid-Barataria diversion is operated in the model using an operational control regime intended to optimize the amount of sediment being diverted while reducing the diverted volume of water. The sensitivity of the LBBw zone (which has the highest concentration of dolphin location observation points in 2011) to the diversion operation is clearly seen in Figure 12, and it appears likely that an operational control regime could be developed to balance sediment delivery needs with a controlled salinity regime within the lower Barataria estuary.

4.3. Delft3D Discussion

The Delft3D annual mean salinity for 2011, a high river year, (Figure 15) conforms well to the spatial trends evident in the observed data (Figure 9). Lake Salvador, in the uppermost portions of the basin, appears to have salinity gradient with annual mean salinities in the northwestern portion of the lake less than 1 ng/kg. The annual mean salinity increases with proximity to the GIWW and has greater connectivity to Barataria Bay via the Barataria Waterway and several large water bodies (Little Lake, Hackberry Bay, etc.). The 2011 modeled annual mean salinity values of 15–20 ng/kg in the vicinity of Caminada Bay with higher values greater than 20 ng/kg near Grand Isle indicate strong agreement with the spatially averaged observed data for 2011. Similar model-observed agreement is evident closer to the sources of freshwater near the Mississippi River; annual mean salinity values of 5–10 ng/kg near the river with substantial freshening (<2 ng/kg) near the Birdsfoot Delta.
In addition to the strong model-observed agreement in long-term salinity trends within Barataria Basin, the daily salinity fluctuations, as predicted by Delft3D, correspond well with the observed daily measurements from the USGS and CRMS stations within the Barataria Basin.

5. Conclusions

Through compilation of a variety of sources, a comprehensive dataset was developed which aggregated a spatially varied mixture of discrete and continuous observational salinity data points into a time series of daily mean salinity across Barataria Basin at a variety of spatial scales. As a contribution to the science and practice communities, this comprehensive dataset will be made public through the Water Institute of the Gulf website.
The analysis performed here offers a visual and quantitative approach where spatial maps, animations and daily timeseries can be used as a framework that can be used to analyze salinity dynamics throughout the basin with respect to the amount of time any specific location within the basin was subjected to salinity values less than 8 ng/kg for extended periods of time. This criterion was chosen for its significance to bottlenose dolphins, a marine mammal species in Barataria Basin that is sensitive to extended periods of low salinity water. The framework presented here can be applied with any other threshold or even multiple thresholds.
The threshold analysis conducted to quantify periodic freshening appears to be an effective approach to compare against observed dolphin locations. However, the temporally-aggregated approach masked the movement of dolphins into and out of zones of fresher waters. Therefore, a Delft3D model of Barataria Basin was used to simulate the 4 years with available dolphin telemetry data. These high-resolution numerical simulations showing the spatial and temporal dynamics of the 8 ng/kg isohaline contour are a more effective approach to compare against dolphin movements with respect to salinity dynamics. The original dolphin telemetry data were designed to evaluate the impacts of the BP oil spill on the animals and a later study used this to determine a potential threshold. The purpose of the initial study is important because it influenced the primary tagging locations. The results presented in this research show that the model is capable of analyzing the relationship between the animal’s movement in regards to the temporal and spatial changes in salinity. For this analysis to be valid and comprehensive, a carefully designed sampling program is needed such that animals from all regions are included in the surveys.
Barataria Basin is subjected to numerous fresh water diversions off the Mississippi River, and there are more proposed for construction as part of the 2017 Coastal Master Plan. The ICM, which was developed for the Master Plan analyses, was used to assess the impact of the Davis Pond fresh water diversion (which was activated in 2002) and the proposed Mid-Barataria sediment diversion on salinity dynamics, including periodic freshening, under both historic sea level rise conditions and a case of high RSLR into the future. Based on these simulations, the magnitude of salinity impacts from Davis Pond (as it was modeled based on the operational control plan, which results in much more diverted fresh water than has been seen in observational records) and Mid-Barataria diversion are comparable in most upper portions of Barataria Basin where salinities are generally low. Near Caminada Bay, far from existing sources of fresh water, the Mid-Barataria diversion has much larger impacts on periodic freshening than that of Davis Pond, particularly during years with high flows in the Mississippi River. Higher rates of RSLR rise did not change the relative impact of these diversions after two decades of simulation. However, in the third decade, when the assumed RSLR began to accelerate exponentially, the diversion impacts appeared to begin to diminish due to an overall increase in salinity as a result of higher relative sea levels.

Supplementary Materials

The following are available online at https://www.mdpi.com/2073-4441/10/8/1015/s1. Additional figures and discussion surrounding the model development, validation, and analyses conducted here are provided as Supplementary Material to this article. This material also includes: animations of daily average salinity from Delft3D model output and daily dolphin locations for 2011 through 2014, salinity observations, spatially averaged daily timeseries, and GIS files for the observation sites and spatial averaging regions used in this analysis. This data is available online as Supplementary Material or can be downloaded from: https://thewaterinstitute.org/projects/nwf-barataria-salinity-project.

Author Contributions

Conceptualization, E.M.; Data Curation, E.D.W. and L.M.; Formal Analysis, E.D.W., F.M., L.M. and E.M.; Funding Acquisition, E.M.; Investigation, E.D.W., F.M. and E.M.; Methodology, E.D.W., F.M. and E.M.; Project Administration, E.M.; Software, E.D.W.; Supervision, E.M.; Visualization, E.D.W., F.M. and L.M.; Writing–Original Draft, E.D.W., F.M. and L.M.; Writing-Review & Editing, E.D.W. and E.M.

Funding

This research was funded by the National Wildlife Federation under contract number NWF ID:1701-004.

Acknowledgments

The Integrated Compartment Model development and calibration discussed in this work was initially funded by the Louisiana Coastal Protection and Restoration Authority; the authors are indebted to the many researchers and engineers who participated in the 2017 Coastal Master Plan analyses and assisted in those efforts. The Delft3D basin wide model development and calibration discussed in this work was partially funded by the Louisiana Coastal Protection and Restoration Authority. The authors want to thank the Institute colleagues who participated in this effort, in particular Kazi Sadid, Hoonshin Jung, and Melissa Baustian. Additional thanks to the observational researchers who were gracious in sharing decades of salinity measurements with us for this project, in particular Erick Swenson and Gene Turner, both at Louisiana State University.

Conflicts of Interest

The authors declare no conflict of interest. The funders had no role in the design of the study; in the collection, analyses, or interpretation of data; in the writing of the manuscript, and in the decision to publish the results.

References

  1. Inoue, M.; Park, D.; Justic, D.; Wiseman, W.J., Jr. A high-resolution integrated hydrology–hydrodynamic model of the Barataria Basin system. Environ. Model. Softw. 2008, 23, 1122–1132. [Google Scholar] [CrossRef]
  2. Das, A.; Justic, D.; Inoue, M.; Hoda, A.; Huang, H.; Park, D. Impacts of Mississippi River diversions on salinity gradients in a deltaic Louisiana estuary: Ecological and management implications. Estuar. Coast. Shelf Sci. 2012, 111, 17–26. [Google Scholar] [CrossRef]
  3. Hornsby, F.; McDonald, T.; Balmer, B.; Speakman, T.; Mullin, K.; Rosel, P.; Wells, R.; Telander, A.; Marcy, P.; Schwacke, L. Using salinity to identify common bottlenose dolphin habitat in Barataria Bay, Louisiana, USA. Endanger. Species Res. 2017, 33, 181–192. [Google Scholar] [CrossRef] [Green Version]
  4. Habib, E.; Nuttle, W.K.; Rivera-Monroy, V.H.; Gautam, S.; Wang, J.; Meselhe, E.; Twilley, R.R. Assessing Effects of Data Limitations on Salinity Forecasting in Barataria Basin, Louisiana, with a Bayesian Analysis. J. Coast. Res. 2007, 23, 749–763. [Google Scholar] [CrossRef]
  5. Gagliano, S.M.; Meyer-Arendt, K.J.; Wicker, K.M. Land loss in the Mississippi River deltaic plain. Trans. Gulf Coast Assoc. Geol. Soc. 1981, 31, 295–300. [Google Scholar]
  6. Wiseman, W.J., Jr.; Swenson, E.; Power, J. Salinity trends in Louisiana estuaries. Estuaries 1990, 13, 265–271. [Google Scholar] [CrossRef]
  7. McMillan, H.; Krueger, T.; Freer, J. Benchmarking observational uncertainties for hydrology: Rainfall, river discharge and water quality. Hydrol. Process. 2012, 26, 4078–4111. [Google Scholar] [CrossRef]
  8. Hijuelos, A.C.; Sable, S.E.; O’Connell, A.M.; Geaghan, J.P.; Lindquist, D.C.; White, E.D. Application of species distribution models to identify estuarine hot spots for juvenile nekton. Estuaries Coasts 2016, 1–12. [Google Scholar] [CrossRef]
  9. Rose, K.A.; Huang, H.; Justic, D.; de Mutsert, K. Simulating fish movement responses to and potential salinity stress from large-scale river diversions. Mar. Coast. Fish. 2014, 6, 43–61. [Google Scholar] [CrossRef]
  10. Visser, J.; Duke-Sylvester, S. LaVegMod v2: Modeling coastal vegetation dynamics in response to proposed coastal restoration and protection projects in Louisiana, USA. Sustainability 2017, 9, 1625. [Google Scholar] [CrossRef]
  11. Wells, R.; Schwacke, L.; Rowles, T.; Balmer, B.; Zolman, E.; Speakman, T.; Townsend, F.; Tumlin, M.; Barleycorn, A.; Wilkinson, K. Ranging patterns of common bottlenose dolphins Tursiops truncatus in Barataria Bay, Louisiana, following the Deepwater Horizon oil spill. Endanger. Species Res. 2017, 33, 159–180. [Google Scholar] [CrossRef] [Green Version]
  12. McDonald, T.; Hornsby, F.; Speakman, T.; Zolman, E.; Mullin, K.; Sinclair, C.; Rosel, P.; Thomas, L.; Schwacke, L. Survival, density, and abundance of common bottlenose dolphins in Barataria Bay (USA) following the Deepwater Horizon oil spill. Endanger. Species Res. 2017, 33, 193–209. [Google Scholar] [CrossRef] [Green Version]
  13. Miller, C.E. Abundance Trends and Environmental Habitat Usage Patterns of Bottlenose Dolphins (Tursiops truncatus) in Lower Barataria and Caminada Bays, Louisiana. Ph.D. Thesis, Louisiana State University, Baton Rouge, LA, USA, 2003. [Google Scholar]
  14. Miller, C.E.; Baltz, D.M. Environmental characterization of seasonal trends and foraging habitat of bottlenose dolphins (Tursiops truncatus) in northern Gulf of Mexico bays. Fish. Bull. 2009, 108, 79–86. [Google Scholar]
  15. National Marine Fisheries Service. A Review of Common Bottlenose Dolphins (Tursiops truncatus truncatus) in the Northern Gulf of Mexico: Population Biology, Potential Threats, and Management; Northern Gulf of Mexico Bay, Sound and Estuary Stocks; National Marine Fisheries Service: Silver Spring, MD, USA, 2011.
  16. De Mutsert, K.; Cowan, J.H.; Walters, C.J. Using ecopath with ecosim to explore nekton community response to freshwater diversion into a Louisiana estuary. Mar. Coast. Fish. 2012, 4, 104–116. [Google Scholar] [CrossRef]
  17. De Mutsert, K.; Cowan, J.H. A before-after–control-impact analysis of the effects of a Mississippi River freshwater diversion on estuarine nekton in Louisiana, USA. Estuaries Coasts 2012, 35, 1237–1248. [Google Scholar] [CrossRef]
  18. Meselhe, E.; McCorquodale, J.A.; Shelden, J.; Dortch, M.; Brown, T.S.; Elkan, P.; Rodrigue, M.D.; Schindler, J.K.; Wang, Z. Ecohydrology component of Louisiana’s 2012 Coastal Master Plan: Mass-balance compartment model. J. Coast. Res. 2013, 67, 16–28. [Google Scholar] [CrossRef]
  19. Wang, H.; Chen, Q.; Hu, K.; La Peyre, M.K. A modeling study of the impacts of Mississippi river diversion and sea-level rise on water quality of a deltaic estuary. Estuaries Coasts 2016. [Google Scholar] [CrossRef]
  20. Day, J.W., Jr.; Cable, J.E.; Cowan, J.H.; DeLaune, R.; de Mutsert, K.; Fry, B.; Mashriqui, H.; Justić, D.; Kemp, P.; Lane, R.R.; et al. The impacts of pulsed reintroduction of river water on a Mississippi delta coastal basin. J. Coast. Res. 2009, 54, 225–243. [Google Scholar] [CrossRef]
  21. Day, J.W., Jr.; Lane, R.; Moerschbaecher, M.; DeLaune, R.; Mendelssohn, I.; Baustian, J.; Twilley, R. Vegetation and soil dynamics of a Louisiana estuary receiving pulsed Mississippi river water following Hurricane Katrina. Estuaries Coasts 2013, 36, 665–682. [Google Scholar] [CrossRef]
  22. Piazza, B.P.; La Peyre, M.K. Restoration of the annual flood pulse in Breton Sound, Louisiana, USA: Habitat change and nekton community response. Aquat. Biol. 2007, 1, 109–119. [Google Scholar] [CrossRef]
  23. Piazza, B.P.; La Peyre, M.K. Nekton community response to a large-scale Mississippi River discharge: Examining spatial and temporal response to river management. Estuar. Coast. Shelf Sci. 2011, 91, 379–387. [Google Scholar] [CrossRef]
  24. Snedden, G.A.; Cretini, K.; Patton, B. Inundation and salinity impacts to above- and belowground productivity in Spartina patens and Spartina alterniflora in the Mississippi River deltaic plain: Implications for using river diversions as restoration tools. Ecol. Eng. 2015, 81, 133–139. [Google Scholar] [CrossRef]
  25. Flemer, D.A.; Champ, M.A. What is the future fate of estuaries given nutrient over-enrichment, freshwater diversion and low flows? Mar. Pollut. Bull. 2006, 52, 247–258. [Google Scholar] [CrossRef] [PubMed]
  26. Ward, G.H. Marsh Enhancement by Freshwater Diversion. J. Water Resour. Plan. Mgnag. 1985, 111. [Google Scholar] [CrossRef]
  27. Sanders, B.F.; Piasecki, M. Mitigation of Salinity Intrusion in Well-mixed Estuaries by Optimization of Freshwater Diversion Rates. J. Hydraul. Eng. 2002, 128. [Google Scholar] [CrossRef]
  28. Van Beek, J.L.; Roberts, D.; Davis, D.; Sabins, D.; Gagliano, S.M. Recommendations for Freshwater Diversion to Louisiana Estuaries East of the Mississippi River; Coastal Management Section, Louisiana Department of Natural Resurces: Baton Rouge, LA, USA, 1982. Available online: https://repository.library.noaa.gov/view/noaa/2484 (accessed on 25 July 2018).
  29. Turner, R.E. Water Quality Data from the Barataria Basin, 1994–2016. Gulf of Mexico Research Initiative—Coastal Waters Consortium II: Corpus Christi, TX, USA, 2017. [Google Scholar] [CrossRef]
  30. White, E.D.; Meselhe, E.; McCorquodale, A.; Couvillion, B.; Dong, Z.; Duke-Sylvester, S.M.; Wang, Y. 2017 Coastal Master Plan: Attachment C3-22: Integrated Compartment Model (ICM) Development; Coastal Protection and Restoration Authority: Baton Rouge, LA, USA, 2017; pp. 1–49.
  31. Meselhe, E.; White, E.D.; Reed, D.J. 2017 Coastal Master Plan: Appendix C: Modeling Chapter 2—Future Scenarios; Coastal Protection and Restoration Authority: Baton Rouge, LA, USA, 2017; pp. 1–32.
  32. Couvillion, B.R.; Steyer, G.D.; Wang, H.; Beck, H.J.; Rybczyk, J.M. Forecasting the effects of coastal protection and restoration projects on wetland morphology in coastal Louisiana under multiple environmental uncertainty scenarios. J. Coast. Res. 2013, 67, 29–50. [Google Scholar] [CrossRef]
  33. Couvillion, B.R.; Beck, H. Marsh collapse thresholds for coastal Louisiana estimated using elevation and vegetation index data. J. Coast. Res. 2013, 63, 58–67. [Google Scholar] [CrossRef]
  34. Brown, S.; Couvillion, B.; de Mutsert, K.; Fischbach, J.; Roberts, H.; Rodrigue, M.; Schindler, J.; Thomson, G.; Visser, J.; White, E. 2017 Coastal Master Plan: Appendix C: Modeling Chapter 3—Modeling Components and Overview; Version Final; Coastal Protection and Restoration Authority: Baton Rouge, LA, USA, 2017; p. 72.
  35. Brown, S.; Couvillion, B.; Dong, Z.; Meselhe, E.; Visser, J.; Wang, Y.; White, E. 2017 Coastal Master Plan: Attachment C3-23: ICM Calibration, Validation, and Performance Assessment; Coastal Protection and Restoration Authority: Baton Rouge, LA, USA, 2017; pp. 1–95.
  36. Meselhe, E.; White, E.; Wang, Y. 2017 Coastal Master Plan: Attachment C3-24: Integrated Compartment Model Uncertainity Analysis; Coastal Protection and Restoration Authority: Baton Rouge, LA, USA, 2017; p. 68.
  37. Brown, S. 2017 Coastal Master Plan Modeling: Attachment C3-26: Hydrology and Water Quality Boundary Conditions; Coastal Protection and Restoration Authority: Baton Rouge, LA, USA, 2017; pp. 1–44.
  38. Couvillion, B. 2017 Coastal Master Plan: Attachment C3-27: Landscape Data; Coastal Protection and Restoration Authority: Baton Rouge, LA, USA, 2017; pp. 1–84.
  39. Sweet, W.V.; Kopp, R.E.; Weaver, C.P.; Obeysekera, J.; Horton, R.M.; Thieler, E.R.; Zervas, C. Global and Regional Sea Level Rise Scenarios for the United States; U.S. Department of Commerce, National Oceanic and Atmospheric Administration, National Ocean Service—Center for Operational Oceanographic Produces and Services: Silver Spring, MD, USA, 2017.
  40. Coastal Protection and Restoration Authority (CPRA). Davis Pond Operational Plan 2016–2017; Coastal Protection and Restoration Authority (CPRA): Baton Rouge, LA, USA, 2017.
  41. Reed, D.; Yuill, B. 2017 Coastal Master Plan: Attachment C2-2: Integrated Compartment Model (ICM) Development; Coastal Protection and Restoration Authority: Baton Rouge, LA, USA, 2017; pp. 1–15.
  42. Coastal Protection and Restoration Authority (CPRA). Louisiana’s Comprehensive Master Plan for a Sustainable Coast: Committed to Our Coast; Coastal Protection and Restoration Authority (CPRA): Baton Rouge, LA, USA, 2017; 392p.
  43. Liang, M.; Sadid, K.; Xing, F.; Messina, F.; Meselhe, E. TO15/16 Improvement of Model Grid and Bathymetry; The Water Institute of the Gulf. Funded by the Coastal Protection and Restoration Authority under Task Orders 15/16; Coastal Protection and Restoration Authority (CPRA): Baton Rouge, LA, USA, 2016.
  44. Meselhe, E.; Baustian, M.; Allison, M. Basin Wide Model Development for the Louisiana Coastal Area Mississippi River Hydrodynamic and Delta Management Study; The Water Institute of the Gulf. Prepared for and funded by the Coastal Protection and Restoration Authority; Coastal Protection and Restoration Authority (CPRA): Baton Rouge, LA, USA, 2015.
  45. Meselhe, E.A.; Jung, H.; Sadid, K.; Messina, F.; Baustian, M.M. TO46: Calibration and Validation of Delft3D Model Version 2—Comparison of V1 and V2 Model Performance; The Water Institute of the Gulf. Funded by the Coastal Protection and Restoration Authority under Task Order 46; Coastal Protection and Restoration Authority (CPRA): Baton Rouge, LA, USA, 2017.
  46. Messina, F.; Meselhe, E. TO15/16: Improvements to the Hydrodynamics and Salinity in Barataria; The Water Institute of the Gulf. Funded by the Coastal Protection and Restoration Authority under Task Orders 15/16; Coastal Protection and Restoration Authority (CPRA): Baton Rouge, LA, USA, 2016.
  47. Deltares. Delft3D-FLOW User Manual; Deltares: Delft, The Netherlands, 2014; Available online: http://oss.deltares.nl/web/delft3d/manuals (accessed on 25 July 2018).
  48. Swenson, E.M.; Cable, J.E.; Fry, B.; Justic, D.; Das, A.; Snedden, G.; Swarzenski, C. Estuarine flushing times influenced by freshwater diversions. Coast. Hydrol. Process. 2006, 33, 403–412. [Google Scholar]
  49. Alymov, V.; Cobell, Z.; de Mutsert, K.; Dong, Z.; Duke-Sylvester, S.; Fischbach, J.; Hanegan, K.; Lewis, K.; Lindquist, D.; McCorquodale, J.A.; et al. 2017 Coastal Master Plan: Appendix C: Modeling Chapter 4—Model Outcomes and Interpretations; Coastal Protection and Restoration Authority: Baton Rouge, LA, USA, 2017; 418p.
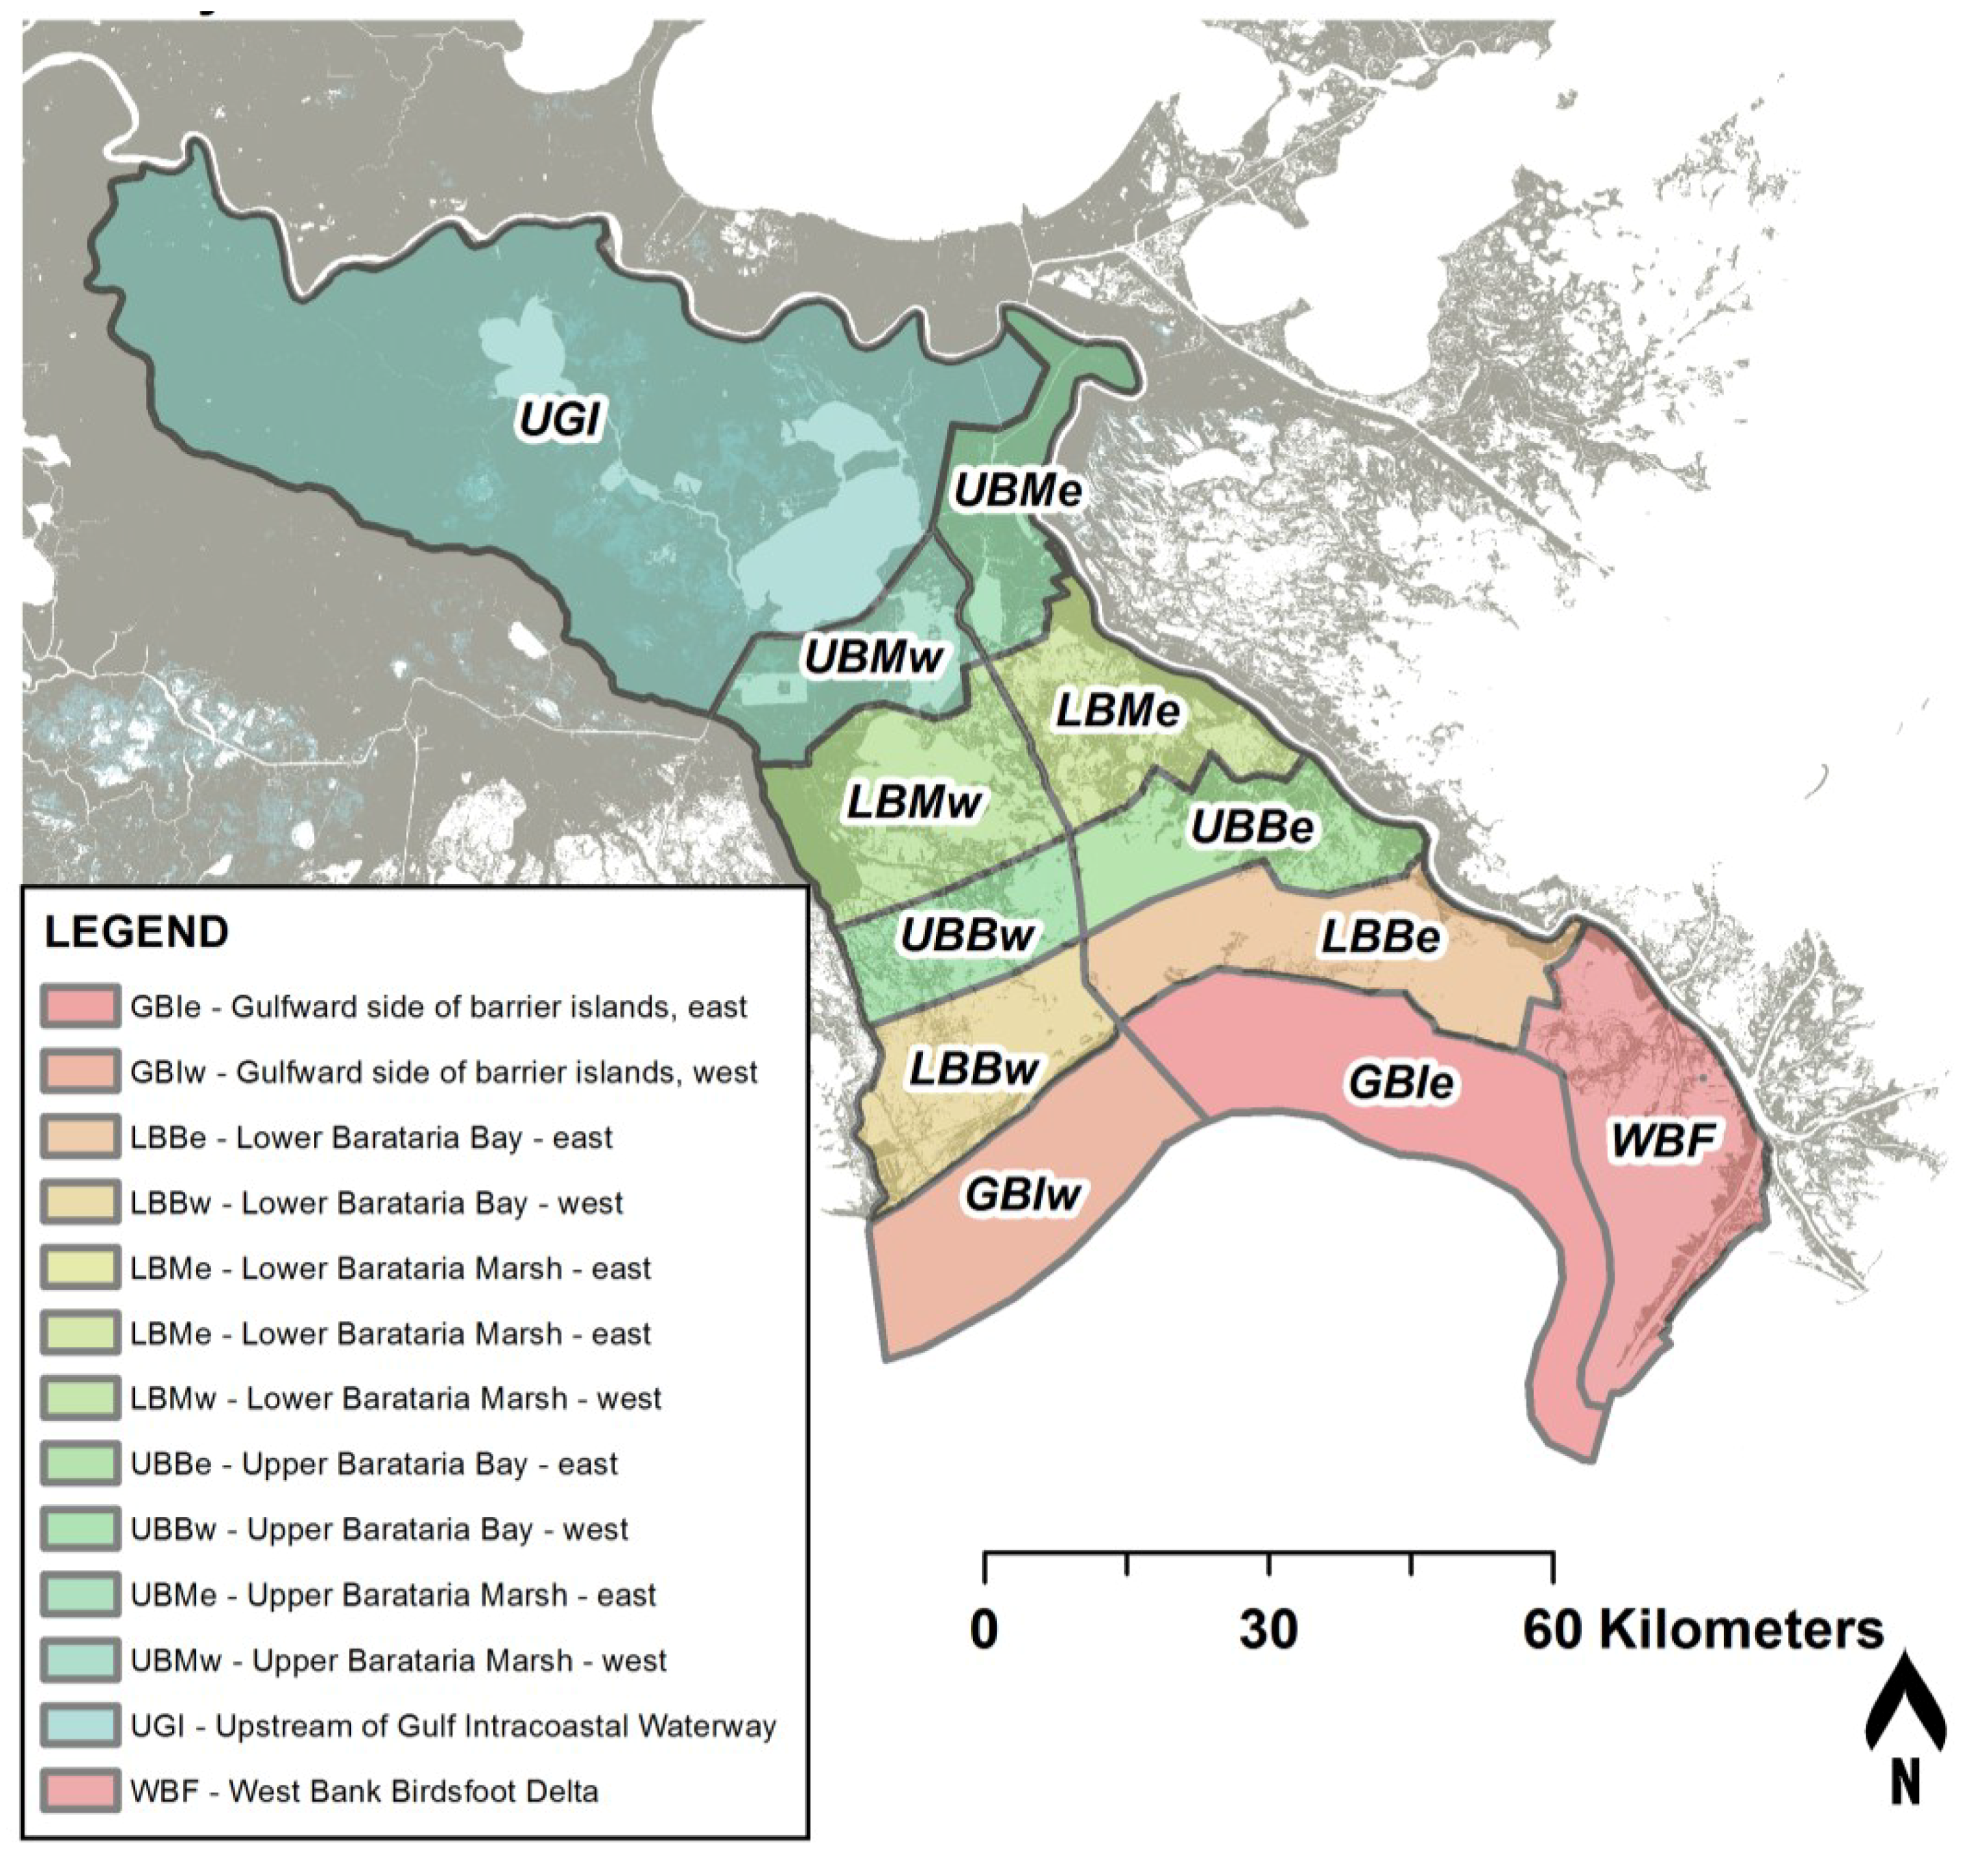
Figure 1. Barataria Basin regional extent, water bodies of interest in this analysis, and diversion locations.
Water 10 01015 g001
Figure 2. Location of all salinity monitoring data used in this analysis. Dot size on the map is proportional to data collection frequency; the larger the dot, the more frequent the monitoring.
Water 10 01015 g002
Figure 3. Subdivision of Barataria Basin into 12 zones.
Water 10 01015 g003
Figure 4. Basin-wide Delft3D model extension and subdivision in 12 domains.
Water 10 01015 g004
Figure 5. Average salinity by color gradient with the size of the points representing the number of events since 2008 where the salinity was less than 8 ng/kg for at least 48 consecutive hours.
Water 10 01015 g005
Figure 6. Average salinity by color gradient with the size of the points representing the number of events since 2008 where the salinity was less than 8 ng/kg for at least 120 consecutive hours.
Water 10 01015 g006
Figure 7. Annual mean salinity (ng/kg) (dot color) and number of days in which the mean salinity was less than 8 ng/kg for at least 120 consecutive hours (dot size) for 2011, overlaid with daily dolphin telemetry locations (purple dots) in 2011.
Water 10 01015 g007
Figure 8. Mississippi River Hydrograph for three selected years: 2006 (low flow), 2010 (average flow), and 2011 (high flow).
Water 10 01015 g008
Figure 9. Observed (left) and modeled hindcast (right) mean annual salinity (ng/kg) averaged across ICM-Hydro model compartments for a higher-than-average river year (2011). Refer to Figures S1 and S2 in Supplementary Materials for additional years.
Water 10 01015 g009
Figure 10. Model-predicted mean annual salinity under historic sea level rise rates during year 10 with only Davis Pond diversion active (top left), with both Davis Pond and Mid-Barataria diversions active (top right), and without any diversions active (bottom left). Figures for year 25 are provided in Supplementary Materials.
Water 10 01015 g010
Figure 11. Annual mean salinity by zone for three simulations under historic sea level rise rates: no diversions active (dotted), Davis Pond only (dashed), and both Davis Pond and Mid-Barataria diversions active (solid).
Water 10 01015 g011
Figure 12. Mean number of days in a year for each zone where daily mean salinity was below 8 ng/kg for at least five consecutive days for three simulations under historic sea level rise rates: no diversions active (dotted), only Davis Pond active (dashed), and both Davis Pond and Mid-Barataria diversions active (solid).
Water 10 01015 g012
Figure 13. Mean number of days in a year for each zone where daily mean salinity was below 8 ng/kg for at least five consecutive days for two simulations under high sea level rise rates: only Davis Pond active (dashed), and both Davis Pond and Mid-Barataria diversions active.
Water 10 01015 g013
Figure 14. Mississippi River Hydrograph for four modeled years: 2011, 2012, 2013, and 2014.
Water 10 01015 g014
Figure 15. Annual mean salinity for 2011, a high river year, as modeled by Delft3D.
Water 10 01015 g015
Figure 16. Basin-wide salinity model output (ng/kg) and dolphin locations (pink dots). Example for 2011 simulation.
Water 10 01015 g016
Figure 17. 2011 basin wide salinity model output and dolphin locations over time.
Water 10 01015 g017
Table 1. Description of twelve zones developed for spatially averaged salinity data.
ZoneDescriptionZoneDescription
UGIUpper Barataria Basin upstream of the GIWWWBFWest Bay and adjacent areas on the west bank side of the Birdsfoot Delta
UBMwUpper marshes between Barataria Bay and GIWW, west of Barataria WaterwayUBMeUpper marshes between Barataria Bay and GIWW, east of Barataria Waterway
LBMwLower marshes between Barataria Bay and GIWW, west of Barataria WaterwayLBMeLower marshes between Barataria Bay and GIWW, east of Barataria Waterway
UBBwUpper portion of Barataria Bay and adjacent wetlands, west of Barataria WaterwayUBBeUpper portion of Barataria Bay and adjacent wetlands, east of Barataria Waterway
LBBeLowermost portion of Barataria Bay and adjacent wetlands, west of Barataria WaterwayLBBeLowermost portion of Barataria Bay and adjacent wetlands, east of Barataria Waterway
GBIwGulfward side of barrier islands, west of Barataria WaterwayGBIeGulfward side of barrier islands, east of Barataria Waterway

