A Constructed Wetland System for Rural Household Sewage Treatment in Subtropical Regions

College of Environmental Science and Engineering, Central South University of Forestry and Technology, Changsha 410004, China
*
Author to whom correspondence should be addressed.
Water 2018, 10(6), 716; https://doi.org/10.3390/w10060716
Submission received: 2 May 2018
/
Revised: 26 May 2018
/
Accepted: 30 May 2018
/
Published: 1 June 2018
(This article belongs to the Section Wastewater Treatment and Reuse)
Abstract
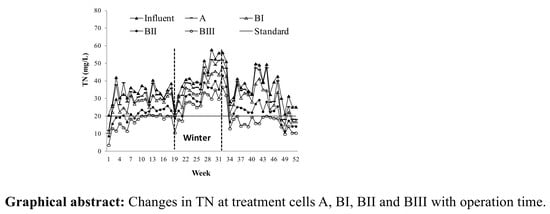
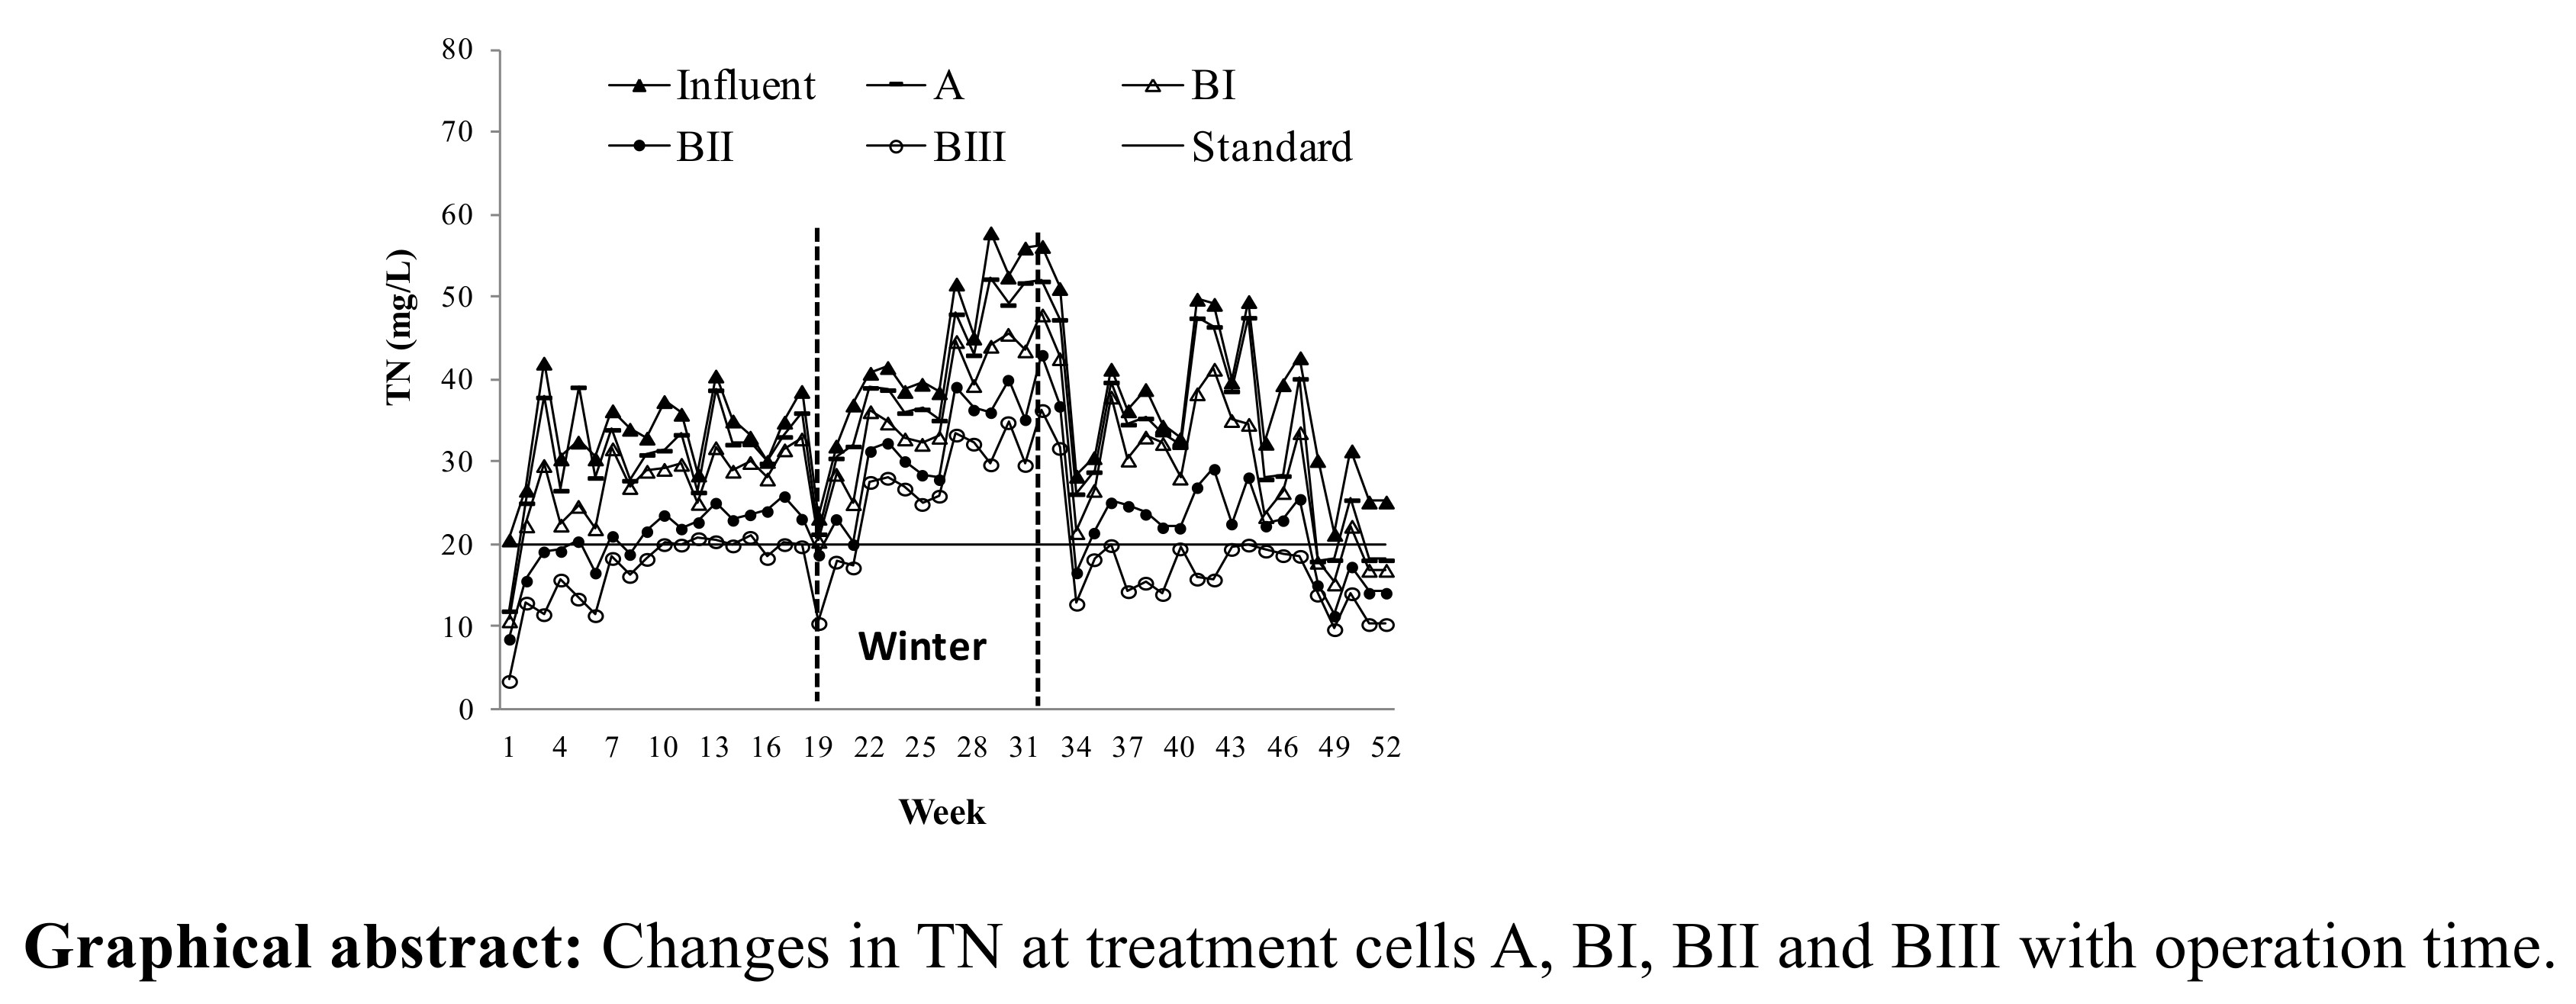
:A constructed wetland system, consisting of a surface-flow wetland cell connected in series with three vertical subsurface-flow wetland cells, was tested for treatment of domestic sewage from rural families in southern China. Diatomite, vermiculate, zeolite and hydrotalcite, were used, respectively, as filler adsorbents in the sequenced subsurface-flow cells for adsorption of organic, cationic and anionic pollutants. Selected trees, shrubs and annual herbs were planted to form a wetland plant community. The total treatment capacity, hydraulic loading rate and water retention time were 2 m3/d, 0.5 m/d and 48 h, respectively. Experimental data obtained from a year operation confirmed that the treatment process followed the dynamic pathway of pollutant transformation. The constructed system was effective to remove TSS, CODCr and BOD5 and their effluent concentrations met the first grade of the discharge standards legislated in China. The removal rates of TN, NH3-N and TP were relatively lower, and their effluent concentrations fell within the range between the first and second grade of the standards. An increase in initial pollutant loading and a decrease in temperature in winter caused apparent accumulation of TN, NH3-N and TP in the system. Discharge of sludge at adequate intervals was shown to be effective to enhance the treatment efficiency.
1. Introduction
Accounted for by its low construction and operation costs and ecologically responsible nature, constructed wetland technology (CW technology) has been rapidly developed as one of the alternative solutions for treatment of various types of wastewaters in different countries [1,2,3,4,5,6,7]. Examples [8,9] have shown that CW technology is very useful in rural and particularly mountainous areas where establishment of a centralized conventional treatment plant connected to long distance wastewater collection and transportation pipeline systems becomes an impossible option. With efforts to meet the demands for use of environmentally friendly and energy-saving technology to protect the rural environment, the present study was conducted to test a constructed wetland system for treatment of domestic sewage from rural families in southern China.
In order to obtain a better understanding of pollutant removal mechanisms, studies have been carried out by different workers on factors that determine the treatment efficiency of constructed wetland systems, including wetland types and combinations [5,10]; hydraulic and pollutant loads [2,11]; plant species [12,13,14]; substrates [15,16]; and their interactions [17,18], etc. The increasing trend in CW technology application coupled with stricter water quality standards requires development of better process design tools. Aimed at providing useful information for future design, efforts have been made in the following areas: dynamic simulation models [19,20,21,22]; treatment stages [23] and pollutant transformation cycles [24]. A constructed wetland is a designed ecosystem. The integrated function of a wetland system is complex, involving physical processes (sedimentation, flocculation, adsorption and volatilization); chemical reactions (hydrolysis, oxidation and reduction); biochemical reactions (degradation and transformation); biological activities (uptake and assimilation) and ecological processes (matter and energy exchange among bio-species and between the system and surroundings). The rates of the reactions that occur in a wetland system are related to environmental variables including temperature, dissolved oxygen, oxidation-reduction potential, and many other physical, chemical, biological and ecological characteristics. Because of the complexity of ecological processes and the unpredictability of the changes in environmental conditions that vary in localities, the design of constructed wetland systems has so far been based mainly on experiences without commonly accepted standard procedures. Most applied systems are more or less treated as black boxes with insufficient knowledge and data concerning the exact manners, mechanisms, functions and contributions of the interrelated processes.
One of the main objectives of the present study was focused on the development of design principles using the knowledge related to the transformation of the target pollutants and pathways of pollutant accumulation and removal. The functions of the designed treatment cells corresponding to specific stages of pollutant transformation and their treatment efficiencies were examined using sewage from a teaching building at the university. The ultimate goal of this study was to provide a technical model with basic data and parameters for design and application of constructed wetland systems for rural household sewage treatment.
2. Materials and Methods
2.1. Basic Parameters Used for Treatment Process Design
Although there are numbers of factors affecting the treatment process, the hydraulic loading rate (HLR, the volumetric flow rate divided by the wetland surface area) and water retention time (HRT, the ratio of the useable wetland water volume to the average flow rate) are the two key parameters that need to be determined for the design of a constructed wetland treatment system. Given wastewater type, HLR (m/d) determines not only the hydraulic and pollutant loads but also the required land area, or the land use efficiency, which is one of the highly concerned factors for application of CW technology. When HLR is given, HRT can be adjusted by the active depth of the treatment cells. In the investigated rural regions in Hunan Province, China, the amount of sewage discharge from a farmer’s house ranged between 0.5 and 1.5 t/d (approximately 180 L/d per person). Due to variation in wastewater types and localities, the HLR and HRT values applied by different workers [2,25,26] varied greatly from 0.06 to 0.49 m/d and a few hours to several days, respectively. Based on the data obtained from previous studies, the total treatment capacity, hydraulic loading rate, BOD5 loading rate, and water retention time designed for the constructed wetland system were 2 m3/d, 0.5 m/d, 60.9 g BOD5/m2/d and 48 h, respectively. The effluent quality was designed to meet the first grade B for the discharge standard of pollutants for a municipal wastewater treatment plant (GB 18918-2002) in China.
2.2. Sequence of Treatment Cells Related to the Transformation Pathway
Decomposition of organic pollutants normally takes several steps under different conditions. It is thus difficult to obtain a high pollutant removal rate from a single wetland unit without input of additional energy. In general, multiple cells connected in series are recommended to minimize short circuiting and maximize treatment efficiency [23,27]. Therefore, given HLR and HRT, it is necessary to determine the number and connection sequence of the treatment cells required to ensure treatment efficiency.
It is known that the overall decomposition reaction of organic pollutants follows the pathway,
where E denotes the energy released from the reaction and M denotes inorganic substances other than NH4+ and PO43−. The sequence of the reactions related to nitrogen-containing organic compounds, for example, can be described by
Large molecules → small molecules → CO2 + H2O + NH4+ + PO43− + M + E
Protein → amino acid → NH4+ → (NO2−) → NO3− → NO2, NO, N2
There are basically 4 steps in Reaction (2) for the transformation of various types of proteins into nitrogen gases: (1) hydrolysis of protein (splitting of large protein molecules into amino acids); (2) ammonification (release of NH3 from amino acid by oxidation, reduction or hydrolysis); (3) nitrification (oxidation of NH4+ to NO3− under aerobic conditions) and (4) denitrification (reduction of NO3− to NO2, NO or N2 under anaerobic conditions). Apart from being either removed by plant uptake or retained by microorganisms and plant roots in the system, NH4+, NO3− and PO43− can be adsorbed onto filler substrate (S),
S− + NH4+ === S-NH4
S+ + NO3− === S-NO3
3S+ + PO43− === S-3PO4
As a matter of fact, a large amount of soluble organic compounds can also be kept in precipitated or adsorbed forms. Use of substrate with high adsorption capacities can thus increase the system buffering capacity to resist pollutant loads.
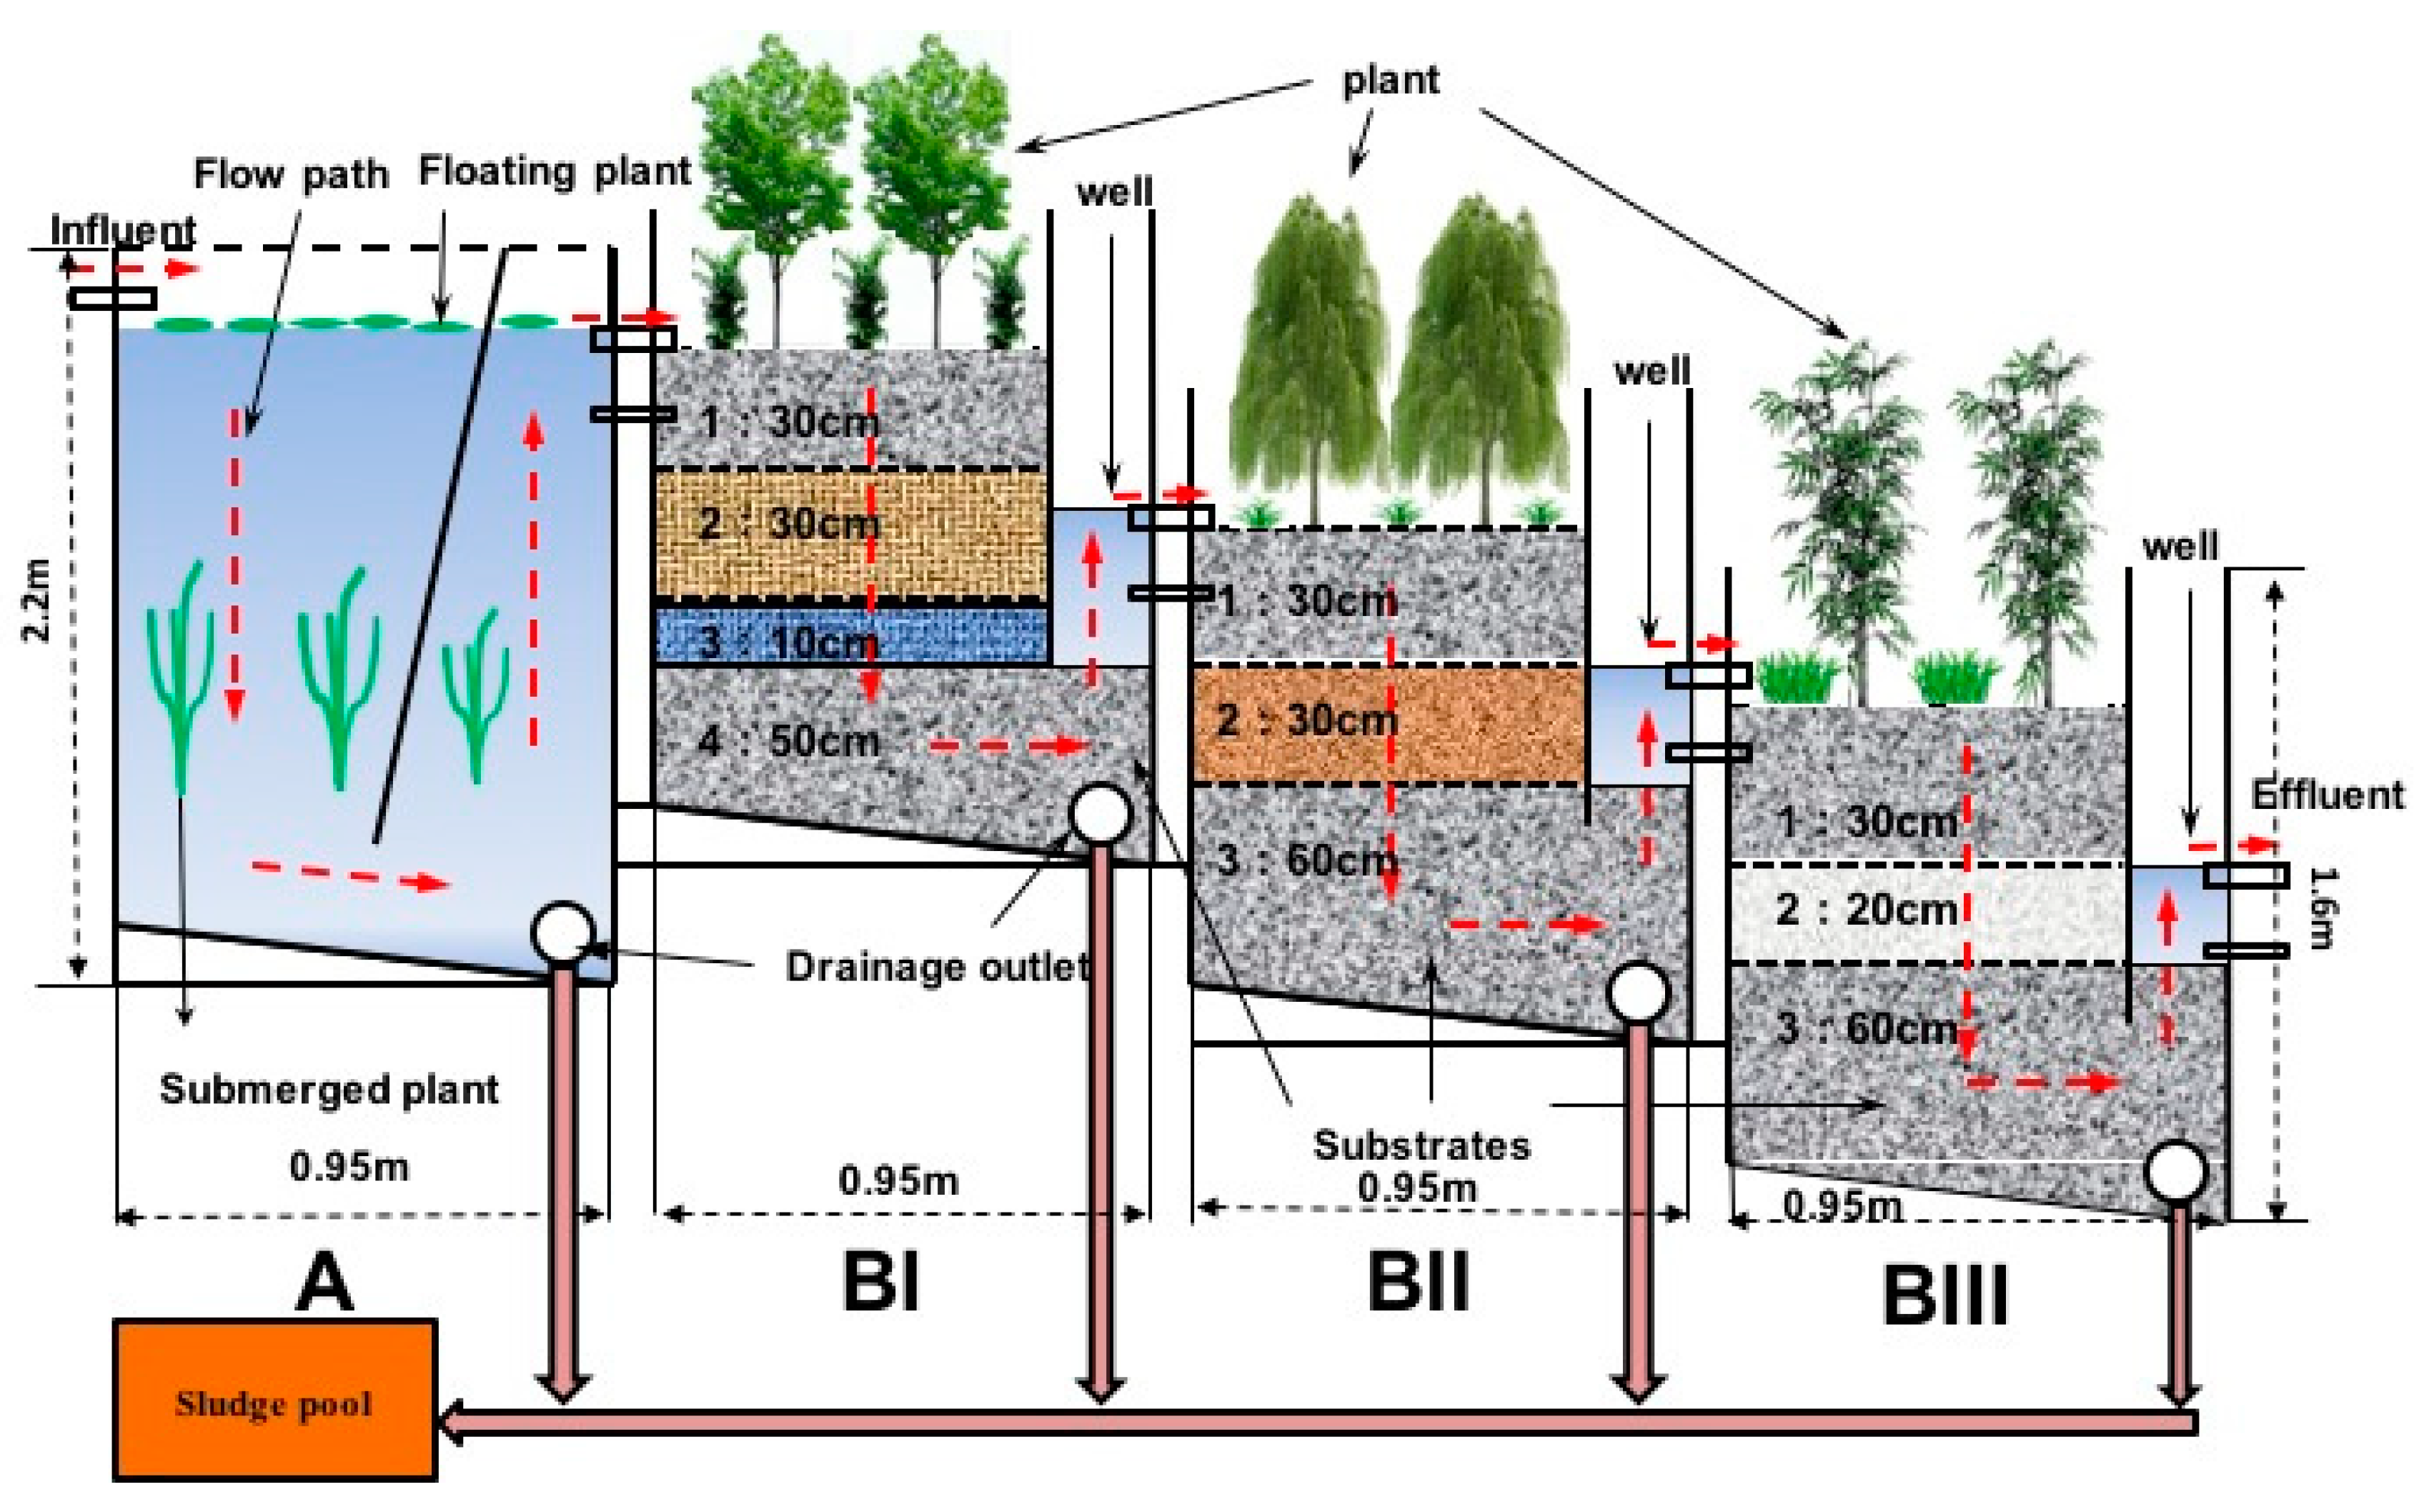
The above Reactions (1)–(5) provide a theoretical background for the design of a wetland treatment process following the pollutant transformation pathway. As illustrated in Figure 1, the presented rural household system consists of four basic units with a surface-flow wetland cell A, used as the first treatment unit that allows sedimentation and precipitation of large pollutant particles, connected in series with three vertical subsurface-flow wetland cells, BI, BII and BIII. Following the reaction pathway, the major target pollutants to be removed by use of different plant species and adsorbents in units A, BI, BII and BIII, are organic (e.g., amino acids), cationic (NH4+) and anionic (NO3−, PO43−) pollutants, respectively. The drainage outlet of each treatment cell is connected to a sludge pool (Figure 1), which allows discharge of sludge from the drainage outlets of the system when needed. In addition, the drainage system is designed to prevent clogging that will be inevitably encountered in constructed wetland systems after a long period of operation.
The types, functions, introduced plant species and substrate fillers of the treatment cells are summarized in Table 1. The system used in the present test was made of steel which is firm and waterproof. For application in rural areas, other cheaper materials can be used to reduce the construction costs.
2.3. Plant Species and Substrates
In order to strengthen the integrated function of a wetland system, it is important to use suitable plant species and a highly cost-effective substrate. Plant richness can improve the structure, function and sustainability of wetland ecosystems to resist seasonal changes [13,28]. Use of adsorbents can enhance the buffering capacity of the treatment cells to resist pollutant loads. Based on previous studies, the plant species listed in Table 1 were used to establish a wetland plant community consisting of trees (Hibiscus mutabilis Linn., Salix babylonica), shrubs (Metasequoia glyptostroboides, Rosa chinensis Jacq., Loropetalum chinense var. rubrum, Nerium indicum Mill.) and annual herbs (Hydrocotyle vulgaris, Myriophyllum verticillatum, Hydrilla verticillata (L. f.) Royle, Ipomoea aquatica Forsk., Eichhornia crassipes, Alternanthera hiloxeroides (Mart.) Griseb, Pontederia cordata, Brassica campestris L., Acorus calamus L., Oenanthe javanica (Blume) DC., Fargesia fungosa Yi, Arundo donax var. versicolor, Thalia dealbata Link). The selected filler adsorbents, diatomite (as molecular adsorbent), vermiculate and zeolite (both as cationic adsorbents) and hydrotalcite (as anionic adsorbent), were used in different cells for the adsorption of organic, cationic and anionic pollutants, respectively. The adsorption characteristics of the selected adsorbents were examined in earlier tests.
2.4. Operation and Analysis
The wastewater used for test of the designed system was the sewage from a septic tank installed at one of the main teaching buildings of the university. Analytical results indicated that the concentrations of the main pollutants in the tested wastewater were similar to those in the investigated rural areas in Hunan Province. The variation range of the water quality indexes of the influent, the designed standards of the effluent and the maximum removal rate (RM) required to reduce the highest pollutant concentration to designed standards are listed in Table 2.
The operation of the system was continued through a whole year. During the operation period, water samples of 500 mL were collected in triplicate from both the inlet and outlet of each treatment cell at mostly week intervals and were prepared immediately for analysis. The standard methods stipulated in “Methods for Monitoring and Analysis of Water and Wastewater, 2000” by the Ministry of Environmental Protection, China, were used for analyses of total suspended solid (TSS), chemical oxygen demand (CODCr), biochemical oxygen demand (BOD5), total nitrogen (TN), ammonia nitrogen (NH3-N), and total phosphorus (TP). The relative deviations of the sample analyses were between 0.3% and 6.1%, which were within the allowed accuracy range. The average values of the measurements were presented for discussion.
3. Results
3.1. Treatment Efficiency of the System
Table 3 gives the average effluent pollutant concentration and accumulative removal rate (Ra) of the treatment cells. The accumulative removal rate is given as
where C0 denotes the initial pollutant concentration in the untreated influent (the influent of cell A) and Cefi is the pollutant concentration in the effluent of cell i. The Ra value of BIII represents the total removal rate RT of the system.
Ra = 100 × (C0 − Cefi)/C0
Despite the great variation in pollutant loadings in the operation period, the designed system was very effective in the removal of TSS, CODCr and BOD5. The observed concentrations of TSS, CODCr and BOD5 in the effluent of the final cell (BIII) met the first grade B of the legislated discharge standards (GB 18918-2002) throughout the tested year. In comparison, however, the removal of TN, NH3-N and TP was lower, and approximately one third of their observed values fell within the range between the first and second grade standards. The average total removal rate (the Ra value of BIII) was higher than 80% for TSS, CODCr and BOD5 but lower than 62% for TN, NH3-N and TP (Table 3).
3.2. Effect of Pollutant Loading, Temperature and Sludge Discharge
Given the hydraulic loading rate HLR, the pollutant concentration of the initial influent (influent of cell A) determines the pollutant loading rate of the treatment system. Table 4 gives the coefficient values obtained from the correlation analyses on pollutant concentrations between effluent and initial influent. All correlation coefficient values are positive, showing the impact of the pollutant loading on treatment efficiency. A clear trend can be noticed in Table 4: the coefficient values for all analyzed pollutants decrease along the treatment process from A to BIII. Since in the designed system, the effluent of a cell is the influent of its successor, it is expected that the initial pollutant loading rate should have less influence on subsequent cells. This appears to be the case for TSS and TP. The correlation coefficient values for TSS and TP are very low at BII and BIII, suggesting that the initial pollutant loading rate is not the unique factor determining the effluent concentration of TSS and TP. The low coefficient values for TSS observed at cells BII and BIII can be explained by the high removal capacity of BI. As noticed in Table 3, the TSS level in the effluent of BI was low, which already met the designed standard and thus reduced the dependence of BII and BIII on initial pollutant loading. The low coefficient values for TP at BII and BIII, however, were mainly attributed to the changes in temperature. The low temperature in the winter period caused an apparent reduction of TP removal in all subsurface-flow wetland cells.
The effect of an increase in initial influent concentration and a decrease in temperature in winter on the effluent concentration of BIII is illustrated in Figure 2. In order to give a clear picture to show the change in system treatment efficiency with operation time, the average weekly measurement values for cells A, BI and BII were not presented. In general, the trends of the changes in week observations for cells A, BI and BII are similar to that for BIII shown in Figure 2. The operation time is separated into warm and cold periods by two dotted lines (Figure 2). The interval between the two dotted lines denotes the cold period phase (late November to early March) with a temperature range between approximately −2 °C and 15 °C. The remaining sections are the warm periods with a temperature range between 16 °C and 39 °C. The two dotted arrow lines in Figure 2 indicate the day on which sludge drainage occurred.
The high difference in temperature between the cold and warm periods did not cause significant changes in the effluent concentration of CODCr. Despite the sharp increase in initial pollutant loadings in the cold period, the concentration of CODCr (as well as BOD5 and TSS) in the effluent of BIII remained below the GB1 (the stricter first B discharge standard) line throughout the operation period (Figure 2a). In comparison, the negative impact of the pollutant loadings on the removal of TN (Figure 2b), NH3-N (Figure 2c) and TP (Figure 2d) was apparently exaggerated by the low temperature in the cold period, which raised the effluent concentrations of these three pollutants to significantly higher levels than their discharge standards. There were clear trends of increasing pollutant concentrations in the effluent of BIII under increasing operation time before the day when the first sludge drainage was performed (Figure 2). The increasing trends of the effluent concentrations were indications of pollutant accumulation in the solid phase of the system. As shown in Figure 2, the discharge of the sludge using the drainage pipelines (Figure 1) to empty the stored wastewater from the whole system for 24 h was carried out twice (week 34, the end of the cold period, and week 45, the end of the spring) in the later operation period. The effect of sludge discharge with the purpose of removing the accumulated pollutants was effective as it resulted in a significant reduction of the effluent concentration for all analyzed pollutants in all treatment cells. The observed differences between the month before and after the sludge drainage showed that the sludge discharge enhanced the average monthly removal rates by 16.8%, 20.1% and 34.6% at week 34, and 8.2%, 11.5% and 16.2% at week 45 for TN, NH3-N and TP, respectively. The sludge discharge measure was shown to be effective to reduce the effluent concentrations of NH3-N and particularly TP to meet the designed discharge standards.
3.3. Function and Contribution of Treatment Cells
For design of a multiple-cell system, it is necessary to determine the function and contribution of each treatment cell. The function of an individual wetland cell can be evaluated by its relative removal rate Rr given as
where Cin and Cef denote, respectively, the influent and effluent concentrations of the treatment cell. The applied HRT was 48 h, which was long enough for pollutant transfer to reach equilibrium among liquid, gas and solid phases in the system. The Rr values given by Equation (7) and listed in Table 5 can thus be regarded as equilibrium ratios.
Rr = 100 × (Cin − Cef)/Cin
The Rr values of CODCr were significantly higher than those of TN, NH3-N and TP in all treatment cells. The highest Rr values obtained for NH3-N (as well as TN) at BII and TP at BIII confirmed the functions of BII and BIII designed, respectively, to remove cationic and anionic pollutants.
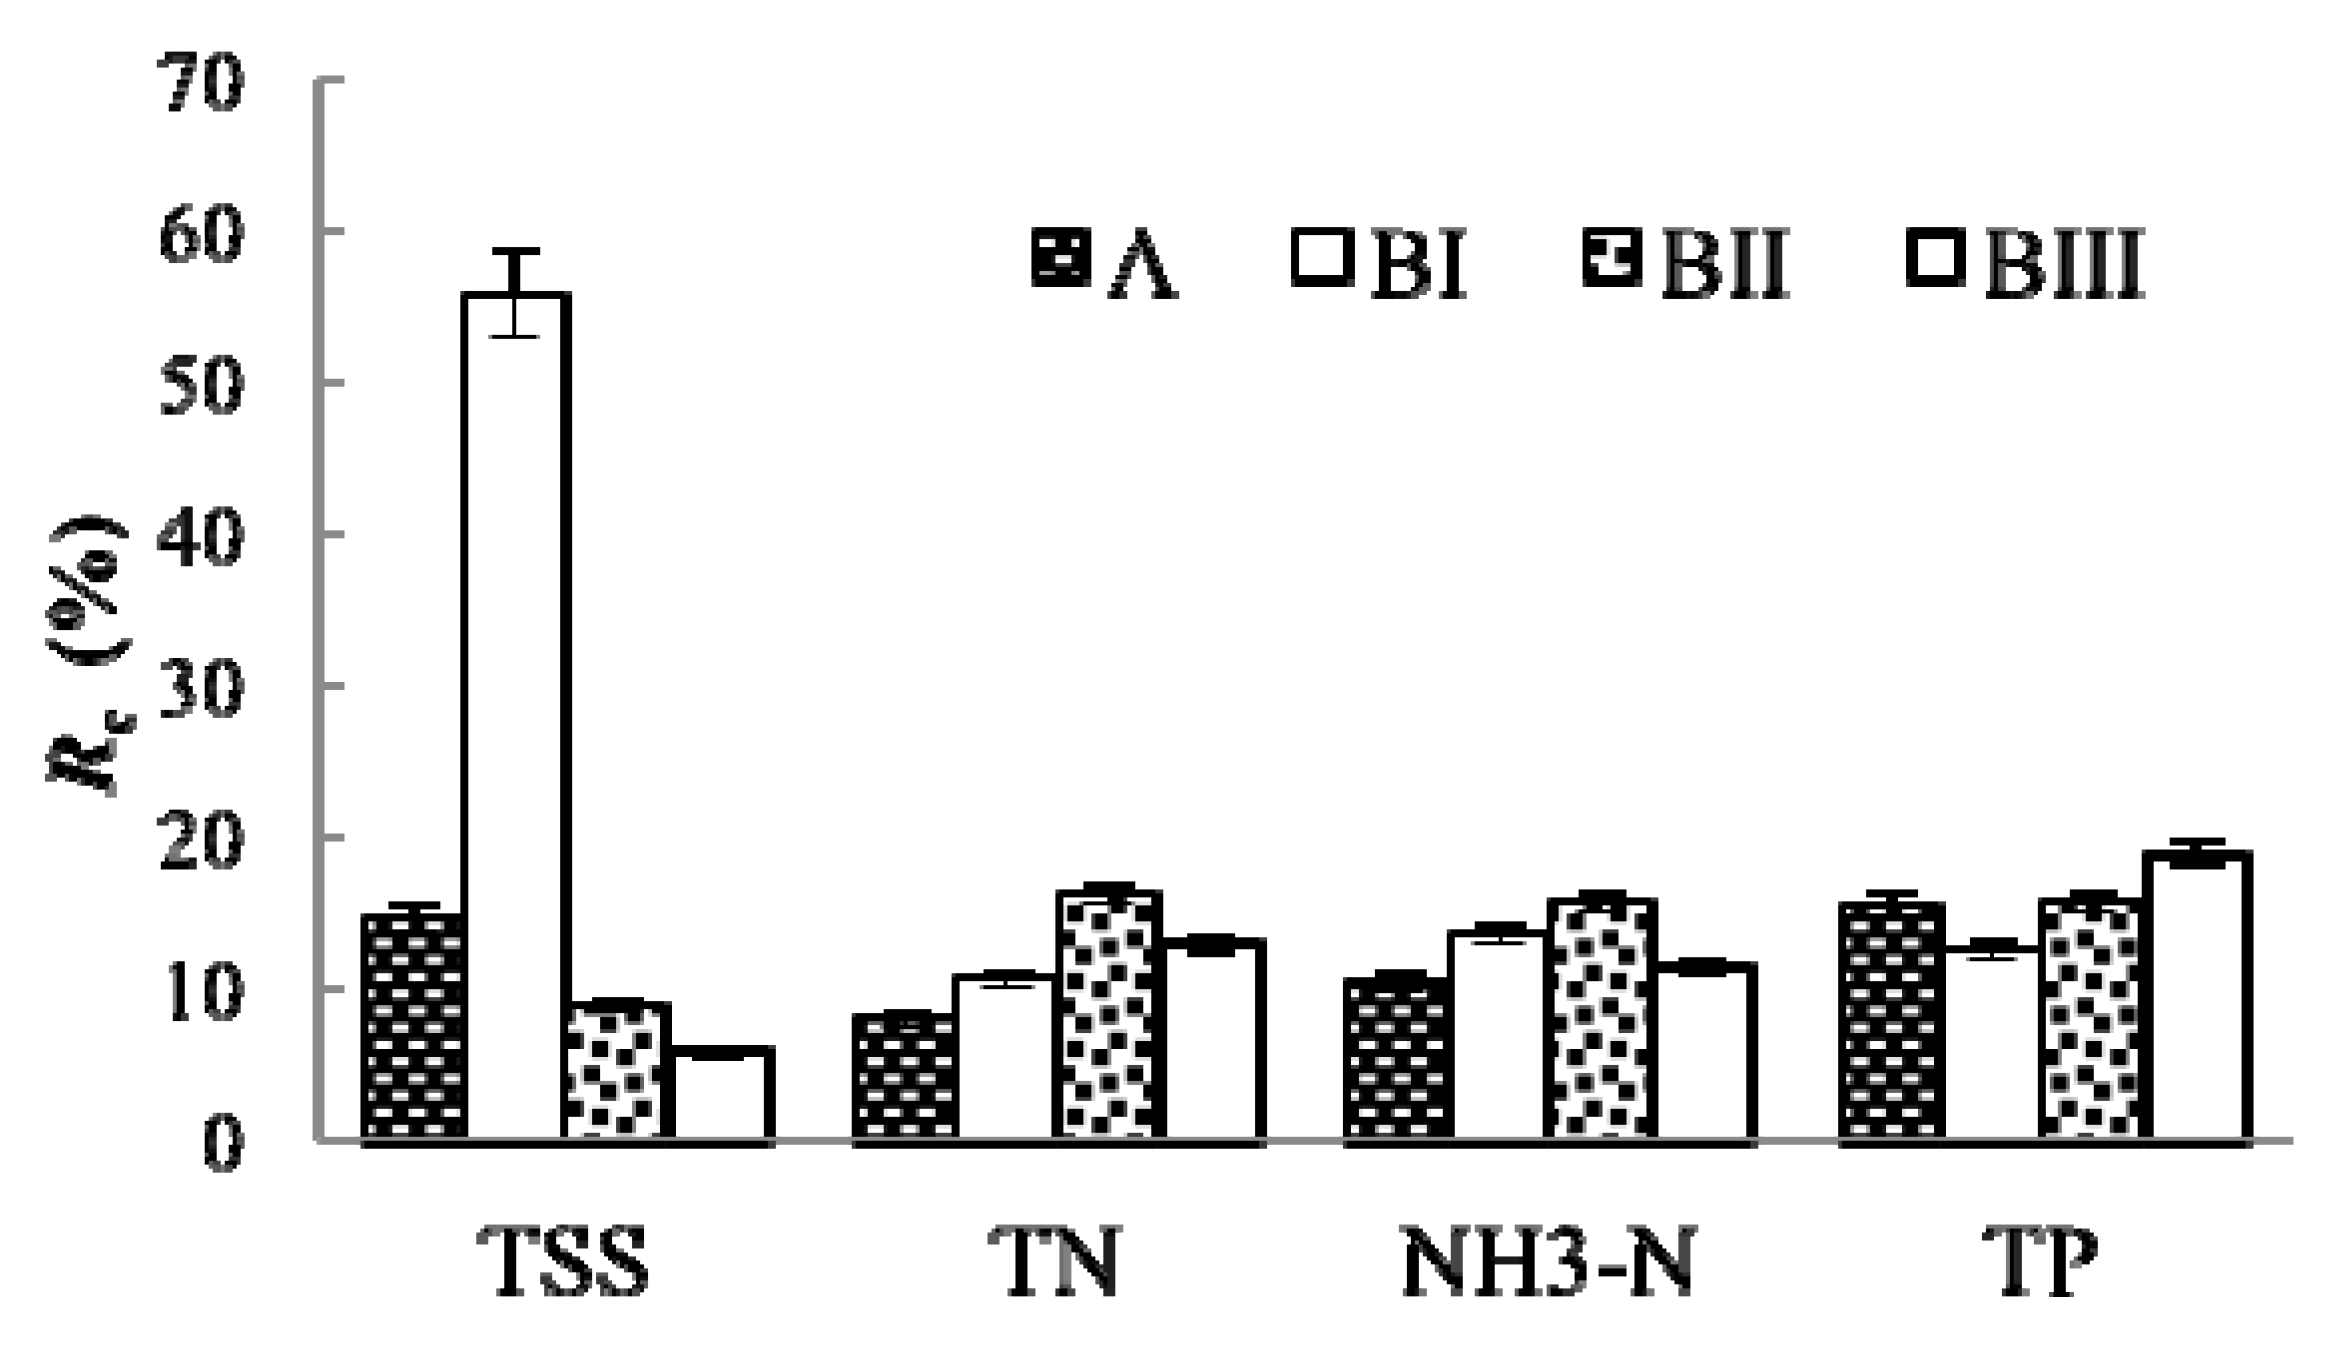
The relative removal rate cannot fully reflect the contribution of the cell to the system treatment efficiency as it is a function of the cell’s influent concentration which varies in cells connected in series. Replacing the denominator Cin (the influent concentration of cell i) in Equation (7) by C0 (the initial influent concentration of cell A) gives the rate of contribution of cell i to the system treatment efficiency
Rc = 100 × (Cin − Cef)/C0
The difference in average Rc values for pollutants in different cells is shown in Figure 3.
The highest Rc value of TSS obtained at BI indicated that the subsurface-flow wetland cell was an excellent sedimentation and filtration system for removal of suspended solids. Unlike the Rr value of CODCr (Table 5), which increased from A to BIII due to a decrease in denominator Cin, the Rc value of CODCr decreased along the treatment pathway (Figure 3). The highest contribution rate for CODCr was obtained in cell A because, as the first unit, it received the highest pollutant loads. As expected, BII (designed for removal of cationic pollutants) had the highest contribution for the removal of TN and NH3-N while BIII (designed for removal of anionic pollutants) had the highest contribution for the removal of TP. The difference in contribution rates between cells was significant (p < 0.001) for all analyzed pollutants.
The released ionic species (NH4+, NO3− and PO43−, etc.) from decomposition of organic pollutants can be removed by plant uptake. Therefore, as an essential component, wetland plants play an important role in both the constitution of a wetland system and enhancement of its treatment efficiency [12,14]. However, the amounts of nitrogen and phosphorus removed directly by plant uptake are relatively low, which, according to Dzakpasu et al. [29], contributes less than 16% of the total removal rates. Thus, in the treatment process, large amounts of nitrogen and phosphorus will remain in the substrate bed in either organic-bound or mineralized forms. As a critical parameter for design of a treatment cell, the relative removal rate is only partially related to the buffering capacity of the cell. Use of fillers with higher ion adsorption capacity for construction of a wetland cell bed, for an example, can increase the buffering capacity of the cell to resist ionic pollutant loads for a longer operation period [16]. However, regardless of how high the adsorption capacity of the cell is, the concentration of the adsorbed pollutants in the solid phase will increase and finally reach saturation if the adsorption capacity of the cell bed cannot be simultaneously renewed by other means. This demands an effective pathway for regeneration of the system adsorption capacity.
4. Discussion
The observed changes in effluent concentrations (Table 3, Figure 2) and correlation coefficients (Table 4) and variations in relative removal rates (Table 5) and contribution rates (Figure 3) confirm that the designed treatment process follows the pathway described by Reactions (1)–(5). The observed high and stable CODCr and BOD5 removal rates are expected results from the designed multiple-cell process because a reduction in CODCr can be attained in all cells under both aerobic and anaerobic conditions. The highest contribution rate of CODCr obtained in cell A (Figure 3) shows the importance of the pretreatment unit. In the multiple-cell system, cell A functions not only as a sedimentation pool to remove large solid particles but also as a facultative reactor for decomposition of soluble organic compounds and release of volatile organics. Removal of nitrogen and phosphorus present in inorganic forms occurs at later stages of the treatment process, and this is one of the major reasons for their lower removal rates. Apart from plant uptake, removal of NH3-N as NH3 and N2 gases from the system demands optimal pH, DO and temperature conditions in the sequenced ammonification, nitrification and denitrification processes [23]. Development of cost-effective measures for control of microbial activities to enhance nitrogen removal in wetland systems may still remain important topics in future studies [17]. In a natural process, the unique route to remove phosphorus completely from the wetland system is plant uptake. This results in difficulties in phosphorus removal particularly in winter when plant growth is lower. Reduction of pollutant loadings by increasing land use area or improvement of the wetland structure and function by using high adsorption capacity fillers, etc., can be effective solutions to obtain better performance. Applications of such measures, however, will inevitably lead to increases in construction costs.
In general, maintaining a high and stable treatment efficiency of the designed wetland system demands simultaneous removal of the pollutants, not only from the liquid phase, but also from the solid phase when influent is continuously inputted into the system. It is necessary to mention that sedimentation, precipitation and adsorption do not remove the pollutants from the wetland cells. To renew the pollutant adsorption capacity in the solid phase, for example, the pollutants adsorbed from the influent onto the solid surfaces need to be removed by continuous bio-transformation and translocation. At deeper layers of treatment cells, however, both aerobic reaction and bio-translocation rates are relatively low due to low DO (dissolved oxygen) levels and limited root and microbial activities [27]. This can consequently lead to accumulation of the pollutants at the bottom layer of the cells and in turn cause an increase in pollutant concentration in the whole system. Therefore, discharge of the sludge from the bottom layer of the wetland cells may become a necessary measure to maintain a high treatment efficiency of the system. The results shown in Figure 2 confirmed that the discharge of sludge at certain operation intervals was an effective solution. As a matter of fact, pollutant accumulation in the wetland bed not only resulted from the influent input. Constructed wetlands are primary biomass production ecosystems. Along with the degradation of the organic pollutants contained in the influent in the operation period, the released inorganic carbon, nitrogen and phosphorus are simultaneously synthesized by both microorganisms and plants to form biomass [27]. Thus, in the treatment process, a decrease in organic and inorganic pollutants in the effluent is simultaneously associated with an increase in biomass in the wetland ecosystem. This can be crucial in a subtropical region when fast-growing plant species are introduced into wetland cells. In addition to an increase in plant uptake in the process of vegetation growth, plant roots can also contribute a certain amount of oxygen to the granular bed and can provide an additional surface for bio-film attachment, which facilitates the decomposition of organic matters. As root penetration in the bed is only partial, and there is a significant amount of flow under the root zone, removal of the pollutants from the deep layer of the system will always be limited to relatively low levels. Because of this, it is necessary to design a pathway for the discharge of sludge from the bottom layers of wetland beds. In addition, harvest of mature plants and removal of plant litter as well as reuse of discharged sludge are also important procedures to avoid secondary pollution.
5. Conclusions
(1) The tested constructed wetland system was effective to remove TSS, CODCr and BOD5, and the effluent concentrations of these three pollutants met the legislated discharge standards throughout the operation period. The average total removal rates determined in the tested period for TSS, CODCr, BOD5, TN, NH3-N and TP were 85.3%, 82.4%, 80.1%, 47.5%, 51.0% and 61.8%, respectively. Discharge of sludge at adequate intervals could further enhance the treatment efficiency.
(2) The obtained experimental data confirmed that the removal of the organic, cationic and anionic pollutants in the designed treatment process followed the dynamic pathway of organic pollutant transformation. Relative removal and contribution rates were found to be useful indexes for evaluating the functions and contributions of the sequenced treatment cells.
(3) The results obtained from the present study provided a technical system with basic data and parameters for the design and application of constructed wetland systems for rural household sewage treatment in subtropical regions of China.
6. Patents
Xinxi Fu, Xiaofu Wu, Sangyang Zhou, Jian Lu. A constructed a wetland system for rural household sewage treatment (ZL 2016 1 0190847.X).
Author Contributions
Conceptualization, X.F. and X.W.; Methodology, X.F.; Software, X.F.; Validation, X.W., X.F., S.Z., Y.C. and M.C.; Formal Analysis, X.F.; Investigation, X.F. and S.Z.; Resources, X.W.; Data Curation, X.F. and X.W.; Writing—Original Draft Preparation, X.F. and X.W.; Writing—Review & Editing, X.W., X.F., S.Z., Y.C., M.C. and R.C.; Visualization, X.F. and X.W.; Supervision, X.W.; Project Administration, X.F.; Funding Acquisition, X.F., X.W., and R.C.
Funding
This research received no external funding.
Acknowledgments
This work was supported by the project (2014BAC09B00) of the Ministry of Science, Technology, P.R. China and the Youth Fund of Central South University of Forestry and Technology (QJ201505) and Hunan Provincial Natural Science Foundation of China (Science Foundation for Youths grant nos. 2018JJ3885).
Conflicts of Interest
The authors declare no conflict of interest.
References
- Reyes, C.P.D.L.; Villamar, C.A.; Neubauer, M.E.; Pozo, G.; Vidal, G. Behavior of Typha angustifolia L. in a free water surface constructed wetlands for the treatment of swine Wastewater. J. Environ. Sci. Health Part A 2013, 48, 1216–1224. [Google Scholar] [CrossRef] [PubMed]
- Shpigel, M.; Ben-Ezra, D.; Shauli, L.; Ventura, M.; Sagi, Y.; Samocha, T.; Lee, J.J. Constructed wetland with Salicornia as a biofilter for mariculture effluents. Aquaculture 2013, 412, 52–63. [Google Scholar] [CrossRef]
- Jesus, J.M.; Calheiros, C.S.C.; Castro, P.M.L.; Borges, M.T. Feasibility of Typha Latifolia for high salinity effluent treatment in constructed wetlands for integration in resource management systems. Int. J. Phytoremediat. 2014, 16, 334–346. [Google Scholar] [CrossRef] [PubMed]
- Troescha, S.; Salmaa, F.; Esser, D. Constructed wetlands for the treatment of raw wastewater: The French experience. Water Pract. Technol. 2014, 9, 430–439. [Google Scholar] [CrossRef]
- Wang, W.; Zheng, J.; Wang, Z.; Zhang, R.; Chen, Q.; Yu, X.; Yin, C. Performance of pond–wetland complexes as a preliminary processor of drinking water sources. J. Environ. Sci. 2016, 39, 119–133. [Google Scholar] [CrossRef] [PubMed] [Green Version]
- Brix, H.; Arias, C.A. Danish guidelines for small-scale constructed wetland systems for onsite treatment of domestic sewage. Water Sci. Technol. 2005, 51, 1–9. [Google Scholar] [CrossRef] [PubMed]
- Langergraber, G.; Weissenbacher, N. Survey on number and size distribution of treatment wetlands in Austria. Water Sci. Technol. 2017, 75, 2309–2315. [Google Scholar] [CrossRef] [PubMed]
- Solano, M.L.; Soriano, P.; Ciria, M.P. Constructed wetlands as a sustainable solution for wastewater treatment in small villages. Biosyst. Eng. 2004, 87, 109–118. [Google Scholar] [CrossRef]
- Wu, S.; Austin, D.; Liu, L.; Dong, R. Performance of integrated household constructed wetland for domestic wastewater treatment in rural areas. Ecol. Eng. 2011, 37, 948–954. [Google Scholar] [CrossRef]
- Sun, H.; Zhang, H.; Yu, Z.; Wu, J.; Jiang, P.; Yuan, X.; Shi, W.M. Combination system of full-scale constructed wetlands and wetland paddy fields to remove nitrogen and phosphorus from rural unregulated non-point sources. Environ. Geochem. Health 2013, 35, 801–809. [Google Scholar] [CrossRef] [PubMed]
- Lopez-Rivera, A.; Lopez-Lopez, A.; Vallejo-Rodrıguez, R.; Leon-Becerril, E. Effect of the organic loading rate in the stillage treatment in a constructed wetland with canna indica. Environ. Progress Sustain. Energy 2015, 35, 411–415. [Google Scholar] [CrossRef]
- Shelef, O.; Gross, A.; Rachmilevitch, S. Role of plants in a constructed wetland: Current and new perspectives. Water 2013, 5, 405–419. [Google Scholar] [CrossRef]
- Wang, H.; Chen, Z.; Zhang, X.; Zhu, S.; Ge, Y.; Chang, S.X.; Zhang, C.B.; Huang, C.C.; Chang, J. Plant species richness increased belowground plant biomass and substrate nitrogen removal in a constructed wetland. Clean Soil Air Water 2013, 41, 657–664. [Google Scholar] [CrossRef]
- Lombard Latune, R.; Laporte-Daube, O.; Fina, N.; Peyrat, S.; Pelus, L.; Molle, P. Which plants are needed for a French vertical-flow constructed wetland under a tropical climate? Water Sci. Technol. 2017, 8, 1873–1881. [Google Scholar] [CrossRef] [PubMed]
- Chyan, J.M.; Senoro, D.B.; Lin, C.J.; Chen, P.J.; Chen, I.M. A novel biofilm carrier for pollutant removal in a constructed wetland based on waste rubber tire chips. Int. Biodeterior. Biodegrad. 2013, 85, 638–645. [Google Scholar] [CrossRef]
- Cui, L.J.; Li, W.; Zhou, J.; Zhang, Y.; Zhang, M.Y.; Lei, Y.R.; Kang, X.M.; Zhao, X.S.; Pan, X. Influence of substrate depth and particle size on phosphorus removal in a surface flow constructed wetland. Water Sci. Technol. 2017, 75, 2291–2298. [Google Scholar]
- Cui, L.; Ouyang, Y.; Gu, W.; Yang, W.; Xu, Q. Evaluation of nutrient removal efficiency and microbial enzyme activity in a baffled subsurface-flow constructed wetland system. Bioresour. Technol. 2013, 146, 656–662. [Google Scholar] [CrossRef] [PubMed]
- Meng, P.; Pei, H.Y.; Hu, W.; Shao, Y.; Li, Z. Performance evaluation of light-weight aggregates-based horizontal flow constructed wetlands for domestic wastewater treatment. Clean Soil Air Water 2015, 43, 217–222. [Google Scholar] [CrossRef]
- Wynn, T.M.; Liehr, S.K. Development of a constructed subsurface-flow wetland simulation model. Ecol. Eng. 2001, 16, 519–536. [Google Scholar] [CrossRef]
- Rousseaua, D.P.L.; Vanrolleghemb, P.A.; De Pauw, N. Model-based design of horizontal subsurface flow constructed treatment wetlands: A review. Water Res. 2004, 38, 1484–1493. [Google Scholar] [CrossRef] [PubMed]
- Meyer, D.; Chazarenc, F. Modelling constructed wetlands: Scopes and aims- a comparative review. Ecol. Eng. 2015, 80, 205–213. [Google Scholar] [CrossRef]
- Langergraber, G. Applying Process-Based Models for Subsurface Flow Treatment Wetlands: Recent Developments and Challenges. Water 2017, 9, 5. [Google Scholar] [CrossRef]
- Vymazal, J. The use of hybrid constructed wetlands for wastewater treatment with special attention to nitrogen removal: A review of a recent development. Water Res. 2013, 47, 4795–4811. [Google Scholar] [CrossRef] [PubMed]
- Wu, S.; Kuschk, P.; Wiessner, A.; Müller, J.; Saad, R.A.B.; Dong, R. Sulphur transformations in constructed wetlands for wastewater treatment: A review. Ecol. Eng. 2013, 2, 278–289. [Google Scholar] [CrossRef]
- Abbassi, B.; Al-Zboon, K.; Radaideh, J.; Wahbeh, A. Using constructed wetlands to improve drainage water quality from hydroponics farms. Irrig. Drain. 2011, 60, 370–380. [Google Scholar] [CrossRef]
- Shao, Y.; Pei, H.; Hu, W. Nitrogen removal by bioaugmentation in constructed wetlands forrural domestic wastewater in autumn. Desalin. Water Treat. 2013, 51, 6624–6631. [Google Scholar] [CrossRef]
- EPA, National Risk Management Research Laboratory Office of Research and Development U.S. Manual Constructed Wetlands Treatment of Municipal Wastewaters; Environmental Protection Agency: Cincinnati, OH, USA, 2000; p. 79.
- Yang, Q.; Chen, Z.; Zhao, J.; Gu, B. Contaminant removal of domestic wastewater by constructed wetlands: Effects of plant species. J. Integr. Plant Biol. 2007, 49, 437–446. [Google Scholar] [CrossRef]
- Dzakpasu, M.; Scholz, M.; MCIWEM; McCarthy, V.; Jordan, S. Phosphorus retention and mass balance in an integrated constructed wetland treating domestic wastewater. Water Environ. J. 2015, 29, 298–306. [Google Scholar] [CrossRef]
Figure 1.
Constructed wetland system designed for treatment of rural household sewage (Layer numbers in BI, BII and BIII correspond to the numbers of substrate layers in Table 1).
Figure 1.
Constructed wetland system designed for treatment of rural household sewage (Layer numbers in BI, BII and BIII correspond to the numbers of substrate layers in Table 1).

Figure 2.
Change in pollutant concentration with operation time (O: influent; BIII: effluent; GB1: stricter first B discharge standard; GB2: old first B discharge standard; Interval between two dotted lines: cold period; Dotted arrow lines: point of sludge drainage. The relative deviations of the average values were within the range between 0.3% and 6.1%).
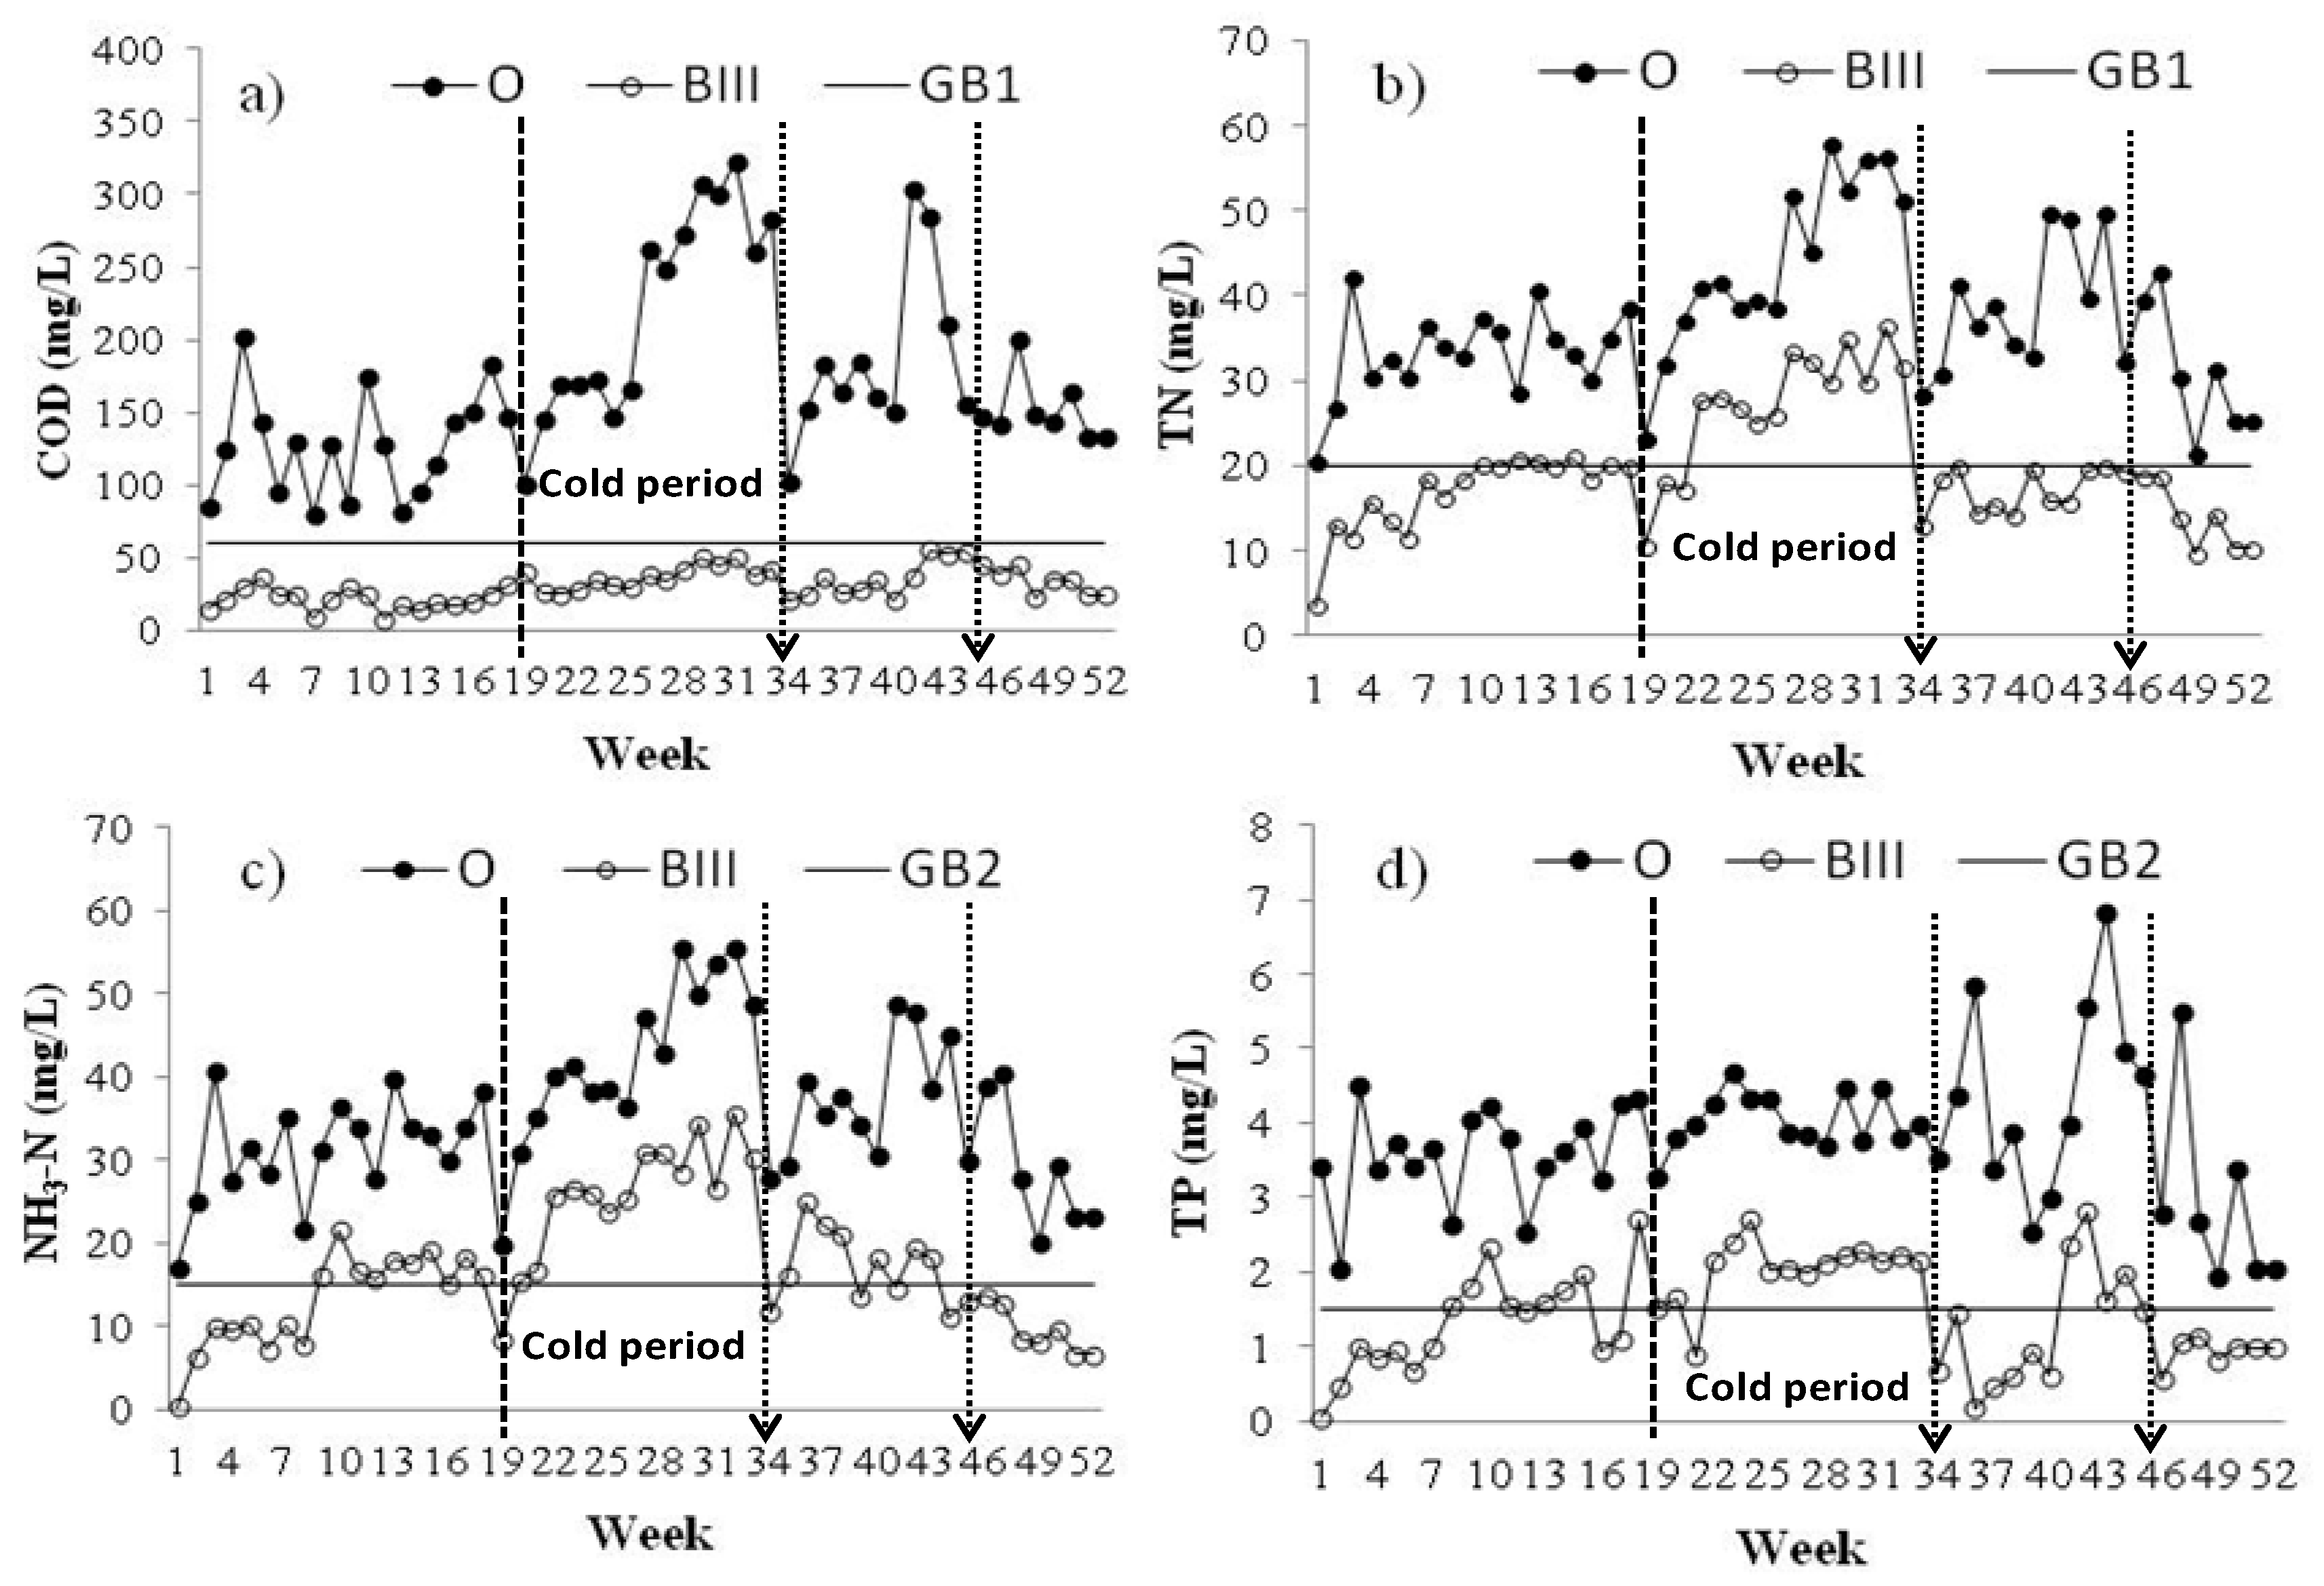
Figure 3.
Contribution rate (Rc) of treatment cells.


Table 1.
Type, function, plant species and substrate of wetland cells.
| Cell | Type | Major Target Pollutant | Main Reaction | Plant Species | Substrate |
|---|---|---|---|---|---|
| A | Surface flow | Organic pollutant Suspended solid | Sedimentation Precipitation Decomposition Uptake | Hydrocotyle vulgaris Ipomoea aquatica Forsk. Otnanthe Ljavanica (Blume) DC. Hydrilla verticillata Myriophyllum verticillatum | none |
| BI | Subsurface flow | Organic pollutant Suspended solid | Decomposition Filtration Uptake Adsorption | Hibiscus mutabilis Linn. Metasequoia glyptostroboides Rosa chinensis Jacq. Pontederia cordata Brassica campestris L. Iris germanica L. | 1: Limestone (Φ1 cm–Φ2 cm) 2: Diatomite 3: Vermiculate 4: Limestone (Φ3 cm–Φ5 cm) |
| BII | Subsurface flow | Organic pollutant Cationic pollutant | Decomposition Uptake Adsorption | Salix babylonica Loropetalum chinense var.rubrum Nerium indicum Mill. Acorus calamus L. Typha orientalis Presl. Oenanthe javanica (Blume) DC. | 1: Limestone (Φ1 cm–Φ2 cm) 2: Zeolite 3: Limestone (Φ3 cm–Φ5 cm) |
| BIII | Subsurface flow | Organic pollutant Anionic pollutant | Decomposition Uptake Adsorption | Fargesia fungosa Yi Arundo donax var. versicolor Thalia dealbata Link | 1: Limestone (Φ1 cm–Φ2 cm) 2: Hydrotalcite 3: Limestone (Φ3 cm–Φ5 cm) |
Table 2.
Pollutant concentration in the influent and designed standard of the effluent.
| Index | TSS | CODCr | BOD5 | TN | NH3-N | TP |
|---|---|---|---|---|---|---|
| Influent (mg/L) | 55~80 | 79.5~322.6 | 46.7~121.9 | 20.3~57.9 | 17.1~55.5 | 1.79~6.83 |
| Standard * (mg/L) | 20 | 60 | 20 | 20 | 8 | 1 |
| RM (%) | 75 | 82 | 84 | 66 | 86 | 86 |
Note: *: First grade B, Discharge Standard of Pollutants for Municipal Wastewater Treatment [GB 18918-2002], stipulated by the Ministry of Environment Protection, China. RM: Expected total removal rate to reduce the highest pollutant concentration to designed standards.
Table 3.
Annual average effluent concentration Cef (mg/L) and accumulative removal rate Ra (%).
| Index | TSS | ☐ | CODCr | ☐ | BOD5 | ☐ | TN | ☐ | NH3-N | ☐ | TP | ☐ |
|---|---|---|---|---|---|---|---|---|---|---|---|---|
| Cell | Cef | Ra | Cef | Ra | Cef | Ra | Cef | Ra | Cef | Ra | Cef | Ra |
| O | 68.0 ± 4.0 | 0.0 | 172.5 ± 9.8 | 0.0 | 88.8 ± 5.4 | 0.0 | 38.3 ± 1.9 | 0.0 | 36.4 ± 2.0 | 0.0 | 3.92 ± 0.24 | 0.0 |
| A | 58.0 ± 2.0 | 14.7 ± 0.5 | 123.9 ± 5.7 | 28.2 ± 1.2 | 73.8 ± 4.1 | 16.9 ± 1.0 | 35.3 ± 2.1 | 7.9 ± 0.4 | 32.6 ± 1.9 | 10.4 ± 0.6 | 3.32 ± 0.20 | 15.2 ± 0.9 |
| BI | 20.0 ± 1.0 | 70.6 ± 2.7 | 85.6 ± 3.9 | 50.4 ± 2.6 | 40.5 ± 2.3 | 54.4 ± 3.1 | 31.2 ± 1.9 | 18.5 ± 1.1 | 27.7 ± 1.6 | 23.9 ± 1.4 | 2.84 ± 0.17 | 27.5 ± 1.6 |
| BII | 14.0 ± 0.5 | 79.4 ± 3.0 | 56.0 ± 2.4 | 67.5 ± 3.2 | 30.1 ± 1.5 | 66.1 ± 3.5 | 25.1 ± 1.5 | 34.6 ± 1.9 | 22.0 ± 1.3 | 39.6 ± 2.1 | 2.23 ± 0.13 | 43.1 ± 2.4 |
| BIII | 10.0 ± 0.3 | 85.3 ± 3.4 | 30.4 ± 1.6 | 82.4 ± 4.0 | 17.7 ± 0.9 | 80.1 ± 4.2 | 20.1 ± 1.2 | 47.5 ± 2.8 | 17.8 ± 1.0 | 51.0 ± 2.7 | 1.50 ± 0.08 | 61.8 ± 3.6 |
| GB * | 1st | ☐ | 1st | ☐ | 1st | ☐ | 2nd | ☐ | 2nd | ☐ | 2nd | ☐ |
Note: *: Discharge standard (GB 18918-2002): 1st: First grade B; 2nd: Second grade.
Table 4.
Correlation coefficient between effluent and initial influent concentrations.
| Cell | TSS | CODCr | TN | NH3-N | TP |
|---|---|---|---|---|---|
| A | 0.88 | 0.90 | 0.96 | 0.97 | 0.88 |
| BI | 0.72 | 0.79 | 0.94 | 0.91 | 0.58 |
| BII | 0.38 | 0.70 | 0.88 | 0.85 | 0.46 |
| BIII | 0.21 | 0.69 | 0.77 | 0.79 | 0.38 |
Table 5.
Average relative pollutant removal rate Rr (%) of treatment cells.
| Unit | TSS | CODCr | TN | NH4+-N | TP |
|---|---|---|---|---|---|
| A | 14.7 ± 0.8 | 28.2 ± 1.6 | 7.9 ± 0.4 | 10.4 ± 0.5 | 15.2 ± 0.6 |
| BI | 65.5 ± 3.7 | 30.9 ± 1.5 | 11.5 ± 0.5 | 15.1 ± 0.8 | 14.5 ± 0.5 |
| BII | 30.0 ± 1.8 | 34.5 ± 1.6 | 19.8 ± 1.0 | 20.6 ± 0.9 | 21.5 ± 0.9 |
| BIII | 28.6 ± 1.6 | 45.7 ± 2.2 | 19.7 ± 1.1 | 18.9 ± 0.7 | 32.8 ± 1.3 |
© 2018 by the authors. Licensee MDPI, Basel, Switzerland. This article is an open access article distributed under the terms and conditions of the Creative Commons Attribution (CC BY) license (http://creativecommons.org/licenses/by/4.0/).
Share and Cite
MDPI and ACS Style
Fu, X.; Wu, X.; Zhou, S.; Chen, Y.; Chen, M.; Chen, R. A Constructed Wetland System for Rural Household Sewage Treatment in Subtropical Regions. Water 2018, 10, 716. https://doi.org/10.3390/w10060716
AMA Style
Fu X, Wu X, Zhou S, Chen Y, Chen M, Chen R. A Constructed Wetland System for Rural Household Sewage Treatment in Subtropical Regions. Water. 2018; 10(6):716. https://doi.org/10.3390/w10060716
Chicago/Turabian StyleFu, Xinxi, Xiaofu Wu, Sangyang Zhou, Yonghua Chen, Mingli Chen, and Runhua Chen. 2018. "A Constructed Wetland System for Rural Household Sewage Treatment in Subtropical Regions" Water 10, no. 6: 716. https://doi.org/10.3390/w10060716
Note that from the first issue of 2016, this journal uses article numbers instead of page numbers. See further details here.