1. Introduction
Permeable pavement (PP) systems provide on-site storm water management that is useful not only as a way to provide a well-drained pavement, independent of conventional pipe-based drainage systems, but also as a means to reassert ecological balances of urbanized catchments while adapting cities to heavier downpours due to changing climate. As such, PP systems are an embedded part of sustainable urban drainage system (SUDS) and Green infrastructure (GI) storm water control measures (SCMs) [
1,
2]. In urbanized catchments, however, the environmental concern related to contaminants as well as shallow groundwater or risk of water ingress in nearby buildings limits the uptake of PP systems and in such cases, a lined PP system may be durable, as the use of a watertight geo-membrane helps meet these concerns [
2]. While wrapping a geo-membrane around the below surface perimeter disables on-site infiltration, a lined PP system will still provide storage capacity, volume reduction by way of evaporation, and detain intense rain storms, eventually reducing the risk of pluvial flooding and combined sewer overflow (CSO) [
1]. Furthermore, on an annual basis, the volume reduction caused by evaporation from the PP system may affect the overall urban water balance by reducing the volume discharged from the city, thus reducing the volume that needs treatment in the combined sewer system. Lined PP systems are comparable to underground detention installations, but deviate in their evaporation potential and may also display a slower drainage pattern if capillary forces are active in the subbase aggregates.
With a focus on PP systems as a means to promote on-site infiltration, the hydraulic function of non-lined PP systems is well described [
3,
4,
5,
6,
7,
8,
9], while fewer studies document the function of lined PP systems in a real-life setting. Recent studies conducted at a parking area retrofitted in 2009 at the USEPA’s (U. S. Environmental Protection Agency) Environmental Center, Edison, New Jersey [
10], and in 2011 at Washington State University’s Research and Extension Center in Puyallup, Washington [
11], both in the US, represent state of knowledge on lined PP systems along with earlier studies conducted at Clifton Campus, Tent Polytechnic at a parking lot built in 1986 [
12,
13] and at a parking area near Oxford built in 1998 [
14], both in the UK. The studies have documented performance criteria regarding storage capacity, accumulated water balances as well as water balance of single events as further detailed below.
Pratt et al. [
12,
13] studied the storage capacity four types of lined PP systems built as side-by-side parking lots, each 46 m
2 in size and separated from each other by an impermeable membrane, paved with almost identical PP surface layer but different sub-base aggregates. A considerable span in sub-base porosities were observed, with 31% for 10 mm round gravel, 42% for 5–40 mm (crushed) granite, 43% for 5–40 mm carboniferous limestone, and 48% for 40 mm blast furnace slag [
13]. The span in porosities is associated with the individual shape and gradation of the material as well as degree of compaction, where aggregates of uniform particle size and angular shape represent the highest porosity [
15]. According to Ferguson [
16], internal pores in aggregates can enhance the porosity, which is normally found within the range of 30 to 40%. Laboratory tests conducted by Park et al. [
17] on aggregates for sub-base use in PP systems found porosity to be 29%. Relating those studies to aggregates studied by Pratt et al. [
13] highlights well-performing sub-base materials in terms of the storage capacity provided.
Brown and Borst [
10] studied three types of PP system surfaces on top of a 400 mm thick subbase of recycled concrete aggregates (RCA) that were crushed and screened on site to the size of 50–63 mm, covering a parking area of 4000 m
2. Permeable asphalt (PA) and Portland cement pervious concreate (PCPC) were constructed directly on the sub-base, while permeable interlocking concrete pavement (PICP) was installed on a bedding layer of 12.5 mm aggregates and a choking layer of 25 mm aggregates overlaying RCA. For three types of PP system surfaces, each divided into four separately enclosed sections, cumulative precipitation and subsurface discharge were monitored for almost two years, resulting in mean cumulative evaporation of 5.2% of precipitation, spanning from 2.4–7.6% in the order PCPC > PICP > PA. Since the PP systems tested received runoff from adjacent impermeable pavement, annual evaporation rates were converted to account for direct rainfall only, resulting in values of 12%, 8%, and 7% for PCPC, PICP and PA surfaces, respectively. Interestingly, evaporation for dark PA is less than for the two light gray PP surfaces tested pointing towards a diminutive albedo effect. In the same study, the average daily evaporation rate was estimated to be 1.37 mm (ranging from 0.87 to 1.81 mm across PP systems and replicates), while Pratt et al. [
13] found evaporation to be some 0.2 mm daily during dry weather periods, but as high as 5.5 mm per day during wet weather periods monitored by use of a 0.5 m
2 model of the experimental set-up, placed next to the field test site. The above mentioned full-scale studies are supplemented by quasi-experiments (outdoor PP systems not subjected to usage) conducted by Göbel et al. [
18], in which evaporation ranged 10–18% for pervious concrete measured from August to October (warm months), with surface color in anthracite color (dark) returning 19% higher evaporation relative to the same paver in light grey. Furthermore, it was found that PP systems designed with a two-layered sub-base with a shift in aggregate size provided 16% less evaporation, possibly ascribed to capillary breakage between finer aggregates overlaying a coarser layer [
19]. Li et al. [
20] exposed samples of PA, PCPC and three types of aggregates (size 9.5, 12.5 and 19 mm) to natural weather conditions during three warm days (36–39 °C) and found that sand (<9.5 mm particles) under the influence of capillary forces provided the highest evaporation rate of 1.8 mm/h, equivalent to 70% of evaporation from open water. However, the study found a positive correlation between evaporation, void share in surface material and permeability for all other materials tested and thus suggests that evaporation from a PP system is under the influence of both capillarity and porosity. The influence of both the PP system sub-base aggregates and surface material on the water balance as well as attenuation has further been investigated by Jorge et al. [
21] in which PICP and PA and sub-base aggregates of recycled Construction and Demolition debris (C&D aggregates) and well as limestone were studied in combinations by way of 32 simulated rainfalls. Specimens with C&D aggregates returned the highest volume reduction and lag-time that was especially pronounced in combination with PA.
At the parking lots studied by Pratt et al. [
12,
13], 42 out of 62 events resulted in measurable discharge (>0.25 mm/h) with a mean discharge of 37% for PICP on a sub-base of rounded gravel, 47% for granite aggregates, 45% for carboniferous limestone and 34% for blast furnace relative to precipitation, and with the first occurrence of discharge always 25–50% into the rain duration. No measurable discharge was observed for rainfall smaller than 5 mm [
13]. In [
14], the performance of porous blocks built on a sub-base of crushed gravel, rock, and crushed concrete found lag time up to 2:00 h and mean volume reduction of 22.5% when monitored over the course of 13 months (rain depths 3.0–20.6 mm). Knappenberger et al. [
11] constructed a parking area paved with 3200 m
2 PA divided into nine individual lined and monitored stalls, including one control with conventional impermeable asphalt and found mean lag-time for PA to be 2–3 h, depending on maintenance regime while run-off from the control resulted in a mean lag-time of 0:54 h based on analysis of nine distinct events. Surprisingly, the highest lag-time was experienced for the unmaintained PA, which leads to the conclusion that small particles in the deeper part of the asphalt structure caused by the applied maintenance technique affect the lag-time.
Although the concept of PP systems is not new, knowledge about their performance requires further qualification since various factors influence performance: specific PP system design and climatic conditions along with other contextual factors, as well as knowledge on PP system components currently available on the commercial market is a research need [
8]. This should be done as enclosed or lined PP systems built in a real-life-setting to derive estimates on storage capacity, annual water balance as well as for single events and lag time. Accordingly, the research objectives in this study were:
to determine storage capacity of a selection of sub-base aggregates;
to document surface permeability of a range of PP systems;
to estimate total volume reductions over a significant observation period; and
to estimate volume reductions and lag time for single events.
2. Materials and Methods
As parking areas are often mentioned as ideal for PP systems [
1], an existing public parking area was chosen for constructing six unique and individual lined and monitored PP systems. The six experimental stalls were equally sized of 25 m
2, corresponding to two parking lots and situated next to each other at the most frequently used area at a parking lot next to a public sport facility in Copenhagen, Denmark (55°42′51′′ N, 12°34′42′′ E). The sports facility has long opening hours all weekdays and all year round except for a summer break; thus, the parking lots were intensively used. By placing a raised concrete tile along the perimeter of each stall, a 20 mm high boundary towards the surroundings was formed, ensuring that only rainfall over the individual stall was captured and infiltrated. The stalls were fitted to existing terrain conditions, resulting in a cross fall of 1.5%. The bottom of each of the stalls was individually lined with a 2 mm polyethylene (HDPE) membrane overlaid with a studded membrane of polypropylene (12 mm) (Platon) to prevent the underlying membrane from being perforated as sub-base aggregates were built in. Tightness tests were conducted by allowing water to stand for 12 h, after the first half of aggregates were in place and compacted as membrane rupture has previously been reported as a possible source of error in interpreting data [
10,
11]. The HDPE membrane was folded in corners to also cover sides, and finally, pinched between surface layer and the circumscribing tile. To ensure free discharge, a 110 mm diameter perforated pipe was placed on the studded membrane downstream and connected to a 600 mm monitoring well placed outside the PP system, through a sealed socket perforation of the membrane. From the monitoring well, discharge was pumped by way of a submerged pump to the piped drainage network. Stalls 1–5 had a reinforcement net directly on top of the studded membrane, as well as at a level of 300 mm below pavement surface to minimize the risk of deformations. Plan and cross-section illustrations of the six stalls are presented in
Figure 1.
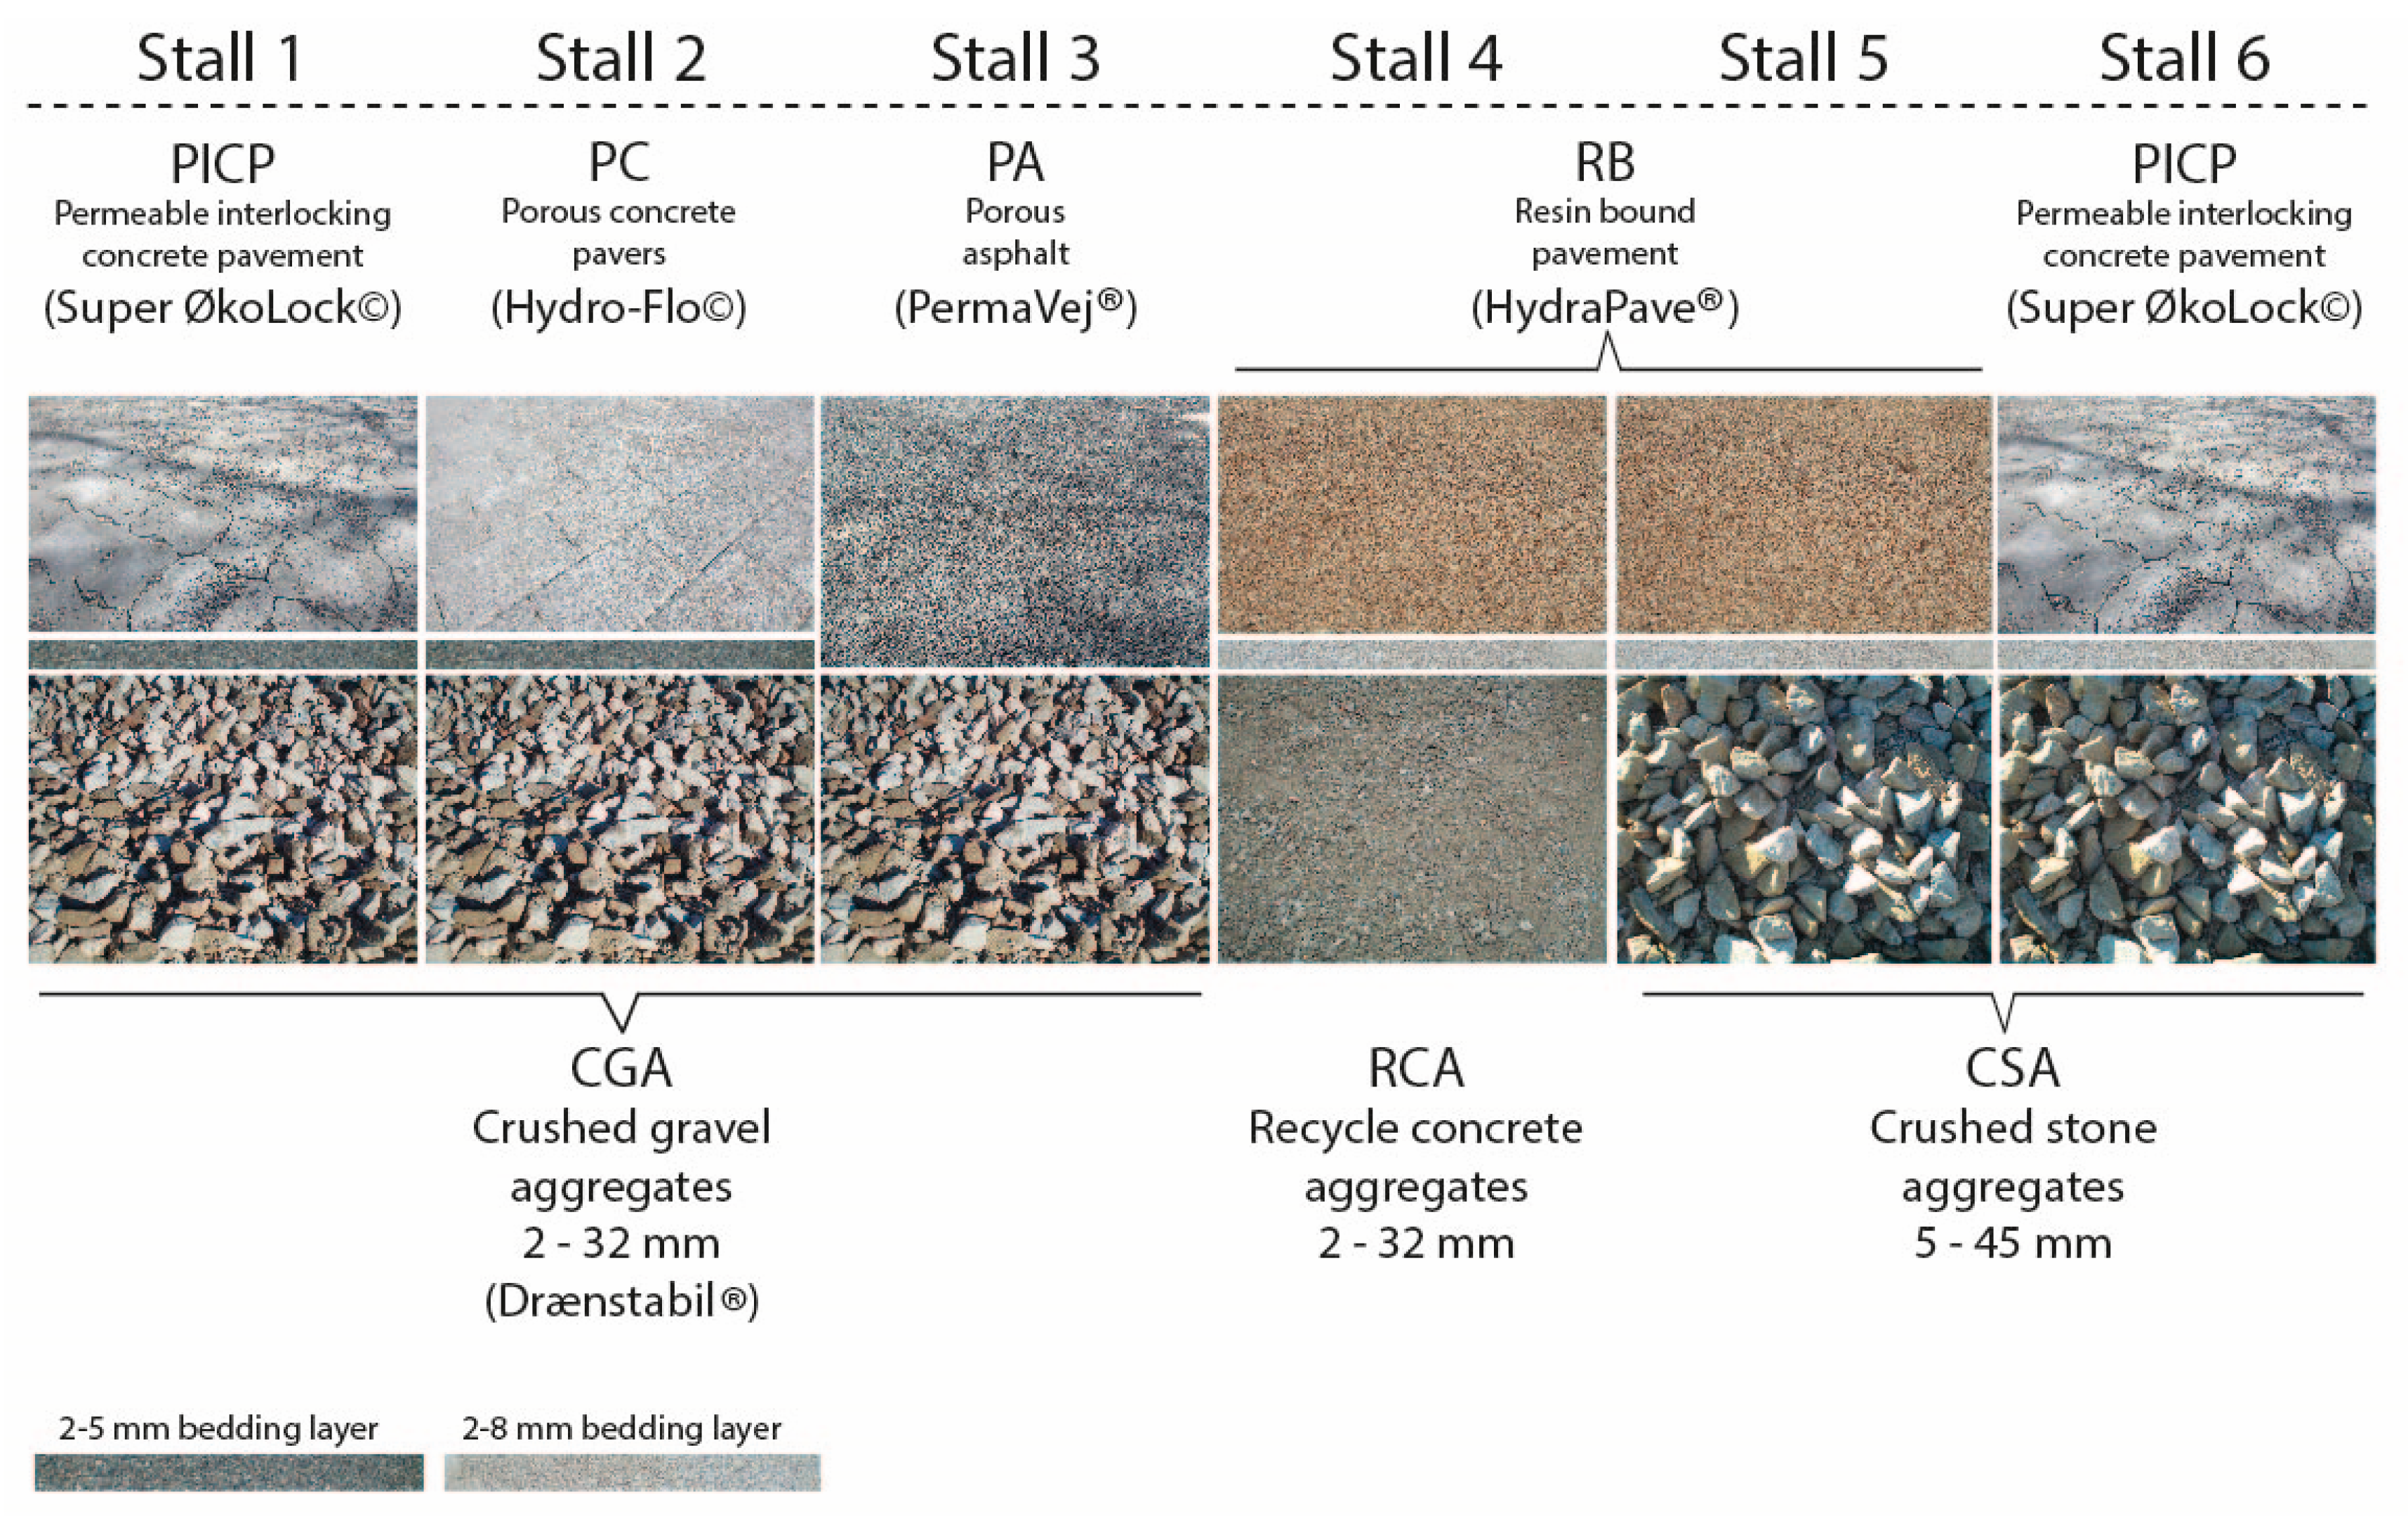
Each of the experimental stalls was constructed with a sub-base layer, a surface layer as well as a bedding layer if required, selected to test commercially available products resulting in six unique combinations (
Figure 2).
Stalls were built during the early months of 2013 and put into use in the beginning of May 2013. Due to a number of malfunctions related to local power outage, software problems and defective instruments, we report a continuous monitoring period of 12 months starting from 1 December 2014, i.e., to a starting point 19 months after completion of installation, thus initial high surface permeability rates were assumed to have settled to a more permanent level [
9,
22,
23], providing results representative of a longer period of functional lifetime. The stalls were enrolled in the present maintenance program for surrounding conventional pavements, which includes occasional collection of litter and debris, but no specific actions to maintain high surface permeability.
2.1. PP Sub-Base Layers
Aggregates for the sub-base layer of 400–520 mm thickness were selected to represent different granular materials including:
Crushed gravel aggregate (CGA), Drænstabil ® (NCC Råstoffer A/S), specified range 2–32 mm;
Recycled concrete (RCA), (Norocco A/S), specified range 2–32 mm; and
Crushed stone aggregate (CGA), (Stenrand), specified with 80% in range 25–45 mm and 20% in range 5–8 mm, added to minimize internal downwards migration of aggregates.
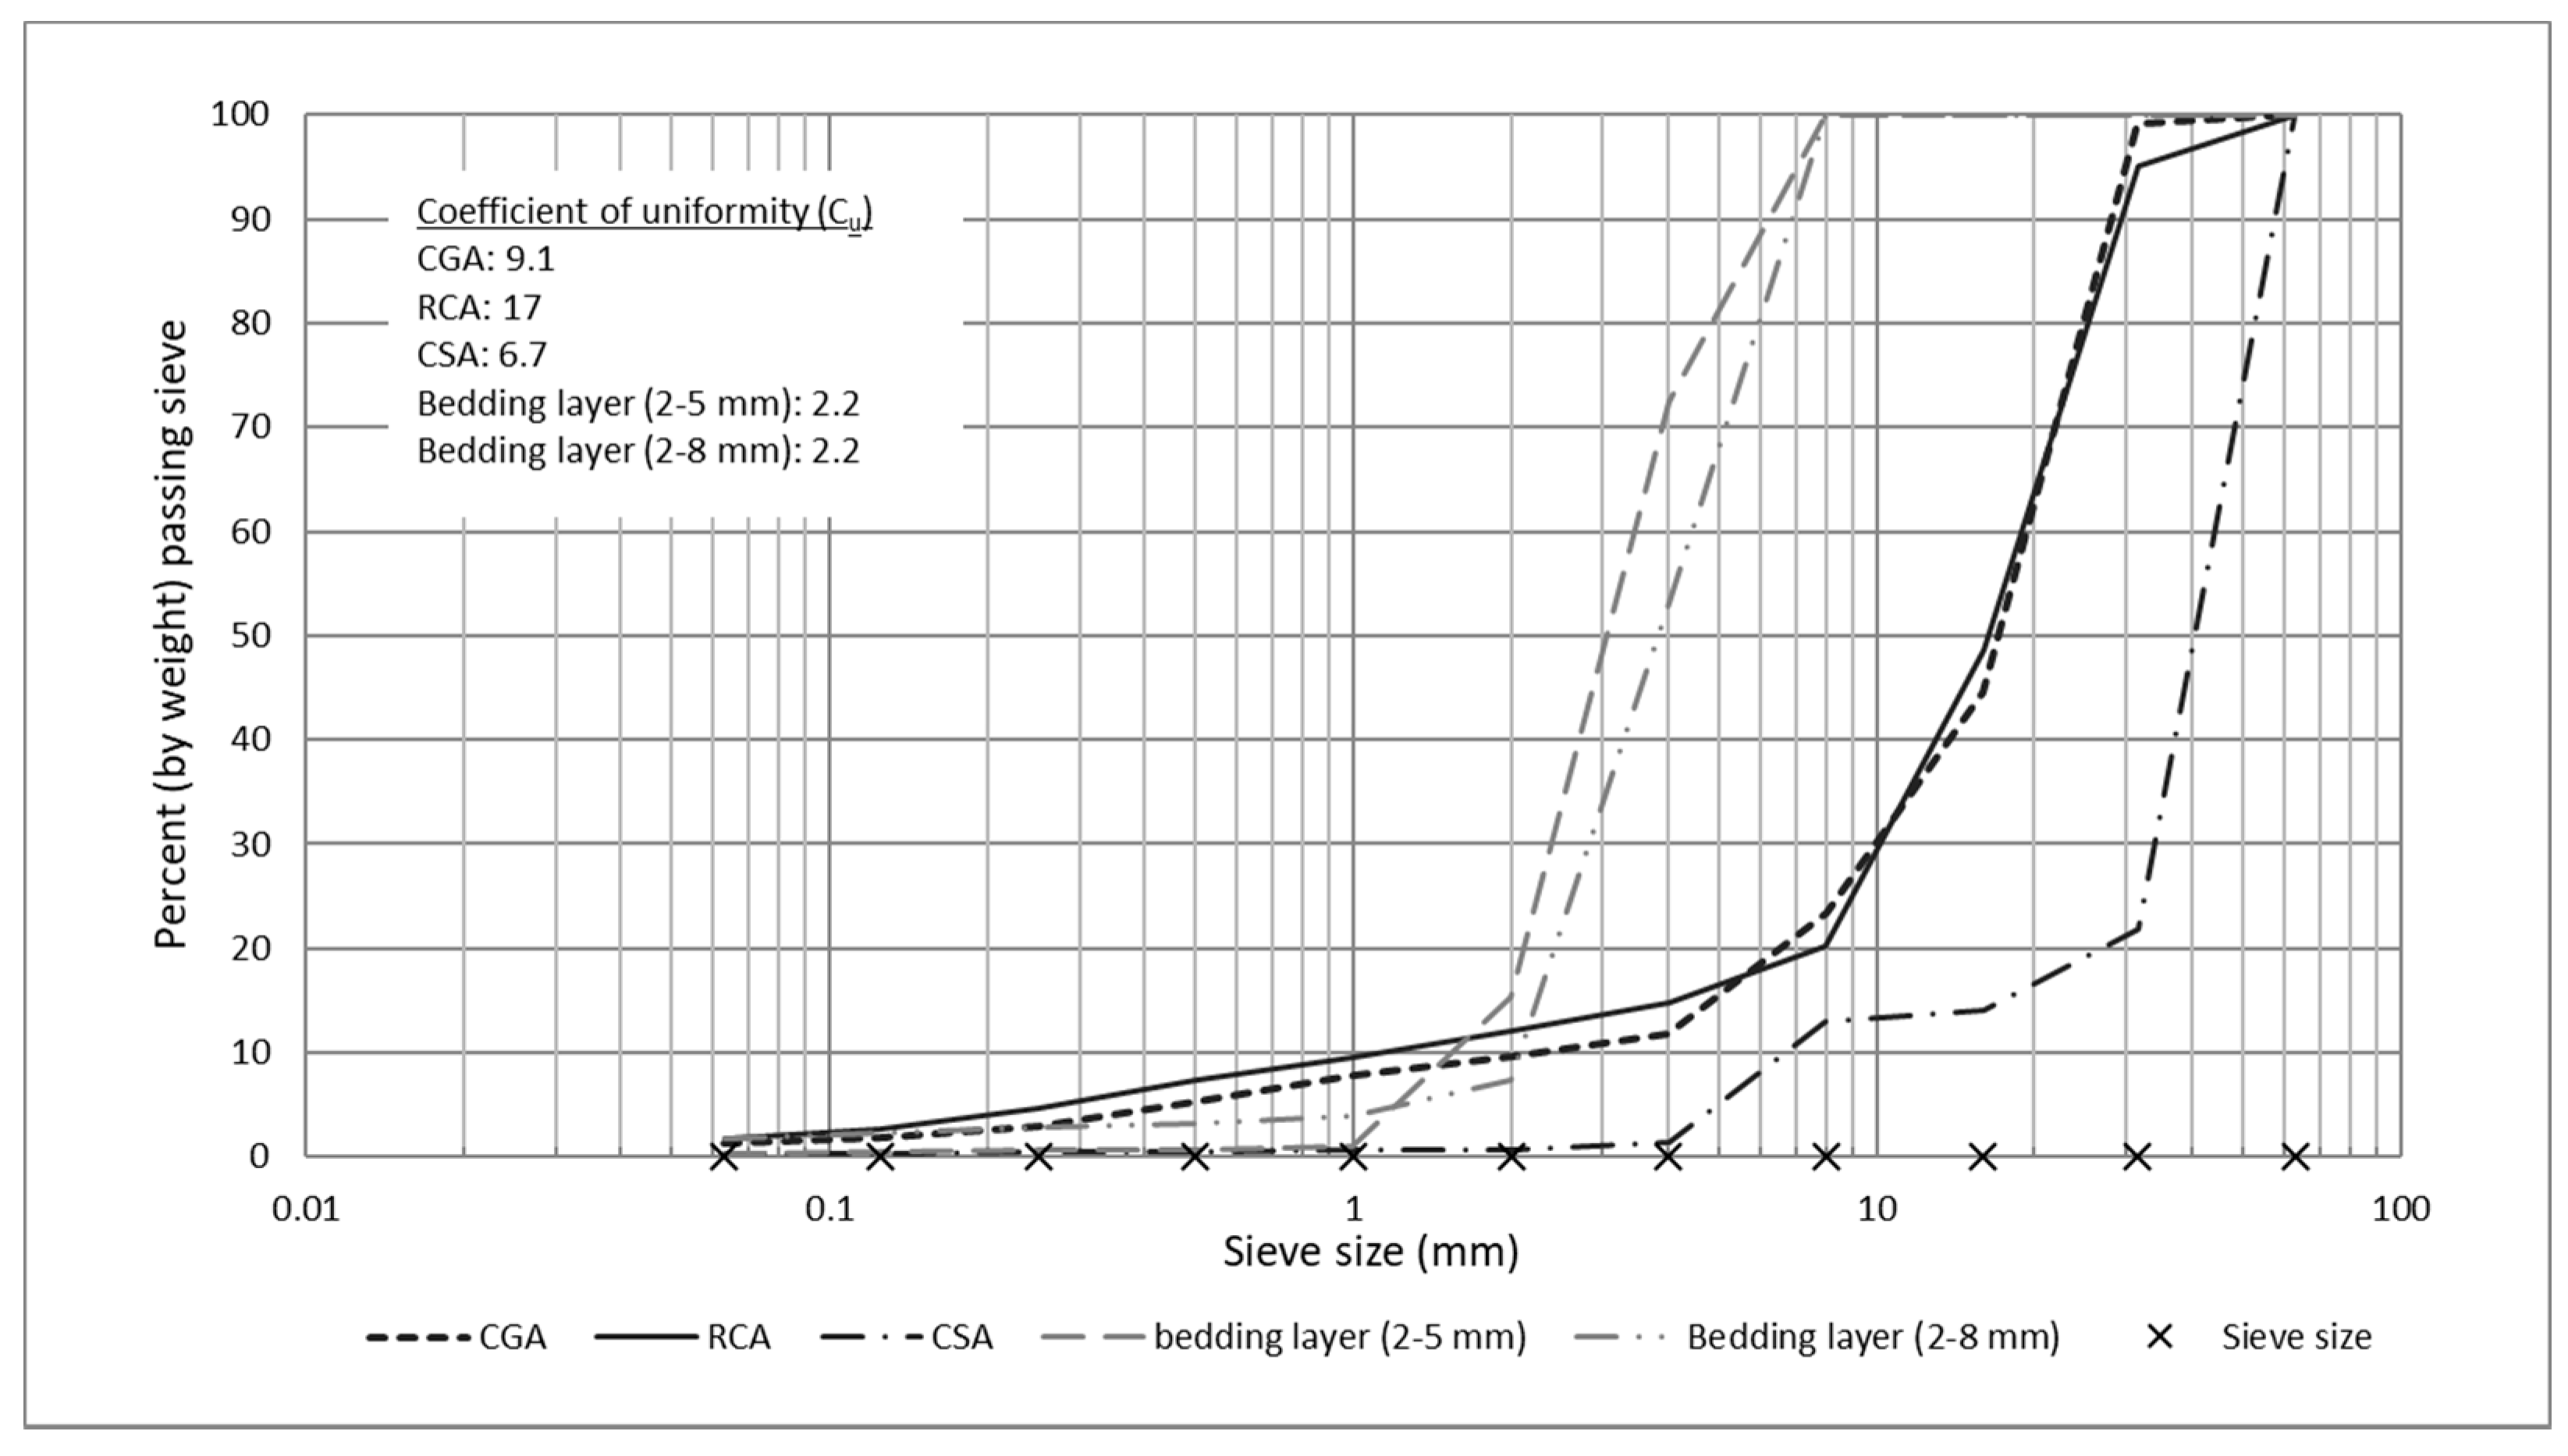
Specific attention was paid to avoid the use of particles less than 2 mm. The sub-base materials were mixed by the supplier and delivered unwashed and applied to the site according to suppliers’ specifications. During construction, samples of materials were collected at the construction site for control of gradation by laboratory measurement of particle size distribution according to DS/EN 993-1 and calculation of coefficient of uniformity (C
u) expressed as D
60/D
10, where D is the sieve size to a specific percentage of particles passing that sieve (by weight). The coefficient of uniformity was calculated to give a characteristic of the grading profile, where C
u in the range of 2.0–2.5 characterizes an open-graded distribution, while a higher value characterizes a more dense-graded distribution [
16].
2.2. PP Surfaces and Bedding Layers
Together with a city officer from Copenhagen Municipality, four types of commercially available PP surface products in different colors and textures were chosen for testing, thus representing a variety in terms of aesthetics, functionality, and infiltration concepts likely to be taken into use in the City of Copenhagen. The types of PP surfaces include:
Permeable interlocking concrete pavement (PICP), type Super ØkoLock© (Ikast Betonvare Fabrik, Ikast, Denmark), 80 mm thick, permeable openings 50 mm by 50 mm representing a total void share of 10% at the surface;
Porous concrete pavers (PC), type Hydro-Flo© (Midtgaard A/S, Roskilde, Denmark), 130 mm × 210 mm and 70 mm thick, and porosity of 7% stated by supplier;
Resin bound pavement (RB), type HydraPave© (Byggros, Odense, Denmark), 45 mm thick, and porosity of 30–40% stated by supplier; and
Porous asphalt (PA), type PermaVej® (NCC Roads, Søborg, Denmark), 40 mm thick base-layer with porosity of 14.8–16.1%, and 60 mm thick top-layer with total porosity of 19.8–24%.
Thus, the experiment represented PP systems with permeable joints (PICP), permeable pavers (PC), and permeable monolithic structures (RB and PA). Regarding PICP, the permeable openings were filled with 2–5 mm aggregates, while the 1–2 mm conventional joints in the PC were filled with 1–2 mm aggregates. For PICP and PC, a 30 mm thick bedding layer of 2–5 mm aggregates was used. The RB was mixed on-site using crushed stone 1–3 mm aggregate size and placed on a 30 mm bedding layer of 2–8 mm aggregates. PA was applied directly on the sub-base in a two-step process resulting in a base-layer and a top-layer, and afterwards three core samples were subsequently examined by the supplier to measure the void share. Since small manual equipment was used for construction of the PA, some unevenness in distribution of voids was expected.
2.3. Monitoring and Data Analysis
Storage capacity (SC) of aggregates was empirically determined in the laboratory by use of boxes with a volume,
Vbox, of 48 L, measuring 610 mm × 315 mm and 402 mm in height (two replicates). To account for surface moisture on the individual aggregates as well as moisture in internal pores of aggregates, the storage capacity of dry aggregates (
SCdry) as well as moist (after soaking and drainage for 24 h) sub-base aggregates (
SCmoist) was determined. The former is seen as an optimistic estimate for SC and the latter more realistic with respect to the capacity when constructed in a real-life setting, where aggregates will rarely dry up completely. Samples of dry aggregates were collected at the construction site and manually packed in boxes, filling the box to the rim and carefully compacting after each 100 mm using a sledgehammer, to finally form an even surface. Then, the boxes were weighed, returning the weight of dry aggregates,
Mdry aggregates (after subtracting of weight of empty box), filled with water, and weighed again returning the weight of aggregates and water,
Maggregates + water (after subtracting of weight of empty box), allowing us to calculate
SCdry, using Equation (1).
Afterwards, the box was drained for 24 h by opening a valve in the bottom of the box, and weighed, returning the weight of moist aggregates,
Mmoist aggregates (after subtracting weight of empty box), allowing us to calculate storage capacity of moist aggregates,
SCmoist, using Equation (2):
Each of the six monitoring wells serving the six stalls was equipped with a pressure transducer (MJK Expert™ 7060 hydrostatic level-transmitter from MJK) to allow for high resolution data of discharge volumes. The equipment is similar to equipment used by, e.g., Drake [
7] and Brown and Borst [
10]. The precision was ±2 mm and subsurface discharge volumes were logged using an interval of 1 min. Discharge was thus allowed to raise temporarily in the monitoring well before being rapidly pumped to the existing combined sewage system using a submerged pump adjusted to start when water level reached a fixed level (
Figure 1). Pumping always started within an interval of 150–180 mm water depth in the well (diameter of 600 mm), which corresponds to the pumping of 42.4–56.5 L equivalent to a maximum of 1.70–2.26 mm of rain depth that may not be counted in the final pumping session of each event, should 100% of rainfall reach the well. All pumping sequences were identified in the post data analysis, and corrupted data during time of pumping (1–3 min) was compensated by using an average value of the preceding 3 min data value. To calculate discharge, a depth to volume relationship was developed accumulating discharge minute by minute. For analysis, data were bulked in 10-min intervals.
Precipitation was monitored by use of a tipping-bucket rain gauge with a resolution of 0.2 mm. The rain gauge was placed at a height of 4 m next to the experimental stalls. Data were logged (“Chatter”, MJK), connected by telemetry to a server at the University of Copenhagen.
Every six months, surface infiltration tests in triplicates were conducted at each stall following ASTM C1781/C1781M-13 [
24]. This was to verify that no surface runoff was generated from any of the stalls.
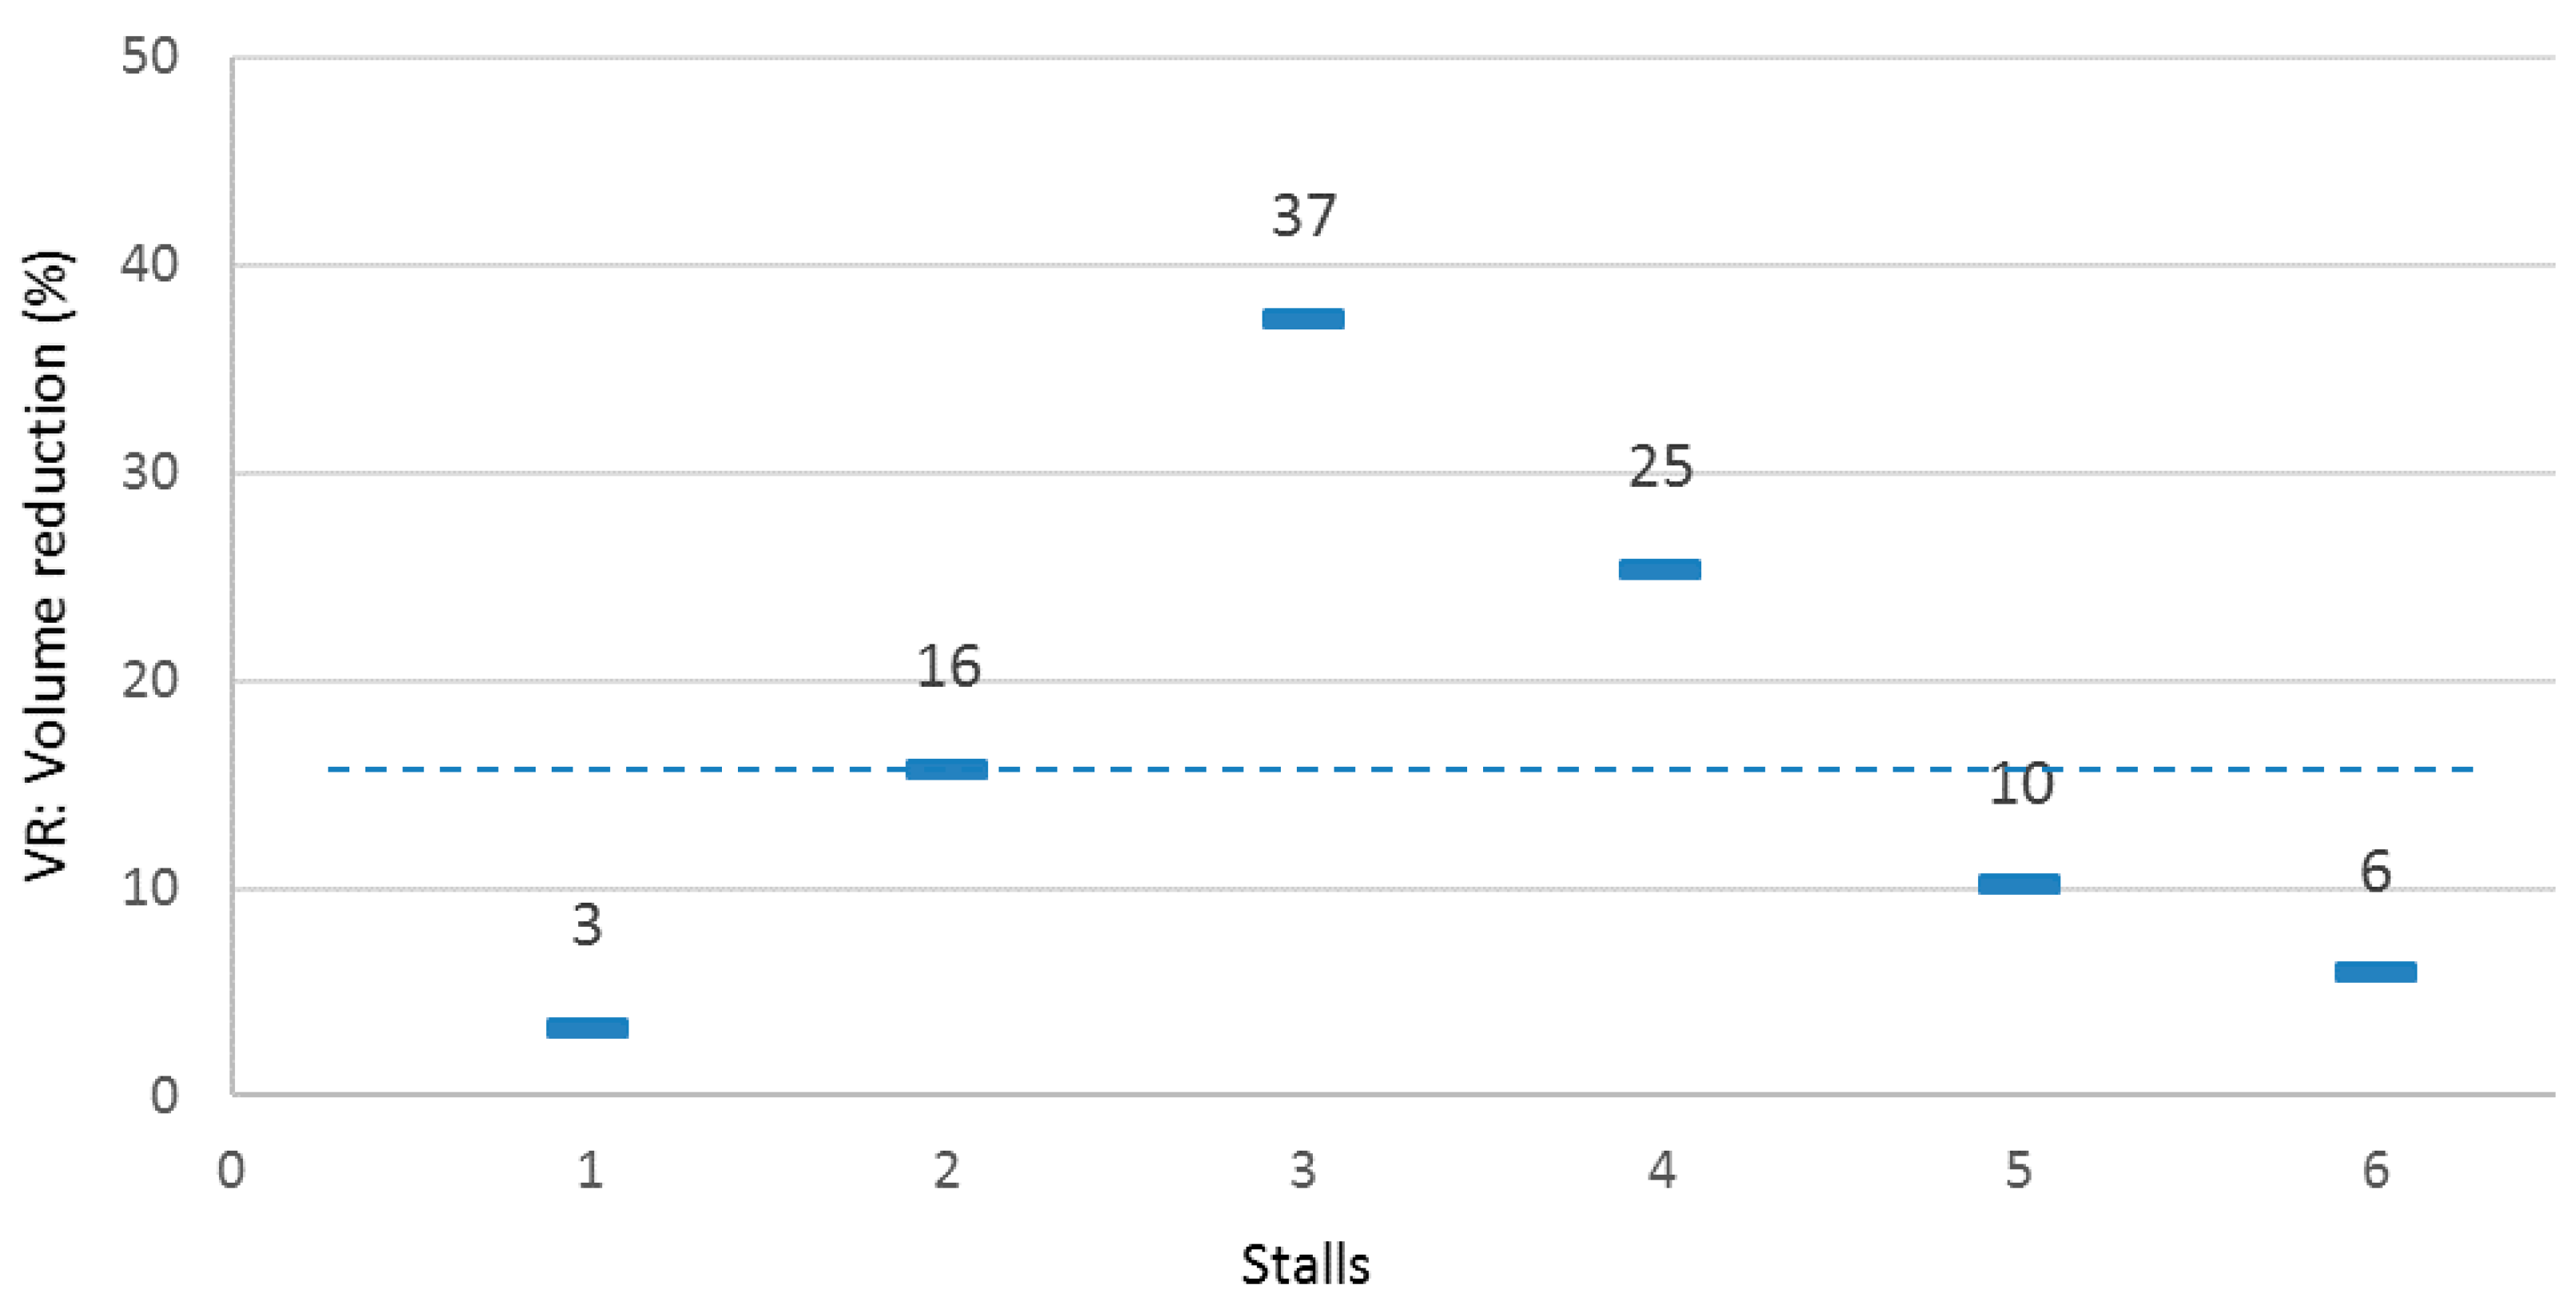
Total volume reduction (
VRtotal) over the observation period (12 months) was calculated for each stall as fraction of accumulated precipitation (
Vprecipitation) not discharged (
Vdischarge), using Equation (3). Volume reduction is assumed to represent evaporation loss.
The assessment of hydraulic performance of single events was based on analysis of events resulting in discharge identifiable from a base flow not exceeding 0.3 mm/h at the beginning of the event, and where no new event would start before reaching the same low level of base flow. Since the PP systems produced discharge for hours and sometimes days, choosing the discharge cut-off was a matter of being able to single out individual events in a climate with frequent recurring events, found more important than choosing a certain low base flow. The cut-off level is similar to 0.25 mm/h as used by Pratt et al. [
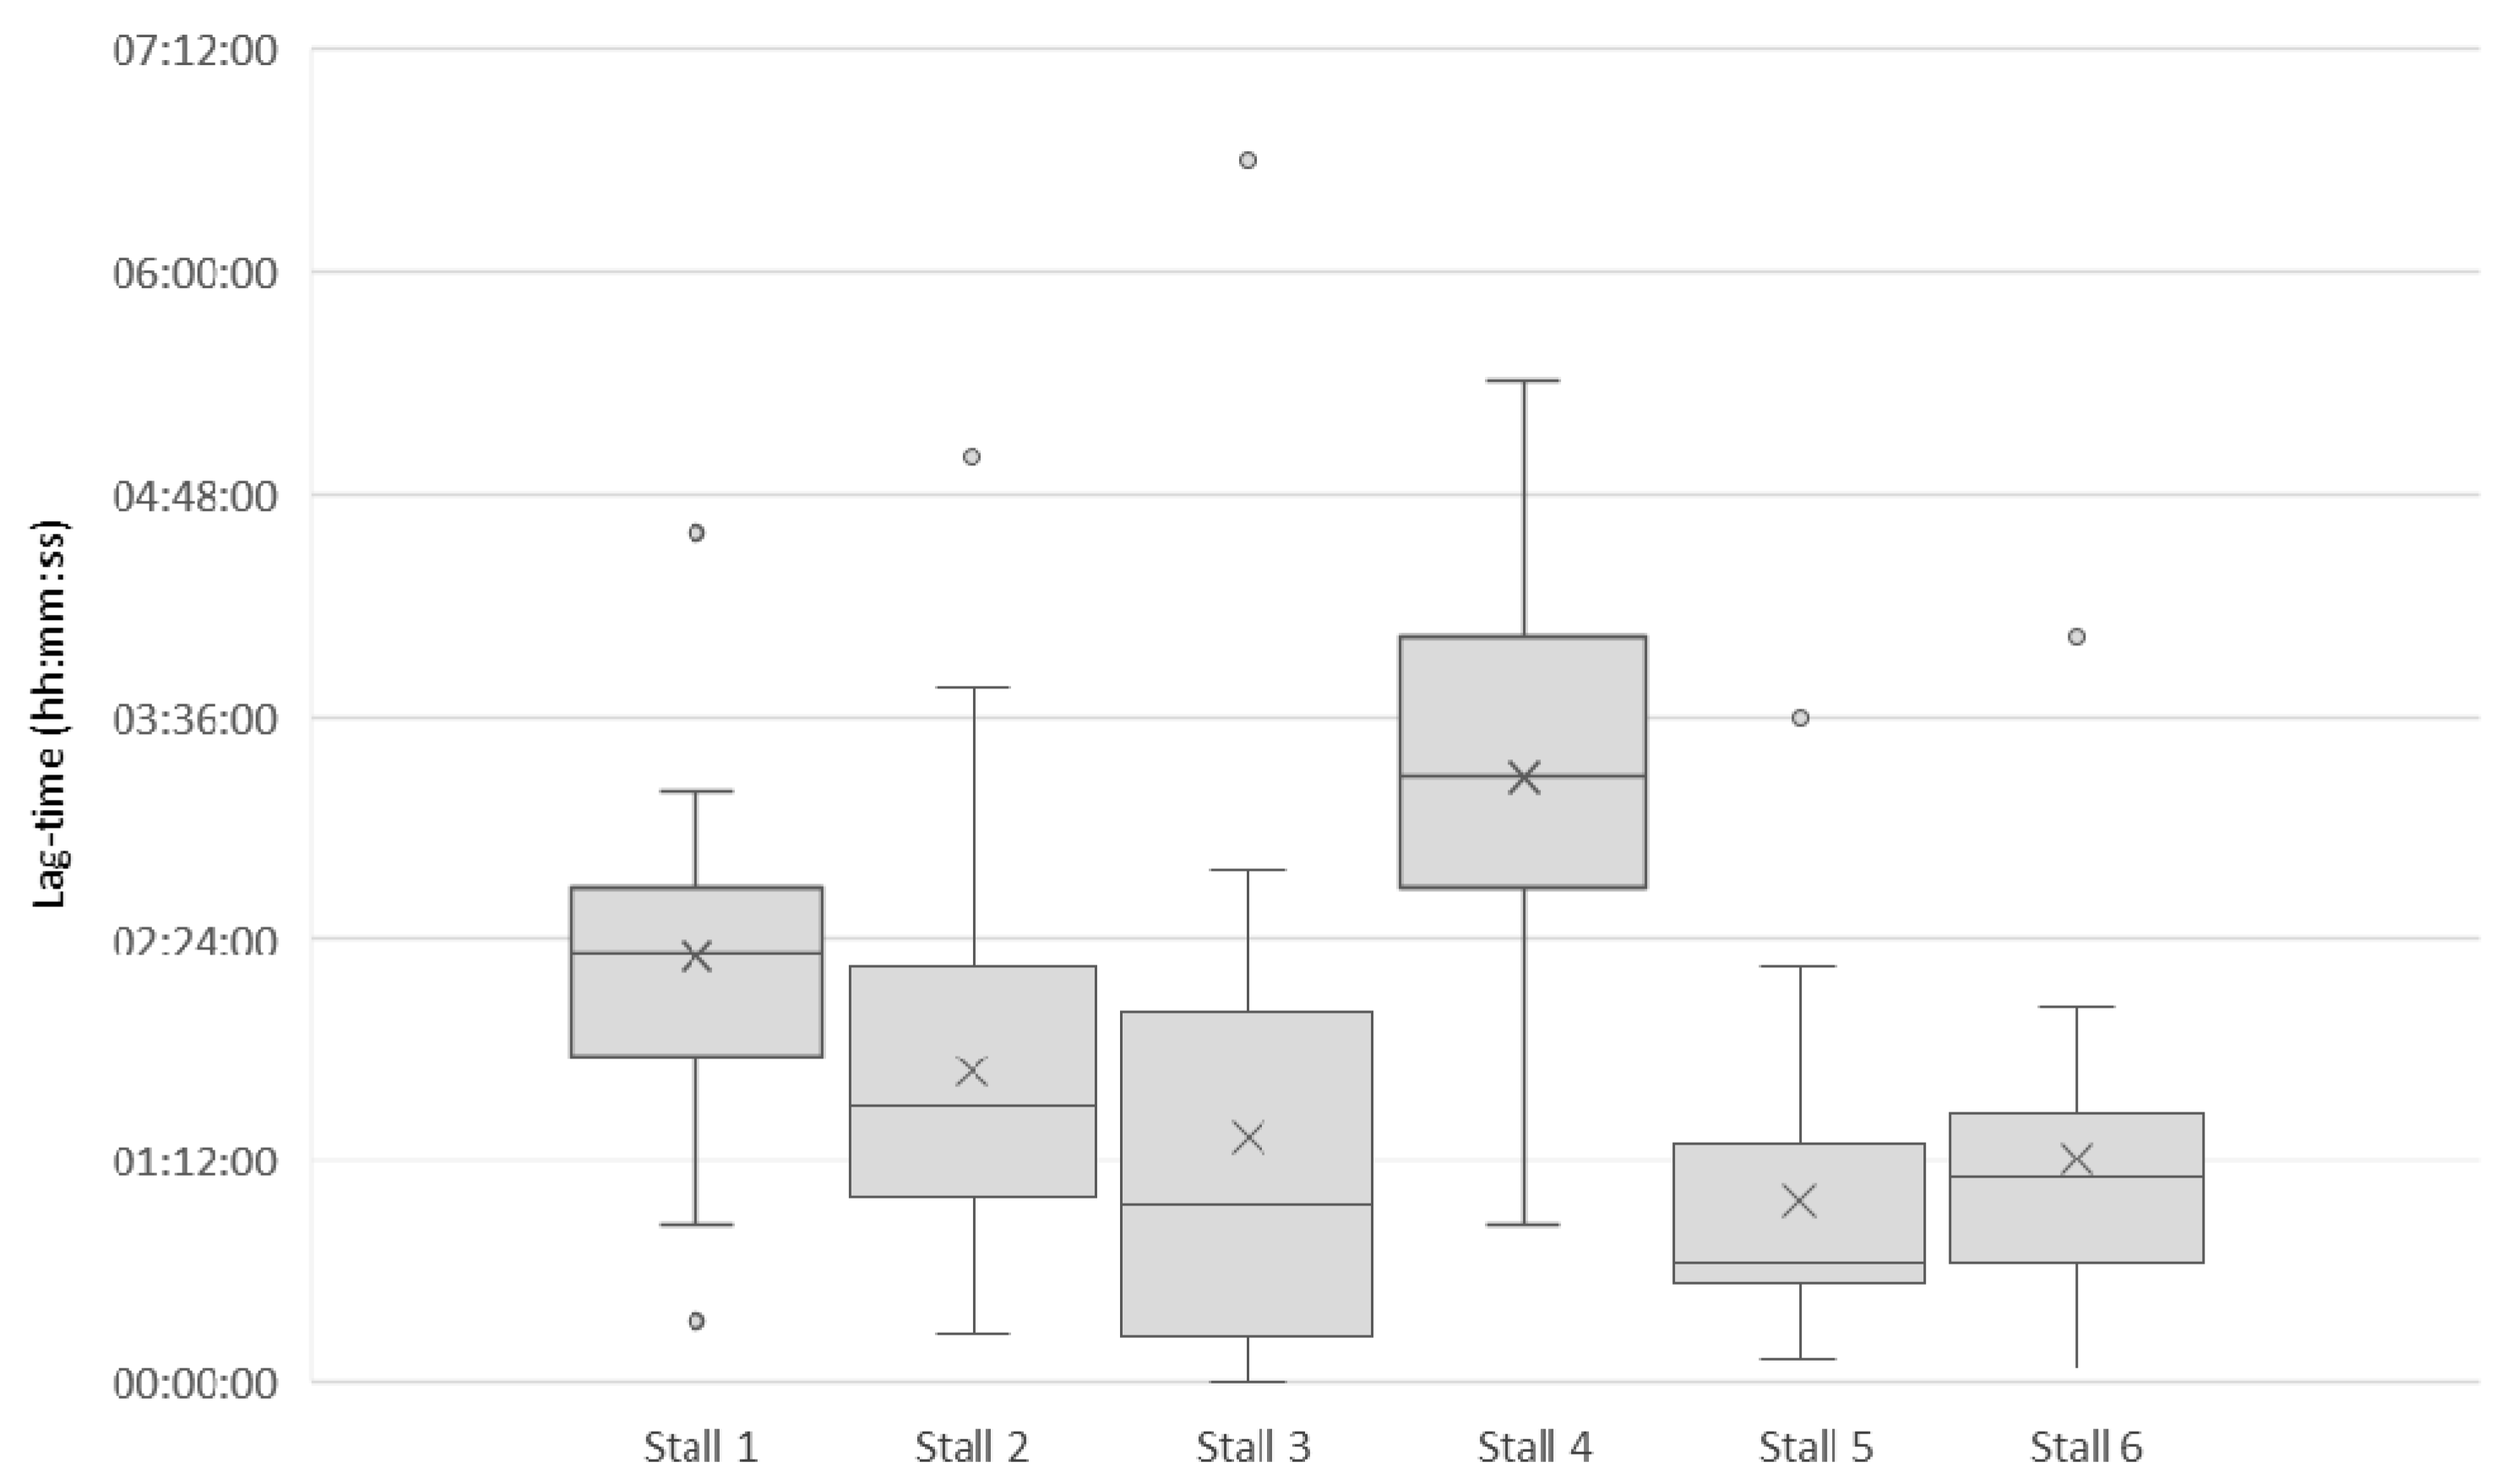
13]. Further, to obtain comparable results across stalls, no less than four stalls should produce discharge. Performance assessment included VR on event-basis, using Equation (4), and lag time (
tlag) (hh:mm) calculated on a volume-basis as the center of mass (centroid lag) defined as the time between the centroids of precipitation (
tprecipitation) and discharge (
tstall)) [
25], using Equation (5):
4. Conclusions
Over the course of 12 months, we investigated the hydraulic properties of lined PP systems, that is, when built with a liner to prevent on-site infiltration, in a real-life setting connected with an underdrain to an existing sewer network. We measured storage capacity of three different base aggregates to be within the range of 27.5–35.3%, when moist, in the order: gap-graded crushed stone > coarse-graded gravel > recycled concrete aggregates. Lower storage capacity for moist aggregates than for dry was observed, particularly for recycled concrete aggregates that had hydroscopic properties as well as many small-size particles. Total volume reductions over the course of 12 months ranged from almost none (3%) to more than 1/3 (37%), pointing to substantial evaporation losses of some PP systems. Highest losses were observed for porous asphalt (37%) and porous concrete paver (16%), both having low surface infiltration rates and placed on course-graded gravel, and for resin-bound porous pavement over recycled concrete aggregates. Pairwise comparison indicated that volume reduction was highly influenced by surface properties such as surface permeability and surface color in the order (from highest reduction): porous asphalt > porous concrete pavers > permeable interlocking concrete pavers when overlaid coarse-graded gravel. Moreover, results indicate that properties of sub-base aggregates also affect total volume reduction, at least if the PP system surface provides high surface permeability. For permeable interlocking concrete pavement that allows infiltration through joints and placed on a subbase of crushed gravel or stone, the total volume reductions were inconsequential (3–6%). Total volume reductions are ascribed to evaporation, and the marked differences observed call for further investigation of combinations of surface and subbase materials.
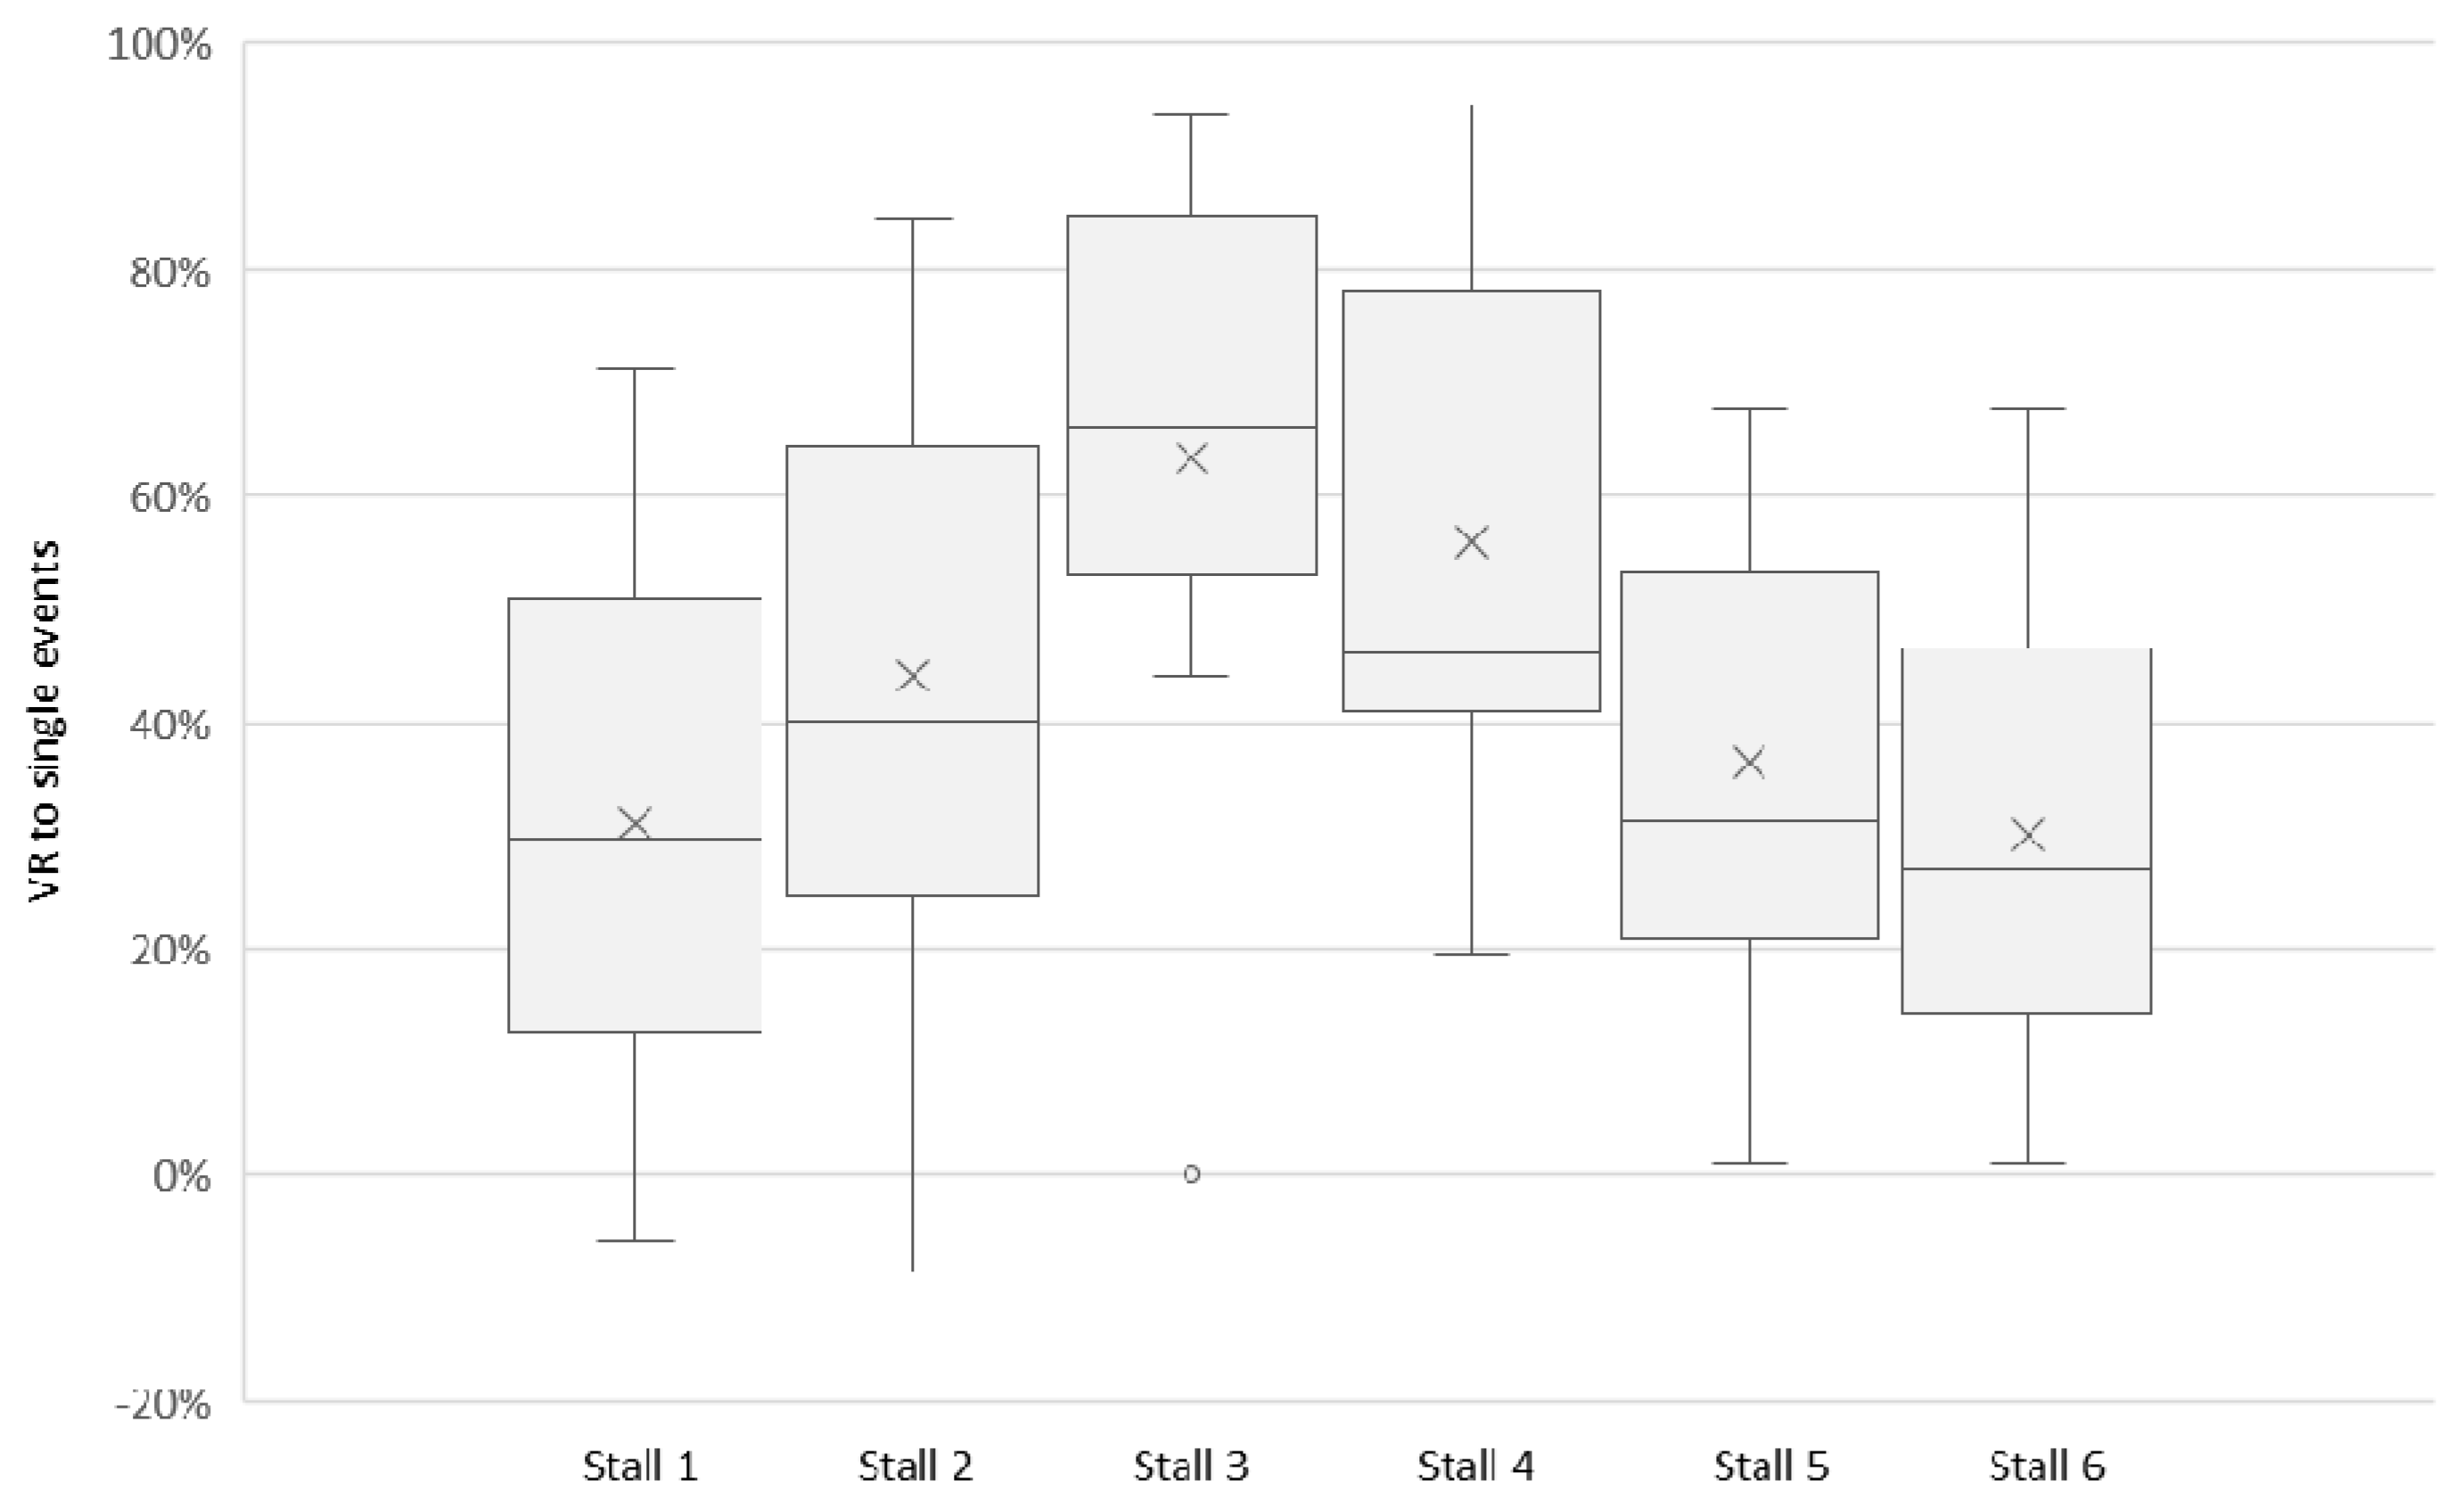
Analysis of 22 single rainfall events showed mean volume reductions ranging from 27% to 69%, following the same order as total volume reductions, but being higher due to both some periods with continuous rain not being included and due to exclusion of discharge below a cut-off base-flow level. Median lag-time of the 22 events ranged from 00:39 h to 03:16 h, pointing to a significant lag-time in all events and a significant range. Since none of the observed events represented the longer return periods used for drainage system dimensioning, e.g., the 5- or 10-year storms, the results for event volume reductions and lag-time cannot be directly related to the impact of lined PP systems on sizing of urban drainage systems. Nevertheless, with those limitations, the results show that all PP systems tested had the ability to alleviate storm water runoff by changing around half the precipitation to subsurface discharge at a base flow level of 0.3 mm/h or less. The considerable difference in hydraulic performance to the individual PP systems tested in this study suggest that favoring one hydraulic property might be at the expense of others, which emphasizes the importance of addressing the context-specific hydraulic needs prior to the selection of PP system components.


