Towards Development of an Optimization Model to Identify Contamination Source in a Water Distribution Network


1
Department of Electrical Engineering/French South African Institute of Technology (F’SATI), Tshwane University of Technology, Pretoria 0001, South Africa
2
École Supérieure d’Ingénieurs en Électrotechnique et Électronique, Cité Descartes, 2 Boulevard Blaise Pascal, 93160 Noisy-le-Grand, Paris, France
3
Department of Chemical Engineering, Tshwane University of Technology, Pretoria 0001, South Africa
*
Author to whom correspondence should be addressed.
Water 2018, 10(5), 579; https://doi.org/10.3390/w10050579
Submission received: 3 April 2018
/
Revised: 18 April 2018
/
Accepted: 24 April 2018
/
Published: 29 April 2018
(This article belongs to the Special Issue Water Networks Management: New Perspectives)
Abstract
:Protection of the water system is paramount due to the negative consequences of contaminated water on the public health. Water resources are one of the critical infrastructures that must be preserved from deliberate and accidental attacks. Water qualities are examined at the treatment plant. However, its quality can substantially be contaminated during transportation from the plant to the consumers’ taps. Contamination in water distribution networks (WDNs) is a danger that can have severe consequences on public health as well as an economic and social instability. Water distribution networks are immensely susceptible to deliberate or accidental attacks due to the complex nature of the system. Hence, contamination source identification (CSI) is a topical issue in water distribution systems that require immediate attention of researchers in order to protect mankind from the adverse effect of consuming contaminated water. Usually, a contaminant event can be detected by the water quality monitoring sensors or the contaminant warning system (CWS) installed on the network. Nevertheless, how to derive the source of the contamination from the collected information is a difficult task that must be tackled in order to evaluate the spread of the contamination and for immediate remedial strategies. In the past two decades, considerable efforts and advancement have been made by researchers applying various techniques in order to locate the source of the contamination in WDNs. Each of the techniques has certain limitations and applicability as reported in the literature. This paper presents a comprehensive review of the existing techniques with emphasis on their importance and technical challenges. Despite a series of investigations in this domain, the field is yet to be unified. Hence, open research areas are still available to explore. Consequently, improvement on the existing techniques is necessary and hereby suggested. More importantly, practical application of these techniques offer a major research gap that must be addressed.
1. Introduction
One of the most important environmental challenges in the 21st century is the protection of a water distribution network that supplies clean water to consumers around the globe. The drinking water system is a physical, cultural, social, political and economic resource crucial to human health and well-being. Provision of drinking water is a human right and significant to the existence all humans. Hence, the water distribution system is one of the critical infrastructures and essential to the society [1]. Water distribution networks (WDNs) are complex systems that are composed of spatially interrelated components [2,3]. Typical WDNs may be described as a collection of nodes and links that transport water from the main supply to the consumers. Despite the fact that some of the components are buried, the system can be accessed where human imposition is possible. Thus, it is vulnerable to accidental and deliberate attack that can have severe consequences for public health, besides economic and social instability [4,5,6,7]. Generally, water quality is examined at the treatment plant, but the water may be contaminated during transportation to the users. Intrusion into the network may occur through: storage tanks, nodes, pipe leakages, and intersections [8]. The economic and social consequences of such occurrences may be grim. The study by Kenzie et al. [9] and Corso et al. [10] reported the significant effect of a transported infection through the water supply system in Milwaukee (USA) that engender 403,000 users and subsequently hospitalised with an estimated bill of about USD 96.2 million. The recent study by Cooper et al. [11] accounted for the consequences of accidental pollution of chemical in a water distribution network in Virgina where over 300,000 users were affected. Investigations have shown that attacks on the water distribution networks are real, as it has happened before and can happen again.
In order to minimise the risks to the society, two preventive operations are required: enhancing the physical security of the system and installment of water quality monitoring sensors. If all nodes in the network can be systematically surveyed, then a moderate level of safety can be attained. Regrettably, it is impossible to install sensors at every node in the network due to the high cost of procurement and budget constraints. However, a reasonable number of investigations [12,13,14,15,16,17,18,19,20,21,22,23,24,25,26,27,28,29,30] have concentrated on the sensor placement techniques to meet diverse objectives. Nonetheless, when a contaminant event is recognised by the monitoring sensors, it is necessary to accurately identify the source of the contamination for immediate action in order to safeguard the environment and the mankind. Contamination source identification (CSI) characterises contaminant location, the time of injection and its concentrations in the entire network. A derivation of this information from the data obtained from the water quality monitoring stations is a complex task that must be addressed for several purposes. A contaminant transport model is an absolute process and treated as ill-posed because its resolution does not meet stability, uniqueness and existence. In reality, the resolution of existence can be presumed to be fulfilled, since the intrusion had to be initiated from somewhere. However, the two remaining resolutions are not fulfilled [31]. This produces discontinuous dependence on data and response to the measurement inaccuracy. Much earlier investigations have made a concentrated effort to address the CSI challenge by several approaches, which includes particle backtracking by Laird et al. [32] and De Santics et al. [33], machine learning by Wang et al. [34], and data mining by Huang et al. [35]. Recently, a survey on monitoring, modelling and optimisation techniques was discussed by Tsitsifli and Kanakoudis [36] and Kanakoudis et al. [37]. The study by Deng and Wang [38] discussed water quality data analysis based on data mining. Despite several advancements made by scholars, there is no consensus among them, which shows that the field is yet to be harmonised.
In this paper, a comprehensive review of the existing approaches for the contamination source identification in the water distribution network is presented. To the best of our knowledge, there is no existing publication of similar studies in this domain, making it unique. Hence, it pioneers the review study in this field upon which subsequent investigations stand. The uniqueness of this study can be attributed to the following: (1) it accounts for diverse approaches that have been proposed to address the CSI problem; (2) it outlines various technical associated challenges; (3) suggests possible solutions in order to develop an improved method and (4) recommends areas of future research directions. The remainder of this paper is presented as follows: Section 2 elucidates the contamination source identification problem, whereas Section 3 details the water quality models. In Section 4, solution approaches to pipe networks was discussed. Quality modelling approaches are depicted in Section 5 and Section 6 lists the available simulation tools. In Section 7, solution approaches to the source identification problems are presented while Section 8 gives a summary of the existing approaches. Section 9 details the technical challenges, suggested possible solutions and the future research direction. Finally, conclusions are drawn in Section 10.
2. Contamination Source Identification (CSI) Problem
The CSI problem entails adequate computation of three major parameters. These are: the contamination source location, the concentration of the contaminant (mass history) and the time of intrusion. This information can be computed from the data collected by the monitoring sensors installed on the networks. Hu et al. [39] reported that the contamination source identification problem is primarily handled as an inverse problem where unknown input parameters can be obtained from partially known output. This problem has received reasonable attention from researchers considering its significant and negative consequences on the society. The existing solutions can be broadly categorised into three (3) major categories: probabilistic approaches [34,40,41], simulation approaches [42,43,44] and other approaches [33,45]. Murray et al. [46] stated that an optimisation approach is often utilised to solve the event location problem. Simulation–optimisation procedure is usually a trial and error scheme that coupled a searching procedure with a water simulation tool like the one developed by Rossman [47] in order to estimate the searching results. The study by Hu et al. [39] demonstrated that the simulation–optimisation based procedure has a higher accuracy comparable to the others. A typical water distribution network with contaminant injection is shown in Figure 1. The simple network consists of a reservoir at node 1, and a contaminant injection at node 2. Nodes 3, 4, 5, 6 and 7 are pipe junctions, respectively.
3. Water Quality Models
The study by Davidson et al. [49] classified the existing models into steady-state and dynamic. These are modelled on a transport layer that presents a hydraulic solver in order to estimate the movement in the pipes. Steady state assumes that both the concentrations of constituents entering into the system and the hydraulic behavior of the network remain constant until equilibrium is obtained in all pipes. The following studies [6,50,51,52] presented diverse investigations on the steady state approach. Contrarily, dynamic models were established to satisfy both time-variant hydraulic and reactive constituents. Hence, it utilised an extended period simulation (EPS) to model the flows in the pipes as a sequence of steady-state hydraulic state calculated at distinct time intervals. Applications of the calculated hydraulic time step with EPS analysis can be found in the following studies [53,54,55,56,57]. The study by Rossman and Boulos [58] broadly classified the water models into four (4) classes and compared the speed and accuracy by using a solver developed by Rossman [47]. The four (4) classes consist two types of Lagrangian and two of Eulerians methodologies. Lagrangian approaches trace the movement of flows in a pipe and strategically situate flow volume boundaries where significant changes of concentration can be monitored. Time-driven methods (TDMs) of Lagrangians used equal-sized time steps like the Eulerian approaches. Liou and Kroon [59] described an application of this approach in their study. Lagrangian event-driven models (EDMs) utilised time steps in varying length. Boulus et al. [60] utilised the (EDMs) approach to deduce optimal segmentation procedure with negligible parts to process the simulation. In relation to the investigation by Boulos et al. [61], the result permits more dynamic water modelling in reacting to the shape and length of the network. The Eulerian method partitioned pipes into evenly spaced grid points for the Eulerian finite-difference method (FDM) and equal size volume for Eulerian discrete-volume method (DVM). The work of Islam and Chaudhry [62] is an example of FDM while applications of DVM are reported by Clark et al. [4,5], Grayman et al. [63], and Rossman et al. [64,65]. Overview of the existing water quality models is presented in Table 1.
4. Solution Approaches to the Pipe Network Problem
5. Water Quality Modelling Approach
Models are essential in water distribution networks due to the complex nature of the system. Simulation of WDNs replicates the dynamic nature of an existing or proposed system that are yet to be built in order carry out investigation and ascertain the functionality of the system before it is really constructed. Furthermore, in a situation in which water quality is an issue, direct evaluation of the system may be costly and create hazardous risks to the public health. Modelling may be appropriate to simulate the proposed or current system without disrupting the real system. Water operators need to be prepared in order to deal with a very wide range of emergencies. Disruption of services may be prevented or reduced to the effect on the consumers with the use of model against any emergency. Modelling is an excellent tool for emergency response planning and contingency [79,80]. The desire of water operators is to ensure that potable water is delivered to the users in adequate quantities. Simulation are useful tools that can analyse the variation of water quality during its transportation to the consumers. Over the years, researchers [65,81,82,83,84] have devoted efforts to evaluate the deterioration of chlorine by using simulation in the water system. Several numerical models have been applied to monitor the contaminant transport in water distribution networks under steady or dynamic hydraulic conditions. In steady state, conservation law of mass is employed to evaluate the propagation of contamination in the distribution system as reported by Boulos et al. [60]. Rossman et al. [58] reported that these models have the potential evaluation of discontinuous result, making it less accurate. However, assessment of propagation is performed under varying time demand and hydraulic state for dynamic models [60]. These models provide an improved practical approximation to real operation of water distribution systems since it is subjected to time varying conditions in the simulation [47]. The study by Boulus et al. [50] proposed an explicit solution for modelling water quality parameters such as chemical concentrations and water age based on steady hydraulic behavior. In 1993, Boulous and Altamn [85] described a procedure that governs various water quality boundary subject to steady state. The procedures were conceived to enhance the water quality control. The model suggested by Rossman et al. [64] was used to trace the disintegrated materials in a water network under a dynamic system. The model was formulated based on a mass balance relationship in the pipes subject to an advective transport and reaction kinetics. The suggested model enabled simulation of spatial and temporal distribution of materials in the water network. Thereafter, Rossman et al. [65] presented a model to estimate chlorine deterioration in a water distribution network based on mass transfer. The study was based on the consideration of pipe wall reaction and bulk movement of the first order. The chlorine deterioration formulation was integrated to the solver developed by Rossman [47] to perform water quality simulations in a large network. Simulation of transport conservative substances in a water distribution network under dynamic hydraulic conditions was presented by Boulos et al. [61]. Boulos et al. [60] expanded the suggested model developed by Boulos et al. [61] to accommodate the simulation of the transport of reactive species. However, they stated that the water quality models can only be effective for the simulation of reactive species if the reaction mechanisms are properly defined. The analytical approach for the water quality model within storage tanks for transport, mixing and kinetic reaction processes were carried out by Mau and Boulos [86]. The model generated results showed good agreements with the observed field measurements.
Dynamic models can be spatially categorised as either Eulerian or Lagrangian and temporally as time-driven or event-driven. In Eulerian models, pipes are divided into fixed control volumes and changes in the movement of water are recorded, whereas Lagrangian models traces the variation in a series of discrete parcel as water flow within the pipe. Time-driven models update the state of the network at fixed time intervals while event driven models adjust the state in the network only when variation is observed such as when a new parcel of water gets to the extreme of the pipe [58]. The article by Rossman and Boulos [58] made a comparison between four numerical methods (two Eulerian and two Lagrangian approaches considering both time-driven and event-driven approaches) for modelling the water quality behaviour in water distribution system. The results of the investigation show that the Lagrangian methods were more efficient for simulating chemical transport and for modelling the water age, while the Eulerian methods proved to be memory efficient. In 2004, Munavalli and Kumar [70] compared Lagrangian time-driven methods and event-driven methods for deviation of concentration and water quality time step. The proposed hybrid method improved the accuracy of the methods. The authors added that the time-driven methods were affected by both concentration tolerance and water quality time step while event-driven methods relied on the concentration tolerance. The proposed hybrid model verified less sensitivity to the parameters and demand a sensible computational effort. The numerical discretisation employed to model the advection in the water networks presents a good solution for Gaussian initial distribution, but generated artificial diffusion when steep gradients are simulated. Simplicity and modest computational effort have made the finite different methods to be more suitable for one-dimensional problems. Explicit finite-difference techniques are generally simplified programming, with the time step size usually restricted by the courant stability condition. The majority of implicit finite-difference methods are unconditionally stable; however, they are significantly more complex and require extra parameters [87]. Investigation of the application of seven finite-difference methods and one polynomial interpolation scheme for the solution of the transport equation for both Gaussian and non-Gaussian initial distributions were presented by Islam and Chandhry [88]. The results obtained by each method were compared with the exact solution. Almost every method gave reasonable results for a Gaussian initial distribution. However, for steep gradient concentrations, some of the methods produced high oscillations. The third and fourth-order methods generated the best results for this scenario, but required additional computation time and the programming became more complex. Substantial investigation of the models presented so far employed the extended-period simulation (EPS) approach to address the flow conditions in the networks. Development of a dynamic model to estimate the spatial and temporal distribution under slowly varying flow condition was discussed by Islam and Chandhry [62]. In this method, flow propagation was first computed followed by a simulation of a substances simulation with separation of advection and dispersion. However, the results were not satisfactory when the flow became more unstable and backward flow materialised. Ozdemir and Ger [82] evaluated the consequences of daytime operation to the night. They argued that dispersion should be accounted for and they came up with the development 2D convective dispersive algorithm. The developed algorithm was compared to the experiment and results verified that the algorithm failed to enhance the output. In 2002, Ozdemir and Ucak [84] proposed a solution to assess the deterioration of chlorine in the water network by applying a two-way approach to model the transportation of chlorine. The deterioration calculation in a single pipe involved the bulk-flow reaction, radial diffusion and pipe wall reaction of chlorine.
An input–output algorithm proposed by Zieroff and Polycarpou [89] expressed the chlorine absorption at a specific pipe junction and time as a weighted average of exponentially decayed values of the concentrations at all adjacent upstream junctions. The algorithm traces all routes from the supply stations through which each measured point to account for the reaction rate related to chlorine decomposition at the pipe wall to allow modification in order to enhance the estimation of chlorine absorption and increase the model accuracy. A particle backtracking algorithm (PBA) employed by Shang and Uber [90] is an easy and systematic class of the input-output model developed by Zieroff and Polycarpou [89]. Besides that, the model was expanded to permit multiple quality data. The main advantage of this algorithm is the capability to analyse the specific paths and its attributes since they are made explicit by the scheme. Analysis of the set of governing equations by Al-Zahrani and Moied [91] described the reaction–diffusion, the convection system for a homogeneous tubular reactor that considered both steady-state and dynamic systems by employing various standard reduction approaches. Results signified that, for cases dominated by convection and reaction, high-resolution discretisation techniques oscillations were efficient for tracking steep moving fronts. Different types and order of finite difference methods were reported to model the accumulation and the convection derivatives. First-order finite difference methods result in univalent and steady conditions with the inaccurate solution of the systems. Unlike first order, higher order techniques are less disruptive, but susceptible to uncertainties as reported by Wang and Hutter [92]. Remarkable development has been recorded to enhance the accuracy of the methods. One standard method to minimise the unseen vibration close to discontinuities is by applying numerical propagation to the system. The numerical propagation can be adjusted widely close to discontinuities in order to minimise the vibrations in another place to keep accuracy constant. Various other approaches have been developed with this approach. Total variation diminishing (TVD) schemes and flux and slope-limiter approaches, such as: essentially non-oscillatory (ENO), weighted essentially non-oscillatory (WENO) schemes and Superbee flux corrector, are few examples of these methods as reported by Alhumaizi [93]. These authors made a comparison between several finite different models proposed to address the convection–reaction issue. The results demonstrated that first-order schemes demanded large grid numbers to enhance the accuracy of the solution, which may not be suitable for large distribution systems, while higher-order methods can cause high oscillations near discontinuities. High resolution TVD, WENO schemes and the Superbee flux corrector methods were tested and proved to be accurate for solving cases with steep concentration profiles. In 2007, Alhumaizi [94] analysed the strengths and limitations of five flux-limiters to numerically simulate the behavior of a homogeneous tubular reactor with steep moving fronts. All methods were successful to solve the cases with steep concentration profiles without giving negative concentrations. The Superbee limiter was found to be the fastest scheme for simulating the sharp front of the model for all scenarios. According to Hallam [95], the chlorine decay rates in water distribution networks for bulk and wall demands should be modelled separately because it depends on various factors. The author developed a methodology for the laboratory determination of the wall decay rate. The results revealed that the wall decay rates were restrained by chlorine transport for pipe materials with high reactivity and by the pipe material characteristics for pipe materials with low reactivity. In general, water velocity increased wall decay rates, although less statistical confidence was recorded for low reactivity pipes. A moderate biofilm coating did not affect the wall decay rate for low reactivity pipes. An inverse model was presented by Munavalli and Kumar [96] to determine the water quality parameters for both bulk and pipe wall reactions and the source strength of chlorine necessary to maintain the specified chlorine residual at a target node. The extension of this method with dynamic hydraulic behavior was discussed by Munavalli and Kumar [97]. The application of the method to a real-life scenario demonstrated that the quantity, quality and location of measurement nodes played an important role in the estimation of parameters.The study by Yang et al. [98] defined contaminant chlorine reactions taking place during the transport of water in pipes. The essence was to characterise the hydraulic dispersion of non-reactive chemicals in order to improve the detection of contaminants using water quality sensors and to establish a model for predicting the fate and transport of a slug of a reactive contaminant. They performed a series of experiments in a pilot scale network and made a comparison with the results of the simulations. The results showed good agreement and helped to deduce that the residual chlorine loss curve and its geometry are useful tools to identify the presence of a contaminant slug and infer its reactive properties in adaptative contamination detections. In water systems, sensitivity analyses are used to examine the estimation of physical parameters by empirical techniques. These derived analyses are highly dependent on the unsteady advection reaction equations for quality modelling [99]. The study by Gancel et al. [99] proposed a splitting method to simultaneously solve the sensitivities and the advection–reaction equation that describes the quality modelling. The advection term is solved with an Eulerian scheme using a TVD criterion and the ordinary differential equations with reaction are resolved using an implicit third-order Runge–Kutta scheme. The work by Mansour-Rezaei et al. [66] coupled a Lagrangian-based transport model with a Eulerian-based transient hydraulic model to examine the contaminant infringement and its spread in a water distribution system. The Lagrangian-based contaminant transport model minimised the simulation period and avoided the numerical dissolution and dispersion inaccuracy that are peculiar to the Eulerian-based approach. However, assessment of contaminant infringement was carried out using the proposed approach to ascertain its capability to reveal the contaminant infringement and dispersion in the network.
6. Available Simulation Tools
In this section, various open source and commercial software packages to simulate in water distribution systems are discussed. These tools are mainly oriented for tasks of modelling and simulation of the hydraulic behavior in water distribution networks. Models for studying water quality behavior, particularly for the commercial packages are add-in tools and closed boxes. The available information about their features in relation to the water quality is outlined below.
6.1. EPANET
EPANET is one of the most popular software programs in water distribution networks. It can execute water quality movement and propagation in a piping system. Its performance includes traces of flow in pipes, pressure at each junction and chemical concentration within the whole network during an extended simulation analysis. It permits adjustment of input information and presents results in various formats. It has the capability to analyse both bulk flow and pipe wall in the piping networks. It can model the water age and tracks the movement of reactive materials over the time. The hydraulic head lost by the flow of water due to the friction in a pipe and the pipe walls can be computed by using either: Hazen-Williams, Darcy-Weisbach or Chezy-Manning developed by Rossman [47]. This package is freely available.
EPANET MSX
There are several other types of water quality problems that cannot be accurately modelled by using the single species capabilities by Rossman et al. [47]. EPANET-MSX is an expansion of EPANET that allow complex model formulation of both for bulk and wall pipe reaction. It is also available as freeware where various chemical reaction models can be executed. The following studies [76,100,101,102,103,104,105] have used EPANET for their investigations in water distribution systems.
6.2. PORTEAU
PORTEAU is a tool employed to model the behavior of looped main networks distributing water under pressure. It provides a decision-making tool for designing and managing drinking water supply networks. The general principle is simple. It consists of creating a diagram of the particular network, which is composed of pipes and nodes. The data of the different components of the system will be inserted to ensure that the complete network infrastructure and conditions are well configured close to reality. For water quality related cases, three types of results are generated: the concentration of a product, the age of the water and the origin of the water. The results can be displayed either in the form of a table at each of the time steps (5 min to 1 h) for the whole network, or in the form of a table over the whole day by pipe or by node, or in the form of variation curves over the day of pipe and by node on the network diagram. This software is available as freeware.
6.3. Piccolo
This package has the capability to simulate propagation problems in a piping network. Simulations can be run for steady state or dynamic conditions. A calibrated model can be used for master planning, case studies and water quality studies, such as influenced areas, chlorination, origin of water and blended sources.
6.4. Synergi Water
The Synergi water package is an essential water quality and hydraulic software that permits several simulation analyses. It is user friendly and flexible to utilise. Its performance is accurate and can be used on a large network. Synergi presents a versatile modelling environment for a detailed estimation of multi-species of water analysis. It is a robust software program that gives recent advance modelling needed to include GIS optional features and ascertain diverse reliability analysis. Compared to the EPANET algorithm for solving the hydraulics, the main difference is that, when the change in flow from the previous iteration to the next is less than one tenth of one percent of the overall propagation, the network is considered solved.
6.5. WaterGEMS
WaterGEMS is a multi-platform environment simulation package that can handle the water distribution system analysis. It has the capabilities to analyse pipes and can build hydraulic models. It can also simulate the water network in real time and can identify water loss. It provides an environment for engineers in order to analyse, design, and optimise in water distribution systems.
6.6. H2ONET
Spanning all platforms, from AutoCAD to ArcGIS to the Web, H2ONET products are stand-alone software. It is a robust package that can model a complete water distribution network. Its capabilities include water quality modelling, real-time simulation and control, fire flow and energy management. The package can also effectively used to analyse pressurised sewer collection systems. It has interfaces to connect with online Supervisory Control and Data Acquisition (SCADA) automatically.
7. Solution Approaches to Source Identification Problems
This section presents a comprehensive account of various approaches suggested by researchers to address the contamination source identification problem in water distribution networks. For the purpose of this study, the solution approaches are broadly classified into: simulation–optimisation approach, probabilistic approach and other approaches.
7.1. Simulation–Optimisation Approach
Optimisation approach has been very resourceful in various disciplines and reasonably applied to address challenges in water system [106,107,108,109,110,111]. One of the classical approaches to address an inverse problem is the utilisation of a simulation–optimisation approach as shown in Figure 3.
An optimisation approach is often taken to solve an event detection problem [46]. The spread of contamination in the network can be resolved by a simulation method if the contaminant intrusion is known by assumption. Modelling the output condition from a known input parameter is referred to as a forward problem. Contrarily, optimisation techniques attempt to extract the unknown parameters that produce partly known output conditions. Location of the source of contamination and other features can be derived from the information collected by the water quality monitoring sensors. This type of challenge is fundamentally ill-conditioned, which generates distinctive complications that were not obtained in the forward problem. The CSI problem is commonly expressed as an inverse problem attempting to locate the source based on the information collected from the water quality monitoring stations. A quadratic programming (QP) method was presented by Laird et al. [32] and van Bloeman et al. [112] to address the inverse problem. The optimisation problem can be represented as:
where E is the error, is the estimated contaminant concentration, and is the observed contaminant concentration. The time step is t and i is the node index of a water quality sensor. The indicated number of time steps T and the number of sensors in the network, N. The variation between estimated and observed pollution profile is calculated for all sensors in the network at every simulated time step. The objective was to minimise the variation between the measured data and the computed values of the developed model and utilise regularization to detect the family probable solutions. Experimental results from the network examined showed that the performance of the algorithm was affected by changing the location of internal node. Even though the formulation exhibits the possibility to identify the source location, the excessive computational effort associated with it is a major challenge. Hence, it is practically impossible to apply this approach to a large distribution network. Exact gradient calculation through direct or adjoint sensitivities will greatly improve the performance of the algorithm. Due to the shortcoming of direct linear solvers, it becomes relatively difficult to solve the entire network problem for increasing large networks. Thus, Laird et al. [113] formulated a dynamic optimisation method based on a sub-domain approach to reduce the excessive computational time. Analysis of the network examined showed that the sub-domain approach reduces the computational time and also improves the quality of the inversion solution. Selection of a sub-domain reduces the amount of the available information for the optimisation and also reduces the computational time. Caution must be taken while selecting the sub-domain in order not to exclude the important information of the inversion problem. However, it is important to identify the optimal sensor locations to minimise solution of non-uniqueness and reduce the identification time. Most importantly, further investigation of more advanced techniques for selecting this sub-domain is inconsequential. A particle backtracking algorithm introduced by Zieroff and Polycarpou [89] and extended by Shang and Uber [90] was presented for breaking down the water quality model down to its essential elements, calculating an impact coefficient that describes the concentration of selected outputs as functions of network sources and tank concentrations. This algorithm reformulates the pipe constraints of the water quality models by reducing the size of the discretised problem and provides a straightforward mathematical representation of the pipe boundary concentrations. The authors also identified some important areas of future work such as the determination of optimal sensor location, the testing of the reliability of the formulation against sensor failure or noise in flow rates or sensor measurements and the correct description of the reaction rate in pipes. Some results were presented in a real municipal water distribution system to demonstrate the effectiveness of the proposed simulation. A source inversion problem developed by Preis and Ostfeld [114] discussed the use of a coupled model tree-linear programming approach. Primarily, the model trees were formulated from a learning process by applying tool developed by Rossman [47]. Thereafter, the model trees, linear rule configuration was combined with a linear programming design to unravel the inverse issue. Also, Preis and Ostfeld [115] suggested a method that linked the tool developed by Rossman et al. [47] with a generic algorithm (GA) to solve inverse problem. Contaminant events were simulated and the GA regulates the features of injection of the contamination with the purpose of minimising the variation between the measured data and the simulated contamination concentrations. Although, the model employed an optimisation heuristic search technique, it is important to know that such approach is substantive only if a systematic search technique is not viable. Simplicity of system size and provision of solutions to problem of uniqueness is two major contributions of this study. However, one major notable limitation of this work is the solution to the excessive computational burden especially when uncertainty is incorporated. In reality, implementation of the algorithm will possibly require parallel computing. Additionally, the algorithm assumed that the flows in the pipe are known and monitoring stations are perfect. This may not be practicable as little information about the consumption and pressure demand are known as well as utilisation of imperfect sensors. Investigation on the effect of uncertainties in the sensor measurements was carried out and presented using a modified generic algorithm scheme by Preis and Ostfeld [116] and Prasad and Park [117]. The developed model was implemented by using three types of sensors: perfect sensors, sensors transmitting fuzzy measured information and sensors indicating only a contamination presence. Two illustrations of increasing complexity were presented to validate the capability of the developed methodology showing the balance between the type of the sensor sensor types and the model capabilities in order to obtain a unique resolution to the source identification problem. Simulation-optimisation method by Guan et al. [42] was developed to solve a nonlinear CSI problem for a complex water distribution system. The method employed the tools developed by Rossman as a simulator to randomly compute the concentrations at designated monitoring stations. Thereafter, the obtained information was utilised in a continuous optimal predictor–corrector algorithm in order to identify the source of the contamination. A case of Dover township (Tom River), N.J water distribution system was used to validate the proposed method. Results showed that the method was efficient and robust in identifying locations and release histories of the contaminant sources. Nonetheless, better results can be obtained if the number of monitoring station increases, which will directly increase the cost of procurement and operation. Consequently, the authors recommended further investigations on the optimal sensor placement and spatial distributions. The approach by De Sanctis et al. [33] identified the set of probable source of contamination by applying sensor status from a monitoring station and hydraulic parameter. The method integrated the particle backtracking algorithms and fixed rules in order to determine the probable source junction that can have effects on the positive sensor information but not a negative measurement. Based on the assumption that sensors are perfect, the method can identify all locations and times of possible contamination sources using information about the network hydraulic and contamination state on distributed sensor locations. A flow path analysis gives water flow paths and travel times using each monitoring station and sampling time. The result of the proposed method efficiently reduces the number of possible sources and true contamination source that belong to the candidate group. Using this method is helpful for real-time application because of the computational competence. Improvement on the better choice of sensor location will aid the capability of this method. A mixed-integer linear programming (MILP) method to identify the source of contamination by using the accessible discrete data from sparse manual data at restricted locations was established by van Thienen [118].
The effects of uncertainties in water management resource systems have been widely studied [119,120,121]. Understanding the uniqueness of hydraulic in water distribution systems is important for building robust models and or performing vulnerability assessments and reasonable uncertainties that produce high degrees of uncertainty in estimated exposure levels which was discussed by Torres et al. [122]. Thus, parameter uncertainty is a source of error that may create a large disparity in water distribution network, particularly in the water demand which can fluctuate widely and is unpredictable [35]. These uncertainties may be computed from the random feature of resource conditions and natural process errors in estimated model parameters or imprecision or fuzziness human-induced [121]. These approaches provide an approximation that is always affected by modelling uncertainty and difficult to handle by the available model calibration approaches [35]. In real-life applications, Preis and Ostfeld [123] proposed that only a smaller quantity of the hydraulic data is known and the single available data from the monitoring status. Thus, they presented a methodology that adds the hydraulics ambiguity in contamination source identification. The proposed methodology relied on an earlier model developed by the authors embedded in a statistical structure to compute the ambiguity of a contamination source identification. Three examples of applications were used to ascertain the performance of the proposed method through base runs and sensitivity analysis. It is noteworthy to state that demand perturbations were not examined assuming a uniform probability between the upper and the lower values of the anticipated demands of each of the nodes with no consumption dependencies between different nodes. Inclusion of this may have an effect on the result. However, the main limitation of this method is the computational intensity, which requires further investigation in order to deal with a large network scenario. Contamination source identification under water demand uncertainty was proposed by Vankayala et al. [124]. In this approach, a simulator designed by Rossman [47] was utilised with stochastic and a noisy genetic algorithm (GA) as optimisers to minimise the difference between the simulated and observed concentrations at the sensor nodes. The random demands were synthetically created by using a Gaussian model and AR model. In order to address the demand inconsistency in the source identification problems, two alternatives of generic algorithm were scrutinised. Overall, four diverse scenarios were inspected on the sample network using two demand models and two optimisation schemes. The two optimisation schemes (Stochastic and noisy GA) identified the true source as the most feasible source for both demand models. Remarkably, GA exhibited robustness of better precision than the stochastic. In addition, the probability of identifying the true source was lower for the more realistic AR model than the Gaussian model. This shows that AR model is better suited in real application as it leads to a more conservative assessment of uncertainty in the source identification problem. More research efforts should be devoted to the influence of temporal demand uncertainty on a large water networks and multiple contaminant sources. The challenge of a limited number of sensors, large network nodes and varied water demands are major contributors of uncertainties in this domain. Large amount of studies has considered the simulation–optimisation model for the CSI problem as a unimodal optimisation problem. However, Yan et al. [125] formulated it a multimodal optimisation problem by using dynamic niching that calculates the multiple contamination sources through one operation that provides the possibility for screening the true contamination source in order to address the issue of uncertainty. A standard network example in the study by Ostfeld et al. [19] was used to test the effectiveness of the developed method. However, the authors suggested further research on this method as problems can be wide when the network nodes are more than 1000 and water demands that consumers make real-time changes.
Substantial effort is in progress to develop an algorithm in support of the contamination events in water distribution networks. Of interest is the application of the least square method by Hill et al. [126] to minimise the deviation between the measured and simulated concentration in an attempt to locate the source of contamination in the water network. Several previous studies developed their formulations on the ground that continuous sensors will offer unbiased measurements of concentration. However, based on recent advances in technology, it is possible that Boolean type sensors will be more suitable to employ as it will indicate the occurrence of contaminant perfectly if the concentration is higher than the threshold. The correlation result between the constant readings and Boolean measurements are presented in this work. Indication emerged that location can be more accurate if the high quality of Boolean values was utilised in the least square formulation. Still, the Boolean measurement algorithm failed to calculate the injection magnitude because of the disconnected reaction between the network delay and the magnitude of concentrations. An optimisation method developed by Cristo and Leopardi [127] aimed to locate an accidental contamination source in water network by using the water fraction matrix concept. The method starts from the concentration data to select a set of candidate nodes from which the source location was identified to minimise the variation between estimated and measured concentrations. An uncertainty analysis was presented to exhibit the capability of the method against ambiguities in concentration measurements and water demands. The study considered a literature network of Anytown to demonstrate the effectiveness of the method, and the authors recommended further studies on the methodology for deliberate contaminations and multiple pollution sources. Application of the simulation–optimisation technique to reveal a contamination sources in a laboratory water distribution system by employing a sodium hypochlorite solution as a contaminant was reported by Mou et al. [128]. Output for various input factors was compared, and their effects of the procedure were also outlined. The work of Tryby et al. [129] suggested a methodology as a nonlinear combinatorial optimisation problem and resolved it by utilising a genetic algorithm. The performance of the optimized scheme was evaluated and the results verified the significance of the monitoring sensors compared to the solution proposed to identify the sources. Liu et al. [43,44] proposed an adaptive dynamic optimisation technique (ADOPT) that generates a real-time reaction to a contamination incident. A new multiple population-based search that employed an evolutionary algorithm (EA) was examined to avoid the untimely convergence of EA, which might lead to an incorrect solution. This procedure was implemented to keep a set of alternative solutions that signify various non-unique solutions. As new observations are incorporated, the EA outcomes produced an improved solution that reduces the degree of non-uniqueness. Two water networks were examined to exhibit the performance of the proposed techniques. However, the ADOPT solved a limited set of cases based on some assumptions like a single injection location, non-reactive contaminant, and known demand, which may be practically impossible in real life. Further investigation of this technique is necessary to handle cases of relatively large networks.
Gugat et al. [130] described a WDN where the contaminant intrusion could occur at a limited number of nodes. The method was based on the data collected in a defined set of sensors. The corresponding infinite-dimensional optimisation problem was defined in a Hilbert space setting with the addition of a quadratic regularisation term added in the objective function to guarantee a unique solution. Under certain assumptions, the computation of the solution on a discrete time grid was performed by solving finite-dimensional linear least squares problems. This method was considered useful to minimise potential impacts of contamination emergencies on consumers by helping to select locations to flush the contaminant out of the distribution network. Recently, the study by Xu et al. [131] formulated a cultural algorithm to solve the CSI problem. Three different sizes of water supply networks were used to examine the efficiency of the method. The results showed that the algorithm is feasible and demonstrated robustness of the proposed method. However, excessive computational time was observed to process the results that were a difficulty of this application. The problems associated with the contamination source identification concern include a limited number of sensors, a large number of network nodes and dynamic water demand that creates uncertainties. In the work of Yan et al. [132], an optimisation problem was established and the hybrid encoding method was employed to code the problem, according to the properties of a variable so as to improve the convergence speed and accuracy. Different sizes of the pipe network data validated the proposed methodology. The study by Xue et al. [133] addressed the challenge of water demand with the aid of a Gaussian model and then proposed an improved generic algorithm to solve the CSI problem under uncertainty of water demand. The proposed method was experimented on two water distribution networks of different sizes. However, they established that constant changes of water demand and large scale network nodes can be considered as an abstract optimisation problem that is dynamic and a multimodal function in nature. Therefore, the authors advised the need to further investigations on an improved method to address the challenge of dynamic, large scale and multi-model problems.
An adjoint method is a means for direct computation of the sensitivity of a system state at a specific position and time to the dynamic system. This approach is referred to as adjoint state and a state variable of the forward contaminant transport equations. In the case of CSI, the system state is the contaminant transport of a monitoring station and the system parameter is the extent of discharge from the source. The method has been utilised for source identification in groundwater [134]. The application of this method in water distribution networks has been restricted to moderately small networks [135]. Locating of a contamination source in a water drinking system by using this method was introduced by Neupauer [135]. They employed the simulator approach by Rossman [47] as a tool that assumes an idea mixing at all nodes. However, the investigation by Austin et al. [136] revealed that the proposition generated an invalid result. This led to the development of an adjoint theory by Wang et al. [137], which incorporates incomplete mixing at the junction. A coupled adjoint scheme and a Monte Carlo sensor installment procedure was established by Ung et al. [138]. At first, the backtracking algorithm applied binary response to compute the possible location of contamination characteristic. After which, a definite condition was applied to precision and explicitness. Subsequently, two optimising procedures that maximise the set conditions were suggested: greedy and a local search procedure that was integrated with a Monte Carlo scheme to assign the best location of monitoring stations suitable for assigning the source of a contamination. This method was tested on a practical French network that has over 2500 pipes to validate the proposed method. The authors agreed that the choice of sensor placement for source identification depends on the network properties along a number of available sensors. They advocated further study on the impact of hydraulic and transport model errors in the final output design.
7.2. Probabilistic Approach
The dominance of Bayesian technique has been recognised in water resources and environmental system investigation [139]. Its usefulness has been found in the analysis of chlorine deterioration in water distribution networks [35], rainfall–runoff parameter estimation [140,141] and network model calibration [142], leak localisation [143] and water demand [144]. The studies by Candelieri [145] and Shabani et al. [146] are recent methodologies for water forecasting demand. Candelieri et al. [147] employed a Bayesian approach to optimise the operation of pumps in water distribution systems. Little effort has been made to estimate the source probabilities [127]. An efficient experimental design for contamination source identification in ground water was discussed by Zhang et al. [148]. Bayesian techniques have become a probable means for the CSI challenge by openly allocate probabilities to the likely source locations. The Bayesian Belief Network states that:
Here, the prior probability of t with unknown observation M; and is the probability of M with unknown t; is the succeeding probability of t after observation M; and represents the probability of observation M assuming t is correct. The Bayesian prior probability is upgraded to a succeeding probability that reproduces an observation M. Utilisation of this approach by Dawsey et al. [149] and Dawsey [150] integrated sensor information in order to estimate the probability of incidents from various zones in the network. Identification of contamination source in water distribution networks based on the users’ report was developed by Tao et al. [151] from a probabilistic view. The feasibility of this methodology was demonstrated by the application in real cases of ZJ city, China, which includes more than 3000 nodes. Various scenarios were designed to investigate the influence of different uncertainties on the results. The proposed methodology has the capability to identify the contamination source based on the users’ reports. However, since the information obtained from the users’ reports’ is very limited and consists of a great number of uncertainties, the unique approach derived from the method may not be the true contamination source. Further investigations to improve the methodology in order to make it more practicable is necessary. The Bayesian Belief Network by De Sanctis et al. [152] expanded the study by De Sanctis et al. Ref. [33] suggested a probabilistic source identification based on the principle that allocated a probability instead of classification to any likely upstream node that is more appropriate to consist of hydraulic route ambiguity as well as data related to false positive or negative data from the monitoring stations. A similar approach to this theory was developed by Yang and Boccelli [153], which employed a beta-binomial conjugate pair structure to characterise the CSI and equate its performance with the earlier developed by De Sanctis [152]. The new procedure was able to instantly allocate a probability to a likely source location and upgrade the probability by applying the backtracking theory and Bayesian statistics. A simple network was used to validate the approach shows that a beta-binomial algorithm has a higher response than the Bayesian rule. In addition, evaluation of a small skeletonised network and higher pipes exhibit higher accuracy for both algorithms. Generally, the proposed beta-binomial probabilistic contaminant source identification leads to more selective performance than the Bayes’ rule approach. The effect of using imperfect sensors and hydraulic uncertainty requires further investigation. A stochastic technique using directed acyclic graphs (DAG) that created clusters of nodes and enabled the potential sources to be estimated was described by Perelman and Ostfeld [154]. Backward modelling approach by Nuepauer et al. [155] uses a probability density function to identify the source node and release time of a contamination. The probability density functions are obtained from the data collected from an installed set of sensors. The backward model proved to be effective for steady flow conditions and for a single instant source of the contamination. Application of the Bayesian sequential approach to address the contamination source identification problem was discussed by Wang and Zhou [156]. Validation of this method was examined on the real-life simple network scenario. The results verified the effectiveness of the method. One notable contribution of this method is that the probability distribution of likely observations is organised in ranked tree and combinatorial disruption is avoided. Additionally, a variation analysis of posterity was conducted to provide significance probability to the achieved identification output, and the computational load in the method increases exponentially as the number of contamination parameters increases, which limits the application of the proposed method in the multi-parameter identification case. Consequently, studies on minimising the computational load in order to extend the proposed method needed to be done. Another interesting area that requires further study is the optimisation of sensor layout. The study by Baradouzi et al. [157] based their method on Probabilistic Support Vector Machines (PSVMs) for identifying the contamination source in water distribution systems. Several simulations were performed in order to obtain the necessary information for training the PSVMs. The trained probabilistic SVMs were found to be productive in locating the upstream areas that are liable to have positive identification output. The efficiency and usefulness of the proposed approach were validated using the available information acquired from a water distribution network of Arak in the western part of Iran.
7.3. Other Approaches
Several other authors have addressed the CSI problem in water distribution networks by using analytical [158], model-based [159], artificial neutral networks, [160] and hybrid methods [161,162]. The study by Propato [20] presented an entropic-based technique to address the CSI problem. The authors utilised the linear algebra method to reduce the selection of the possible source of the contamination. Thereafter, the minimum entropy technique was employed to compute the possible source of the contamination. This approach accounted for different potential sources of pollution that may be liable for the information collected at the monitoring stations. The study by Shen and McBeam [163] disclosed that the identification of contamination sources had two major issues: the occurrence of false negatives in which the method fails to identify the true contamination source, and false positives when the method wrongly identifies a location that was not the true contamination source. These authors presented a data mining scheme based on the registered information at the monitoring stations. The results indicated that a large amount of stored data will minimise the negative and positive rate false scenarios. A model-based technique was introduced by Eliades et al. [164] to detect the occurrence of contamination in water distribution networks by using a chlorine assessment. In this technique, the chlorine injection indicators apply many Monte Carlo models that run simultaneously in the actual system. A threshold was set at every node location of the monitoring stations to send an alert once the concentration is equal to or higher than the set limit. This technique was validated in a real-life scenario. Davidson et al. [49] suggested the two method approach that utilised supervisory control and data acquisition, which generated connectivity matrices. The approach considered the impact of all propagation scenarios of the contamination. The first one considers the operating nodes while the second focused on elementary pathway. The results of the two methods are similar, and computational burden was reduced in the elementary pathway procedure.
Artificial Neural Networks (ANNs) had also found relevance in the water distribution networks. The study by Hamam and Hindi [165] utilised artificial neural networks to optimise the leakage in the water piping network. Investigation by Kim et al. [160] applied ANN models to identify the source of contamination for intentional or the accidental spread of Escherichia coli 15,597 in the water network. The output of the approach revealed up to 75 percent correlation of the spread of all the water parameters considered. The approach by Yang et al. [98] explored a real-time event adaptive detection, identification and warning methodology based on the information collected by the conventional water quality sensors. They performed several pilot scale pipe flow experiments with different chemical and biological contaminants at different concentration levels. Contaminant signals were enhanced and background noise was reduced in time-series plots, through adaptive transformation of the sensor outputs leading to detection and identification of all simulated contamination events. Then, the relative changes calculated from adaptively transformed residual chlorine measurements were quantitatively related to contaminant-chlorine reactivity in drinking water. The results showed that the tested contaminants were distinguishable based on kinetic and chemical differences. The approach by Zechman and Ranjithan [159] described an approach based on evolutionary techniques and a population-based global search procedure. The method was formulated by using a tree-based encoding model that presented the decision vectors and a group of related genetic operators that lead to an effective searching. The results of the technique indicated a good correlation and its capability on the numbers of cases examined. The combination of data from several monitoring sensors to minimise false background alarms was proposed by Koch et al. [166]. They used the Kulldorffs scan test to statistically locate the important clusters of identification based on the location and time of isolated detections as points leading to a random space-time point process. The results showed that the scan test can detect significant clusters of events, reducing the occurrence of false alarms caused by background noise by three orders of magnitude using the scan test. The clusters can also help to characterise the contamination. The study by Di Nardo et al. [158] experimented with a basic backflow incident with the introduction of cyanide into the potable water system. The location of the major entry portion of the contaminant occurrence was indicated. Computation of the lethal dose of the cyanide consumed by the consumers and the length of the affected pipes was examined along the sub-division of the isolated region. The output of the techniques showed that sectorisation of WDN may minimise the propagation of polluted water and prevent the customers from using unsafe water. Consequently, exposure to the contaminated water has significant negative effects on the consumers. Hence, the author concluded additional examination on the proposal of a water district in water networks for adequate protection. A computational approach based on decision trees for selecting a series of junctions in the WDN to conduct an extended evaluation of the effect of water contamination and isolating the source area with a few quality samples was described by Eliades and Polycarpou [167]. The performance of the procedure was demonstrated on a simplified benchmark water distribution network for validation.
Liu et al. [162] presented a methodology that integrates a statistical procedure and a heuristic search model to characterise the contamination occurrence. The statistical procedure was employed to spot the probable locations for the contaminant intrusion and the heuristic search method enhanced refinement of the contamination source characteristics. Two illustrative examples of WDNs demonstrated the ability of the method to adaptively discover the contaminant source characteristics as well as assessing the degree of non-uniqueness. The method can be extended to solve larger networks such as multi-source contaminant. However, the scenarios examined here did not account for uncertainty of the hydraulic model, which has implications on the output. Hence, future research should be conducted to cater for the uncertainty that can lead to the excessive computational burden that can pose a challenge on both accuracy and efficiency of the method. The effort made by Liu et al. [161] introduced a hybrid method for the real-time characterisation of a contaminant source given sensor measurements in WDNs. This approach incorporates a logistic regression (LR) and local improvement model to accelerate the convergence. The study by Liu et al. [43] employed an evolutionary strategy (ES)- based Adaptive Dynamic Optimisation Technique (ADOPT) to adaptively examine the group of contaminant source characteristics. Actually, the ADOPT exhibits a promising result, but requires an extensive computational to converge. This computational burden will not only affect the identification time, but also the quality of the result. In order to minimise the simulation time and sustain the adequacy of the accuracy, the ADOPT techniques require further improvement. Here, the integration of LS into the ADOPT stimulates the performance of the algorithm of the ADOPT, and the degree of improvements may depend on the problem. This augmentation assists the operation of ADOPT by eradicating unnecessary nodes and adjusting the process. To exhibit the efficiency of the hybrid model, two networks were considered. One is a small network of about 117 pipes and the other is a relatively large network with details in [168]. Several interesting results were derived from the networks examined. The hybrid methodology has a faster convergence than a standalone approach. This is evidence that the hybrid process can improve not only on the quality of the solution, but also on the computational efficiency, particularly when a larger network is considered. The procedure of local search selection plays a vital role in the algorithm performance, which requires further study, especially under various degrees of complex scenarios. Costa et al. [169] investigated the challenge of restricting the contamination occurrence by using information collected from the monitoring stations. The proposed approach was tested on a real-life network to verify the methodology. The outcome of the investigation revealed that it is possible to restrict the sources of contamination to the first sensor that detects it. Thereafter, an improvement on the outcome can be made as new information is accessible. This indicates the possibility of detecting the contaminant concentration variation in the network at the new sensor location. Thus, the other potential contamination event can be identified and location of sources can be further confined. Two scenarios were also examined to ascertain the effect of irregularities of false positives. The results demonstrated that false positive incident has no connection to the real identification.
8. Summary of Existing Approaches
Table 2 presents a summary of some of the existing approaches proposed by researchers in order to address the contamination source identification problem in water distribution networks.
9. Challenges, Suggested Solutions and Future Directions
We are motivated to present a comprehensive review of the existing approaches developed in this domain, being the first of its kind in order to develop an improved optimisation model for contamination source identification in WDNs. Unlike other networks, several attributes of water distribution networks such as: huge scale, high risk to the society, susceptible to attacks, and water pressure driven amongst others makes it more unique. The aforementioned studies applied various methodologies to the contamination source identification problem in WDNs, which indicates the significance of this research field. Each approach has certain limitations and applicability as reported in the literature, which shows the field is not yet harmonised. The limitations associated with some of these approaches are excessive computational time, water demand variability, uncertainty, optimal sensor placement and large network consideration. Although some of the studies require a reasonable computation time that relies on the concentration profile analysis that assumed that the sensor will estimate the pollutant concentration, which might be impossible to actualise in a real scenario. More effort should be devoted to formulating a simplified model. Meanwhile, cloud computing has emerged as a viable option with a pool of rich computation resources. This has been proposed and adopted in practice. One of these was discussed by Tabaa et al. [176], which enabled a MapReduce/Spark computing paradigm. Further investigation in this direction should be sustained, which is a future research direction. In addition, the majority of the published work envisaged a calibrated hydraulic analysis with an estimated water demand at each node at a specific time. Demand in water distribution networks is not constant and this may have a significant effect on the analysis. Recently, the study by Creaco et al. [177,178] presented the choice of demand and hydraulic model in water and subsequently a review of models for generating household water demand. Further study on the demand fluctuation due to its stochastic nature is crucial and an open research field. The challenges concerning parameter uncertainty are not addressed in general. However, little attention has been given to address issue of uncertainty. Integrating some of these approaches as a form of hybrid could give better results [74,161] and are hereby recommended. Furthermore, it will be interesting for future research to present a case study that compares the various methodologies applicable to source contaminant identification. This will help in identifying the various strengths and weaknesses of the methods and how they can be hybridised to get a more robust method. In addition, a considerable number of research works in this area have devoted their efforts on simple or medium-size networks, though few have applied their method to large-scale network. An improvement on the existing techniques to cater for application on a large scale network is a challenge and an open research area. Demand fluctuation may cause a pressure drop and change of flow direction and magnitude that can lead the polluted water to infiltrate into channels that were not initially supplied. Placement of water quality monitoring stations may reveal the change in magnitude and flow direction in the network, which may be difficult to accurately estimate once a contamination event has occurred. Misinterpretation of magnitude and flow direction will lead to incorrect analysis of propagation of the contamination in the network and result in false information. One of the major consequences of giving false information is the declaration of uncontaminated networks polluted causing more panic to the public. This will also generate unnecessary additional expenses, causing more disruption of services to the community. According to the work by Davidson et al. [49], installation of a few sensors on the network may lead to the incorrect model formulation. However, deployment of more sensors on the network will result in an increase of sensors’ procurement. Hence, a trade-off between sensor procurement and model analysis will be a recommended alternative. Consequently, priority should be given to optimal sensor placement in a water distribution network and is thereby suggested. Additionally, since the hydraulic model exists and has been solved by many researchers [74,76,77], superimposing both hydraulic analysis and contaminant is a task that will improve the existing techniques and therefore proposed.
10. Conclusions
Identification of contamination source in a water distribution network is essential considering the consequences the use of contaminated water on the public. In this study, a comprehensive survey on the existing contamination source identification methods is presented. From this survey, it is evident that the existing approaches were able to identify the contamination source to a reasonable extent. However, each of the methods has certain limitations as reported in the literature. Associated technical challenges include uncertainties of sensors, stochastic water demands, excessive computational time, particularly for a large network among others. Despite a series of investigations on the contamination source identification problem, the research in the field is still at an infancy stage. Hence, further investigation is essential in order to properly address the research gaps. Generally, contamination source identification remains a topical issue in a water distribution network due to the complex nature of the system and its significance in the economy and social instability. More research efforts should be devoted to the applicability of these techniques to ascertain their efficiency in a real-life scenario in order to minimise the economic and public health consequences the use of contaminated water.
Author Contributions
These authors contributed equally to this work.
Acknowledgments
This research work was supported by the French South African Institute of Technology (F’SATI), Tshwane University of Technology, Pretoria, South Africa. This study is part of the Doctoral developmental research project.
Conflicts of Interest
The authors declare no conflict of interest.
References
- Swamee, P.K.; Sharma, A.K. Design of Water Supply Pipe Networks; John Wiley & Sons: Hoboken, NJ, USA, 2008. [Google Scholar]
- Yazdani, A.; Otoo, R.A.; Jeffrey, P. Resilience enhancing expansion strategies for water distribution systems: A network theory approach. Environ. Model. Softw. 2011, 26, 1574–1582. [Google Scholar] [CrossRef]
- Collins, M.; Cooper, L.; Helgason, R.; Kennington, J.; LeBlanc, L. Solving the pipe network analysis problem using optimization techniques. Manag. Sci. 1978, 24, 747–760. [Google Scholar] [CrossRef]
- Clark, R.M.; Grayman, W.M.; Males, R.M.; Hess, A.F. Modeling contaminant propagation in drinking-water distribution systems. J. Environ. Eng. 1993, 119, 349–364. [Google Scholar] [CrossRef]
- Clark, R.M.; Grayman, W.M.; Goodrich, J.A.; Deininger, R.A.; Skov, K. Measuring and modeling chlorine propagation in water distribution systems. J. Water Resour. Plan. Manag. 1994, 120, 871–887. [Google Scholar] [CrossRef]
- Clark, R.M.; Grayman, W.M.; Males, R.M. Contaminant propagation in distribution systems. J. Environ. Eng. 1988, 114, 929–943. [Google Scholar] [CrossRef]
- Clark, R.M.; Deininger, R.A. Protecting the nation’s critical infrastructure: The vulnerability of US water supply systems. J. Conting. Crisis Manag. 2000, 8, 73–80. [Google Scholar] [CrossRef]
- Kirmeyer, G.J.; Martel, K. Pathogen Intrusion into the Distribution System; American Water Works Association: Denver, CO, USA, 2001. [Google Scholar]
- Mac Kenzie, W.R.; Hoxie, N.J.; Proctor, M.E.; Gradus, M.S.; Blair, K.A.; Peterson, D.E.; Kazmierczak, J.J.; Addiss, D.G.; Fox, K.R.; Rose, J.B.; et al. A massive outbreak in Milwaukee of Cryptosporidium infection transmitted through the public water supply. N. Engl. J. Med. 1994, 331, 161–167. [Google Scholar] [CrossRef] [PubMed]
- Corso, P.S.; Kramer, M.H.; Blair, K.A.; Addiss, D.G.; Davis, J.P.; Haddix, A.C. Costs of illness in the 1993 waterborne Cryptosporidium outbreak, Milwaukee, Wisconsin. Emerg. Infect. Dis. 2003, 9, 426. [Google Scholar] [CrossRef] [PubMed]
- Cooper, W.J. Responding to crisis: The West Virginia chemical spill. Environ. Sci. Technol. 2014, 48, 3095. [Google Scholar] [CrossRef] [PubMed]
- Berry, J.W.; Fleischer, L.; Hart, W.E.; Phillips, C.A.; Watson, J.P. Sensor placement in municipal water networks. J. Water Resour. Plan. Manag. 2005, 131, 237–243. [Google Scholar] [CrossRef]
- Berry, J.W.; Hart, W.E.; Phillips, C.A.; Uber, J.G.; Watson, J.P. Validation and assessment of integer programming sensor placement models. In Impacts of Global Climate Change; American Society of Civil Engineers: Reston, VA, USA, 2005; pp. 1–11. [Google Scholar]
- Berry, J.; Hart, W.E.; Phillips, C.A.; Uber, J.G.; Watson, J.P. Sensor placement in municipal water networks with temporal integer programming models. J. Water Resour. Plan. Manag. 2006, 132, 218–224. [Google Scholar] [CrossRef]
- Berry, J.; Carr, R.D.; Hart, W.E.; Leung, V.J.; Phillips, C.A.; Watson, J.P. Designing contamination warning systems for municipal water networks using imperfect sensors. J. Water Resour. Plan. Manag. 2009, 135, 253–263. [Google Scholar] [CrossRef]
- Ostfeld, A.; Salomons, E. Optimal layout of early warning detection stations for water distribution systems security. J. Water Resour. Plan. Manag. 2004, 130, 377–385. [Google Scholar] [CrossRef]
- Ostfeld, A.; Salomons, E. Optimal early warning monitoring system layout for water networks security: Inclusion of sensors sensitivities and response delays. Civ. Eng. Environ. Syst. 2005, 22, 151–169. [Google Scholar] [CrossRef]
- Ostfeld, A.; Salomons, E. Securing water distribution systems using online contamination monitoring. J. Water Resour. Plan. Manag. 2005, 131, 402–405. [Google Scholar] [CrossRef]
- Ostfeld, A.; Uber, J.G.; Salomons, E.; Berry, J.W.; Hart, W.E.; Phillips, C.A.; Watson, J.P.; Dorini, G.; Jonkergouw, P.; Kapelan, Z.; et al. The battle of the water sensor networks (BWSN): A design challenge for engineers and algorithms. J. Water Resour. Plan. Manag. 2008, 134, 556–568. [Google Scholar] [CrossRef]
- Propato, M. Contamination warning in water networks: General mixed-integer linear models for sensor location design. J. Water Resour. Plan. Manag. 2006, 132, 225–233. [Google Scholar] [CrossRef]
- Kansal, M.; Dorji, T.; Chandniha, S.K. Design scheme for water quality monitoring in a distribution network. Int. J. Environ. Dev. 2012, 9, 69–81. [Google Scholar]
- Krause, A.; Leskovec, J.; Guestrin, C.; VanBriesen, J.; Faloutsos, C. Efficient sensor placement optimization for securing large water distribution networks. J. Water Resour. Plan. Manag. 2008, 134, 516–526. [Google Scholar] [CrossRef]
- Afshar, A.; Mariño, M.A. Multi-objective coverage-based ACO model for quality monitoring in large water networks. Water Resour. Manag. 2012, 26, 2159–2176. [Google Scholar] [CrossRef]
- Afshar, A.; Khombi, S.M. Multiobjective Optimization of Sensor Placement in Water Distribution Networks; Dual Use Benefit Approach. Int. J. Optim. Civ. Eng. 2015, 5, 315–331. [Google Scholar]
- Woo, H.M.; Yoon, J.H.; Choi, D.Y. Optimal monitoring sites based on water quality and quantity in water distribution systems. In Bridging the Gap: Meeting the World’s Water and Environmental Resources Challenges; American Society of Civil Engineers: Reston, VA, USA, 2001; pp. 1–9. [Google Scholar]
- Cozzolino, L.; Mucherino, C.; Pianese, D.; Pirozzi, F. Positioning, within water distribution networks, of monitoring stations aiming at an early detection of intentional contamination. Civ. Eng. Environ. Syst. 2006, 23, 161–174. [Google Scholar] [CrossRef]
- Adedeji, K.B.; Hamam, Y.; Abe, B.T.; Abu-Mahfouz, A.M. Leakage Detection and Estimation Algorithm for Loss Reduction in Water Piping Networks. Water 2017, 9, 773. [Google Scholar] [CrossRef]
- Hindi, K.; Hamam, Y. Locating pressure control elements for leakage minimization in water supply networks: An optimization model. Eng. Optim. 1991, 17, 281–291. [Google Scholar] [CrossRef]
- Hindi, K.; Hamam, Y. Pressure control for leakage minimization in water supply networks Part 1: Single period models. Int. J. Syst. Sci. 1991, 22, 1573–1585. [Google Scholar] [CrossRef]
- Hindi, K.; Hamam, Y. Locating pressure control elements for leakage minimisation in water supply networks by genetic algorithms. In Artificial Neural Nets and Genetic Algorithms; Springer: Vienna, Austria, 1993; pp. 583–587. [Google Scholar]
- Sun, N.Z. Inverse Problems in Groundwater Modeling; Springer Science & Business Media: Berlin, Germany, 2013. [Google Scholar]
- Laird, C.D.; Biegler, L.T.; van Bloemen Waanders, B.G.; Bartlett, R.A. Contamination source determination for water networks. J. Water Resour. Plan. Manag. 2005, 131, 125–134. [Google Scholar] [CrossRef]
- De Sanctis, A.E.; Shang, F.; Uber, J.G. Real-time identification of possible contamination sources using network backtracking methods. J. Water Resour. Plan. Manag. 2009, 136, 444–453. [Google Scholar] [CrossRef]
- Wang, H.; Harrison, K.W. Improving efficiency of the Bayesian approach to water distribution contaminant source characterization with support vector regression. J. Water Resour. Plan. Manag. 2012, 140, 3–11. [Google Scholar] [CrossRef]
- Huang, J.J.; McBean, E.A.; James, W. Multi-objective optimization for monitoring sensor placement in water distribution systems. In Water Distribution Systems Analysis Symposium 2006; American Society of Civil Engineers: Reston, VA, USA, 2008; pp. 1–14. [Google Scholar]
- Tsitsifli, S.; Kanakoudis, V. Drinking water quality and safety assessment—A review. In Proceedings of the 6th International Conference on Environmental Management, Planning, Engineering (CEMEPE2017), Thessaloniki, Greece, 25–30 June 2017; pp. 403–416. [Google Scholar]
- Kanakoudis, V.; Tsitsifli, S. Potable water security assessment—A review on monitoring, modelling and optimization techniques, applied to water distribution networks. Desalin. Water Treat. 2017, 99, 18–26. [Google Scholar] [CrossRef]
- Deng, W.; Wang, G. A novel water quality data analysis framework based on time-series data mining. J. Environ. Manag. 2017, 196, 365–375. [Google Scholar] [CrossRef] [PubMed]
- Hu, C.; Zhao, J.; Yan, X.; Zeng, D.; Guo, S. A MapReduce based parallel niche genetic algorithm for contaminant source identification in water distribution network. Ad Hoc Netw. 2015, 35, 116–126. [Google Scholar] [CrossRef]
- Perelman, L.; Ostfeld, A. Bayesian networks for source intrusion detection. J. Water Resour. Plan. Manag. 2012, 139, 426–432. [Google Scholar] [CrossRef]
- Wagner, D.; Neupauer, R. Probabilistic contaminant source identification in water distribution systems with incomplete mixing at pipe junctions. In World Environmental and Water Resources Congress 2013: Showcasing the Future; American Society of Civil Engineers: Reston, VA, USA, 2013; pp. 930–935. [Google Scholar]
- Guan, J.; Aral, M.M.; Maslia, M.L.; Grayman, W.M. Identification of contaminant sources in water distribution systems using simulation-optimization method: Case study. J. Water Resour. Plan. Manag. 2006, 132, 252–262. [Google Scholar] [CrossRef]
- Liu, L.; Ranjithan, S.R.; Mahinthakumar, G. Contamination source identification in water distribution systems using an adaptive dynamic optimization procedure. J. Water Resour. Plan. Manag. 2010, 137, 183–192. [Google Scholar] [CrossRef]
- Liu, L.; Zechman, E.M.; Brill, E.D., Jr.; Mahinthakumar, G.; Ranjithan, S.; Uber, J. Adaptive contamination source identification in water distribution systems using an evolutionary algorithm-based dynamic optimization procedure. In Water Distribution Systems Analysis Symposium 2006; American Society of Civil Engineers: Reston, VA, USA, 2008; pp. 1–9. [Google Scholar]
- Shang, F.; Uber, J.; Murray, R. Uncertainty of contamination source characterization within water distribution systems. In World Environmental and Water Resources Congress 2007: Restoring Our Natural Habitat; American Society of Civil Engineers: Reston, VA, USA, 2007; pp. 1–8. [Google Scholar]
- Murray, R.; Haxton, T.; Janke, R.; Hart, W.E.; Berry, J.; Phillips, C. Sensor Network Design for Drinking Water Contamination Warning Systems: A Compendium of Research Results and Case Studies Using the TEVA-SPOT Software; National Homeland Security Research Center, US Environmental Protection Agency: Cincinnati, OH, USA, 2010.
- Rossman, L.A. EPANET 2: Users Manual; National Risk Management Research Laboratory: Cincinnati, OH, USA, 2000. [Google Scholar]
- Tinelli, S.; Creaco, E.; Ciaponi, C. Sampling significant contamination events for optimal sensor placement in water distribution systems. J. Water Resour. Plan. Manag. 2017, 143, 04017058. [Google Scholar] [CrossRef]
- Davidson, J.; Bouchart, F.; Cavill, S.; Jowitt, P. Real-time connectivity modeling of water distribution networks to predict contamination spread. J. Comput. Civ. Eng. 2005, 19, 377–386. [Google Scholar] [CrossRef]
- Boulus, P.F.; Altman, T.; Sadhal, K.S. Computer modeling of water quality in large multiple-source networks. Appl. Math. Model. 1992, 16, 439–445. [Google Scholar] [CrossRef]
- Males, R.M.; Clark, R.M.; Wehrman, P.J.; Gates, W.E. Algorithm for mixing problems in water systems. J. Hydraul. Eng. 1985, 111, 206–219. [Google Scholar] [CrossRef]
- Wood, D.J.; Ormsbee, L.E. Supply identification for water distribution systems. J. Am. Water Works Assoc. 1989, 81, 74–80. [Google Scholar] [CrossRef]
- Bhave, P.R. Extended period simulation of water systems—Direct solution. J. Environ. Eng. 1988, 114, 1146–1159. [Google Scholar] [CrossRef]
- Creaco, E.; Pezzinga, G. Embedding linear programming in multi objective genetic algorithms for reducing the size of the search space with application to leakage minimization in water distribution networks. Environ. Model. Softw. 2015, 69, 308–318. [Google Scholar] [CrossRef]
- Giustolisi, O.; Kapelan, Z.; Savic, D. Extended period simulation analysis considering valve shutdowns. J. Water Resour. Plan. Manag. 2008, 134, 527–537. [Google Scholar] [CrossRef]
- Giustolisi, O.; Laucelli, D.; Berardi, L.; Savić, D.A. Computationally efficient modeling method for large water network analysis. J. Hydraul. Eng. 2011, 138, 313–326. [Google Scholar] [CrossRef]
- Todini, E. A more realistic approach to the extended period simulation of water distribution networks. Adv. Water Supply Manag. 2003, 173–184. [Google Scholar]
- Rossman, L.A.; Boulos, P.F. Numerical methods for modeling water quality in distribution systems: A comparison. J. Water Resour. Plan. Manag. 1996, 122, 137–146. [Google Scholar] [CrossRef]
- Liou, C.; Kroon, J. Modeling the propagation of waterborne substances in distribution networks. J. Am. Water Works Assoc. 1987, 79, 54–58. [Google Scholar] [CrossRef]
- Boulos, P.F.; Altman, T.; Jarrige, P.A.; Collevati, F. Discrete simulation approach for network-water-quality models. J. Water Resour. Plan. Manag. 1995, 121, 49–60. [Google Scholar] [CrossRef]
- Boulos, P.F.; Altman, T.; Jarrige, P.A.; Collevati, F. An event-driven method for modelling contaminant propagation in water networks. Appl. Math. Model. 1994, 18, 84–92. [Google Scholar] [CrossRef]
- Islam, M.R.; Chaudhry, M.H. Modeling of constituent transport in unsteady flows in pipe networks. J. Hydraul. Eng. 1998, 124, 1115–1124. [Google Scholar] [CrossRef]
- Grayman, W.M.; Clark, R.M.; Males, R.M. Modeling distribution-system water quality; dynamic approach. J. Water Resour. Plan. Manag. 1988, 114, 295–312. [Google Scholar] [CrossRef]
- Rossman, L.A.; Boulos, P.F.; Altman, T. Discrete volume-element method for network water-quality models. J. Water Resour. Plan. Manag. 1993, 119, 505–517. [Google Scholar] [CrossRef]
- Rossman, L.A.; Clark, R.M.; Grayman, W.M. Modeling chlorine residuals in drinking-water distribution systems. J. Environ. Eng. 1994, 120, 803–820. [Google Scholar] [CrossRef]
- Mansour-Rezaei, S.; Naser, G.; Malekpour, A.; Karney, B.W. Contaminant intrusion in water distribution systems. J. Am. Water Works Assoc. 2013, 105, E278–E290. [Google Scholar] [CrossRef]
- Fernandes, C.; Karney, B. Modelling the advection equation under water hammer conditions. Urban Water J. 2004, 1, 97–112. [Google Scholar] [CrossRef]
- Tzatchkov, V.G.; Aldama, A.A.; Arreguin, F.I. Advection-dispersion-reaction modeling in water distribution networks. J. Water Resour. Plan. Manag. 2002, 128, 334–342. [Google Scholar] [CrossRef]
- Basha, H.; Malaeb, L. Eulerian-Lagrangian method for constituent transport in water distribution networks. J. Hydraul. Eng. 2007, 133, 1155–1166. [Google Scholar] [CrossRef]
- Munavalli, G.; Kumar, M.M. Modified Lagrangian method for modeling water quality in distribution systems. Water Res. 2004, 38, 2973–2988. [Google Scholar] [CrossRef] [PubMed]
- Cross, H. Analysis of Flow in Networks of Conduits or Conductors. In Analysis of Flow in Networks of Conduits or Conductors; Technical Report; University of Illinois at Urbana Champaign, College of Engineering, Engineering Experiment Station: Champaign, IL, USA, 1936. [Google Scholar]
- Martin, D.; Peters, G. The application of Newtons method to network analysis by digital computer. J. Inst. Water Eng. 1963, 17, 115–129. [Google Scholar]
- Epp, R.; Fowler, A.G. Efficient code for steady-state flows in networks. J. Hydraul. Div. 1970, 96, 43–56. [Google Scholar]
- Hamam, Y.; Brameller, A. Hybrid method for the solution of piping networks. Proc. Inst. Electr. Eng. 1971, 118, 1607–1612. [Google Scholar] [CrossRef]
- Wood, D.J.; Charles, C.O. Hydraulic network analysis using linear theory. J. Hydraul. Div. 1972, 98, 1157–1170. [Google Scholar]
- Todini, E.; Pilati, S. A gradient method for the analysis of pipe networks. In Proceedings of the International Conference on Computer Applications for Water Supply and Distribution, Leicester Polytechnic, UK, 8–10 September 1987. [Google Scholar]
- Todini, E. A unifying view on the different looped pipe network analysis algorithms. In Computing and Control for the Water Industry; Research Studies Press Ltd.: Baldock, UK, 1999; pp. 63–80. [Google Scholar]
- Todini, E.; Rossman, L.A. Unified framework for deriving simultaneous equation algorithms for water distribution networks. J. Hydraul. Eng. 2012, 139, 511–526. [Google Scholar] [CrossRef]
- Walski, T.M.; Chase, D.V.; Savic, D.A.; Grayman, W.; Beckwith, S.; Koelle, E. Advanced Water Distribution Modeling and Management. Civ. Environ. Eng. Eng. Mech. Fac. Publ. 2003, 18. [Google Scholar]
- Strafaci, A. Advanced Water Distribution Modeling and Management. Ed; Haestad Press: Waterbury, CT, USA, 2003; pp. 577–583. [Google Scholar]
- Clark, R.M.; Rossman, L.A.; Wymer, L.J. Modeling distribution system water quality: Regulatory implications. J. Water Resour. Plan. Manag. 1995, 121, 423–428. [Google Scholar] [CrossRef]
- Ozdemir, O.N.; Ger, A.M. Unsteady 2-D chlorine transport in water supply pipes. Water Res. 1999, 33, 3637–3645. [Google Scholar] [CrossRef]
- Al-Omari, A.S.; Chaudhry, M.H. Unsteady-state inverse chlorine modeling in pipe networks. J. Hydraul. Eng. 2001, 127, 669–677. [Google Scholar] [CrossRef]
- Ozdemir, O.N.; Ucak, A. Simulation of chlorine decay in drinking-water distribution systems. J. Environ. Eng. 2002, 128, 31–39. [Google Scholar] [CrossRef]
- Boulos, P.; Altman, T. Explicit calculation of water quality parameters in pipe distribution systems. Civ. Eng. Syst. 1993, 10, 187–206. [Google Scholar] [CrossRef]
- Mau, R.E.; Boulos, P.F.; Bowcock, R.W. Modelling distribution storage water quality: An analytical approach. Appl. Math. Model. 1996, 20, 329–338. [Google Scholar] [CrossRef]
- Islam, M.R.; Chaudhry, M.H. Numerical solution of transport equation for applications in environmental hydraulics and hydrology. J. Hydrol. 1997, 191, 106–121. [Google Scholar] [CrossRef]
- Islam, M.R.; Chaudhry, M.H.; Clark, R.M. Inverse modeling of chlorine concentration in pipe networks under dynamic condition. J. Environ. Eng. 1997, 123, 1033–1040. [Google Scholar] [CrossRef]
- Zierolf, M.L.; Polycarpou, M.M.; Uber, J.G. Development and autocalibration of an input-output model of chlorine transport in drinking water distribution systems. IEEE Trans. Control Syst. Technol. 1998, 6, 543–553. [Google Scholar] [CrossRef]
- Shang, F.; Uber, J.G.; Polycarpou, M.M. Particle backtracking algorithm for water distribution system analysis. J. Environ. Eng. 2002, 128, 441–450. [Google Scholar] [CrossRef]
- Al-Zahrani, M.A.; Moied, K. Optimizing water quality monitoring stations using genetic algorithms. Arab. J. Sci. Eng. 2003, 28, 57–75. [Google Scholar]
- Ewing, R.E.; Wang, H. A summary of numerical methods for time-dependent advection-dominated partial differential equations. In Partial Differential Equations; Elsevier: New York, NY, USA, 2001; pp. 423–445. [Google Scholar]
- Alhumaizi, K. Comparison of finite difference methods for the numerical simulation of reacting flow. Comput. Chem. Eng. 2004, 28, 1759–1769. [Google Scholar] [CrossRef]
- Alhumaizi, K. Flux-limiting solution techniques for simulation of reaction–diffusion–convection system. Commun. Nonlinear Sci. Numer. Simul. 2007, 12, 953–965. [Google Scholar] [CrossRef]
- Hallam, N.; West, J.; Forster, C.; Powell, J.; Spencer, I. The decay of chlorine associated with the pipe wall in water distribution systems. Water Res. 2002, 36, 3479–3488. [Google Scholar] [CrossRef]
- Munavalli, G.; Kumar, M.M. Water quality parameter estimation in steady-state distribution system. J. Water Resour. Plan. Manag. 2003, 129, 124–134. [Google Scholar] [CrossRef]
- Munavalli, G.; Kumar, M.M. Water quality parameter estimation in a distribution system under dynamic state. Water Res. 2005, 39, 4287–4298. [Google Scholar] [CrossRef] [PubMed]
- Yang, Y.J.; Haught, R.C.; Goodrich, J.A. Real-time contaminant detection and classification in a drinking water pipe using conventional water quality sensors: Techniques and experimental results. J. Environ. Manag. 2009, 90, 2494–2506. [Google Scholar] [CrossRef] [PubMed]
- Gancel, G.; Mortazavi, I.; Piller, O. Coupled numerical simulation and sensitivity assessment for quality modelling for water distribution systems. Appl. Math. Lett. 2006, 19, 1313–1319. [Google Scholar] [CrossRef]
- Siew, C.; Tanyimboh, T.T. Pressure-dependent EPANET extension: Extended period simulation. In Water Distribution Systems Analysis 2010; American Society of Civil Engineers: Reston, VA, USA, 2010; pp. 85–95. [Google Scholar]
- Jun, L.; Guoping, Y. Iterative methodology of pressure-dependent demand based on EPANET for pressure-deficient water distribution analysis. J. Water Resour. Plan. Manag. 2012, 139, 34–44. [Google Scholar] [CrossRef]
- Muranho, J.; Ferreira, A.; Sousa, J.; Gomes, A.; Marques, A.S. Pressure-dependent demand and leakage modelling with an EPANET extension—WaterNetGen. Proc. Eng. 2014, 89, 632–639. [Google Scholar] [CrossRef]
- Conejos, M.P.; Alzamora, F.M.; Alonso, J.C. A water distribution system model to simulate critical scenarios by considering both leakage and pressure dependent demands. Proc. Eng. 2017, 186, 380–387. [Google Scholar] [CrossRef]
- Zhang, G.Y. Real-Time Simulation of Pipe Network Based on EPANET. In Applied Mechanics and Materials; Trans Tech Publications: Zürich, Switzerland, 2014; Volume 548, pp. 1800–1803. [Google Scholar]
- Seyoum, A.G.; Tanyimboh, T.T. Investigation into the pressure-driven extension of the EPANET hydraulic simulation model for water distribution systems. Water Resour. Manag. 2016, 30, 5351–5367. [Google Scholar] [CrossRef]
- Puri, D.; Borel, K.; Vance, C.; Karthikeyan, R. Optimization of a Water Quality Monitoring Network Using a Spatially Referenced Water Quality Model and a Genetic Algorithm. Water 2017, 9, 704. [Google Scholar] [CrossRef]
- Huang, L.; Wang, L.; Zhang, Y.; Xing, L.; Hao, Q.; Xiao, Y.; Yang, L.; Zhu, H. Identification of Groundwater Pollution Sources by a SCE-UA Algorithm-Based Simulation/Optimization Model. Water 2018, 10, 193. [Google Scholar] [CrossRef]
- Huang, P.S.; Chiu, Y.C. A Simulation-Optimization Model for Seawater Intrusion Management at Pingtung Coastal Area, Taiwan. Water 2018, 10, 251. [Google Scholar] [CrossRef]
- Anele, A.O.; Hamam, Y.; Abu-Mahfouz, A.M.; Todini, E. Overview, Comparative Assessment and Recommendations of Forecasting Models for Short-Term Water Demand Prediction. Water 2017, 9, 887. [Google Scholar] [CrossRef]
- Letting, L.K.; Hamam, Y.; Abu-Mahfouz, A.M. Estimation of Water Demand in Water Distribution Systems Using Particle Swarm Optimization. Water 2017, 9, 593. [Google Scholar] [CrossRef]
- Lee, Y.J.; Park, C.; Lee, M.L. Identification of a Contaminant Source Location in a River System Using Random Forest Models. Water 2018, 10, 391. [Google Scholar] [CrossRef]
- van Bloemen Waanders, B.G.; Bartlett, R.A.; Biegler, L.T.; Laird, C.D. Nonlinear programming strategies for source detection of municipal water networks. In World Water & Environmental Resources Congress 2003; American Society of Civil Engineers: Reston, VA, USA, 2003; pp. 1–10. [Google Scholar]
- Laird, C.D.; Biegler, L.T.; van Bloemen Waanders, B.G. Real-time, large-scale optimization of water network systems using a subdomain approach. In Real-Time PDE-Constrained Optimization; Society for Industrial and Applied Mathematics: Philadelphia, PA, USA, 2007; pp. 289–306. [Google Scholar]
- Preis, A.; Ostfeld, A. A contamination source identification model for water distribution system security. Eng. Optim. 2007, 39, 941–947. [Google Scholar] [CrossRef]
- Preis, A.; Ostfeld, A. Multiobjective sensor design for water distribution systems security. In Water Distribution Systems Analysis Symposium 2006; American Society of Civil Engineers: Reston, VA, USA, 2008; pp. 1–17. [Google Scholar]
- Preis, A.; Ostfeld, A. Genetic algorithm for contaminant source characterization using imperfect sensors. Civ. Eng. Environ. Syst. 2008, 25, 29–39. [Google Scholar] [CrossRef]
- Prasad, T.D.; Park, N.S. Multiobjective genetic algorithms for design of water distribution networks. J. Water Resour. Plan. Manag. 2004, 130, 73–82. [Google Scholar] [CrossRef]
- Van Thienen, P. Alternative strategies for optimal water quality sensor placement in drinking water distribution networks. In Proceedings of the 11th International Conference on Hydroinformatics, New York, NY, USA, 16–21 August 2014. [Google Scholar]
- Chung, G.; Lansey, K.; Bayraksan, G. Reliable water supply system design under uncertainty. Environ. Model. Softw. 2009, 24, 449–462. [Google Scholar] [CrossRef]
- Li, Y.; Huang, G.; Nie, S. Planning water resources management systems using a fuzzy-boundary interval-stochastic programming method. Adv. Water Resour. 2010, 33, 1105–1117. [Google Scholar] [CrossRef]
- Li, Y.; Huang, G.; Nie, S.; Chen, X. A robust modeling approach for regional water management under multiple uncertainties. Agric. Water Manag. 2011, 98, 1577–1588. [Google Scholar] [CrossRef]
- Torres, J.M.; Brumbelow, K.; Guikema, S.D. Risk classification and uncertainty propagation for virtual water distribution systems. Reliab. Eng. Syst. Saf. 2009, 94, 1259–1273. [Google Scholar] [CrossRef]
- Preis, A.; Ostfeld, A. Hydraulic uncertainty inclusion in water distribution systems contamination source identification. Urban Water J. 2011, 8, 267–277. [Google Scholar] [CrossRef]
- Vankayala, P.; Sankarasubramanian, A.; Ranjithan, S.R.; Mahinthakumar, G. Contaminant source identification in water distribution networks under conditions of demand uncertainty. Environ. Forensics 2009, 10, 253–263. [Google Scholar] [CrossRef]
- Yan, X.; Zhao, J.; Hu, C. Research on Multimodal Optimization Algorithm for the Contamination Source Identification of City Water Distribution Networks. In Bio-Inspired Computing-Theories and Applications; Springer: Singapore, 2016; pp. 80–85. [Google Scholar]
- Hill, J.; van Bloemen Waanders, B.; Laird, C. Source inversion with uncertain sensor measurements. In Proceedings of the Water Distribution System Analysis Symposium 2006, Cincinnati, OH, USA, 27–30 August 2006. [Google Scholar]
- Cristo, C.D.; Leopardi, A. Pollution source identification of accidental contamination in water distribution networks. J. Water Resour. Plan. Manag. 2008, 134, 197–202. [Google Scholar] [CrossRef]
- Mou, L.; Menglin, W.; Jie, L.; Shen, D. Notice of Retraction Investigation on backward tracking of contamination sources in water supply systems—Case study. In Proceedings of the 2010 The 2nd Conference on Environmental Science and Information Application Technology, Wuhan, China, 17–18 July 2010; Volume 3, pp. 484–487. [Google Scholar]
- Tryby, M.E.; Propato, M.; Ranjithan, S.R. Monitoring design for source identification in water distribution systems. J. Water Resour. Plan. Manag. 2010, 136, 637–646. [Google Scholar] [CrossRef]
- Gugat, M. Contamination source determination in water distribution networks. SIAM J. Appl. Math. 2012, 72, 1772–1791. [Google Scholar] [CrossRef]
- Yan, X.; Gong, W.; Wu, Q. Contaminant source identification of water distribution networks using cultural algorithm. Concurr. Comput. Pract. Exp. 2017, 29. [Google Scholar] [CrossRef]
- Yan, X.; Zhao, J.; Hu, C.; Wu, Q. Contaminant source identification in water distribution network based on hybrid encoding. J. Comput. Methods Sci. Eng. 2016, 16, 379–390. [Google Scholar] [CrossRef]
- Xuesong, Y.; Jie, S.; Chengyu, H. Research on contaminant sources identification of uncertainty water demand using genetic algorithm. Cluster Comput. 2017, 20, 1007–1016. [Google Scholar] [CrossRef]
- Neupauer, R.M.; Wilson, J.L. Adjoint method for obtaining backward-in-time location and travel time probabilities of a conservative groundwater contaminant. Water Resour. Res. 1999, 35, 3389–3398. [Google Scholar] [CrossRef]
- Neupauer, R.M. Adjoint sensitivity analysis of contaminant concentrations in water distribution systems. J. Eng. Mech. 2010, 137, 31–39. [Google Scholar] [CrossRef]
- Austin, R.; Waanders, B.v.B.; McKenna, S.; Choi, C. Mixing at cross junctions in water distribution systems. II: Experimental study. J. Water Resour. Plan. Manag. 2008, 134, 295–302. [Google Scholar] [CrossRef]
- Wang, H.; Jin, X. Characterization of groundwater contaminant source using Bayesian method. Stoch. Environ. Res. Risk Assess. 2013, 27, 867–876. [Google Scholar] [CrossRef]
- Ung, H.; Piller, O.; Gilbert, D.; Mortazavi, I. Accurate and Optimal Sensor Placement for Source Identification of Water Distribution Networks. J. Water Resour. Plan. Manag. 2017, 143, 04017032. [Google Scholar] [CrossRef]
- Hobbs, B.F. Bayesian methods for analysing climate change and water resource uncertainties. J. Environ. Manag. 1997, 49, 53–72. [Google Scholar] [CrossRef]
- Bates, B.C.; Campbell, E.P. A Markov chain Monte Carlo scheme for parameter estimation and inference in conceptual rainfall-runoff modeling. Water Resour. Res. 2001, 37, 937–947. [Google Scholar] [CrossRef]
- Marshall, L.; Nott, D.; Sharma, A. A comparative study of Markov chain Monte Carlo methods for conceptual rainfall-runoff modeling. Water Resour. Res. 2004, 40. [Google Scholar] [CrossRef]
- Boccelli, D.; Uber, J. Incorporating spatial correlation in a Markov chain Monte Carlo approach for network model calibration. Impacts Glob. Clim. Chang. 2005, 1–8. [Google Scholar] [CrossRef]
- Soldevila, A.; Fernandez-Canti, R.M.; Blesa, J.; Tornil-Sin, S.; Puig, V. Leak localization in water distribution networks using Bayesian classifiers. J. Process Control 2017, 55, 1–9. [Google Scholar] [CrossRef]
- Gargano, R.; Tricarico, C.; Granata, F.; Santopietro, S.; de Marinis, G. Probabilistic models for the peak residential water demand. Water 2017, 9, 417. [Google Scholar] [CrossRef]
- Candelieri, A. Clustering and Support Vector Regression for Water Demand Forecasting and Anomaly Detection. Water 2017, 9, 224. [Google Scholar] [CrossRef]
- Shabani, S.; Candelieri, A.; Archetti, F.; Naser, G. Gene Expression Programming Coupled with Unsupervised Learning: A Two-Stage Learning Process in Multi-Scale, Short-Term Water Demand Forecasts. Water 2018, 10, 142. [Google Scholar] [CrossRef]
- Candelieri, A.; Perego, R.; Archetti, F. Bayesian optimization of pump operations in water distribution systems. J. Glob. Optim. 2018, 1–23. [Google Scholar] [CrossRef]
- Zhang, J.; Zeng, L.; Chen, C.; Chen, D.; Wu, L. Efficient Bayesian experimental design for contaminant source identification. Water Resour. Res. 2015, 51, 576–598. [Google Scholar] [CrossRef]
- Dawsey, W.J.; Minsker, B.S.; VanBlaricum, V.L. Bayesian belief networks to integrate monitoring evidence of water distribution system contamination. J. Water Resour. Plan. Manag. 2006, 132, 234–241. [Google Scholar] [CrossRef]
- Dawsey, W.J. Bayesian Belief Networks to Integrate Monitoring Evidence of Water Distribution System Contamination. Ph.D. Thesis, University of Illinois at Urbana-Champaign, Champaign, IL, USA, 2012. [Google Scholar]
- Tao, T.; Huang, H.D.; Xin, K.L.; Liu, S.M. Identification of contamination source in water distribution network based on consumer complaints. J. Central South Univ. Technol. 2012, 19, 1600–1609. [Google Scholar] [CrossRef]
- De Sanctis, A.; Boccelli, D.; Shang, F.; Uber, J. Probabilistic approach to characterize contamination sources with imperfect sensors. In Proceedings of the World Environmental and Water Resources Congress 2008: Ahupua’A, Honolulu, HI, USA, 12–13 May 2008; pp. 1–10. [Google Scholar]
- Yang, X.; Boccelli, D.L. Bayesian approach for real-time probabilistic contamination source identification. J. Water Resour. Plan. Manag. 2013, 140, 04014019. [Google Scholar] [CrossRef]
- Perelman, L.; Ostfeld, A. Bayesian networks for estimating contaminant source and propagation in a water distribution system using cluster structure. In Water Distribution Systems Analysis 2010; American Society of Civil Engineers: Reston, VA, USA, 2010; pp. 426–435. [Google Scholar]
- Neupauer, R.M.; Records, M.K.; Ashwood, W.H. Backward probabilistic modeling to identify contaminant sources in water distribution systems. J. Water Resour. Plan. Manag. 2009, 136, 587–591. [Google Scholar] [CrossRef]
- Wang, C.; Zhou, S. Contamination source identification based on sequential Bayesian approach for water distribution network with stochastic demands. IISE Trans. 2017, 49, 899–910. [Google Scholar] [CrossRef]
- Barandouzi, M.; Kerachian, R. Probabilistic Contaminant Source Identification in Water Distribution Infrastructure Systems. Civ. Eng. Infrastruct. J. 2016, 49, 311–326. [Google Scholar]
- Di Nardo, A.; Di Natale, M.; Guida, M.; Musmarra, D. Water network protection from intentional contamination by sectorization. Water Resour. Manag. 2013, 27, 1837–1850. [Google Scholar] [CrossRef]
- Zechman, E.M.; Ranjithan, S.R. Evolutionary computation-based methods for characterizing contaminant sources in a water distribution system. J. Water Resour. Plan. Manag. 2009, 135, 334–343. [Google Scholar] [CrossRef]
- Kim, M.; Choi, C.Y.; Gerba, C.P. Source tracking of microbial intrusion in water systems using artificial neural networks. Water Res. 2008, 42, 1308–1314. [Google Scholar] [CrossRef] [PubMed]
- Liu, L.; Zechman, E.M.; Mahinthakumar, G.; Ranji Ranjithan, S. Identifying contaminant sources for water distribution systems using a hybrid method. Civ. Eng. Environ. Syst. 2012, 29, 123–136. [Google Scholar] [CrossRef]
- Liu, L.; Zechman, E.M.; Mahinthakumar, G.; Ranjithan, S.R. Coupling of logistic regression analysis and local search methods for characterization of water distribution system contaminant source. Eng. Appl. Artif. Intell. 2012, 25, 309–316. [Google Scholar] [CrossRef]
- Shen, H.; McBean, E. False negative/positive issues in contaminant source identification for water-distribution systems. J. Water Resour. Plan. Manag. 2011, 138, 230–236. [Google Scholar] [CrossRef]
- Eliades, D.; Lambrou, T.; Panayiotou, C.; Polycarpou, M. Contamination event detection in water distribution systems using a model-based approach. Proc. Eng. 2014, 89, 1089–1096. [Google Scholar] [CrossRef]
- Hamam, Y.; Hindi, K. Optimised on-line leakage minimisation in water piping networks using neural nets. Proc. IFIP Work. Conf. 1992, 28, 57–64. [Google Scholar]
- Koch, M.W.; McKenna, S.A. Distributed sensor fusion in water quality event detection. J. Water Resour. Plan. Manag. 2010, 137, 10–19. [Google Scholar] [CrossRef]
- Eliades, D.G.; Polycarpou, M.M. Water contamination impact evaluation and source-area isolation using decision trees. J. Water Resour. Plan. Manag. 2011, 138, 562–570. [Google Scholar] [CrossRef]
- Brumbelow, K.; Torres, J.; Guikema, S.; Bristow, E.; Kanta, L. Virtual cities for water distribution and infrastructure system research. In Proceedings of the World Environmental and Water Resources Congress 2007: Restoring Our Natural Habitat, Tampa, FL, USA, 15–19 May 2007; pp. 1–7. [Google Scholar]
- Costa, D.; Melo, L.; Martins, F. Localization of contamination sources in drinking water distribution Systems: A method based on successive positive readings of sensors. Water Resour. Manag. 2013, 27, 4623–4635. [Google Scholar] [CrossRef]
- Laird, C.; Biegler, L.; van Bloemen Waanders, B.; Bartlett, R. Time dependent contamination source determination for municipal water networks using large scale optimization. J. Water Resour. Plan. Manag. 2003. Available online: https://www.researchgate.net/publication/266407494_T (accessed on 23 November 2017).
- Laird, C.D.; Biegler, L.T.; van Bloemen Waanders, B.G. Mixed-integer approach for obtaining unique solutions in source inversion of water networks. J. Water Resour. Plan. Manag. 2006, 132, 242–251. [Google Scholar] [CrossRef]
- Laird, C.D.; Biegler, L.T.; van Bloemen Waanders, B.G.; Bartlett, R.A. Time dependent contamination source determination: A network subdomain approach for very large water networks. In Critical Transitions in Water and Environmental Resources Management; American Society of Civil Engineers: Reston, VA, USA, 2004; pp. 1–10. [Google Scholar]
- Preis, A.; Ostfeld, A. Contamination source identification in water systems: A hybrid model trees-linear programming scheme. J. Water Resour. Plan. Manag. 2006, 132, 263–273. [Google Scholar] [CrossRef]
- Nazarovs, S.; Dejus, S.; Juhna, T. Modelling water quality in drinking water distribution networks from real-time direction data. Drink. Water Eng. Sci. 2012, 5, 39–45. [Google Scholar] [CrossRef]
- Quesson, B.; Sheldon-Robert, M.; Vloerbergh, I.; Vreeburg, J.G. Acoustic monitoring of terrorist intrusion in a drinking water network. In Water Distribution Systems Analysis 2008; American Society of Civil Engineers: Reston, VA, USA, 2008; pp. 1–12. [Google Scholar]
- Tabaa, Y.; Medouri, A.; Tetouan, M. Towards a next generation of scientific computing in the cloud. Int. J. Comput. Sci. 2012, 9, 177–183. [Google Scholar]
- Creaco, E.; Pezzinga, G.; Savic, D. On the choice of the demand and hydraulic modeling approach to WDN real-time simulation. Water Resour. Res. 2017, 53, 6159–6177. [Google Scholar] [CrossRef]
- Creaco, E.; Blokker, M.; Buchberger, S. Models for generating household water demand pulses: Literature review and comparison. J. Water Resour. Plan. Manag. 2017, 143, 04017013. [Google Scholar] [CrossRef]
Figure 1.
Sample of water distribution network with contaminant injection adapted from [48].
Figure 1.
Sample of water distribution network with contaminant injection adapted from [48].
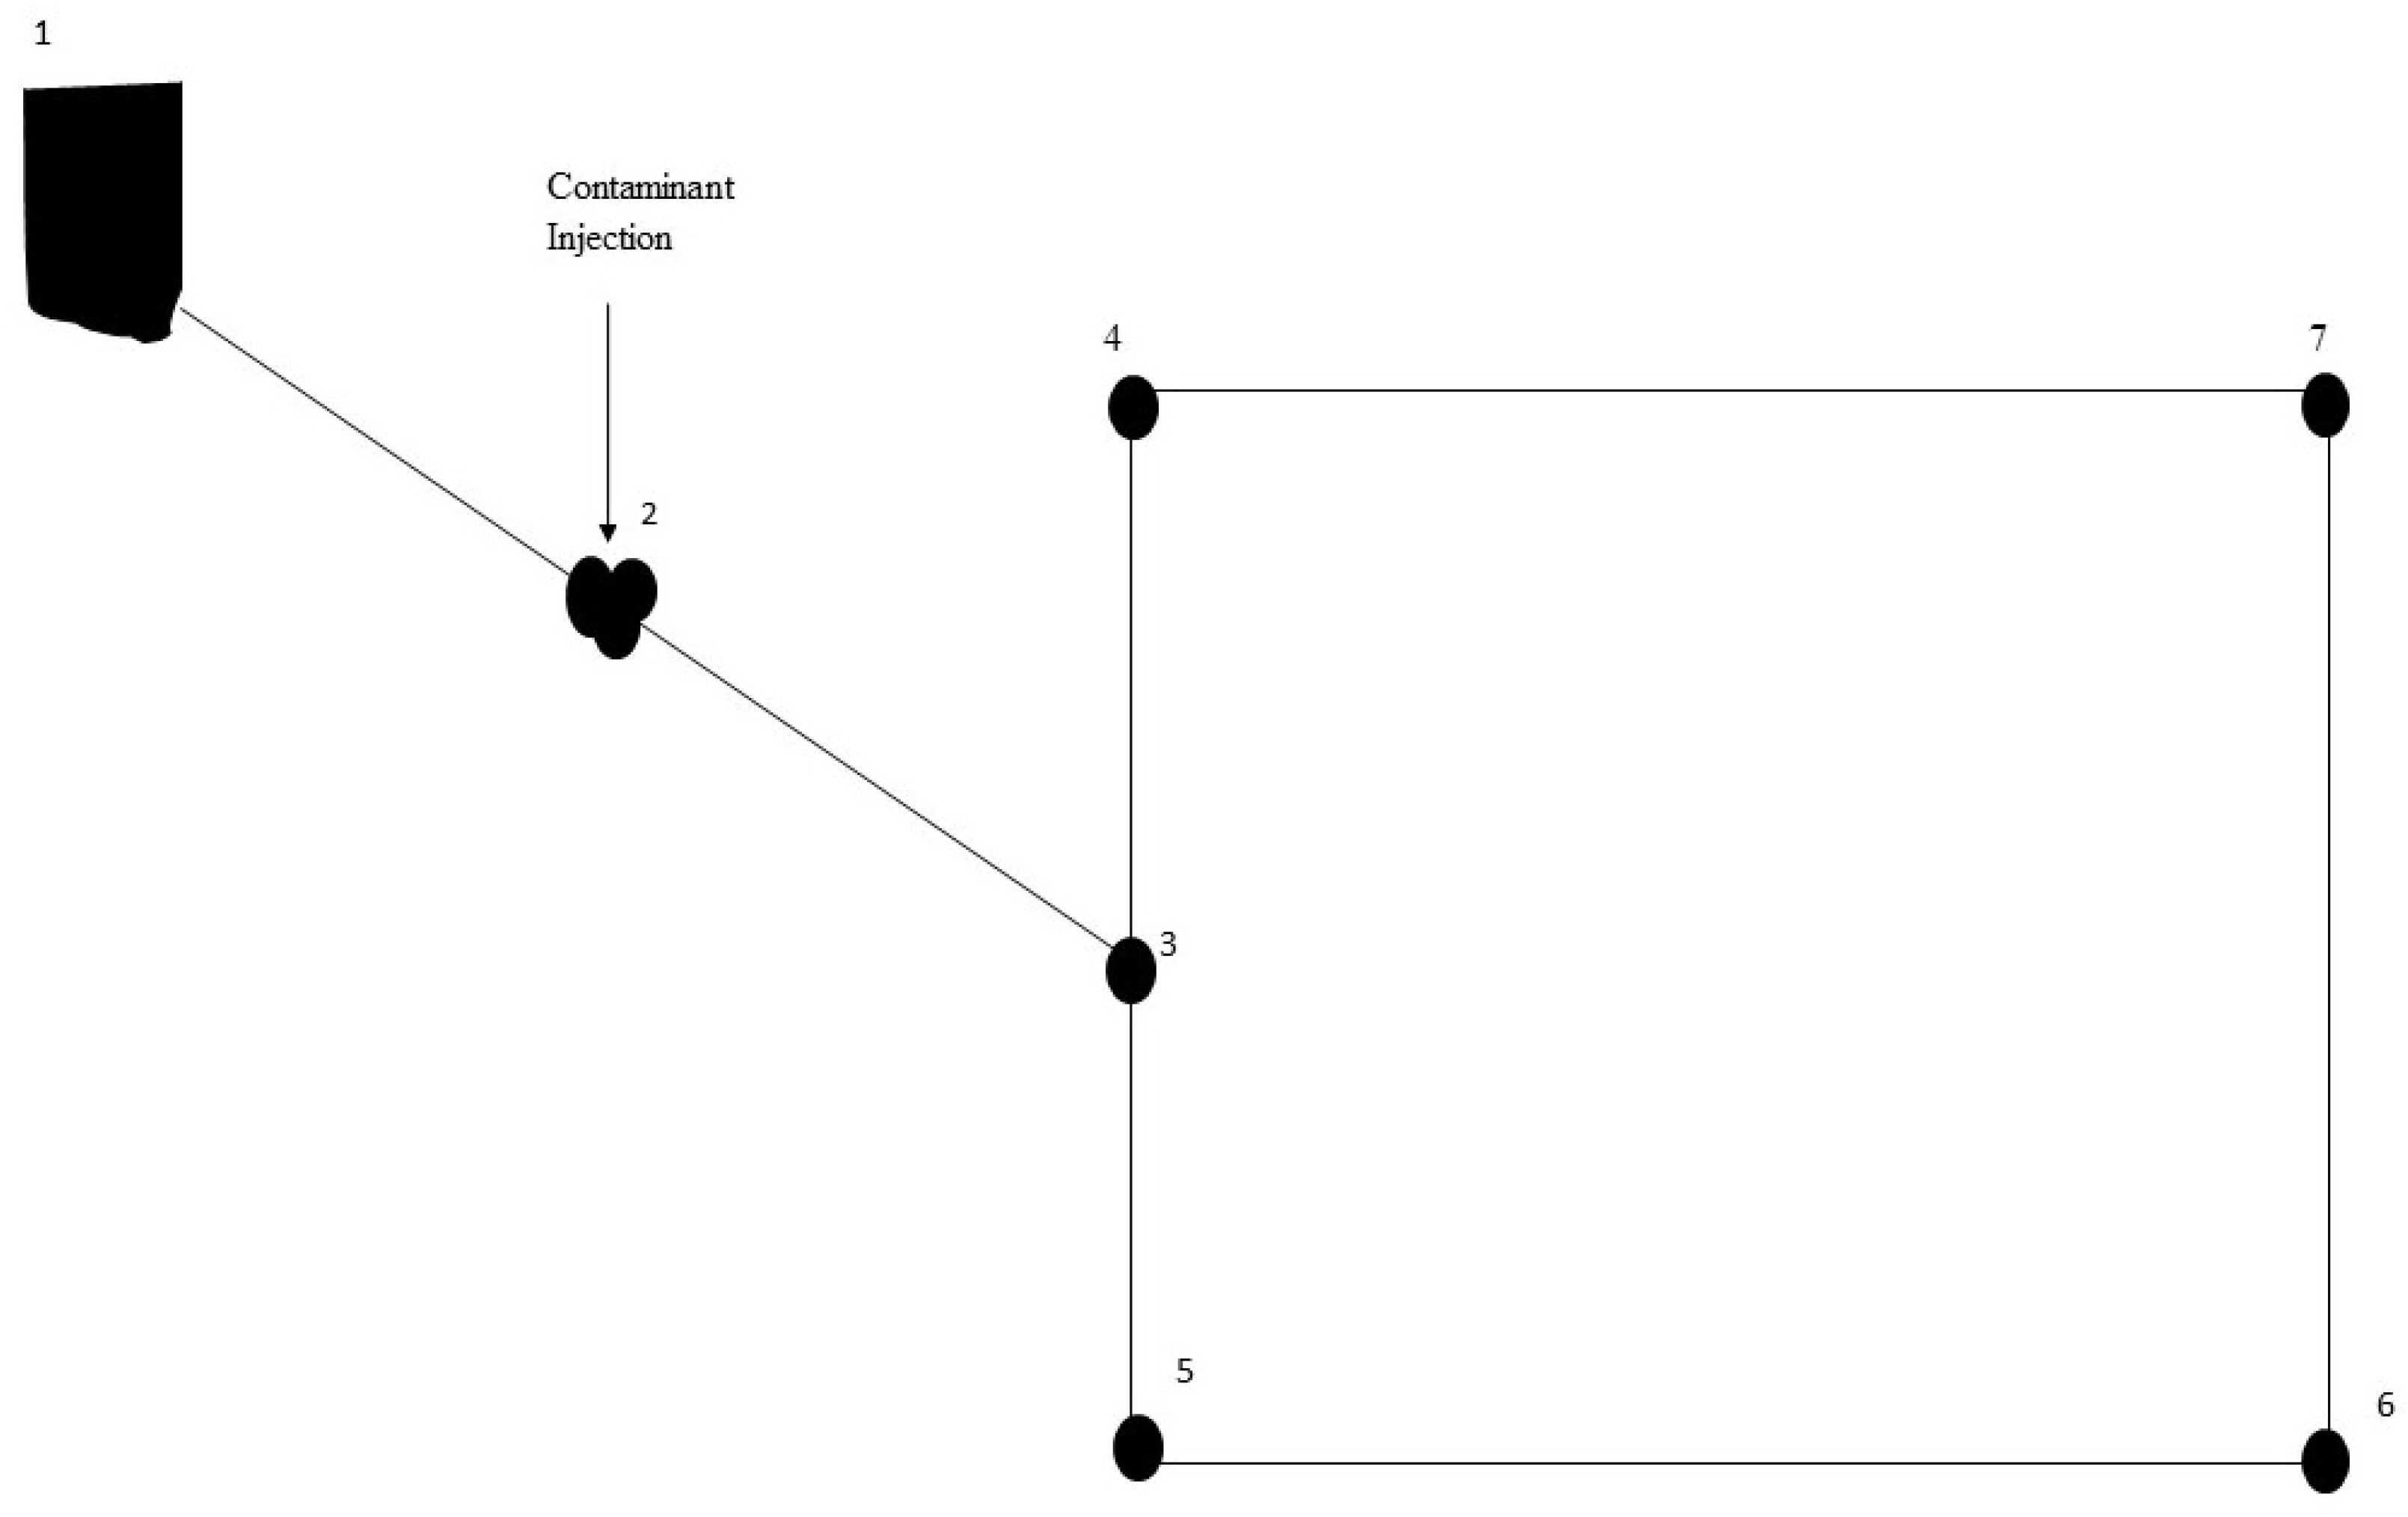
Figure 2.
Various approaches to the solution of pipe network analysis adapted from [78].
Figure 2.
Various approaches to the solution of pipe network analysis adapted from [78].
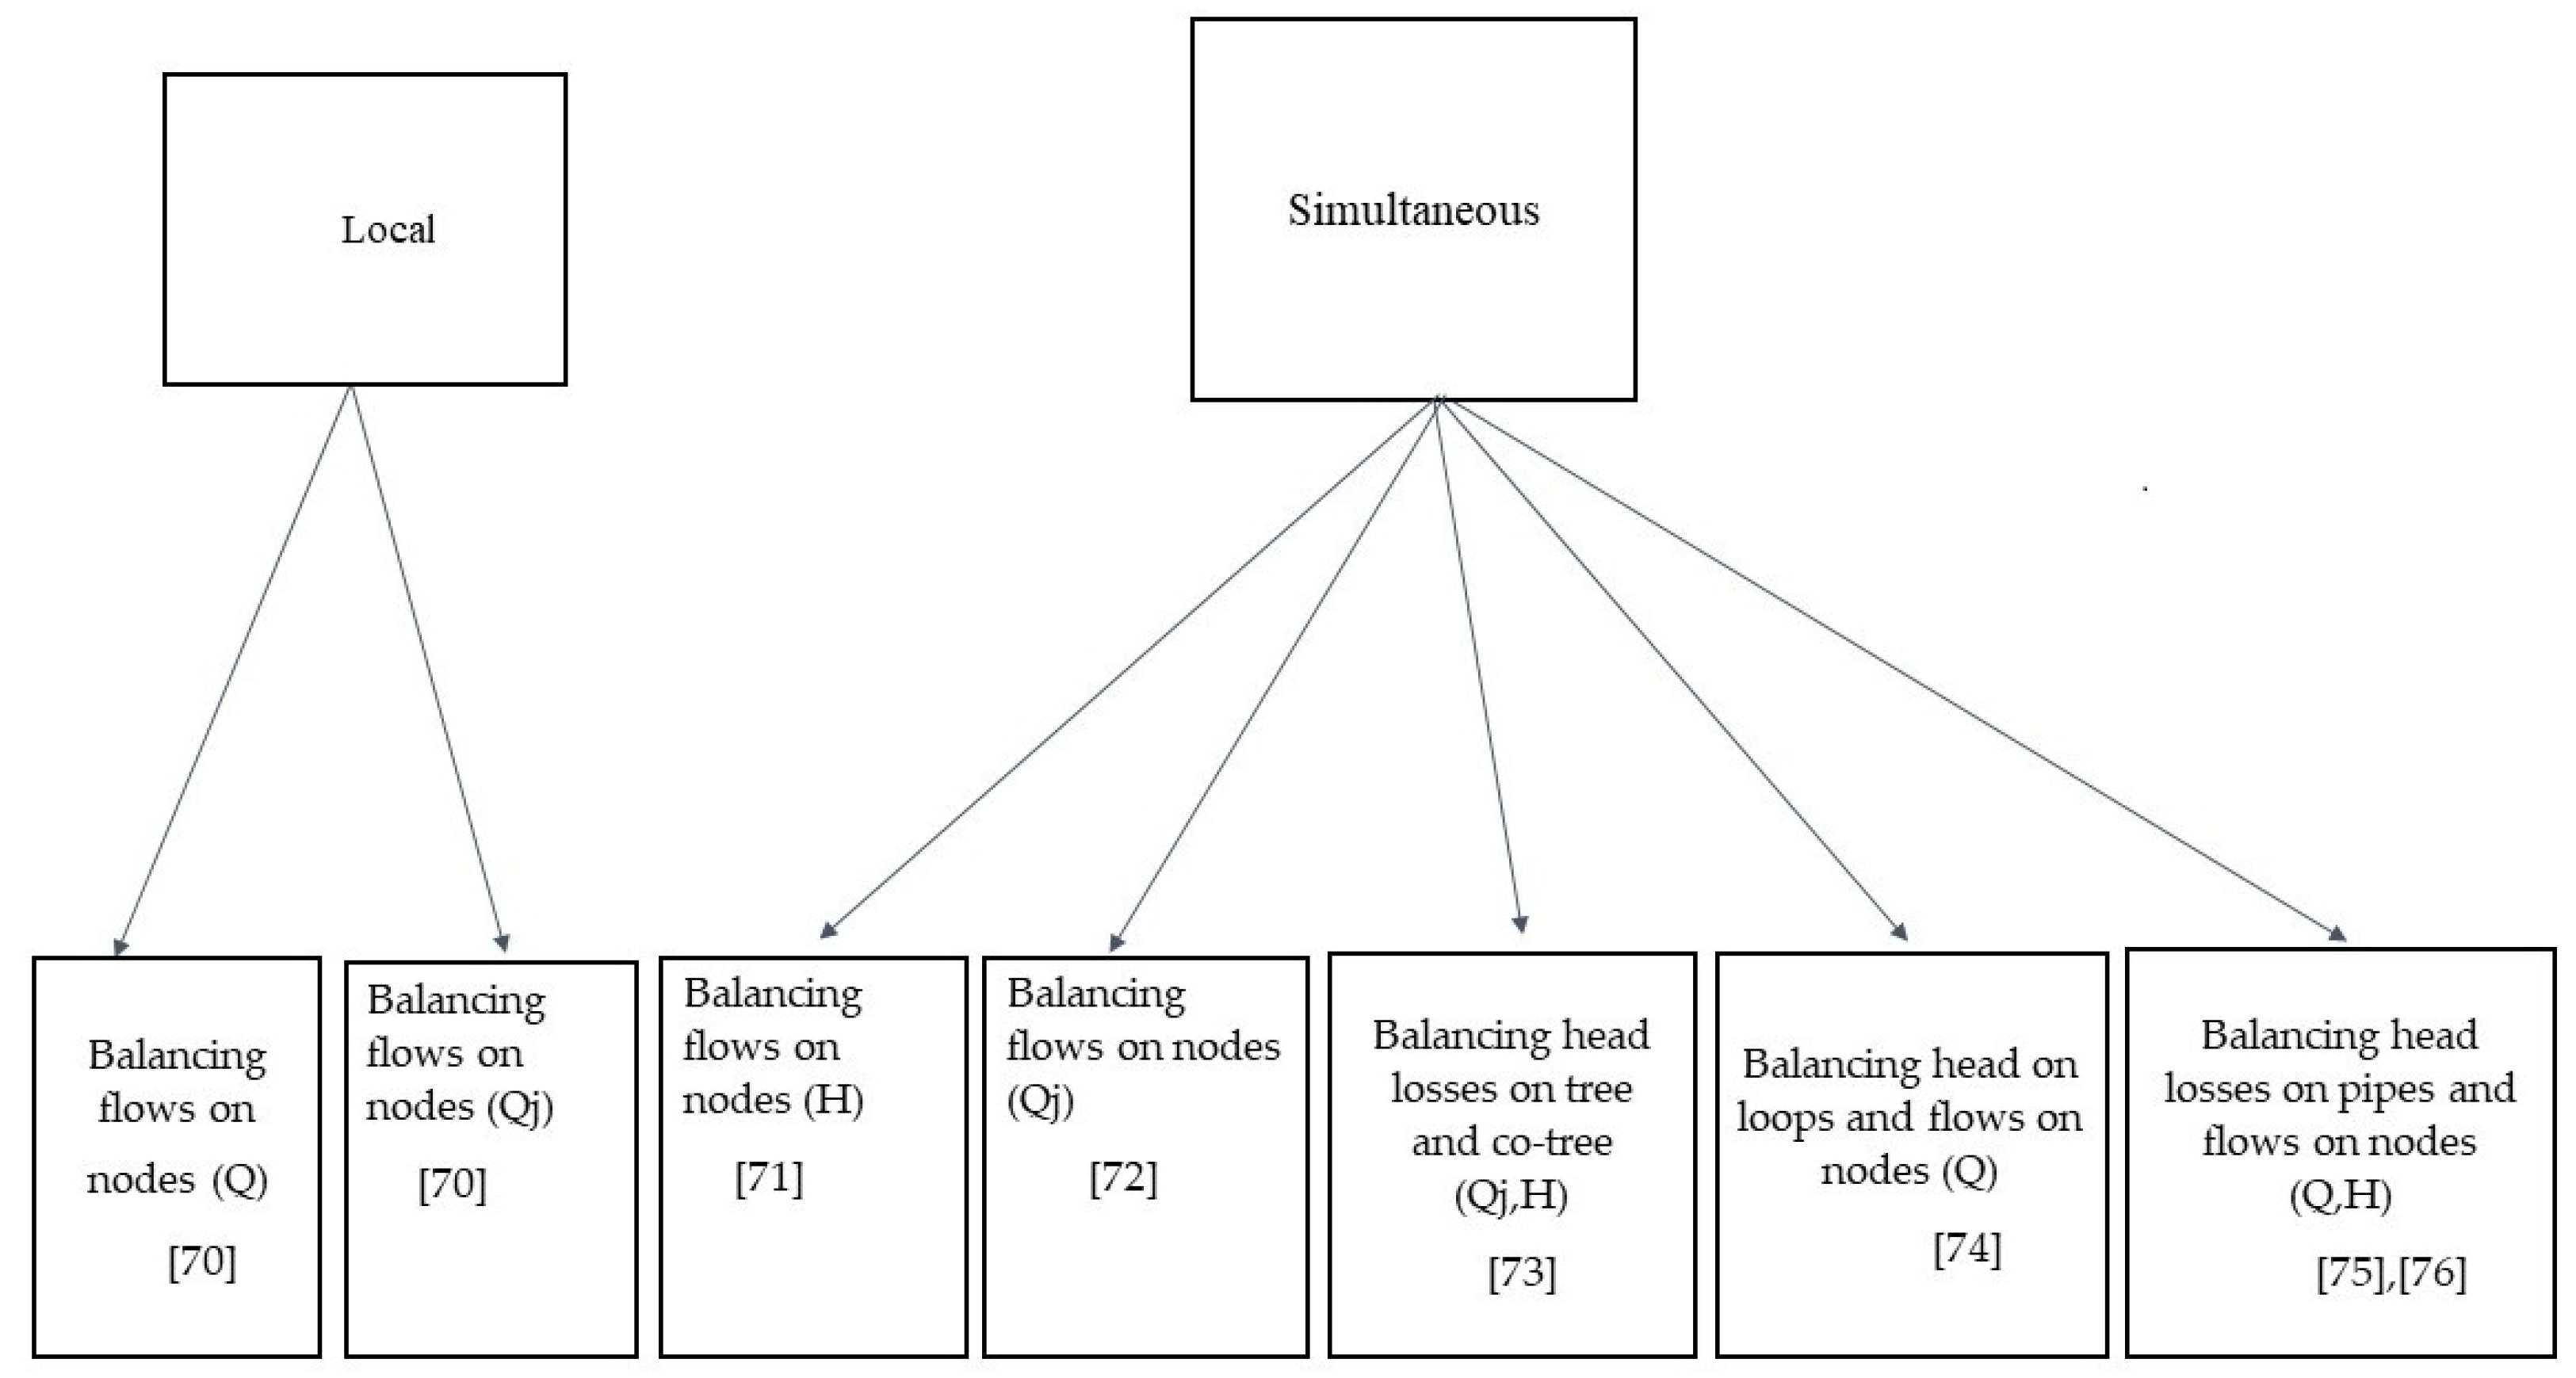
Figure 3.
Source identification as an inverse problem.


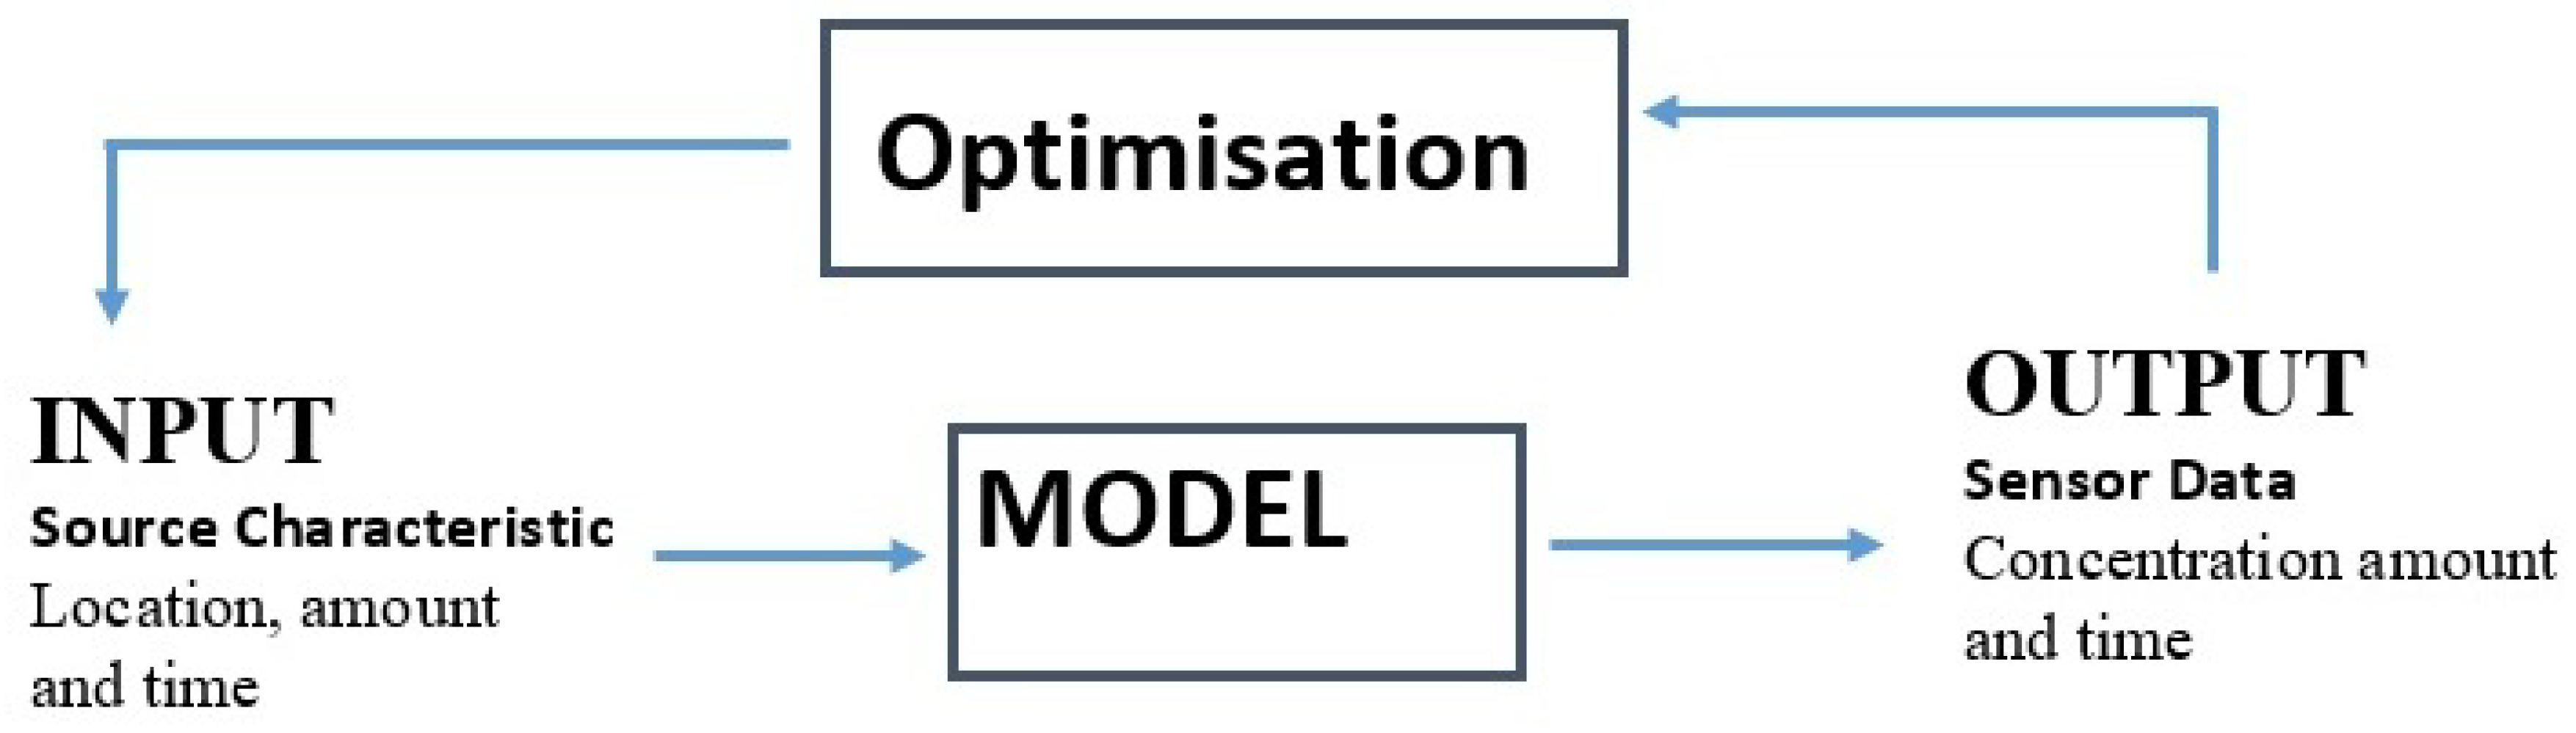
Table 1.
Overview of water quality models: Adapted from [66].
Table 1.
Overview of water quality models: Adapted from [66].
| Numerical Model | Governing Equation | Hydraulic Model | Citations |
|---|---|---|---|
| E-FDM | Advection-reaction equation | SSM | [58] |
| E-DVM | Advection-reaction equation | DA | [64] |
| E-FDM | Advection-reaction equation | TA | [67] |
| Eulerian-Langragian method | Advection-diffusion-reaction equation | SSM | [68,69] |
| L-MEDM | Advection-reaction equation | SSM | [70] |
| L-EDM | Advection-reaction equation | SSM | [61] |
E-FDM: Eulerian finite difference method; E-DVM: Eulerian discrete volume method; L-MEDM: Lagrangian modified event driven method; L-EDM: Lagrangian-event driven method; SSM: Steady state modeling; DA: Dynamic Analysis; TA: Transient analysis.
Table 2.
Summary of some of the existing methodologies.
| Specific Method | Classification | Remarks | Citations |
|---|---|---|---|
| NLP | Optimisation | Performance affected by source location and not up to large network | [32,112,170] |
| PB | Optimisation | Explicit mathematical computation | [89,90] |
| MIQP | Optimisation | Show positive result | [171] |
| SO | Optimisation | Show robustness | [42,124,128,170,172] |
| LSF | Optimisation | Show potential to reveal location | [126] |
| MTLPA | Optimisation | Show efficiency | [173] |
| GA | Optimisation | Revealed approximation time of injection | [114,116] |
| FMC | Optimisation | Show applicability | [127] |
| ADOPT | Optimisation | Converges to best solution | [43,44] |
| QRLS | Optimisation | Show potential usage of the procedure | [130] |
| RTM | Others | Fundamentals path was more efficient computationally | [49,174] |
| BBN | Probability | Effective for steady flow condition for single instantaneous source | [40,149,150,151,153,154] |
| ASA | Others | Show promising result | [175] |
| ANN | Others | Positive correlation | [160] |
| DMA | Others | [98] | |
| ESHA | Others | Algorithm had good performance | [159] |
| KST | Others | Indicates potential to detect source location | [166] |
| DT | Others | Required further investigations | [158] |
| MBA | Others | Show capability | [167] |
| CSMHSM | Others | Demonstrated to identify location and evaluating degree of non-uniqueness | [162] |
| HM | Others | Show robustness | [161] |
| RP | Others | Show robustness | [151] |
NLP: Non-linear programming method; PB: Particle backtracking; MIQP: Mixed-integer quadratic programming; SO: Simulation-Optimisation; LSF: Least square formulation; MTLPA: Model tree and linear programming algorithm; GA: Generic Algorithm; FMC- Fraction matrix concept; ADOPT: Adaptive dynamic optimisation technique; QRLS: Quadric regularisation least square; RTM: Real Time Method; BBN: Bayesian Belief Network; ASA: Acoustic sensor applications; ANN: Artificial neutral network; DMA: Data mining approach; ESHA: Evolutionary strategies and heuristic global algorithm; KST: Kulldoff scan test; DT: Decision tree; MBA: Model based approach; CSHSM: Coupled statistical method and heuristic search method; HM: Hybrid method; RP: Recognition pattern.
© 2018 by the authors. Licensee MDPI, Basel, Switzerland. This article is an open access article distributed under the terms and conditions of the Creative Commons Attribution (CC BY) license (http://creativecommons.org/licenses/by/4.0/).
Share and Cite
MDPI and ACS Style
Adedoja, O.S.; Hamam, Y.; Khalaf, B.; Sadiku, R. Towards Development of an Optimization Model to Identify Contamination Source in a Water Distribution Network. Water 2018, 10, 579. https://doi.org/10.3390/w10050579
AMA Style
Adedoja OS, Hamam Y, Khalaf B, Sadiku R. Towards Development of an Optimization Model to Identify Contamination Source in a Water Distribution Network. Water. 2018; 10(5):579. https://doi.org/10.3390/w10050579
Chicago/Turabian StyleAdedoja, Oluwaseye Samson, Yskandar Hamam, Baset Khalaf, and Rotimi Sadiku. 2018. "Towards Development of an Optimization Model to Identify Contamination Source in a Water Distribution Network" Water 10, no. 5: 579. https://doi.org/10.3390/w10050579
Note that from the first issue of 2016, this journal uses article numbers instead of page numbers. See further details here.