Article

Energetic, Exergetic, and Economic Analysis of MED-TVC Water Desalination Plant with and without Preheating

1
The Higher Institute of Industrial Technology, Engila, Tripoli, P.O. Box 89025, Libya
2
College of Technological Studies, Mechanical Power and Refrigeration Engineering Technology, Al-Asamah, Shuwaikh Educational, P.O. Box 23167, Safat 13092, Kuwait
3
Sir Joseph Swan Centre for Energy Research, School of Engineering, Newcastle University, Newcastle upon Tyne NE1 7RU, UK
*
Author to whom correspondence should be addressed.
Water 2018, 10(3), 305; https://doi.org/10.3390/w10030305
Submission received: 3 February 2018 / Revised: 25 February 2018 / Accepted: 4 March 2018 / Published: 12 March 2018
(This article belongs to the Special Issue Desalination and Water Treatment)

Abstract

:
Desalination is the sole proven technique that can provide the necessary fresh water in arid and semi-arid countries in sufficient quantities and meet the modern needs of a growing world population. Multi effect desalination with thermal vapour compression (MED-TVC) is one of most common applications of thermal desalination technologies. The present paper presents a comprehensive thermodynamic model of a 24 million litres per day thermal desalination plant, using specialised software packages. The proposed model was validated against a real data set for a large-scale desalination plant, and showed good agreement. The performance of the MED-TVC unit was investigated using different loads, entrained vapour, seawater temperature, salinity and number of effects in two configurations. The first configuration was the MED-TVC unit without preheating system, and the second integrated the MED-TVC unit with a preheating system. The study confirmed that the thermo-compressor and its effects are the main sources of exergy destruction in these desalination plants, at about 40% and 35% respectively. The desalination plant performance with preheating mode performs well due to high feed water temperature leading to the production of more distillate water. The seawater salinity was proportional to the fuel exergy and minimum separation work. High seawater salinity results in high exergy efficiency, which is not the case with membrane technology. The plant performance of the proposed system was enhanced by using a large number of effects due to greater utilisation of energy input and higher generation level. From an economic perspective, both indicators show that using a preheating system is more economically attractive.

1. Introduction

Potable water is a scare natural resource, and its ongoing supply is one of most critical issues facing humanity today. Saltwater represents about 97.5% of the water resources on the earth and that make desalination technologies the sole reliable source for securing fresh water. Practitioners and researchers in this field are exerting great effort to enhance the performance of desalination systems because it is considered an energy intensive process [1]. Combining a multi-effect desalination (MED) unit with thermal vapour compression (TVC) is an attractive choice for water production due to operating flexibility, fewer rotating parts, minimum corrosion risk and high effectiveness [2]. The MED-TVC system reuses a portion of the energy extracted from the last effect through a thermo-compressor (steam ejector) to reduce the loss in the condenser and act as an energy source for the first effect [3].
Two evaluation tools are used to assess the energy system’s performance; energy analysis based on the first law of thermodynamics and exergy analysis based on both the first and second laws of thermodynamics. The first law conserves energy but not exergy and the focus is on quality as well as quantity. Exergy analysis can identify the sources of the energy losses in the system, types and locations and suggests modifications to enhance system efficiency [4,5].
Hamed et al. were the first researchers to use exergy analysis to investigate the thermal performance of a four-stage MED-TVC plant located in the United Arab Emirates [6]. The plant operated at low temperatures with a performance ratio of 6.5; exergy destruction had a maximum value at the first stage and in the thermo-compressor. A1-Najem et al. have confirmed that the maximum exergy destruction occurs in the first effect and in the thermo-compressor, due to high fuel exergy [7]. Alasfour et al. presented a comparison study between three different configurations of ME-TVC [8]. The results emphasised that the largest sources of irreversibilities occur in the thermo-compressor and evaporators, while the first effect constituted approximately 50% of the total exergy destruction.
Choi et al. performed an exergy analysis on a MED-TVC plant manufactured by Hyundai Heavy Industries (HHI) for different units with capacities of 4.5, 10, 16 and 20 million litres per day (1.0, 2.2, 3.5 and 4.4 MIGD—million imperial gallons per day) [9]. The exergy destruction due to irreversibilities and exergy losses of the MED-TVC was evaluated in order to reveal potential plant efficiency improvements; results showed that 70% of the total exergy destruction occurred in the TVC and stages.
Samake et al. conducted parametric analysis of MED-TVC desalination systems based on the first and second laws of thermodynamics [10]. Their findings confirmed the insensitivity of plant performance to concentration factor but that the ejector compression ratio played a great role in reducing the amount of required input thermal energy, and exergy destruction. These authors recommended a higher value for the compression ratio. Esfahani et al. performed an exergy analysis and optimization using a genetic algorithm based on a multi-objective function to minimize total annual cost and maximize the gain ratio (GR), the ratio of the distillate product to steam supplied to the desalination unit of the MED-TVC desalination system [11]. The results show that maximum GR and minimum product cost was achieved by using the highest number of effects (six in total). This was later confirmed by Eshoul et al. [12].
Recently, Alamolhoda et al. [13] carried out a parametric analysis on the Kavian desalination unit, which consists of four stages with a total plant capacity of 192 ton per hour (about 4600 million litres per day). The Kavian desalination plant has 3.95% exergetic efficiency, which is considered low compared to other thermal applications. The major sources of irreversibilities occur in the thermo-compressor heater and evaporators.
Despite numerous studies being available in the literature for MED-TVC desalination systems, there has been no study exploring the impact of treating seawater as a real mixture and including the chemical exergy on performance. This paper will introduce a novel scheme for MED-TVC plant with preheating obtained from waste energy from the production line.

2. Plant Description (MED-TVC)

In this study, a large-scale MED-TVC desalination plant with capacity of 24,000 cubic meter per day (5.3 MIGD) of fresh water was investigated from both the thermodynamic and economic perspectives. The desalination plant is inspired by the Zawya MED-TVC desalination plant, which is located in Libya, near the Al-Zawya combined cycle power plant. The latter powers four MED-TVC units by supplying low-pressure steam to the thermo-compressor. Each unit produces 6000 cubic meter per day and consists of seven effects. Table 1 shows the performance data of a single MED-TVC unit.

3. Process Description

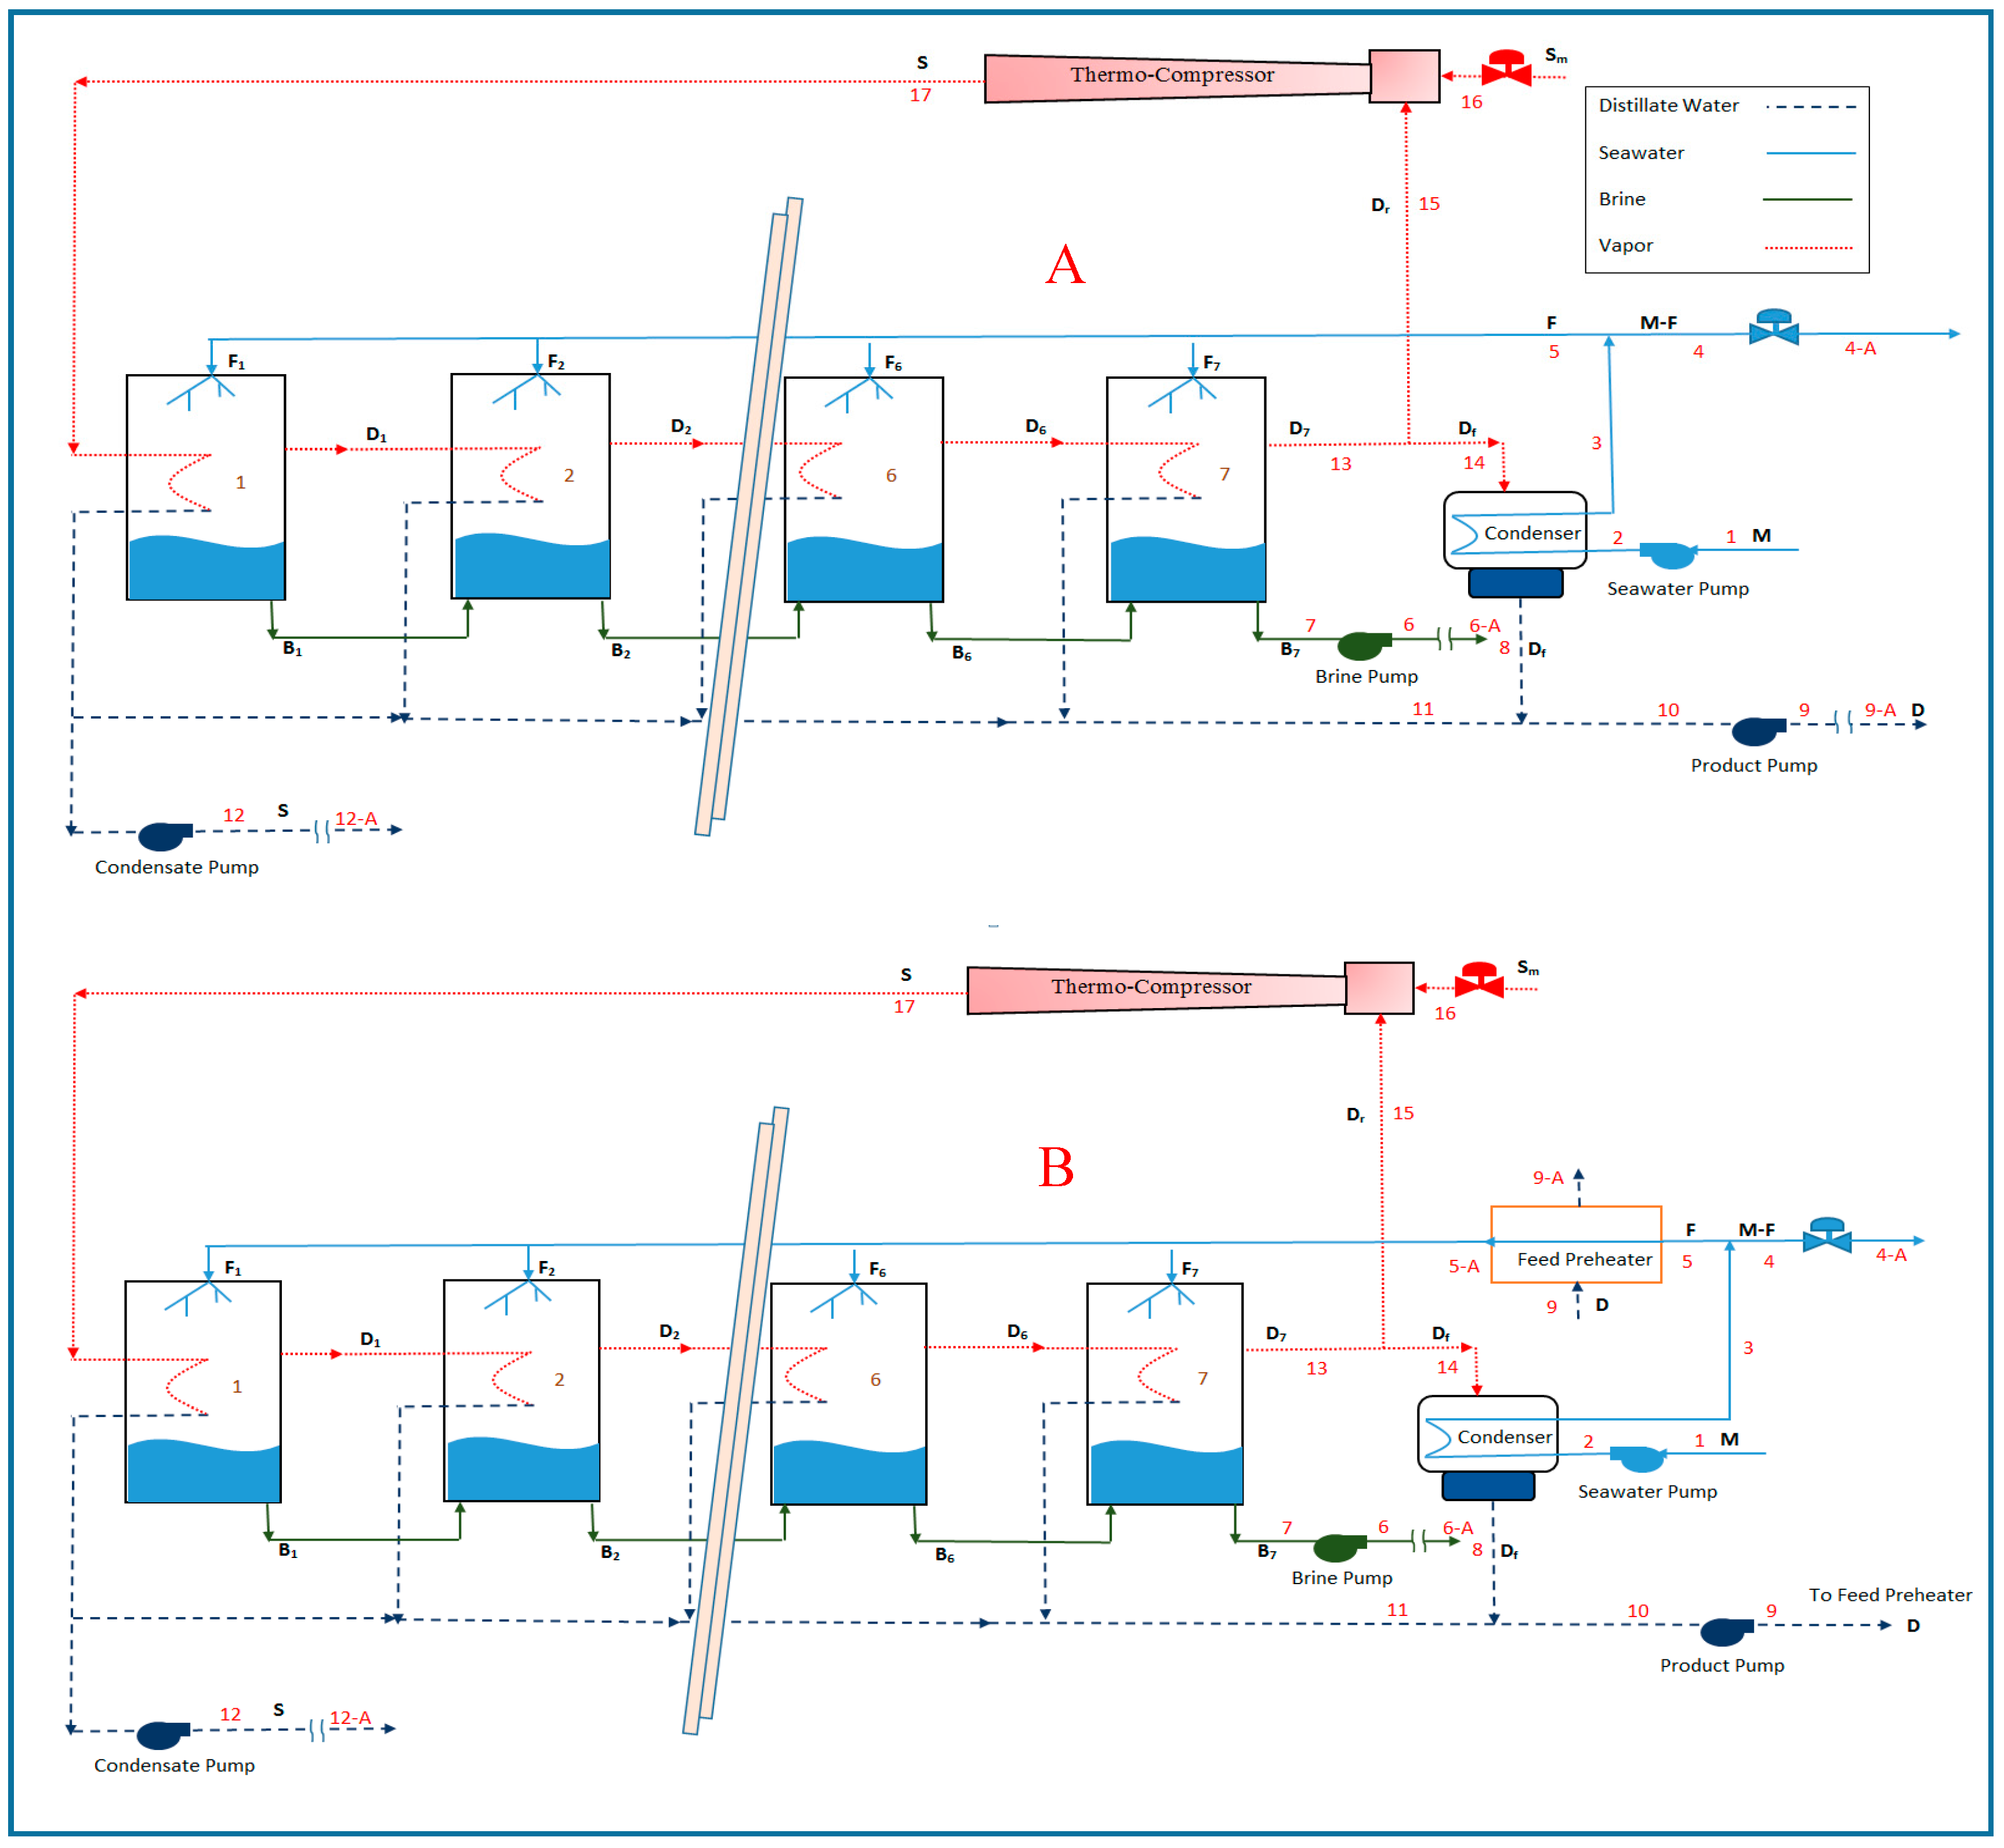
Figure 1A shows a schematic diagram of a single MED-TVC unit without preheating. The cooling seawater flow (M) at stream number (1) enters the condenser to cool the distillate water and increase the seawater feed temperature. The seawater leaves the condenser at point (3) and is divided into two streams. Stream M-F goes back to the tank and stream F is directed to the effects and split into seven parts (F1 to F7). The extracted motive steam (Sm) goes directly to the steam ejector (Thermo-Compressor) and is mixed in the ejector or TVC with entrained steam (Dr) which was separated from the steam generated from the last effect (D7), and the other part (Df) entered the condenser and then combined with the steam condensate flow from the other effects. The vapour generated from the first effect is passed through demisters and enters effect number two and so on into the next effect. The brine remaining in the feed water of the first effect is passed to the second effect as raw water, B1. Meanwhile the condensate steam from the first effect in the four blocks is split into two streams: S (in stream number 12) returns back to the CCPP while Dr passes to the product line. The vapour formed outside the tubes in the first effect is passed to the second effect and so on to the other effects (D1 to D7), each time to heat the feed water for the next effect. In doing so it condenses as distillate water, with all streams collected in the product line [14,15].

4. Methodology

4.1. Exergy and Energy Analysis

Energetic and exergetic analyses are conducted on a large scale MED-TVC desalination plant at an appropriate reference state. Exergy evaluation is an essential method for measuring the energy system performance, shedding light on the locations and sources of energy degradation. The potential for improvement can be found by determining the less efficient parts within the proposed system. The maximum useful work that can be extracted from the system under reversible condition is called exergy. The total exergy of stream can be classified into four parts as given in the following equation:
E ˙ x = E ˙ ke + E ˙ pe + E ˙ ph + E ˙ ch       ( kW )
where E ˙ ke , E ˙ pe , E ˙ ph and E ˙ ch , are the kinetic, potential, physical and chemical exergies, respectively. The kinetic and potential are considered to be negligible due to their insignificant impact relative to the physical and chemical exergies.
The physical and chemical exergy can be expressed, respectively, as:
E ˙ ph = m ˙ [ ( h s h o ) T o ( s s s o ) ]     ( kW )
E ˙ ch , w = m ˙ w k ( μ k s μ k o )       ( kW )
where the subscript s refers to initial state and o to the corresponding environmental or reference state, respectively. The terms 𝜇 and 𝑤 refer to the chemical potential and mass fraction. However, the thermophysical properties of the seawater streams are evaluated using correlations proposed and validated by Sharqawy et al. [4,14]. These correlations give the specific enthalpy (h), and specific entropy (S) respectively for both pure (w) and saline water (sw) [15]:
hw = 141.355 + 4202.070 × T − 0.535 × T2 + 0.004 × T3      (kJ/kg)
hsw = hw − ws(b1 + b2ws + b3ws2 + b4ws3 + b5T +b6T2 + b7T3 + b8wsT + b9ws2T + b10wsT2)       (kJ/kg)
Sw = 0.1543 + 15.383 × T − 2.996 × 10⁻² × T2 + 8.193 × 10⁻⁵ × T3 − 1.370 × 10⁻⁷ × T4       (kJ/kg.K)
Ssw = Sw − ws (c1 + c2ws + c3ws2 + c4ws3 + c5T + c6T2 + c7T3 + c8wsT + c9ws2T + c10wsT2)        (kJ/kg.K)
The temperature unit (T) in Equations (4)–(7) is Celsius and the outcome units for the specific enthalpy and specific entropy are J/kg, and J/kg.K, respectively. Table 2 shows the constants used to calculate thermodynamic properties.
The exergetic efficiency of a thermal desalination plant represents the ratio of the minimum separation work to fuel exergy, and can be expressed as:
η ex = W ˙ min E ˙ f
The minimum separation work ( W ˙ min ) is defined as least work required to separate the salt from saline water, which is function of number of moles, separation temperature and activity. The fuel exergy ( E ˙ f ) is equivalent to the total input exergy to the proposed system or component.
The exergy destruction ( E ˙ d ) and exergy loss ( E ˙ l ) plus exergy outlet ( E ˙ xe ) of the system components are equal to exergy inlet ( E ˙ xi ). In the steady state analysis these quantities are related as:
E ˙ xi = E ˙ xe + E ˙ d + E ˙ l       ( kW )
The exergy destruction is associated with entropy generation due to irreversibilities during the process. The exergy loss is related to energy emitted to the atmosphere during, or at end of the process, e.g., brine water in a desalination system. However, exergy destruction can be appraised in two ways; as a ratio according to total fuel exergy, or total exergy destruction:
y d = E ˙ d E ˙ f
y d = E ˙ d E ˙ d , tot
From the energetic perspective, the performance of MED-TVC or any thermal desalination process can be evaluated using different terms for the consumed energy. The most common term is the gain ratio, which represents the distillate output ( D ˙ ) divided by the steam supplied ( S ˙ ) to the desalination system [8,16].
GOR = D ˙ S ˙
The first law of thermodynamics governs the energy analysis evaluation and is used to assess the performance of any energy system. This principle is based on conservation of energy where the sum of all the energies in the system is constant. The boundary of an open system is exposed to three types of energy transfer: mass transfer, work transfer and heat transfer. The general energy balance equation under steady-state conditions, can be expressed as:
Q ˙ W ˙ =   Δ H + Δ K E + Δ P E
The mass transfer is given by change in enthalpy, kinetic energy, and potential energy and appear on the right in Equation (13); heat transfer and work are presented on the left side. Energy analysis is a powerful tool in energy system evaluation, and combining energy and exergy analysis will strengthen the outcomes and deliver more precise results in any assessment.

4.2. Economic Analysis

An economic evaluation or feasibility study of any project will determine levels of profitability and acceptability and that will help the decision maker to compare different energy systems based on cost-effectiveness. Investment and operating costs are essential input data required to determine the profitability through the project life. The total capital investment (TCI) of an energy system is a one-time cost incurred at the beginning of the project and can be divided into direct and indirect costs. The direct costs are mainly purchase of equipment (PEC) and installation; while the indirect costs include construction, supervision and contingency [17]. The capital costs and operation and maintenance costs for MED-TVC were selected based on past studies as reported by Hanafi et al. [18] and Alasfour and Bin Amer [19]. The main economic parameters used to evaluate the proposed system are shown in Table 3.
The economic assessment process for the systems proposed in the current study was carried out using two economic indicators; Payback Period (PBP) and Net Present Value (NPV). The former represents the required period to recover the investment cost while the latter shows the difference between the cash inflow and cash outflow over the book life in terms of present-day values.

4.3. Heat Exchanger Cost Estimation

The heat exchanger is an essential part in energy systems that must match stream conditions. The size and design of heat exchanger will depend on the specific application, stream conditions and material used for its construction. In the second proposed system feed water preheater is integrated with MED-TVC to reduce the waste exergy of the distillate stream. The heat exchangers’ cost estimation was evaluated using the ESDU engineering data developed by IMI Marston Limited, a British manufacturer. This method estimates heat exchanger cost based on the number of transfer unit (NTU) with available data for cold/hot stream inlet/outlet temperatures [20]. The inlet and outlet hot and cold temperatures (Th and Tc respectively) for each stream are used as input data to calculate the mean temperature difference as:
Δ T m = Δ T lm = [ ( T h , in T c , out ) ( T h , out T c , in ) ] log e [ ( T h , in T c , out ) / ( T h , out T c , in ) ]       ( C )
The value of Q ˙ / Δ T lm is calculated and used to find the values of cost factors C 1 and C 2 in Equation (15) which can be read directly from ESDU tables for the specified condition. The value of Q ˙ / Δ T lm is found from given tables supplied for each type of heat exchanger, but may require interpolation [16], the cost factor (C-value) is then calculated by logarithmic interpolation as follows:
C = exp { log e C 1 + log e ( C 1 / C 2 ) log e [ ( Q ˙ / Δ T m ) / ( Q ˙ / Δ T m ) 1 ] log e ( Q ˙ / Δ T m ) 1 / ( Q ˙ / Δ T m ) 2 }
where subscript (1) and (2) refers to hot and cold stream respectively. Finally, multiplying the C-value by Q ˙ / T m will give the final equipment purchase cost of the heat exchanger (EPC).

4.4. Assumptions

The following assumptions were adopted for the analysis:
  • The proposed system operates under steady-state conditions.
  • The rotating equipment in the proposed system operates under adiabatic conditions.
  • It is acceptable to omit the effect of potential and kinetic energies.
  • Leakages of working fluid are negligible.
  • The salinity of the seawater is constant.
  • Pump efficiency is assumed to be typically 75% [21].
  • Feed water preheater material is assumed to be 316 L stainless steel.
  • No taxation on plant expenses and income.
  • The reference state is 20 °C and 1.013 bar.

5. Results and Discussion

The thermodynamic and economic analyses were performed for one block of the MED-TVC desalination plant using different modes, with and without the feed water preheating system. Each block of the proposed system produced 6 million litres per day, and comprised seven effects. Specialised software was used for modelling and analysing the proposed systems at different operational conditions. The thermodynamic properties of seawater were treated as a real mixture using the most recently published data in the literature [14]. The effects of entrained vapour, seawater temperature, seawater salinity, number of effects and load variation on plant performance have been probed using intake conditions as a reference state (T = 293 K, P = 1.013 bar, and ws = 37,000 ppm). Table 4 and Table 5 present exergetic data for the MED-TVC desalination plant without and with preheating system respectively, and streams are denoted by the numbers shown in Figure 1. The main equations used in the exergy analysis are summarised in Table 6.
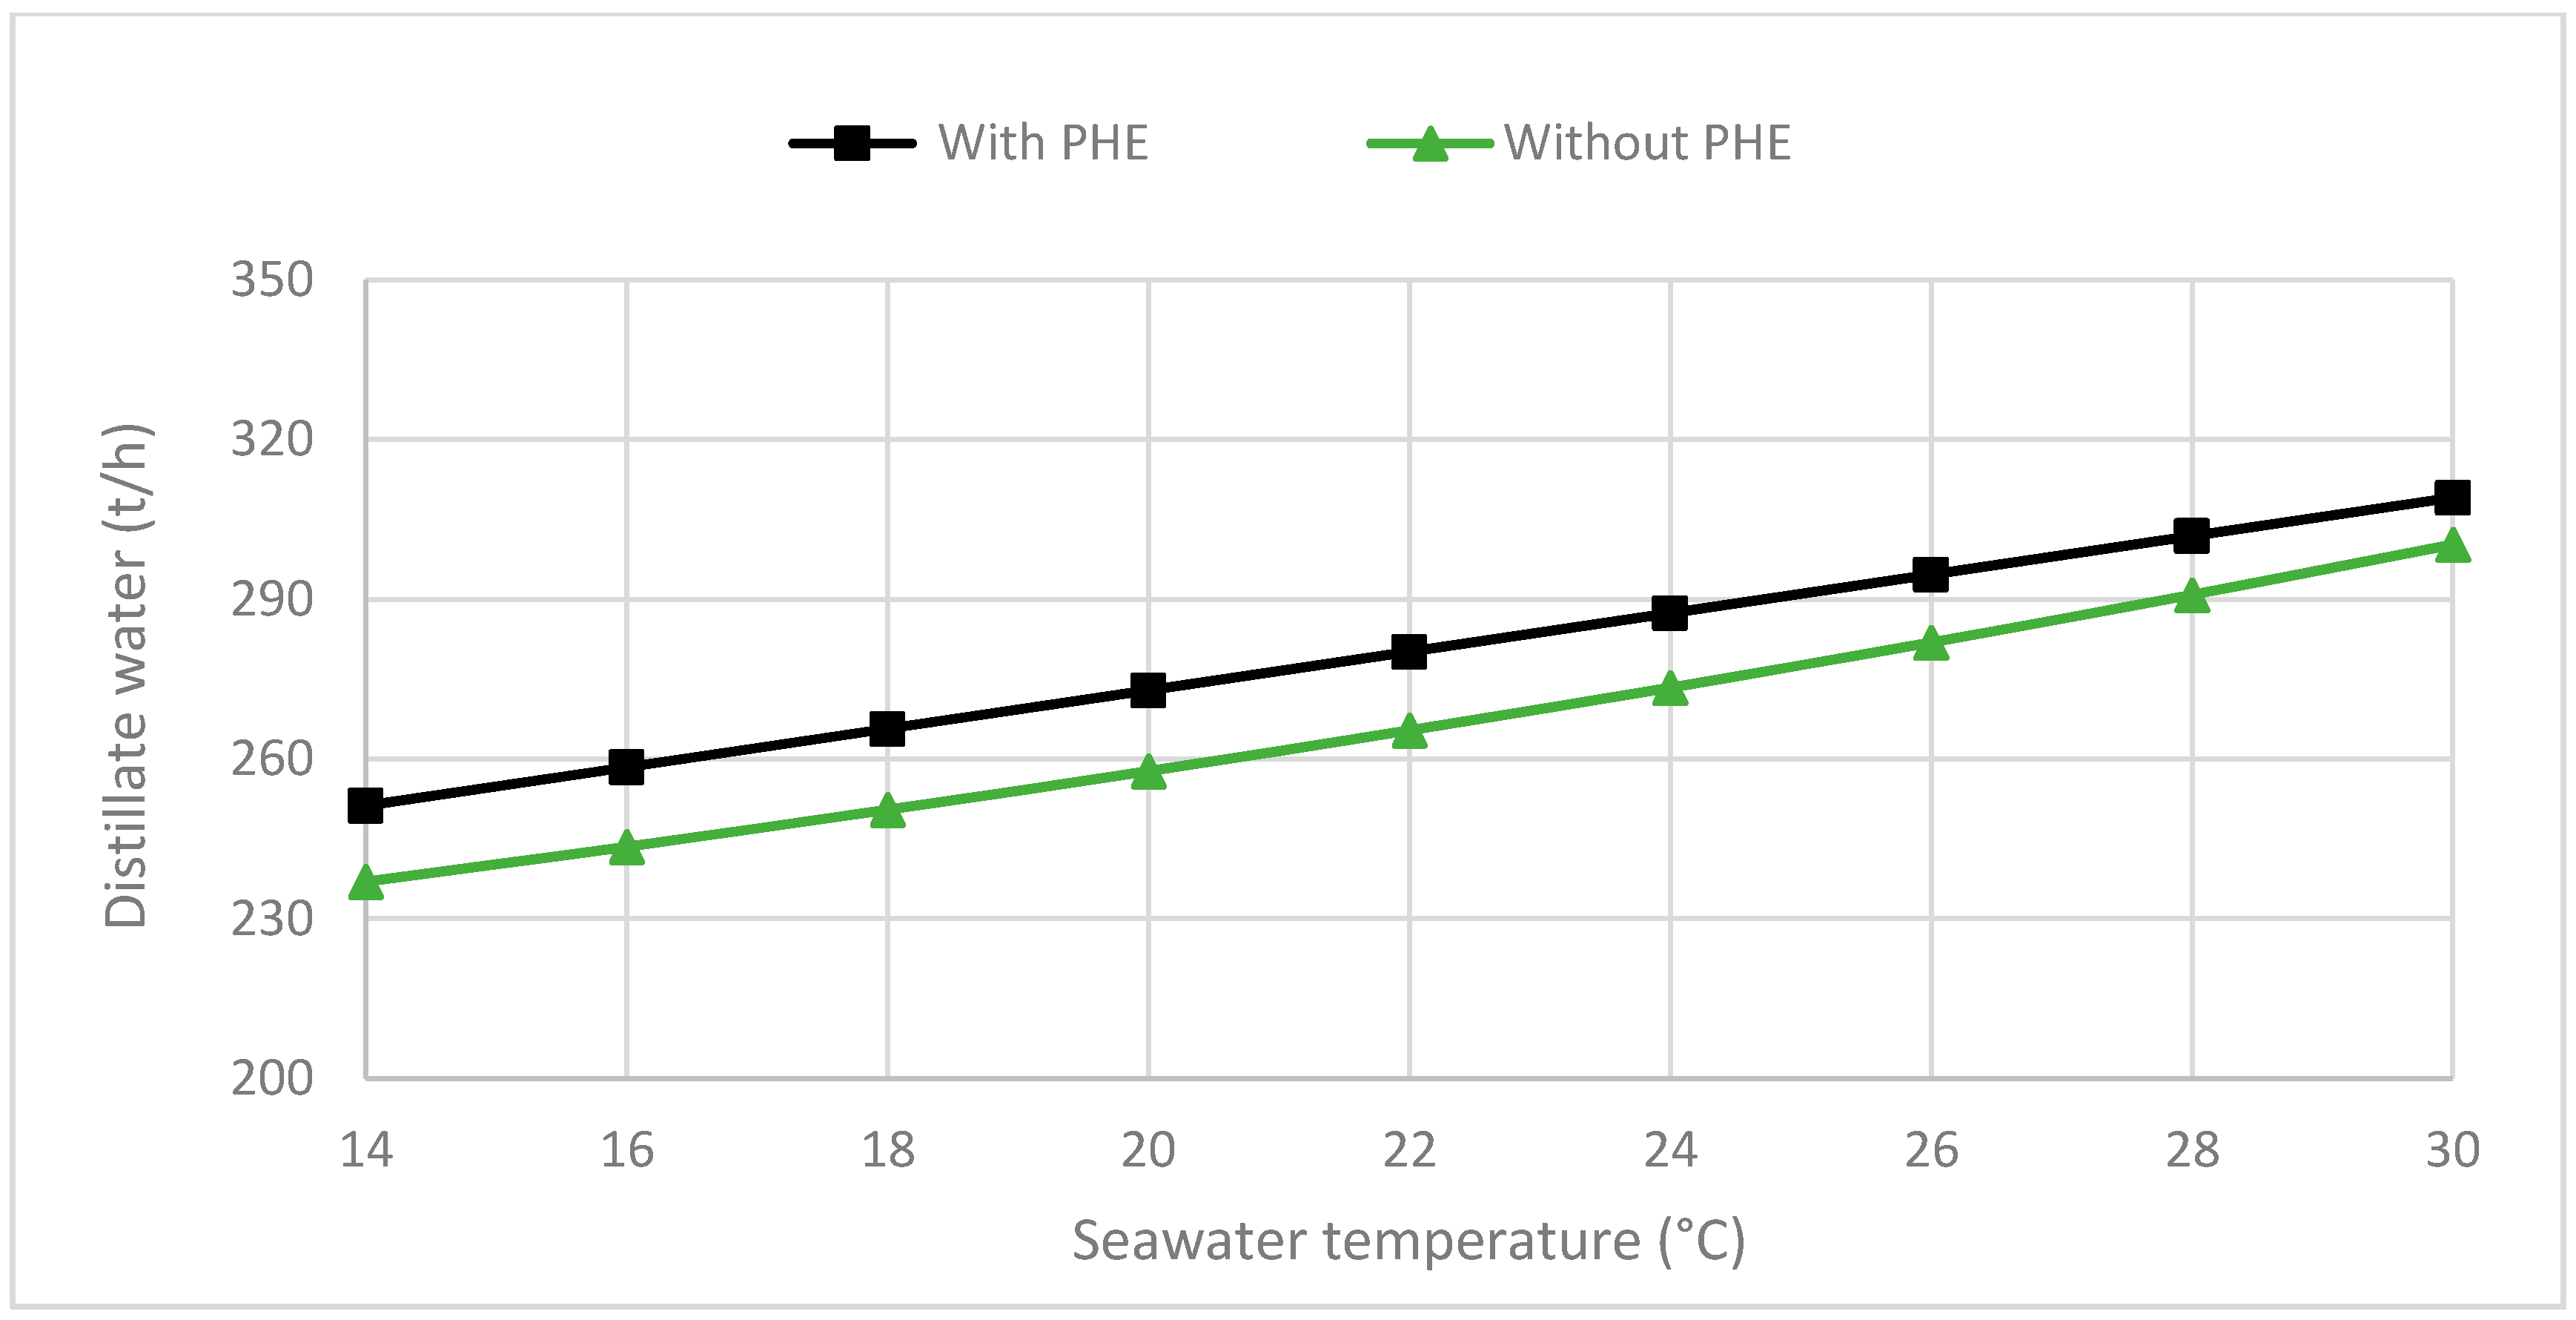
The exergy efficiency of MED-TVC system at design conditions is about 3.4% as illustrated in Table 5, which was considered extremely low and might be attributed to three reasons; (i) quality of the thermal separation process, (ii) a large number of components, and (iii) high latent heat of vaporisation due to the low working pressure inside the effects. The impact of seawater temperature variation on exergy efficiency for both modes of the proposed system is shown in Figure 2. The exergy efficiency values were between 3.2–4.7% and 3.0–4.5% over the range tested (14–30 °C) for the system with and without preheating respectively. When the MED-TVC system was integrated with a feed water preheating exchanger, the performance was enhanced slightly due to a reduction in waste exergy in the condenser and an increase in the entrained fuel exergy. Distillate water production in the preheating mode was always higher than the non-preheating mode, because of the temperature difference between the feed water and effects is lower. That means more vapour is generated in each effect as shown in Figure 3. The impact of the preheating system will reduce as the seawater temperature increases because the temperature difference between the seawater and distillate water reduces.
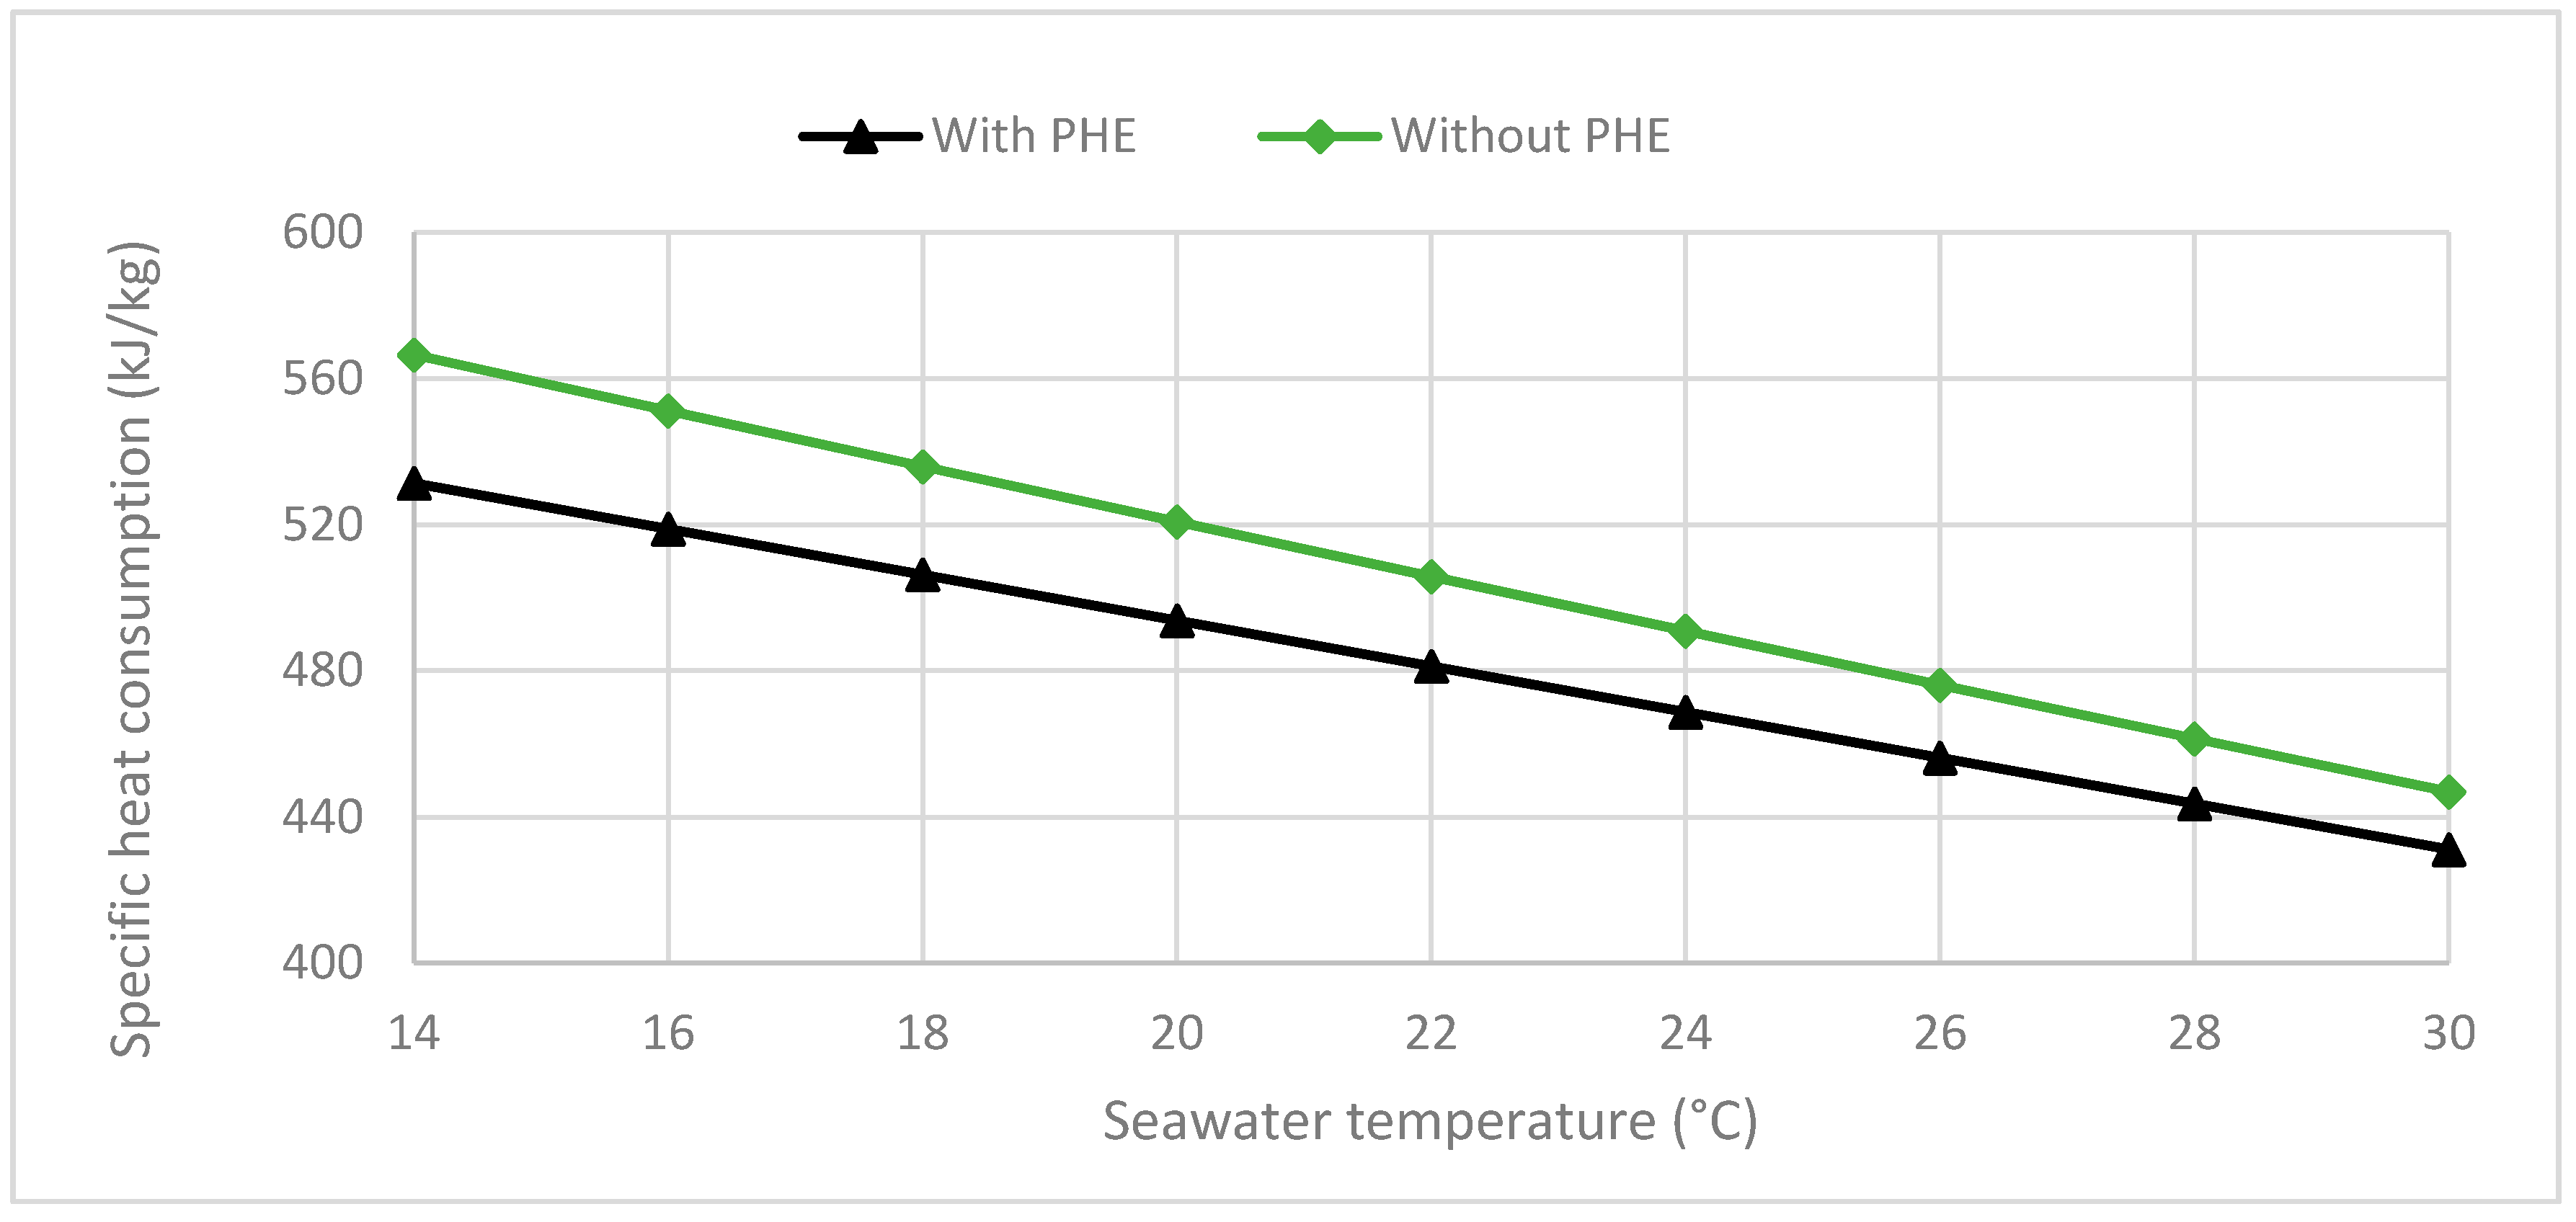
This means that the effectiveness of the preheater will be less in the summer, relative to the winter season. The relation between specific heat consumption and the seawater temperature is shown in Figure 4. The specific heat consumption is the amount of energy consumed to produce 1 kg of distillate water. The rate of increase in distillate water production is higher than the rate of increase of energy consumption, and that means there is a significant reduction in specific heat consumption and improvement in the MED-TVC gain ratio.
In MED-TVC thermal desalination technology, the entrainment ratio (ratio of motive steam mass flow rate to the mass of entrained vapour) is considered an important factor in determining energy input and plant size. A thermo-compressor compresses the entrained vapour which is mixed with motive steam then directed to the first effect in the MED-TVC unit. The entrained vapour represents only a small portion of the vapour generated in the last effect, while the remaining vapour moves forward to the condenser to continue the process.
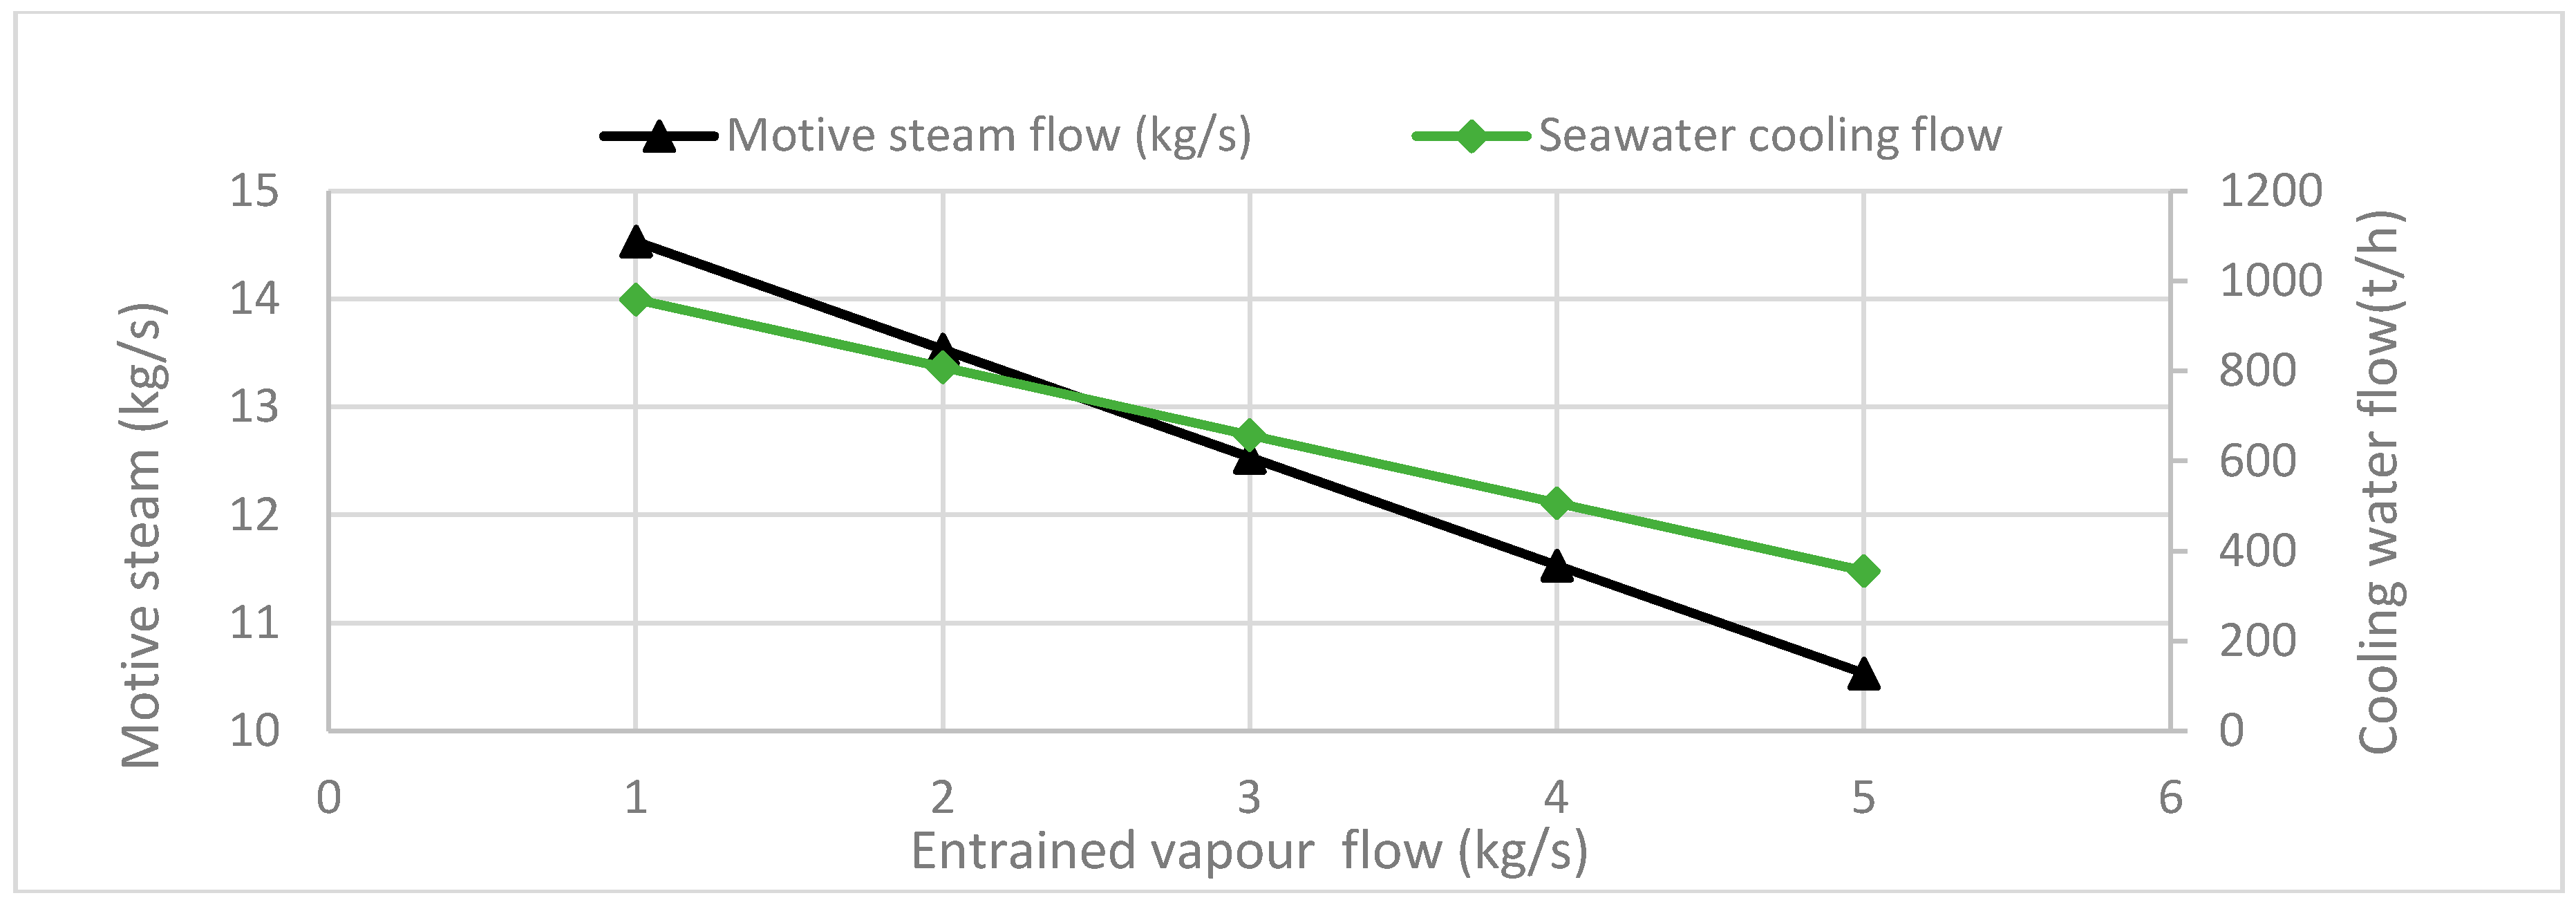
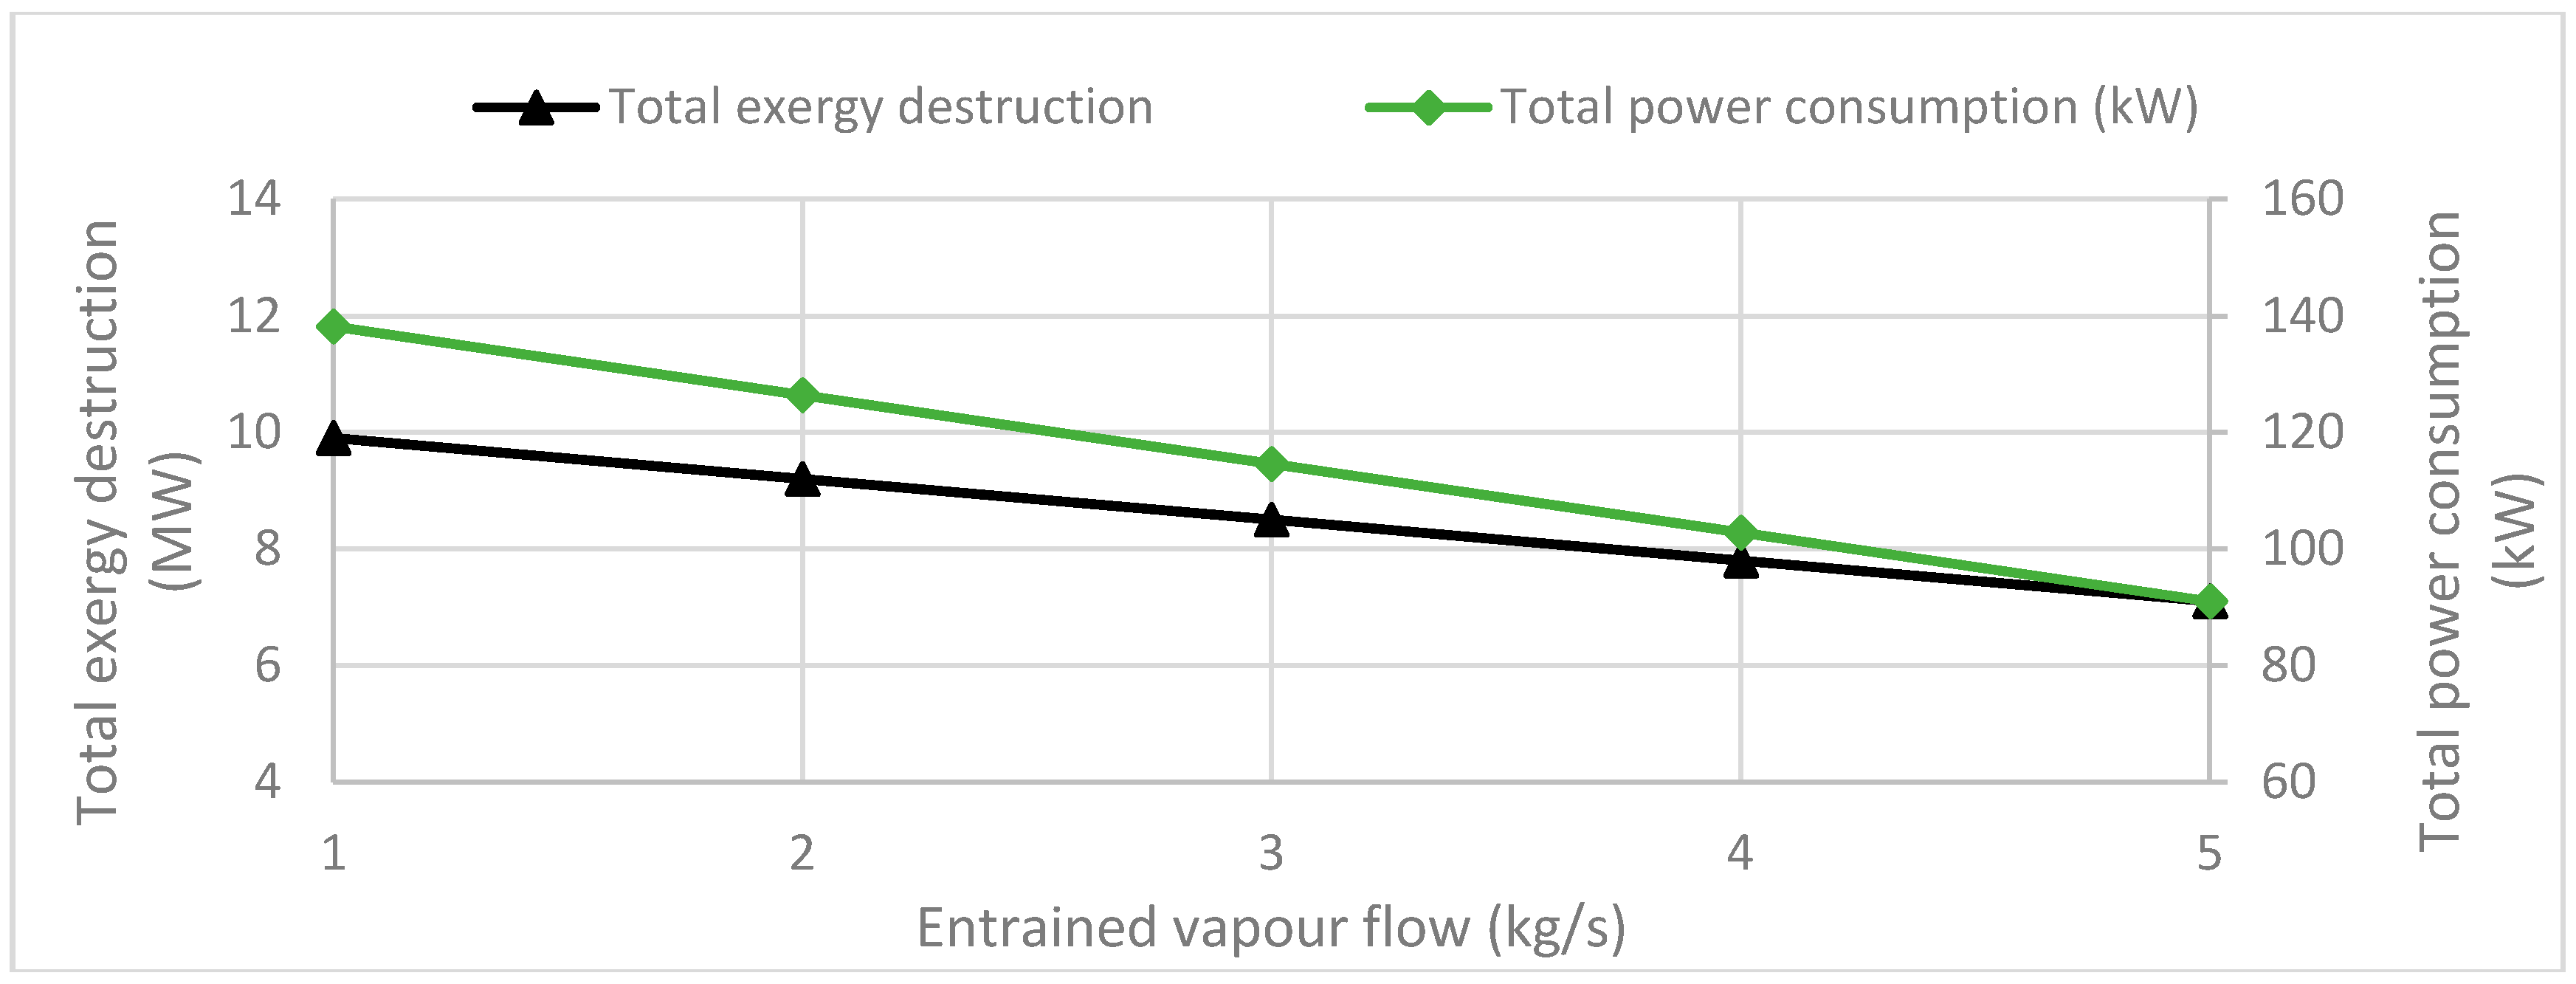
Figure 5 shows the effect of entrained vapour on motive steam, and cooling water flow. Both motive steam and cooling water flow decrease as entrained vapour flow increases, which means more fuel exergy is saved in the system, and exergy loss in the condenser is reduced. The rate of reduction of the cooling water flow is steeper than motive steam because of the reduction in the condenser load. The relation between the entrained vapour and total exergy destruction and total power consumption is shown in Figure 6. The reduction in total exergy destruction might be attributed to the reduction in fuel exergy while in the total power consumption falls with reduction of product line mass flow.
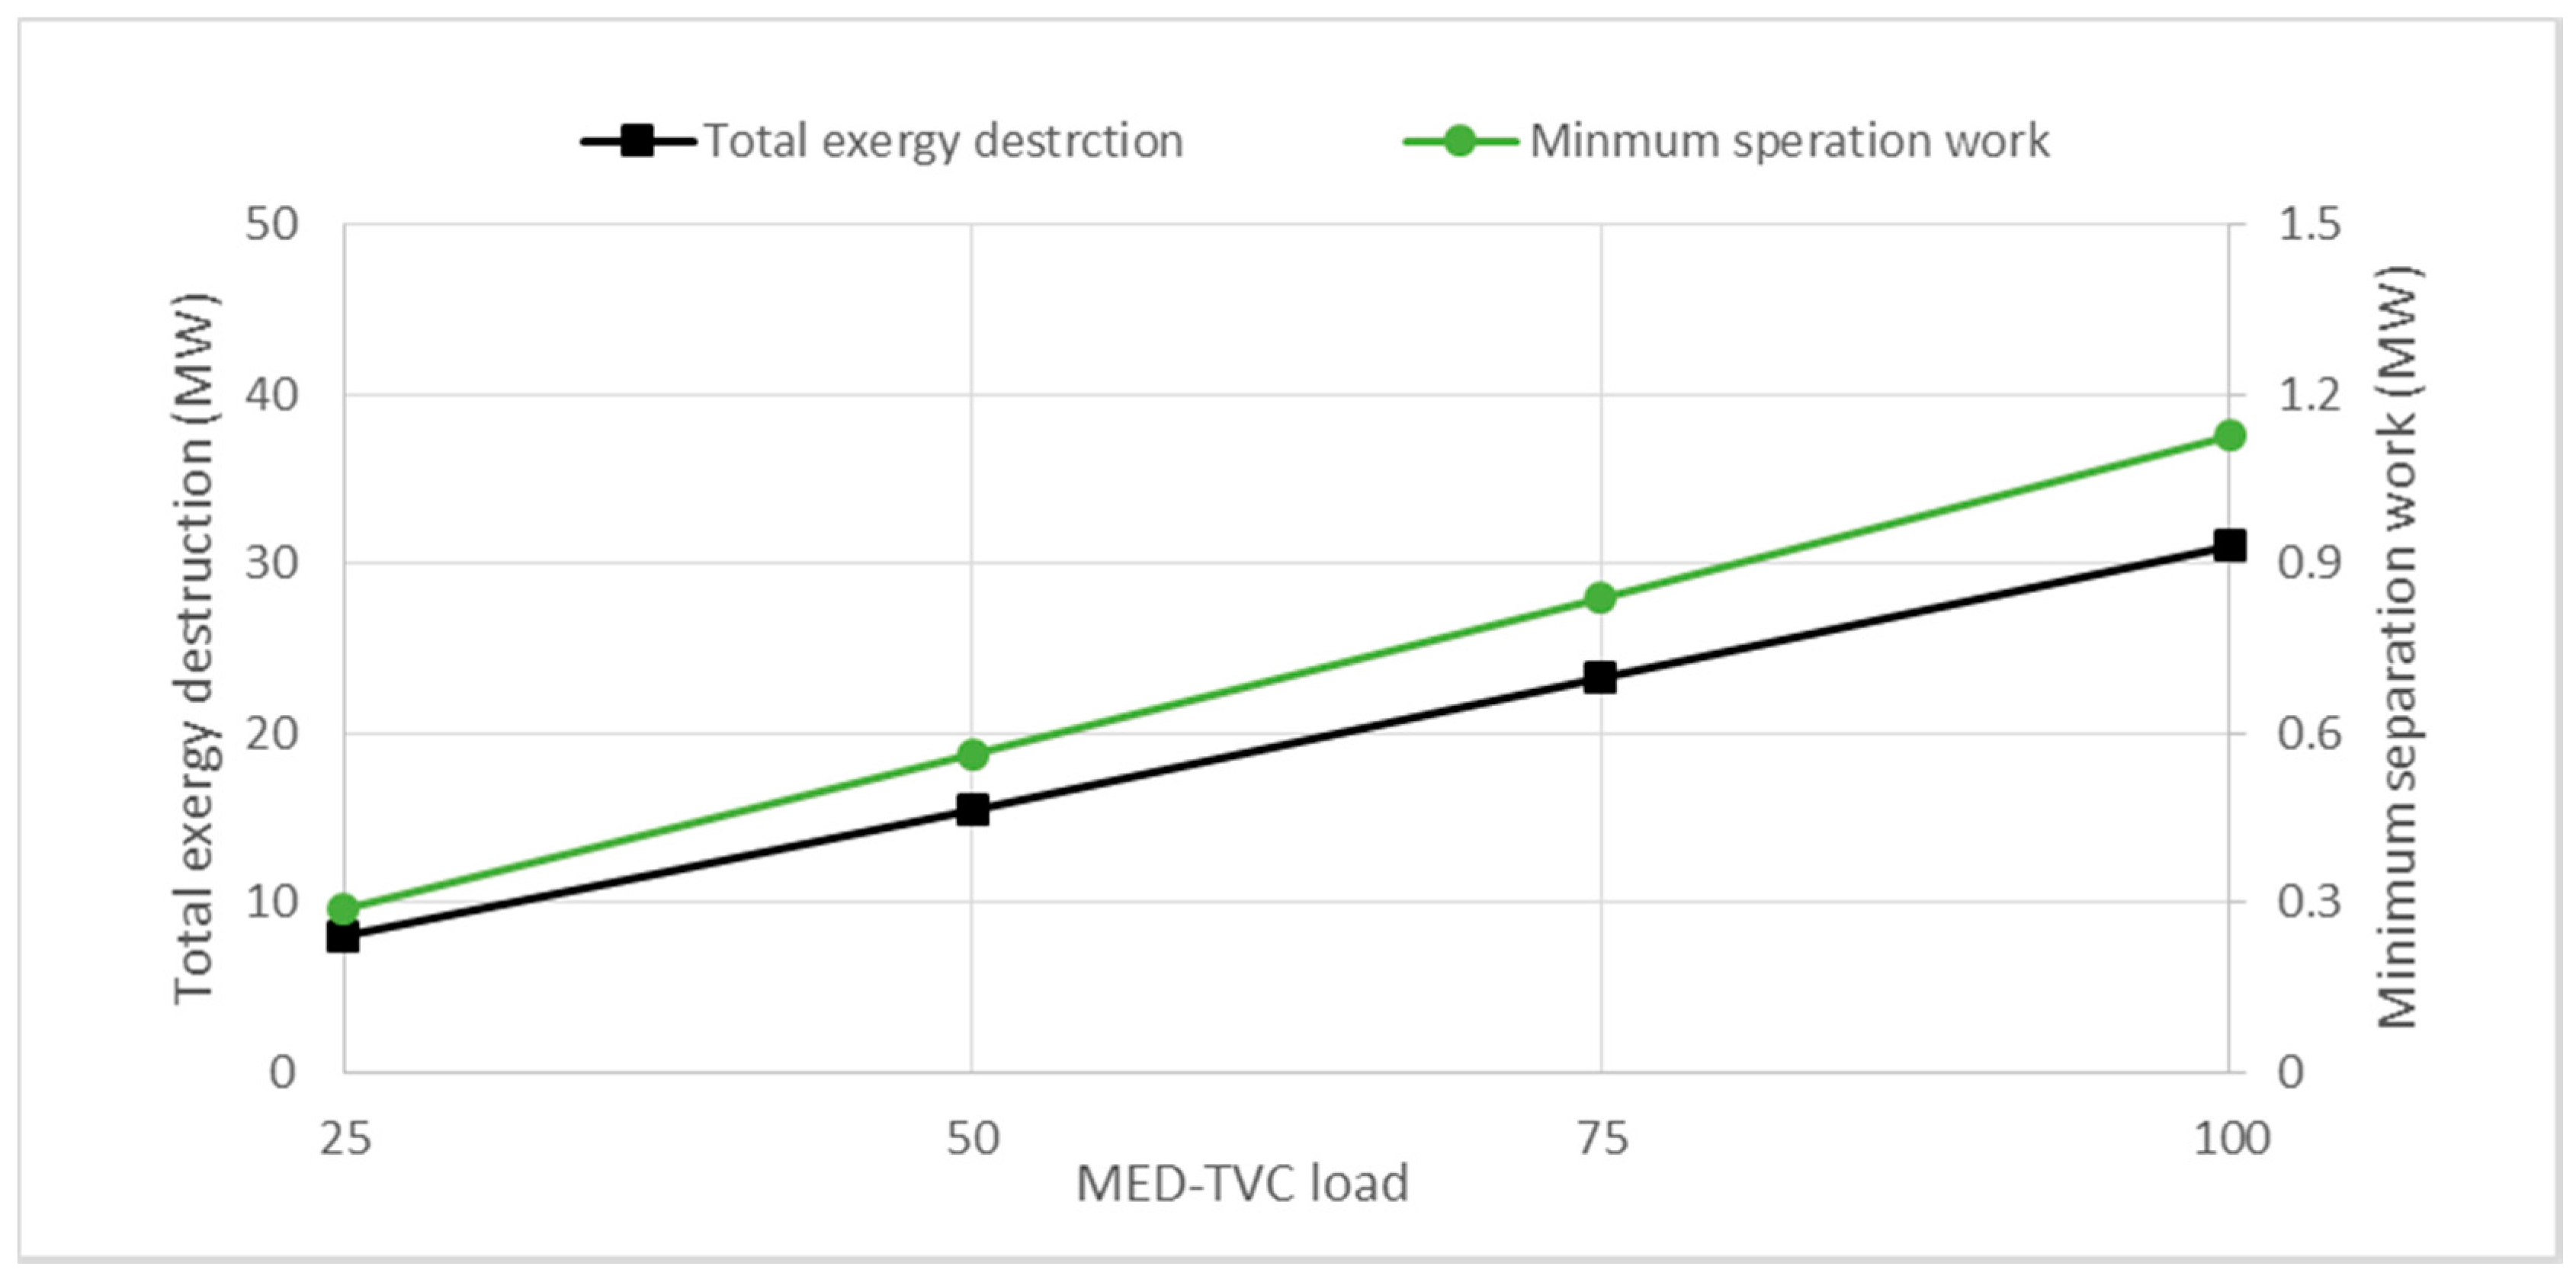
Figure 7 shows the effect of change in plant capacity from 25% to 100% load. 25% total plant capacity is achieved by operating one block, 50% two blocks, 75% three blocks and 100% all four blocks. Thermal desalination technologies are highly energy intensive processes due to the energy required for separation. More load capacity means a higher level of minimum separation work as well as total exergy destruction. The latter results are compatible with thermal design criteria by reducing the sources of irreversibilities through fewer components being utilised in the system. The low exergy efficiency mainly results from high fuel exergy input relative to minimum separation work. Thermal desalination technologies have low efficiency compared to other thermal processes, but their use is vital in regions where there is a lack of fresh water. However, setting the plant capacity at low load is acceptable from an operational perspective.
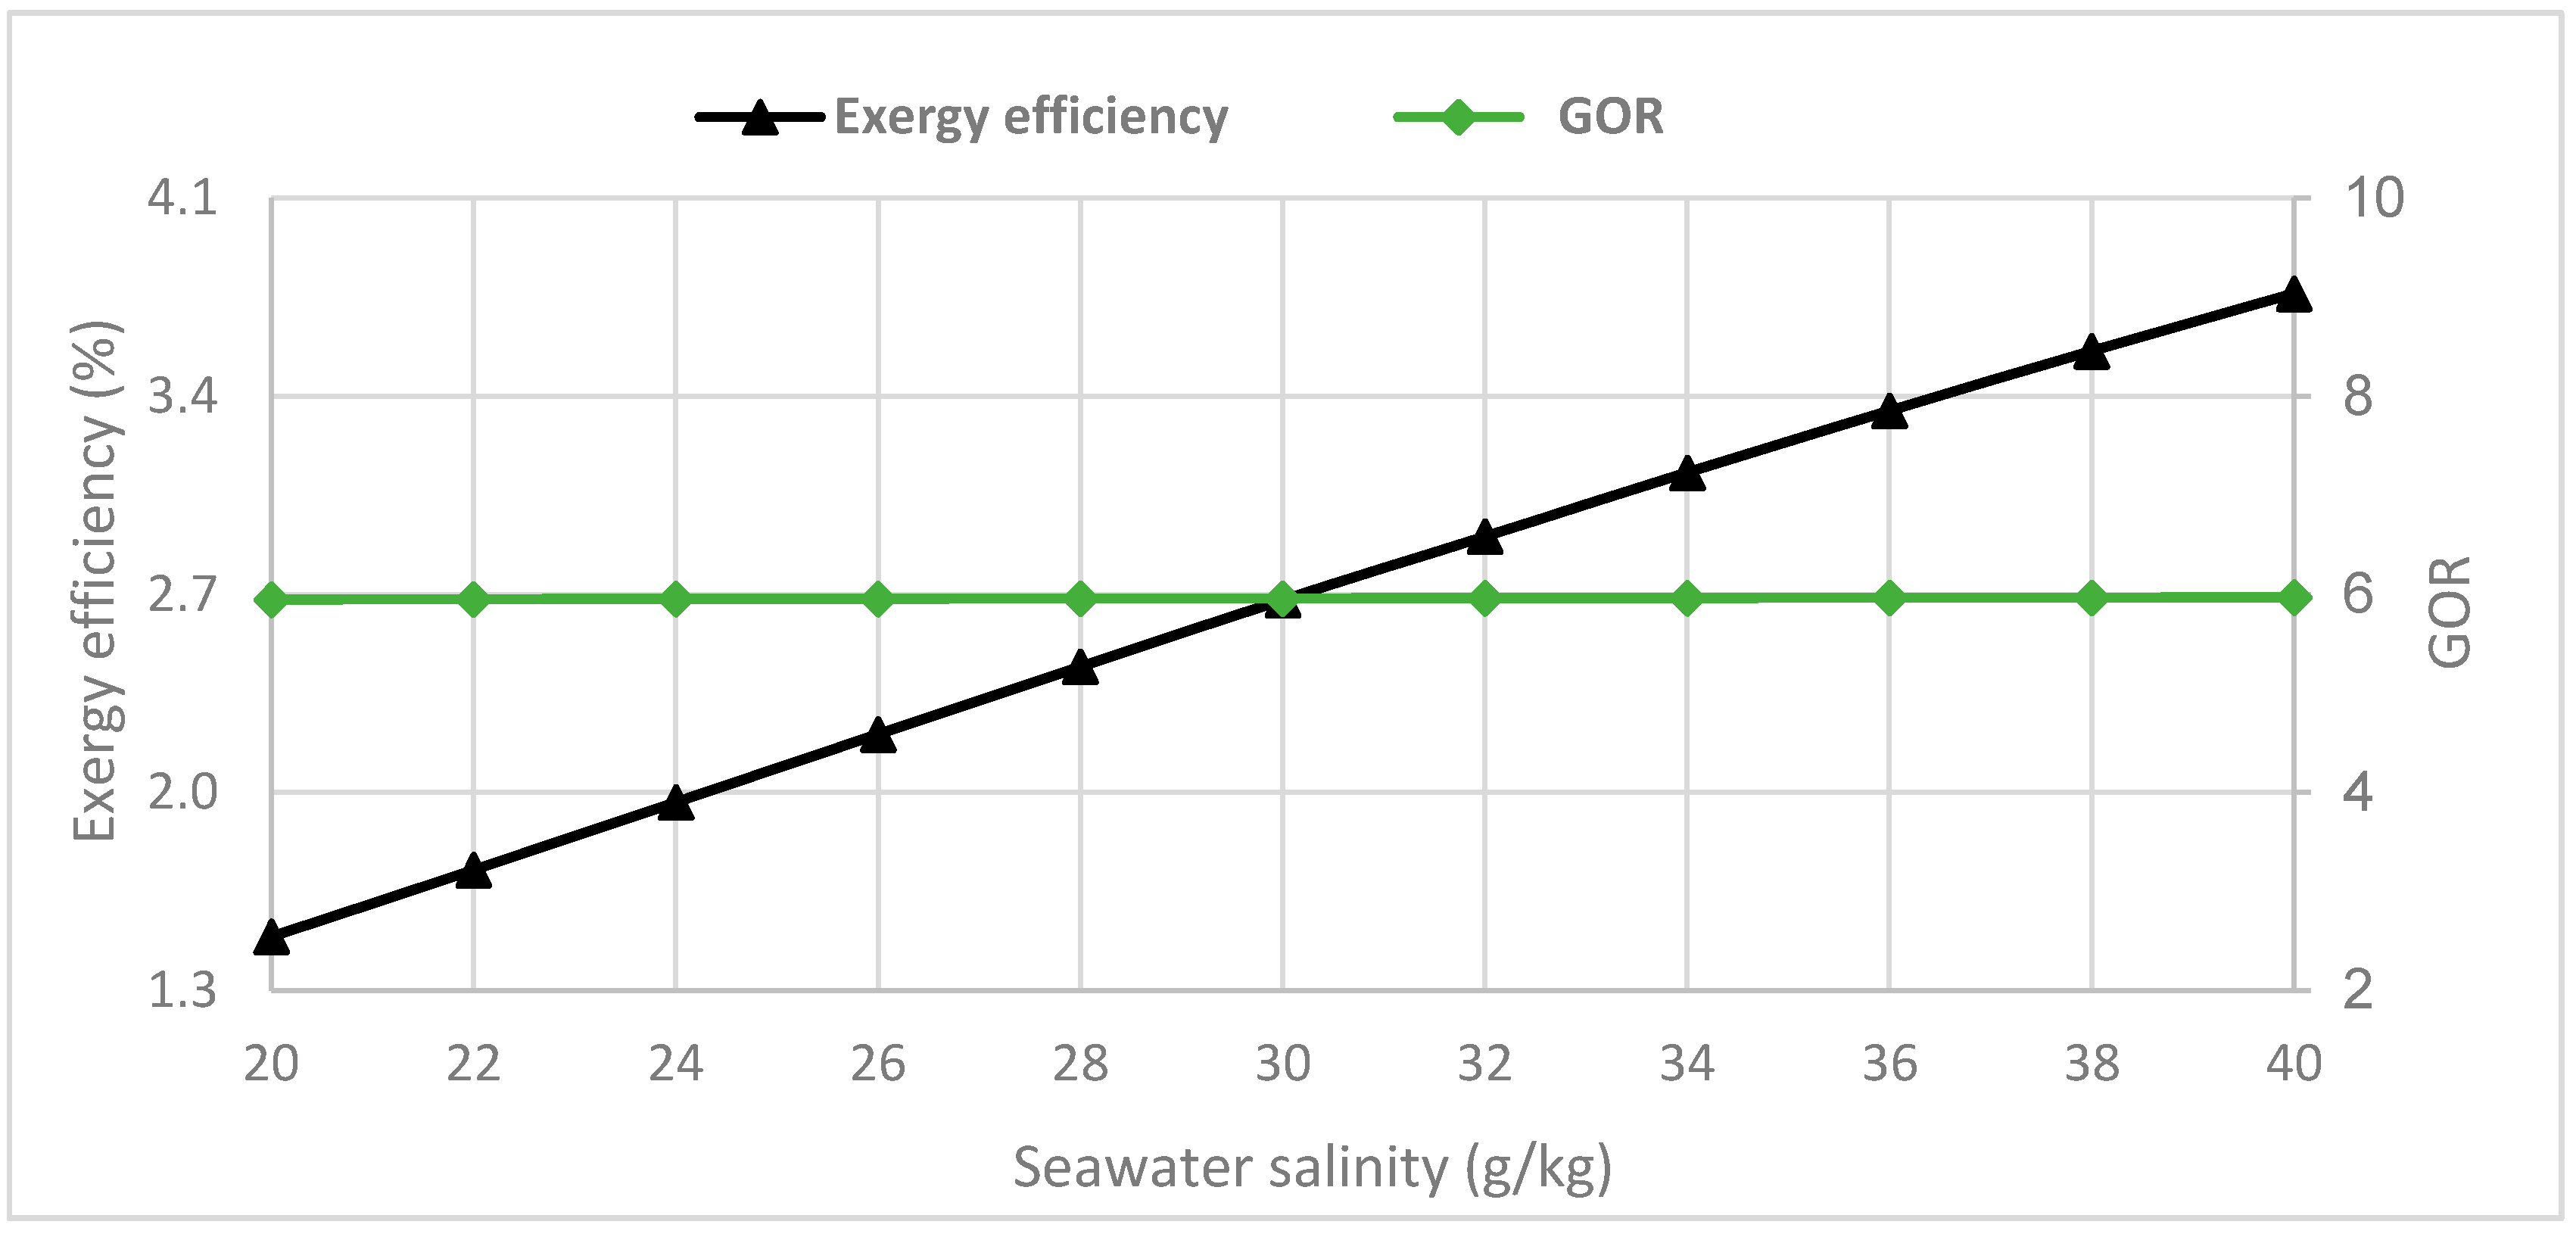
The impact of seawater salinity variation on the exergy efficiency and gain ratio is illustrated in Figure 8. The gain ratio values are almost constant at a value of 6 over the tested salinity range, this is because it does not take into account the availability or the work utilised by the pumping system. Conversely, the exergy efficiency includes both these factors which have an immediate effect on MED-TVC thermal desalination performance. The relation between the seawater salinity and exergy efficiency of the MED-TVC system is linearly proportional. The main reason for that is the proportional increase in work required for minimum separation is greater than the proportional increase in fuel exergy. Consequently, exergy efficiency increases.
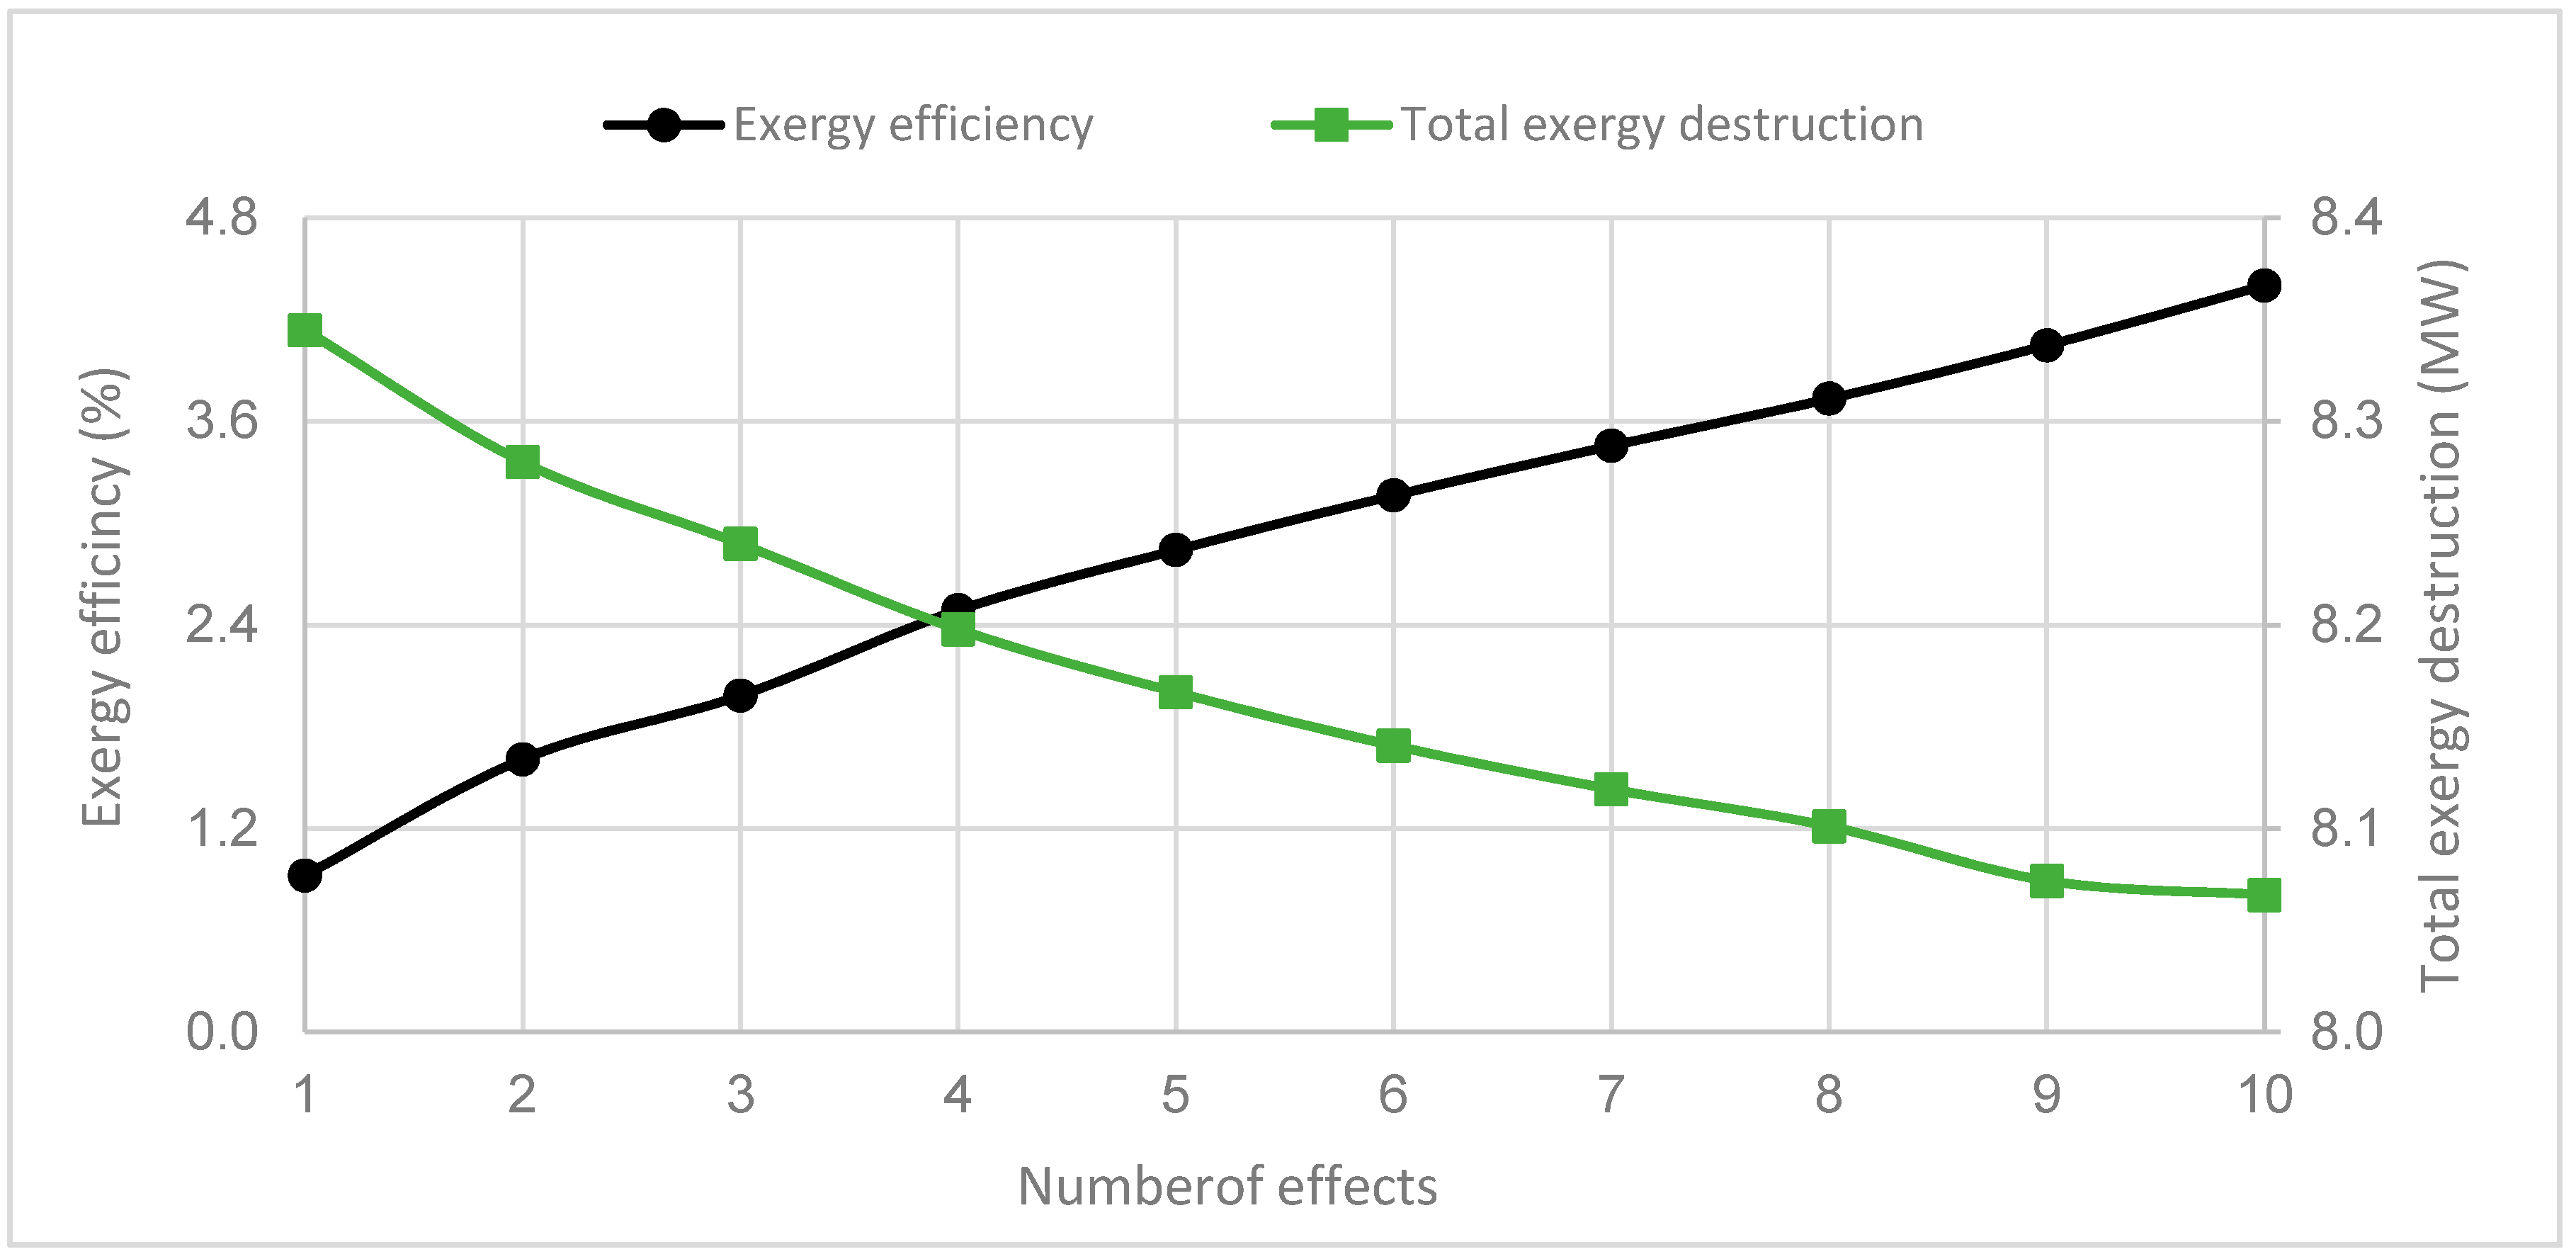
The relation between the number of effects in the MED-TVC unit with the exergy efficiency and total exergy destruction is shown in Figure 9. Increasing the number of effects improves overall plant efficiency due to greater utilisation of energy input to the desalination unit. However, more effects lead to increased minimum work of separation because more distillate water is produced.
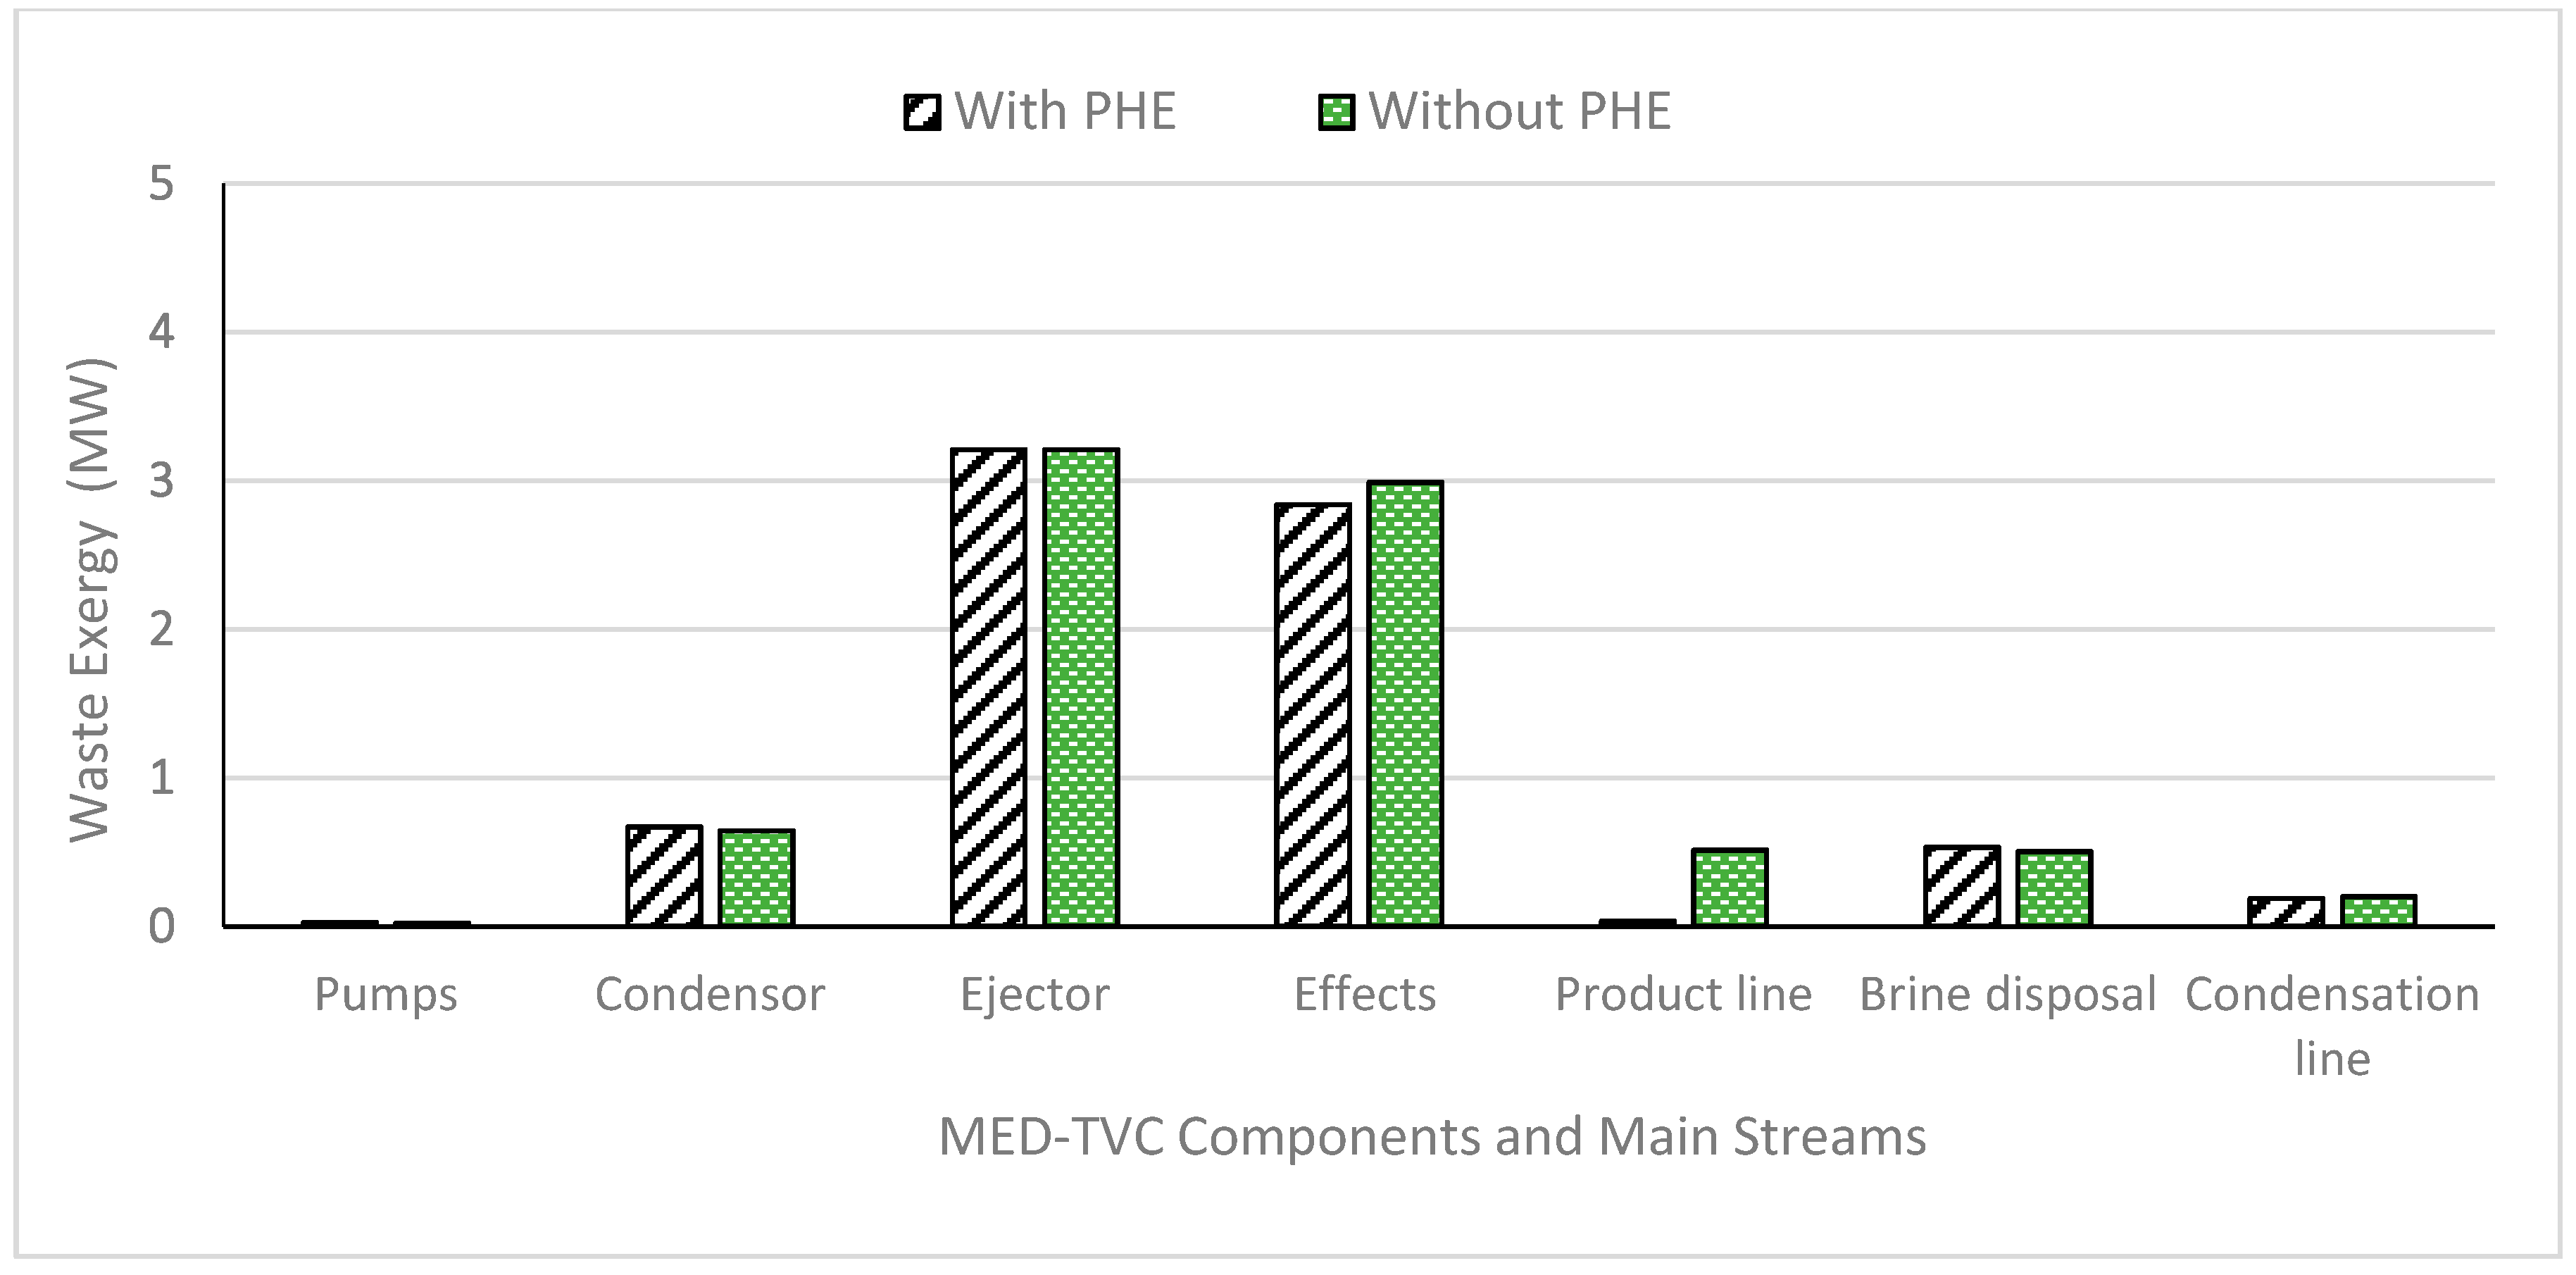
The waste exergy rates for all the main components of the MED-TVC under design conditions, for both proposed modes, are shown in Figure 10. The major waste exergy occurs in the ejector (thermo-compressor) due to the mixing process, its configuration produces high fuel exergy, as confirmed by [22]. The second greatest waste takes place in the effects due to temperature differences and the separation process. The amount of waste exergy in non-preheating mode is higher across all effects, but slightly lower when in preheating mode, due to increasing quality of fuel exergy. The condenser represents the third major source of irreversibilities in the system, because of the energy lost to the coolant during the condensation process. The fourth source of irreversibilities is the product stream in non-preheating mode due to its relatively high temperature. In preheating mode, the brine line represents the fourth source of irreversibilities due to high salinity and temperature.
Figure 11 shows the PBP and NPV for both modes of the proposed MED-TVC desalination plant. As can be seen the MED-TVC system without preheating has the longer PBP, about 4.5 years compared with the system with preheating. This period could be reduced to 2.9 years by adding the preheater to raise feed water temperature. This result agrees with thermodynamic analysis which showed that the exergy efficiency improved with the addition of a preheater. The NPV is equal to 71 M$ and 104 M$, without and with preheating system respectively. The addition of preheating system enhances the economic performance and increases the NPV at the end of project life by 33 M$. Furthermore, the payback period is reduced in spite of an increase in capital investment cost. That may be attributed to an increase in the plant capacity due to reducing the thermal load per effect. However, the profit factors show MED-TVC desalination plant with preheating demonstrates better economic efficiency.
6. Conclusions

In this study, exergetic and economic analyses have been carried out for a MED-TVC thermal desalination plant at different working conditions and configurations. The consequences of changes in entrained vapour, seawater temperature, seawater salinity, number of effects and load were explored. The input data for both exergy and economic analyses were derived from actual data and the results of the developed model showed good agreement with manufacturer’s published data. The main conclusions from the present study are:
  • The analysis confirmed that the MED-TVC desalination process is extremely energy intensive with low exergetic efficiency.
  • The highest level of irreversibilities occurs in thermo-compressor, followed by the effects, representing more than 75% of total waste exergy in the system.
  • The preheated configuration gave higher performance and better economic efficiency. Water production was higher with preheating than without preheating, for all seawater temperatures considered.
  • Raising the amount entrained vapour will reduce the motive steam and cooling water flows and, consequently, cause a considerable reduction of exergy loss in the condenser.
  • Operating the thermal desalination technologies at low load will minimise the irreversibilities in the proposed system.
  • Increasing the seawater salinity leads to an increase in both the fuel exergy and minimum separation work, with change in the minimum separation having the higher level.
  • Increasing number of effects in the MED-TVC system increased the minimum work of separation due to a greater production of distillate water, but improved plant efficiency.

Acknowledgments

The authors wish to express their sincere thanks to the Exergy Engineering Solutions (EES) in the state of Kuwait for its valuable support and assistance to the current work.

Author Contributions

The authors have contributed equally in writing and revision of this manuscript.

Conflicts of Interest

The authors declare no conflict of interest.

Nomenclature

BBrine water flow rate (kg/s)
CCost factor ($ per kW/K)
DDistillate water flow rate (kg/s)
e ¯ k ch Specific molar chemical exergy (kJ/mol)
ERate of exergy flow in stream (MW)
eSpecific exergy of stream (kJ/kg)
FFeed water flow rate (kg/s)
GRGain ratio
gSpecific Gibbs energy (J/kg)
hSpecific enthalpy of the stream (kJ/kg)
MCooling seawater flow rate (kg/s)
PPressure of the stream (Pa)
Q ˙ Heat transfer rate (MW)
SSteam flow rate (kg/s)
sSpecific entropy of the stream (kJ/(kg.K))
TTemperature of the stream (°C)
Δ T m The mean temperature difference (°C)
UAHeat transfer conductance (kW/m2)
vSpecific volume (m3)
wSalinity of the stream (g/kg)
𝑤Mass fraction
XConcentration (%)
yExergy destruction ratio
WminMinimum work of separation (MW)

Greek Symbols

μChemical potential
η ex Exergy efficiency
Δ Difference

Subscripts

eExit
fFuel
oDead state
chChemical
dDestruction
keKinetic
iInlet
phPhysical
PePotential
ppPumps
mMotive
MinMinimum
MaxMaximum
rEntrained vapour
sSpecified state
swSeawater

Superscripts

wPure Water
oDead state
*Stream condition

Abbreviations

PBPPayback Period
EPCEquipment purchase cost
MEDMulti Effect Desalination
NPVNet present value
NTUNumber of transfer unit
TVCThermal vapour compression

References

  1. El-Dessouky, H.; Ettouney, H. Fundamentals of Salt Water Desalination; Elsevier: Amsterdam, The Netherlands, 2002. [Google Scholar]
  2. Sayyaadi, H.; Saffari, A.; Mahmoodian, A. Various approaches in optimization of multi effects distillation desalination systems using a hybrid meta-heuristic optimization tool. Desalination 2010, 254, 138–148. [Google Scholar] [CrossRef]
  3. Hamed, O. Thermoeconomic analysis of combined power cycle integrated with MSF/SWRO desalination plant. Desalin. Water Treat. 2016, 3994, 1–10. [Google Scholar] [CrossRef]
  4. Sharqawy, M.; Lienhard, J.; Zubair, S. On exergy calculations of seawater with applications in desalination systems. Int. J. Therm. Sci. 2011, 50, 187–196. [Google Scholar] [CrossRef]
  5. Almutairi, A.; Pilidis, P.; Al-Mutawa, N. Energetic and exergetic analysis of combined cycle power plant: Part-1 operation and performance. Energies 2015, 8, 14118–14135. [Google Scholar] [CrossRef]
  6. Hamed, O.; Zamamiri, A.; Aly, S.; Lior, N. Thermal performance and exergy analysis of a thermal vapor compression desalination system. Energy Convers. Manag. 1996, 37, 379–387. [Google Scholar] [CrossRef]
  7. Al-Najem, N.; Darwish, M.; Youssef, F. Thermovapor compression desalters: Energy and availability—Analysis of single- and multi-effect systems. Desalination 1997, 110, 223–238. [Google Scholar] [CrossRef]
  8. Alasfour, F.; Darwish, M.; Amer, A.B. Thermal analysis of ME—TVC+MEE desalination systems. Desalination 2005, 174, 39–61. [Google Scholar] [CrossRef]
  9. Choi, H.-S.; Lee, T.-J.; Kim, Y.-G.; Song, S.-L. Performance improvement of multiple-effect distiller with thermal vapor compression system by exergy analysis. Desalination 2005, 182, 239–249. [Google Scholar] [CrossRef]
  10. Samake, O.; Galanis, N.; Sorin, M. Thermodynamic study of multi-effect thermal vapour-compression desalination systems. Energy 2014, 72, 69–79. [Google Scholar] [CrossRef]
  11. Esfahani, I.J.; Ataei, A.; Shetty, K.; Oh, T.; Park, J.; Yoo, C. Modeling and genetic algorithm-based multi-objective optimization of the MED-TVC desalination system. Desalination 2012, 292, 87–104. [Google Scholar] [CrossRef]
  12. Eshoul, N.; Agnew, B.; Mnider, A.; Engineering, E.; Tyne, N. Parametric study of Mult-effect desalination with thermal vapour compression plant. In Proceedings of the 7th International Renewable Energy Congress (IREC), Hammamet, Tunisia, 22–24 March 2016; pp. 5–10. [Google Scholar]
  13. Alamolhoda, F.; KouhiKamali, R.; Asgari, M. Parametric simulation of MED–TVC units in operation. Desalin. Water Treat. 2016, 57. [Google Scholar] [CrossRef]
  14. Sharqawy, M.; Lienhard, J.; Zubair, S. Thermophysical properties of seawater: A review of existing correlations and data. Desalin. Water Treat. 2011, 29, 355. [Google Scholar] [CrossRef]
  15. Almutairi, A.; Pilidis, P.; Al-Mutawa, N.; Al-Weshahi, M. Exergetic and Sustainability Analysis of an Intercooled Gas Turbine Cogeneration Plant with Reverse Osmosis Desalination System. J. Energy Eng. 2017, 143, 04017016. [Google Scholar] [CrossRef]
  16. Darwish, M. Desalination Engineering; Balaban Desalination Publications: Hopkinton, MA, USA, 2015. [Google Scholar]
  17. Bejan, A.; Tsatsaronis, G.; Michael, M. Thermal Design and Optimization; John Wiley & Sons: Hoboken, NJ, USA, 1996. [Google Scholar]
  18. Hanafi, A.; Mostafa, G.; Fathy, A.; Waheed, A. Thermo-economic analysis of combined cycle MED-TVC desalination system. Energy Procedia 2015, 75, 1005–1020. [Google Scholar] [CrossRef]
  19. Alasfour, F.; Amer, O.B. The feasibility of integrating ME-TVC+MEE with Azzour South Power Plant: Economic evaluation. Desalination 2006, 197, 33–49. [Google Scholar] [CrossRef]
  20. ESDU 92013. Selection and Costing of Heat Exchangers; IHS ESDU: London, UK, 1994. [Google Scholar]
  21. Kahraman, N.; Cengel, Y. Exergy analysis of a MSF distillation plant. Energy Convers. Manag. 2005, 46, 2625–2636. [Google Scholar] [CrossRef]
  22. Almutairi, A.; Pilidis, P.; Al-Mutawa, N.; Al-Weshahi, M. Energetic and exergetic analysis of cogeneration power combined cycle and ME-TVC-MED water desalination plant: Part-1 operation and performance. Appl. Therm. Eng. 2016, 103, 77–91. [Google Scholar] [CrossRef]
Figure 1. A schematic diagram of a single MED-TVC unit (A) without preheater, (B) with preheater.
Water 10 00305 g001
Figure 2. Exergy efficiency for both systems versus seawater temperature, with and without preheating.
Water 10 00305 g002
Figure 3. Distillate water production in tonne per hour for both systems versus seawater temperature.
Water 10 00305 g003
Figure 4. Specific heat consumption for both systems versus seawater temperature.
Water 10 00305 g004
Figure 5. Motive steam and cooling water flow versus entrained vapour flow.
Water 10 00305 g005
Figure 6. Total exergy destruction and total power consumption versus entrained vapour flow.
Water 10 00305 g006
Figure 7. Total exergy destruction and minimum separation work versus plant load.
Water 10 00305 g007
Figure 8. Exergy efficiency and gain ratio versus seawater salinity.
Water 10 00305 g008
Figure 9. Exergy efficiency and total exergy destruction versus number of effects.
Water 10 00305 g009
Figure 10. Waste exergy for all MED-TVC components and main streams for both preheat and non-preheat modes.
Water 10 00305 g010
Figure 11. Payback period (PBP) and net present value (NPV) for both modes in proposed desalination system.
Water 10 00305 g011
Table 1. Performance data of a single multi-effect desalination unit with thermal vapour compression (MED-TVC) unit.
DescriptionValueUnit
Number of effects, n7----
Unit capacity69.7kg/s
Motive pressure3.78bar
Motive steam flow rate12.0kg/s
Maximum brine temperature71.2°C
Minimum brine temperature45.5°C
Feed sea water temperature20.0°C
Compression ratio3.40----
Expansion ratio11.7----
Gain output ratio5.80kg/s
Specific heat consumption405.4kJ/kg
Table 2. Constants used to calculate the enthalpy and entropy of seawater [4,14].
b1b5b6b10c1c5c6c10
b1 = −2.348 × 10⁴b6 = −4.417 × 101c1 = −4.231 × 10²c6 = − 1.443 × 10⁻¹
b2 = 3.152 × 10⁵b7 = 2.139 × 10⁻¹c2 = 1.463 × 10⁴c7 = 5.879 × 10⁻⁴
b3 = 2.803 × 10⁶b8 = −1.991 × 10⁴c3 = −9.880 × 10⁴c8 = −6.111 × 101
b4 = −1.446 × 10⁷b9 = 2.778 × 10⁴c4 = 3.095 × 10⁵c9 = 8.041 × 101
b5 = 7.826 × 10³b10 = 9.728 × 101c5 = 2.562 × 101c10 = 3.035 × 10⁻¹
Table 3. Economic Parameters for a 6000 m3/day MED-TVC unit [18,19].
ParameterUnitValue
Capital CostUS $/m3/day1542
O&M CostUS $/m30.39
Annual Operation Hoursh/year8000
Engine Life Timeyear20
Nominal Escalation Rate%5
Discount rate%5
Table 4. Exergetic data of all streams in the proposed system without preheating.
Stream No.T (°C)Pressure P (kPa)Mass Flow m (kg/s)Salinity ws (g/kg)Enthalpy h (kJ/kg)Entropy s (kJ/kg.K)Specific Physical Exergy eph (kJ/kg)Specific Chemical Exergy ech (kJ/kg)Total Specific Exergy E total (kJ/kg)Total Exergy E total (MW)
120.00101.3539.837.00080.9760.2860.0000.0000.0000.000
220.01150.0539.837.00081.0440.2860.0470.0000.0470.026
324.00150.0539.837.00095.5340.3350.1090.0000.1240.067
424.00150.0322.537.00095.5340.3350.1090.0000.1240.040
524.00150.0217.237.00095.5340.3350.1090.0000.1240.027
645.56200.0145.653.000177.6780.5965.596−1.2963.8070.554
745.539.6145.653.000177.3940.5965.404−1.2963.6140.526
844.929.63.60.000188.0890.6383.8362.9976.2560.022
959.18200.071.60.000247.8630.8219.8172.99710.0080.716
1059.1530.071.60.000247.5900.8219.6322.9979.8260.703
1159.7830.068.00.000250.2280.8289.9422.99710.0440.683
1271.1532.812.00.000297.7850.96916.2592.99719.4860.234
4-A20.00101.3322.537.00080.9760.2860.0000.0000.0000.000
6-A20.00101.3145.653.00078.9090.2731.568−1.2880.3570.052
9-A20.00101.371.60.00085.4660.301−0.1382.9972.8550.204
12-A20.00101.312.00.00085.4660.301−0.1382.9972.8550.034
1345.529.67.60.0002583.4708.168189.0375.871197.5561.497
1445.529.63.60.0002583.4728.168189.0395.871197.5580.707
1545.529.64.00.0002583.4728.168189.0395.871197.5580.790
16142.43387.012.00.0002645.1756.687685.4155.871693.4168.321
1771.2332.916.00.0002628.2017.736360.5605.871368.9275.903
Table 5. Exergetic data of all streams in the proposed system with preheating.
Stream No.T (°C)Pressure P (kPa)Mass Flow m (kg/s)Salinity ws (g/kg)Enthalpy h (kJ/kg)Entropy s (kJ/kg.K)Specific Physical Exergy eph (kJ/kg)Specific Chemical Exergy ech (kJ/kg)Total Specific Exergy E total (kJ/kg)Total Exergy E total (MW)
120.00101.3871.70337.00079.5860.2810.0000.0000.0000.000
220.01150.0871.70337.00079.6570.2810.0470.0000.0470.041
324.00150.0871.70337.00095.5340.3350.1240.0000.1240.108
424.00150.0621.88137.00095.5340.3350.1240.0000.1240.077
524.00150.0249.82237.00095.5340.3350.1240.0000.1240.031
643.37200.0169.02555.000168.6170.5675.259−1.4553.8050.643
743.358.5169.02555.000168.3370.5665.067−1.4553.6120.611
842.728.55.7800.000178.9040.6093.2662.9906.2560.036
952.07210.080.7970.000218.1630.7306.8002.9909.7900.791
1052.0430.080.7970.000217.8760.7306.6082.9909.5980.775
1152.7630.075.0180.000220.8730.7396.9052.9909.8950.742
1271.1532.812.0000.0000.2280.0012.7162.9905.7060.068
4-A20.00101.3621.88137.00079.5860.2810.0000.0000.0000.000
5-A32.00140.0249.82237.00079.5860.2810.0001.0001.0000.250
6-A20.00101.3169.02554.00077.3080.2671.770−1.4300.3390.057
9-A20.00101.380.7970.000106.6150.3730.0723.9904.0620.328
12-A20.00101.312.0000.000119.5160.4160.3973.9904.3870.053
1343.268.59.7800.0002579.4548.208176.0512.990179.0411.751
1443.268.55.7800.0002579.4548.208176.0513.990180.0411.041
1543.268.54.0000.0002579.4548.208176.0514.990181.0410.724
16142.42387.012.0000.0002644.4506.685687.5155.990693.5058.322
1771.2332.916.0000.0002628.2017.736363.1656.990370.1555.922
Table 6. Exergy analysis result summary for MED-TVC plant without using preheating system.
DescriptionEquationsResultUnit
Seawater pump exergy in E 2 E 1 0.102MW
Brine pump exergy in E 6 E 7 0.112MW
Distillate pump exergy in E 9 E 10 0.0522MW
Pumps input exergy in ( 1 / 0.75 ) [ { ( E 2 E 1 ) + ( E 6 E 7 ) + ( E 9 E 10 ) } ] 0.355MW
Heating system exergy in E 16 33.64MW
Exergy inHeating system exergy in + Pump input exergy in33.99MW
Minimum separation work = E 6 A + E 9 A E 4 A 1.162MW
Exergy efficiency η II = W min E 16 + E pp 3.420%
Total exergy destructionExergy in – Minimum separation work32.83MW
Exergy destroyed in pumps E d , pp = ( 1 0.75 ) E pp 0.089MW
Exergy destroyed in condenser (cod) E 2 + E 14 E 3 E 8 2.573MW
Exergy destroyed in ejector E 15 + E 16 E 17 12.83MW
Exergy destroyed in effects (effects) E 5 + E 17 E 7 E 13 E 12 E 11 11.96MW
Exergy destroyed in products E 9 E 9 A 2.490MW
Exergy destroyed in brine disposal E 6 E 6 A 2.010MW
Exergy destroyed in condensate E 2 + E 14 E 3 E 8 0.798MW