Assessment of Water Quality and Identification of Pollution Risk Locations in Tiaoxi River (Taihu Watershed), China


Abstract
:1. Introduction
2. Materials and Methods
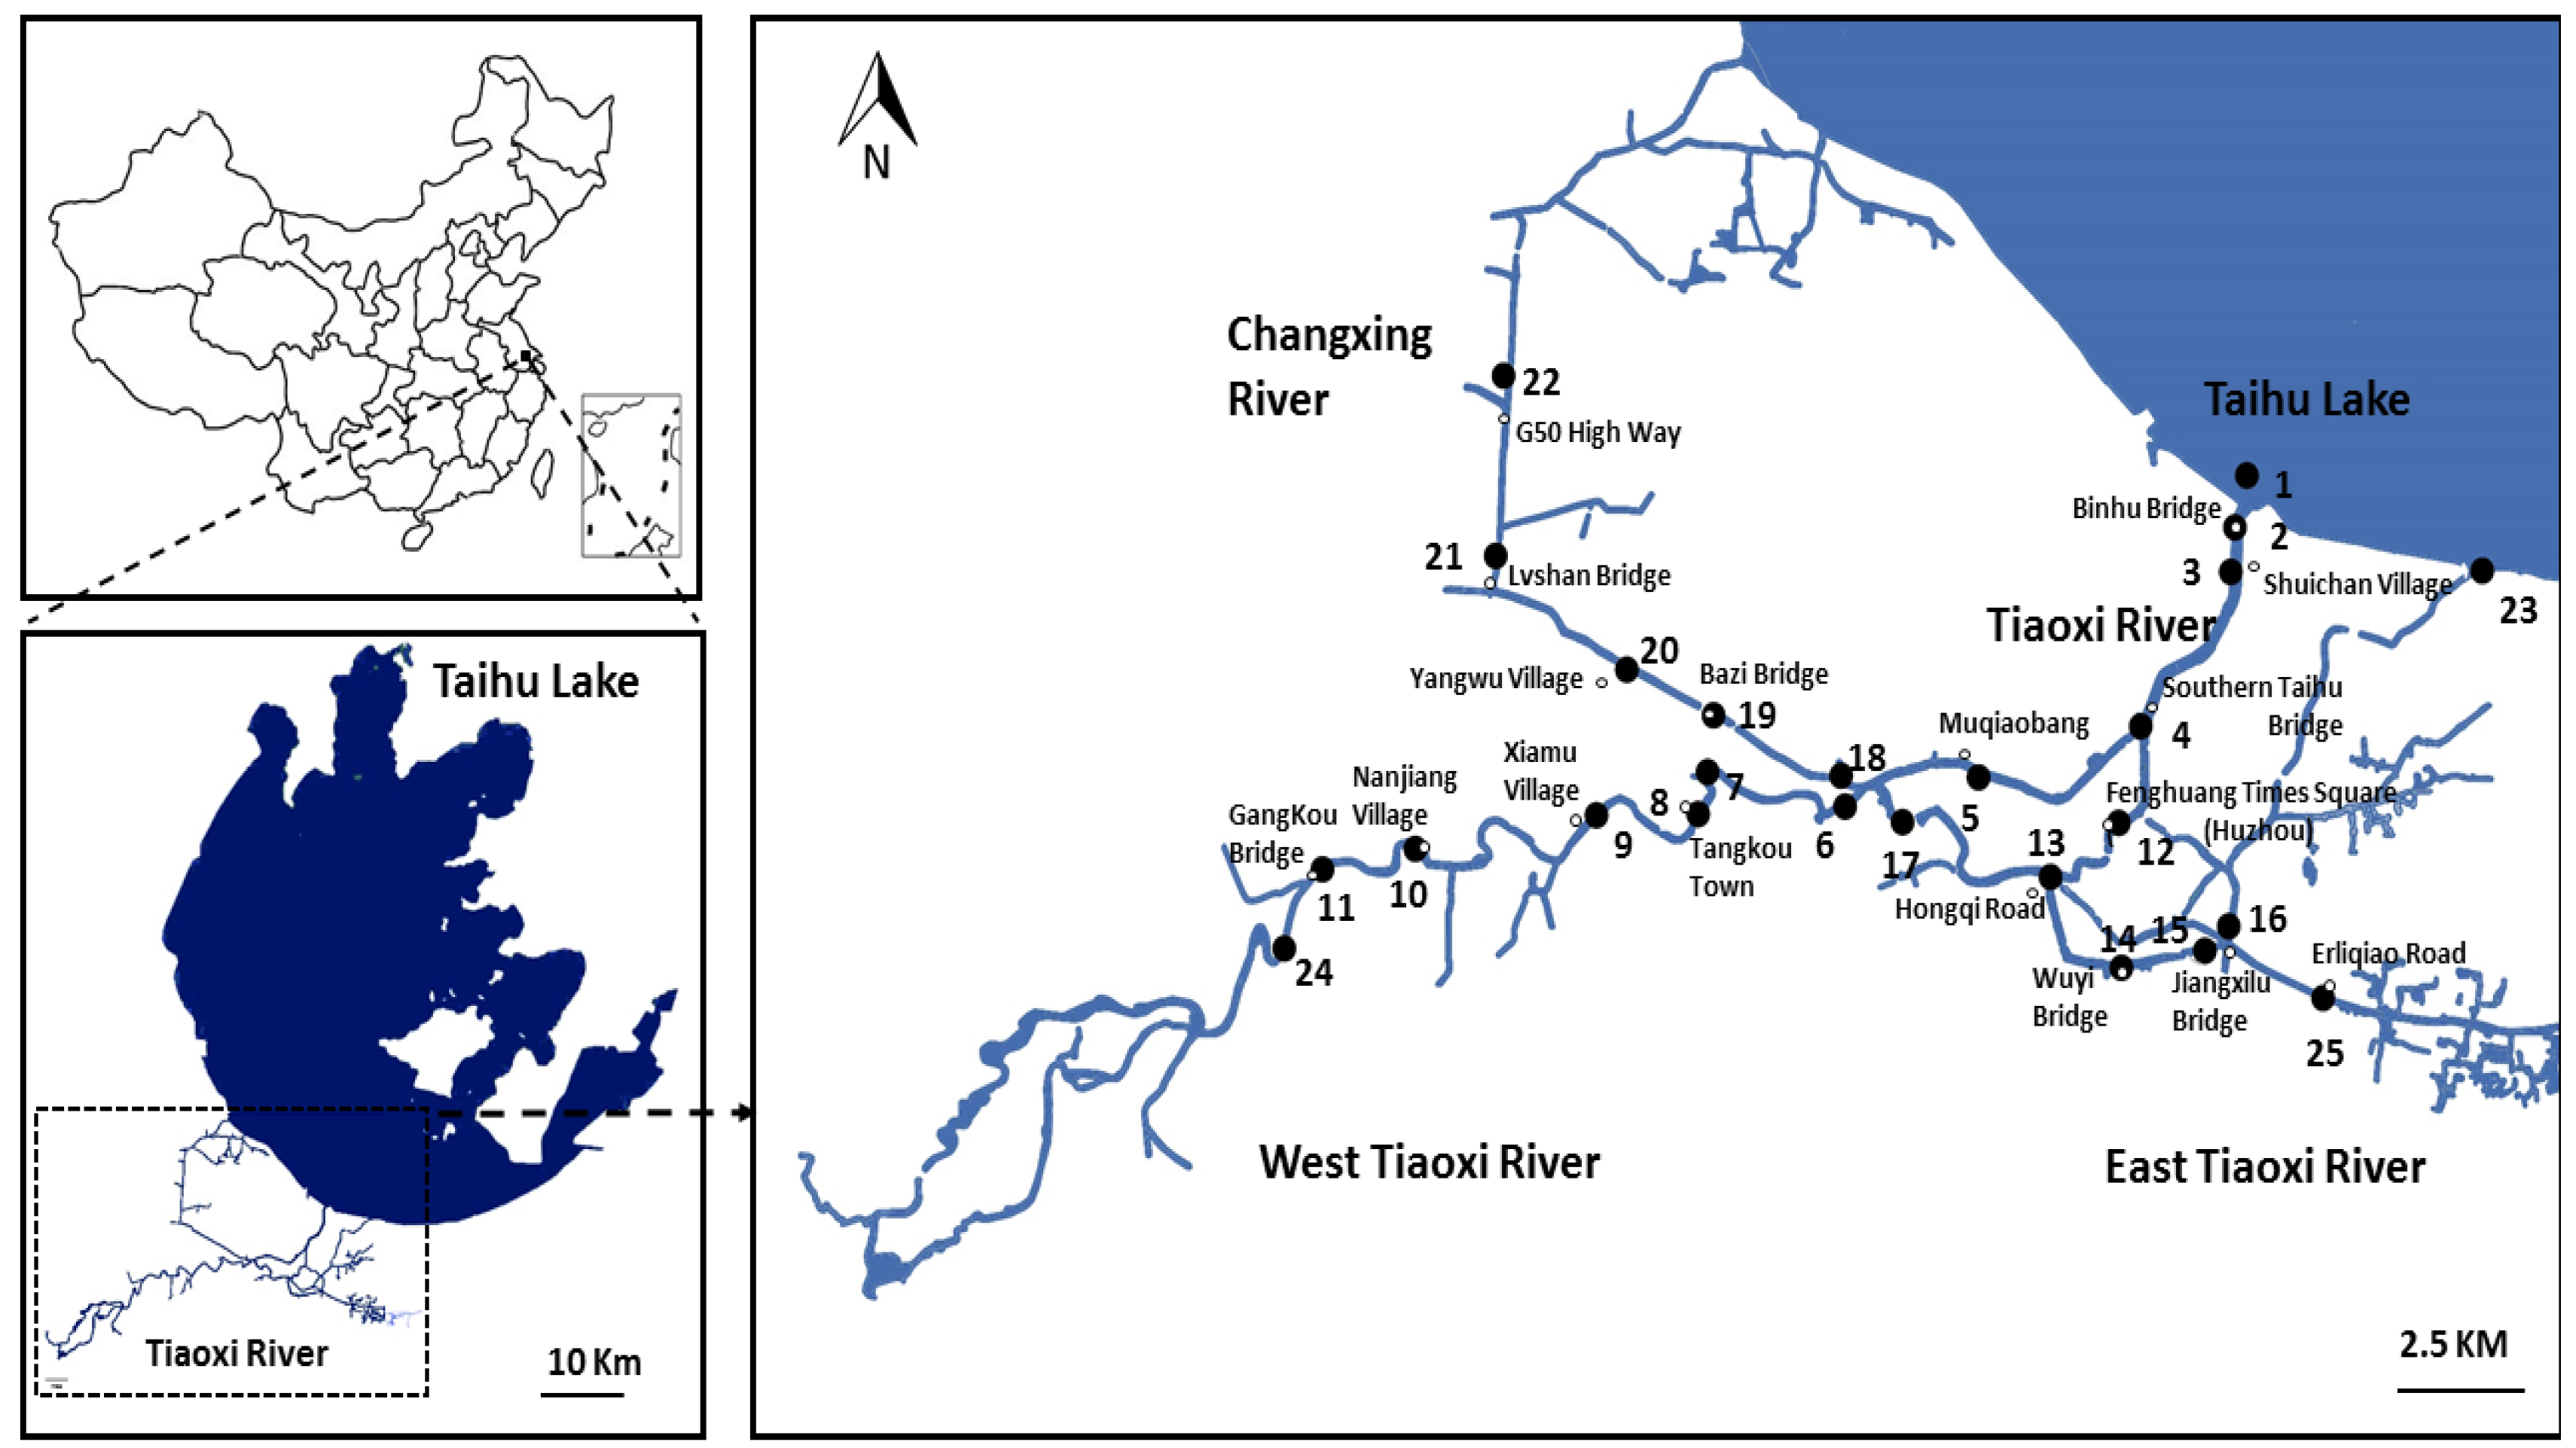
2.1. Study Area
2.2. Sampling Locations and Sample Collection
2.3. Physico-Chemical Parameters
2.4. Microbiological Parameters
2.5. Statistical Analyses
2.5.1. Cluster Analysis
2.5.2. Principal Component Analysis/Factor Analysis
3. Results and Discussion
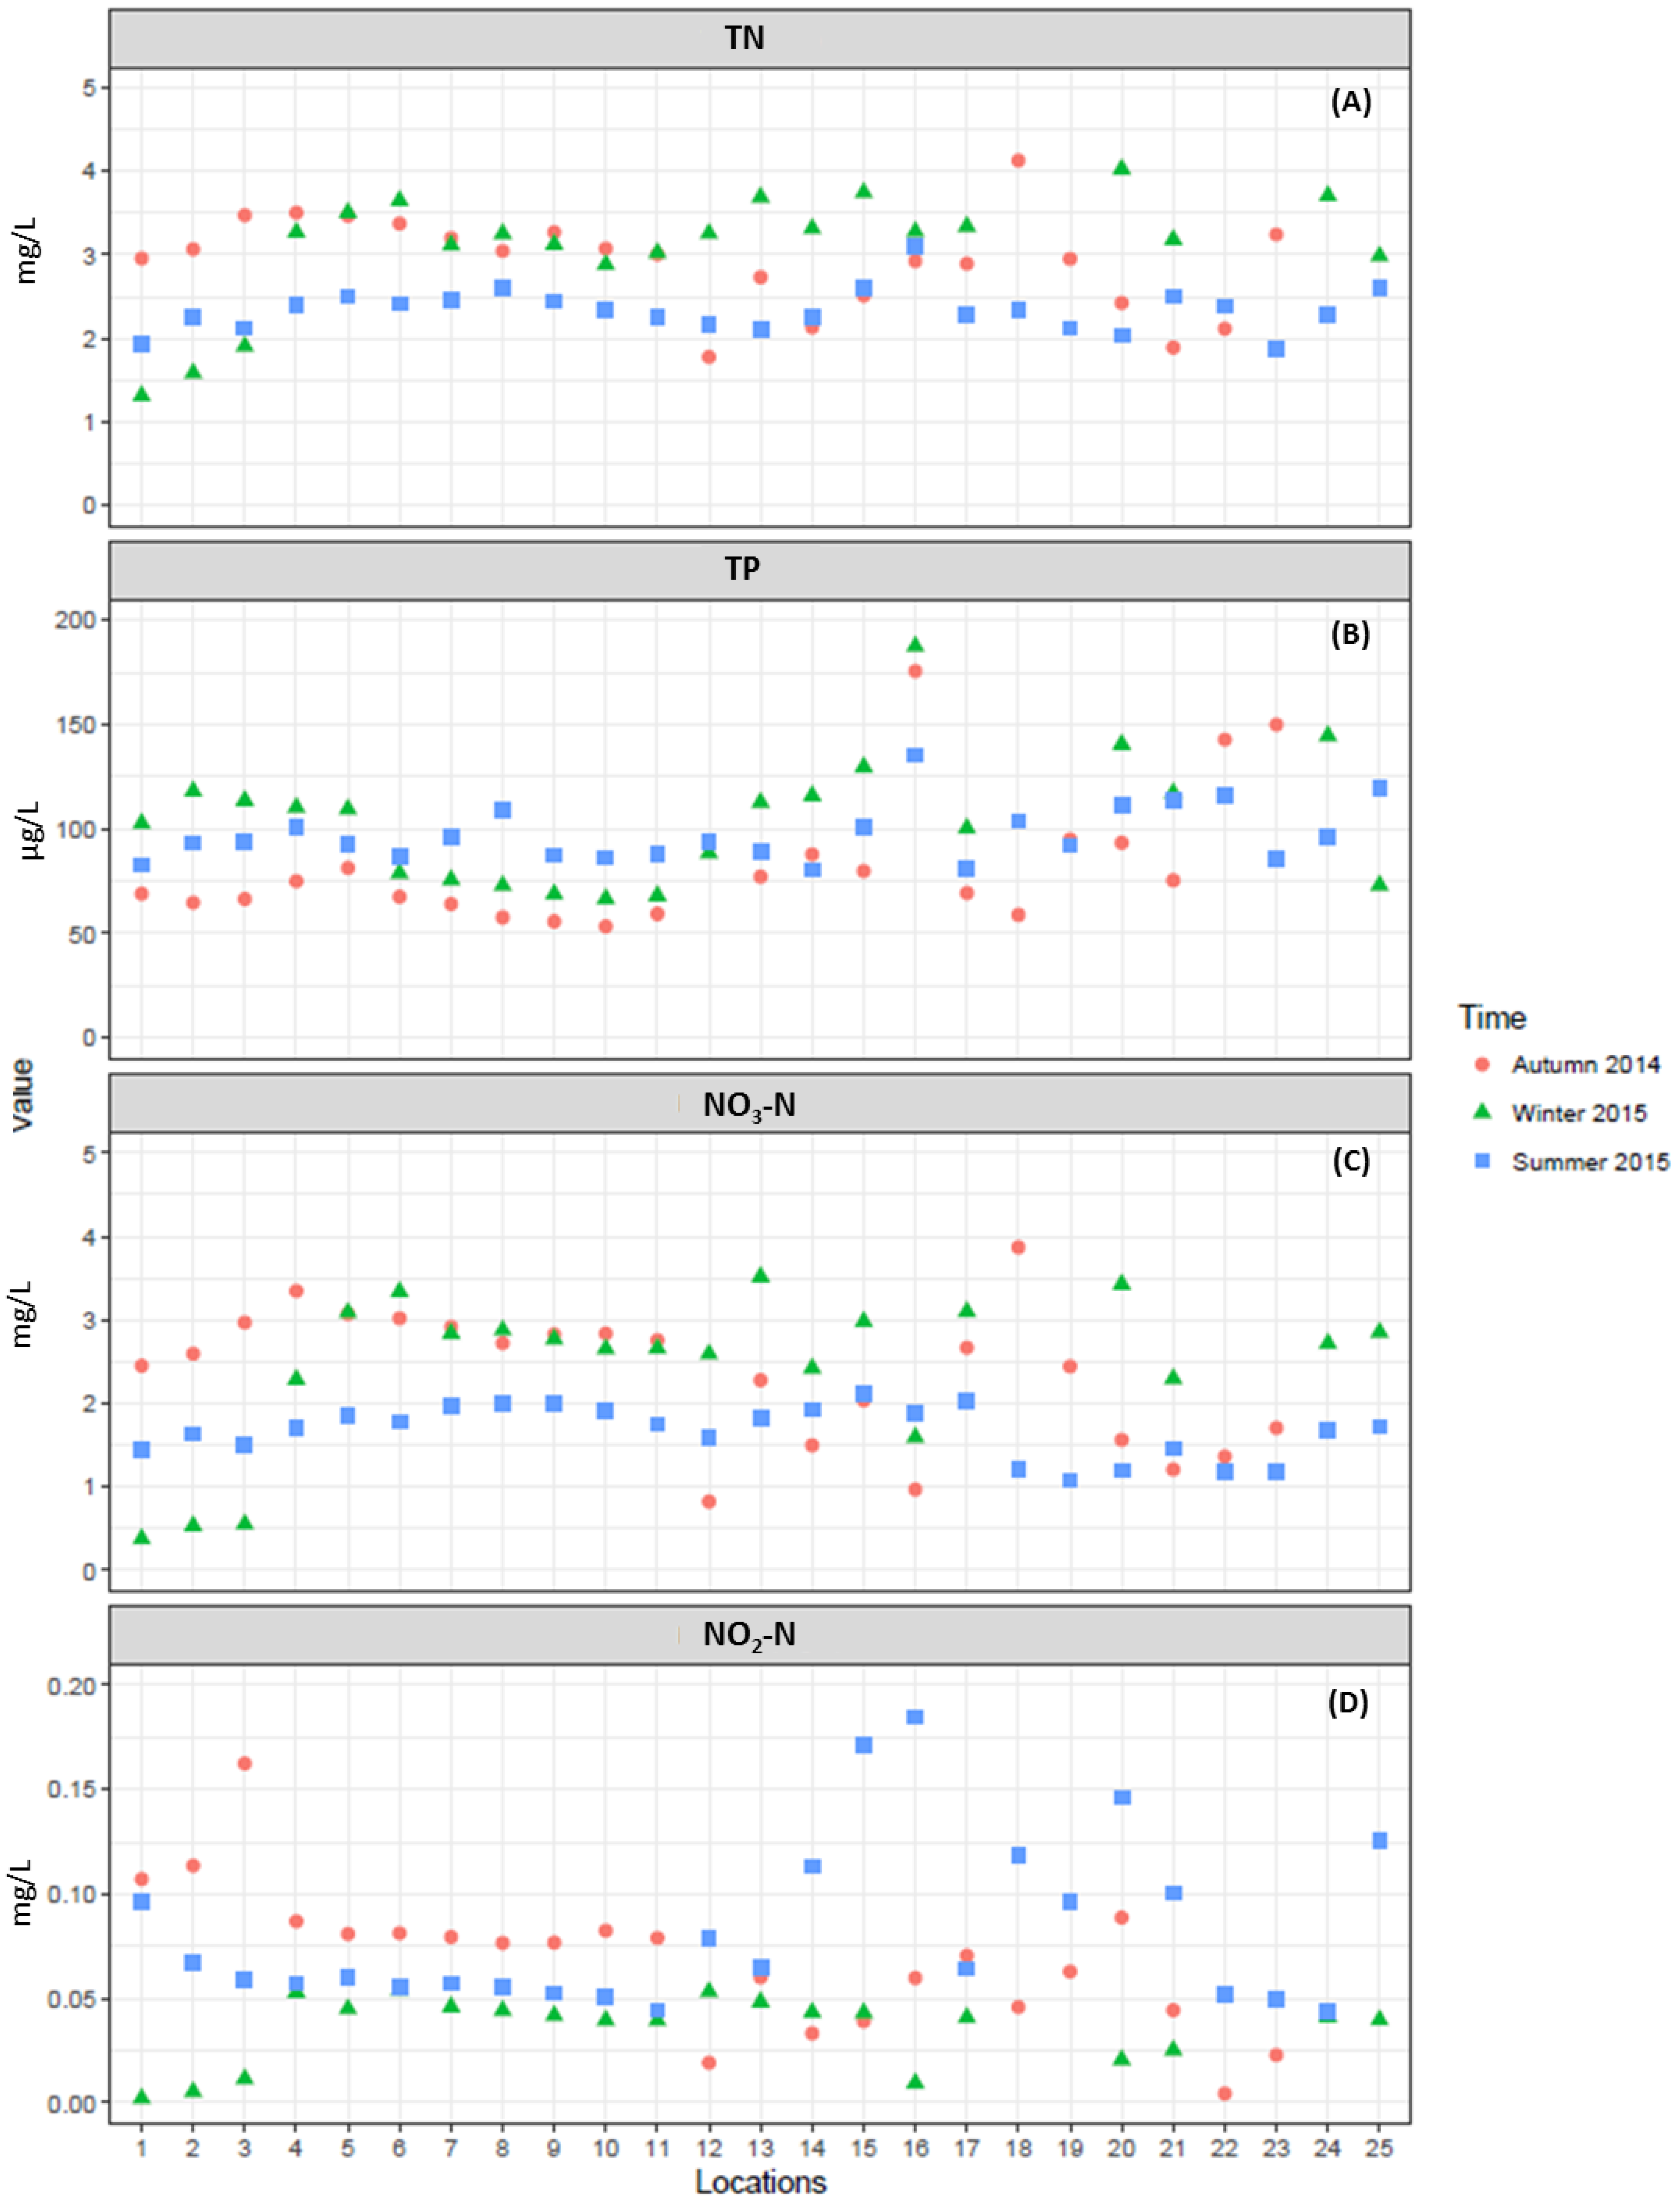
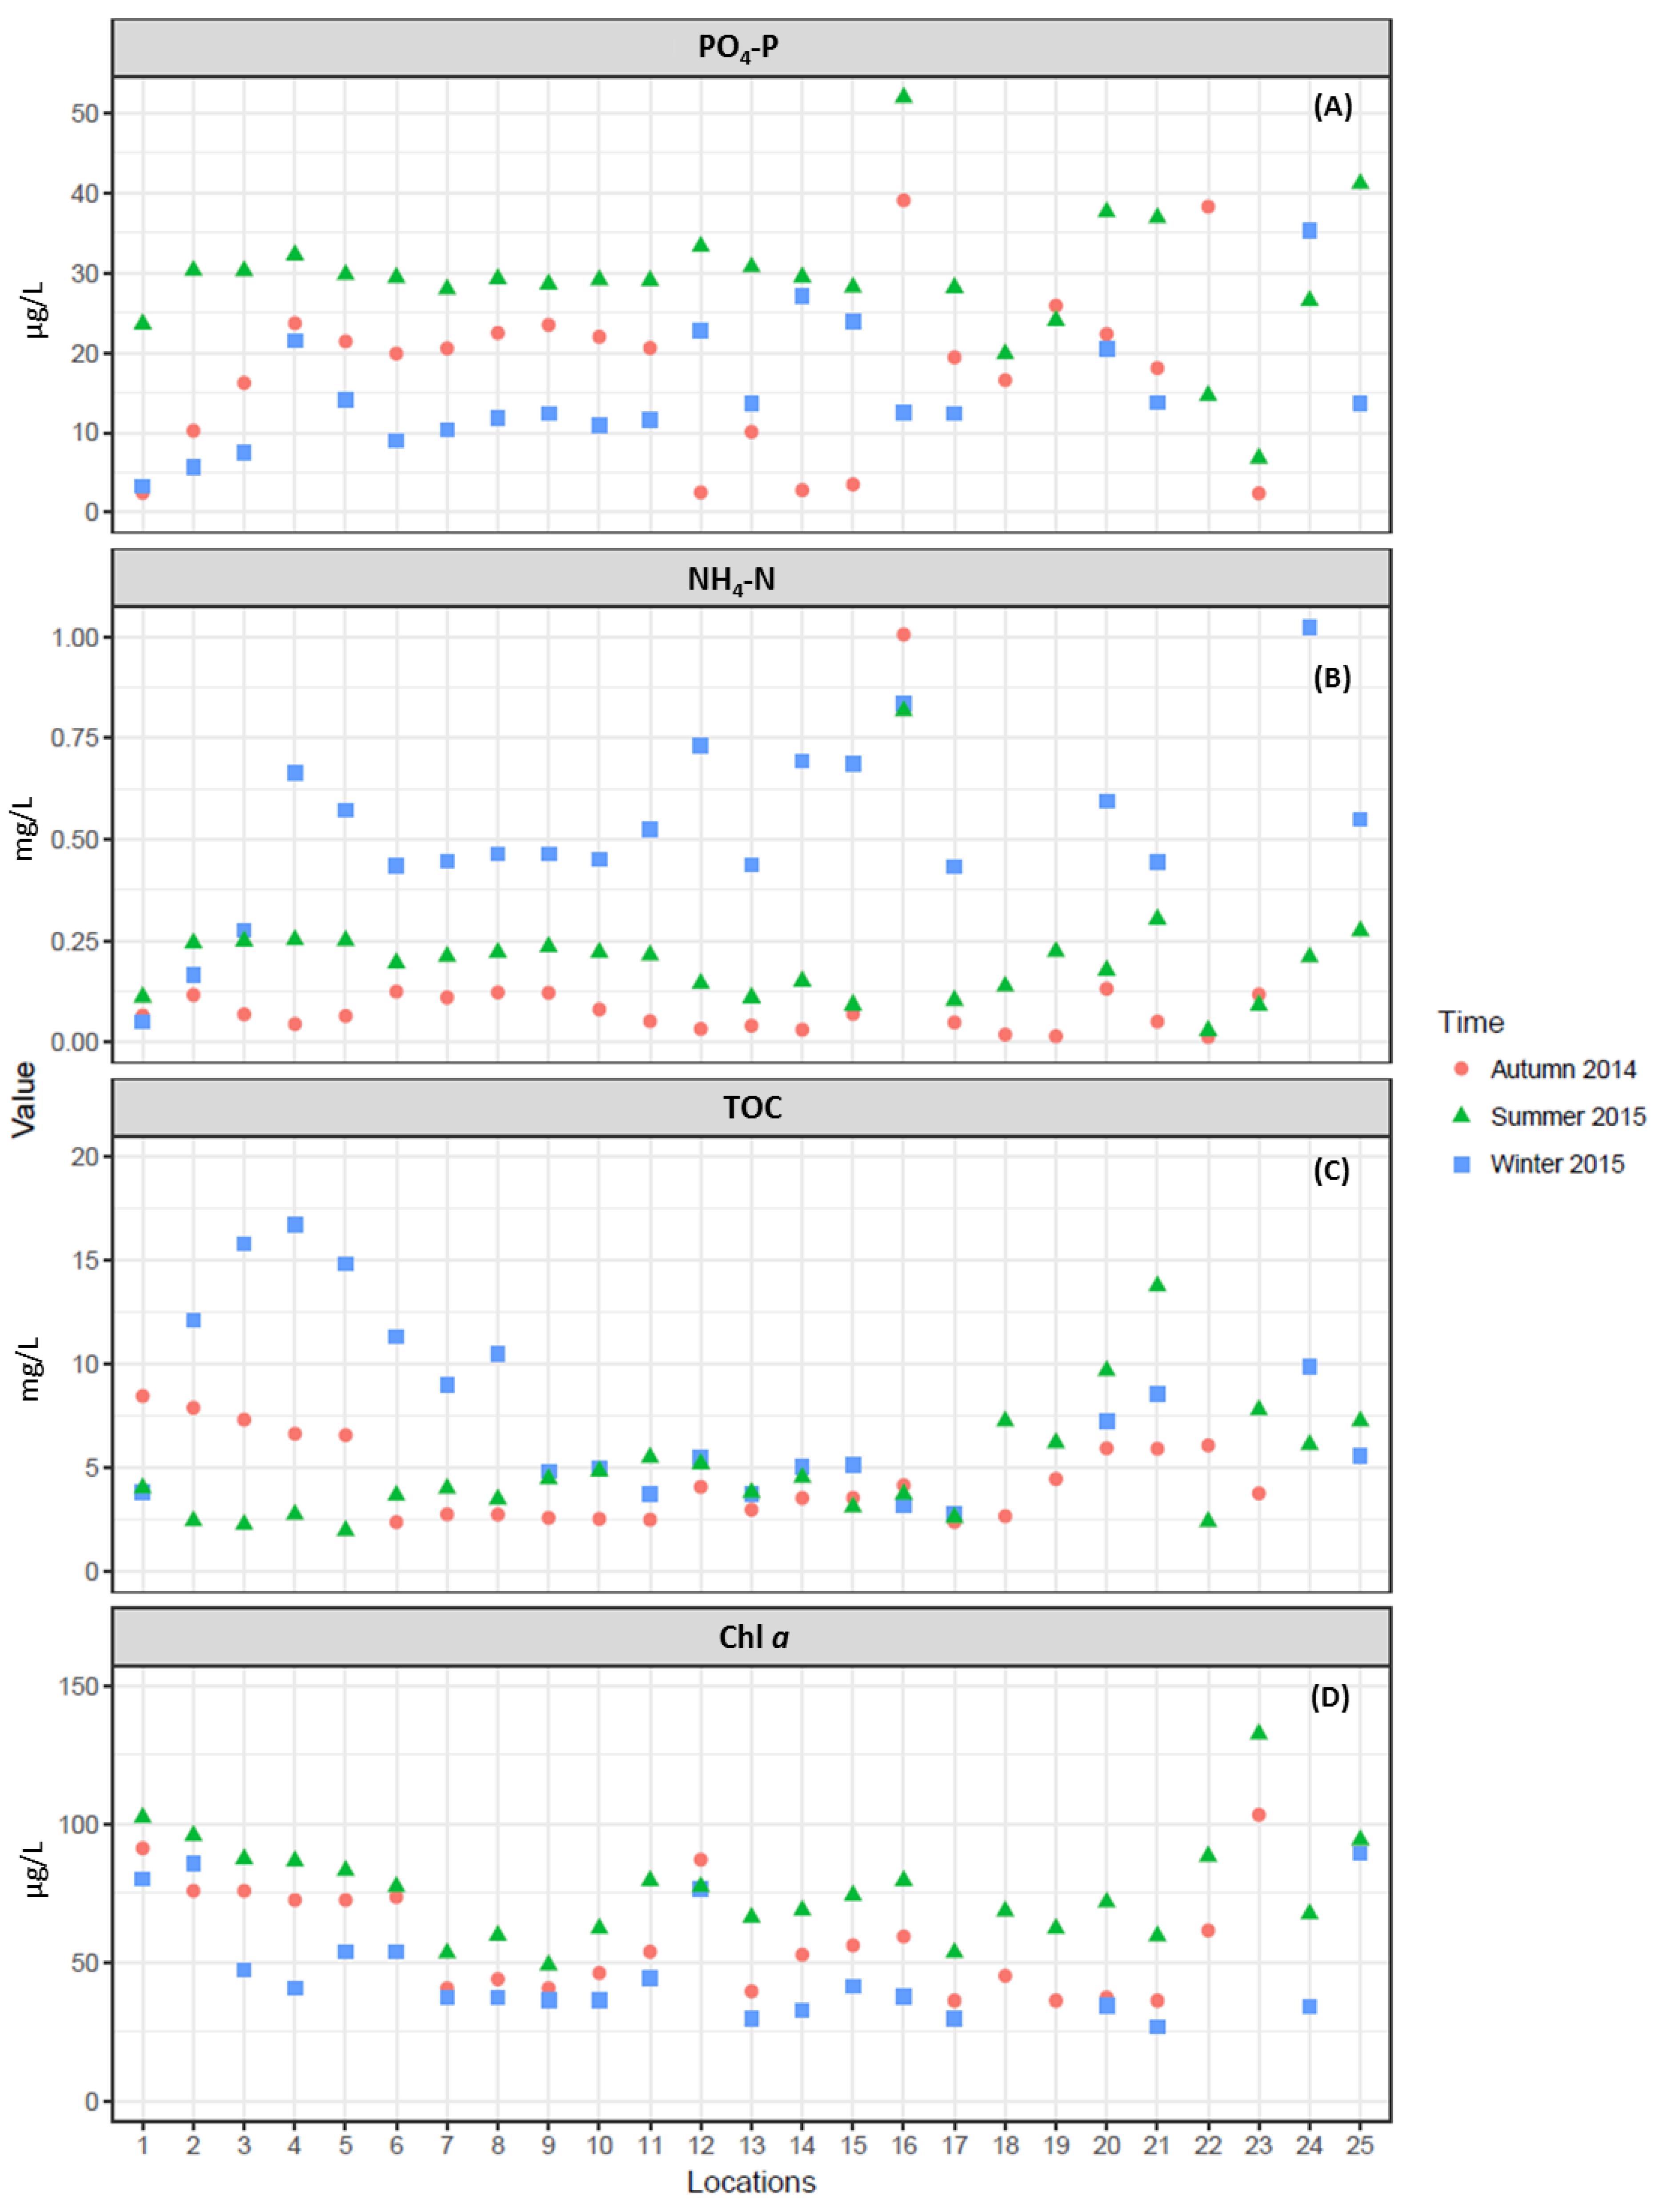
3.1. Physico-Chemical and Microbiological Parameters
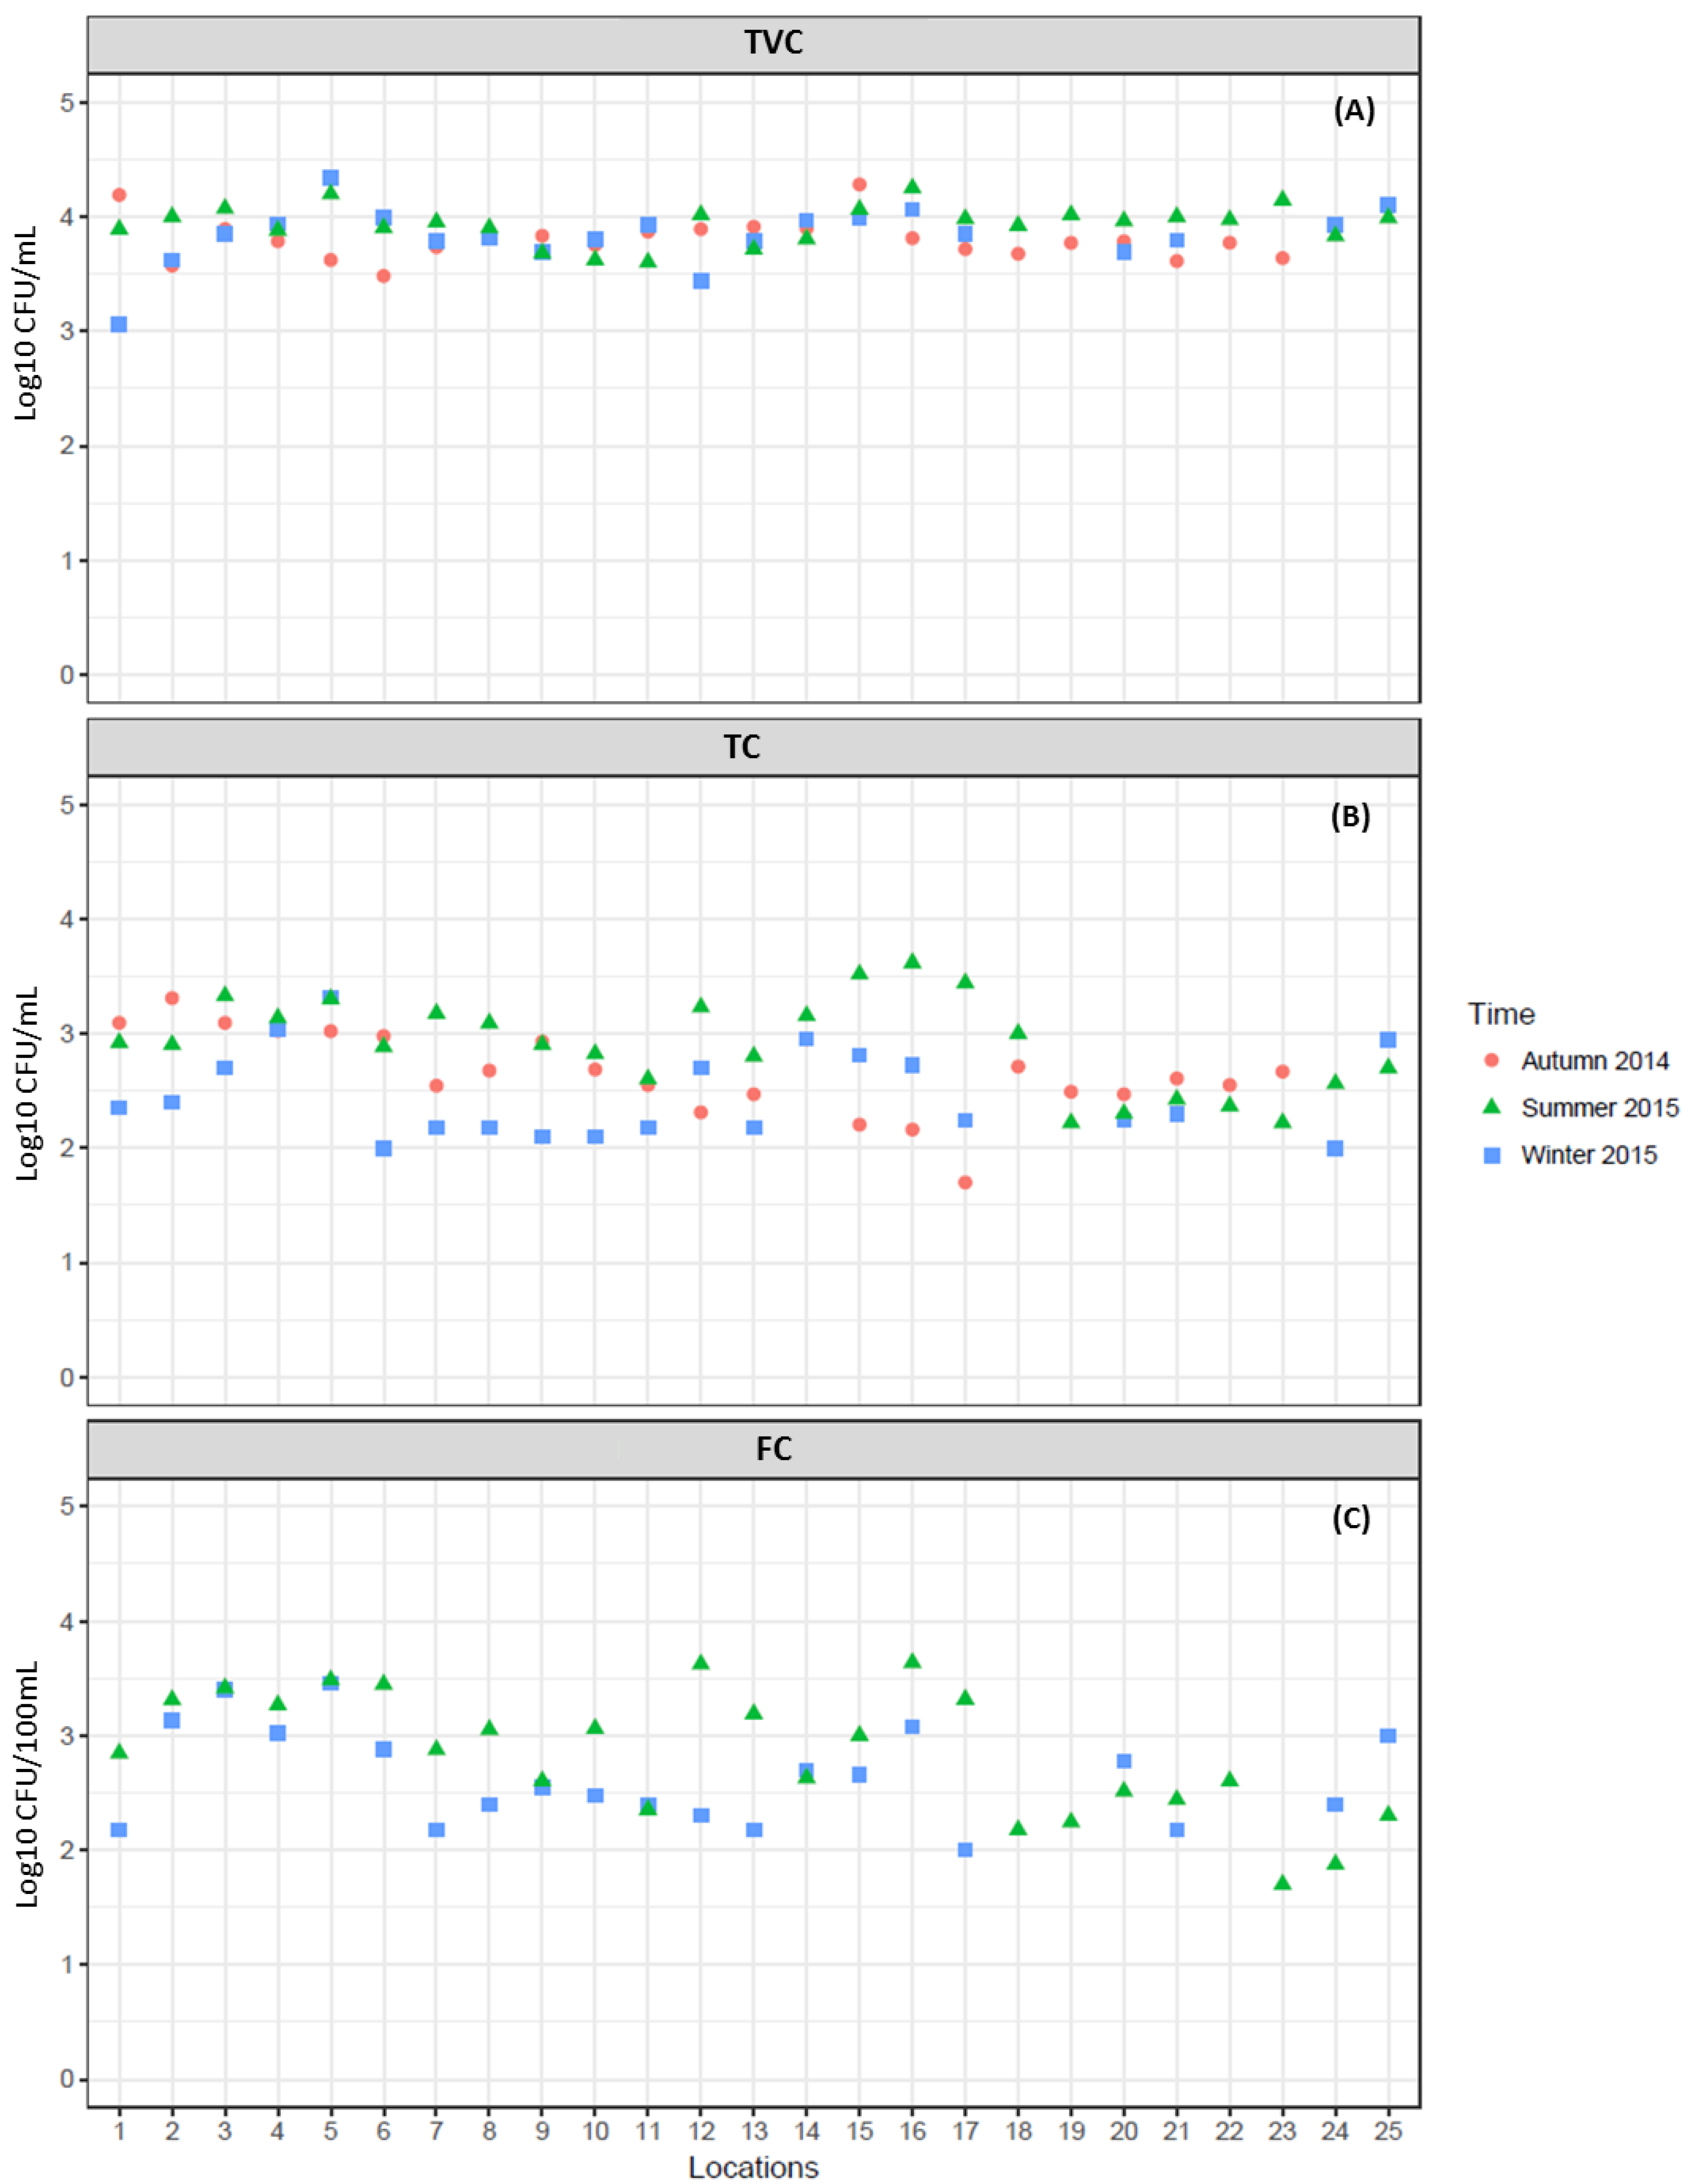
Microbiological Parameters
3.2. Correlation Between Variables
3.3. Cluster Analysis for Spatial Grouping
3.4. Principal Component Analysis/Factor Analysis for Source Identification
4. Conclusions
Supplementary Materials
Acknowledgments
Author Contributions
Conflicts of Interest
References
- Noori, R.; Sabahi, M.S.; Karbassi, A.R.; Baghvand, A.; Taati Zadeh, H. Multivariate statistical analysis of surface water quality based on correlations and variations in the data set. Desalination 2010, 260, 129–136. [Google Scholar] [CrossRef]
- Lodder, W.J.; van den Berg, H.H.; Rutjes, S.A.; de Roda Husman, A.M. Presence of enteric viruses in source waters for drinking water production in The Netherlands. Appl. Environ. Microbiol. 2010, 76, 5965–5971. [Google Scholar] [CrossRef] [PubMed]
- Ouyang, Y. Evaluation of river water quality monitoring stations by principal component analysis. Water Res. 2005, 39, 2621–2635. [Google Scholar] [CrossRef] [PubMed]
- Carroll, S.P.; Dawes, L.; Hargreaves, M.; Goonetilleke, A. Water Quality Profile of an Urbanising Catchment—Ningi Creek Catchment; Technical Report; School of Urban Development, Queensland University of Technology: Caboolture Shire Council, QLD, Australia, 2006; pp. 1–93. [Google Scholar]
- Nnane, D.E.; Ebdon, J.E.; Taylor, H.D. Integrated analysis of water quality parameters for cost-effective faecal pollution management in river catchments. Water Res. 2011, 45, 2235–2246. [Google Scholar] [CrossRef] [PubMed]
- Hill, M.K. Understanding Environmental Pollution, 3rd ed.; Cambridge University Press: Cambridge, UK, 2010. [Google Scholar]
- Bu, H.; Meng, W.; Zhang, Y. Spatial and seasonal characteristics of river water chemistry in the Taizi River in northeast China. Environ. Monit. Assess. 2014, 186, 3619–3632. [Google Scholar] [CrossRef] [PubMed]
- Razmkhah, H.; Abrishamchi, A.; Torkian, A. Evaluation of spatial and temporal variation in water quality by pattern recognition techniques: A case study on jajrood river (Tehran, Iran). J. Environ. Manag. 2010, 91, 852–860. [Google Scholar] [CrossRef] [PubMed]
- Li, S.; Li, J.; Zhang, Q. Water quality assessment in the rivers along the water conveyance system of the middle route of the south to north water transfer project (China) using multivariate statistical techniques and receptor modeling. J. Hazard. Mater. 2011, 195, 306–317. [Google Scholar] [CrossRef] [PubMed]
- Mei, K.; Liao, L.; Zhu, Y.; Lu, P.; Wang, Z.; Dahlgren, R.A.; Zhang, M. Evaluation of spatial-temporal variations and trends in surface water quality across a rural-suburban-urban interface. Environ. Sci. Pollut. Res. 2014, 21, 8036–8051. [Google Scholar] [CrossRef] [PubMed]
- Wang, X.; Cai, Q.; Ye, L.; Qu, X. Evaluation of spatial and temporal variation in stream water quality by multivariate statistical techniques: A case study of the xiangxi river basin, China. Quat. Int. 2012, 282, 137–144. [Google Scholar] [CrossRef]
- Shrestha, S.; Kazama, F. Assessment of surface water quality using multivariate statistical techniques: A case study of the fuji river basin, Japan. Environ. Model. Softw. 2007, 22, 464–475. [Google Scholar] [CrossRef]
- Singh, K.P.; Malik, A.; Sinha, S. Water quality assessment and apportionment of pollution sources of gomti river (india) using multivariate statistical techniques—A case study. Anal. Chim. Acta 2005, 538, 355–374. [Google Scholar] [CrossRef]
- Ogwueleka, T.C. Use of multivariate statistical techniques for the evaluation of temporal and spatial variations in water quality of the Kaduna River, Nigeria. Environ. Monit. Assess. 2015, 187, 137. [Google Scholar] [CrossRef] [PubMed]
- Sheikhy Narany, T.; Ramli, M.F.; Aris, A.Z.; Sulaiman, W.N.; Fakharian, K. Spatiotemporal variation of groundwater quality using integrated multivariate statistical and geostatistical approaches in Amol-Babol Plain, Iran. Environ. Monit. Assess. 2014, 186, 5797–5815. [Google Scholar] [CrossRef] [PubMed]
- Mustapha, A.; Aris, A.Z.; Juahir, H.; Ramli, M.F.; Kura, N.U. River water quality assessment using environmentric techniques: Case study of Jakara River Basin. Environ. Sci. Pollut. Res. Int. 2013, 20, 5630–5644. [Google Scholar] [CrossRef] [PubMed] [Green Version]
- Sharma, A.; Bora, C.R.; Shukla, V. Evaluation of seasonal changes in physico-chemical and bacteriological characteristics of water from the Narmada River (India) using multivariate analysis. Nat. Resour. Res. 2013, 22, 283–296. [Google Scholar] [CrossRef]
- Gatica, E.A.; Almeida, C.A.; Mallea, M.A.; Del Corigliano, M.C.; Gonzalez, P. Water quality assessment, by statistical analysis, on rural and urban areas of Chocancharava River (Río Cuarto), Córdoba, Argentina. Environ. Monit. Assess. 2012, 184, 7257–7274. [Google Scholar] [CrossRef] [PubMed]
- Chen, Y.; Zhao, K.; Wu, Y.; Gao, S.; Cao, W.; Bo, Y.; Shang, Z.; Wu, J.; Zhou, F. Spatio-temporal patterns and source identification of water pollution in Lake Taihu (China). Water 2016, 8, 86. [Google Scholar] [CrossRef]
- Qin, B.; Xu, P.; Wu, Q.; Luo, L.; Zhang, Y. Environmental issues of Lake Taihu, China. Hydrobiologia 2007, 581, 3–14. [Google Scholar] [CrossRef]
- Ackerman, D.; Weisberg, S.B. Relationship between rainfall and beach bacterial concentrations on Santa Monica Bay beaches. J. Water Health 2003, 1, 85–89. [Google Scholar] [PubMed]
- Wang, F.-E.; Tian, P.; Yu, J.; Lao, G.-M.; Shi, T.-C. Variations in pollutant fluxes of rivers surrounding Taihu Lake in Zhejiang Province in 2008. Phys. Chem. Earth Parts A/B/C 2011, 36, 366–371. [Google Scholar] [CrossRef]
- Du, C.; Li, Y.; Wang, Q.; Liu, G.; Zheng, Z.; Mu, M.; Li, Y. Tempo-spatial dynamics of water quality and its response to river flow in estuary of Taihu Lake based on GOCI imagery. Environ. Sci. Pollut. Res. Int. 2017, 24, 28079–28101. [Google Scholar] [CrossRef] [PubMed]
- Xu, S.; Huang, B.; Wei, Z.B.; Luo, J.; Miao, A.J.; Yang, L.Y. Seasonal variation of phytoplankton nutrient limitation in Lake Taihu, China: A monthly study from year 2011 to 2012. Ecotoxicol. Environ. Saf. 2013, 94, 190–196. [Google Scholar] [CrossRef] [PubMed]
- Liu, J.; Liang, X.; Yang, J.; Ye, Y.; Su, M.; Nie, Z.; Chen, Y. Size distribution and composition of phosphorus in the East Tiao River, China: The significant role of colloids. J. Environ. Monit. 2011, 13, 2844–2850. [Google Scholar] [CrossRef] [PubMed]
- Zhang, Y.; Shi, K.; Zhou, Y.; Liu, X.; Qin, B. Monitoring the river plume induced by heavy rainfall events in large, shallow, Lake Taihu using modis 250 m imagery. Remote Sens. Environ. 2016, 173, 109–121. [Google Scholar] [CrossRef]
- Wang, X.-l.; Lu, Y.-L.; Han, J.-Y.; He, G.-Z.; Wang, T.-Y. Identification of anthropogenic influences on water quality of rivers in Taihu watershed. J. Environ. Sci. 2007, 19, 475–481. [Google Scholar] [CrossRef]
- Hagedorn, C.; Liang, X. Current and future trends in fecal source tracking and deployment in the Lake Taihu region of China. Phys. Chem. Earth 2011, 36, 352–359. [Google Scholar] [CrossRef]
- Lv, H.; Xu, Y.; Han, L.; Zhou, F. Scale-dependence effects of landscape on seasonal water quality in Xitiaoxi catchment of Taihu Basin, China. Water Sci. Technol. 2015, 71, 59–66. [Google Scholar] [CrossRef] [PubMed]
- Tang, X.; Ullah, N.; Yu, C.; Qin, Z.; Huang, R.; Zhu, X.; Shen, C.; Chen, Y. Chemical and bioassay analysis of estrogen pollution in the surface water of the Tiaoxi river, the source river for Taihu Lake. Bull. Environ. Contam. Toxicol. 2012, 89, 816–819. [Google Scholar] [CrossRef] [PubMed]
- Zheng, J.; Gao, R.; Wei, Y.; Chen, T.; Fan, J.; Zhou, Z.; Makimilua, T.B.; Jiao, Y.; Chen, H. High-throughput profiling and analysis of antibiotic resistance genes in east Tiaoxi river, China. Environ. Pollut. 2017, 230, 648–654. [Google Scholar] [CrossRef] [PubMed]
- Ministry of Environmental Protection of the People’s Republic of China (MEP). Environmental Quality Standards for Surface Water; GB 3838-2002; MEP: Beijing, China, 2002.
- Wang, J.; Soininen, J.; Zhang, Y.; Wang, B.; Yang, X.; Shen, J. Contrasting patterns in elevational diversity between microorganisms and macroorganisms. J. Biogeogr. 2011, 38, 595–603. [Google Scholar] [CrossRef]
- APHA. Standard Methods for the Examination of Water and Wastewater, 21st ed.; American Public Health Association: Washington, DC, USA, 2005. [Google Scholar]
- Reasoner, D.J.; Geldreich, E.E. A new medium for the enumeration and subculture of bacteria from potable water. Appl. Environ. Microbiol. 1985, 49, 1–7. [Google Scholar] [PubMed]
- Baylis, C.L.; Patrick, M. Comparison of a Range of Chromogenic Media for Enumeration of Total Coliforms And E. coli in Foods; Leatherhead International Technical Notes, No. 135; Leatherhead Food Research Association: Epsom, UK, 1999. [Google Scholar]
- Kazi, T.G.; Arain, M.B.; Jamali, M.K.; Jalbani, N.; Afridi, H.I.; Sarfraz, R.A.; Baig, J.A.; Shah, A.Q. Assessment of water quality of polluted lake using multivariate statistical techniques: A case study. Ecotoxicol. Environ. Saf. 2009, 72, 301–309. [Google Scholar] [CrossRef] [PubMed]
- Alberto, W.D.; Pilar, D.M.D.; Valeria, A.; Fabiana, P.S.; Cecilia, H.A.; Angeles, B.M.D.L. Pattern recognition techniques for the evaluation of spatial and temporal variations in water quality. A case study: Suquia river basin (Cordoba–Argentina). Water Res. 2001, 35, 2881–2894. [Google Scholar] [CrossRef]
- Singh, K.P.; Malik, A.; Mohan, D.; Sinha, S. Multivariate statistical techniques for the evaluation of spatial and temporal variations in water quality of Gomti River (India)—A case study. Water Res. 2004, 38, 3980–3992. [Google Scholar] [CrossRef] [PubMed]
- Helena, B.; Pardom, R.; Vega, M.; Barrado, E.; Fernandez, J.M.; Fernandez, L. Temporal evolution of groundwater composition in an alluvial aquifer (Pisuerga River, Spain) by principal component analysis. Water Res. 2000, 34, 807–816. [Google Scholar] [CrossRef]
- Abdul-Wahab, S.A.; Bakheit, C.S.; Al-Alawi, S.M. Principal component and multiple regression analysis in modelling of ground-level ozone and factors affecting its concentrations. Environ. Model Softw. 2005, 20, 1263–1271. [Google Scholar] [CrossRef]
- Chapman, D. Water Quality Assessments—A Guide to Use of Biota, Sediments and Water in Environmental Monitoring; Cambridge University Press: Cambridge, UK, 1996. [Google Scholar]
- Pearce, G.R.; Ramzan Chaudhry, M.; Ghulam, S. A Simple Methodology for Water Quality Monitoring; Department for International Development, HR Wallingford: Wallingford, UK, 1999. [Google Scholar]
- United States Environmental Protection Agency (USEPA). Available online: http://water.epa.gov/type/rsl/monitoring/vms511.cfm (accessed on 17 January 2017).
- United States Environmental Protection Agency (USEPA). Total Nitrogen; USEPA Office of Water Office of Science and Technology: Washington, DC, USA, 2013.
- Farhadinejad, T.; Khakzad, A.; Jafari, M.; Shoaee, Z.; Khosrotehrani, K.; Nobari, R.; Shahrokhi, V. The study of environmental effects of chemical fertilizers and domestic sewage on water quality of Taft region, Central Iran. Arab. J. Geosci. 2012, 7, 221–229. [Google Scholar] [CrossRef]
- Yan, C.A.; Zhang, W.; Zhang, Z.; Liu, Y.; Deng, C.; Nie, N. Assessment of water quality and identification of polluted risky regions based on field observations & GIS in the honghe river watershed, China. PLoS ONE 2015, 10, e0119130. [Google Scholar] [CrossRef]
- Lucassen, E.C.H.E.T.; Smolders, A.J.P.; Vander Salm, A.L.; Roelofs, J.G.M. High groundwater nitrate concentrations inhibit eutrophication of sulphate-rich freshwater Wetlands. Biogeochemistry 2004, 67, 249–267. [Google Scholar] [CrossRef]
- Fewtrell, L. Drinking-water nitrate, methemoglobinemia, and global burden of disease: A discussion. Environ. Health Perspect. 2004, 112, 1371–1374. [Google Scholar] [CrossRef] [PubMed]
- United States Environmental Protection Agency (USEPA). Aquatic Life Ambient Water Quality Criteria for Ammonia—Freshwater; United States Environmental Protection Agency Office of Water Office of Science and Technology: Washington, DC, USA, 2013.
- Xu, H.; Yang, L.-Z.; Zhao, G.-M.; Jiao, J.-G.; Yin, S.-X.; Liu, Z.-P. Anthropogenic impact on surface water quality in Taihu Lake region, China. Pedosphere 2009, 19, 765–778. [Google Scholar] [CrossRef]
- Shock, C.C.; Pratt, K. Phosphorus effects on surface water quality and phosphorus TMDL development. In Proceedings of the Western Nutrient Management Conference, Salt Lake City, UT, USA, 6–7 March 2003; pp. 211–220. [Google Scholar]
- Xu, H.; Paerl, H.W.; Qin, B.; Zhu, G.; Gaoa, G. Nitrogen and phosphorus inputs control phytoplankton growth in eutrophic Lake Taihu, China. Limnol. Oceanogr. 2010, 55, 420–432. [Google Scholar] [CrossRef]
- U.S. Congress. Beaches Environmental Assessment and Coastal Health Act (BEACH Act). Stat. 870-877, Public Law 106-284. In Proceedings of the 106th U.S. Congress, Washington, DC, USA, 2000. [Google Scholar]
- Pisciotta, J.M.; Rath, D.F.; Stanek, P.A.; Flanery, D.M.; Harwood, V.J. Marine bacteria cause false-positive results in the colilert-18 rapid identification test for escherichia coli in florida waters. Appl. Environ. Microbiol. 2002, 68, 539–544. [Google Scholar] [CrossRef] [PubMed]
- Schriewer, A.; Miller, W.A.; Byrne, B.A.; Miller, M.A.; Oates, S.; Conrad, P.A.; Hardin, D.; Yang, H.H.; Chouicha, N.; Melli, A.; et al. Presence of bacteroidales as a predictor of pathogens in surface waters of the Central California Coast. Appl. Environ. Microbiol. 2010, 76, 5802–5814. [Google Scholar] [CrossRef] [PubMed]
- Haller, L.; Amedegnato, E.; Poté, J.; Wildi, W. Influence of freshwater sediment characteristics on persistence of fecal indicator bacteria. Water Air Soil Pollut. 2009, 203, 217–227. [Google Scholar] [CrossRef]
- Muirhead, R.W.; Davies-Colley, R.J.; Donnison, A.M.; Nagels, J.W. Faecal bacteria yields in artificial flood events: Quantifying in-stream stores. Water Res. 2004, 38, 1215–1224. [Google Scholar] [CrossRef] [PubMed]
- Heaney, C.D.; Myers, K.; Wing, S.; Hall, D.; Baron, D.; Stewart, J.R. Source tracking swine fecal waste in surface water proximal to swine concentrated animal feeding operations. Sci. Total Environ. 2015, 511, 676–683. [Google Scholar] [CrossRef] [PubMed]
- Vieira, J.S.; Pires, J.C.M.; Martins, F.G.; Vilar, V.J.P.; Boaventura, R.A.R.; Botelho, C.M.S. Surface water quality assessment of Lis river using multivariate statistical methods. Water Air Soil Pollut. 2012, 223, 5549–5561. [Google Scholar] [CrossRef]
- Pejman, A.H.; Nabi Bidhendi, G.R.; Karbassi, A.R.; Mehrdadi, N.; Bidhendi, M.E. Evaluation of spatial and seasonal variations in surface water quality using multivariate statistical techniques. Int. J. Environ. Sci. Technol. 2009, 6, 467–476. [Google Scholar] [CrossRef]
- Phung, D.; Huang, C.; Rutherford, S.; Dwirahmadi, F.; Chu, C.; Wang, X.; Nguyen, M.; Nguyen, N.H.; Do, C.M.; Nguyen, T.H.; et al. Temporal and spatial assessment of river surface water quality using multivariate statistical techniques: A study in Can Tho City, a Mekong Delta area, Vietnam. Environ. Monit. Assess. 2015, 187, 229. [Google Scholar] [CrossRef] [PubMed]
- Liu, C.-W.; Lin, K.-H.; Kuo, Y.-M. Application of factor analysis in the assessment of groundwater quality in a blackfoot disease area in Taiwan. Sci. Total Environ. 2003, 313, 77–89. [Google Scholar] [CrossRef]
- Ruzdjak, A.M.; Ruzdjak, D. Evaluation of river water quality variations using multivariate statistical techniques: Sava river (croatia): A case study. Environ. Monit. Assess. 2015, 187, 215. [Google Scholar] [CrossRef] [PubMed]


| Sampling Location | Description of Location and Land Use Types | Coordinates | |
|---|---|---|---|
| Latitude | Longitude | ||
| 1 | Taihu Lake and Tiaoxi River junction; 1 km inside the Taihu Lake; Aquaculture/fishing area. | N30°57′3.15″ | E120°07′42.64″ |
| 2 | Suburban area with aquaculture and fish handling/processing area. | N30°56′25.30″ | E120°07′35.72″ |
| 3 | Fishermen’s village; People live on boats stationed at this location. | N30°55′57.65″ | E120°07′37.27″ |
| 4 | Suburban area with residential apartments, businesses, and parks; East and West Tiaoxi River junction near south Taihu bridge. | N30°53′50.96″ | E120°06′0.95″ |
| 5 | Urban area with construction sites and various factories; Heavy ferry transportation was noticed in this area. | N30°53′19.40″ | E120°03′18.16″ |
| 6 | Suburban and industrial area with various factories; West Tiaoxi River and Changxing River junction. | N30°52′55.15″ | E120°0′58.87″ |
| 7 | Residential, farming, and small industrial area close to a village; Various farm animals in small scale were noticed at the river bank. | N30°53′14.16″ | E119°58′38.58″ |
| 8 | Close to a town with businesses and residences; Ferry/boat docking area. | N30°53′1.82″ | E119°58′48.08″ |
| 9 | Rural agricultural area with sparse residential apartments. | N30°52′43.41″ | E119°56′43.37″ |
| 10 | Rural agriculture area with few industries (e.g., shipping industries and oil station); Heavy ferry transportation was noticed in this area. | N30°52′21.55″ | E119°53′55.85″ |
| 11 | Rural with high number of residential apartments; Heavy ferry transportation was noticed in this area. | N30°52′8.11″ | E119°52′15.52″ |
| 12 | Urban area with businesses (e.g., many shopping malls) and residential apartments; Tourist boats docked close to this location. | N30°52′54.56″ | E120°06′1.47″ |
| 13 | Urban area with residential apartments and construction sites; Second junction between West and East Tiaoxi River. | N30°51′56.74″ | E120°04′25.11″ |
| 14 | Suburban area with construction sites, residential apartments, and businesses; Ferry docking (large scale) area. | N30°50′53.74″ | E120°05′38.57″ |
| 15 | Suburban area with residential apartments and businesses; Junction between East Tiaoxi River and a small river which connects to Taihu Lake; Sampled close to ferry docking (large scale) area. | N30°50′59.27″ | E120°06′21.50″ |
| 16 | Suburban and residential/business area; Junction between the main river and a canal which connects to Taihu Lake. | N30°51′27.75″ | E120°07′32.13″ |
| 17 | Suburban and sparse residential area; Sampled at third junction between West and East Tiaoxi River. | N30°52′40.51″ | E120°01′58.88″ |
| 18 | Suburban and industrial area; Sampled in the junction of Changxing and Tiaoxi River; Sampled near ferry docking station. | N30°53′11.17″ | E120°0′52.95″ |
| 19 | Rural/village, sparse residential and industrial area. | N30°54′2.88″ | E119°58′42.16″ |
| 20 | Rural/village and sparse residential/industrial area. | N30°54′33.91″ | E119°57′31.34″ |
| 21 | Rural/village, residential and sparse industrial area. | N30°55′52.05″ | E119°55′9.61″ |
| 22 | Rural/village and industrial area; Heavy ferry transportation; Sampled close to a factory and ferry docking station. | N30°57′45.22″ | E119°55′19.98″ |
| 23 | Rural/village area; Sampled in a small canal which connects to Taihu Lake. | N30°55′53.87″ | E120°11′35.48″ |
| 24 | Rural/village and sparse residential /industrial area. | N30°51′0.12″ | E119°51′28.68″ |
| 25 | Suburban area with businesses and industries; Many small rivers branch off from East Tiaoxi River. | N30°50′45.36″ | E120°08′21.54″ |
| Parameters | Acceptable Range (by MEP) | Range (Minimum–Maximum) | p value | |||
|---|---|---|---|---|---|---|
| Autumn 2014 | Winter 2015 | Summer 2015 | Season | Spatial | ||
| WT (°C) | - | 22.8–26.6 | 6–8.8 | 27.2–30.8 | 0.0001 * | 0.712 |
| pH | 6.5–8.5 | 7.2–8 | 7.4–7.9 | 7.3–7.9 | 0.112 * | 0.4546 |
| EC (µS/cm) | - | 153–400 | 164–356 | 124–234 | 0.0102 * | 0.6564 |
| TN (mg/L) | ≤1 mg/L | 1.78–4.13 | 1.3–4.03 | 1.88–3.11 | 0.5209 | 0.0001 *** |
| TP (mg/L) | ≤1 mg/L (≤0.05 ª) | 0.07–0.18 | 0.07–0.19 | 0.08–0.14 | 0.0001 *** | 0.0001 *** |
| NO3–N (mg/L) | ≤10 mg/L | 0.84–3.43 | 0.376–3.39 | 1.07–2.02 | 0.2464 | 0.0220 * |
| NO2–N (mg/L) | ≤0.15 mg/L | 0.02–0.16 | 0.002–0.05 | 0.04–0.18 | 0.9987 | 0.0011 ** |
| PO4–P (µg/L) | - | 2.4–38.2 | 3.2–35.24 | 6.8–51.9 | 0.1324 | 0.0001 *** |
| NH4–N (mg/L) | ≤1 mg/L | 0.013–1 | 0.05–1.025 | 0.02–0.81 | 0.0001 *** | 0.0001 *** |
| TOC (mg/L) | - | 2.38–8.46 | 14.9–268.9 | 1.9–13.7 | 0.2929 | 0.0083 ** |
| Chl a (µg/L) | - | 36.3–103.4 | 29.8–89.3 | 49.1–132.6 | 0.0001 *** | 0.0001 *** |
| TVC (Log10 CFU/mL) | - | 3.57–4.28 | 3.06–4.34 | 3.60–4.19 | 0.3078 | 0.2454 |
| TC (Log10 CFU/mL) | 1 | 1.60–3.30 | 2.0–3.31 | 2.22–3.61 | 0.328 | 0.0025 ** |
| FC (Log10 CFU/100 mL) | - | 2.0–3.45 | 1.69–3.62 | - | 0.0055 ** | |
| Parameters | WT | pH | EC | TN | TP | NO3−N | NO2−N | PO4−P | NH4−N | TOC | Chl a | TVC | TC |
|---|---|---|---|---|---|---|---|---|---|---|---|---|---|
| WT | 1 | ||||||||||||
| pH | 0.03 | 1 | |||||||||||
| EC | 0.22 | 0.80 ** | 1 | ||||||||||
| TN | −0.15 | −0.35 | −0.35 | 1 | |||||||||
| TP | 0.17 | 0.74 ** | 0.78 ** | 0.08 | 1 | ||||||||
| NO3−N | −0.16 | −0.61 ** | −0.73 ** | 0.65 ** | 0.45 * | 1 | |||||||
| NO2−N | 0.34 | 0.16 | 0.46 * | 0.23 | 0.54 * | −0.24 | 1 | ||||||
| PO4−P | 0.27 | 0.06 | −0.02 | 0.49 * | 0.28 | 0.10 | −0.01 | 1 | |||||
| NH4−N | −0.17 | 0.25 | 0.23 | 0.45 * | 0.53 * | −0.08 | 0.16 | 0.73 ** | 1 | ||||
| TOC | 0.57 * | −0.15 | 0.24 | −0.08 | 0.21 | −0.16 | 0.23 | 0.15 | 0.12 | 1 | |||
| Chl a | −0.02 | 0.06 | 0.33 | −0.23 | 0.12 | −0.41 | 0.34 | −0.37 | 0.01 | 0.33 | 1 | ||
| TVC | 0.09 | 0.29 | 0.30 | 0.27 | 0.50 * | −0.13 | 0.59 ** | 0.01 | 0.32 | 0.125 | 0.37 | 1 | |
| TC | −0.03 | 0.18 | 0.19 | 0.24 | 0.36 | −0.12 | 0.50 * | −0.11 | 0.25 | 0.037 | 0.47 * | 0.80 ** | 1 |
| Parameters | Components | |||
|---|---|---|---|---|
| VF1 | VF2 | VF3 | VF4 | |
| WT | 0.134 | 0.121 | −0.173 | 0.857 |
| pH | 0.911 | 0.131 | −0.003 | −0.160 |
| EC | 0.926 | −0.086 | 0.182 | 0.207 |
| TN | −0.474 | 0.837 | 0.181 | −0.056 |
| TP | 0.755 | 0.443 | 0.393 | 0.172 |
| NO3−N | −0.808 | 0.388 | −0.123 | −0.195 |
| NO2−N | 0.385 | 0.279 | 0.495 | 0.392 |
| PO4−P | 0.088 | 0.938 | −0.024 | 0.127 |
| NH4−N | 0.175 | 0.866 | 0.195 | −0.076 |
| TOC | 0.013 | −0.170 | 0.114 | 0.861 |
| Chl a | 0.145 | −0.602 | 0.589 | 0.168 |
| TVC | 0.183 | 0.183 | 0.848 | 0.010 |
| TC | 0.030 | −0.030 | 0.885 | −0.140 |
| Eigenvalue | 4.186 | 3.297 | 1.843 | 1.567 |
| % Total variance | 32.197 | 25.365 | 14.174 | 12.054 |
| Cumulative % variance | 32.197 | 57.562 | 71.735 | 83.786 |
© 2018 by the authors. Licensee MDPI, Basel, Switzerland. This article is an open access article distributed under the terms and conditions of the Creative Commons Attribution (CC BY) license (http://creativecommons.org/licenses/by/4.0/).
Share and Cite
Vadde, K.K.; Wang, J.; Cao, L.; Yuan, T.; McCarthy, A.J.; Sekar, R. Assessment of Water Quality and Identification of Pollution Risk Locations in Tiaoxi River (Taihu Watershed), China. Water 2018, 10, 183. https://doi.org/10.3390/w10020183
Vadde KK, Wang J, Cao L, Yuan T, McCarthy AJ, Sekar R. Assessment of Water Quality and Identification of Pollution Risk Locations in Tiaoxi River (Taihu Watershed), China. Water. 2018; 10(2):183. https://doi.org/10.3390/w10020183
Chicago/Turabian StyleVadde, Kiran Kumar, Jianjun Wang, Long Cao, Tianma Yuan, Alan J. McCarthy, and Raju Sekar. 2018. "Assessment of Water Quality and Identification of Pollution Risk Locations in Tiaoxi River (Taihu Watershed), China" Water 10, no. 2: 183. https://doi.org/10.3390/w10020183
APA StyleVadde, K. K., Wang, J., Cao, L., Yuan, T., McCarthy, A. J., & Sekar, R. (2018). Assessment of Water Quality and Identification of Pollution Risk Locations in Tiaoxi River (Taihu Watershed), China. Water, 10(2), 183. https://doi.org/10.3390/w10020183