1. Introduction
Dams, considered to be “structures of public utility,” play an essential role in controlling and harvesting benefits from floods and always pose potential risks to human life and property on their downstream side in the event of flood [
1,
2,
3]. According to the International Commission on Large Dams (ICOLD), overtopping causes about 35% of all earth dam failures, seepage, and piping, while other causes make up the rest, and floods are the driving forces in dam overtopping [
4]. Dam floods are highly vulnerable and particularly devastating in high mountain areas, since a lack of basic data limits our understanding of the complex hydrology of mountain areas generally [
5,
6]. Although particularly complex, dam flood risk evaluation can provide a rational basis for risk management, the importance of which has increasingly been recognized by both academic researchers and managers [
7]. It is usually performed with applying statistical methods or sophisticated mathematical models; however, for situations in which data is lacking, improvements or replacements are necessary to provide reliable results faster.
Many efforts have also been made to analyze the flood risk of dam structures. Various studies have proposed procedures to assess the total risk of dams. There are two main approaches to quantitatively analyzing dam overtopping caused by flood: probabilistic risk analysis and indicator-based risk analysis. While the probability estimation relies on large samples of historical data, the indicator-based method solves the non-linear problems inherent to risk assessment in a complex manner. ICOLD’s and Bureau’s methods can deal with these problems [
8,
9,
10,
11,
12,
13,
14,
15]. The wildly known method recommended by ICOLD quickly rates total risk and evaluates the seismic hazard of a dam site and the risk rating of the structure separately [
8]. The method was developed by Bureau, who combined these two factors to define the total risk factor (TRF) and established the type of dam as an important parameter impacting the TRF [
9,
16]. The method was subsequently applied to dams in South Carolina and neighboring states [
10], and to the Euphrates Basin in Turkey [
11]. According to Bureau’s method, the total risk rating is based on the capacity of the reservoir, the height of the dam, the evacuation requirements, and the potential downstream damages [
12].
In the study, we propose a method for flood risk analysis of large dams by extending ICOLD’s and Bureau’s TRF concepts, which can be used to rate the total risk of each evaluated dam quickly by evaluating the hazard of the dam site, the risk rating of flood vulnerability, and the downstream potential risk and by assigning the risk classes of each dam in terms of TRFs.
2. Methods
The original TRF method for earthquake risk analysis is expressed as [
8,
9,
10,
11,
12,
13,
14,
15]
This equation contains three components of the dam structure, the downstream risk, and the seismic vulnerability rating. These three components are quantified by the sum of capacity risk factor (CRF), height risk factor (HRF), and age risk factor (ARF), the downstream hazard factor (DHF) based on population and property at risk, and the predicted damage factor (PDF) based on the dam type and the site-specific seismic hazard, respectively.
All of the various factors shown in Equation (1) and their weighting points have been defined in [
8,
9].
Equation (1) was originally for seismic risk analysis. To use it for dam total risk analysis under flood hazards, the following modifications of each mentioned component were necessary.
(1) Structure influence, still expressed as CRF + HRF + ARF, quantifies the risk of a dam and its reservoir. The modification is to re-define CRF and HRF, shown in
Table 1, which makes the factors more suitable for the dam sizes and reservoir capacities encountered in China and indicates that high dams or large reservoirs can release significant uncontrolled outflows in case of dam failure and expose extensive downstream areas to potential flooding [
10]. ARF defined in
Table 2 expresses that old dams are often more vulnerable than modern dams because of a possible deterioration, a lack of maintenance, the use of obsolete modes of construction (concrete masonry or hydraulic fill), insufficient compaction, reservoir siltation, or insufficient foundation treatment [
9].
(2) Downstream risk is based on the population and property at risk and re-defined as
which is modified from the original expression in Equation (3).
It should be noted that the downstream evacuation requirement factor (ERF) and the downstream damage risk index (DRI) depend on the human population at risk and on the value of private, commercial, industrial, or government property in the potential flood path, respectively, and must be obtained from a combination of detailed dam breach, inundation mapping, and economic studies, which is hard to achieve for many study areas. When it is not cost-effective to obtain the ERF and DRI from detailed studies, the downstream hazard potential rating of the National Inventory of Dams (NID) can be used to obtain a substitute value of the DHF. However, the relevant information is equally difficult to obtain. Therefore, in this study, in order to effectively apply the research data and related information from detailed studies and describe the downstream hazard situation under the effect of flood disaster, the definition of DHF is modified as the downstream socioeconomic situation and re-expressed as Equation (2), where the two brand-new risk factors PD and GD are population density factor and gross domestic product (GDP) density, respectively, and are defined in
Table 3. PD illustrates the degree of social development in the region and depends on the human population at risk. A highly populated district is usually highly vulnerable and may suffer from flood disasters. GD is based on the value of private, commercial, industrial, or government property in the potential flood path and shows the level of economic development in the region. The higher the GD is, the greater the vulnerability is.
(3) Flood vulnerability rating, modified from the seismic vulnerability rating and defined by the PDF, is expressed as the summation of the damage rating factor (DRF) and the flood zoning factor (FZF), which is a function of the local site flood hazard and dam performance:
where DRF is the damage rating factor, and FZF is the flood zoning factor. Due to the type-difference of natural hazards acting on the dam site, it is totally different from the original expression in Equation (5):
where the coefficient 2.5 is empirically selected by Bureau and Ballentine to provide consistency between vulnerability estimates obtained from site-specific ground motion estimates defined by the earthquake severity index (ESI) [
16], which is a function of peak ground acceleration (PGA) and earthquake magnitude (M):
The predicted damage index (PDI) depends on the ESI at each dam site, for each postulated earthquake scenario, and is obtained from dam vulnerability curves developed by Bureau and Ballentine [
16]. The seismic characteristic parameters, PGA and M, as the principle components for calculating ESI, describe a certain seismic scenario, are inapplicable, and need to be substituted for a flood scenario. Moreover, the vulnerability curves require detailed site-specific geologic, geotechnical, and seismic response studies, are intended only to be applied to a large family of dams, and help identify the potentially most critical facilities in regional studies. Therefore, for the flood vulnerability rating, the PDF depends on the characteristic parameters of each postulated flood scenario. Bureau mentioned that, for some cases, without such vulnerability estimations, a combination of a dam type factor and a seismic zone factor can be used to define the PDF [
9]. Similarly, for flood risk analysis, we define the FZF, which is a suitable factor of the local flood exposure for each postulated flood scenario. The FZF can be used to approximately quantify the flood hazard in the form of site hazard classes and quickly compare various sites. There are several steps to obtain the FZF:
(1) Estimating the probable maximum precipitation (PMP), which is the greatest precipitation depth for a given storm duration in a particular area. For flood risk analysis of the dam site in the basin, extreme flood is mainly caused by heavy rainfall, and the flood characteristics are different according to changes in heavy rainfall scenarios. Therefore, taking the PMP as a calculation basis is to analyze the flood hazard problem from the perspective of risk source. Accurate estimations of the PMP are very helpful in minimizing the risk of overtopping dam collapse. It was mainly calculated by the meteorological and statistical methods. Recently, a satellite providing unprecedented precipitation information brings new opportunities for PMP estimation [
17]. Furthermore, PMP estimation is clearly conditioned by data availability, especially in mountain areas [
18]. Indirect methods have increasingly become an alternative, wherein paleohydrology [
19], which is also applied to modern floods, allowing us to compare the accuracy of different approaches [
20], can be combined with a regional analysis of contemporary extreme rainfall and flood data to complement a site-specific PMP study [
18,
21]. Since the 1950s, PMP estimation methods have been greatly developed with advances in hydro-meteorological techniques, and the method applied in this study was the same as that described in [
22], with the main assumption that the PMP will result from a storm in which there is an optimum combination of available moisture in the atmosphere and “efficiency” of the storm mechanism [
23]. The main steps of estimating PMP include [
21,
22]:
Calculation of the representative perceptible water, which is done by estimating the surface dew points. To ensure dew points observed at stations at different elevations are comparable, both storm and maximum dew points should be reduced pseudo-adiabatically to the 1000 hPa level, which permits the construction and use of tables showing atmospheric moisture as a function of the 1000 hPa dew points.
Moisture adjustments. Maximum values of atmospheric water vapor used for storm maximization are usually estimated from the maximum average 24 h 1000 hPa dew points. These dew points are generally obtained from surveys of records from over a long period of time, say 50 or more years, at several stations in the study area.
Moisture maximization. To obtain the PMP, the rainfall depths are adjusted using a moisture maximization factor (MMF); the representative perceptible water is simply multiplied by the MMF, where MNF is the ratio of the maximum perceptible water over 24 h (W
24m) to the representative perceptible water (W
24), i.e.,
where
is the representative perceptible water for a particular duration, and PMP is the probable maximum precipitation of the same duration.
(2) Transforming PMP into the corresponding probable maximum flood (PMF). The PMF leads to the largest amount of water flowing downstream to the reservoir. The PMF hydrographs, simulated by enlarging the typical flood hydrograph based on corresponding peak flows, represent the peak flow process resulting from the most severe combination of meteorological and hydrological conditions considered feasible for the basin.
(3) Reservoir routing, used to denote the propagation of an inflow hydrograph through a reservoir [
24], which depends on the PMF hydrographs, discharge curves, storage curves, and specific operation rules of each reservoir. The main objective of dam overtopping analysis is estimating the highest water level (HWL) of a reservoir under various inflows and comparing the result with the elevation of the dam crest. Many methods have been developed to determine the highest water level of reservoir for a flood event, including the Saint-Venant equations, the Muskingum method, and the graphical method. From a practical viewpoint, it is desirable to simplify the shape of the inflow flood hydrograph and the reservoir routing calculation procedure, as illustrated in the next paragraph. Therefore, the basic and simple model based on mass balance equation is applied [
25]. Further refinement can be made for better accuracy, if required, by using more complicated routing methods [
26]. For a given time interval, the difference volume between inflow and outflow equals to the change of storage. The basic form of this equation can be written as [
4,
27]
where
t is a time interval;
and
are the average rates of inflow and outflow of the reservoir during the time interval, respectively;
is the change in volume of storage during the time interval.
The treatment of reservoir routing in this module is based on the assumption that both the outflow and the storage depend only on the water level in the reservoir. The discrete form of the above equation can be written as
where
is the time at the beginning of the interval;
is the time at the end of the interval;
and
are inflow rates at
and
;
and
are outflow rates at
and
;
and
are the storage volumes at
and
.
The hydrograph of the water profile in the reservoir and the maximum height of the water could be estimated by solving Equation (8) step by step. The time interval Δt determines the length of each step in the reservoir routing equation, and precision of the output is increased by decreasing Δt. In this study, a time interval of 3h was selected. Furthermore, the fourth order Runge–Kutta was applied to solve the reservoir routing.
(4) Determining the HWL of the reservoir. Reservoir routing results are combined with the reservoir discharge curve to obtain the HWLs, which can be seen as characteristic parameters of the flood scenario and plays a key role in judging whether a dam will perform satisfactorily or not.
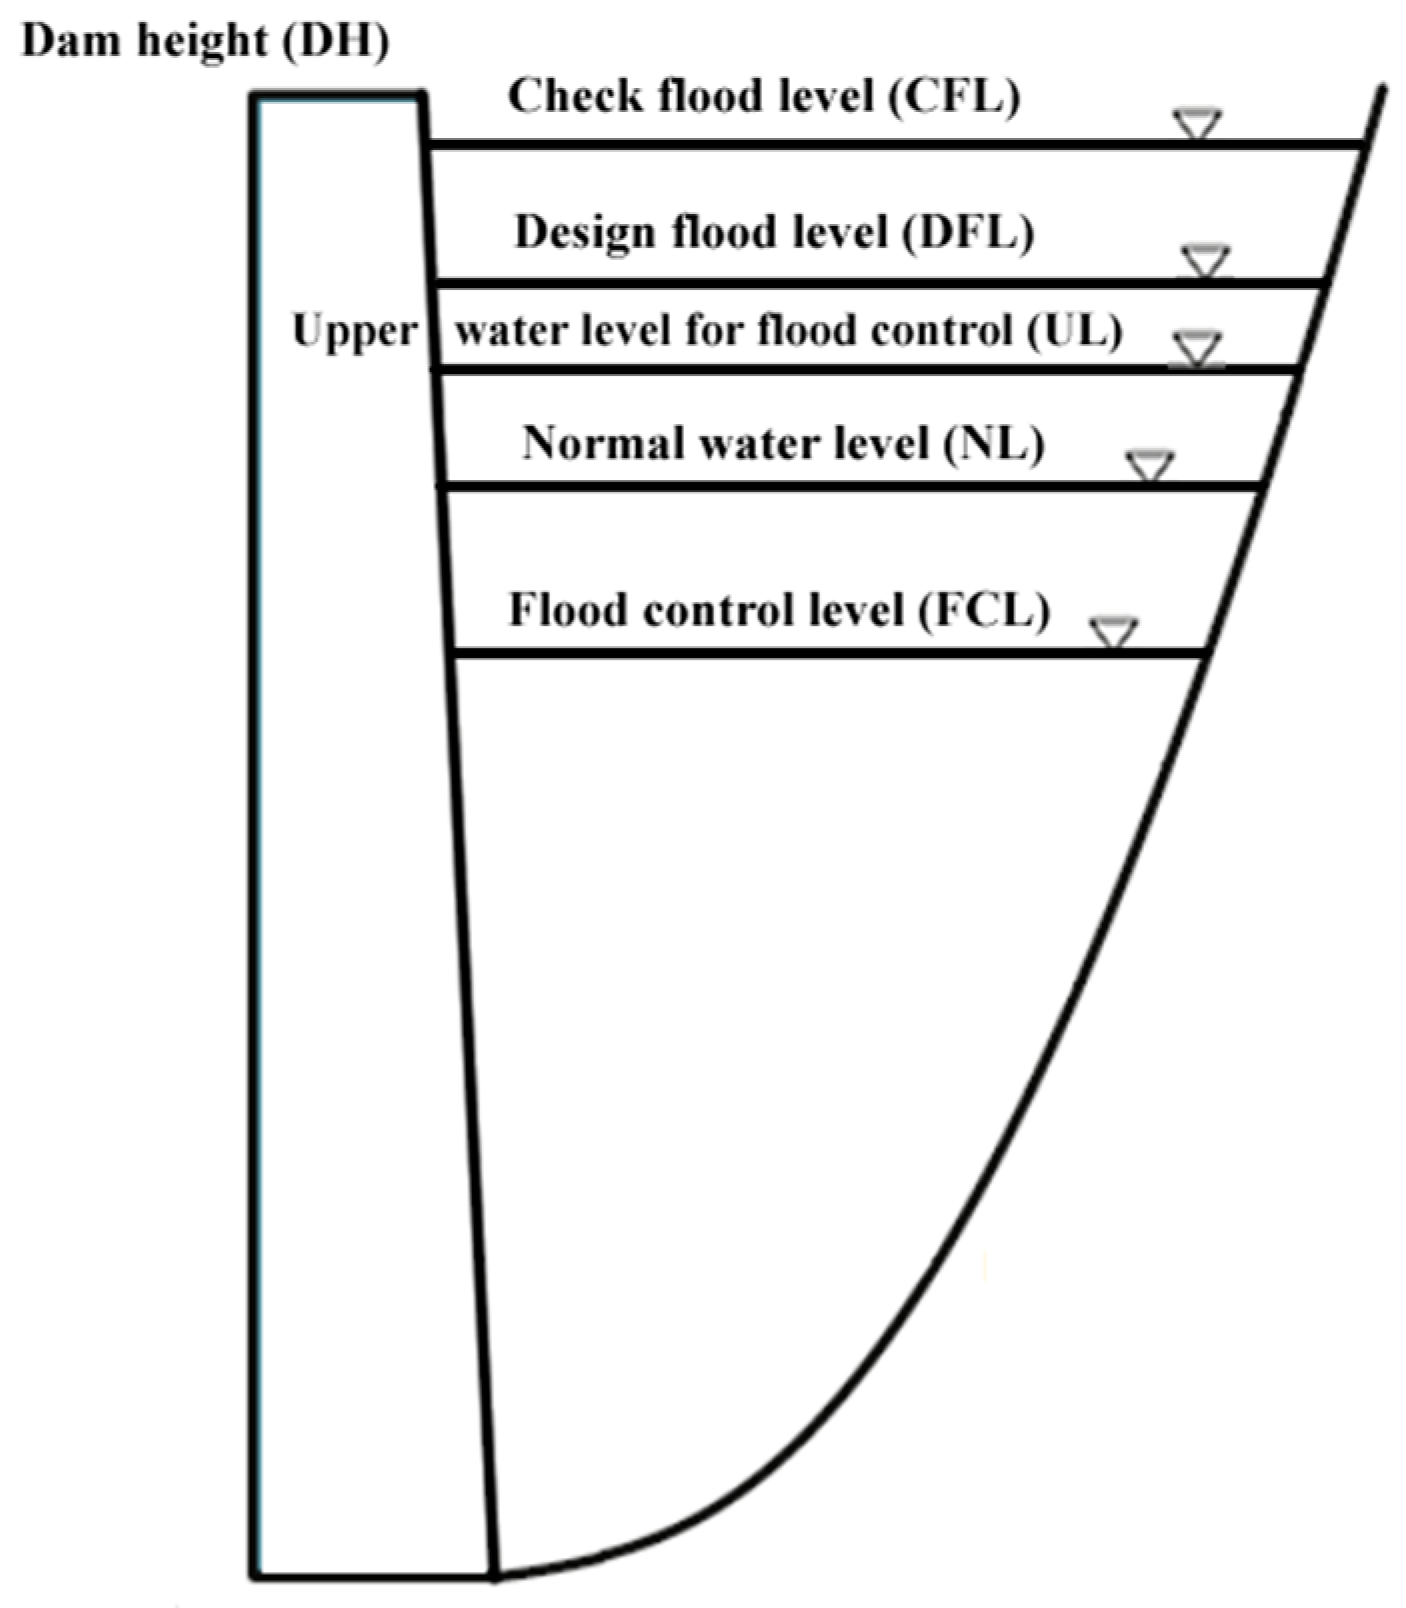
(5) Assigning the FZF to each dam. In order to quantify site hazard classes for the dams, we can compare HWL with several key water levels: the flood control level (FCL), the normal water level (NL), the upper water level for flood control (UL), the design flood level (DFL), the check flood level (CFL), and the dam height (DH), as shown in
Figure 1. When HWLs are located in different ranges of (DH, ∞), (CFL, DH), (DFL, CFL), (UL, DFL), (NL, UL), or (FCL, NL), corresponding values of the FZF shown in
Table 4 are assigned to each dam.
In addition, to each type of dam, we assigned a dam type indicator (DTI) to differentiate between materials and/or modes of construction and facilitate risk analysis and then assigned a general damage rating factor (DRF) according to
Table 5, based on an overall review of available dam performance data or the observed performance of similar dams during worldwide floods [
10]. The DRF can be used, in first approximation, to rate the flood vulnerability of a dam of a given type. It expresses, in a very general fashion, that some types of dams have been more vulnerable than others.
The last step of the assessment is to rank the dams by decreasing TRF and assign to each a risk class ranging from I (low risk) to IV (extreme risk), as shown in
Table 6. TRF does not represent a prediction of the dam’s performance under the flood scenarios, but it is a convenient way to quickly compare potential risks associated with dams such as those considered in this study and to assign priorities for more detailed evaluations. Dams of Class III or IV normally require a sophisticated level of evaluation and a detailed method of flood evaluation, such as finite element or finite difference analysis procedures. For dams of Class I or II, less elaborate methods of evaluation, simplified analysis procedures, and approximate estimation are acceptable [
10].
Furthermore,
Table 7 is provided as a convenient summary of the various terms used or defined in the section.
3. Case Study
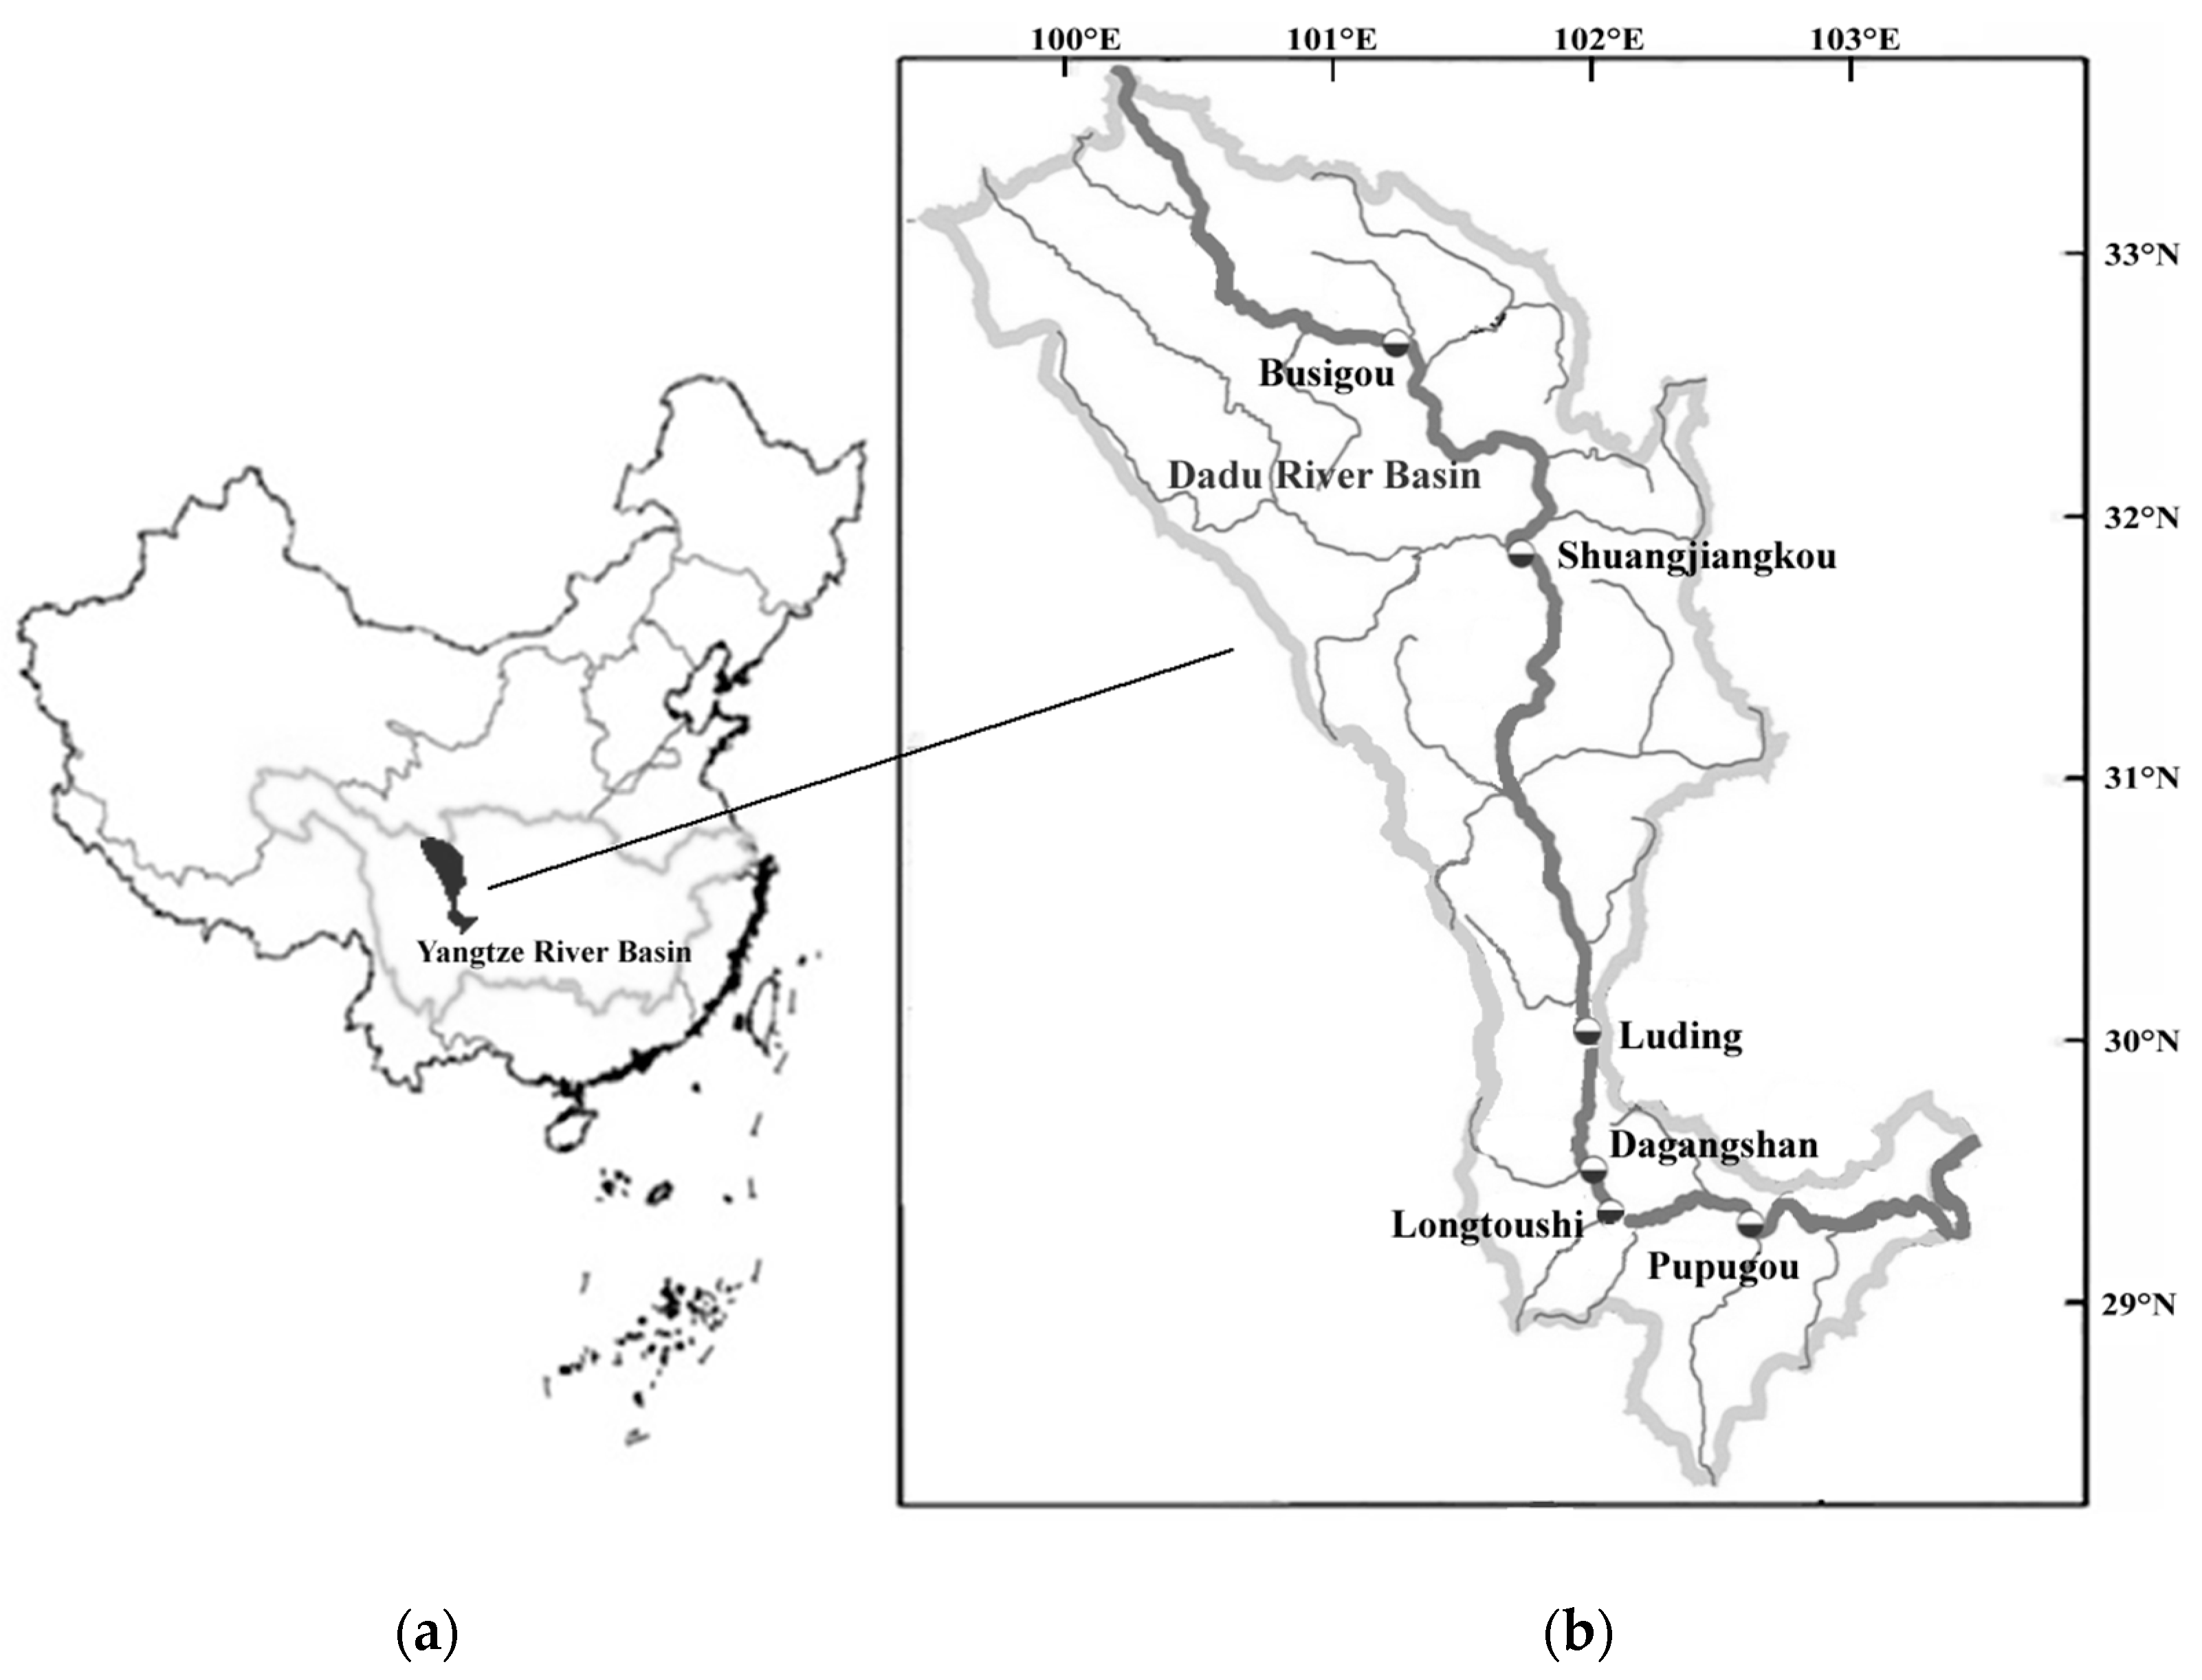
The Dadu River is located in the Sichuan province, Southwestern China. It is a tributary of the Min River, a main tributary of the Yangtze River. With a total area of 77.4 × 10
3 km
2, the Dadu River Basin maintains the quantity and quality of the upstream area of the Yangtze River and supplies the water to the west line of the South-to-North Water Diversion Project [
28]. The Dadu River has been heavily developed, primarily for hydroelectric power purposes. A total of 22 cascade reservoirs, which are a typical mixed cascade reservoir system, have been designed to exploit the energy and flood control potential of the basin (
Figure 2). In this study, six cascade reservoirs of the system—Busigou (BSG), Shuangjiangkou (SJK), Luding (LD), Dagangshan (DGS), Longtoushi (LTS), and Pubugou (PBG)—from upstream to downstream were selected and evaluated based on the proposed method. The characteristic parameter values and the corresponding risk factor weights of the six reservoirs are given in
Table 8. These parameter values were obtained from the related yearbooks and investigation reports.
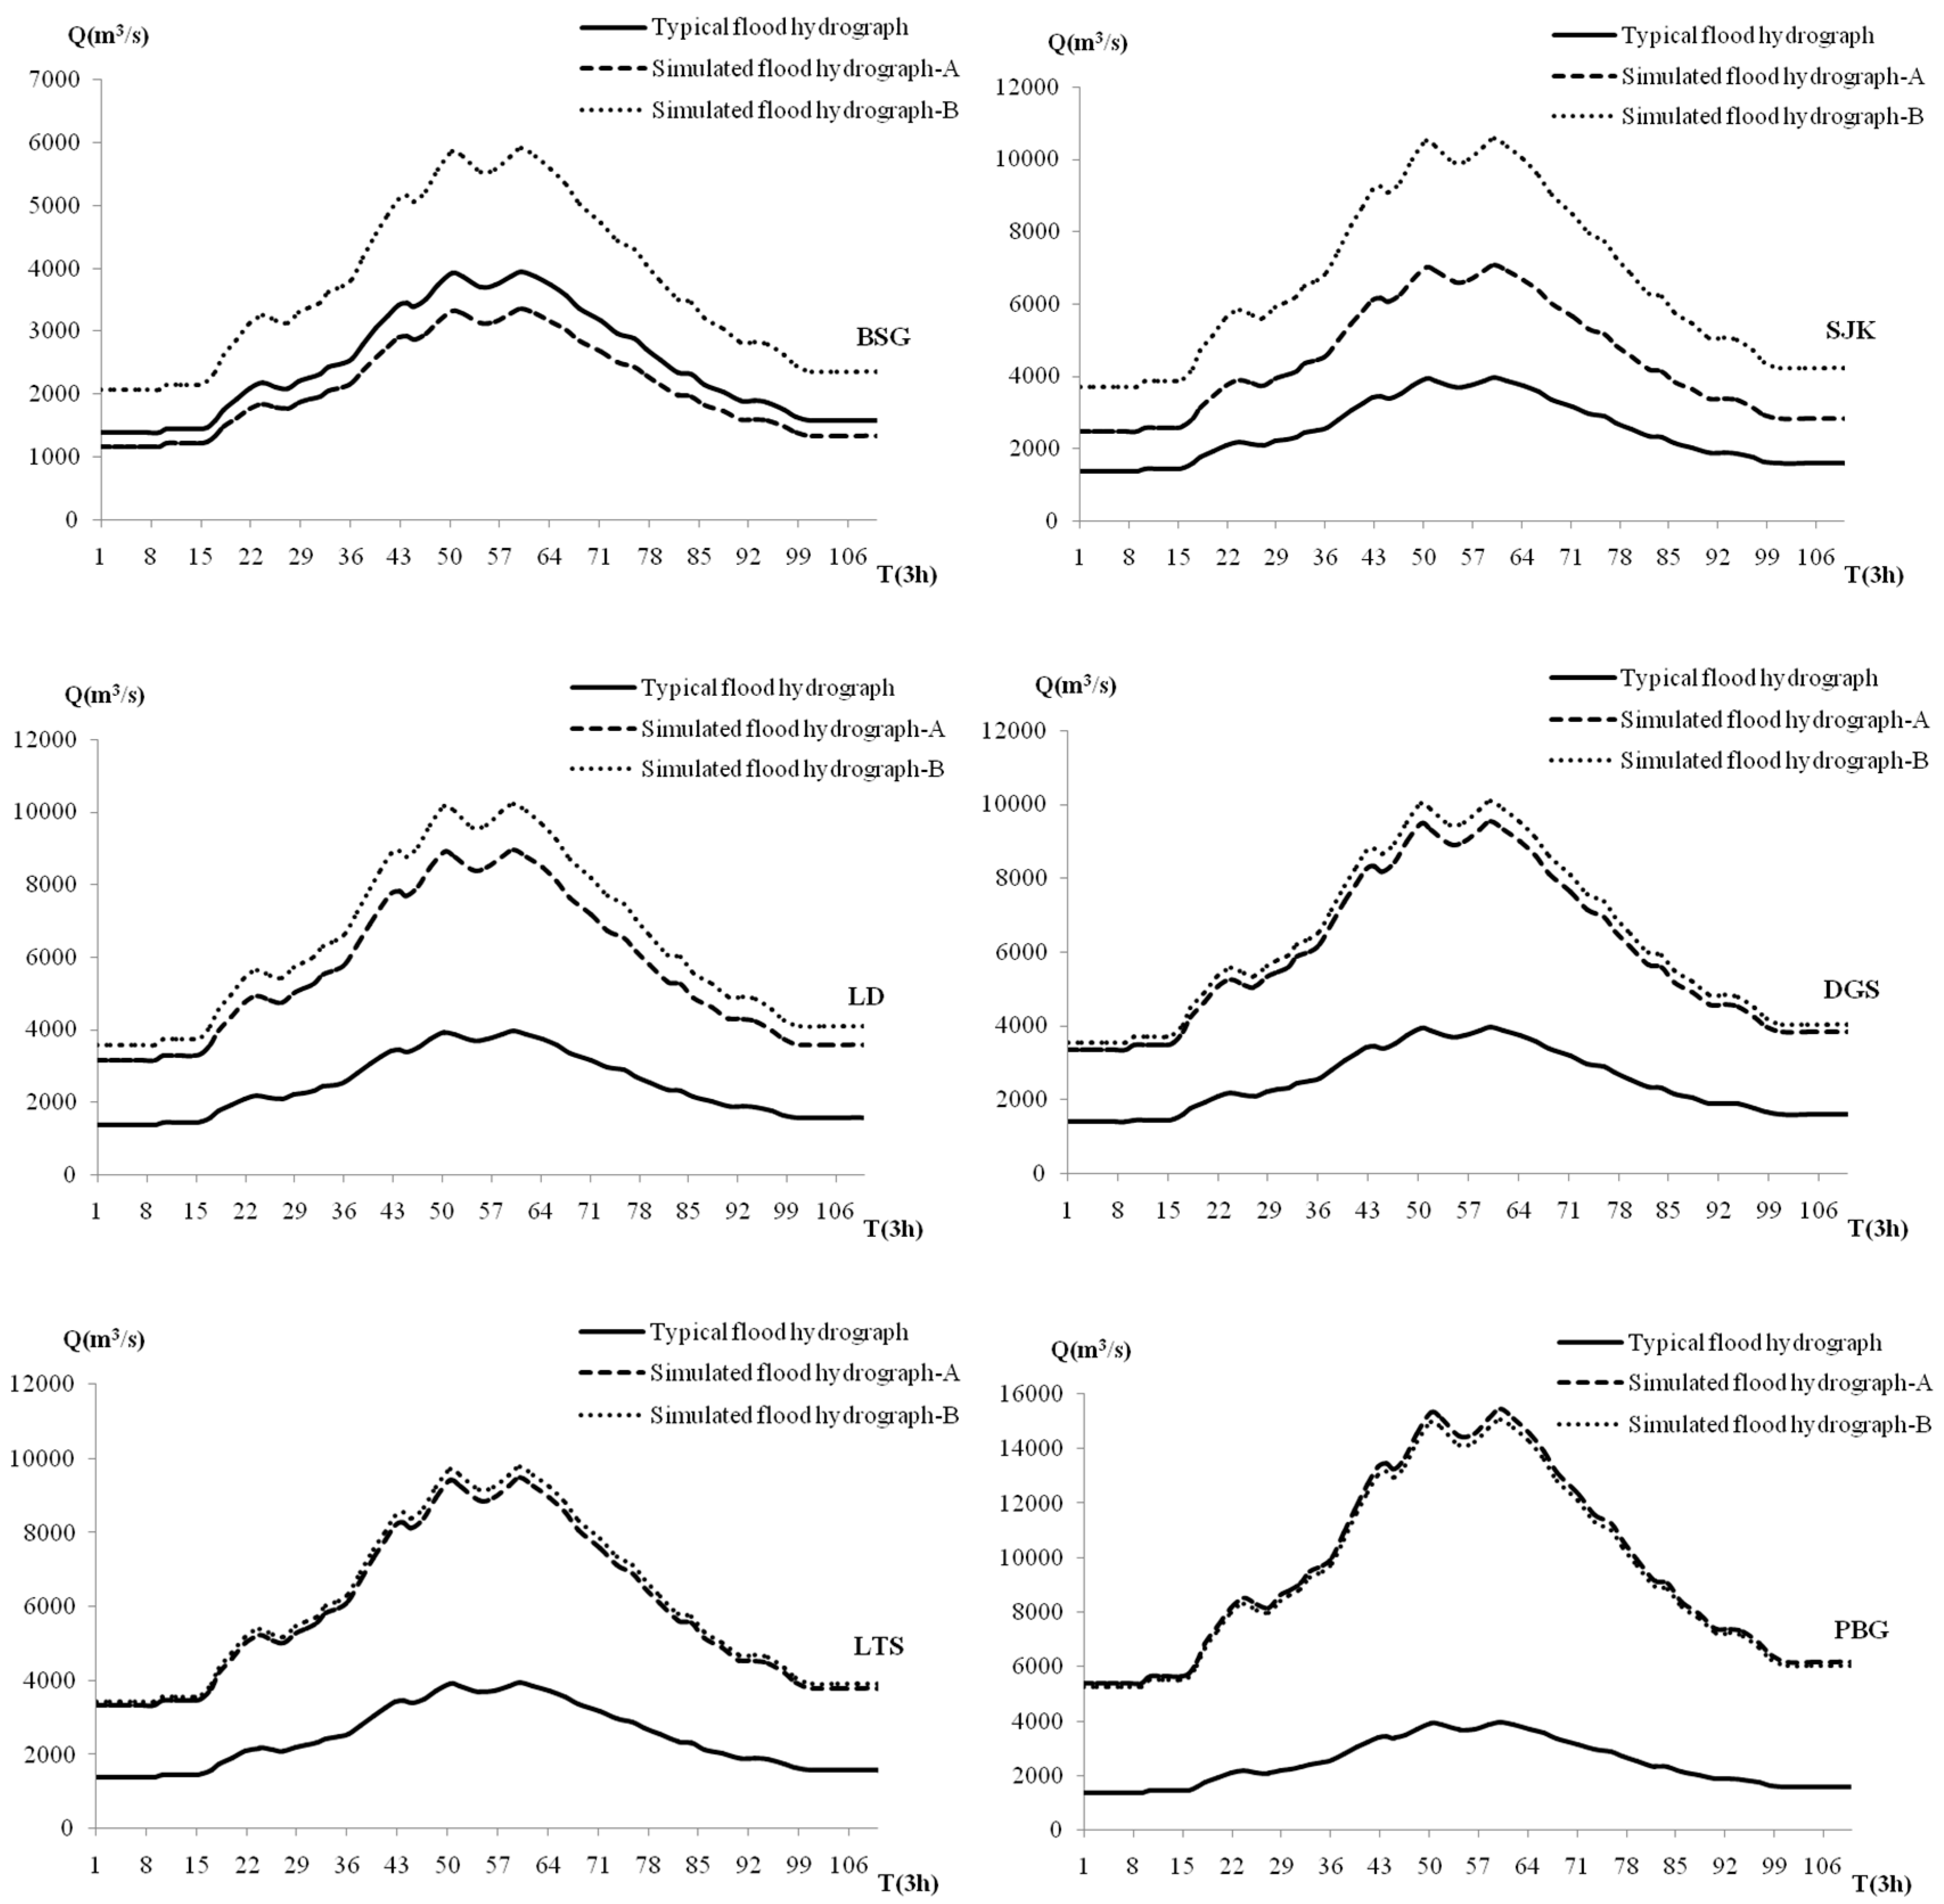
According to data analysis, the precipitation and flood characteristics in the upper and lower reaches of LD are obviously different, and heavy rainfall events do not occur simultaneously in the upper or lower reaches of LD. Furthermore, the zone of intense rainfall within a storm system is commonly concentrated within a smaller portion of the drainage basin, and the risk situations of each reservoir under different rainfall scenarios cannot be considered comprehensively if only the local rainfall data of each reservoir is applied to derive the flood hydrograph. Therefore, the TRF of each dam was evaluated for different rainfall scenarios. Based on the physiographic characteristics of the basin and the hydrologic climate feature, the heavy rainfall patterns in the Dadu River Basin are divided into two scenarios. Scenario A and Scenario B represent the heavy rainfall centers located in the region from LD to PBG and in the upper reaches of LD, respectively. There is a good relation between the water vapor inflow index and the basin’s surface mean rainfall, so water vapor amplification and water vapor efficiency amplification methods can be applied to calculate PMP in the basin. These dew points are generally obtained from long observation records from the 1951–2007 period, at Xichang, Zhaojue, Yibin, and Yuexi stations in the basin. The PMP was estimated for the catchments upstream of the four stations. The representative perceptible water values of each station were calculated based on the water vapor data of the heavy rainfall event in September 1989. Specifically, the two scenarios only refer to the 7-day rainfall process, and the data was calculated using the Tyson polygon method in terms of the point rainfall data collected from the corresponding control rainfall stations.
The PMP–PMF transformation was performed with an appropriate rainfall–runoff simulation model, whose parameters had been previously calibrated for the catchment in study [
29]. Because there are various rainfall scenarios, the transformed PMFs were different accordingly. Based on the two rainfall scenarios, the corresponding PMFs can be obtained. According to the measured runoff data and the analyzed historical flood data of the hydrological station in the basin, the flood event in September 1981 with a high peak and a large volume, influencing the upper, middle, and lower reaches, was adopted as the typical flood to calculate the PMF by means of the runoff yield and concentration calculation.
The inflow hydrographs of each reservoir were obtained by enlarging the typical flood hydrograph with the same multiple ratio method for the specific PMF, and the time intervals of typical and simulated flood hydrographs were identical.
Figure 3 shows the simulated flood hydrographs of each studied reservoir for Scenarios A and B, which could be used in the reservoir routing, combined with the specific operation rules, to analyze the HWL ranges of each reservoir under different scenarios, and the related calculation results are shown in
Table 9.
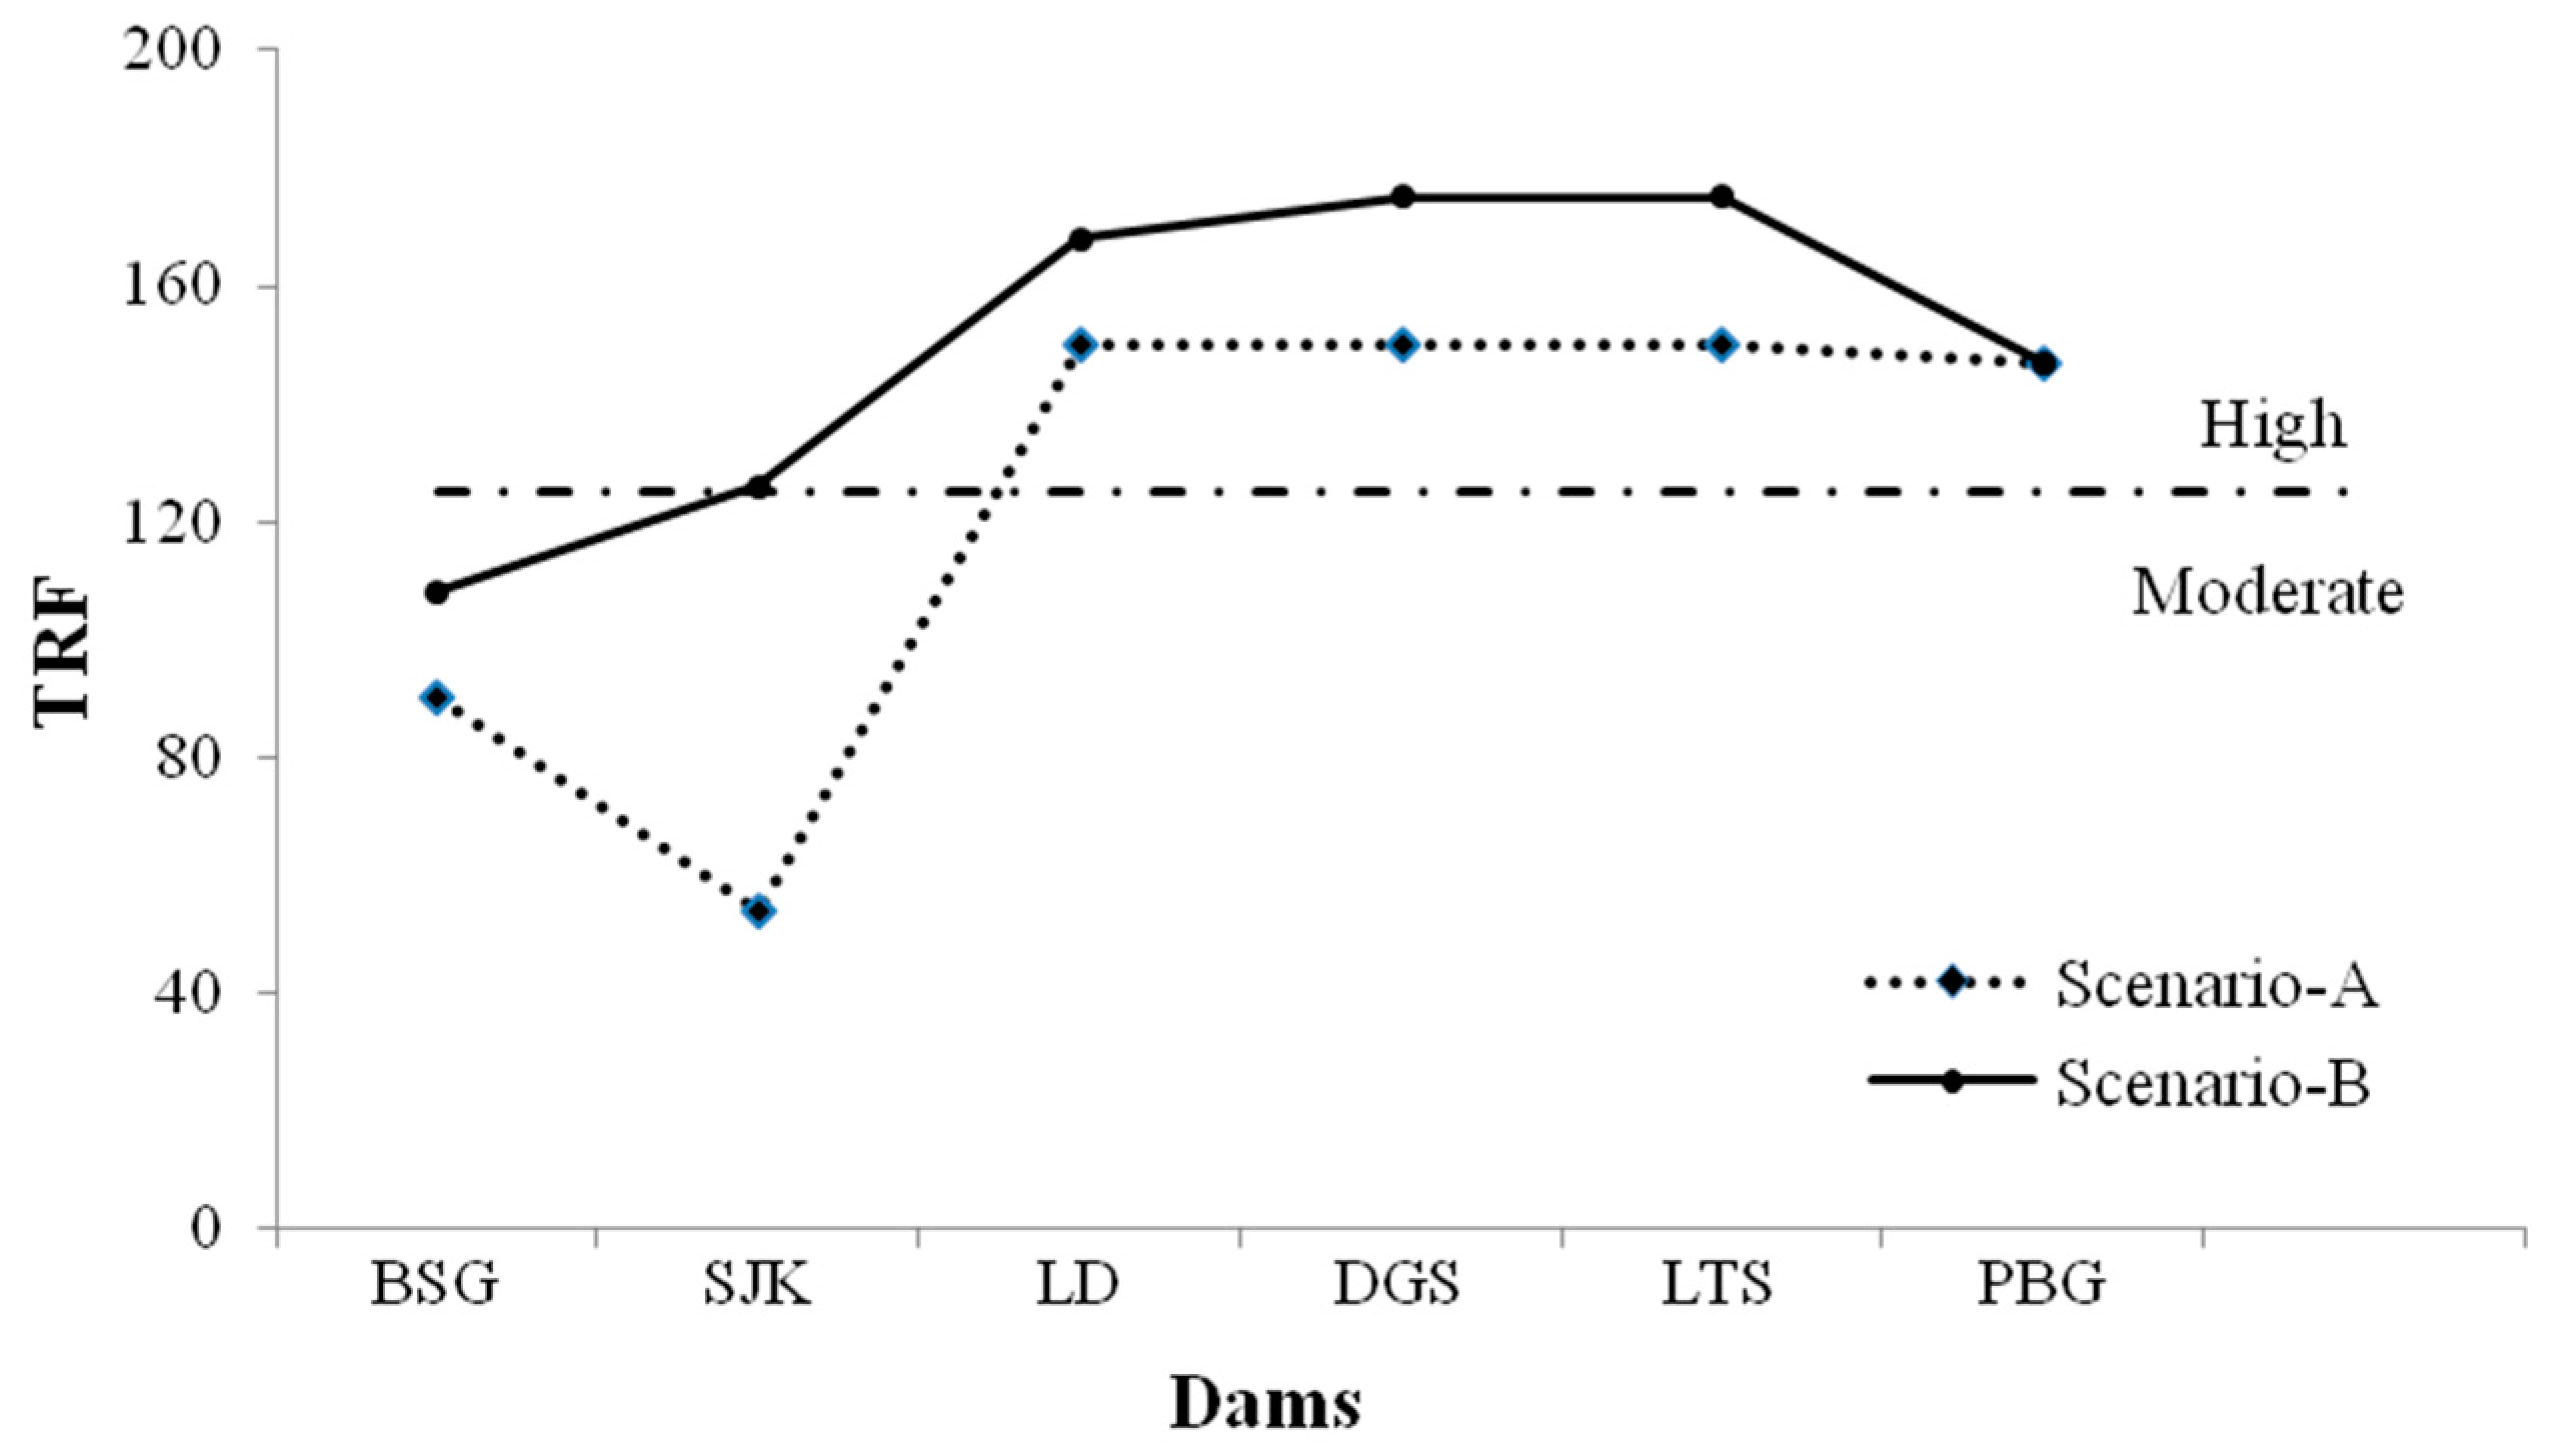
Using Equations (1), (5), and (6) to calculate the TRFs of the selected dams in the two scenarios respectively, the dams were ranked by decreasing the calculated TRFs, and the results are shown in
Table 10 and
Figure 4.
It can be seen in
Table 10 that the safety performance of the dams in terms of flood hazard caused by heavy rainfall in Scenario A is better, which is reflected by the relatively lower TRFs and relatively lower risk ratings. This is because, in Scenario A, the rainfall was mainly concentrated in the region from the LD dam to the PBG dam, where the DGS dam, a double curvature arch dam with a dam height more over 200 m, and the PBG dam, a dam with a reservoir capacity of more than 5 billion m
3, are located.
Only the SJK dam was identified with different risk classes and ratings in the two scenarios. The SJK dam with a reservoir capacity of 28.97 m
3, as a control project, has functions of energy and flood control. If it is broken, the downstream cascade reservoirs will be catastrophically damaged. Therefore, the SJK dam is the most sensitive in the different scenarios.
Figure 4 also intuitively confirms these viewpoints.
4. Conclusions
In the study, a new computational methodology of dam risk analysis under flood hazards is proposed and used to assess the total risk rating and risk classes of six large dams in Dadu River Basin, Southwestern China, in two different scenarios. The following results can be concluded:
(1) Greatly different from the originally TRF method under seismic hazards, the proposed method, the so-called extended TRF method under flood hazards, assigns various risk factor weights to each large dam, highlights how to estimate the structure influence, rate flood vulnerability, and determine downstream risk potential, and can be used to quickly obtain and compare the risk potential associated with different dams in any postulated flood scenario.
(2) The method is easily applicable and efficient for the analysis of large dam-related flood risk and can be applied regardless of non-linear problems inherent to indicator-based risk assessment and without the need of large samples of historical data, which is necessary for probability-based risk estimation.
(3) The risk assessment results can provide reasonable guidance for risk managers to make more detailed estimations of dam flood disasters, to develop public awareness in terms of describing in detail the consequences of different flood scenarios, and to support the development and prioritization of mitigation strategies in a long-term effort to reduce the vulnerability of the Dadu River Basin to floods. Moreover, to better understand changes in flood hazard over time, the historical floods reconstruction method and the method of incorporating satellite imagery and aerial photography during peak flow to observe the dynamics of modern floods can be combined to lengthen the flood records of rare and extreme flood events. The simulated flooding areas can then be computed using recent advanced mathematical models, such as GeoClaw, Open Telemac, and DassFlow-Shallow.
(4) Except for the SJK dam, all of the dams had the same risk rating and risk classes in both scenarios. The dams with high risk were concentrated in the regions from LD to PBG, which means the floods that were caused by different rainfall centers influenced the dams at different levels, which can be seen as a direct instruction to risk managers.


