Future Changes in Flood Hazards across Canada under a Changing Climate


1
Facility for Intelligent Decision Support, Department of Civil and Environmental Engineering, The University of Western, London, Ontario, ON N6A 3K7, Canada
2
National Research Council Canada, 1200 Montreal Road, Ottawa, ON K1A 0R6, Canada
*
Author to whom correspondence should be addressed.
Water 2018, 10(10), 1441; https://doi.org/10.3390/w10101441
Submission received: 4 September 2018
/
Revised: 2 October 2018
/
Accepted: 7 October 2018
/
Published: 13 October 2018
(This article belongs to the Special Issue Extreme Floods and Droughts under Future Climate Scenarios)
Abstract
:Climate change has induced considerable changes in the dynamics of key hydro-climatic variables across Canada, including floods. In this study, runoff projections made by 21 General Climate Models (GCMs) under four Representative Concentration Pathways (RCPs) are used to generate 25 km resolution streamflow estimates across Canada for historical (1961–2005) and future (2061–2100) time-periods. These estimates are used to calculate future projected changes in flood magnitudes and timings across Canada. Results obtained indicate that flood frequencies in the northernmost regions of Canada, and south-western Ontario can be expected to increase in the future. As an example, the historical 100-year return period events in these regions are expected to become 10–60 year return period events. On the other hand, northern prairies and north-central Ontario can be expected to experience decreases in flooding frequencies in future. The historical 100-year return period flood events in these regions are expected to become 160–200 year return period events in future. Furthermore, prairies, parts of Quebec, Ontario, Nunavut, and Yukon territories can be expected to experience earlier snowmelt-driven floods in the future. The results from this study will help decision-makers to effectively manage and design municipal and civil infrastructure in Canada under a changing climate.
1. Introduction
Floods are the most frequently occurring natural hazard in Canada and around the globe [1,2,3,4]. A number of studies have been performed in different parts of the globe to establish methods for effective quantification of floods and their associated risks [5,6,7,8,9,10,11,12,13,14,15,16,17]. Studies have also investigated methods to quantify compound flooding i.e., that are caused by two or more events contributing to flooding example occurrence of extreme rainfall, variations in astronomical tides, storm surge, and wave action, rise in groundwater levels etc., occurring simultaneously or successively [18,19].
Due to continuous greenhouse gas emissions, climate variables and their extremes have exhibited considerable shifts across the globe [20,21,22]. Changes in key hydro-climatic elements and their extremes have been recorded across Canada [21,23] and unprecedented changes are projected for the future [24,25,26]. These changes in climate, coupled with rapid urbanization, have led to increases in the frequencies and magnitudes of flooding events in Canada. A total of 241 flood disasters have been recorded in Canada between 1990 and 2005 [4], many of which have occurred in major Canadian cities such as: Montreal in 2012, Thunder Bay in 2012, Calgary in 2013 and 2010, Winnipeg in 1997 and 2009, and Toronto in 2005 and 2013 [27]. [The trends in hydrological extremes for 248 Reference Hydrometric Basin Network (RHBN) catchments in Canada were examined by [28]. A decreasing trend in annual maximum flows for catchments located in southern Canada, and an increasing trend in catchments located in northern Canada was obtained. In addition, a robust signal of increases in spring snowmelt driven peak flow was obtained in the months of March and April, whereas a decrease in June month peak flow was obtained. These findings highlight that the behavior of extreme floods has changed across Canada as a consequence of climate change. Therefore, as advocated in previous research [29,30], it is important to obtain reliable flood frequency estimates under a non-stationary climate, such that they can be used to design climate resilient civil and municipal infrastructure across Canada.
General Climate Models (GCMs) simulate complex bio-geophysical and chemical processes occurring within the earth system and their interactions [20]. Land surface schemes are the interface within the GCMs that host important energy budget and water balance calculations occurring within a GCM grid-cell. GCM simulations are performed at a coarse spatial resolution of ~110–550 km, which hinders the accurate representation of some of the important physical processes, such as convection that shapes the earth’s climate [22]. As a result, large uncertainties have been obtained in GCM projections, especially for variables linked to precipitation [22]. For making future flows and flooding projections at catchment(s) scales, typically, coarse resolution climate projections from GCMs are downscaled, and they are used to generate streamflow responses using a hydrologic model. This approach has been adopted in a number of catchment scale studies, including [25,31,32,33,34], among others.
Another approach commonly adopted by studies making future flow projections at continental or global spatial scales involve the use of coarse scale gridded runoff projections made by GCMs, and downscaling them to obtain higher resolution runoff estimates. Examples of studies adopting this approach include [35] where 45 km resolution streamflow forecasts for northeastern parts of Canada were generated by dynamically downscaling hydro-climatic forecasts from CanESM2 GCM using a CRCM4 Regional Climate Model [36]. A modified version of the WATROUTE hydraulic modelling scheme [37] was used within the CRCM4 model to simulate high resolution flows. Future changes in projected flood hazard across Europe were estimated by [38]. Dynamically downscaled future climatic projections from two regional climate models (RCMs): HIRHAM model of the Danish Meteorological Institute [39] and the Rossby Centre Atmosphere Ocean Model (RCAO) of the Swedish Meteorological and Hydrological Institute [40], were used as inputs into a hydrological model: LISFLOOD [41] to simulate 5 km resolution river discharges across Europe for historical (1961–1990) and future (2071–2100) timelines. The climatic simulations and projections from 21 GCMs were used as inputs into a global scale hydrologic model, Mac-PDM.09 [42] to simulate current and future flow regimes at 0.5° spatial resolution and assessed global water scarcity in future [43]. On the other hand, [44] used runoff simulations from GCMs and simulated high-resolution water level dynamics across the Amazon River basin, using a catchment-based macro-scale floodplain model: CaMa-Flood [45]. The same model was used by [46] to obtain 25 km resolution flow projections across the globe, using coarser resolution runoff projections from 11 GCMs in accordance with representative concentration pathways (RCPs): RCP 2.6, RCP 4.5, RCP 6.0, and RCP 8.5 [47].
This study investigates changes in the frequencies and timings of large floods (referred to address 100-year and 250-year return period flooding events hereafter) across Canada under projected future influences of climate change. The analysis presented generates novel information, as only a handful of studies (predominantly global assessments) preceding this study have assessed changes in flood hazards on a Canadian scale. In most of these studies, only changes in flooding frequencies and magnitudes have been assessed. This study extends the assessment to also analyze projected changes in flood timings, which is an important piece of information that is required for effective flood risk management. Finally, this study takes into consideration a larger ensemble of future runoff projections as compared to previous studies, which means that the results generated from this study account for the uncertainty associated with future runoff projections made by GCMs more effectively than the previous studies.
2. Models and Methods
2.1. CaMa-Flood Hydrodynamic Model
CaMa-Flood [44,45,46,48,49] is a global scale-distributed hydrodynamic model that routes input runoff generated by a land surface model to oceans or inland seas along a prescribed river network map. Water storage is calculated at every time-step, whereas variables such as: water level, inundated area, river discharge, and flow velocity, are diagnosed from the calculated water storage. River discharge and flow velocity are estimated using a local inertial equation. Floodplain inundation is modelled by taking into consideration the sub-grid scale variabilities in the river channel and floodplain topography. The parameters used in CaMa-Flood model are listed in Table 1. A river channel reservoir has three parameters: channel length (L), channel width (W), and bank height (B). The floodplain reservoir has a parameter for unit catchment area (Ac), and a floodplain elevation profile that describes the floodplain water depth Df as a function of the flooded area, Af. The topography-related parameters i.e., surface altitude (Z), distance to downstream cell (X), and unit catchment area (Ac) are calculated using the Flexible Location of Waterways (FLOW) method [50]. Finally, a Manning’s roughness coefficient parameter (n) is used to represent the roughness in the river channel.
The CaMa-Flood model has been validated extensively for its ability to simulate runoff in the largest catchments of the globe [44,51]. For instance [45] evaluated the performance of the CaMa-Flood model in simulating flow characteristics in 30 major river basins, including the Amazon, Mississippi, Parana, Niger, Congo, Ob, Ganges, Lena, and Mekong. The model was found to be able to simulate flood inundation characteristics in these basins well. Furthermore, [49] evaluated the importance of adding a new computational scheme to help support the representation of flows through bifurcation channels in CaMa-Flood. The model was found to be able to perform realistic hydrodynamic calculations in the complex, resulting in mega delta with numerous bifurcation channels. Given the high credibility of the model in simulating river flow and flood inundation dynamics, the model has been used to assess the impacts of climate change at regional to global scales [46,51,52,53,54,55]. This study uses the globally calibrated version of the CaMa-Flood model that was used to generate global scale runoff projections in [46].
2.2. Methodology
2.2.1. Generation of 25 km Resolution Historical and Future Flows across Canada
Coarse resolution historical (1961–2005) and future (2061–2100) runoff simulations obtained from GCMs were used as inputs into the CaMa-Flood model calibrated at 25 km resolution and flow estimates covering the entire Canadian landmass. A spin-up period of two years was considered, and flows generated during this period were ignored during the assessment.
2.2.2. Grid-Wise Estimation of Future Flooding Frequencies of Historical 100- and 250-Year Floods
Generated historical and future flows at each 25 km grid were used to estimate future changes in the frequencies of historical 100- and 250-year floods. Generalized extreme value (GEV) distribution was fitted to the historical annual maximum flow series. The cumulative distribution function of the GEV distribution is expressed in Equation (1):
where Q is the random variable, q is a probable value of Q, κ is the shape parameter, ε the location parameter, and α is the scale parameter. Parameters of GEV distribution were estimated using the method of L-moments [56].
Flow quantiles corresponding to 100- and 250-year return period floods were estimated for historical timelines. GEV distribution was then fitted to the annual maximums of the future flow series, and return periods corresponding to historical 100- and 250-year flood magnitudes were estimated.
2.2.3. Aggregation and Uncertainty Assessment of Projected Changes in Flooding Frequencies
Future flood frequency projections from different GCMs (corresponding to a particular emission scenario) were aggregated, and uncertainty magnitudes were quantified for each 25 km grid. Previous studies have found large uncertainties in GCM simulated projections of precipitation-related variables, with even the sign of change being found to be uncertain in many regions of the globe (IPCC 2013). Therefore, in this study, robustness of flood frequency projections was taken into consideration when aggregating flooding frequency estimates. The term ‘robust’ was used in this paper to refer to projections/projected changes that concurred by more than 50% of the projections analyzed. If equal numbers of projections conveyed increases/decreases in flooding frequencies in the future for a particular grid, then that grid was associated with ‘non-robust’ flood frequency projections. When aggregating future flood frequencies, projections that concurred with the robust sign of change in flooding frequencies were considered for aggregation and uncertainty assessment. Aggregated flooding frequencies were calculated by finding the median of future return period values, whereas uncertainty was quantified using Equation (2):
where Ur denotes the calculated uncertainty magnitude, and , , and denote the 75th, 50th, and 25th quantiles of the robust flood frequency projections, respectively.
2.2.4. Estimation of Historical and Future Flood Timing
When assessing changes in flood timing, flow events exceeding the 95th quantile flow value over the entire time-period of concern were considered as flooding events. For each individual CaMa-Flood grid located within Canada, flooding events were identified for both historical and future time-periods that met this criterion. The month of the year corresponding to which the largest frequency of flooding events were simulated was recorded as the time of flooding. The differences in the time of flooding between historical and future time-periods were analyzed to identify the impact of climate change on flood timing across Canada.
2.2.5. Aggregation of Historical and Future Flood Timing
Flood timing values were aggregated at each 25 km grid by only taking into consideration projections from GCMs that were able to accurately simulate the robust flow month. The robust flow month is regarded as the month that is projected with the largest number of flooding events by more than 50% of the projections analyzed. If none of the months have been concurred upon by more than 50% of the projections for a grid, then that grid is marked as having ‘non-robust’ flood timing results. The aggregated results for historical and future timelines are compared, to assess changes in flood timing between the two timelines.
3. Study Region
In this study, assessment of future changes in flooding frequencies and timings is performed across the entire Canadian landmass. Canada consists of 10 provinces and 3 territories: Yukon (YK), Northwest Territories (NT), Nunavut (NV), British Columbia (BC), Alberta (AB), Saskatchewan (SK), Manitoba (MB), Ontario (ON), Quebec (QB), Newfoundland and Labrador (NL), New Brunswick (NB), Nova Scotia (NS), and Prince Edward Island (PEI).
Different regions of Canada exhibit considerable differences in landscape and climate. Canada encompasses eight climate regions with different geophysical characteristics (Massey and Connors 1985). These are: (i) Pacific Maritime climate that is shaped by the presence of Pacific Ocean and is characterized by mild but extremely wet winters, and cool and dry summers. Regions located along British Columbia’s west coast and its border with Yukon Territory are a part of this climate type; (ii) Cordilleran climate is influenced by continental air masses and Pacific air streams. It is found in regions covering eastern British Columbia, Yukon Territory, and small portions of southwestern Alberta. It is characterized by cold and wet winters, and warm and dry summers. The climate experienced within this climate type varies considerably spatially, because of the presence of the Rocky Mountains and insulated valleys. This climate type is found in regions covering eastern British Columbia and the Yukon Territory, as well as small portions of southwestern Alberta; (iii) Atlantic Maritime climate is influenced by western continental air masses, and it is modified by the presence of the Atlantic Ocean. This climate type is characterized by cold and wet winters and hot and wet summers. Regions encompassing New Brunswick, Nova Scotia, Prince Edward Island, and southeastern Newfoundland exhibit this climate type; (iv) Southeastern climate is influenced by the continental air masses that are modified by the presence of the Great Lakes. This climate type is characterized by cold and wet winters, and hot and wet summers. Regions that characterize this climate type include Ontario, Quebec, and parts of Nova Scotia and New Brunswick; (v) Prairies climate type is influenced by the continental air masses, and it is characterized with a wide annual temperature range with very cold winters and very hot summers; the southern regions of Alberta, Saskatchewan, and Manitoba provinces demonstrate this climate type; (vi) Boreal climate is influenced by Arctic and Pacific Ocean air masses. This climate type is characterized with very cold and dry winters, and warm and wet summers. Regions forming a continuous belt from Newfoundland and Labrador passing central Quebec and Ontario, across the Prairies, and west to the Rocky Mountains exhibit this climate type; (vii) Arctic climate region is influenced by the air stream coming from the Arctic ice pack. This region is characterized with a very harsh cold climate, permanent snow-cover, short cool summers, and minimal precipitation. Most of the Nunavut, and northern parts of Northwest Territories and Quebec exhibit this climate type. Lastly; (viii) Taiga climate region is associated with long cold winters for more than six months. This climate has some precipitation in summer and very low precipitation in winter.
4. Data Used
GCM-simulated daily runoff data for historical (1961–2005) and future (2061–2100) timelines were obtained from Coupled Model Inter-comparison Project Phase 5 (CMIP5) of the World Climate Research Programme (WCRP) (Taylor et al. 2012). Future runoff projections corresponding to four Representative Concentration Pathways (RCPs): RCP2.6, RCP4.5, RCP6.0, and RCP8.5 [47] were collected. The list of GCMs considered for analysis in this study is provided in Table 2. Runoff data for above mentioned timelines was collected for a total of 105 (84 future and 21 historical) realizations from the CMIP5 multi-model ensemble.
To perform computationally extensive CaMa-Flood simulations over the Canadian domain for all 105 realizations, the Shared Hierarchical Academic Research Computing Network (SHARCNET) platform (www.sharcnet.ca) was used. The preparation of CaMa-Flood inputs and the processing of results was performed in R programming language [57].
5. Results and Discussion
This section presents the results obtained from the assessment of projected future changes in flood frequency and timing across Canada.
5.1. Projected Changes in Flooding Frequencies
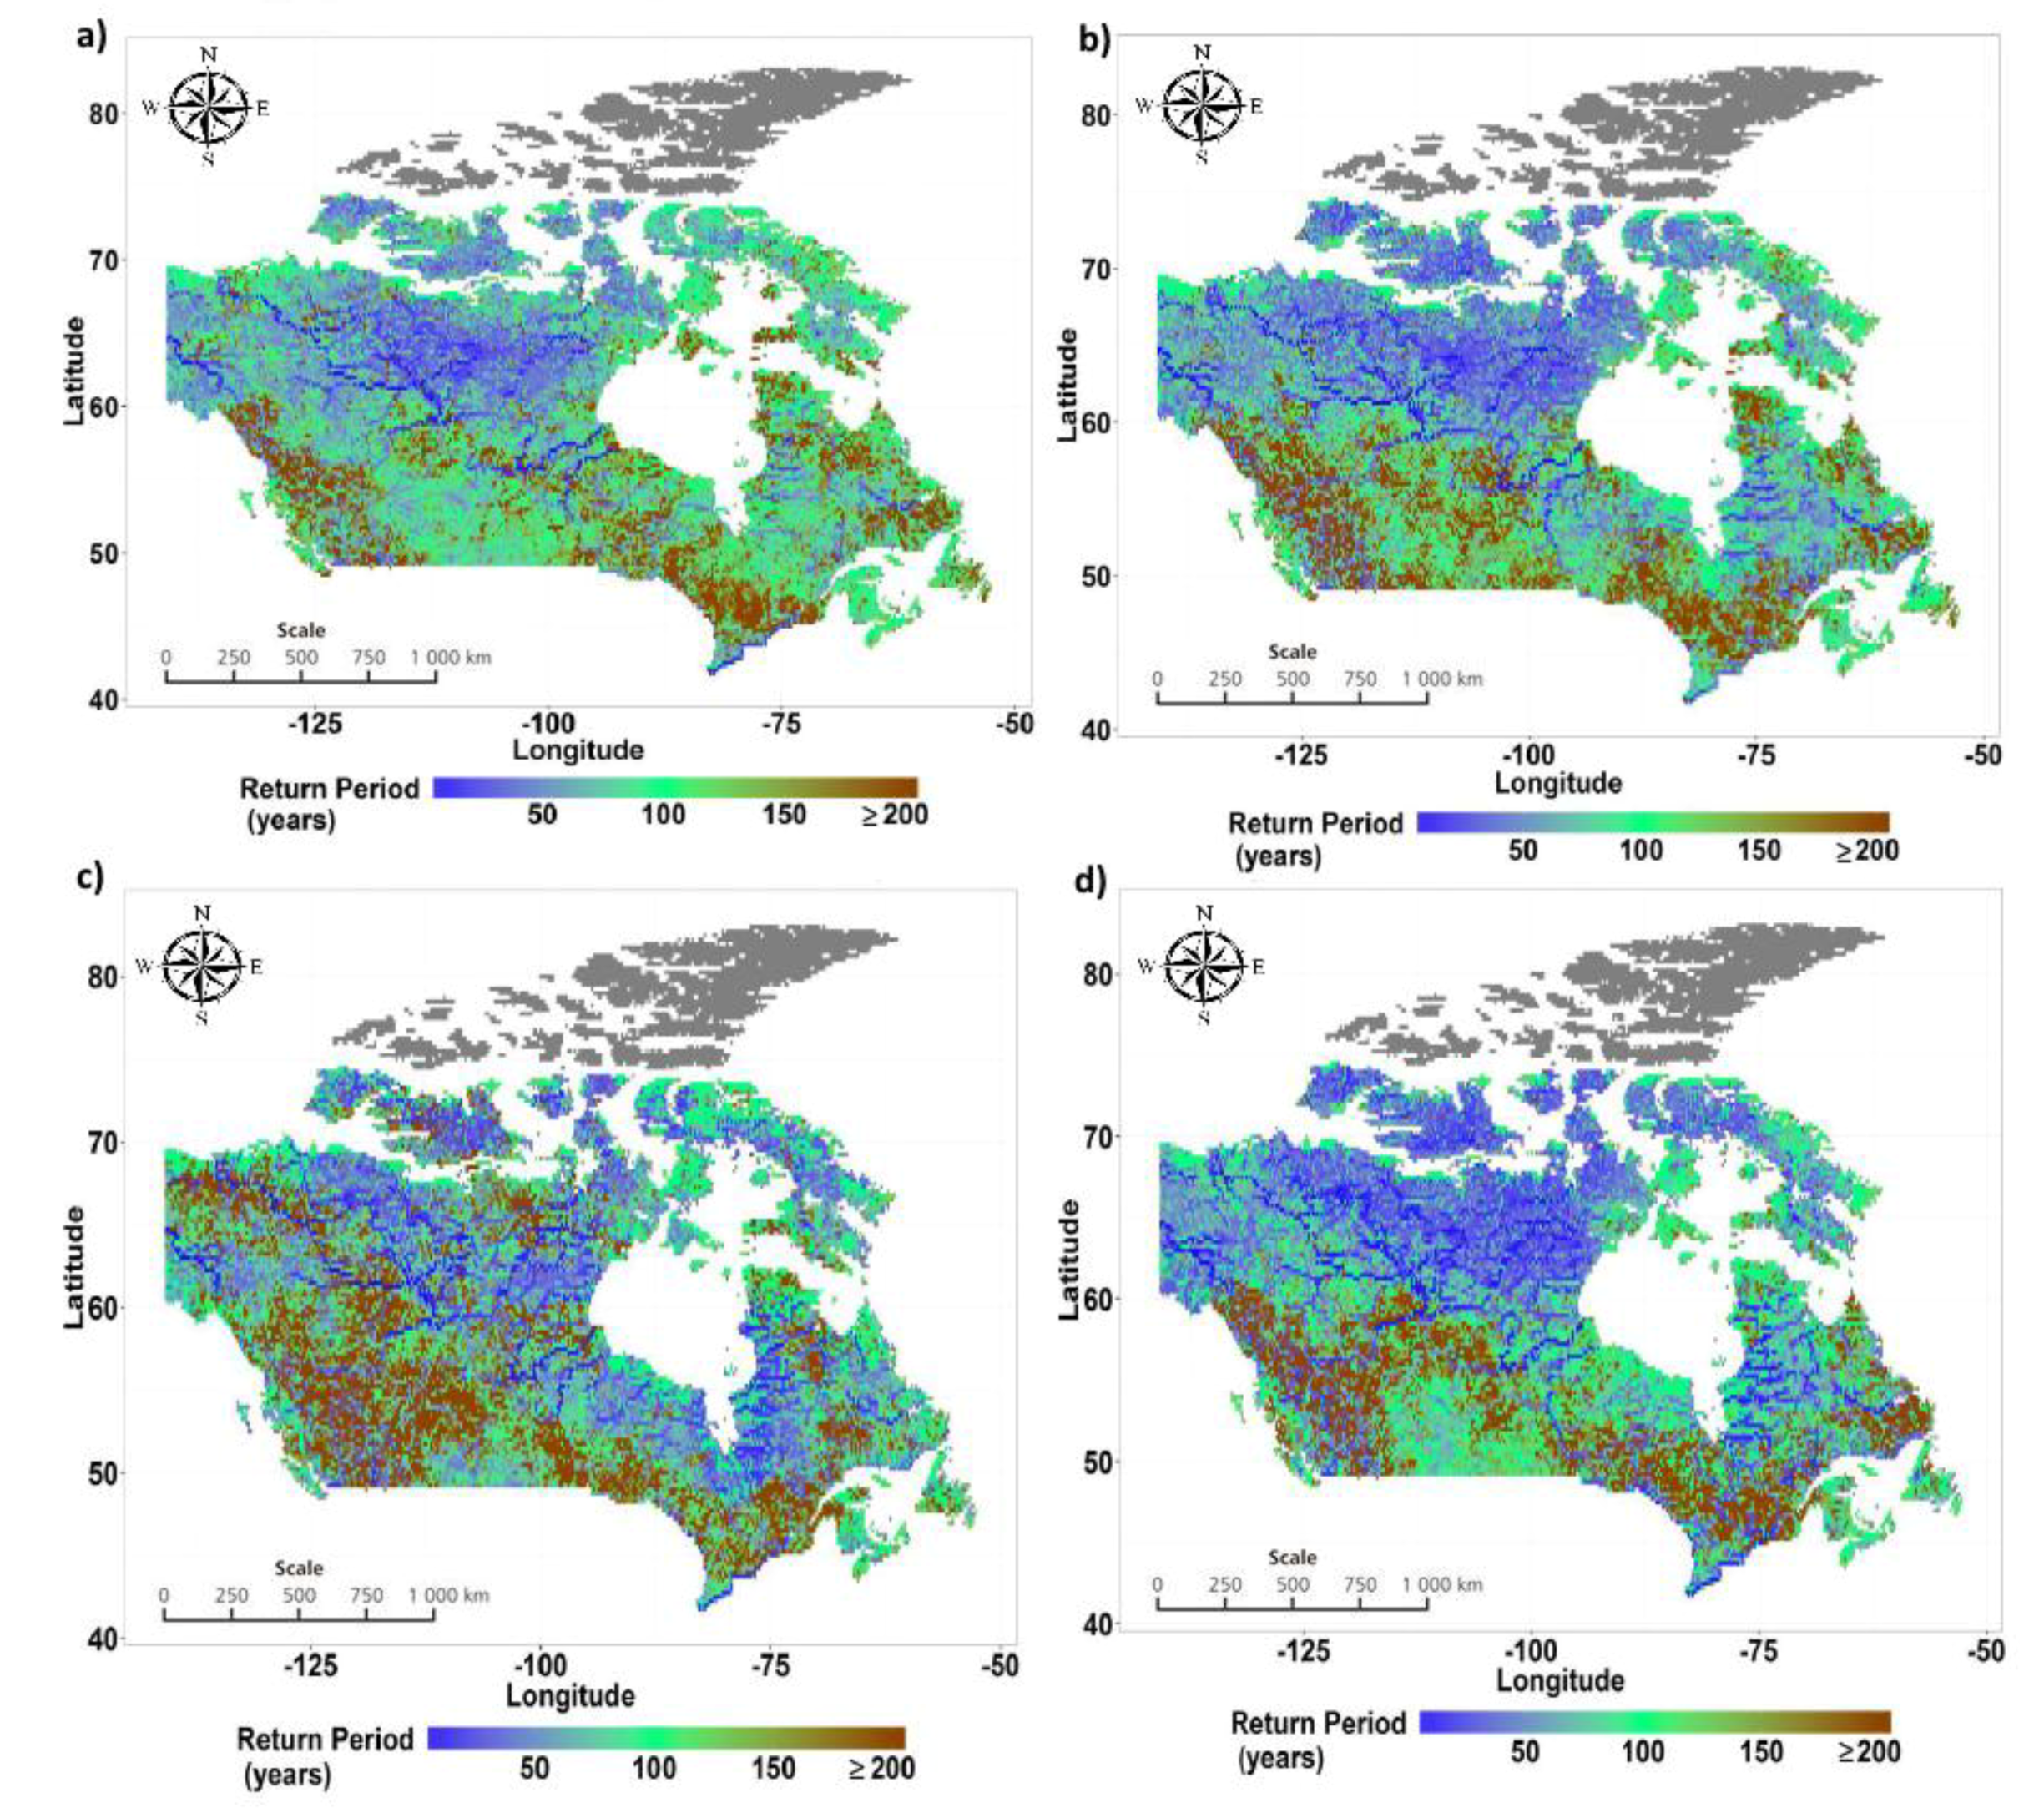
Future flooding frequencies of historical 100-year and 250-year flooding events aggregated using the approach defined in Section 2 (referred as robust GCM median approach hereafter) are presented in Figure 1 and Figure 2 respectively. The regions presented in blue (brown) are projected with future increases (decreases) in flooding frequencies, whereas the regions presented in green are projected with no considerable changes in flooding frequencies. Regions where non-robust (described in Section 2) projections of flood frequencies are obtained are shown in white.
Results indicated that flooding frequencies of historical 100-year and 250-year return period flooding can be expected to increase considerably in the northern regions of Canada, with return periods of historical 100-year floods projected to reduce to 50-year floods or less in the future. This finding is in line with the findings from studies such as [28] which have analyzed observational flow records across Canada and have detected an increasing trend in extreme flows in the northern regions of Canada. A robust signal of projected decreases in flooding frequencies can also be noted from the results for the central and prairies regions of Canada, including areas of British Columbia, Alberta, Manitoba, and Saskatchewan, where the return period of historical 100-year floods can be expected to increase to 165–200 years in the future. These results are again in line with the observed decreases in peak flow trends in the prairies region [58] attributed largely to decreases in snowfall and increases in temperatures during the winter months. Finally, small parts of Nova Scotia, Newfoundland, and Labrador, and northernmost regions of Nunavut, and south-west British Columbia are also projected to experience no considerable changes in flooding frequencies in the future. A comparison of changes projected for 100-year and 250-year return period flooding events indicate that the spatial structure of projected changes is similar for flooding events of both magnitudes.
The spatial distribution of the projected changes in flooding frequencies was found to be similar under the RCP 4.5 and RCP 8.5 emission scenarios, whereas different spatial structures of projected changes were obtained under emission scenarios RCP 2.6 and RCP 6.0. For example, under RCP 6.0, the provinces of Yukon Territory, Northwest Territory, and Nunavut were projected with lower flood frequencies than that projected under the RCP 4.5 and RCP 8.5 emission scenarios. It should however be noted that the total number of GCMs from which runoff projections were available under RCP 6.0 (10) was lower than other emission scenarios, i.e., RCP 2.6 (15), RCP 4.5 (19), and RCP 8.5 (19), which can also contribute towards some of these differences. Finally, changes projected under RCP 2.6 were found to be of the smallest magnitudes as compared to other emission scenarios, with large areas projected with negligible changes in the future.
The above results are based on an approach where the robustness of GCMs in predicting the projected sign of change in runoff is taken into consideration when aggregating the projected changes. To investigate the impact of aggregation procedure method on the obtained results, a relatively straightforward method that does not consider the robustness of projections is used to aggregate them. In this method (referred as ‘all GCM median approach’ hereafter) the median of all projections is taken to obtain the future projected return periods across Canada. The results of future return periods of historical 100-year and 250-year return period flooding events obtained from this approach are shown in Figure 3 and Figure 4, respectively. A comparison of Figure 1 and Figure 2 with Figure 3 and Figure 4 highlight the important similarities and differences in the magnitudes, and the spatial distributions of future projected flood frequencies. It is noted that northern parts of Canada, southwestern Ontario, and northeastern Quebec are projected with an increase in flooding frequencies when the results are aggregated from either approach. Similarly, the northern prairies region and north-central Ontario are projected with decreases in flooding frequencies from either approach. A key difference is obtained in the magnitudes of the projected changes, where higher magnitudes of absolute (positive or negative) changes were obtained from a robust GCM median approach as compared to the GCM median approach. This is likely because projected changes cancel out when averages are taken across all GCMs in the GCM median approach. For the same reason, aggregation using the all GCM median approach was found to result in more areas with no considerable changes as compared to the robust GCM median approach.
Uncertainty magnitudes obtained from future flood frequency projections of historical 100-year floods obtained in the cases of the robust GCM median approach and the GCM median approach are presented in Figure 5 and Figure 6, respectively. To present the spatial heterogeneity of uncertainty effectively, normalized values of uncertainty magnitudes are presented in the figures. The spatial distribution of uncertainty from both approaches was found to be similar; however, the uncertainty magnitudes obtained from all GCM median approaches were found to be higher than that obtained from the robust GCM median approach. Overall, increases in flood magnitudes projected in the northern provinces of Yukon, Northwest Territories, and Nunavut, northern Quebec, and south-west Ontario were found to be among the least uncertain results obtained. The decreases in flood frequency projected for the prairies region, northern Ontario, British Columbia, and Newfoundland and Labrador were found to be among the most uncertain results. These results indicated that there was a larger degree of confidence in the projected increases in flooding frequencies in parts of Canada than the projected decreases. Finally, between the four RCPs, the least uncertainty was found to be associated with the projected changes made under RCP 4.5 as compared to the other RCPs.
5.2. Projected Changes in Flood Occurrence Timing
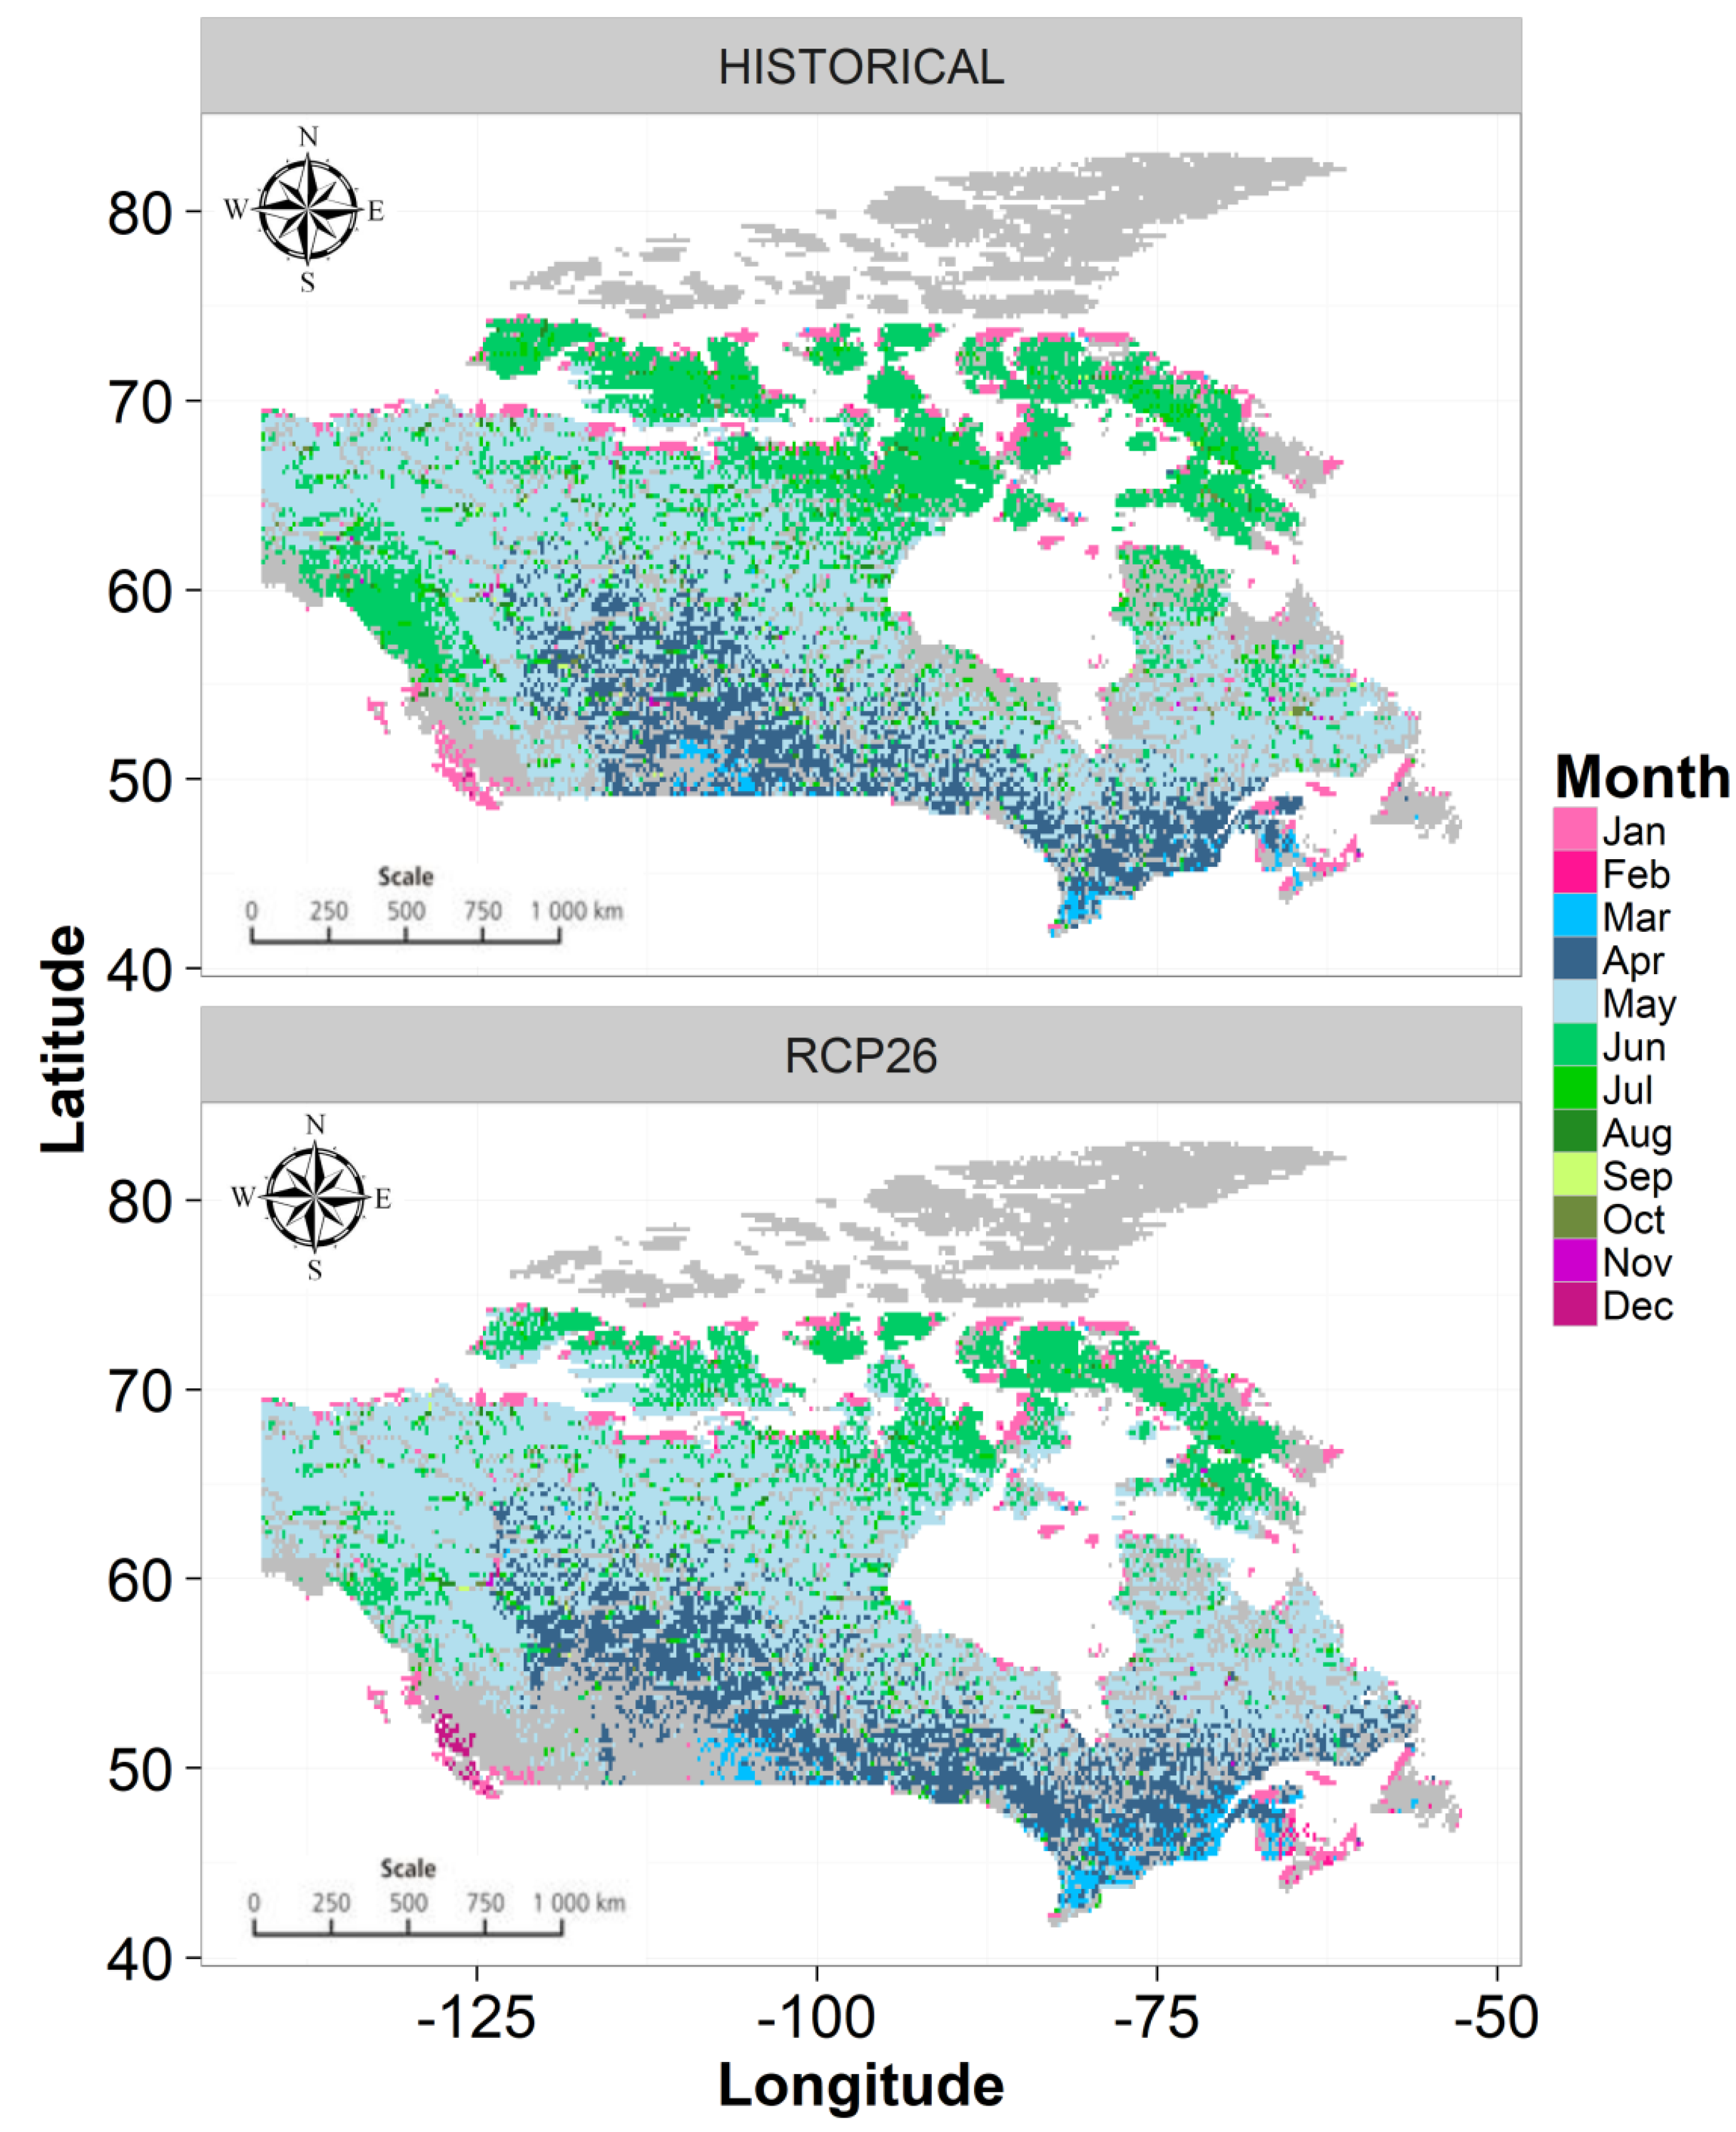
Spatial distributions of flood timing obtained for historical and future timelines are presented in Figure 7 and Figure 8 for two extreme RCPs with regard to greenhouse gas emissions: RCP 2.6 and RCP 8.5, respectively. In the figures, months where wintertime precipitation is likely to contribute to peaks, i.e., November, December, January, February, are shown in the shades of pink, months where snow-melt can be a dominant factor, i.e., March, April, May, are shown in the shades of blue, while months where summertime convection can be a dominant contributor to peaks, i.e., June, July, August, September, October, are shown in shades of green. Grids with non-robust flood timing results are shown in a grey color. Results clearly highlighted projected future increases in the total area effected by snowmelt driven floods (shown in the shades of blue), as well as an earlier onset of snowmelt driven floods in the future. These changes were most evident in the northern and central regions of Canada. Regions in Ontario and Quebec were projected with earlier summertime extreme flows (shifts from April/May to March). Most of the regions from Nunavut and Yukon Territories were projected to have earlier summertime extreme flow changes (from May to April). An earlier onset of snowmelt driven floods in the future was also evident from Figure 9, where grids that are projected with up to two months of early spring melt are shown. These results are in line with the findings from observational studies performed in different locations across Canada, where an earlier onset of snowmelt driven floods has been documented [59,60,61,62], as well as projected under the influences of climate change [34,63,64,65]. This observation is obtained consistently across all four emission scenarios considered for assessment, although it is noted that the GCMs were more uncertain on the prediction of the peak flow month in the cases of RCP 4.5 and RCP 8.5, than in the cases of RCP 2.6 and RCP 6.0.
6. Conclusions
The impacts of climate change have been detected on the characteristics of streamflow and their extremes in catchments distributed across Canada. Given this non-stationarity in climatic conditions, there is a need to quantify the projected future impacts of climate change on flow extremes to better design civil and municipal infrastructure in Canada. It is also important to account for sources of uncertainties when making future projections, so that policymakers can review them before national flood protection guidelines are put into place.
This study quantifies future changes in the frequencies and timings of flooding events across Canada as a consequence of climate change. An ensemble of 84 future runoff projections made by 21 GCMs are considered for assessment. A state-of-the-art mesoscale hydrodynamic model: CaMa-Flood is used to simulate 25 km resolution historical and projected future flows from coarse resolution GCM runoff estimates. The changes projected by different GCMs are aggregated, and associated uncertainty is quantified using two approaches: (1) where only projections made by ‘robust’ GCMs (i.e., those who concur on the sign of change as projected by more than 50% of the GCMs) are considered, and (2) where projections made by all GCMs are considered. In general, it was found that the spatial distribution of the projected changes is similar in the results obtained from both approaches, whereas the magnitudes (both positive and negative) are found to be larger in the first approach than in the second approach. In terms of uncertainty, both approaches demonstrate similar spatial structures; however, results from the second approach demonstrate higher uncertainties than the first approach.
The spatial distributions of projected flood frequency changes convey that the northern provinces of Canada: Northwest Territories, Yukon Territory, and Nunavut, and southwestern Ontario, can be expected to have higher flood frequencies in the future, with a return period of 100-year historical floods becoming 10–60 years by the end of the 21st century. On the contrary, the northern prairies and north-central Ontario can be expected to experience lower flood frequencies, with a return period of 100-year historical floods to become 160–200 years in the future. This projected increase (decrease) in flooding frequencies in the above-mentioned areas is also found to be among the least (most) uncertain changes projected for Canada, indicating that there is a high confidence that flood hazard will increase in the above-stated regions of Canada in the future.
An assessment of projected changes in future flood timing indicates earlier snowmelt in almost all regions of Canada. This is expected, given that future temperatures are projected to increase across Canada under the influence of climate change [23]. Signs of increases in snowmelt-driven floods, and earlier snowmelt have been detected in historical flow records [66,67], as well as have been projected for many Canadian rivers [34,63,64,65]. The results obtained are thus also in line with the findings made in many previous studies performed at catchment scales in Canada.
The flood hazard and risk changes identified in this study can serve as useful guides for decision-makers in Canada to identify flood-hazard areas, and to prioritize appropriate mitigation and response efforts in the face of global climate change. This work can be expanded by overlapping generated flood-hazard maps with exposure elements such as population and water resource management infrastructure, to identify flood risk areas. Efforts in this direction are currently underway.
Author Contributions
A.G. conceptualized the research, performed the formal analysis, and wrote the first draft of the paper. A.G. and S.P.S. provided feedback on the research approach, and reviewed and edited the first draft of the paper. All authors revised the paper and agreed on the final version of the paper.
Funding
Funding for this research came from Chaucer Syndicates (London, UK) and the Natural Sciences and Engineering Research Council of Canada (NSERC).
Acknowledgments
We extend special thanks to Dai Yamazaki for providing a calibrated CaMa-Flood model for the purposes of this study, and for providing useful feedback on the research approach. Detailed feedback and reviews from three anonymous reviewers also helped to improve the quality of this manuscript.
Conflicts of Interest
The authors declare no conflict of interest.
References
- Paprotny, D.; Sebastian, A.; Morales-Napoles, O.; Jonkman, S.N. Trends in flood losses in Europe over the past 150 years. Nat. Commun. 2018, 9, 1985. [Google Scholar] [CrossRef] [PubMed]
- Paprotny, D.; Vousdoukas, M.I.; Morales-Napoles, O.; Jonkman, S.N.; Feyen, L. Compound flood potential in Europe. Hydrol. Earth Syst. Sci. Discuss. 2018. [Google Scholar] [CrossRef]
- Berghuijs, W.R.; Aalbers, E.E.; Larsen, J.R.; Trancoso, R.; Woods, R.A. Recent changes in extreme floods across multiple continents. Environ. Res. Lett. 2017, 12, 114035. [Google Scholar] [CrossRef] [Green Version]
- Sandink, D.; Kovacs, P.; Oulahen, G.; McGillivray, G. Making Flood Insurable for Canadian Homeowners; Institute for Catastrophic Loss Reduction & Swiss Reinsurance Company Ltd.: Toronto, ON, Canada, 2010. [Google Scholar]
- Mangini, W.; Viglione, A.; Hall, J.; Hundecha, Y.; Ceola, S.; Montanari, A.; Rogger, M.; Salinas, J.L.; Borzi, I.; Parajka, J. Detection of trends in magnitude and frequency of flood peaks across Europe. Hydrol. Sci. J. 2018, 63. [Google Scholar] [CrossRef]
- Dandapat, K.; Panda, G.K. A geographic information system-based approach of flood hazards modelling; Paschim Medinipur district; West Bengal; India. J. Disaster Risk Stud. 2018, 10, 518. [Google Scholar] [CrossRef] [PubMed]
- Zischg, A.P.; Felder, G.; Weingartner, R.; Quinn, N.; Coxon, G.; Neal, J.; Freer, J.; Bates, P. Effects of variability in probable maximum precipitation patterns on flood losses. Hydrol. Earth Syst. Sci. 2018, 22, 2759–2773. [Google Scholar] [CrossRef] [Green Version]
- Paprotny, D.; Morales-Napoles, O.; Jonkman, S.N. Efficient pan-European river flood hazard modelling through a combination of statistical and physical models. Nat. Hazards Earth Syst. Sci. 2017, 17, 1267–1283. [Google Scholar] [CrossRef] [Green Version]
- Parkes, B.; Demeritt, D. Defining the hundred year flood: A Bayesian approach for using historic data to reduce uncertainty in flood frequency estimates. J. Hydrol. 2016, 540, 1189–1208. [Google Scholar] [CrossRef]
- Li, C.; Cheng, X.; Li, N.; Du, X.; Yu, Q.; Kan, G. A Framework for Flood Risk Analysis and Benefit Assessment of Flood Control Measures in Urban Areas. Int. J. Environ. Res. Public Health 2016, 13, 787. [Google Scholar] [CrossRef] [PubMed]
- Iacobellis, V.; Castorani, A.; Santo, A.R.D.; Gioia, A. Rationale for flood prediction in karst endorheic areas. J. Arid Environ. 2015, 112A, 98–108. [Google Scholar] [CrossRef]
- Herget, J.; Roggenkamp, T.; Krell, M. Estimation of peak discharges of historical floods. Hydrol. Earth Syst. Sci. 2014, 18, 4029–4037. [Google Scholar] [CrossRef] [Green Version]
- McSharry, P.E.; Little, M.A.; Rodda, H.J.; Rodda, J. Quantifying flood risk of extreme events using density forecasts based on a new digital archive and weather ensemble predictions. Q. J. R. Meteorol. Soc. 2013, 139, 328–333. [Google Scholar] [CrossRef] [Green Version]
- Keast, D.; Ellison, J. Magnitude Frequency Analysis of Small Floods Using the Annual and Partial Series. Water 2013, 5, 1816–1829. [Google Scholar] [CrossRef] [Green Version]
- Fiorentino, M.; Gioia, A.; Iacobellis, V.; Manfreda, S. Regional analysis of runoff thresholds behaviour in Southern Italy based on theoretically derived distributions. Adv. Geosci. 2011, 26, 139–144. [Google Scholar] [CrossRef] [Green Version]
- Reis, D.S.; Stedinger, J.R. Bayesian MCMC flood frequency analysis with historical information. J. Hydrol. 2005, 313, 97–116. [Google Scholar] [CrossRef]
- Blazkov, S.; Beven, K. Flood frequency prediction for data limited catchments in the Czech Republic using a stochastic rainfall model and TOPMODEL. J. Hydrol. 1997, 195, 256–278. [Google Scholar] [CrossRef]
- Moftakhari, H.R.; Salvadori, G.; AghaKouchak, A.; Sanders, B.F.; Mathews, R.A. Compounding effects of sea level rise and fluvial flooding. Proc. Natl. Acad. Sci. USA 2016, 114, 9785–9790. [Google Scholar] [CrossRef] [PubMed]
- Lin, N.; Kopp, R.E.; Horton, B.P.; Donnelly, J.P. Hurricane Sandy’s flood frequency increasing from year 1800 to 2100. Proc. Natl. Acad. Sci. USA 2016. [Google Scholar] [CrossRef] [PubMed]
- IPCC. Summary for Policymakers. In Climate Change. The Physical Science Basis. Contribution of Working Group I to the Fifth Assessment Report of the Intergovernmental Panel on Climate Change; Stocker, T.F., Qin, D., Plattner, G.-K., Tignor, M., Allen, S.K., Boschung, J., Nauels, A., Xia, Y., Bex, V., Midgley, P.M., Eds.; Cambridge University Press: Cambridge, UK; New York, NY, USA, 2013. [Google Scholar]
- IPCC. Managing the Risks of Extreme Events and Disasters to Advance Climate Change Adaptation. A Special Report of Working Groups I and II of the Intergovernmental Panel on Climate Change; Field, C.B., Barros, V., Stocker, T.F., Qin, D., Dokken, D.J., Ebi, K.L., Mastrandrea, M.D., Mach, K.J., Plattner, G.K., Allen, S.K., Eds.; Cambridge University Press: Cambridge, UK; New York, NY, USA, 2012. [Google Scholar]
- Prein, A.F.; Rasmussen, R.M.; Ikeda, K.; Liu, C.; Clark, M.P.; Holland, G.J. The future intensification of hourly precipitation extremes. Nat. Clim. Chang. 2017, 7, 48–52. [Google Scholar] [CrossRef]
- ECCC (Environment and Climate Change Canada). Climate Data and Scenarios for Canada: Synthesis of Recent Observation and Modelling Results. 2016. Available online: https://ec.gc.ca/sc-cs/default.asp?lang=En&n=80E99404-1&printfullpage=true&wbdisable=true#wb-info (accessed on 12 September 2018).
- Gaur, A.; Eichenbaum, M.K.; Simonovic, S.P. Analysis and modelling of surface Urban Heat Island in 20 Canadian cities under climate and land-cover change. J. Environ. Manag. 2017, 206, 145–157. [Google Scholar] [CrossRef] [PubMed]
- Mandal, S.; Simonovic, S.P. Quantification of uncertainty in the assessment of future streamflow under changing climate conditions. Hydrol. Processes 2017, 31, 2076–2094. [Google Scholar] [CrossRef]
- Mladjic, B.; Sushama, L.; Khaliq, M.N.; Laprise, R.; Caya, D.; Roy, R. Canadian RCM Projected Changes to Extreme Precipitation Characteristics over Canada. J. Clim. 2011, 24, 2565–2584. [Google Scholar] [CrossRef] [Green Version]
- Sandink, D. Urban Flooding in Canada. Inst. Catastr. Loss Reduct. 2013, 52, 1–94. [Google Scholar]
- Burn, D.H.; Hag Elnur, M.A. Detection of hydrological trends and variability. J. Hydrol. 2002, 255, 107–122. [Google Scholar] [CrossRef]
- Salas, J.D.; Obeysekera, J. Revisiting the Concepts of Return Period and Risk for Nonstationary Hydrologic Extreme Events. J. Hydrol. Eng. 2014, 19, 554–568. [Google Scholar] [CrossRef]
- Milly, P.C.D.; Betancourt, J.; Falkenmark, M.; Hirsch, R.M.; Kundzewicz, Z.W.; Lettenmaier, D.P.; Stouffer, R.J. Stationarity Is Dead: Whither Water Management? Science 2008, 319, 573–574. [Google Scholar] [CrossRef] [PubMed]
- Gaur, A.; Simonovic, S.P. Climate Change Impact on Flood Hazard in the Grand River Basin; Water Resources Research Report no. 084; Facility for Intelligent Decision Support, Department of Civil and Environmental Engineering: London, ON, Canada, 2013. [Google Scholar]
- Linde, A.H.; Aerts, J.C.J.H.; Bakker, A.M.R.; Kwadijk, J.C.J. Simulating low probability peak discharges for the Rhine basin using resampled climate modeling data. Water Resour. Res. 2010, 46, W04512. [Google Scholar] [CrossRef]
- El-Khoury, A.; Seidou, O.; Lapen, D.R.; Que, Z.; Mohammadian, M.; Sunohara, M.; Bahram, D. Combined impacts of future climate and land use changes on discharge; nitrogen and phosphorus loads for a Canadian river basin. J. Environ. Manag. 2015, 151, 76–86. [Google Scholar] [CrossRef] [PubMed]
- Eum, H.I.; Dibike, Y.; Prowse, T. Comparative evaluation of the effects of climate and land-cover changes on hydrologic responses of the Muskeg River; Alberta; Canada. J. Hydrol. Reg. Stud. 2016, 8, 198–221. [Google Scholar] [CrossRef]
- Huziy, O.; Sushama, L.; Khaliq, M.N.; Laprise, R.; Lehner, B.; Roy, R. Analysis of streamflow characteristics over Northeastern Canada in a changing climate. Clim. Dyn. 2013, 40, 1879–1901. [Google Scholar] [CrossRef]
- De-Elia, R.; Cote, H. Climate and climate change sensitivity to model configuration in the Canadian RCM over North America. Meteorol. Z. 2010, 19, 325–339. [Google Scholar] [CrossRef]
- Soulis, E.D.; Snelgrove, K.R.; Kouwen, N.; Seglenieks, F.; Verseghy, D.L. Towards closing the vertical water balance in Canadian atmospheric models: Coupling of the land surface scheme CLASS with the distributed hydrological model WATFLOOD. Atmos. Ocean 2000, 38, 251–269. [Google Scholar] [CrossRef]
- Dankers, R.; Feyen, L. Climate change impact on flood hazard in Europe: An assessment based on high resolution climate simulations. J. Geophys. Res. 2008, 113, D19105. [Google Scholar] [CrossRef]
- Christensen, J.H.; Christensen, O.B.; Lopez, P.; van Meijgaard, E.; Botzet, M. The HIRHAM4 Regional Atmospheric Climate Model; Scientific Report 96-4; Danish Meteorological Institute: Copenhagen, Denmark, 1996. [Google Scholar]
- Jones, C.G.; Willen, U.; Ullerstig, A.; Hansson, U. The Rossby Centre Regional Atmospheric Climate Model part I: Model climatology and performance for the present climate over Europe. R. Swed. Acad. Sci. 2004, 33, 199–210. [Google Scholar] [CrossRef]
- De Roo, A.P.J.; Wesseling, C.G.; Van Deurzen, W.P.A. Physically-based river basin modelling within a GIS: The LISFLOOD model. Hydrol. Processes 2000, 14, 1981–1992. [Google Scholar] [CrossRef]
- Gosling, S.N.; Arnell, N.W. Simulating current global river runoff with a global hydrological model: Model revisions; validation; and sensitivity analysis. Hydrol. Process. 2011, 25, 1129–1145. [Google Scholar] [CrossRef]
- Arnell, N.W.; Gosling, S.N. The impacts of climate change on hydrological regimes at the global scale. J. Hydrol. 2013, 486, 351–364. [Google Scholar] [CrossRef]
- Yamazaki, D.; Lee, H.; Alsdorf, E.; Dutra, E.; Kim, H.; Kanae, S.; Oki, T. Analysis of the water level dynamics simulated by a global river model: A case study in the Amazon River. Water Resour. Res. 2012, 48, W09508. [Google Scholar] [CrossRef]
- Yamazaki, D.; Kanae, S.; Kim, H.; Oki, T. A physically based description of floodplain inundation dynamics in a global river routing model. Water Resour. Res. 2011, 47, 1–21. [Google Scholar] [CrossRef]
- Hirabayashi, Y.; Mahendran, R.; Koirala, S.; Konoshima, L.; Yamazaki, D.; Watanabe, S.; Kanae, S. Global flood risk under climate change. Nat. Clim. Chang. 2013, 3, 816–821. [Google Scholar] [CrossRef]
- Van Vuuren, D.P. The representative concentration pathways: An overview. Clim. Chang. 2011, 109, 5–31. [Google Scholar] [CrossRef]
- Yamazaki, D.; de Almeida, G.AM.; Bates, P.D. Improving computational efficiency in global river models by implementing the local inertial flow equation and a vector-based river network map. Water Resour. Res. 2013, 49, 7221–7235. [Google Scholar] [CrossRef] [Green Version]
- Yamazaki, D.; Sato, T.; Kanae, S.; Hirabayashi, Y.; Bates, P.D. Regional flood dynamics in a bifurcating mega delta simulated in a global river model. Geophys. Res. Lett. 2014, 41, 3127–3135. [Google Scholar] [CrossRef] [Green Version]
- Yamazaki, D.; Oki, T.; Kanae, S. Deriving a global river network map and its sub-grid topographic characteristics from a fine-resolution flow direction map. Hydrol. Earth Syst. Sci. 2009, 13, 2241–2251. [Google Scholar] [CrossRef] [Green Version]
- Ikeuchi, H.; Hirabayashi, Y.; Yamazaki, D.; Kiguchi, M.; Koirala, S.; Nagano, T.; Kotera, A.; Kanae, S. Modeling complex flow dynamics of fluvial floods exacerbated by sea level rise in the Ganges-Brahmaputra-Meghna delta. Environ. Res. Lett. 2015, 10, 124011. [Google Scholar] [CrossRef]
- Hu, X.; Hall, J.W.; Shi, P.; Lim, W.H. The spatial exposure of the Chinese infrastructure system to flooding and drought hazards. Nat. Hazards 2016, 80, 1083–1118. [Google Scholar] [CrossRef]
- Mateo, C.M.; Hanasaki, N.; Komori, D.; Tanaka, K.; Kiguchi, M.; Champathong, M.; Sukhapunnaphan, T.; Yamazaki, D.; Oki, T. Assessing the impacts of reservoir operation to floodplain inundation by combining hydrological, reservoir management, and hydrodynamic models. Water Resour. Res. 2014, 50, 7245–7266. [Google Scholar] [CrossRef] [Green Version]
- Koirala, S.; Hirabayashi, Y.; Mahendran, R.; Kanae, S. Global assessment of agreement among streamflow projections using CMIP5 model outputs. Environ. Res. Lett. 2014, 9, 064017. [Google Scholar] [CrossRef] [Green Version]
- Pappenberger, F.; Dutra, E.; Wetterhall, F.; Cloke, H.L. Deriving global flood hazard maps of fluvial floods through a physical model cascade. Hydrol. Earth Syst. Sci. 2012, 16, 4143–4156. [Google Scholar] [CrossRef] [Green Version]
- Vogel, R.M.; Wilson, I. Probability distribution of annual maximum; mean; and minimum streamflows in the United States. J. Hydrol. Eng. 1996, 1, 69–76. [Google Scholar] [CrossRef]
- R Development Core Team. R: A Language and Environment for Statistical Computing; R Foundation for Statistical Computing: Vienna, Austria, 2018; ISBN 3-900051-07-0. [Google Scholar]
- Burn, D.H.; Fan, L.; Bell, G. Identification and quantification of streamflow trends on the Canadian Prairies. Hydrol. Sci. J. 2008, 53, 538–549. [Google Scholar] [CrossRef] [Green Version]
- Rokaya, P.; Budhathoki, S.; Lindenschmidt, K.-E. Trends in the Timing and Magnitude of Ice-Jam Floods in Canada. Sci. Rep. 2018, 8, 5834. [Google Scholar] [CrossRef] [PubMed] [Green Version]
- Semmens, K.A.; Romage, J.; Bartsch, A.; Liston, G.E. Early snowmelt events: Detection; distribution; and significance in a major sub-arctic watershed. Environ. Res. Lett. 2013, 8, 014020. [Google Scholar] [CrossRef]
- Déry, S.J.; Stahl, K.; Moore, R.D.; Whitfield, P.H.; Menounos, B.; Burford, J.E. Detection of runoff timing changes in pluvial, nival and glacial rivers of western Canada. Water Resour. Res. 2009, 45, W04426. [Google Scholar] [CrossRef]
- Stewart, I.T.; Cayan, D.R.; Dettinger, M.D. Changes toward Earlier Streamflow Timing across Western North America. J. Clim. 2005, 18, 1136–1155. [Google Scholar] [CrossRef]
- Dibike, Y.; Shakibaeinia, A.; Eum, H.; Prowse, T.; Droppo, I. Effects of projected climate on the hydrodynamic and sediment transport regime of the lower Athabasca River in Alberta, Canada. River Res. Appl. 2018. [Google Scholar] [CrossRef]
- Poitras, V.; Sushama, L.; Seglenieks, F.; Khaliq, M.N.; Soulis, E. Projected Changes to Streamflow Characteristics over Western Canada as Simulated by the Canadian RCM. J. Hydrometeorol. 2011, 12, 1395–1413. [Google Scholar] [CrossRef]
- Pohl, S.; Marsh, P.; Bonsal, B.R. Modeling the Impact of Climate Change on Runoff and Annual Water Balance of an Arctic Headwater Basin. Arctic 2006, 60, 173–186. [Google Scholar] [CrossRef]
- Whitfield, P.H.; Cannon, A.J. Recent Variations in Climate and Hydrology in Canada. Can. Water Resour. J. 2000, 25, 19–65. [Google Scholar] [CrossRef]
- Zhang, X.; Harvey, K.D.; Hogg, W.D.; Yuzyk, T.R. Trends in Canadian Streamflow. Water Resour. Res. 2001, 37, 987–998. [Google Scholar] [CrossRef]
Figure 1.
Future return periods of historical 100-year flood event for: (a) RCP 2.6; (b) RCP 4.5; (c) RCP 6.0; and (d) RCP 8.5. The results presented are GCM projections aggregated using the robust GCM median approach.
Figure 1.
Future return periods of historical 100-year flood event for: (a) RCP 2.6; (b) RCP 4.5; (c) RCP 6.0; and (d) RCP 8.5. The results presented are GCM projections aggregated using the robust GCM median approach.

Figure 2.
Future return periods of historical 250-year flood event for: (a) RCP 2.6; (b) RCP 4.5; (c) RCP 6.0; and (d) RCP 8.5. The results presented are GCM projections aggregated using the robust GCM median approach.
Figure 2.
Future return periods of historical 250-year flood event for: (a) RCP 2.6; (b) RCP 4.5; (c) RCP 6.0; and (d) RCP 8.5. The results presented are GCM projections aggregated using the robust GCM median approach.

Figure 3.
Future return periods of historical 100-year flood event for: (a) RCP 2.6; (b) RCP 4.5; (c) RCP 6.0; and (d) RCP 8.5. The results presented are GCM projections aggregated using the robust GCM median approach.
Figure 3.
Future return periods of historical 100-year flood event for: (a) RCP 2.6; (b) RCP 4.5; (c) RCP 6.0; and (d) RCP 8.5. The results presented are GCM projections aggregated using the robust GCM median approach.

Figure 4.
Future return periods of a historical 250-year flood event for: (a) RCP 2.6; (b) RCP 4.5; (c) RCP 6.0; and (d) RCP 8.5. The results presented are GCM projections aggregated using the robust GCM median approach.
Figure 4.
Future return periods of a historical 250-year flood event for: (a) RCP 2.6; (b) RCP 4.5; (c) RCP 6.0; and (d) RCP 8.5. The results presented are GCM projections aggregated using the robust GCM median approach.

Figure 5.
Normalized values of uncertainties obtained for different regions of Canada for 100-year return period flooding events when GCM projections are aggregated using a robust GCM median approach.
Figure 5.
Normalized values of uncertainties obtained for different regions of Canada for 100-year return period flooding events when GCM projections are aggregated using a robust GCM median approach.

Figure 6.
Normalized values of uncertainties obtained for different regions of Canada for 100-year return period flooding event when GCM projections are aggregated using a GCM median approach.
Figure 6.
Normalized values of uncertainties obtained for different regions of Canada for 100-year return period flooding event when GCM projections are aggregated using a GCM median approach.

Figure 7.
Monthly distribution of extreme flows obtained from aggregated runoff results obtained for historical and future timelines. Future projections are presented for RCP 2.6.
Figure 7.
Monthly distribution of extreme flows obtained from aggregated runoff results obtained for historical and future timelines. Future projections are presented for RCP 2.6.

Figure 8.
Monthly distribution of extreme flows obtained from aggregated runoff results obtained for historical and future timelines. Future projections are presented for RCP 8.5.
Figure 8.
Monthly distribution of extreme flows obtained from aggregated runoff results obtained for historical and future timelines. Future projections are presented for RCP 8.5.

Figure 9.
Grids that are projected with up to two months of earlier onset of spring-time extreme flow.
Figure 9.
Grids that are projected with up to two months of earlier onset of spring-time extreme flow.


Table 1.
Parameters in the catchment-based macro-scale floodplain (CaMa-Flood) model.
| S. No | Name | Symbol | Unit |
|---|---|---|---|
| 1 | Channel length | L | m |
| 2 | Channel width | W | m |
| 3 | Bank height | B | m |
| 4 | Surface altitude | Z | m |
| 5 | Distance to downstream cell | X | m |
| 6 | Unit catchment area | Ac | m2 |
| 7 | Manning’s roughness coefficient | n | m−1/3/s |
Table 2.
GCM-RCP combinations for which at least one set of historical and future realizations were available in the CMIP5 multi-model ensemble. Note that for some cases; more than one realizations were available, and all of them are included for assessment in this study.
Table 2.
GCM-RCP combinations for which at least one set of historical and future realizations were available in the CMIP5 multi-model ensemble. Note that for some cases; more than one realizations were available, and all of them are included for assessment in this study.
| S. No. | GCM Names (Web Reference) | Institution | RCP 2.6 | RCP 4.5 | RCP 6.0 | RCP 8.5 |
|---|---|---|---|---|---|---|
| 1 | NorESM1-M https://portal.enes.org/models/earthsystem-models/ncc/noresm | Norwegian Climate Centre | √ | √ | √ | |
| 2 | MRI-ESM1 http://www.mri-jma.go.jp/Publish/Technical/DATA/VOL_64/index_en.html | Meteorological Research Institute | √ | |||
| 3 | MRI-CGCM3 http://www.glisaclimate.org/model-inventory/meteorological-research-institute-cgcm-version-3 | Meteorological Research Institute | √ | √ | √ | √ |
| 4 | MPI-ESM-MR https://www.mpimet.mpg.de/en/science/models/mpi-esm/cmip5/ | Max Planck Institute for Meteorology (MPI-M) | √ | √ | √ | |
| 5 | MPI-ESM-LR https://www.mpimet.mpg.de/en/science/models/mpi-esm/cmip5/ | Max Planck Institute for Meteorology (MPI-M) | √ | √ | √ | |
| 6 | MIROC5 http://amaterasu.ees.hokudai.ac.jp/~fswiki/pub/wiki.cgi?page=CMIP5 | Atmosphere and Ocean Research Institute (The University of Tokyo); National Institute for Environmental Studies; and Japan Agency for Marine-Earth Science and Technology | √ | √ | √ | √ |
| 7 | MIROC-ESM http://amaterasu.ees.hokudai.ac.jp/~fswiki/pub/wiki.cgi?page=CMIP5 | Japan Agency for Marine-Earth Science and Technology; Atmosphere and Ocean Research Institute (The University of Tokyo); and National Institute for Environmental Studies | √ | √ | √ | √ |
| 8 | MIROC-ESM-CHEM http://amaterasu.ees.hokudai.ac.jp/~fswiki/pub/wiki.cgi?page=CMIP5 | Japan Agency for Marine-Earth Science and Technology; Atmosphere and Ocean Research Institute (The University of Tokyo); and National Institute for Environmental Studies | √ | √ | √ | √ |
| 9 | INMCM4 http://dx.doi.org/10.1134/S000143381004002X | Institute for Numerical Mathematics | √ | √ | ||
| 10 | GFDL-ESM2 Mhttp://data1.gfdl.noaa.gov/ | Geophysical Fluid Dynamics Laboratory | √ | √ | √ | |
| 11 | GFDL-ESM2G http://data1.gfdl.noaa.gov/ | Geophysical Fluid Dynamics Laboratory | √ | √ | √ | √ |
| 12 | GFDL-CM3 http://data1.gfdl.noaa.gov/ | Geophysical Fluid Dynamics Laboratory | √ | √ | √ | |
| 13 | FGOALS-g2 http://www.lasg.ac.cn/fgoals/index2.asp | LASG; Institute of Atmospheric Physics; Chinese Academy of Sciences; and CESS; Tsinghua University | √ | √ | √ | |
| 14 | CSIRO-Mk3-6-0 https://data.csiro.au/dap/search?q=&p=1&rpp=25&tn=Oceanography%20not%20elsewhere%20classified&sb=RELEVANCE&dr=all&collectionType=Data&topics.raw=Climate%20Change%20Processes | Commonwealth Scientific and Industrial Research Organisation in collaboration with the Queensland Climate Change Centre of Excellence | √ | √ | √ | √ |
| 15 | CNRM-CM5 https://portal.enes.org/models/earthsystem-models/cnrm-cerfacs/cnrm-cm5 | Centre National de Recherches Meteorologiques / Centre Europeen de Recherche et Formation Avancees en Calcul Scientifique | √ | √ | √ | |
| 16 | CMCC-CMS http://www.glisaclimate.org/node/2241 | Centro Euro-Mediterraneo per I Cambiamenti Climatici | √ | √ | ||
| 17 | CMCC-CM https://www.cmcc.it/models/cmcc-cm | Centro Euro-Mediterraneo per I Cambiamenti Climatici | √ | √ | ||
| 18 | CMCC-CESM https://portal.enes.org/models/earthsystem-models/cmcc/c-esm | Centro Euro-Mediterraneo per I Cambiamenti Climatici | √ | |||
| 19 | CanESM2 https://www.google.com/url?q=http://climate-modelling.canada.ca/climatemodeldata/cgcm4/CanESM2/index.shtml&sa=D&ust=1516232596583000&usg=AFQjCNGO-4mT9kpaLCUnf3bpt2znikHaPw | Canadian Centre for Climate Modelling and Analysis | √ | √ | √ | |
| 20 | BCC-CSM-1-1 http://forecast.bcccsm.cma.gov.cn/web/channel-34.htm | Beijing Climate Center; China Meteorological Administration | √ | √ | √ | √ |
| 21 | BCC-CSM-1-1-M http://forecast.bcccsm.cma.gov.cn/web/channel-34.htm | Beijing Climate Center; China Meteorological Administration | √ | √ | √ |
© 2018 by the authors. Licensee MDPI, Basel, Switzerland. This article is an open access article distributed under the terms and conditions of the Creative Commons Attribution (CC BY) license (http://creativecommons.org/licenses/by/4.0/).
Share and Cite
MDPI and ACS Style
Gaur, A.; Gaur, A.; Simonovic, S.P. Future Changes in Flood Hazards across Canada under a Changing Climate. Water 2018, 10, 1441. https://doi.org/10.3390/w10101441
AMA Style
Gaur A, Gaur A, Simonovic SP. Future Changes in Flood Hazards across Canada under a Changing Climate. Water. 2018; 10(10):1441. https://doi.org/10.3390/w10101441
Chicago/Turabian StyleGaur, Ayushi, Abhishek Gaur, and Slobodan P. Simonovic. 2018. "Future Changes in Flood Hazards across Canada under a Changing Climate" Water 10, no. 10: 1441. https://doi.org/10.3390/w10101441
Note that from the first issue of 2016, this journal uses article numbers instead of page numbers. See further details here.