Evaluating the Impaction of Coal Mining on Ordovician Karst Water through Statistical Methods

1
School of Environmental Science and Engineering, Chang’an University, Xi’an 710054, Shaanxi, China
2
Xi’an Research Institute Company of China Coal Technology and Engineering Group, Xi’an 710054, Shaanxi, China
*
Authors to whom correspondence should be addressed.
Water 2018, 10(10), 1409; https://doi.org/10.3390/w10101409
Submission received: 13 August 2018
/
Revised: 3 October 2018
/
Accepted: 9 October 2018
/
Published: 10 October 2018
(This article belongs to the Section Water Resources Management, Policy and Governance)
Abstract
:This study aims to reveal karst water trend change and the variation of affecting factors in the Heilongdong spring area due to long-term coal mining. In this study, five yearly recoded data over more than 40 years were collected, including underground water level dynamics, water flow, groundwater withdrawal for industrial and agricultural production and domestic production (groundwater withdrawal), mine drainage and rainfall. On that basis, we conducted linear regression, innovative trend analysis (ITA) and the Mann–Kendall method to quantitative analyze the trend and mutation sequence of the time series of environmental hydrological parameters in the study area. To determine the correlation of different affecting parameters under coal mining, as well as the trend of the correlation, we conducted multivariate linear regression analysis and exploited wavelet coherence. The results suggest: (1) under human influence, the annual value of underground water level in the Heilongdong spring area shows an insignificant decrease of 0.42 m/a; precipitation shows a significant downward trend of 2.34 mm/a, primarily the decrease of rainstorm; the spring flow shows a significant decrease of 9.41 × 10⁶ m3/a, and springs with different flow show a significant decrease. (2) The abrupt changes of various factors affecting spring flow in the study area were successively delayed by rainfall, mine drainage rate, industrial and agricultural water consumption and underground water level. (3) Since the year of the start of dramatic changes, under the impact of increased manual mining and mine drainage, the amount of spring overflow has decreased, the groundwater level has decreased, and the groundwater dynamics have varied from meteorological type to meteorology-artificial type. Moreover, the factors affecting the dynamic changes of groundwater have been changed to rainfall and artificial mining and drainage. (4) As the results of Wavelet coherence analysis suggest, the spring flow resonates significantly with rainfall from the period of 3a to 15a. The correlation between the original spring flow and groundwater level is more obvious than that between the original spring flow and rainfall. The correlation between residual flow and groundwater level is less obvious than that between residual flow and rainfall. The above results provide a basis for comprehensively exploiting water resources in coal mining areas and regional groundwater resources protection measures.
1. Introduction
Karst water resources are a vital component of water resources and an important source of water for human production and life. But due to the corrosion characteristics of karst aquifers, karst water is susceptible to human activities and climate change [1,2]. One-fourth of the karst area on Earth is distributed in China, and one-half of the karst bare area is in the northern China [3,4]. The evaluation of the change trend and influence factors of karst groundwater resources is of great significance to increasing crop yield, preventing geological disasters and predicting groundwater resources [5,6]. In the present paper, the Fengfeng mining area pertains to the Heilongdong karst spring basin located in Hebei central energy base. The Heilongdong karst spring basin has long acted as the significant water supply sources of industrial, agricultural production and life. As coal, steel and industry and agriculture in the spring field have been advancing, human exploitation and emission has increased dramatically, and shortage of water resources has increased significantly [7]. In the 1990s, human exploitation and emission had reached above 95% of the karst water resources system in Heilongdong karst spring basin; 40% of the human exploitation and emission is attributed to mine drainage water through groundwater overdraft that happened in individual years, and springs have appeared several events of cutoff. As a result, the water level of regional groundwater dropped sharply, leading to the abandonment of wells, difficulties in water supply, ecological damage and other phenomena. Thus, the influence of strong drainage in coal mining on the karst water system cannot be ignored.
Although many works have studied the impaction of coal mining on Heilongdong karst spring basin [8,9], variations in coal mining did not raise much concern. Several recent research projects have been undertaken in Heilongdong karst spring basin, which is a typical karst spring in north China. The common methods having been used to research the influences of coal mining on karst groundwater include numerical simulation, analytic hierarchy process and so on [10,11,12,13], but boundary condition and other parameters must be strict to establish conceptual and mathematical models. There are so many factors associated with the effect of coal exploitation on groundwater resources, including rainfall, water for industrial, agricultural and life, underground water level and flow, and initial conditions many decades ago are hard to define, that numerical simulation is very difficult. In this paper, we try to adopt trend and correlation analysis to evaluate the impact by statistical tools, based on the long-term observation data.
There have been many relevant researches of trend analysis at home and abroad. Several methods were employed to identify rainfall trends, including the Mann–Kendall test, Spearman’s Rho (SR), Sen’s slope estimation, linear regression and the innovative trend analysis (ITA) method [14,15,16,17,18]. Oztopal and Sen [19] used innovative trend methodology to study precipitation records from the year 1940 to 1999 in Turkey. By introducing the time series values into three categories, i.e., low, medium and high clusters, more information can be acquired using the innovative trend methodology. Rehman [20] studied long-term wind speed trends in the Kingdom of Saudi Arabia for the monthly and annual means and standard deviations by performing the Mann–Kendall test and linear regression. Wu [21] used two graphical methods, the quantile perturbation method (QPM), and the partial trend method (PTM), to evaluate anomalies and changes of rainfall.
With regard to correlation analysis, several works only considered natural factors that affect the spring flow, such as rainfall, large scale climatic patterns, temperature, monsoons and land-use changes [22,23,24,25]. Some works synthetically analyze rainfall change and human activities. Zhang et al. [24] studied the effects of monsoons and teleconnection patterns on the Niangziguan Karst Spring discharge, in northern China, using wavelet transform, wavelet coherence analysis and global coherence coefficient. Stockton et al. [26] built an empirical relationship between precipitation, temperature and runoff, and assessed the impact on hydrological factors with the change of temperature and precipitation. Wang et al. [27] demonstrated that the correlation between groundwater level and river stage is higher than precipitation in the long term using wavelet analysis. He also found that spatial patterns are similar to patterns of geologic deposits using cross-correlation analysis. Human activities also intensify the process. Huo et al. [28] studied the effect of human activities and climate changes on the annual runoff. Zhang et al. [29] assessed the influence of climate variability and human activities on stream flow variation using the runoff sensitive coefficients method and a SIMHYD model which is a lumped conceptual hydrological model. Haucke [30] employed multiple regression analysis and identified the correlation of precipitation, pumping and groundwater level based on the data from different years to 2008. Although many research projects have examined correlation among rainfall, groundwater level and human activities, those studies have linked precipitation or human activities to groundwater level or spring discharge, and the relations and trends of influence factors and spring discharge have not been studied well when the study area is full of mines.
Most studies of karst groundwater changes in the Heilongdong spring basin have been mainly focused on either the rainfall factor or the groundwater withdrawal which includes industrial, agricultural and living exploitation. The present paper conducts trend and correlation analysis by statistical tools, aims to quantitatively evaluate the influence of long term coal mining on water resources in Heilongdong karst spring area and the degree of correlation change among rainfall, groundwater level and spring flow, in order to further clarify the effect of long-term coal mining on an Ordovician karst spring.
2. Study Area and Data
2.1. Hydrogeological Conditions
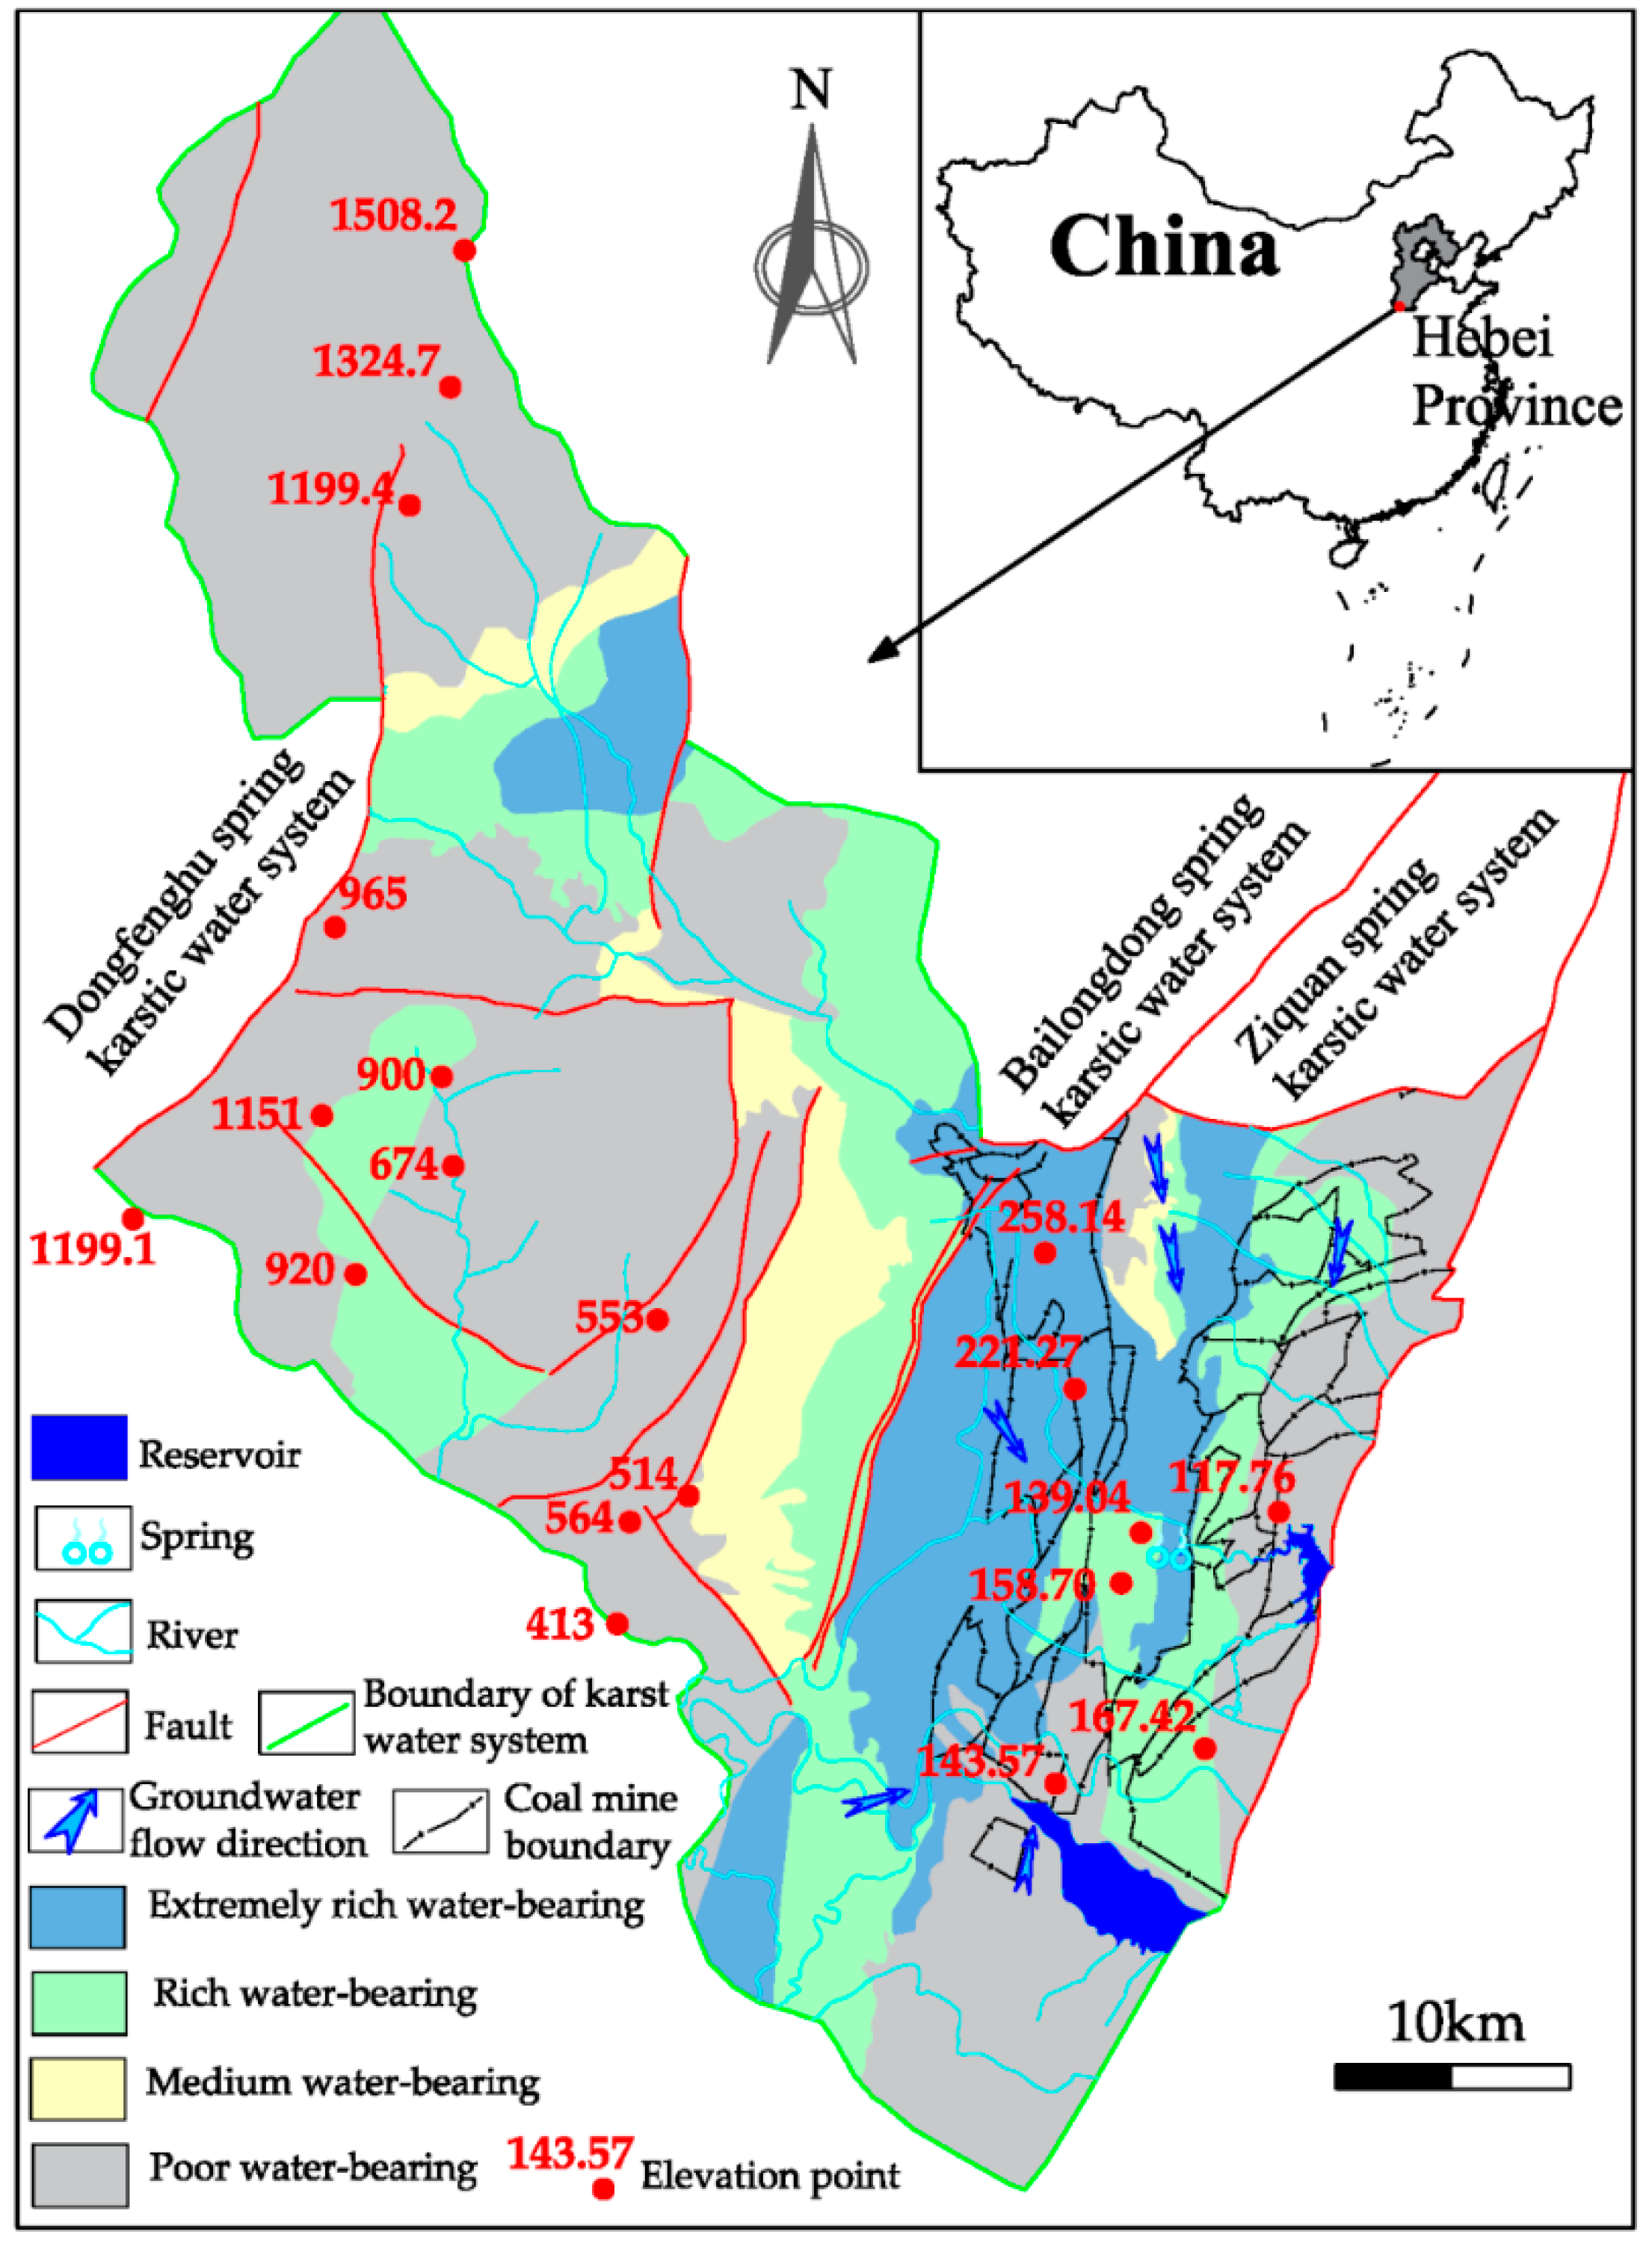
The karst water system is located in Hebei province and west of Handan city, covering the south-west of Handan city and north of Anyang city, where the overall topographical feature is high in the west and low in the east (Figure 1). The strike of the layers is changed from NE to SEE, and the dip angle of the layers is 10–25°. With full strata outcropping in the studied area, the strata are Archaean, Proterozoic, Cambrian, Ordovician, Carboniferous, Permian, Neogene and Quaternary in the order from old to new. The major aquifers of the basin consist of Cambrian and Ordovician limestones, Quaternary sandstone and unconsolidated sediments.
Because our focus is the karst water in Heilongdong karst spring area, based on water yield property, the spring area is divided into four zones (Figure 1). In the extremely rich water-bearing zone, the aquifer medium is Ordovician limestone with highly developed fractures, the units inflow in a single well is greater than 5 L/(s·m). In the rich water-bearing zone, aquifer medium is Ordovician limestone with developed fractures, the units-inflow in a single well is less than 5 L/(s·m) and greater than 1 L/(s·m). In the medium water-bearing zone, aquifer medium is Ordovician limestone, the units-inflow in a single well is less than 1 L/(s·m) and greater than 0.1 L/(s·m). In the poor water bearing zone, aquifer medium is Cambrian limestone, the units inflow in a single well is less than 0.1 L/(s·m).
2.2. Data
The observation data (1959–2006) in 10 stations from the Handan city’s weather bureau were used for rainfall in Heilongdong karst spring basin. Spring flows primarily originate from Heilongdong springs and next from Bailongdong springs. The complete overflow data series are yielded in accordance with measured data and interpolation spill in the years from 1959 to 2006. Groundwater withdrawal includes industrial, agricultural and living exploitation. It is provided by Handan municipal water conservancy bureau, including underground water extraction in the towns and villages in Fengfeng mining area. We calculated the annual drainage quantity in the karst water system one by one in coal mines and iron mines. The groundwater level used the data from long term observation holes and dynamic long term observation holes. The holes is located in the east of Gushan, respectively, G175 (1959–1990) G155 (1990–1994), G174 (1995–2006). The using data are annual averages by measurement and statistical interpolation. The rainfall, mine drainage quantity, groundwater withdrawal, underground water level and spring flow of the spring basin are shown in Figure 2.
2.3. The Impacting Mode of Coal Mining on Karst Water
Limestone in northern China is characterized by high water content with developed karst, and karst water is the major source of mine water [31]. Due to the presence of faults, collapse columns and other geological structures, most coal mines in the north are under the threat of Ordovician karst water. Coal mine drainage, local water supply and environmental protection have relatively obvious contradictions [32].
The major water source for coal mining in the study area is Ordovician karst fissure water, and sandstone fissure water. Iron ore occurs in the contact zone between the igneous rock body and Ordovician limestones. Ordovician limestones are emplaced underneath Permo-Carboniferous coal seams with different spacings, and water leaking out of them is a huge threat. Accordingly, the groundwater extracted from coal and iron ore is primarily the direct or indirect drainage of Ordovician karst fissure groundwater.
The influence of coal mining on karst groundwater resources primarily results from fractures developing in the mining process. Karst groundwater with strong water-bearing capacity enters the mine roadway through the geological structures such as mining fractures, faults, and karst collapse columns, that increases the discharge of karst water, as shown in Figure 3 [33,34]. In Figure 3, the karst collapse column is deep sink hole and a kind of vertical structure that is extensively distributed in the Permo-Carboniferous coalfields in northern China [35,36]. Besides, surface runoff leak to coal mine through ground collapse and fractures caused by mining. Consequently, the leakage of surface runoff on the karst underground water decreases [37,38]. The changes of spring flow, rainfall, groundwater level and mine drainage rate are considered as an interaction effect [39]. Fengfeng mining area is a typical northern China-type coal field, and massive thick Ordovician limestone is coal basement strata. Besides, karst fissure and collapse column are developed. As the incomplete statistics suggests, the number of water inrush associated with fault fractures in the Fengfeng mining area takes up more than 90% of the total number of water inrush.
3. Methods
3.1. Trend Analysis of Different Influences
3.1.1. Mann–Kendall Method
The Mann–Kendall method includes Mann–Kendall verification and trend analysis, widely used in a non-parametric trend test. The advantage is that the sample cannot be normally distributed and is not disturbed by a few abnormal values. It is generally employed for trend analysis and a mutation test of hydrology and meteorology and some time series with non-normal distributions. Mutation analysis has been described in much literature [40,41], so it will not be explained here. The test statistic ‘S’ in the Mann–Kendall trend test is defined as,
where xi and xj are the data at i and j, respectively, j > i; n is sequence length, n > 10.
To identify increasing or decreasing monotone trend in a two-tailed test at the α level significance, the null hypothesis should be rejected, if . Therefore, if the value of Z is positive, it indicates an increasing trend. If the value of Z is negative, it indicates a decreasing trend. In this paper, there is one kind of significance level: 0.01. The trend at 0.01 level of significance is represented as ***.
3.1.2. Innovative Trend Analysis (ITA) Method
The innovative trend analysis (ITA) method was introduced by Zekai Sen to analyze trends in social, environmental, engineering, business and health variables [42,43]. In comparison with the Mann–Kendall (MK) test and Spearman’s Rho test (SR), ITA does not need the data independent and/or normal distribution. ITA divides the time series into two or three equal sections, with every sub-section in ascending order. Therefore, the abscissa and ordinate stand for the same parameter in ITA scatter. Then, it draws the 1:1 line on the same system. If the group is close to the 1:1 line and allows 5% or the maximum 10% error, this suggests no trend (trendless time series). If the group is above (below) the 1:1 line, the group is considered to show an increasing (decreasing) trend. The data intensity is divided into low, moderate and high from the 40th percentile to 60th percentile. The ITA indicator ‘D’ characterizes the increase and decrease, and ‘D’ is defined as follows [44]:
3.2. Correlation Analysis between Influences
3.2.1. Multi Regression Analysis
Multivariate regression analysis is a mathematical statistical method in accordance with the correlation principle. It is conducted to analyze the correlative relations between variables and predict the change [45], and commonly used to identify the hydrological and meteorological factors, such as precipitation, groundwater-level, and runoff [46]. If there are m main factors affecting dependent variable y, the general form of multivariate linear regression analysis model is expressed as follows:
where is constant, , , ⋯, are partial regression coefficients; , , ⋯, is independent variable; is residual.
3.2.2. Wavelet Coherence
To study the effect of mining activities on groundwater resources, natural factors should be separated from human factors to compare the variation trend of groundwater resources under natural conditions and mining. A common way to eliminate human impact is to eliminate the trend term. In the present paper, we use an exponential function to fit the spring flow trend. By extracting the trend term of the exponential function, we obtain the residual flow as the spring flow in the natural state. Moreover, we select the residual flow data as the data used for the wavelet coherence analysis.
The classical correlation refers to the time correlation between two signals, and the two signals have undergone Fourier transform. Wavelet coherence spectrum analysis has been broadly applied in the field of astronomy, atmospheric science, hydrology engineering technology as well as medical epidemiology [47,48,49,50,51]. When two signals are non-stationary, wavelet coherence, compared with Fourier analysis, can analyze the characteristics of two sets of data in time and frequency space, i.e., the spectral characteristics of the signal can be estimated as a time function. The wavelet coherence coefficient is defined by Torrence and Compo [52], and is defined as,
where s is scale, S is smoother; and are the wavelet transform of X and Y, represents the cross wavelet spectrum between X and Y,
where is complex conjugate of , τ is position; represents smoothing along the wavelet scale axis, represents smoothing in time scale. Torrence and Webster defined the Morlet smoothing operator as [53],
where Π is rectangular function; j is scaling function; N is sequence length; 0.6 is decided on the experience, which is related to the solution of Morlet wavelet.
4. Results and Discussion
4.1. The Importance of Coal Mining to Karst Water Resources
The comparison of mine drainage quantity and spring flow over 40 years is shown in Figure 4. Time falls into two stages: annual data of two series are stable in phase I; with the abrupt increase of mine drainage, the spring flow shows a significant decrease in phase II. Coal mine drainage changes the circulation route of groundwater; the source of mine water inrush is mainly karst water [32]. Thus, the influence of coal mining on karst water resources in the study area cannot be ignored. Although the flow rate of Heilongdong spring field has been decreasing in recent years, the rate of decline has been slowing down under the construction of sustainable development strategy.
4.2. The Trend of Influences Changes under Mining Conditions
The trend test results of three methods for each influencing factor are listed in Table 1. The mine drainage quantity and groundwater withdrawal are shown to be significantly increased.
It is suggested from the linear regression analysis that the precipitation decreases at a rate of 2.34 mm/a, and the spring flow decreases rapidly at a rate of 9.41 (106 m3/a) in comparison with that of the groundwater level. The trend of precipitation in the karst area in the north is decreasing, which is consistent with other studies around northern China. The reasons for this phenomenon are related to the greenhouse effect caused by human activities [54]; and also may be related to sunspot numbers, as since the 1960s, the relative decline of sunspot activity is one of the important reasons for the decrease of precipitation in northern China, and the decrease of precipitation infiltration in the karst area leads a reduction in spring flow [2,55]. As the results of MK trend analysis suggest, there was no significant trend in rainfall compared with the critical Z value of 99% bilateral confidence levels. Both the groundwater level and spring flow showed a significant decrease, suggesting that the increase in industrial and agricultural production and mine drainage in recent years was the main factor affecting water resources in the spring area.
The ITA diagram of each influencing factor reflects the trend change characteristics of each parameter. Because of the limited space, the results of ITA trend changes of rainfall, groundwater level and spring flow are only shown in Figure 5. Although there is no significant trend of rainfall according to the MK trend test method, the ITA method shows that the heavy rainfall (rainstorm) drops significantly, and the spring flow changes significantly. Wu reached the conclusion that most of the significant decreases occurred in high and heavy rainfall [21]. In fact, after the heavy rain in August 1996, the water began to flow again; however, before that the underground water level kept dropping and the springs run dry [56]. This suggests that the significant decline of rainstorm is the key for rainfall decrease, and leads to the spring flow decrease. Therefore, it is useful to investigate changes in different rainfall intensities, and analyze anomalies of extreme rainfall with time.
For the five parameters, 3 series have significant trends by linear regression and ITA, while 4 series (including the 3 series) have significant trends by the Mann–Kendall test. Three methods are in general agreement, and the ITA method shows higher agreement with linear regression than the Mann–Kendall test [44]. Therefore, three methods can be effectively used to evaluate trend of different dimension parameters [57].
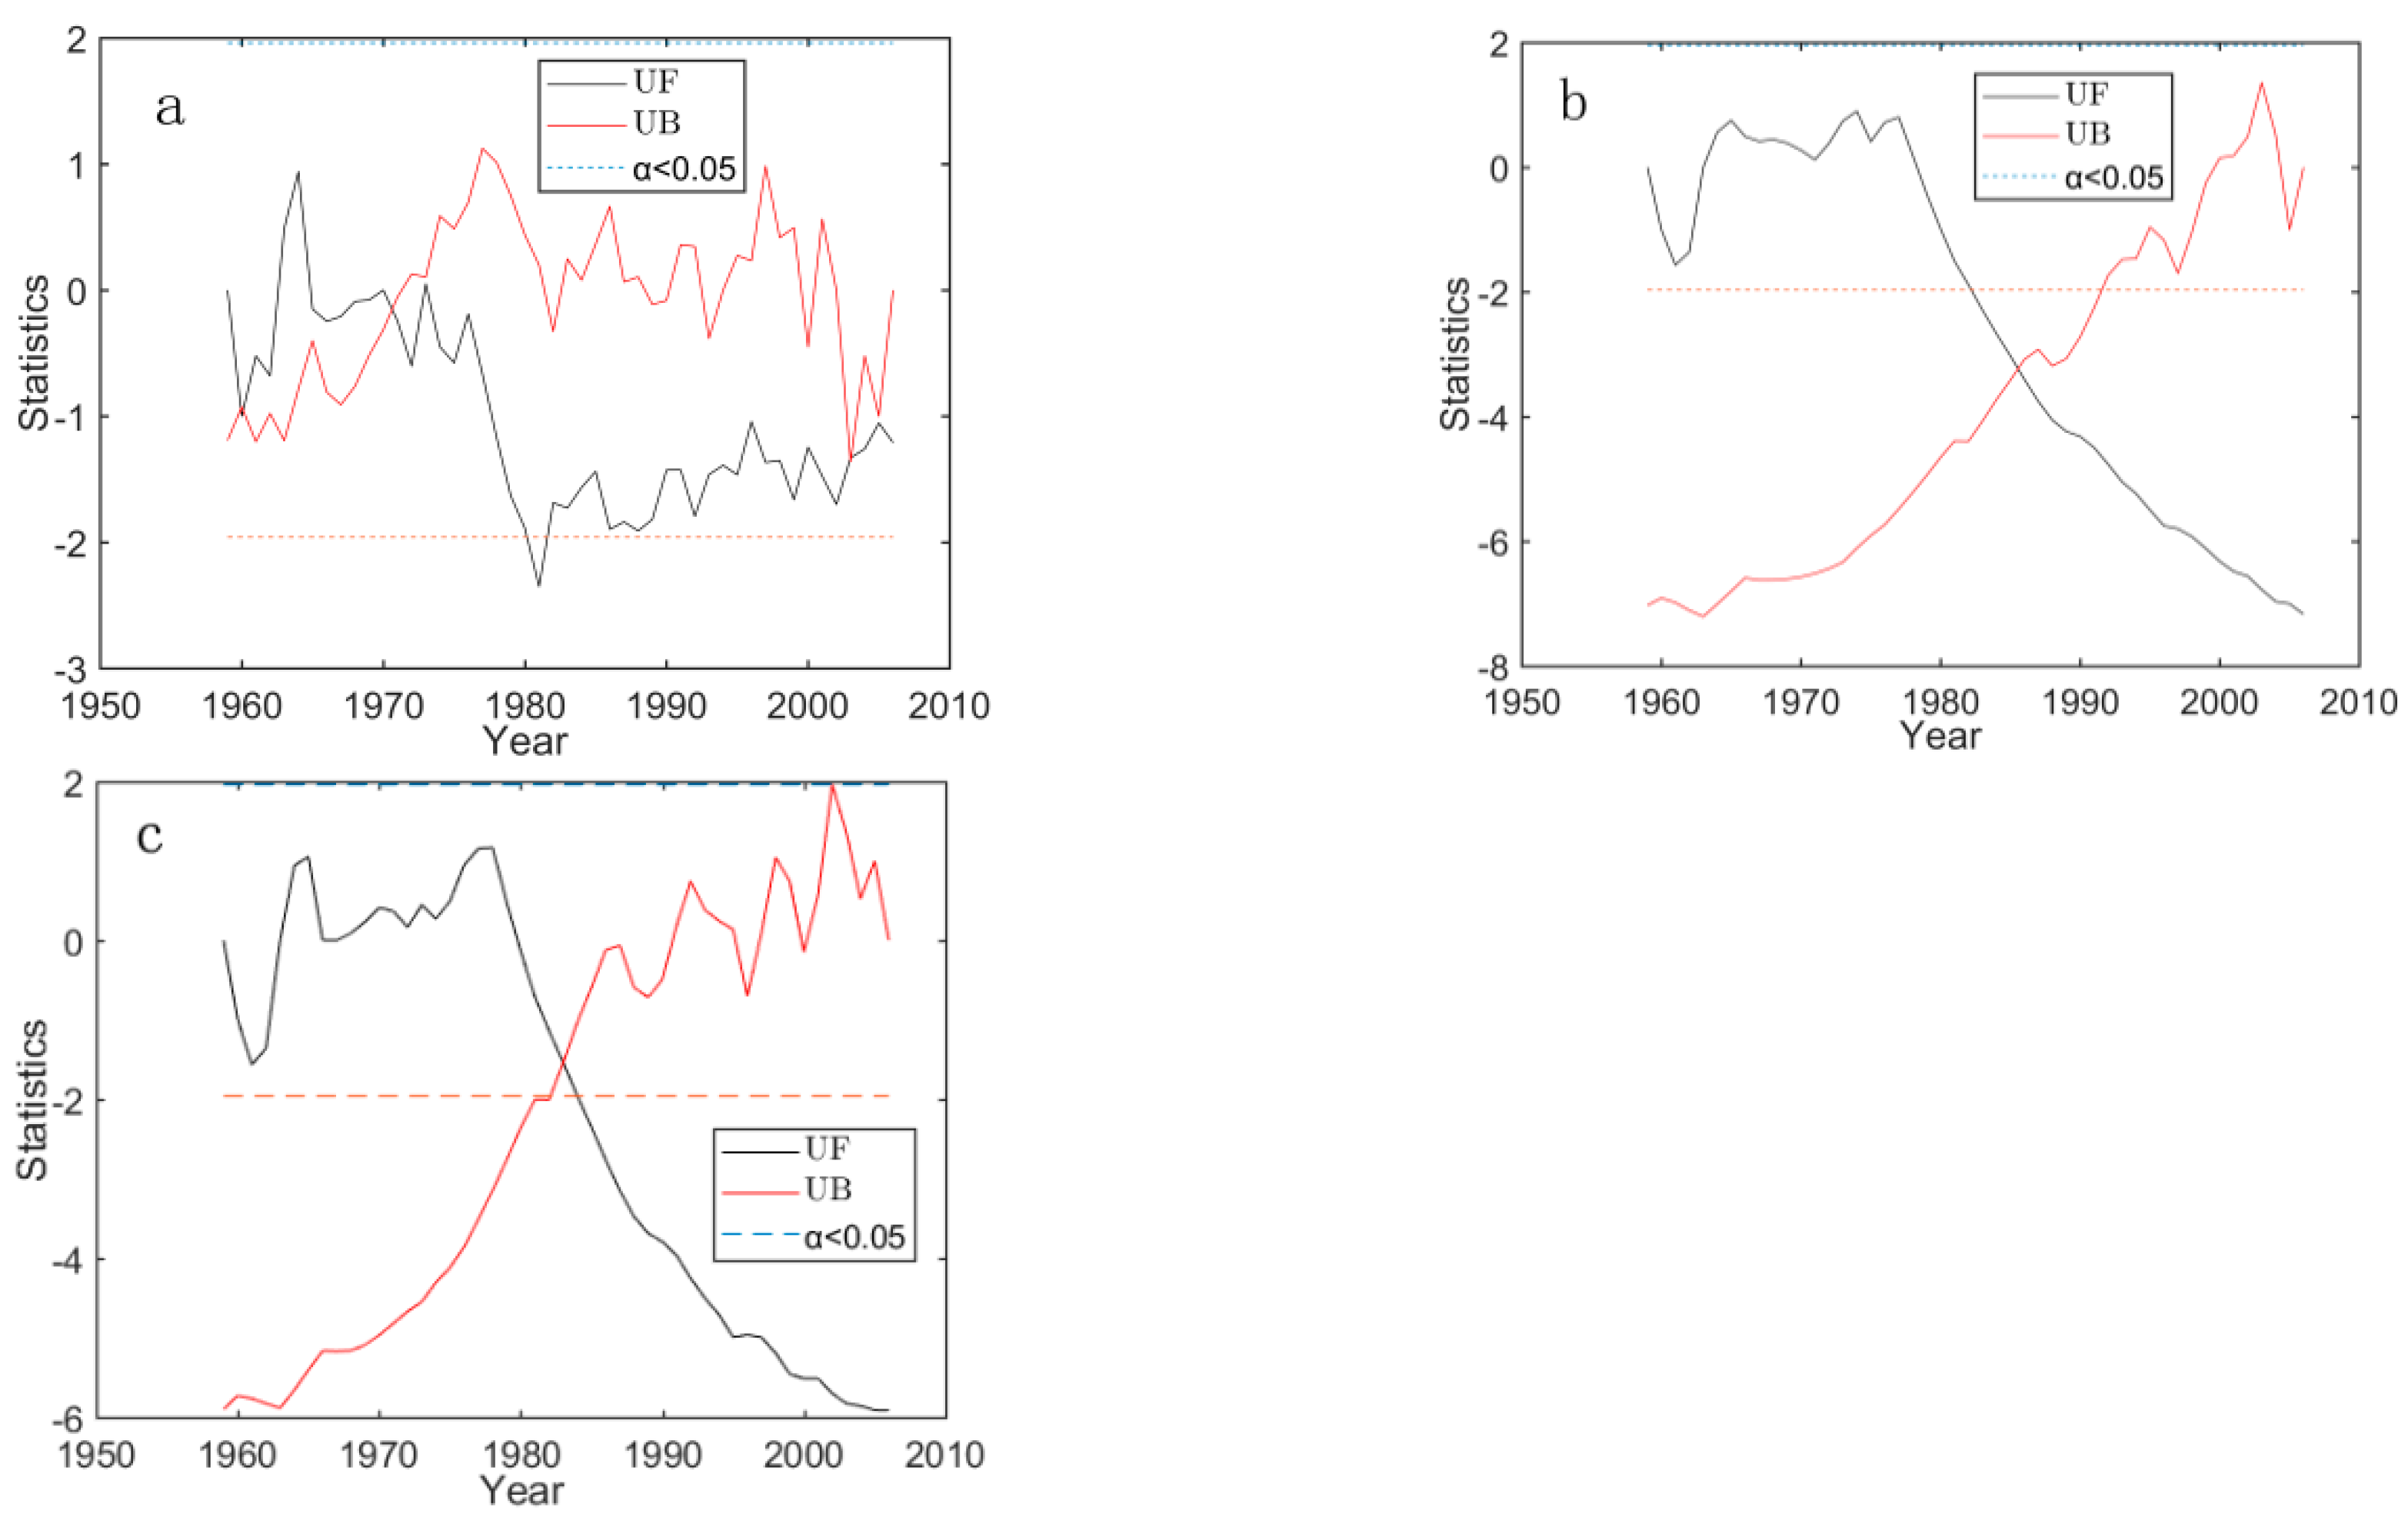
The abrupt time of each time series suggests the mutation characteristics of the trend change of each parameter (Table 2). Because of the limited space, only the MK mutation analysis diagram of rainfall, groundwater level and spring flows are shown in Figure 6. We can see that (1) the rainfall of UF statistic intersects the rainfall of UB statistic at 1971, suggesting that the annual precipitation changed dramatically in 1971, and the rainfall decreased significantly from 1980 to 1981. (2) UF intersects UB in 1983 in terms of spring flow, suggesting that the annual spring flow changed dramatically in 1983, and both the spring flow and the groundwater level showed a significant decrease after the abrupt transition. (3) The abrupt change times of underground water level and spring flow lag behind that of rainfall, and the abrupt change time of underground water level is later than that of spring flow. The reason may be that, from a meteorological point of view, there are teleconnections between different climate indices and precipitation, and groundwater levels. Precipitation was the main driver of groundwater levels variability [58,59,60]. The abrupt change times of underground water levels and spring flows lag behind that of mine drainage quantity and groundwater withdrawal. Thus, the decrease of water levels and spring flows is a combination of rainfall and human factors. (4) The abrupt change times of mine drainage quantity and groundwater withdrawal appear in the 1980s, which is attributed to the large-scale mining of mineral resources and artificial mining capacity increased in the 1980s [61], and even the phenomenon of the springs shut-off appeared in the 1990s.
4.3. The Influence Degree of Each Factor under Mining Conditions
The change of spring flow reflects the comprehensive information of the mining ability of aquifers and the change of groundwater level at regional scale. Thus, in regional scale, spring flow is a good indicator to reflect the variability of groundwater resources. In addition, Section 4.2 mentions that the spring flow decreases year by year, and the change is obvious with the increase of the artificial mining and drainage (including mine drainage quantity and groundwater withdrawal), which fully reflects the impact of artificial mining and drainage on karst groundwater resources. Accordingly, spring flow (y) is selected as the dependent variable, the unit is 104 m3/a. The independent variables include rainfall (), with the unit of millimeters; mine drainage quantity (), with the unit of 104 m3/a; groundwater withdrawal for industrial and agricultural production and domestic production (), with the unit of 104 m3/a; underground water level (), with the unit of meters. Multiple regression equation is presented as follows:
In the regression equation, the regression coefficients of groundwater withdrawal and mine drainage are −0.60 and −1.42, respectively, which are negative correlations as the main factors for the decrease of spring flow. Moreover, it is shown that the effect of mine drainage on spring groups is greater than that of groundwater withdrawal. The regression coefficient of both groundwater level and precipitation is positive. This suggests that the groundwater level increases with the increase of precipitation, and the spring flow also increases, which agrees with the actual situation. The regression coefficient of groundwater level is very significant, suggesting that the spring flow is primarily controlled by groundwater levels. High groundwater levels leads to high spring flow; a low water level causes low spring flow. Economically, when the other variables are assumed constant, spring flow will increase by 142 (104 m3/a) every time, mine drainage is reduced by 100 (104 m3/a). 32 years later, the spring flow will return to the annual average flow in the 1980s.
4.4. The Trend of Influence Degree of Each Factor under Natural or Human Conditions
4.4.1. Data Preprocessing
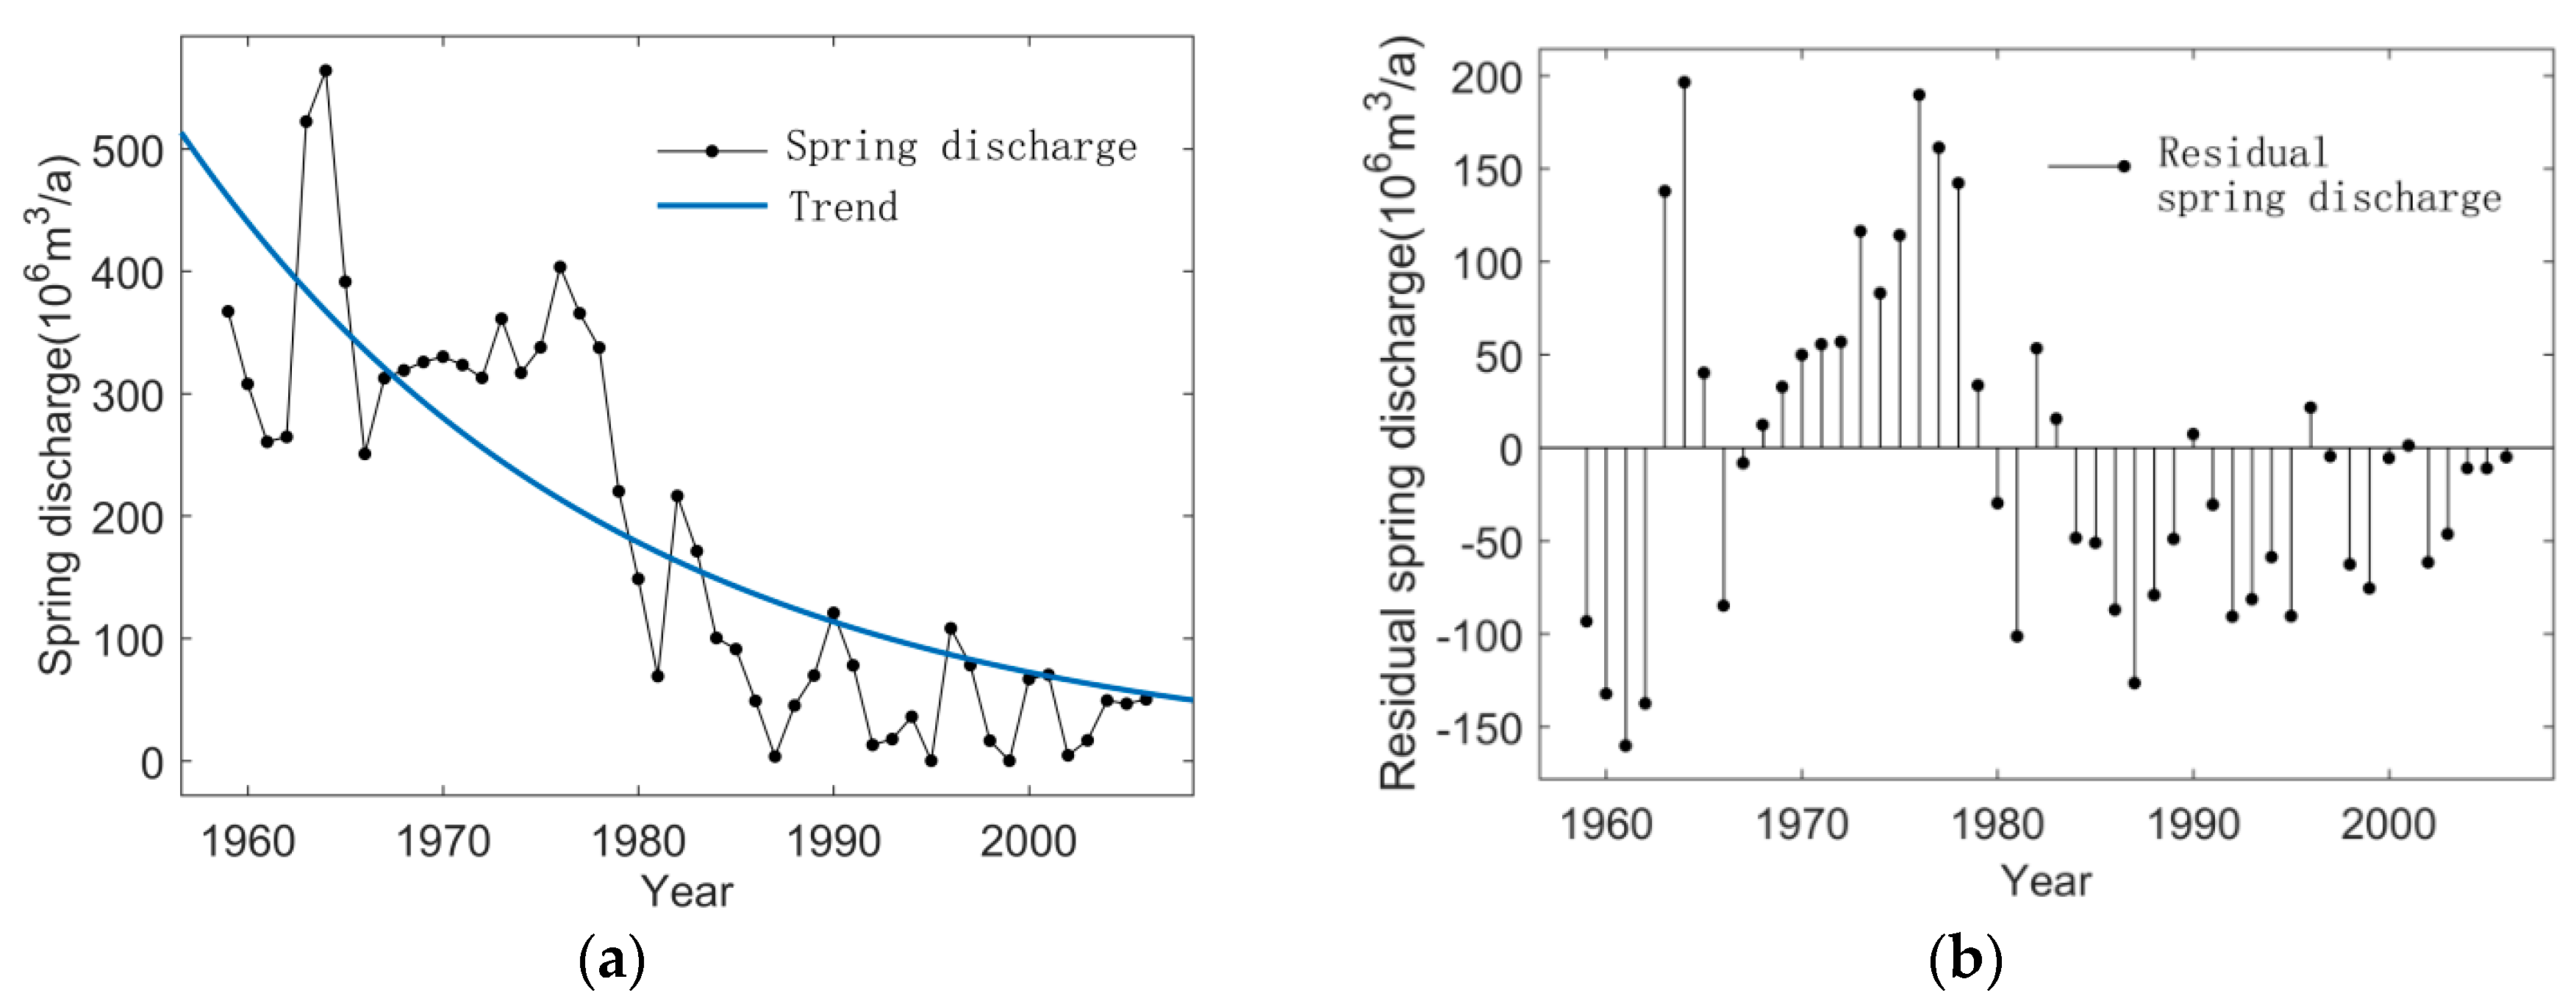
From Figure 7, the change of springs flow in the study area shows a trend of index change, and the fitting equation of an exponential function is show in Equation (12), where y denotes the spring flow, and t is time. Residual springs flow is stream flow under the natural state if not affected by man-made factors, which is obtained by removing the trend of the index function [24]. The spring flow data used for wavelet coherence analysis in the following paragraphs are the original spring flow data and the residual spring flow data after eliminating the trend, respectively.
ytrend = 44.3exp(−0.04516t)
4.4.2. Time-Frequency Distribution of Coherence
Heilongdong karst water system is a relatively independent and closed karst water system. The karst groundwater is controlled by supply and discharge, and the average annual supply and discharge are balanced. The infiltration of precipitation and its surface runoff leakage are its supply sources. In its natural state, springs are its only outlet. Groundwater dynamics is mainly controlled by precipitation and presents periodic changes in a stable state. With the increase of rainfall, groundwater level will rise, and spring flow will increase. Conversely, the groundwater level will reduce, and spring flow will decrease. The dynamic of groundwater is affected by precipitation and artificial mining and drainage. In this paper, wavelet coherence analysis can be used to discuss in detail the influence of various influencing factors on karst groundwater resources.
In the following figures, the color bar on the right represents the coherent spectral density of the wavelet (dimensionless). Yellow suggests that the correlation coefficient of the wavelet is strong. Blue means that the wavelet correlation coefficient is weak, and the minimum is zero. The ‘→’ right arrow denotes the positive phase, the latter series leading the previous sequence by 1 cycle, the phase difference is 360°, and two time series have positive correlations, for example, spring flow and ground water level or rainfall change at the same time. Spring flow leads the underground water level or rainfall by one cycle. In brief, spring flow and the underground water level are the same variation tendency. The ‘←’ left arrow means the negative phase, the latter series leading the previous sequence by 1/2 cycle, the phase difference is 180°. The ‘↑’ up arrow means that the latter series leads the previous sequence by 1/4 cycle, the phase difference is 90°. The ‘↓’ down arrow means that the latter series leads the previous sequence by 3/4 cycle, and the phase difference is 270°. In fact, the arrow is not in an absolute direction. For instance, the arrow points to the upper right, suggesting that two time series are positive correlation, and the latter is 1/4 cycle ahead of the former, or the former is 3/4 cycle ahead of the latter.
In Figure 8, the wavelet coherence map is given. The left is mine drainage quantity and the original spring flows, and the right is groundwater withdrawal and the original spring flows, respectively. From long-term scale, area with higher correlation degree almost covers the whole time domain, resonating significantly on the cycle of 16a–32a, and the area of the left is larger than the right. This suggests that the impact of mine drainage on springs is greater than that of groundwater withdrawal from springs, which agrees with the result of multiple regression analysis. It is significant that controlling the scale of underground mine and reasonably arranging the production mine based on its impact on underground water, in order to achieve the goal of comprehensive protection and utilization of groundwater resources.
The wavelet coherence between the original spring flow and the groundwater level or rainfall are shown in Figure 9, respectively. The wavelet coherence between the residual spring flow and the groundwater level or rainfall are shown in Figure 10, respectively. As the wavelet coherence analysis suggests, most of the time the spring flow resonates significantly with the groundwater level in the period of 3a–11a, the spring flow resonates significantly with rainfall in the period from 2a–15a. The correlation between spring flow and groundwater level varies with time scales. The relationship between spring flow and groundwater level is very complicated in different frequency domains, but they all show strong correlation. In the meantime, the variation of wavelet coherent frequency spectrum can further explain the response of groundwater level and rainfall to spring flow. Compare Figure 8 and Figure 9b, rainfall has higher correlation to spring flow in a short period than human activities, while the opposite is shown in a long period, the impacting factors on karst water are changing [18]. The results indicate that groundwater dynamics have varied from meteorological type to meteorology-artificial type, with the increased impact of human activities, the groundwater cannot be compensated in time, and the groundwater continues to decline, a regional drawdown funnel will be formed.
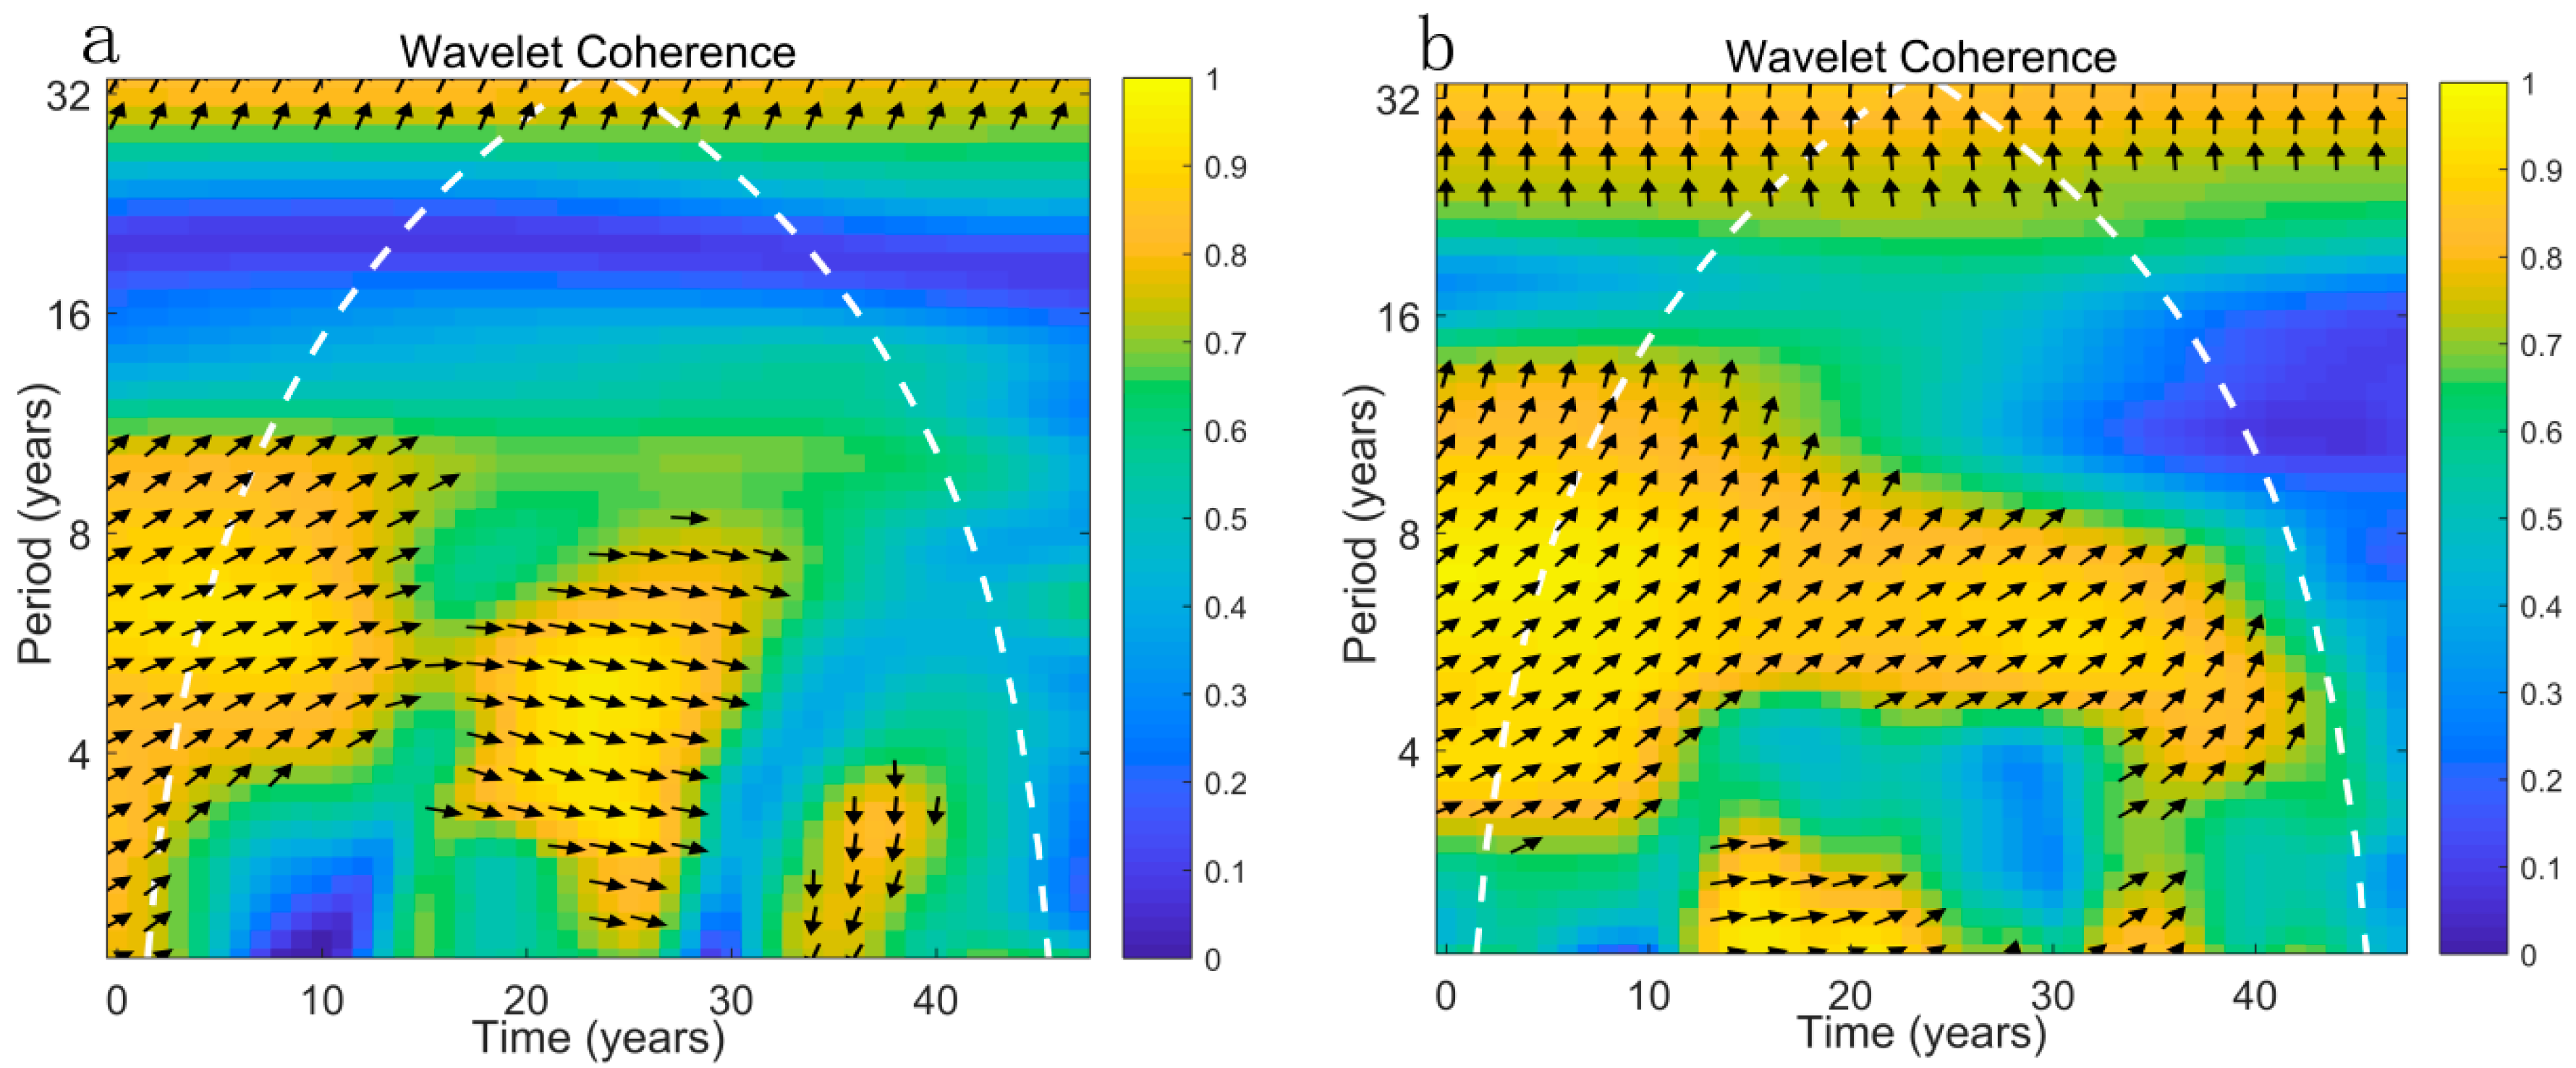
In the long term, the area with higher correlation degree in Figure 9a is larger than that in Figure 9b, and the color is mostly bright yellow. Besides, this region with high correlation coefficient almost nearly runs through the whole time. In the short term, the yellow areas with high correlation degree are relatively few, showing a small correlation. This suggests that the correlation between groundwater level and spring flow is greater than that between rainfall and spring flow under human influence, which is consistent with the results of multiple regression analysis. The correlation between precipitation and the spring flow is low, which is probably because: aquifers play a crucial role in the regulation of precipitation when the precipitation infiltrates through them, and groundwater will have new periodicity when it discharges to the surface as springs. Moreover, the relation of precipitation and groundwater recharge is not linear, and recharge of karst groundwater does not increase with the increase of precipitation linearly [18,24]. In Figure 10, in the long term, the area with higher correlation degree in Figure 10a is smaller than that in Figure 10b, where the former is mostly light blue. Taken together, in the short term, the area with high wavelet coherence of rainfall and residual spring flow is larger than that of rainfall and original spring flow.
From the direction of the arrow, the correlation between the groundwater level and the spring flow in Figure 9a and Figure 10a shows that in the long term, most arrows point to the right or the upper right, the two series are positive correlations, and the spring flow is nearly 1/4 cycle ahead of the groundwater level. In the short term, the direction is not fixed, most arrows point to the lower right, suggesting that the two series are positive correlations, and the spring flow is nearly 3/4 cycle ahead of the groundwater level. Yet it sometimes even points to the left, suggesting a negative correlation between the two series in this region (yellow area near around 1994). The reason for this abnormal phenomenon infers that, in the 1990s, the artificial production capacity from the karst water system in the study area had reached above 95% of the water resources of the karst water system. Overproduction occurred in some years. Mine drainage quantity takes up nearly 40% of the output of manual mining, and the spring groups appeared several events of cutoff. By comparing this with Figure 9b, rainfall and original spring flow have a significant resonance relationship in the period from 4 to 8a. From Figure 10b, rainfall and residential spring flow have a significant resonance relationship in the period from 3a to 15a. By comparing Figure 9b and Figure 10b, it is suggested that the directions of arrows for the relationship between rainfall and original spring flow or residual spring flow are basically the same in the whole cone of influence (COI) region.
4.5. Prospects for Future Research
These results are may provide a scientific basis for regional sustainable development and utilization of groundwater in a karst spring area. Moreover, the five statistical methods can be used to quantitatively evaluate the impacts of different factors on spring flow change. The results can be used to set mining policy in some water shortage areas, in order to achieve a balance between environmental conservation and economic development. Mining of most coal mines has to withstand tremendous water pressure in northern China, and karst-cranny development, therefore, it is useful to conduct this study to protect the karst water resource in a northern China-type coal area.
However, it is difficult to accurately calculate which coal mine has the big contribution to spring flow change in a karst watershed; the research is also hampered by limited data, which cannot analyze the characteristics of recent years. These ideas will be addressed in the next step of hydrological research in the Heilongdong spring area.
5. Conclusions
We used statistical methods to extract the changing karst water resource under the condition of coal mining based on high-quality observation data. This study is unique not only because it analyzes the trend, abrupt change characteristic, multiple factor relationship and multiple timescale features during about 50 years, but additionally because it discusses the change trend under many influences of change scenarios in a typical karst watershed. The following conclusions are drawn:
(1) From 1959 to 2006, the annual variation trend of precipitation in Heilongdong spring area decreased, which was not significant. The underground water level and spring flow are significantly decreased. Moreover, the mine drainage quantity or groundwater withdrawal for agriculture, industry and livelihood are significantly increased. The decreasing trend of rainfall is not obvious, and the decrease of heavy rainfall primarily leads to the decrease. Mine drainage quantity and groundwater withdrawal have significantly increased, which is the leading cause of the decrease of spring flow and groundwater level. In future water resources utilization, the reduction of mine drainage becomes the focus.
(2) The abrupt change time of underground water level lags behind the abrupt change time of spring flow. Underground water levels, spring flow and rainfall exhibited similar abrupt change features and stage characteristics, whereas in the abrupt change times of underground water level, spring flow lagged 12–15 years behind that of rainfall. Before the change of rainfall trend in the 1970s, karst groundwater was in a natural state, primarily in natural circulation. Since the 1970s, human exploitation has been gradually dominant. The result was the significant reduction of spring flow.
(3) Regarding the human factor, the effect of mine drainage on spring groups is greater than that of groundwater withdrawal. To achieve average annual spring flow during the 1980s, if mine drainage is reduced by 100 (104 m3/a) this may take 32 years.
(4) We separate the impact of human activities on spring flow change by removing the trend of index function. In the natural state eliminating the effect of human factors, rainfall and spring flow have a significant resonance relationship in the period from 3a to 15a, a period that is longer than that of rainfall and spring flow under human influence, in most of the time domain. This further demonstrates the high correlation between precipitation and spring flow in the karst water system.
Author Contributions
Conceptualization, L.Z.B. and W.W.K.; Methodology, H.D.; Writing-Original Draft Preparation, H.D.; Writing-Review and Editing, L.Z.B.; Supervision, W.W.K.
Funding
This paper is supported by the Project Sponsored by the Innovation Fund General project of Xi’an Research Institute Company of China Coal Technology and Engineering Group (2015XAYMS17), the National Key Research and Development Program of China (2017YFC0804102).
Acknowledgments
We sincerely thank the editor and anonymous reviewers for their valuable suggestions and comments.
Conflicts of Interest
No conflict of interest exists in the submission of this manuscript. All of the authors listed have approved the manuscript.
References
- Leibundgut, C. Vulnerability of Karst Aquifers; IAHS Publication: Wallingford, CT, USA, 1998. [Google Scholar]
- Wang, W.T.; Liang, Y.P.; Wang, Z.H.; Zhao, C.H. Characteristics of climate change in northern China and its effect on groundwater in karst areas. Hydrogeol. Eng. Geol. 2012, 45, 332–338. [Google Scholar]
- Hao, Y.H.; Wang, W.; Wang, G.Q. Effects of Climate Change and Human Activities on the Karstic Springs in Northern China: A Case Study of the Liulin Springs. Act. Geol. Sin. 2009, 83, 138–144. [Google Scholar]
- Yuan, D.X. Chinese Karst; Geological Publishing House: Beijing, China, 1993. [Google Scholar]
- Zhang, J.Y.; Wang, L.C.; Su, W.C.; Zeng, C.F. Status and prospect of the hydrological effects of human activities in the Karst area. Prog. Geogr. 2014, 33, 1125–1135. [Google Scholar]
- Qi, X.F.; Yang, L.Z.; Han, Y.; Shang, H.; Xing, L. Cross Wavelet Analysis of Groundwater Level Regimes and Precipitation-Groundwater Level Regime in Jinan Spring Region. Adv. Earth Sci. 2012, 27, 969–978. [Google Scholar]
- Zhang, G.H.; Lian, Y.L.; Liu, C.H.; Yan, M.J.; Wang, J.Z. Situation and Origin of Water Resources in Short Supply in North China Plain. J. Earth Sci. Environ. 2011, 33, 172–176. [Google Scholar]
- Feng, D.Y. Research of the Evolution of Ordovician Karst Water Environment in the Fengfeng Coal Mining Influence. Master’s Thesis, China University of Geosciences, Beijing, China, June 2015. [Google Scholar]
- Wu, Z.L.; Bai, X.Q. Evolvement Regulation of Karst Groundwater Flowing Field in the Area of Fengfeng Mine Area. Groundwater 2009, 31, 23–27. [Google Scholar]
- Qiao, X.; Li, G.; Li, M.; Zhou, J.; Du, J.; Du, C. Influence of coal mining on regional karst groundwater system: A case study in west mountain area of Taiyuan city, northern China. Environ. Earth Sci. 2011, 64, 1525–1535. [Google Scholar] [CrossRef]
- Fang, X.Q.; Fu, Y.J. Impact extent assessment of coal mining on Heilongdong spring Karst system in Fengfeng mining area. Coal Geol. China 2012, 24, 25–30. [Google Scholar]
- He, X.L.; Wang, Y.M.; Liu, X.M. Study on the influence of Coal Mining on Groundwater Resources in Yuxi River Basin. Groundwater 2018, 40, 27–29. [Google Scholar]
- Mu, W.; Wu, Q.; Xing, Y. Using numerical simulation for the prediction of mine dewatering from a karst water system underlying the coal seam in the Yuxian Basin, Northern China. Environ. Earth Sci. 2018, 77, 215. [Google Scholar] [CrossRef]
- Kahya, E.; Kalayci, S. Trend analysis of streamflow in Turkey. J. Hydrol. 2004, 289, 128–144. [Google Scholar] [CrossRef]
- Spearman, C. The proof and measurement of association between two things. Am. J Psychol. 1904, 15, 72–101. [Google Scholar] [CrossRef]
- Sen, P.K. Estimates of the regression coefficient based on Kendall’s tau. J. Am. Stat. Assoc. 1968, 63, 1379–1389. [Google Scholar] [CrossRef]
- Caloiero, T.; Coscarelli, R.; Ferrari, E.; Mancini, M. Trend detection of annual and seasonal rainfall in Calabria (Southern Italy). Int. J. Climatol. 2011, 31, 44–56. [Google Scholar] [CrossRef]
- Wu, L.; Wang, S.; Bai, X. Quantitative assessment of the impacts of climate change and human activities on runoff change in a typical karst watershed, SW China. Sci. Total Environ. 2017, 601–602, 1449–1465. [Google Scholar] [CrossRef] [PubMed]
- Oztopal, A.; Sen, Z. Innovative Trend Methodology Applications to Precipitation Records in Turkey. Water Resour. Manag. 2017, 31, 727–737. [Google Scholar] [CrossRef]
- Rehman, S. Long-term wind speed analysis and detection of its trends using Mann–Kendall test and linear regression method. Arabian J. Sci. Eng. 2013, 38, 421–437. [Google Scholar] [CrossRef]
- Wu, H.; Li, X.; Qian, H. Detection of Anomalies and Changes of Rainfall in the Yellow River Basin, China, through Two Graphical Methods. Water 2018, 10, 15. [Google Scholar] [CrossRef]
- Bonaria, V.; Faccini, F.; Galiano, I.C.; Sacchini, A. Hydrogeology of conglomerate fractured-rock aquifers: An example from the Portofino’s Promontory (Italy). Rend. Online Soc. Geol. Ital. 2016, 41, 22–25. [Google Scholar] [CrossRef]
- Kim, T.W.; Valdés, J.B.; Nijssen, B. Quantification of linkages between large-scale climatic patterns and precipitation in the Colorado River Basin. J. Hydrol. 2006, 321, 173–186. [Google Scholar] [CrossRef]
- Zhang, J.; Hao, Y.; Hu, B.X.; Huo, X.; Hao, P.; Liu, Z. The effects of monsoons and climate teleconnections on the Niangziguan Karst Spring discharge in North China. Clim. Dyn. 2017, 48, 53–70. [Google Scholar] [CrossRef]
- Faccini, F.; Benedettini, A.; Firpo, M.; Perasso, L.; Poggi, F. Land-management and planning in karst areas: the ligurian case-study (Italy). Rend. Online Soc. Geol. Ital. 2012, 21, 611–613. [Google Scholar]
- Stockton, C.W.; Boggess, W.R. Geohydrological Implications of Climate Change on Water Resource Development; U.S. Army Coastal Research Engineering Center: Fort Belvoir, VA, USA, 1979. [Google Scholar]
- Wang, Y.L.; Yeh, T.C.J.; Wen, J.C. Characterizing subsurface hydraulic heterogeneity of alluvial fan using riverstage fluctuations. J. Hydrol. 2017, 547, 650–663. [Google Scholar] [CrossRef]
- Huo, Z.L.; Feng, S.Y.; Kang, S.Z. Effect of climate change sand water-relate human activities on annual stream flows of the Shiyang river basin in arid northwest China. Hydrol. Process. 2008, 22, 3155–3167. [Google Scholar] [CrossRef]
- Zhang, K.; Li, L.J.; Bai, P.; Li, J.; Liu, Y. Influence of climate variability and human activities on stream flow variation in the past 50 years in Taoer River, Northeast China. J. Geogr. Sci. 2017, 27, 481–496. [Google Scholar] [CrossRef]
- Haucke, J.; Clancy, K.; Kraft, G. Tools to estimate groundwater levels in the presence of changes of precipitation and pumping. J. Water Resour. Prot. 2016, 8, 1053–1077. [Google Scholar] [CrossRef]
- Wu, Q.; Wang, M. Characterization of water bursting and discharge into underground mines with multilayered groundwater flow systems in the north China coal basin. Hydrogeol. J. 2006, 14, 882–893. [Google Scholar] [CrossRef]
- Wu, Q.; Xing, L.T.; Ye, C.H.; Liu, Y.Z. The influences of coal mining on the large karst springs in north China. Environ. Earth Sci. 2011, 64, 1513–1523. [Google Scholar] [CrossRef]
- Wang, X.Y.; Wang, T.T.; Wang, Q.; Liu, X.; Li, R.; Liu, B. Evaluation of Floor Water Inrush based on Fractal Theory and an Improved Analytic Hierarchy Process. Mine Water Environ. 2016, 36, 87–95. [Google Scholar] [CrossRef]
- Zhao, Q.B.; Zhao, X.N.; Wu, Q. Water burst mechanism of “divided period and section burst” at deep coal seam floor in North China type coalfield mining area. J. China Coal Soc. 2015, 40, 1601–1607. [Google Scholar]
- Ma, D.; Bai, H.B.; Wang, Y.M. Mechanical behavior of a coal seam penetrated by a karst collapse pillar: Mining-induced groundwater inrush risk. Nat. Hazard 2015, 75, 2137–2151. [Google Scholar] [CrossRef]
- Ma, D.; Miao, X.X.; Bai, H.B.; Huang, J.; Pu, H.; Wu, Y.; Li, J. Effect of mining on shear sidewall groundwater inrush hazard caused by seepage instability of the penetrated karst collapse pillar. Nat. Hazard 2016, 82, 73–93. [Google Scholar] [CrossRef]
- Zhai, L.J. Coal Mining Impacting Mode on Karst Water Aquifer in North China Type Coalfields. Coal Geol. China 2012, 24, 30–35. [Google Scholar]
- Zhao, Q.B.; Jiang, Q.M.; Gao, C.F. Study on floor water inrush mechanism of deep seam in Hanxing Mining Area. Coal Sci. Technol. 2016, 44, 117–121. [Google Scholar]
- Lu, X.; Wang, S.M.; Yang, Z.Y. Influence of coal mining on water resources: A case study in Kuye river basin. Coal Geol. Explor. 2014, 42, 54–57. [Google Scholar]
- Charola, A.E. Salts in the deterioration of porous materials: An overview. J. Am. Inst. Conserv. 2000, 39, 327–343. [Google Scholar] [CrossRef]
- Zhang, L.Q.; Zhang, H.; Li, J. Climate change in sandy desertification area of the northern Shanxi from 1980 to 2014. J. Desert Res. 2016, 36, 1116–1125. [Google Scholar]
- Sen, Z. Innovative trend analysis methodology. J. Hydrol. Eng. 2012, 17, 1042–1046. [Google Scholar] [CrossRef]
- Şen, Z. Trend Identification Simulation and Application. J. Hydrol. Eng. 2014, 19, 635–642. [Google Scholar] [CrossRef]
- Wu, H.; Qian, H. Innovative trend analysis of annual and seasonal rainfall and extreme values in Shaanxi, China, since the 1950s. Int. J. Climatol. 2017, 37, 2582–2592. [Google Scholar] [CrossRef]
- Sahoo, S.; Jha, M.K. Groundwater-level prediction using multiple linear regression and artificial neural network techniques: A comparative assessment. Hydrogeol. J. 2013, 21, 1865–1887. [Google Scholar] [CrossRef]
- Fu, J. Research on Impact of Environment Change on Regional Hydrological Components and Water Resources. Ph.D. Thesis, Tianjin University, Tianjin, China, December 2015. [Google Scholar]
- Zhang, X.F.; Le, G.M.; Zhang, Y.X. Phase relationship between the relative sunspot number and solar 10.7 cm flux. Sci. Bull. 2012, 57, 2078–2082. [Google Scholar] [CrossRef] [Green Version]
- Araghi, A.; Mousavi-Baygi, M.; Adamowski, J.; Martinez, C. Association between three prominent climatic teleconnections and precipitation in Iran using wavelet coherence. Int. J. Climatol. 2017, 37, 2809–2830. [Google Scholar] [CrossRef]
- Sun, T.; Ferreira, V.; He, X. Water availability of São Francisco river basin based on a space-borne geodetic sensor. Water 2016, 8, 213. [Google Scholar] [CrossRef]
- Park, T.; Eckley, I.A.; Ombao, H.C. Estimating time-evolving partial coherence between signals via multivariate locally stationary wavelet processes. IEEE Trans. Signal Process. 2014, 62, 5240–5250. [Google Scholar] [CrossRef]
- Tian, F.; Tarumi, T.; Liu, H.; Zhang, R.; Chalak, L. Wavelet coherence analysis of dynamic cerebral autoregulation in neonatal hypoxic–ischemic encephalopathy. Neuroimage Clin. 2016, 11, 124–132. [Google Scholar] [CrossRef] [PubMed]
- Torrence, C.; Compo, G.P. A practical guide to wavelet analysis. Bull. Am. Meteorol. Soc. 1998, 79, 61–78. [Google Scholar] [CrossRef]
- Torrence, C.; Webster, P.J. Interdecadal changes in the ENSO-monsoon system. J. Clim. 1999, 12, 2679–2690. [Google Scholar] [CrossRef]
- Cong, J. The Multidecadal Variability of Precipitation and Its Response to Greenhouse over Arid and Semi-arid Region of Northern China. Master’s Thesis, Lanzhou University, Lanzhou, China, June 2016. [Google Scholar]
- Chi, J.C.; Gu, G.Q. The Influence of Solar Activity on Drought and Flood in Jingjinji Area. Plateau Meteorol. 2009, 28, 1175–1180. [Google Scholar]
- Zhao, B.X.; Chang, M.H. Handan-Fengfeng Mining Area Karstic Aquifer Characteristics and Water Yield Property Division. Coal Geol. China 2007, 19, 41–43. [Google Scholar]
- Huang, D.; Liu, Z.B.; Jiang, Q.M. Application of non-parametric Mann-Kendall and innovative trend method analysis to groundwater quality parameters variation: A case study from aquifers in Xinsankuang Coal mine. J. Water Res. Water Eng. 2018, 29, 7–13. [Google Scholar]
- Qi, X.F.; Li, W.P.; Li, H.T.; Yang, L.Z. Teleconnections between groundwater levels, precipitation, air temperature of the Jinan karst springs watershed and large scale climatic patterns. Hydrogeol. Eng. Geol. 2015, 42, 18–28. [Google Scholar]
- Tremblay, L.; Larocque, M.; Anctil, F.; Rivard, C. Teleconnections and interannual variability in Canadian groundwater levels. J. Hydrol. 2011, 410, 178–188. [Google Scholar] [CrossRef]
- Kuss, A.J.M.; Gurdak, J.J. Groundwater level response in U.S. principal aquifers to ENSO, NAO, PDO, and AMO. J. Hydrol. 2014, 519, 1939–1952. [Google Scholar] [CrossRef]
- Yin, S.X.; Han, Y.; Chang, H.Y.; Guo, J.Z.; Zhang, X.W. Study on optimal allocation of karst water resources in Hanxing Mining Area. Coal Sci. Technol. 2016, 44, 29–34. [Google Scholar]
Figure 1.
The location of study area and overview map of the water yield property division in Heilongdong spring karstic water system. The elevation is based on borehole data and topographic information, and the unit of elevation is in meters.
Figure 1.
The location of study area and overview map of the water yield property division in Heilongdong spring karstic water system. The elevation is based on borehole data and topographic information, and the unit of elevation is in meters.

Figure 2.
Long term rainfall (mm), mine drainage quantity (106 m3/a), groundwater withdrawal (106 m3/a), underground water level (m) and spring flow (106 m3/a) during 1959 to 2006.
Figure 2.
Long term rainfall (mm), mine drainage quantity (106 m3/a), groundwater withdrawal (106 m3/a), underground water level (m) and spring flow (106 m3/a) during 1959 to 2006.
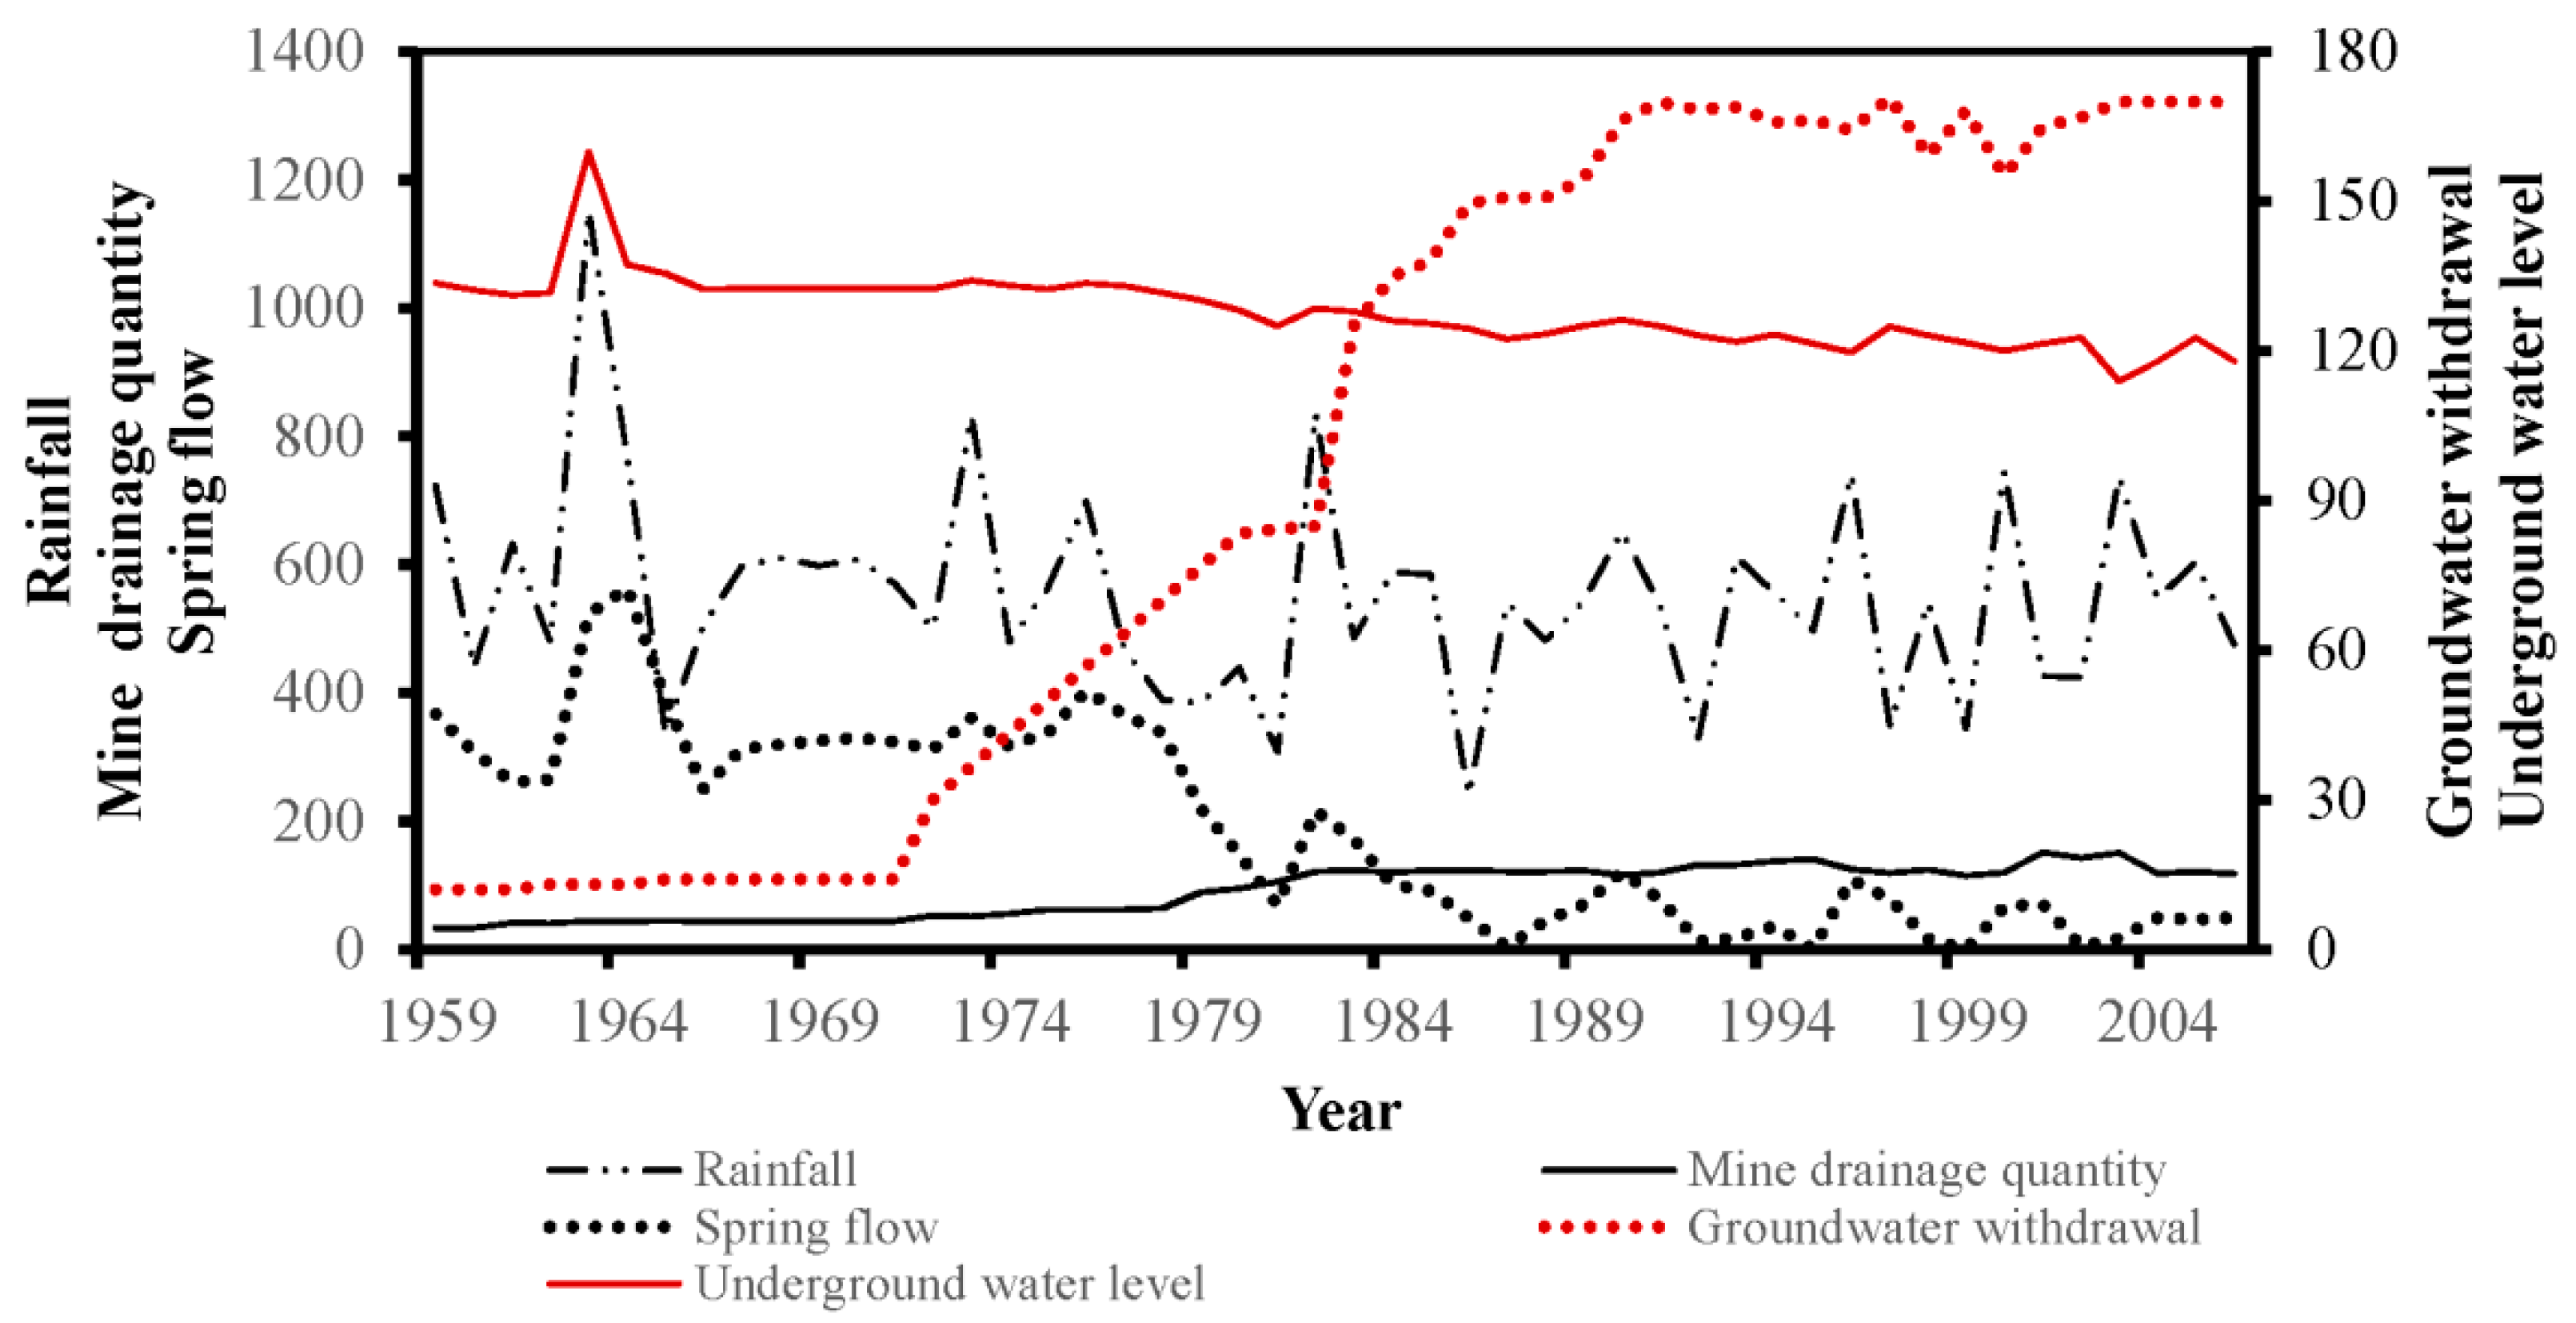
Figure 3.
A sketch of the channels karst water flows into coal mine under the coal mining in Heilongdong spring area. The lithology of the Carboniferous period includes sandstone, mudstone, limestone and coal seam. The lithology of Permian formation contains coal seam and interbed of sandstone and shale.
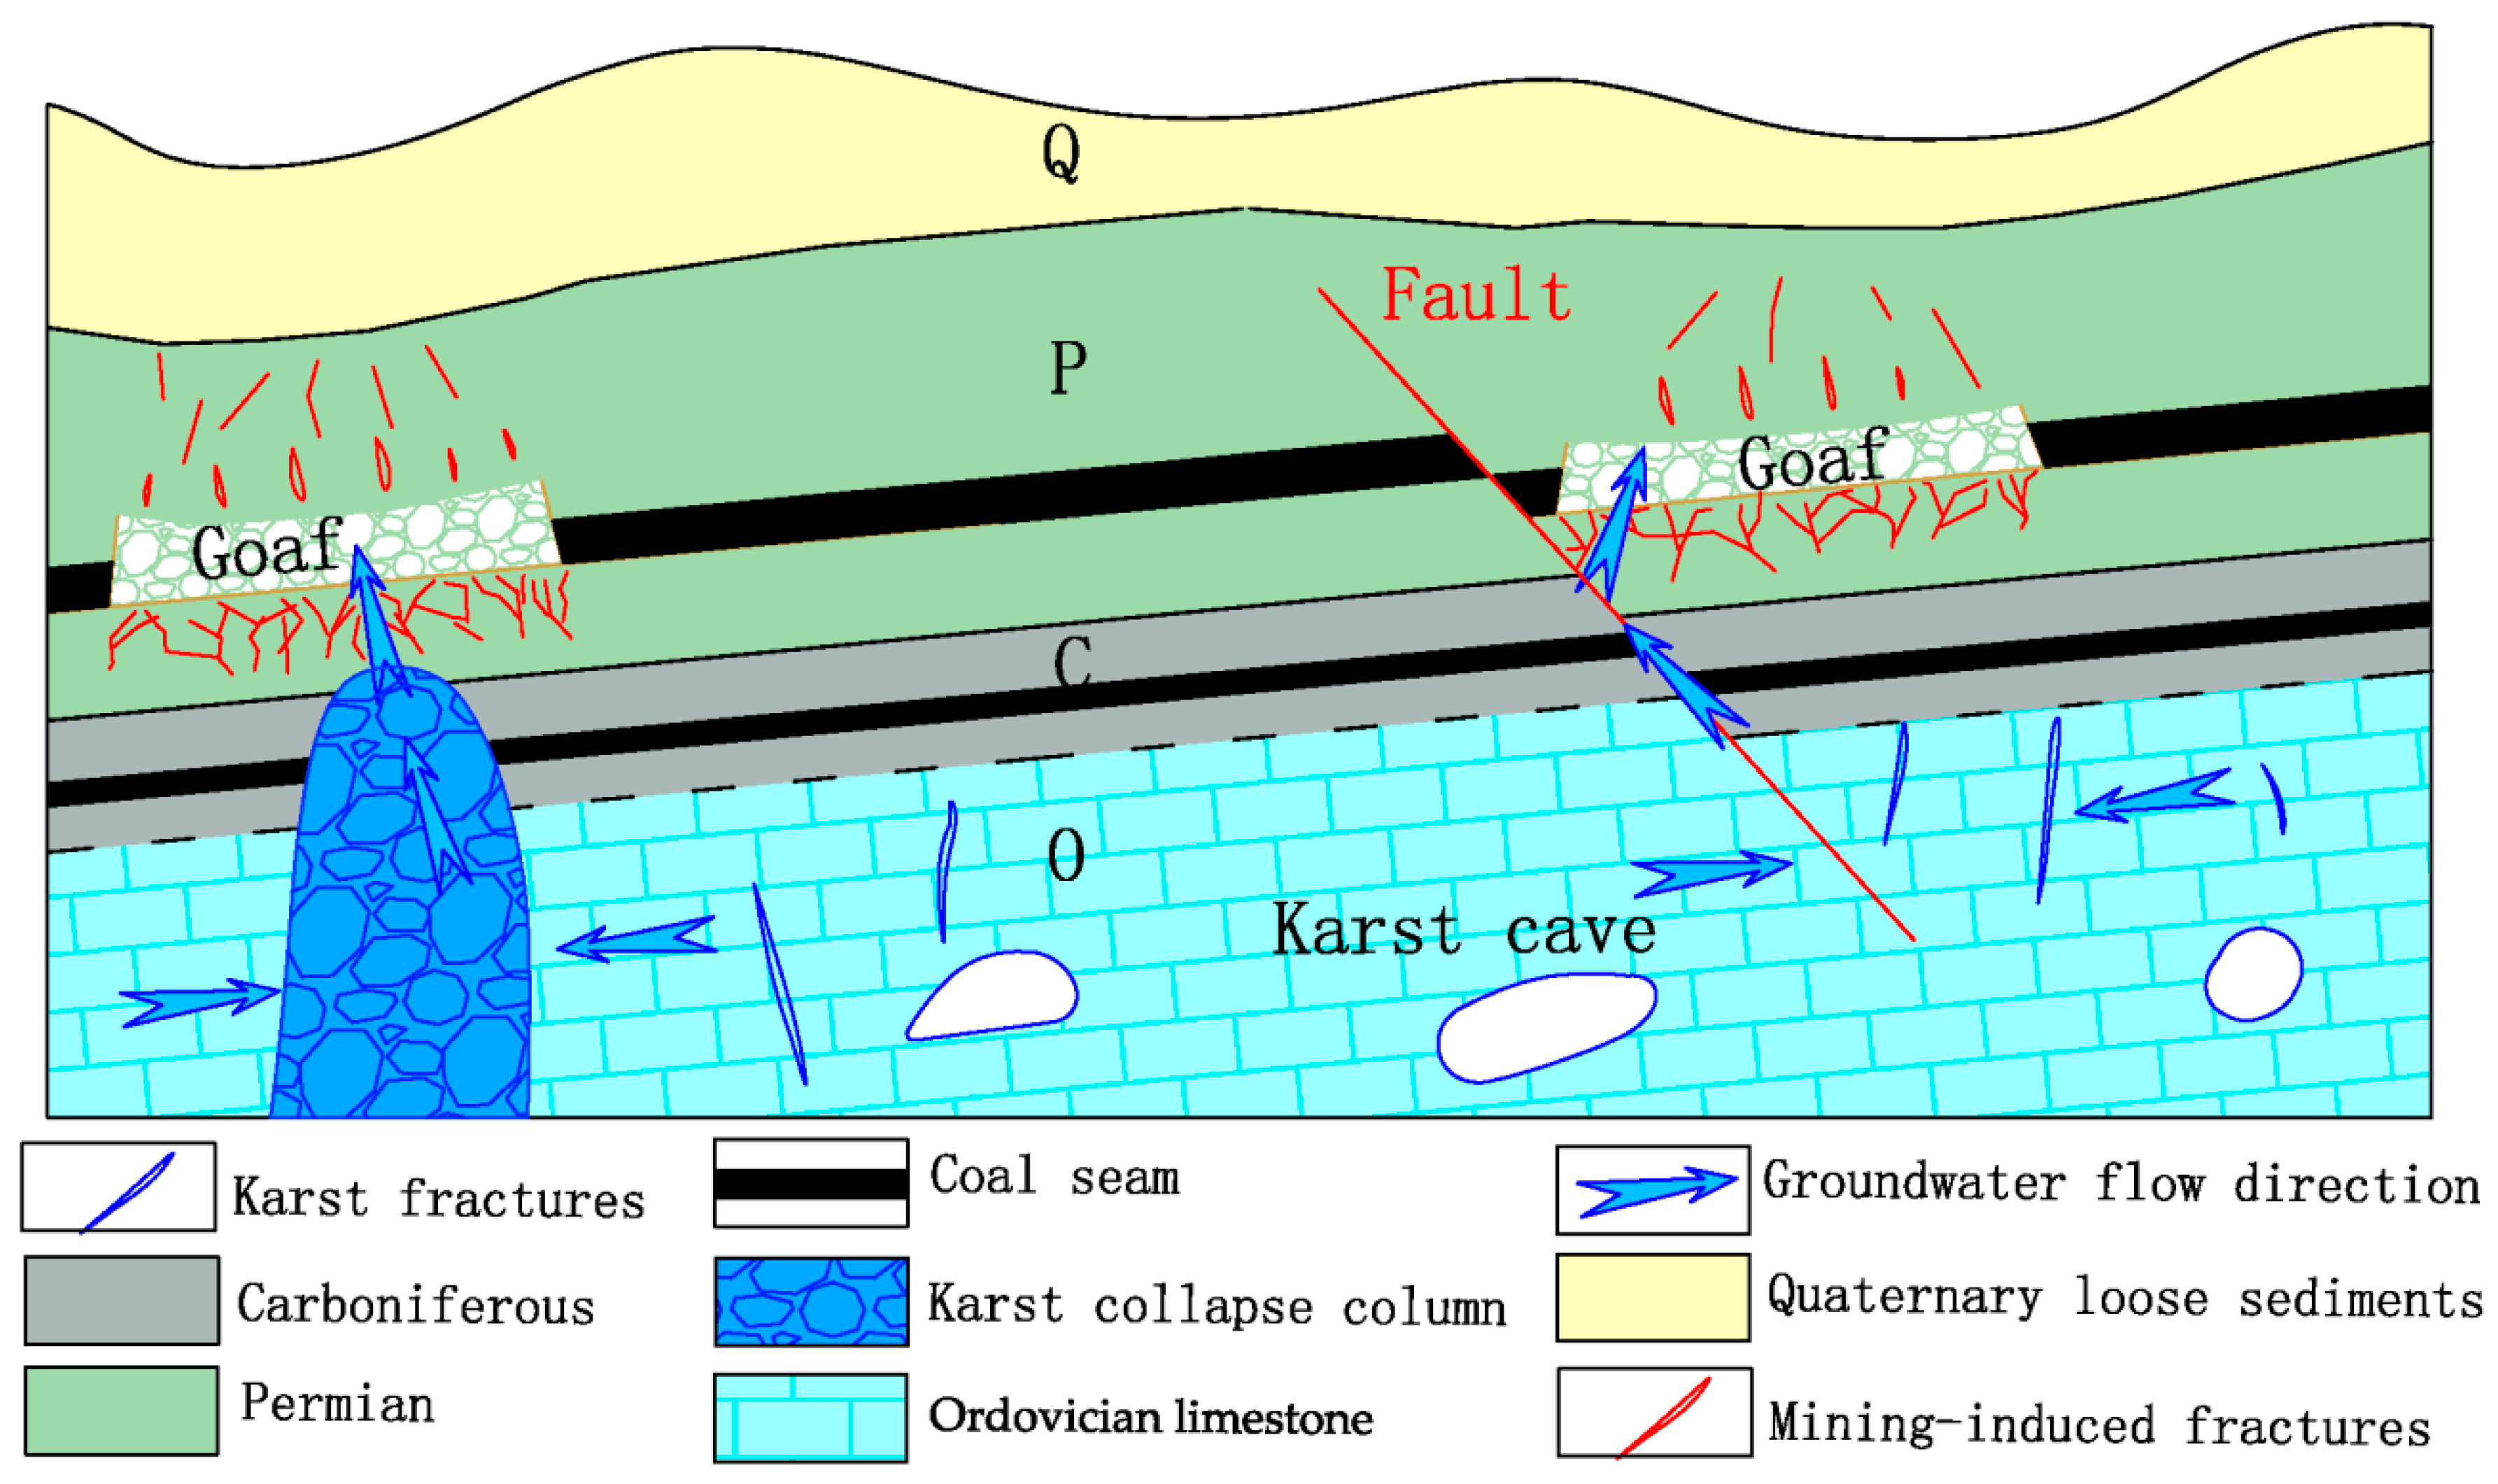
Figure 4.
Annual data comparison diagram of mine drainage quantity and spring flow during 40 years. The units of two series are consistent with Figure 2.
Figure 4.
Annual data comparison diagram of mine drainage quantity and spring flow during 40 years. The units of two series are consistent with Figure 2.
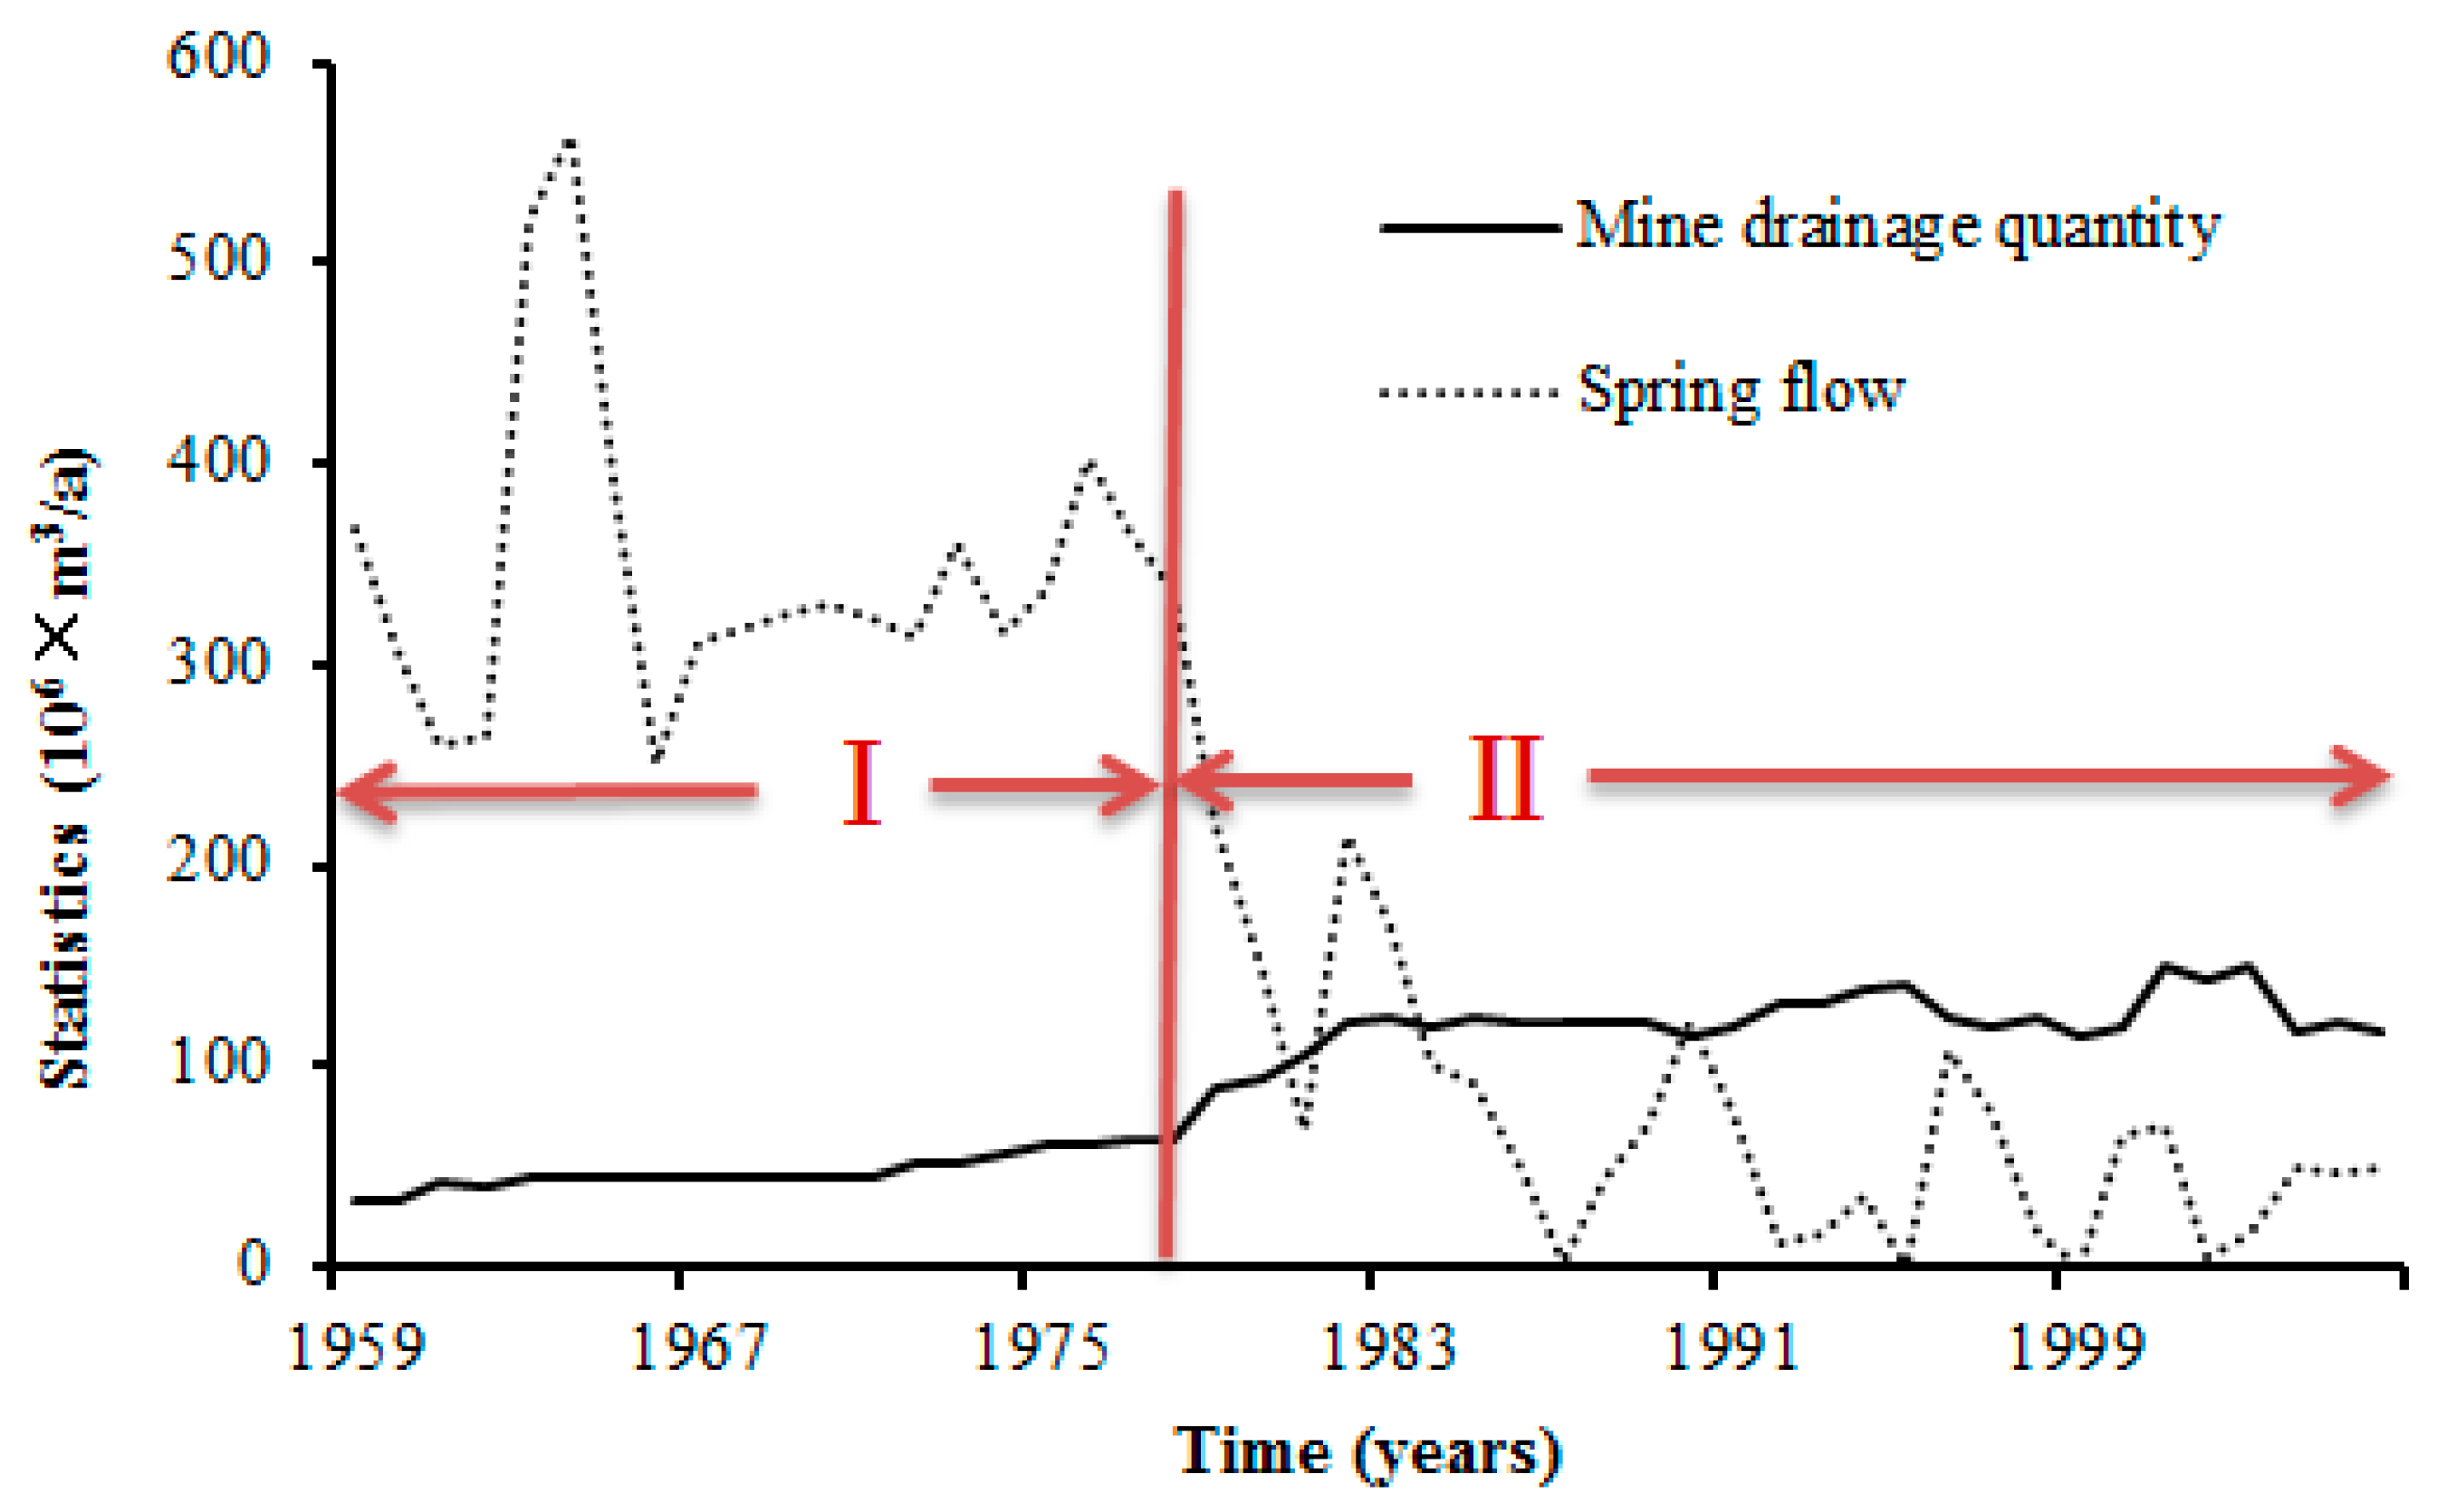
Figure 5.
(a) The ITA scatter diagram of annual rainfall, unit millimeters. (b) The innovative trend analysis (ITA) scatter diagram of underground water level, unit meters. (c) The ITA scatter diagram of spring flow, unit 106 m3/a.
Figure 5.
(a) The ITA scatter diagram of annual rainfall, unit millimeters. (b) The innovative trend analysis (ITA) scatter diagram of underground water level, unit meters. (c) The ITA scatter diagram of spring flow, unit 106 m3/a.
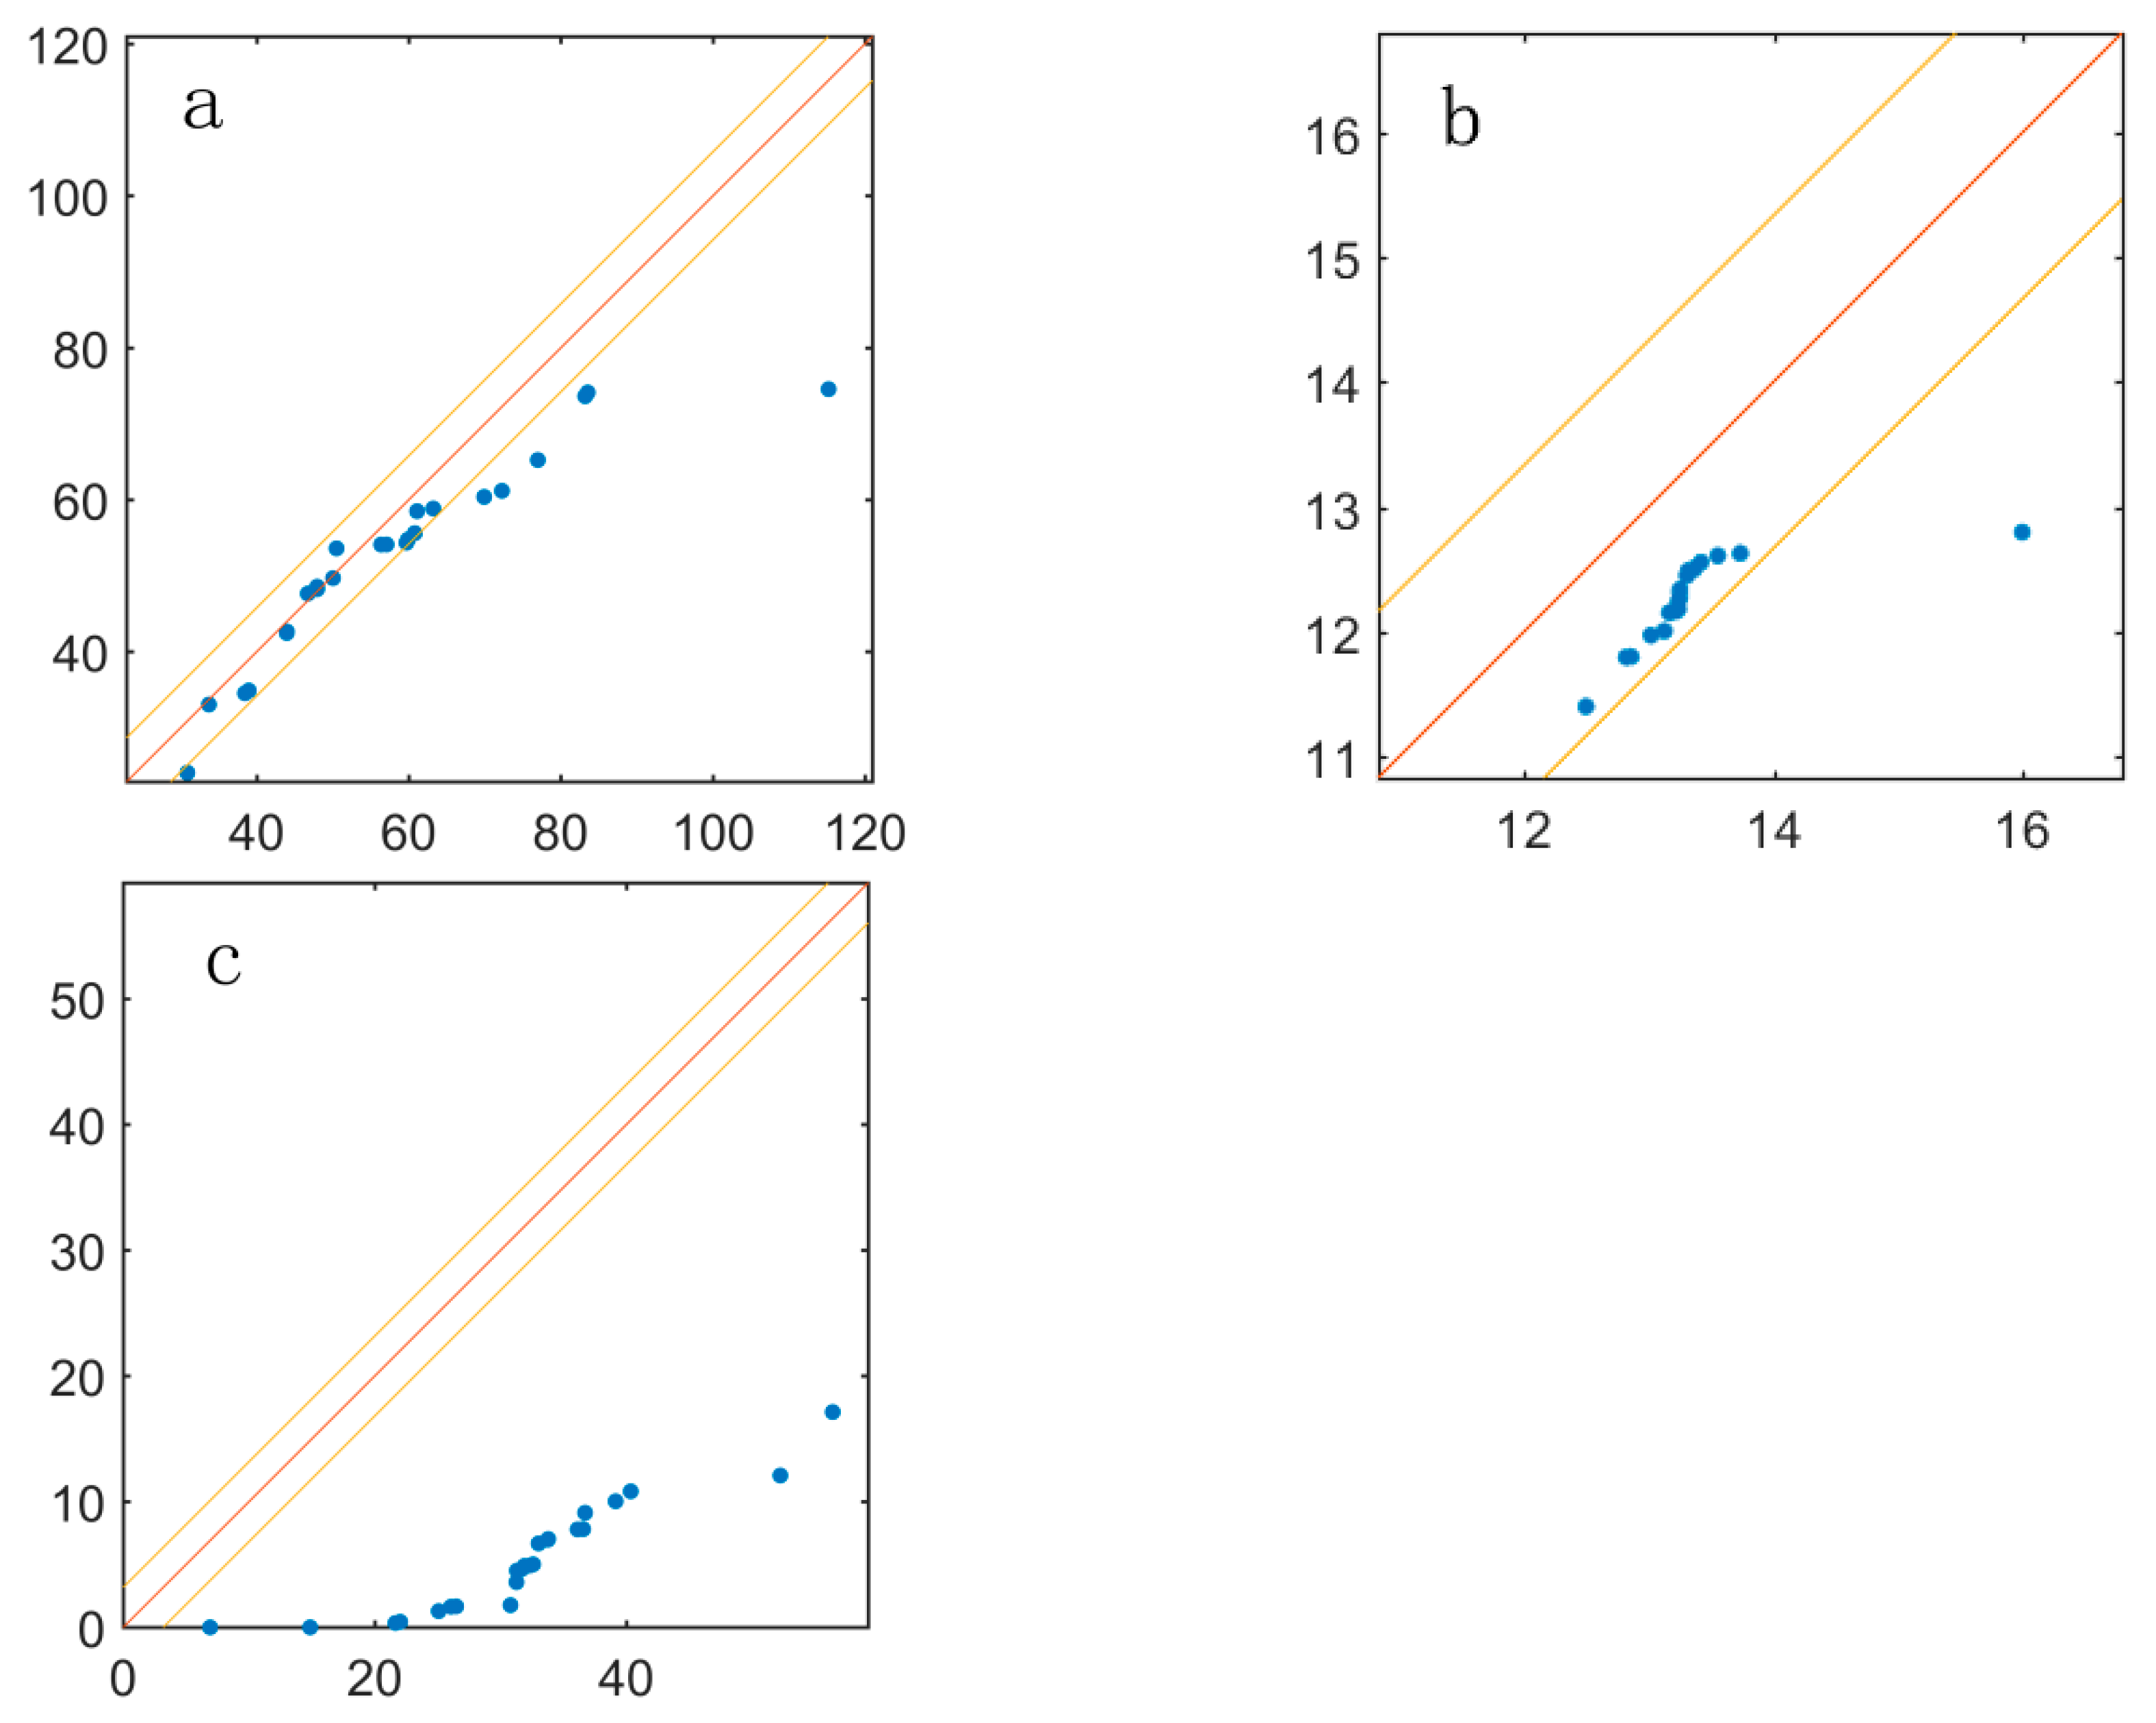
Figure 6.
Mann–Kendall (MK) mutation test, (a) represents rainfall, (b) shows underground water level, (c) is spring flow.
Figure 6.
Mann–Kendall (MK) mutation test, (a) represents rainfall, (b) shows underground water level, (c) is spring flow.

Figure 7.
(a) Heilongdong spring discharge and (b) the detrended spring discharge.

Figure 8.
(a) Wavelet coherence between mine drainage quantity and original springs flow. (b) Wavelet coherence between groundwater withdrawal and original springs flow.
Figure 8.
(a) Wavelet coherence between mine drainage quantity and original springs flow. (b) Wavelet coherence between groundwater withdrawal and original springs flow.
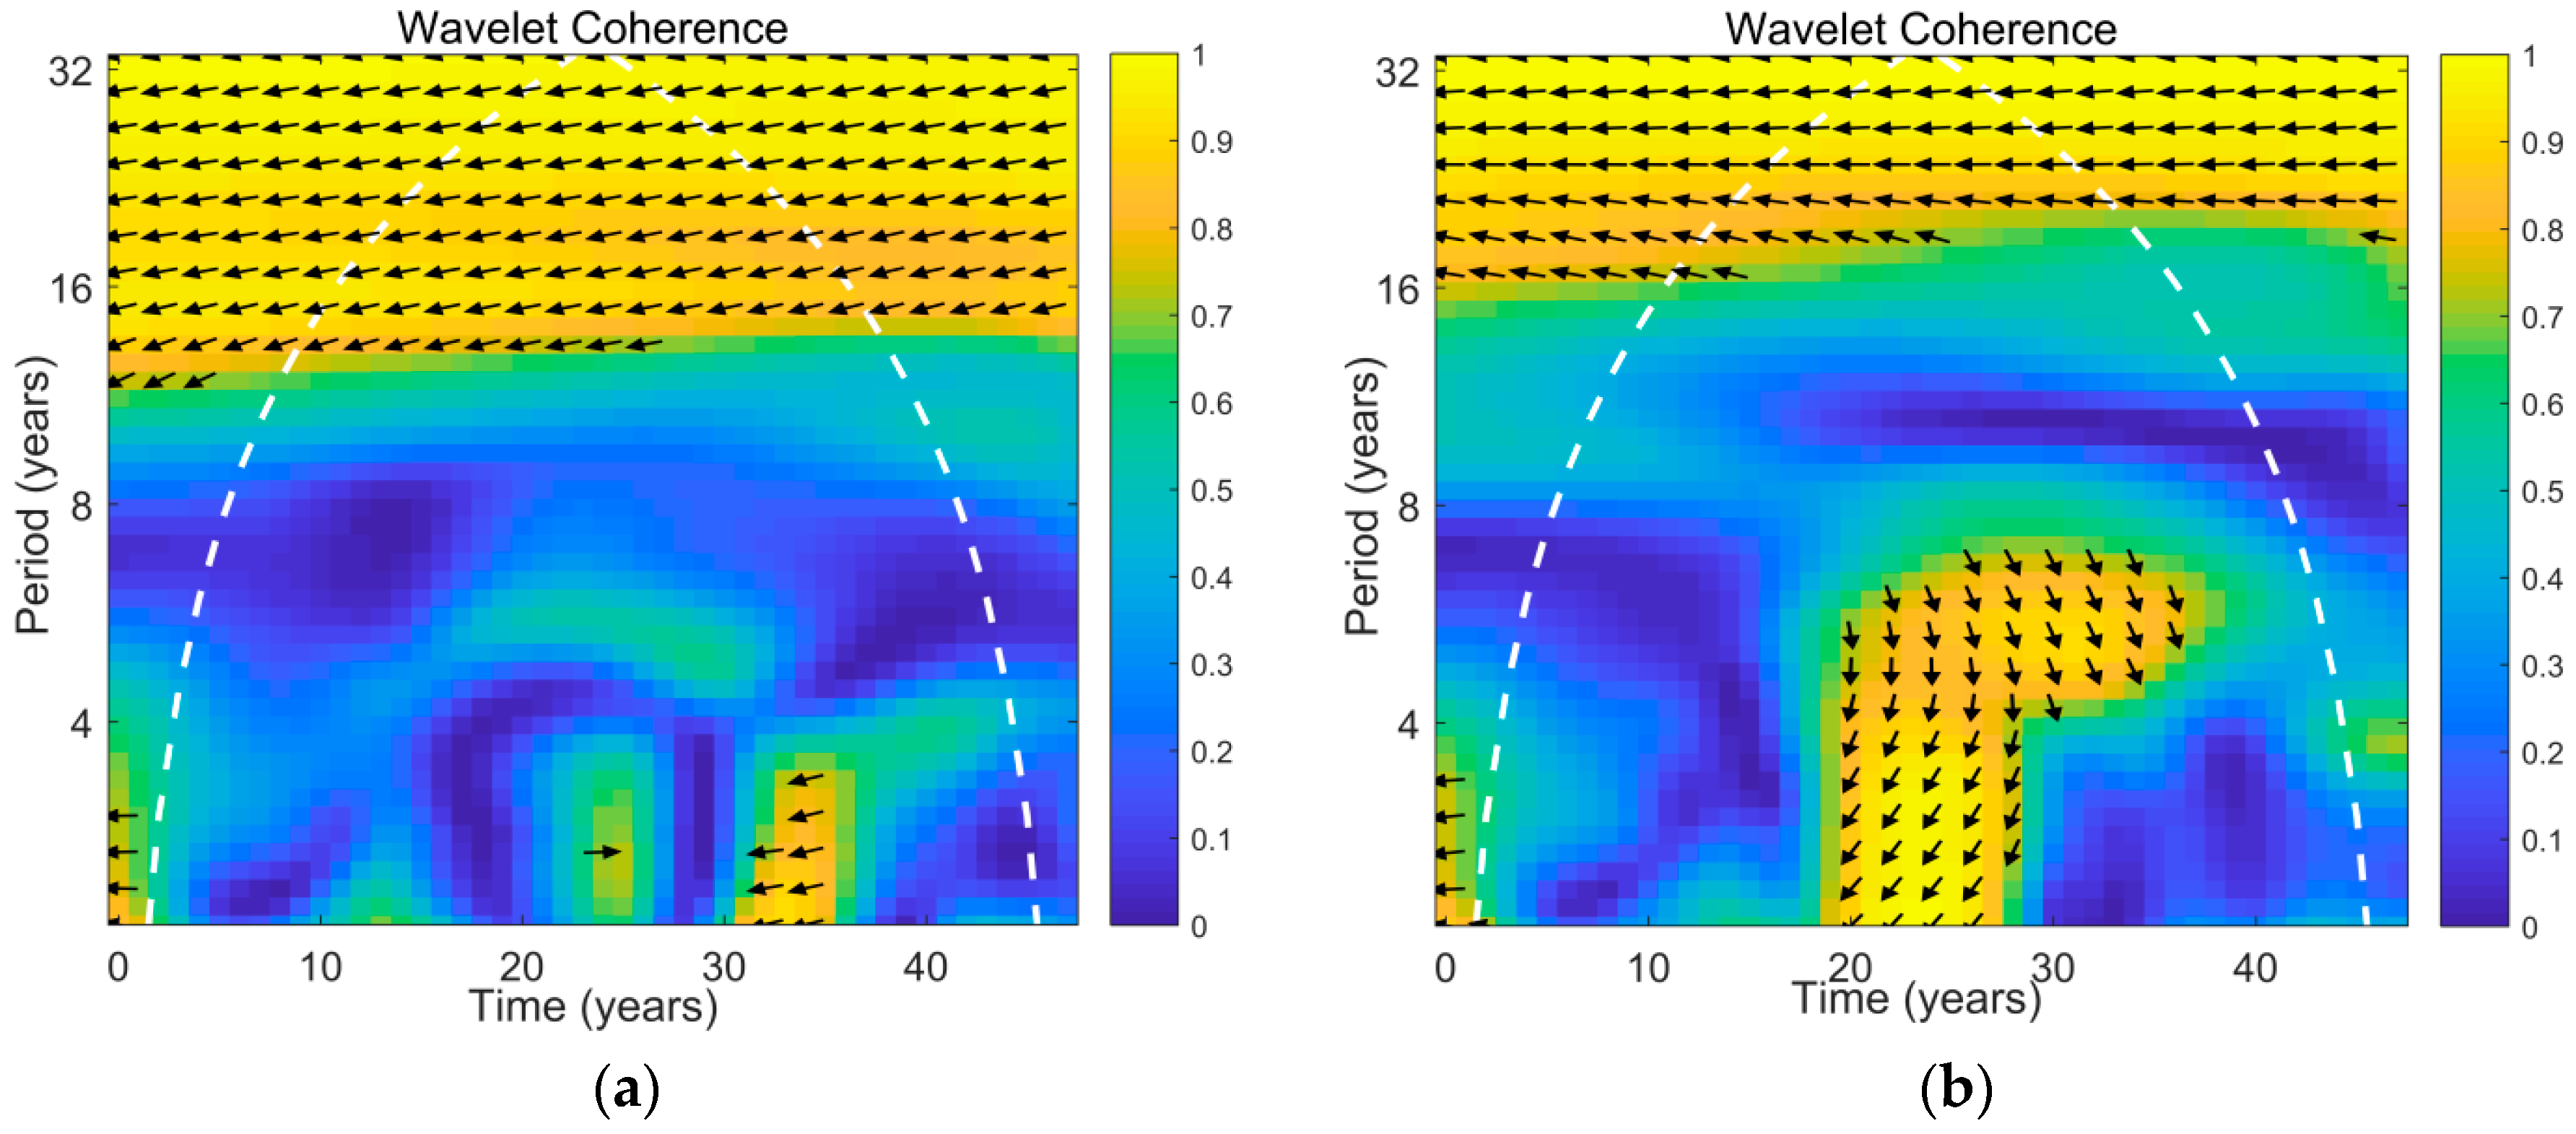
Figure 9.
(a) Wavelet coherence between ground water level and original springs flow. (b) Wavelet coherence between rainfall and original springs flow.
Figure 9.
(a) Wavelet coherence between ground water level and original springs flow. (b) Wavelet coherence between rainfall and original springs flow.
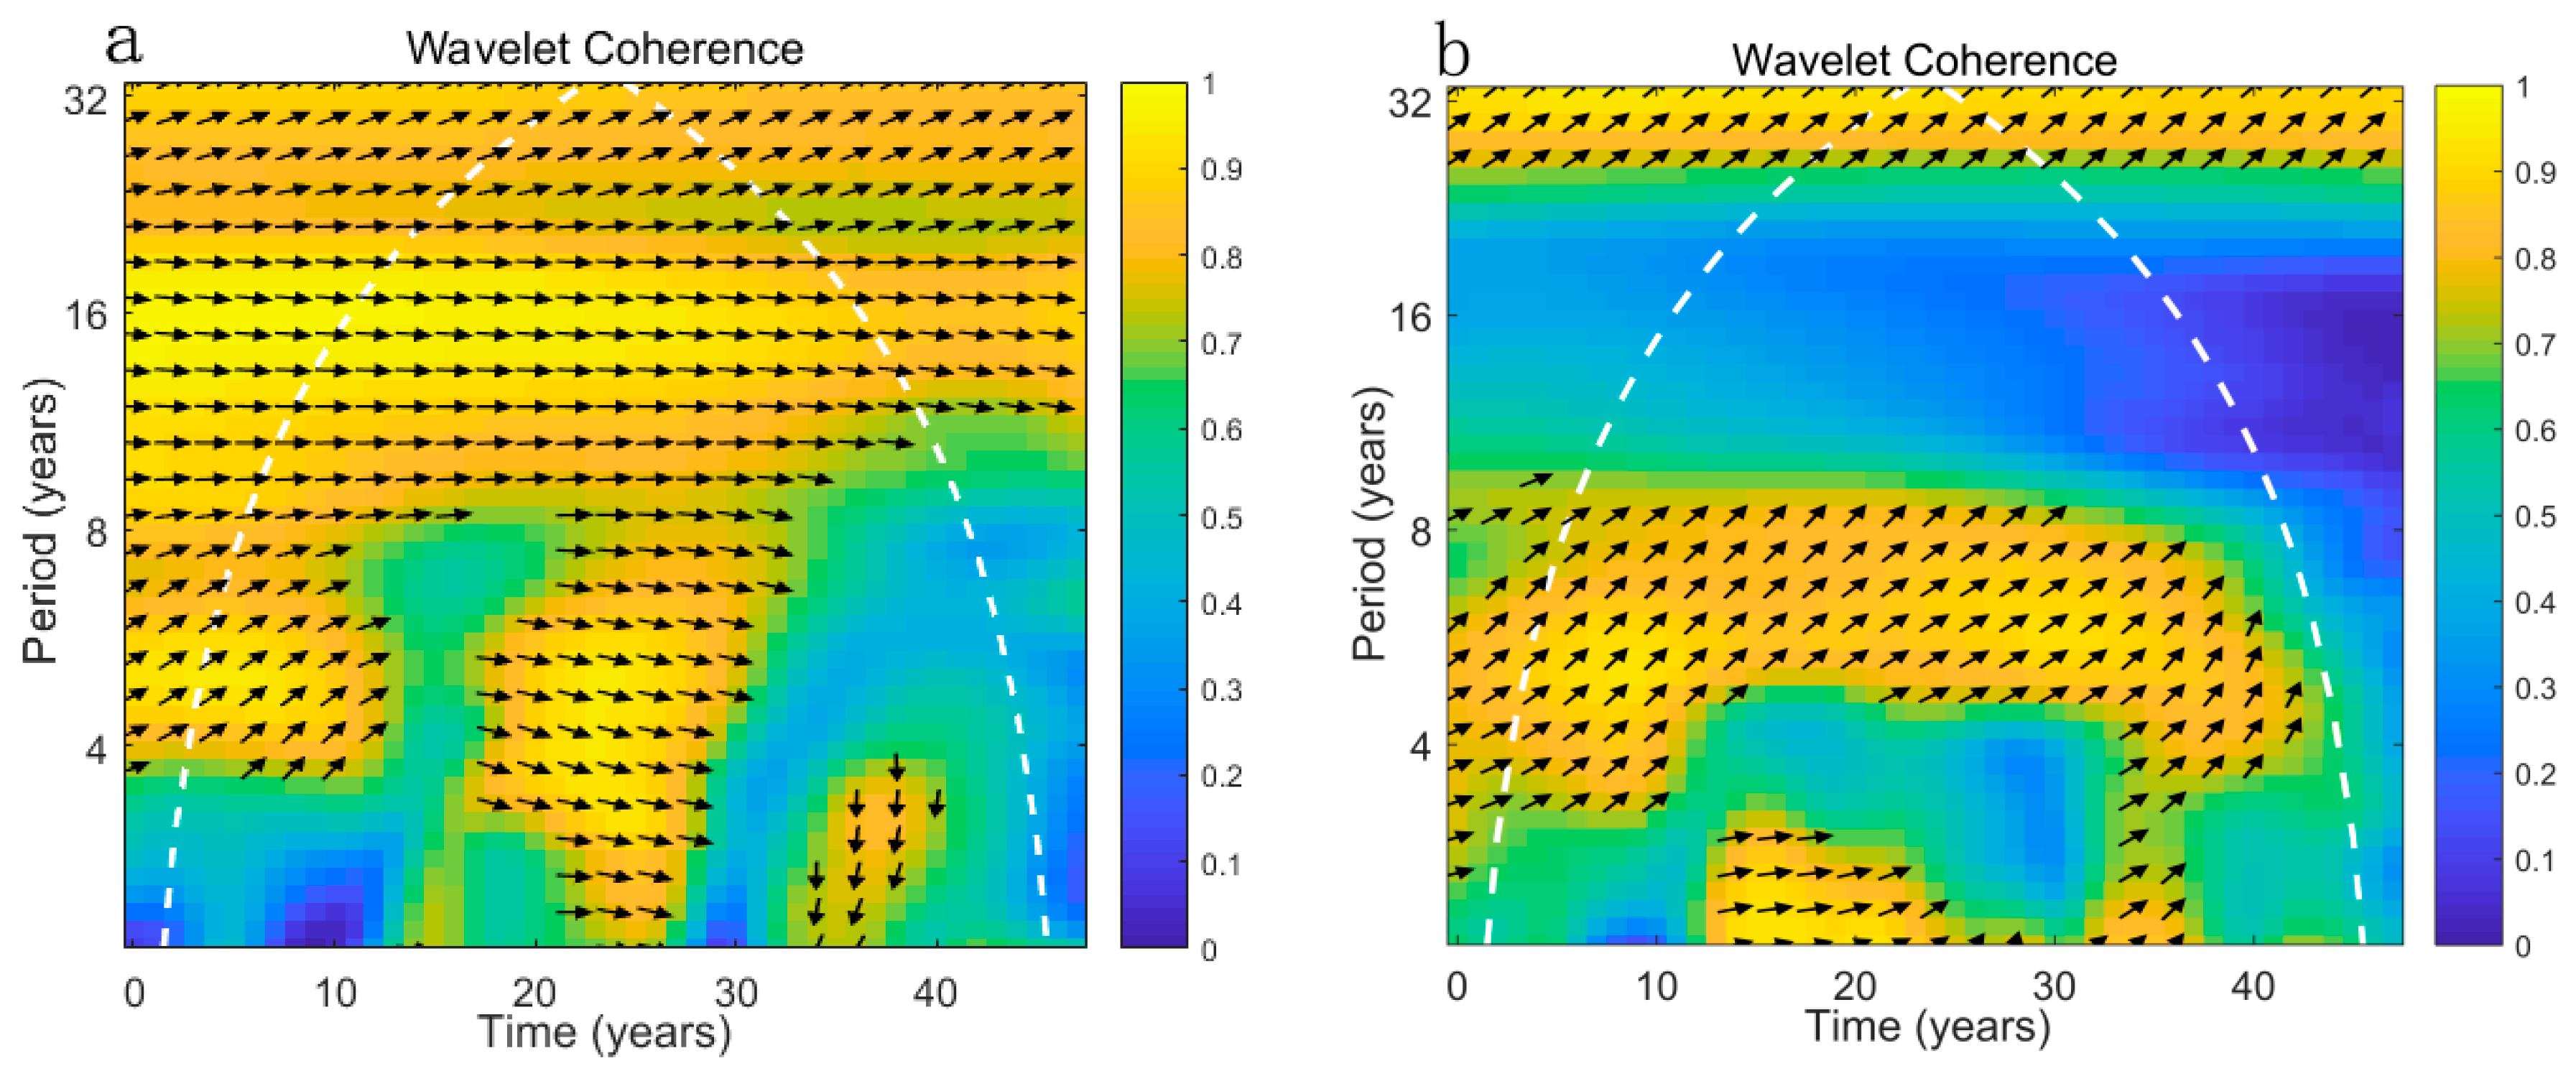
Figure 10.
The wavelet coherence between ground water level or rainfall and residual springs flow. (a) Wavelet coherence between ground water level and residual springs flow. (b) Wavelet coherence between rainfall and residual springs flow.
Figure 10.
The wavelet coherence between ground water level or rainfall and residual springs flow. (a) Wavelet coherence between ground water level and residual springs flow. (b) Wavelet coherence between rainfall and residual springs flow.

Table 1.
Indicators of linear regression (b), Mann–Kendall test (Z) and ITA (D) for five parameters.
Table 1.
Indicators of linear regression (b), Mann–Kendall test (Z) and ITA (D) for five parameters.
| Parameters | b | Z | D | |||
|---|---|---|---|---|---|---|
| Annual | Light | Moderate | Heavy | |||
| Rainfall | −2.34 | −1.19 | −0.96 | −0.31 | −0.27 | −1.88 |
| Mine drainage quantity | 2.57 *** | 7.10 *** | 12.23 | 13.63 | 13.45 | 10.37 |
| Groundwater withdrawal | 4.51 *** | 8.77 *** | 35.03 | 37.56 | 41.76 | 29.38 |
| Underground water level | −0.42 | −7.09 *** | −0.80 | −0.79 | −0.72 | −0.85 |
| Spring flow | −9.41 *** | −5.90 *** | −8.29 | −6.79 | −8.55 | −9.52 |
Table 2.
MK mutation test.
| Parameters | Rainfall | Mine Drainage Quantity | Groundwater Withdrawal | Underground Water Level | Spring Flow |
|---|---|---|---|---|---|
| Abrupt time | 1971 | 1973 | 1980 | 1986 | 1983 |
© 2018 by the authors. Licensee MDPI, Basel, Switzerland. This article is an open access article distributed under the terms and conditions of the Creative Commons Attribution (CC BY) license (http://creativecommons.org/licenses/by/4.0/).
Share and Cite
MDPI and ACS Style
Huang, D.; Liu, Z.; Wang, W. Evaluating the Impaction of Coal Mining on Ordovician Karst Water through Statistical Methods. Water 2018, 10, 1409. https://doi.org/10.3390/w10101409
AMA Style
Huang D, Liu Z, Wang W. Evaluating the Impaction of Coal Mining on Ordovician Karst Water through Statistical Methods. Water. 2018; 10(10):1409. https://doi.org/10.3390/w10101409
Chicago/Turabian StyleHuang, Dan, Zaibin Liu, and Wenke Wang. 2018. "Evaluating the Impaction of Coal Mining on Ordovician Karst Water through Statistical Methods" Water 10, no. 10: 1409. https://doi.org/10.3390/w10101409
Note that from the first issue of 2016, this journal uses article numbers instead of page numbers. See further details here.