Precipitation Thresholds of Drought Disaster for Maize in Areas in Front of Bengbu Sluice, Huaihe River Basin, China


1
Department of Geography & Spatial Information Techniques, Ningbo University, Ningbo 315211, China
2
School of Geography and Tourism, Anhui Normal University, Wuhu 241000, China
*
Author to whom correspondence should be addressed.
Water 2018, 10(10), 1395; https://doi.org/10.3390/w10101395
Submission received: 9 July 2018
/
Revised: 26 September 2018
/
Accepted: 1 October 2018
/
Published: 8 October 2018
(This article belongs to the Section Hydrology)
Abstract
:Droughts occur frequently during summer maize growth in the Huaihe River Basin, China. Identifying the critical precipitation thresholds that can lead to drought is conducive to drought monitoring and the creation of early warning systems. Based on meteorological data from 66 stations from 1961 to 2015 in areas of the Bengbu Sluice in the Huaihe River Basin (BHR), and using correlation analysis between maize climatic yield and water deficit index at different growth stages, the critical period of water deficit in summer maize growth was determined. Twenty-eight types of distribution functions were used to fit the precipitation sequence during the critical period for water during summer maize growth. By applying Akaike Information Criterion and Bayesian Information Criterion, an optimal probability distribution model was established. The precipitation thresholds (Define R as the precipitation thresholds) for each level of drought for summer maize were then quantified based on the precipitation probability quantile method, and the rationality of the index was verified. The results were as follows: (1) The stage of tassel appearance-maturity was the critical period for water during summer maize growth. (2) There was a significant difference in the optimal probability distribution model at the 66 typical sites in the precipitation sequence during the critical period of water during summer maize growth. (3) In this paper, we identified a rapid and effective method for assessing agricultural drought in summer maize, which is based on the precipitation thresholds and dividing the different levels of drought. The precipitation thresholds of a drought disaster for summer maize at the 66 sites varied greatly from region to region. By using the Thiessen polygon method, the precipitation thresholds of a drought disaster during the critical water period during summer maize growth in the Huaihe River Basin were mild drought: 139 ≤ R < 169 mm, moderate drought: 108 ≤ R <139 mm, severe drought: 81 ≤ R < 108 mm, and extreme drought: R < 81 mm.
1. Introduction
Drought is one of the most common meteorological disasters, having a wide range of impacts. Drought has seriously affected the socioeconomic situation, people’s livelihoods, and agricultural production [1,2]. At present, drought is divided into four categories: meteorological drought, agricultural drought, hydrological drought, and socioeconomic drought [3]. Meteorological drought refers to the water deficit caused by an imbalance between precipitation and evaporation [4]. Hydrological drought occurs when river flow is lower than the normal value or when the water level of an aquifer decreases [5]. Social economic drought refers to the phenomenon of social and economic activities, such as production and consumption, that occur due to water shortage in natural systems and human socioeconomic systems [6]. In the context of global warming, agricultural drought has become more frequent and severe [7,8]. Agricultural drought involves soils, crops, human activities, and other factors. The fundamental reason for drought is frequent below-normal precipitation anomalies, resulting in a crop water deficit [9]. In short, agricultural drought is mainly caused by precipitation anomalies, whose intensity depends on the degree of deviation from the normal precipitation amount [10].
The Huaihe River Basin is an important grain production area. It accounts for 14.6 percent of the country’s grain output [11]. Summer maize is the main autumn grain, but droughts that frequently occur during its growth stage negatively affects the growth and development of the crop [12]. Therefore, it is necessary to study drought disaster-causing factors in the BHR. From precipitation, temperature, and other meteorological factors, identifying the critical values (thresholds of drought disaster) is conducive to drought monitoring and early warning work [13].
More indicators for the evaluation of agricultural drought are now available and they are mainly divided into two categories in the international arena: (1) precipitation index based on water supply, including percentage of precipitation anomaly [14], standardized precipitation index (SPI) [15,16,17], standardized precipitation evaporation index [18], and the precipitation probabilistic quantile method [19]; and (2) indicators based on changes in water supply and demand, including crop water stress index [20,21], Palmer Drought Severity Index (PDSI) [22,23], and crop water deficit index [24,25,26]. The two types of indicators have their own advantages and disadvantages. Precipitation indicators involve fewer parameters, access to data is easy, and a drought situation can quickly be assessed [14]. The indicators considering water supply and demand from a main crop growth environment, which include dry and wet conditions of farmland and can more accurately reflect agricultural drought, involve many parameters so that the calculation becomes complex and its timeliness is poor [9,10]. The division of drought levels by the quantile method not only quantifies drought thresholds at all levels, but also has no fixed grade standard of drought compared to some drought indices. The probability value can be set based on the actual situation of the study area to identify drought conditions more accurately. The quantile method has stronger regional applicability [27]. The weather system is complex and varied in the BHR, and special events occur frequently [28]. Drought events need to be quickly and accurately assessed in the BHR [29]. In addition, summer maize is widely planted in the research area, which is an important raw material for food, feed, industrial and chemical products, and plays an important role in food safety and national economic development [30]. Under the background of global warming, drought and flood events occur frequently in the research area, which has seriously affected the growth and production of summer maize [31].
To comprehensively analyze the above, the precipitation probability quartile method was selected to determine the thresholds of drought disaster [32,33]. Agricultural drought was quickly and effectively evaluated, and the degree of drought was judged by accumulating precipitation [34]. The precipitation probability percentile method was used to classify the drought index of crops and reveal the occurrence of drought disasters, mainly based on the precipitation sequence obeying normal distribution or into a normal distribution. The probability distribution model was then used to determine the evaluation index. However, in the study of drought indices during maize growth stages, which are largely based on monthly or late precipitation series, most indices do not fit a normal distribution [19] and the transformation results in very large deviations. Therefore, it is important to determine the optimal distribution of the summer maize precipitation sequence.
Therefore, this paper focuses on summer maize in the BHR based on precipitation data from 66 meteorological stations, from which the precipitation sequence during the critical period for water during summer maize growth was established. Twenty-eight distribution functions were used to fit them. By using the Akaike Information Criterion (AIC) and Bayesian Information Criterion (BIC) tests to test the goodness of fit, the optimal probability distribution model of each site was established. Using the probability quantile method of precipitation, different levels of precipitation thresholds for the drought index were obtained quantitatively. These can be used as a reference for the production of summer maize and in disaster prevention and mitigation, rational distribution, attaining high and stable yield, as well as other work in the BHR.
2. Study Area
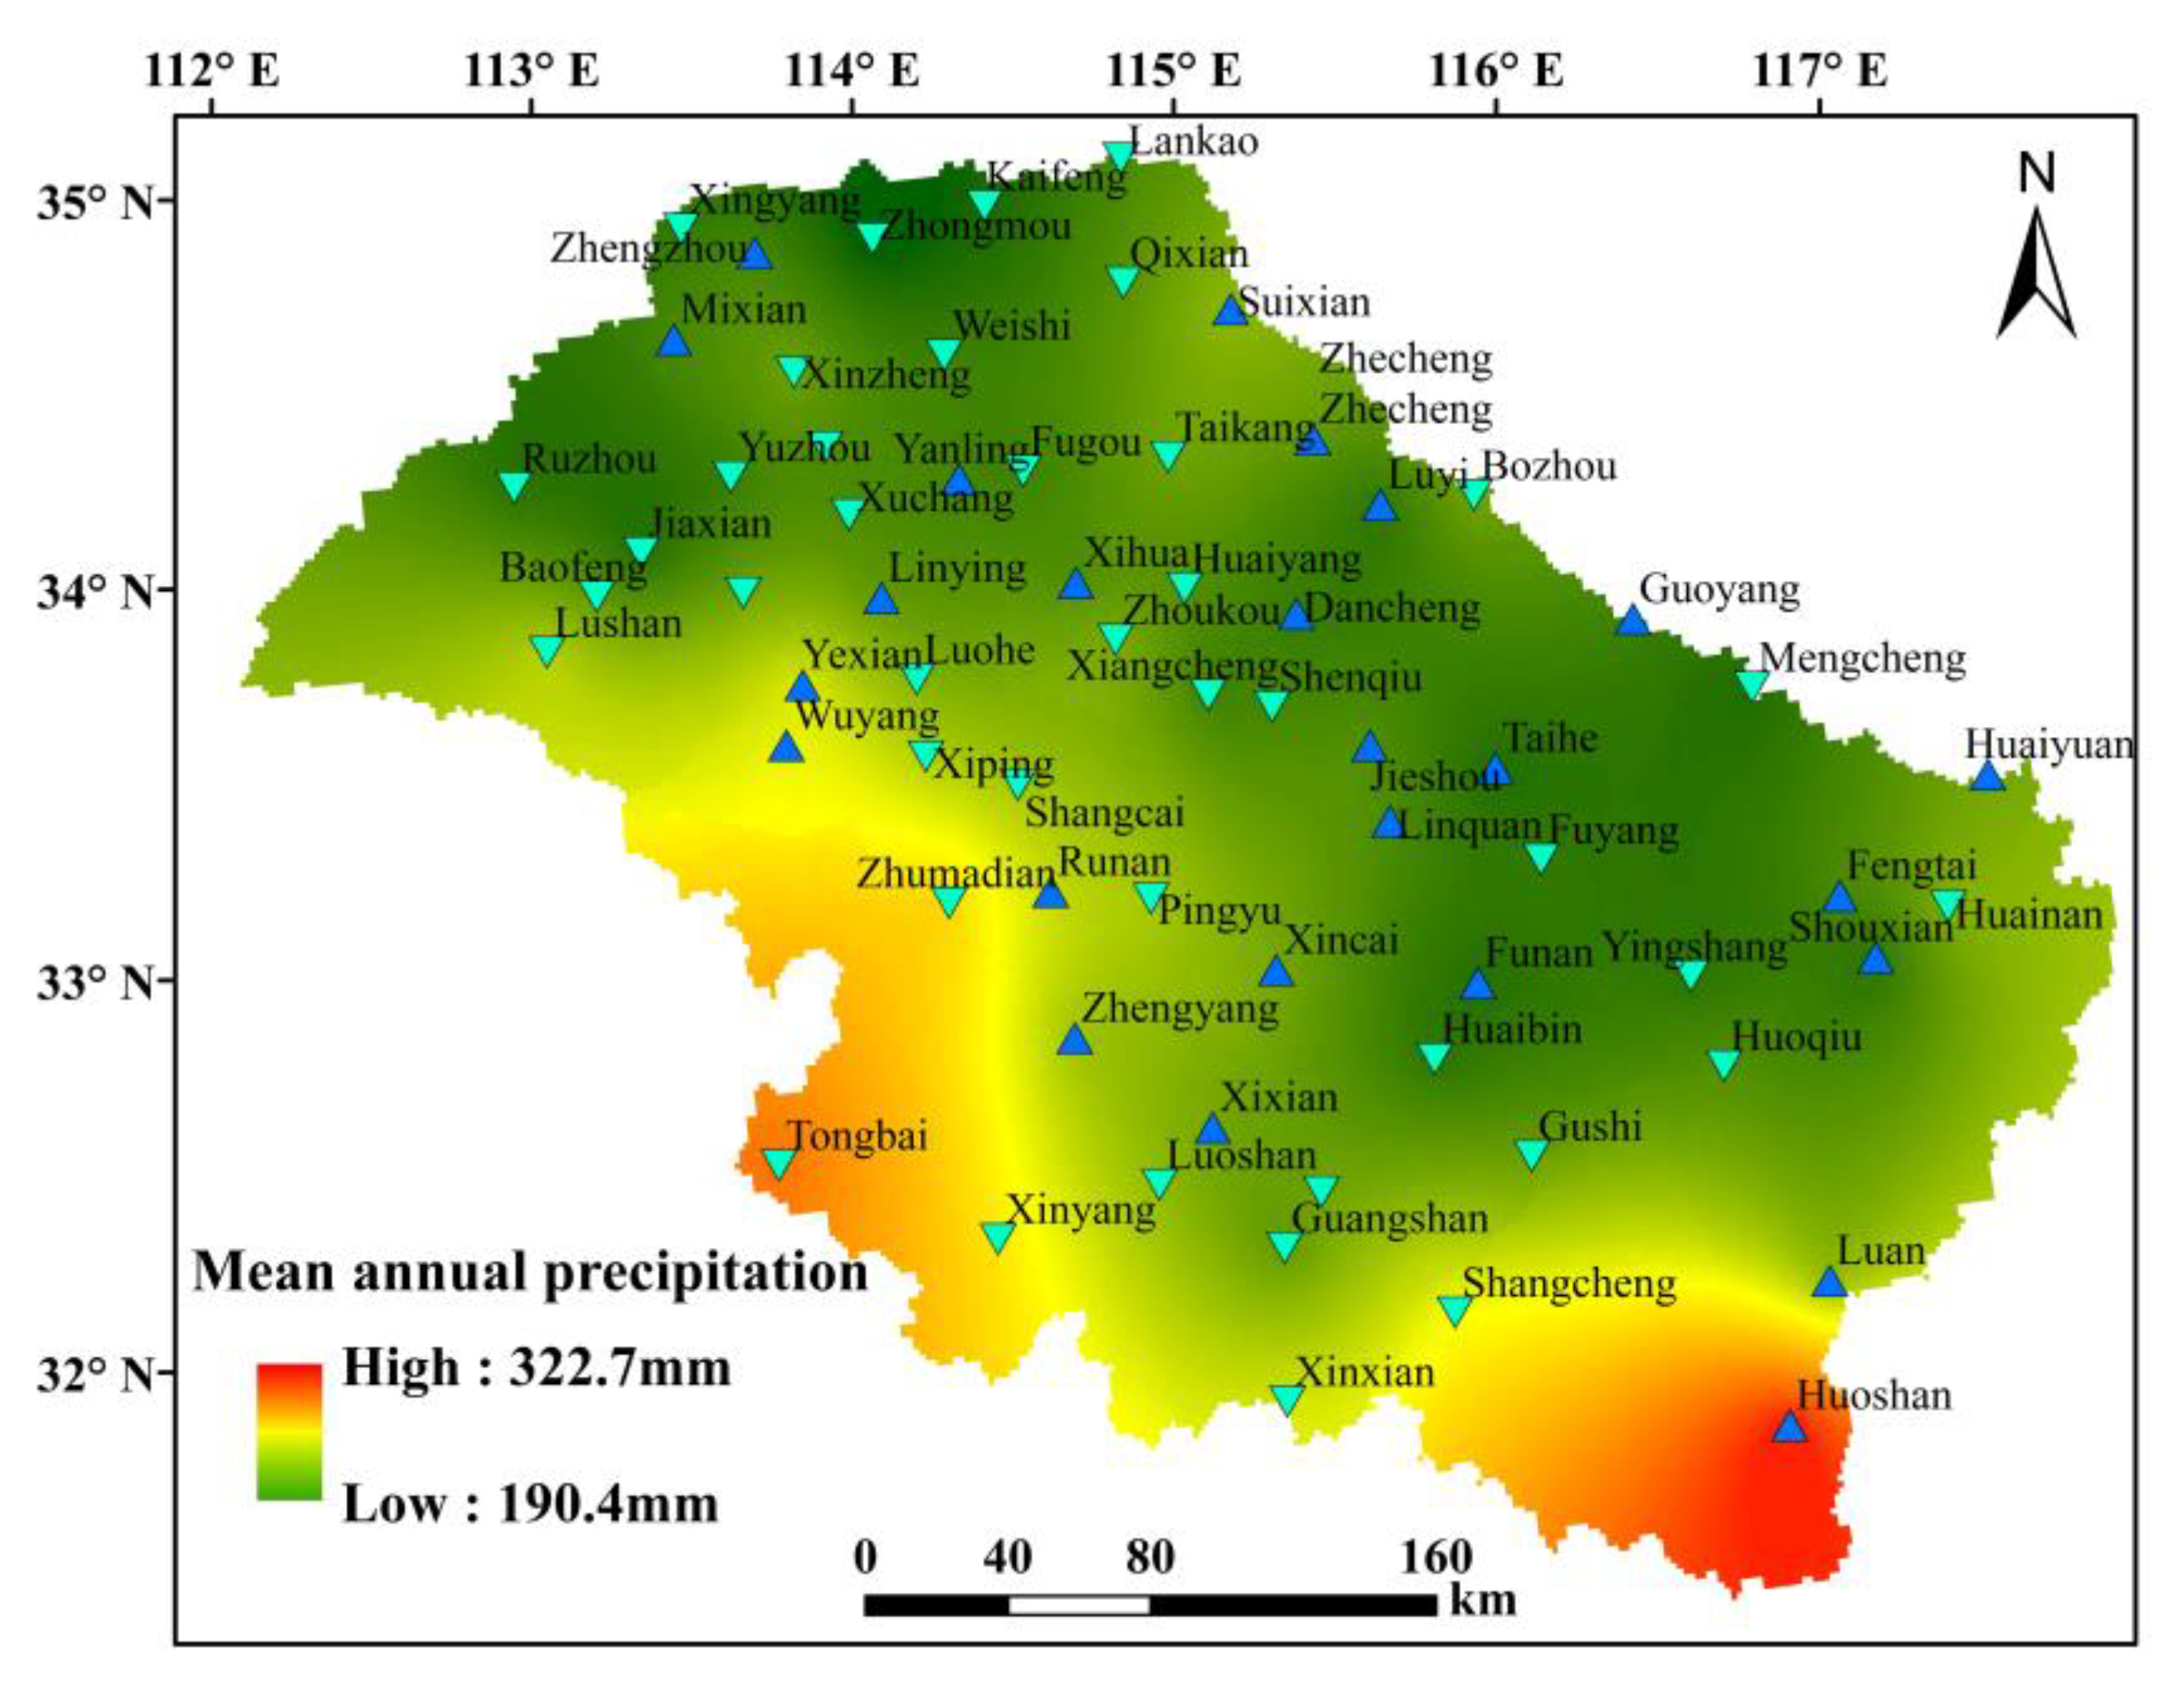
The Huaihe River basin is located in Eastern China with a total area of approximately 270,000 km2 covering four provinces. The Huaihe River is a natural north–south geographical dividing line in China [35]. The BHR is complex in terrain, has a changeable climate, and the interannual variation in precipitation is large (Figure 1). It forms a typical regional drought and flood environment where “heavy precipitation causes flood, precipitation causes waterlogging; no precipitation causes drought” [28]. The study area is a typical area in terms of agricultural drought and 15 severe droughts have occurred between 1949 and 2014, which have adversely impacted agricultural production. Precipitation and temperature are the main influencing factors of agricultural disaster in the BHR [29].
3. Data and Methods
3.1. Data
The data used in this paper mainly included meteorological data, summer maize yield data, and disaster data. The daily meteorological data (precipitation, temperature, air pressure, sunshine, relative humidity, etc.) from 1961 to 2015 from 66 meteorological stations in the BHR were provided by the China Meteorological Administration National Climate Center [36] and it has carried out quality control on the data (e.g., extreme value test, internal consistency test, time consistency test, spatial consistency test), and to a certain extent, they handled the missing values. Therefore, the climate data we obtained is complete data after certain processing. Summer maize yield data from 1961 to 2014 from 12 stations in the BHR and another 3 stations nearby were from the Chinese crop information network [37] and the Chinese agricultural data network [38]. The disaster data were mainly obtained from the China Meteorological Disasters Summary (Henan and Anhui volumes) of the China Meteorological Disaster Yearbook (2005–2014), China flood and drought series focus” (Henan and Anhui volumes), and corresponding Civil Affairs Bureau statistics.
3.2. Methods
3.2.1. Division of Main Growth Period of Maize
According to the proposed criteria from the Food and Agriculture Organization of the United Nations (FAO), the entire maize growth period is divided into four growth stages, so we determined the average dates of the main maize growth periods in the BHR (Table 1).
3.2.2. Climatic Yield
The actual yield of summer maize depends mainly on the level of productivity and meteorological conditions, while being influenced by some random factors [39]. Therefore, the total summer maize yield is divided into three parts: (1) the crop yield trend determined by the level of social productive forces; (2) the climatic yield determined by climatic elements, which is not affected by the level of productivity and maize varieties; and (3) random errors affected by stochastic factors. The formula is as follows:
where yw is the climatic yield, y is the actual yield data of summer maize, yt is trend crop yield, and Δy is random error (generally ignored). Trend crop yield can be modeled using statistical methods. In this paper, the trend in crop yield of summer maize was simulated using the polynomial regression analysis method [40].
3.2.3. Water Deficit Index
According to the principle of farmland water balance, the water deficit index of summer maize during a certain growth period is composed of natural water supply and water demand without considering irrigation [10]. The degree of drought during a period is not only related to the amount of water deficit during this period, but also to the amount of pre-water surplus. Therefore, this paper considered the amount of pre-water surplus, and the revised formula is as follows:
where I is the water deficit index, where negative values indicate water deficit, and positive values indicates moisture surplus; R is the natural water supply, and in the absence of irrigation is precipitation (mm day−1); R10 represents cumulative precipitation during the first 10 days; and W is water demand (mm day−1), calculated by reference crop evapotranspiration and the summer maize crop coefficient [10]. W10 accumulates the water demand on the first 10 days. The formula for W is as follows:
where ET0 is reference crop evapotranspiration (mm day−1) and Kc is crop coefficient. Kc is an index that reflects the combined effects of soil evaporation and crop transpiration, and is affected by a variety of factors such as climatic conditions, crop types, soil evaporation, etc. [41]. The value of Kc is determined using the standard crop coefficient and correction formula recommended by the FAO, and it is corrected according to the actual meteorological, hydrological, soil, and other factors in the study area. In order to determine the crop coefficient of summer maize at each growth stage in the BHR, we drew upon the measured results of the crop coefficient at some sites in the BHR [28], as shown in Table 2.
In this paper, the reference crop evapotranspiration of summer maize was studied using the Penman-Monteith formula recommended by the FAO [26]:
where Rn is the net radiation at the crop surface (MJ m−2), Δ is the saturated water vapor pressure curve slope (kPa °C−1). T is the daily average temperature (°C), U2 is the wind speed at 2 m height (m s−1), es is the saturation vapor pressure (kPa), ea is the actual vapor pressure (kPa), and γ is the psychrometric constant (kPa °C−1).
3.2.4. Calculation of Precipitation Thresholds
The method for determining the precipitation thresholds used in this paper mainly involved the precipitation probability quantile method [32,33], the determination of the optimal probability fitting model, and the AIC and BIC. The precipitation probability quantile was obtained based on the random probability characteristics of different precipitation amounts, combined with historical data analysis. The probability of occurrence of precipitation maxima or minima is small, and in the range centered on the mean precipitation value, the probability of occurrence of precipitation is large. The precipitation probability quantile method is mainly based on the fact that the precipitation sequence obeys normal distribution or transforms into a normal distribution, and then the probability distribution model determines the drought evaluation index, divides the agricultural drought level, and reveals the occurrence law of drought.
In this paper, the optimal distribution function of the precipitation sequence during the critical period for water during summer maize growth in the BHR is thoroughly discussed. Based on the optimal function, the corresponding probability key value is given to quantitatively divide the precipitation thresholds of drought disasters during the critical water period during summer maize growth in the BHR. In order to better select the optimal distribution function, we used 28 distribution functions to fit the precipitation sequence. The distribution functions were divided into four categories (Table 3): (1) the bounded probability distribution function (the range of random variable X is (m, n)), (2) the non-negative probability distribution function (the random variable X is taken as a function of the random variable X), (3) the non-negative probability distribution function (random variable X ranges from (μ value range)), and (4) the generalized distribution function.
Both AIC and BIC were used to determine the optimal probability distribution function at each site, with the aim of reducing the error of precipitation sequence fitting. The criterion for selecting the optimal distribution function is the minimum sum of the check sums obtained from the AIC and BIC tests.
AIC is a standard for measuring the goodness of statistical model fitting. It was proposed by Japanese statistician Akachi Hiroshi in 1974 [42]. It is based on the concept of entropy and provides a standard for weighing the complexity of the model and the goodness of the fitted data. AIC estimates the relative information lost by a given model: the less information a model loses, the higher the quality of that model. In making an estimate of the information lost, AIC deals with the trade-off between the goodness of fit of the model and the simplicity of the model. AIC is defined as:
where k is the number of model parameters and L is the likelihood function. When choosing the best model from a set of alternative models, the model with the smallest AIC is usually selected. In general, when the complexity of the model is increased (k is increased), the likelihood function L is also increased, so that the AIC becomes smaller, but when k is too large, the growth rate of the likelihood function is slowed down, resulting in an increase in AIC. Too complex is easy to cause over-fitting. The goal is to select the model with the smallest AIC. AIC not only needs to improve the model fit (maximum likelihood), but also introduces penalty terms to make the model parameters as small as possible, which helps to reduce the possibility of over-fitting.
In the case of small samples, AIC is converted to AICc. AICc is defined as follows:
n represents the sample. As the sample increases, AICc converges to AIC, so AICc can be used at any sample size [43].
The BIC is similar to AIC and is used for model selection but with a different penalty for the number of parameters. It was proposed by Schwarz in 1978 [44]. When training the model, increasing the number of parameters, that is, increasing the complexity of the model, will increase the likelihood function, but it will also lead to over-fitting. For this problem, both AIC and BIC introduce penalty terms related to the number of model parameters. The penalty of BIC is larger than that of AIC. Considering the number of samples, if the number of samples is too large, the model complexity can be effectively prevented from being too high due to excessive model accuracy. The formula is as follows:
where k is the number of model parameters, n is the number of samples, and L is the likelihood function. The kln(n) penalty term can effectively avoid the dimensional disaster phenomenon when the dimension is too large and the training sample data is relatively small.
3.2.5. Thiessen Polygon
Dutch climatologist Thiessen proposed a method for calculating average rainfall based on rainfall from discretely distributed meteorological stations [45]. All adjacent weather stations are connected into triangles, vertical bisectors are formed on each side of these triangles, and the intersections of the vertical bisectors of the three sides of each triangle are connected to obtain a polygon [46]. The rainfall intensity of a unique weather station contained in this polygon is used to represent the rainfall intensity in this polygonal region, and this polygon is called the Thiessen polygon. Thiessen polygons are also known as Voronoi diagrams, or Dirichlet diagrams [47].
3.2.6. Space Interpolation
The results of the study are described by using the Kriging interpolation method in ArcGIS 10.1 software (Environmental Systems Research Institute, Redlands, CA, USA), including precipitation during the critical water period during summer maize growth, precipitation thresholds of a drought disaster for summer maize, the distribution of disasters in typical drought years, and distribution of spatial elements.
4. Results
4.1. Critical Water Period During Summer Maize Growth
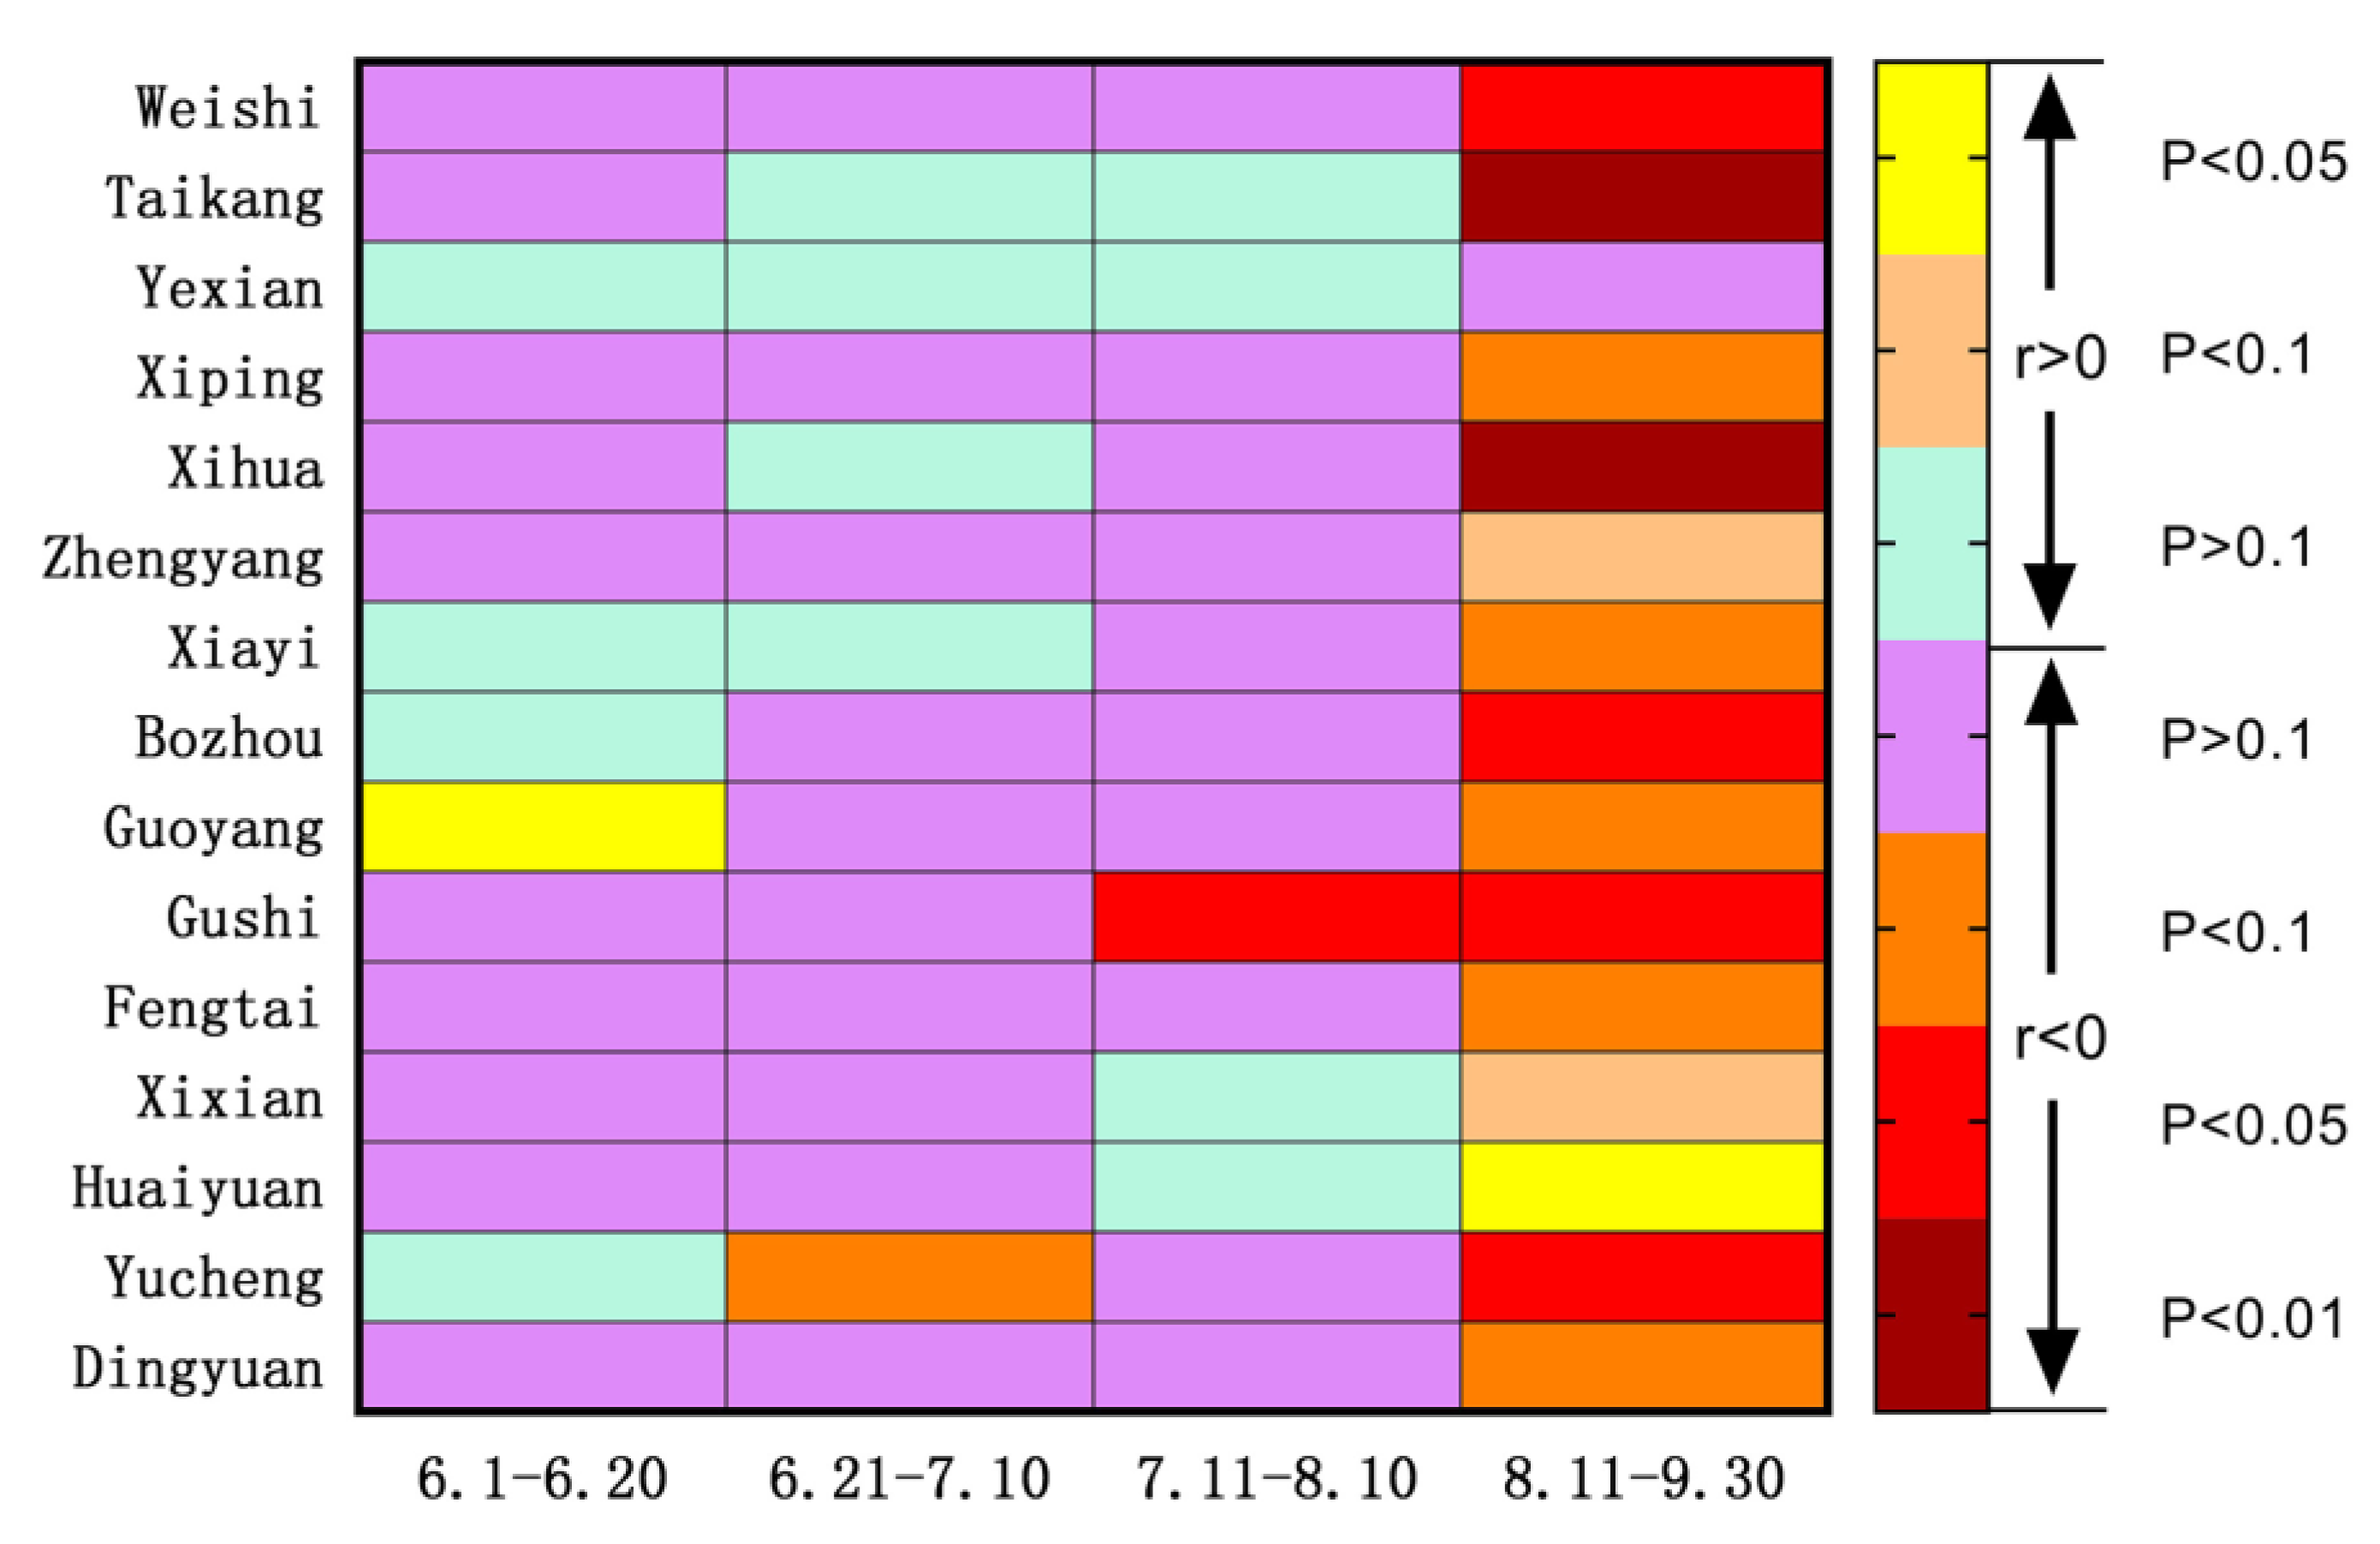
In this paper, the trend in crop yield of summer maize was simulated using polynomial regression analysis and R2 is the goodness of fit. The average goodness of fit of the trend in crop yield at the 15 sites was 0.79, the highest was 0.95 in Weishi, and 60% of the sites had a good fit of 0.8 or more. Overall, the trend in crop yield of all sites fit better. By analyzing the correlation between water deficit index and climatic yield at different growth stages of summer maize, the critical period for water during summer maize growth in the BHR was determined. Based on the statistical analysis software SPSS 20 (International Business Machines Corporation, Armonk, NY, USA) and selecting 15 typical yield sites (Yucheng, Xiayi, and Huaiyuan are near the study area), the Pearson correlation coefficient (r) of the water deficit index and climate yield at different growth stages of summer maize was obtained. As shown in Figure 2, at 86.7% of the sites, the correlation between water deficit index and climate yield in the maize tassel-mature stage of summer maize was high, and all passed the significance level test. Two of these sites passed a significance level of 0.001, five sites passed the 0.05 significance test, and five sites passed the 0.1 significance test. During the tassel-mature stage period (11 August to 30 September), climatic production had the highest correlation with the water deficit index. Therefore, we determined that the key period for water influencing the final yield during the summer maize growth period is the tassel-mature stage in the BHR.
4.2. Temporal and Spatial Precipitation Characteristics of Critical Water Period for Summer Maize Growth
Precipitation spatial distribution during the critical period for water during summer maize growth over the past 55 years was analyzed by Kriging in the BHR. Then, the trend in precipitation changes for each meteorological station was tested using the Mann-Kendall (MK) trend test method [48]. The results are shown in Figure 3. The precipitation at each site was mainly between 190 and 323 mm and its spatial distribution generally showed that in the south, precipitation was higher than in the north, and mountain precipitation was higher than that on the plains. Each station had large annual precipitation variability. Taking the Tongbai station as an example, in the critical period for water during summer maize growth, the precipitation in 2001 was only 22.5 mm, while the precipitation in 1989 was 762.3 mm. The MK trend test results show that precipitation at approximately 62% of the sites is trending downward. Increasing trends at the sites mainly were observed in the central region, but no site passed the significance test, which indicates that the trend in precipitation in the critical period for water in summer maize growth is not obvious, and mainly fluctuates.
4.3. Determining the Optimal Probability Distribution Model
Using the 28 types of distribution functions, the precipitation sequence during the critical water period for summer maize growth at each site in the BHR was fitted. The distribution function of the precipitation sequence at each site was selected using the AICc and BIC. The smaller the test’s statistical value, the better the fitting degree, and the better the fitting effect of the function. The study ensured that the optimal fitting function was the least cumulative sum of the test values of the AICc and BIC. In the study area, the statistics of the optimal probability distribution function of the precipitation sequence for summer maize at the 66 sites is shown in Figure 4, which covers 6 types of functions. Among them, the optimal fitting model of 22 sites was the Beta function, including Zhengzhou, Wuyang, Luohe, Huaiyang and so on.
4.4. Determining Precipitation Thresholds of a Drought Disaster for Summer Maize
4.4.1. Numerical Determination of Precipitation Thresholds of a Drought Disaster for Summer Maize
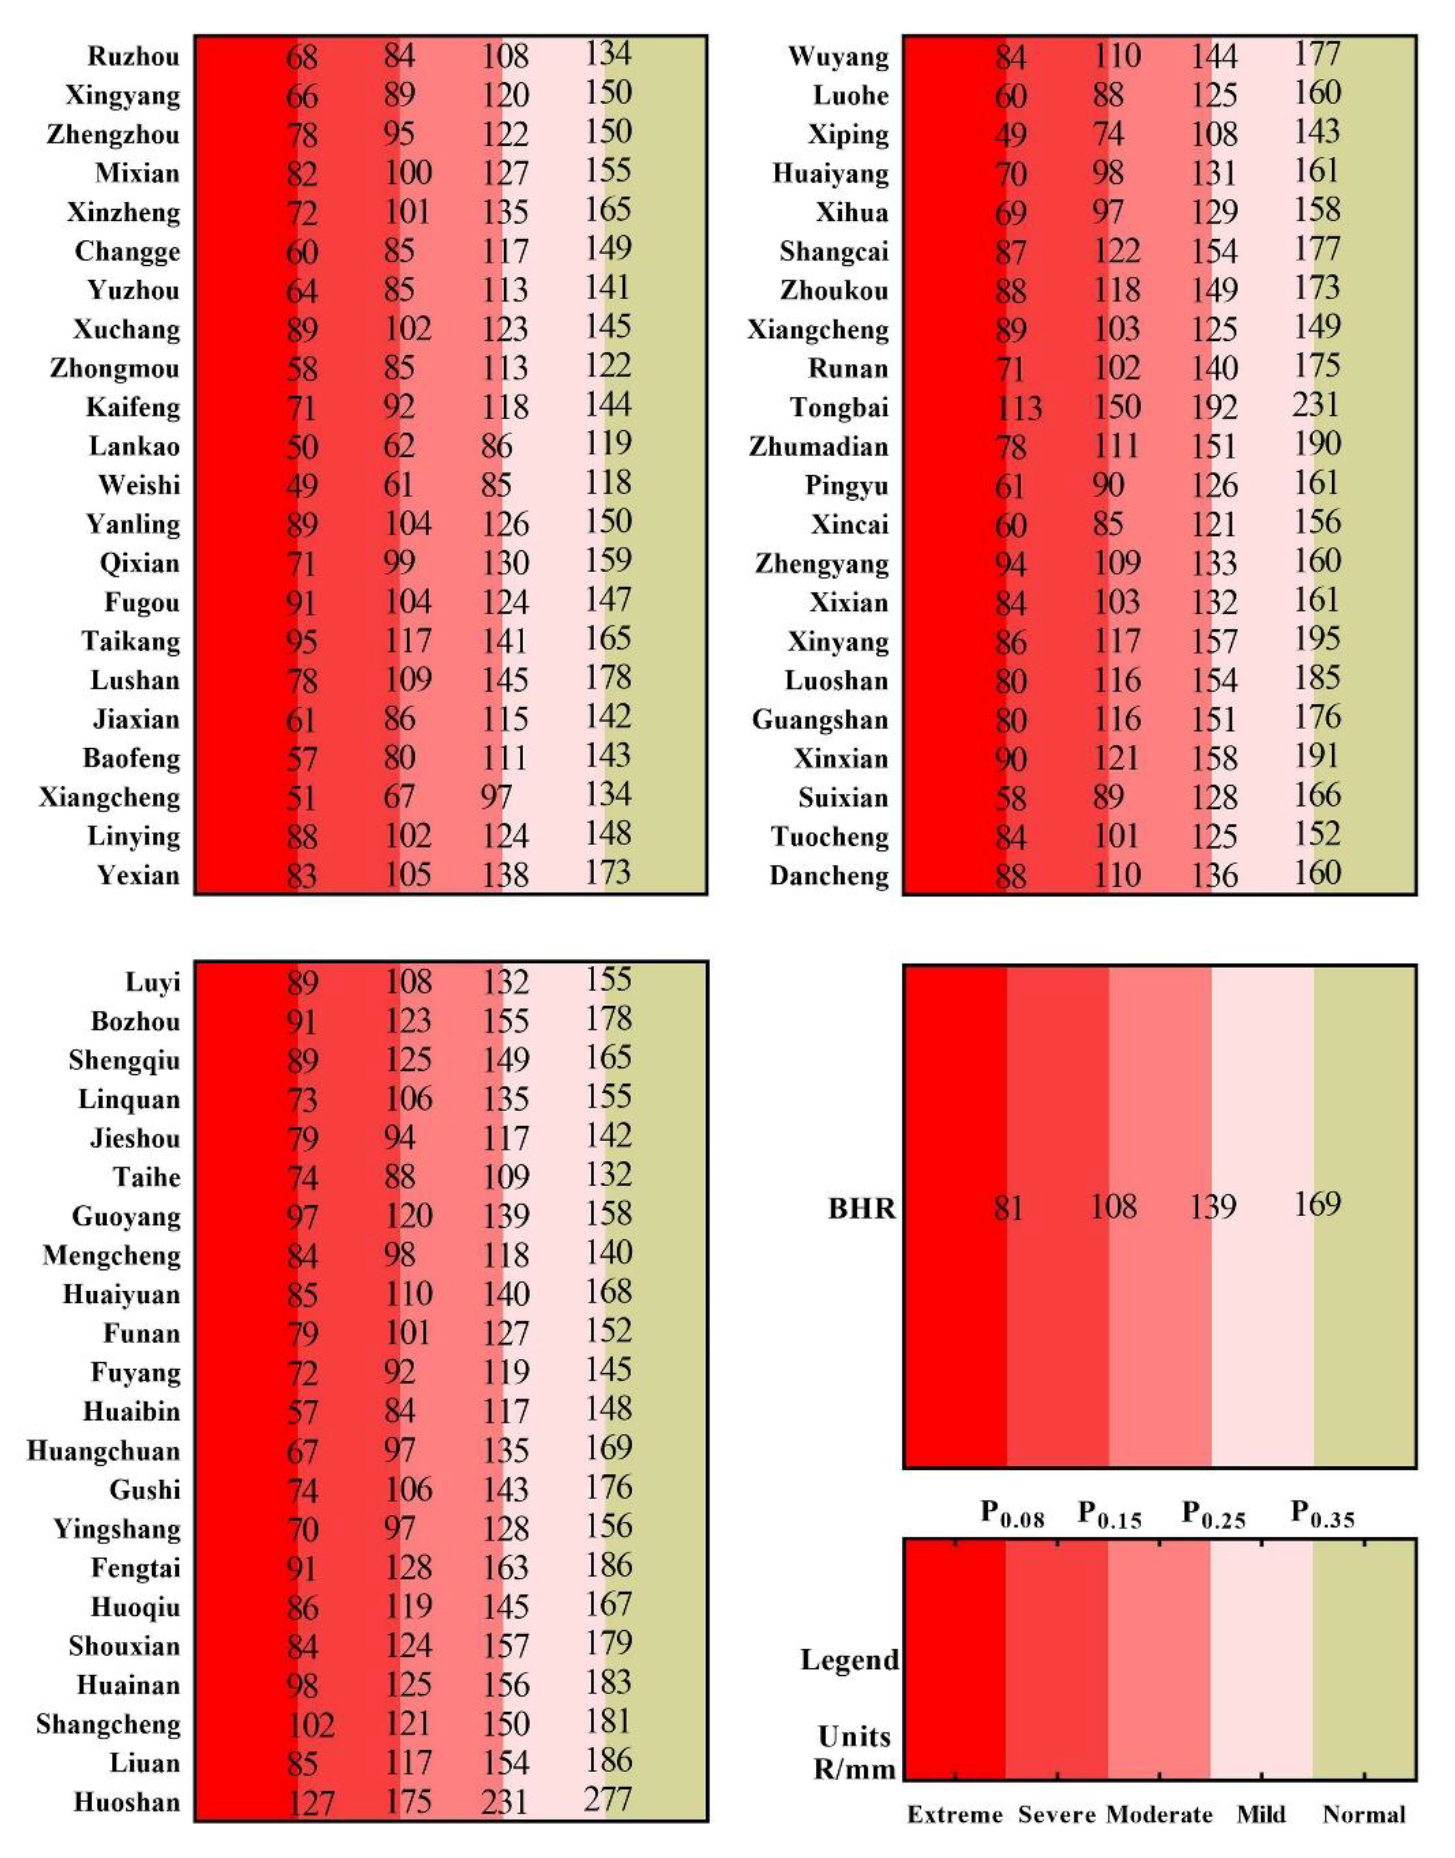
Based on the climatic characteristics of the semi-arid and semi-humid climate zone in the BHR, the arid conditions of the typical drought years (1973, 1981, 1985, 1989, 1994, and 1999) were analyzed and we determined the probability of precipitation P of the 0.08, 0.15, 0.25, and 0.35 quantile [9,34,49]. The quantitative design of the precipitation thresholds R of drought disaster in the BHR was divided into normal, mild, moderate, severe, and extreme drought, respectively. Referring to the literature [50,51] and the Chinese Meteorological Disaster, we determined the summer maize drought level. The different types of drought conditions in different growth stages are described in Table 4. The precipitation thresholds of drought at each site in the BHR were calculated using the Thiessen polygon method, as shown in Figure 5.
4.4.2. Spatial Distribution of Precipitation Thresholds of a Drought Disaster for Summer Maize
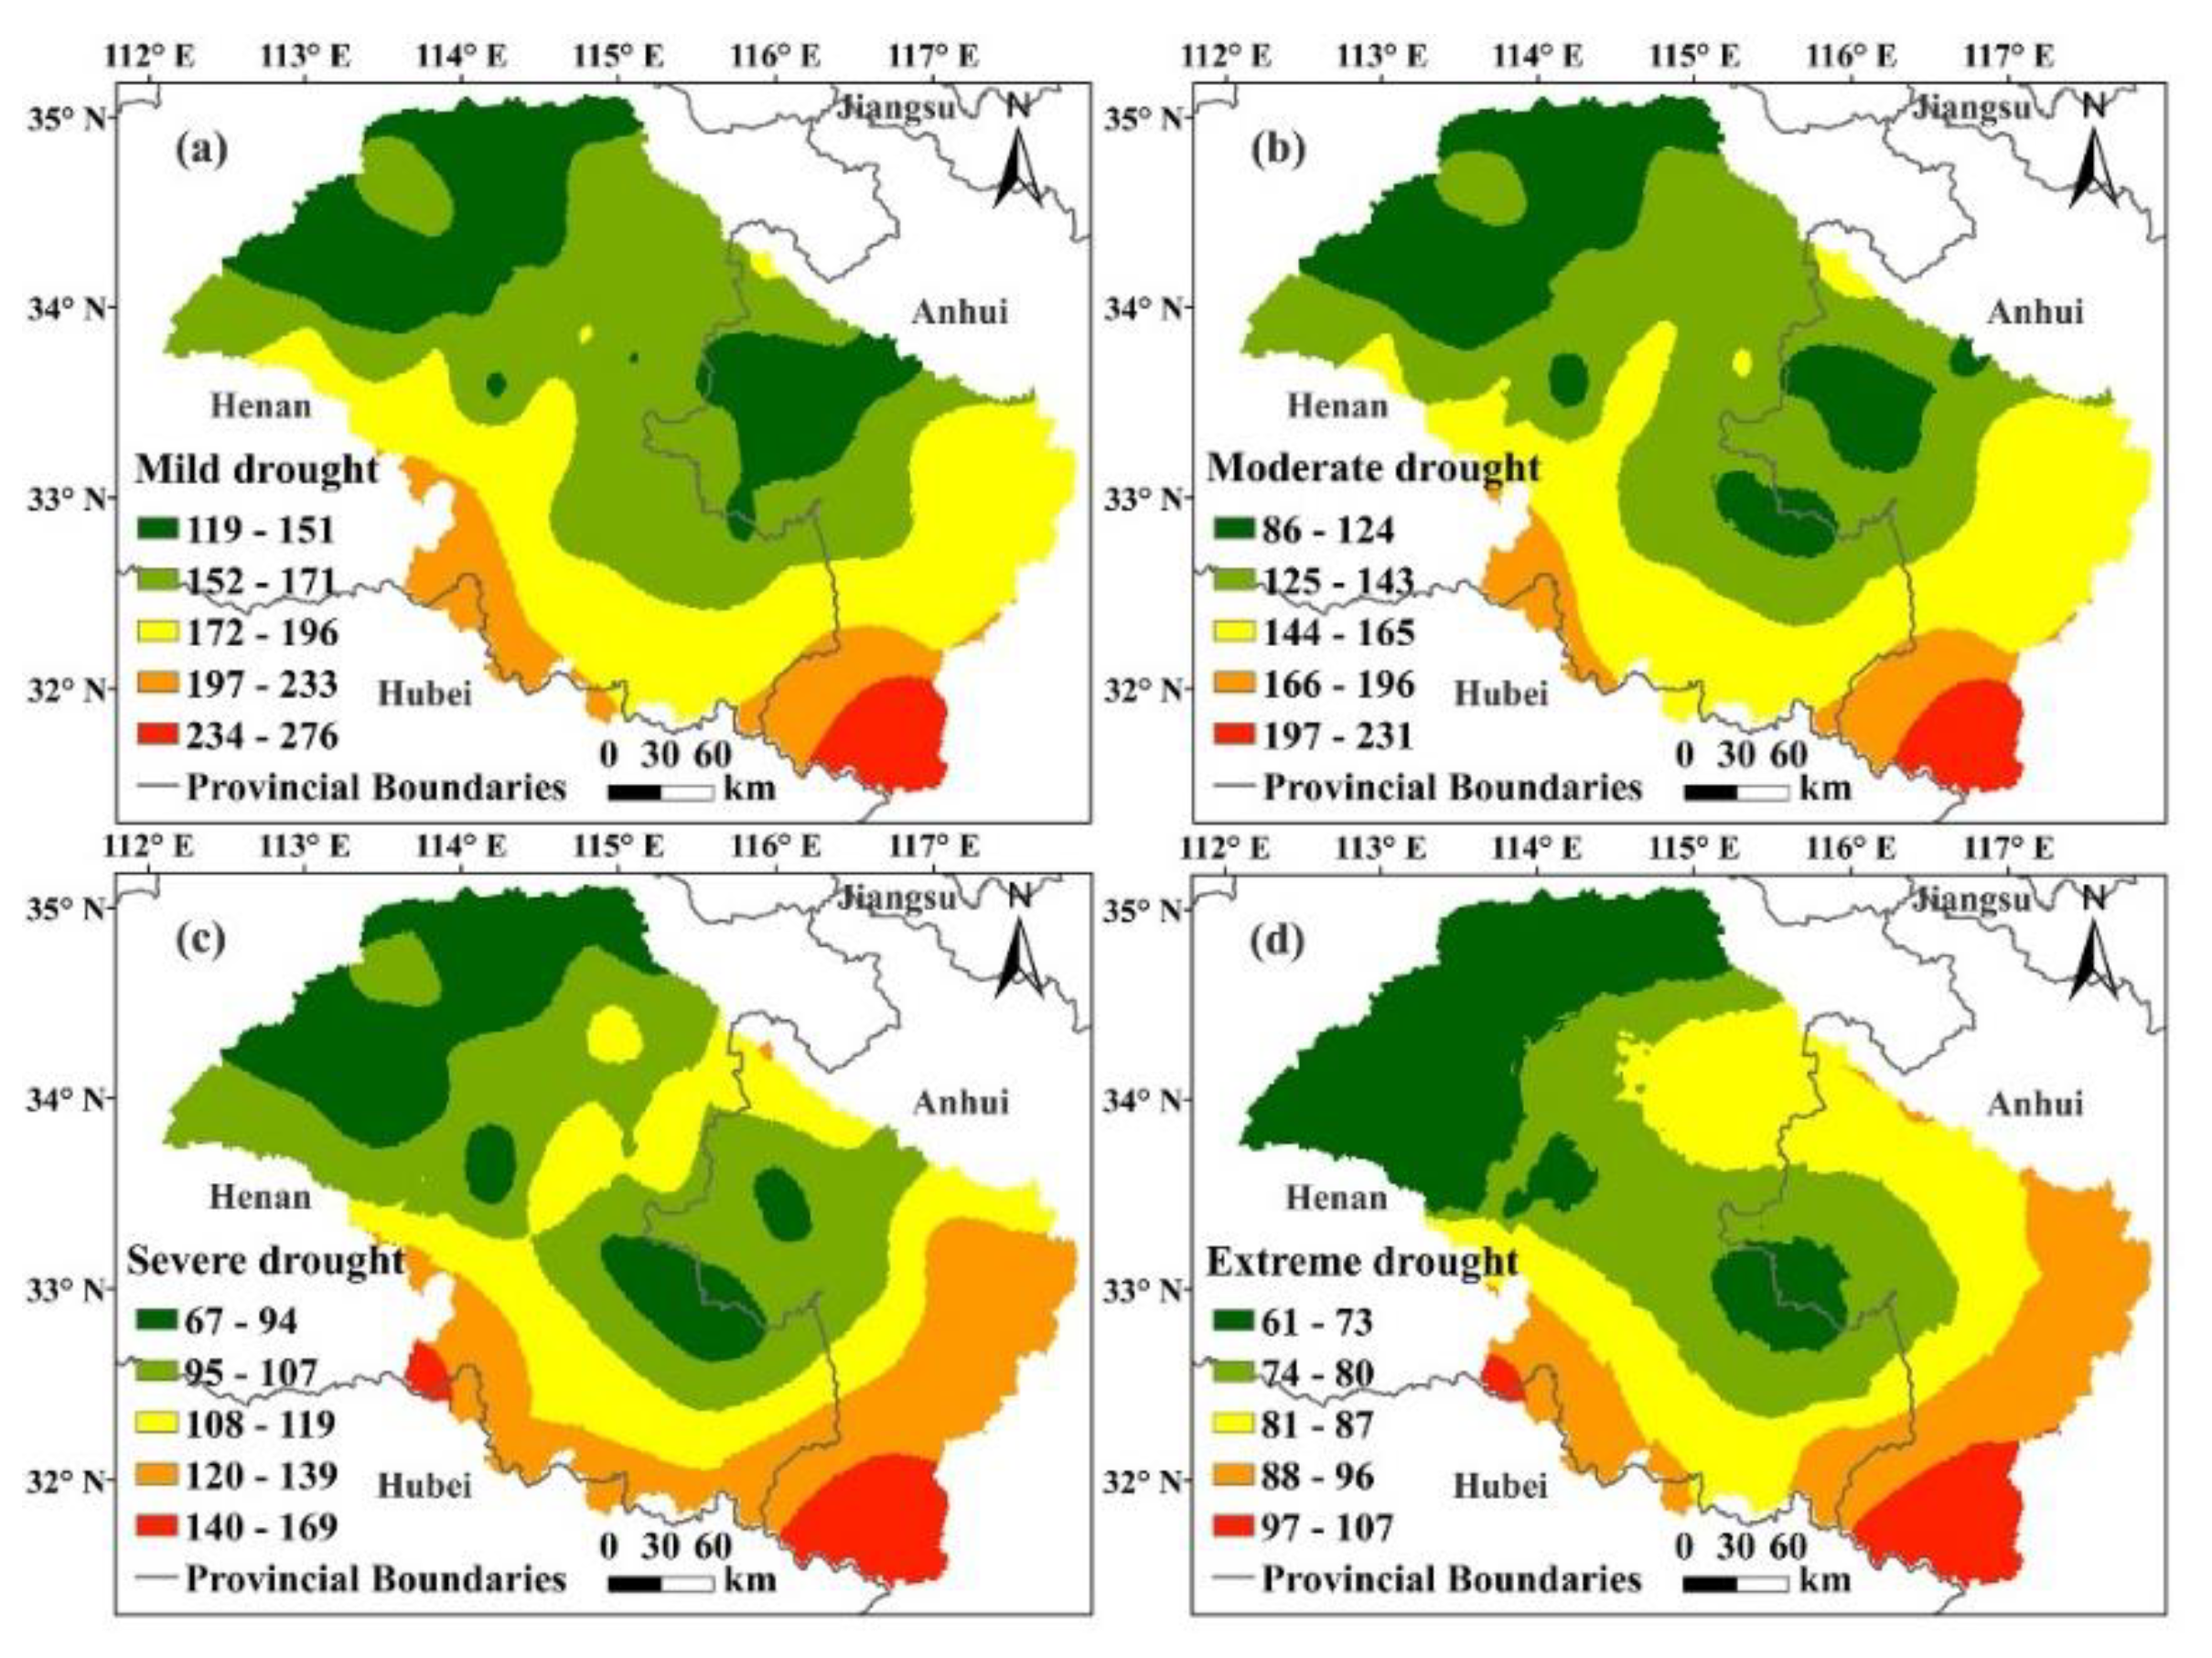
The spatial distribution of the precipitation thresholds of different levels of drought disaster in the critical water period during summer maize growth in the BHR was roughly the same. However, there were some differences in spatial distribution, as shown in Figure 6. It shows an increasing trend from the north to the south within the study area, and the highest thresholds were in Tongbai and Huoshan. There were regional differences in the precipitation thresholds in the study area. Terrain and soil texture may be the key influencing factors [52]. The terrain in the study area is complex and diverse, with different topography such as plains, hills, mountains, and basins, which cause regional variations in precipitation, resulting in agricultural drought with different frequencies and intensities. Over the whole region, elevation disparity and slope are obviously different. The area including Tongbai, Xinxian, and Huoshan to the southwest is mostly mountains, where the terrain has considerable elevational differences. Soil texture is sandy with large particles that drains easily, and the area has poor soil water storage capacity and low soil moisture. This type of soil texture is prone to agricultural drought [53]. The central area is a plain with small elevational differences. The soil texture is clay, capillary rich, and has a higher water retention capacity; thus, soil moisture content is relatively higher. Soil water storage capacity is also higher as compared to the mountainous areas [54,55].
4.5. Validation of Precipitation Thresholds of Drought Disaster for Summer Maize
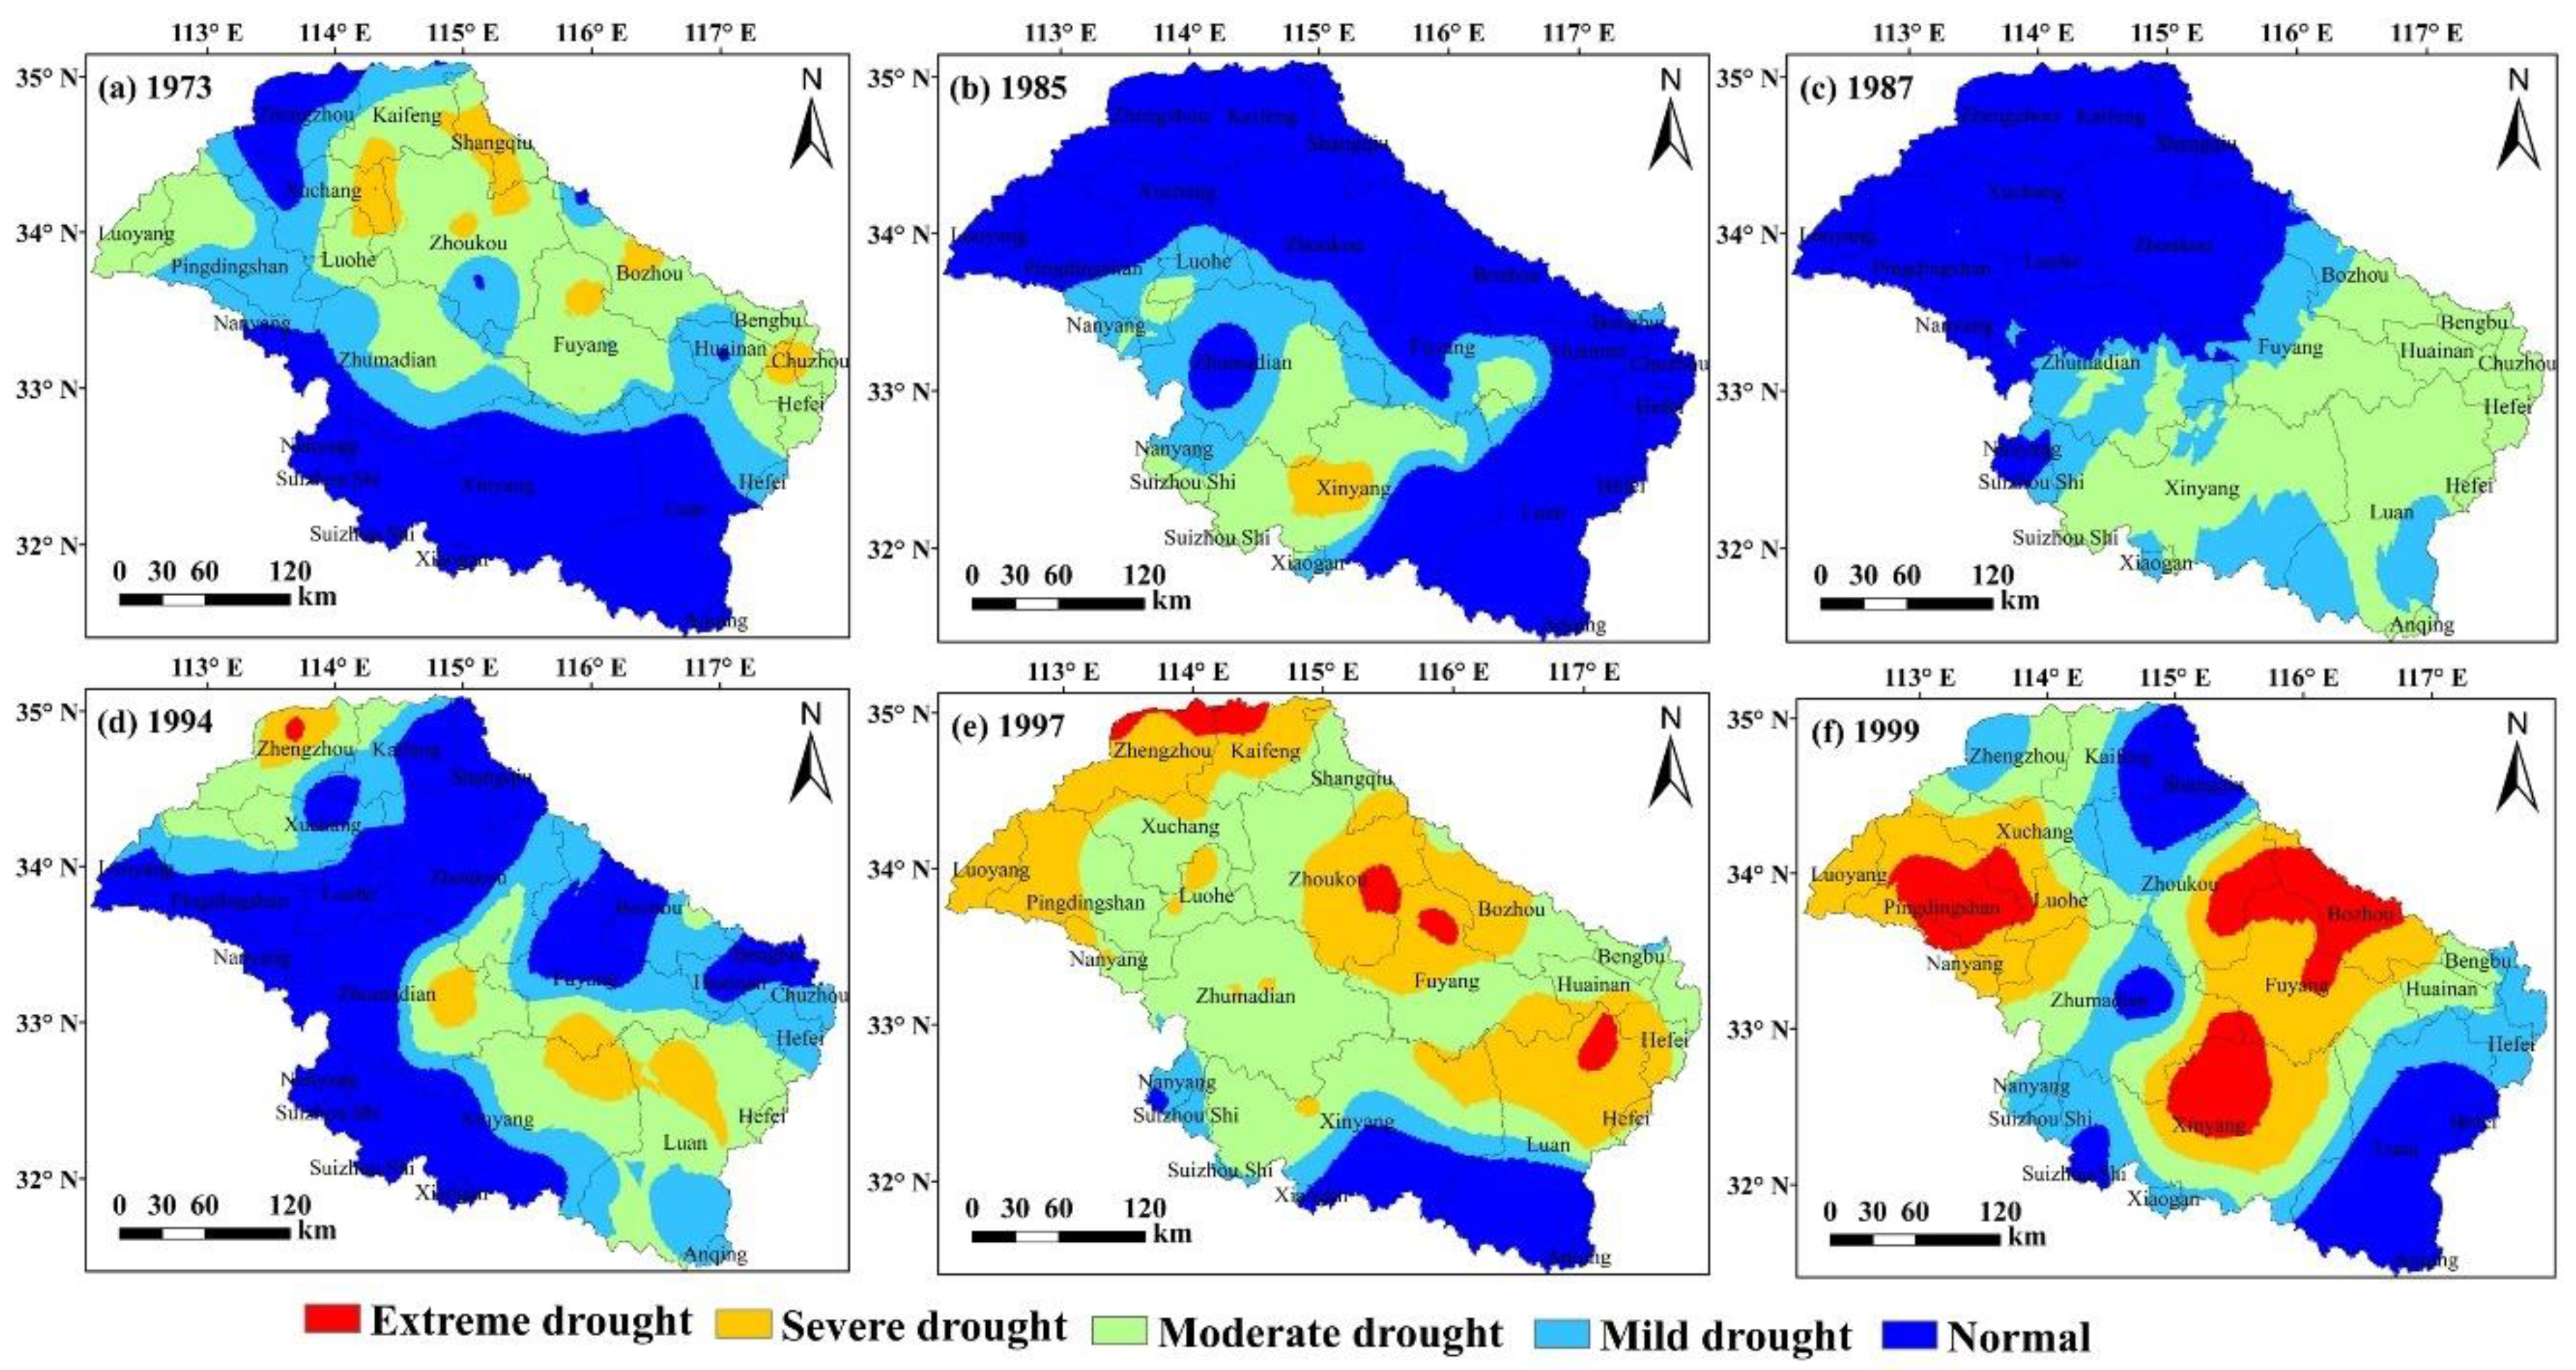
According to the disaster data, six typical drought years in the BHR were selected: 1973, 1985, 1987, 1994, 1997, and 1999. The drought grade was divided based on the precipitation thresholds of a drought disaster. The results are shown in Figure 7. In 1973, drought occurred in all areas except the south. Drought in the west and northwest areas was mild and in the central and east areas, it was moderate. Only a few sites in the central and east areas were subject to severe drought. In 1985, drought occurred in parts of the west and central areas, and part of the Xinyang and Zhumadian areas also suffered moderate drought, among which Luoshan and Guangshan were especially serious. North of Zhumadian, the drought was mild. In 1987, the drought in the research area differed from north to south. Drought only occurred in the south: the southernmost area was mild, and the rest of the area was moderate. In 1994, drought was common in the north, central, and east in the study area. Pingyu, Huaibin, and Huoqiu were hit seriously by drought. In 1997, all sites in the study area were subject to drought, except the south and Tongbai. The situation in the north and east was serious, and in the central area, it was severe. In 1999, most research areas were subject to drought. The northwest and central-east areas were seriously influenced and it was especially serious in Lushan, Luoshan, and Fuyang, among other places. According to the China Meteorological Disaster Ceremony and civil affairs statistics of these disasters and other disaster data, the spatial distribution of drought and drought degree, based on the thresholds of this study, were consistent with actual situation of the year. The actual disaster data are shown in Table A1.
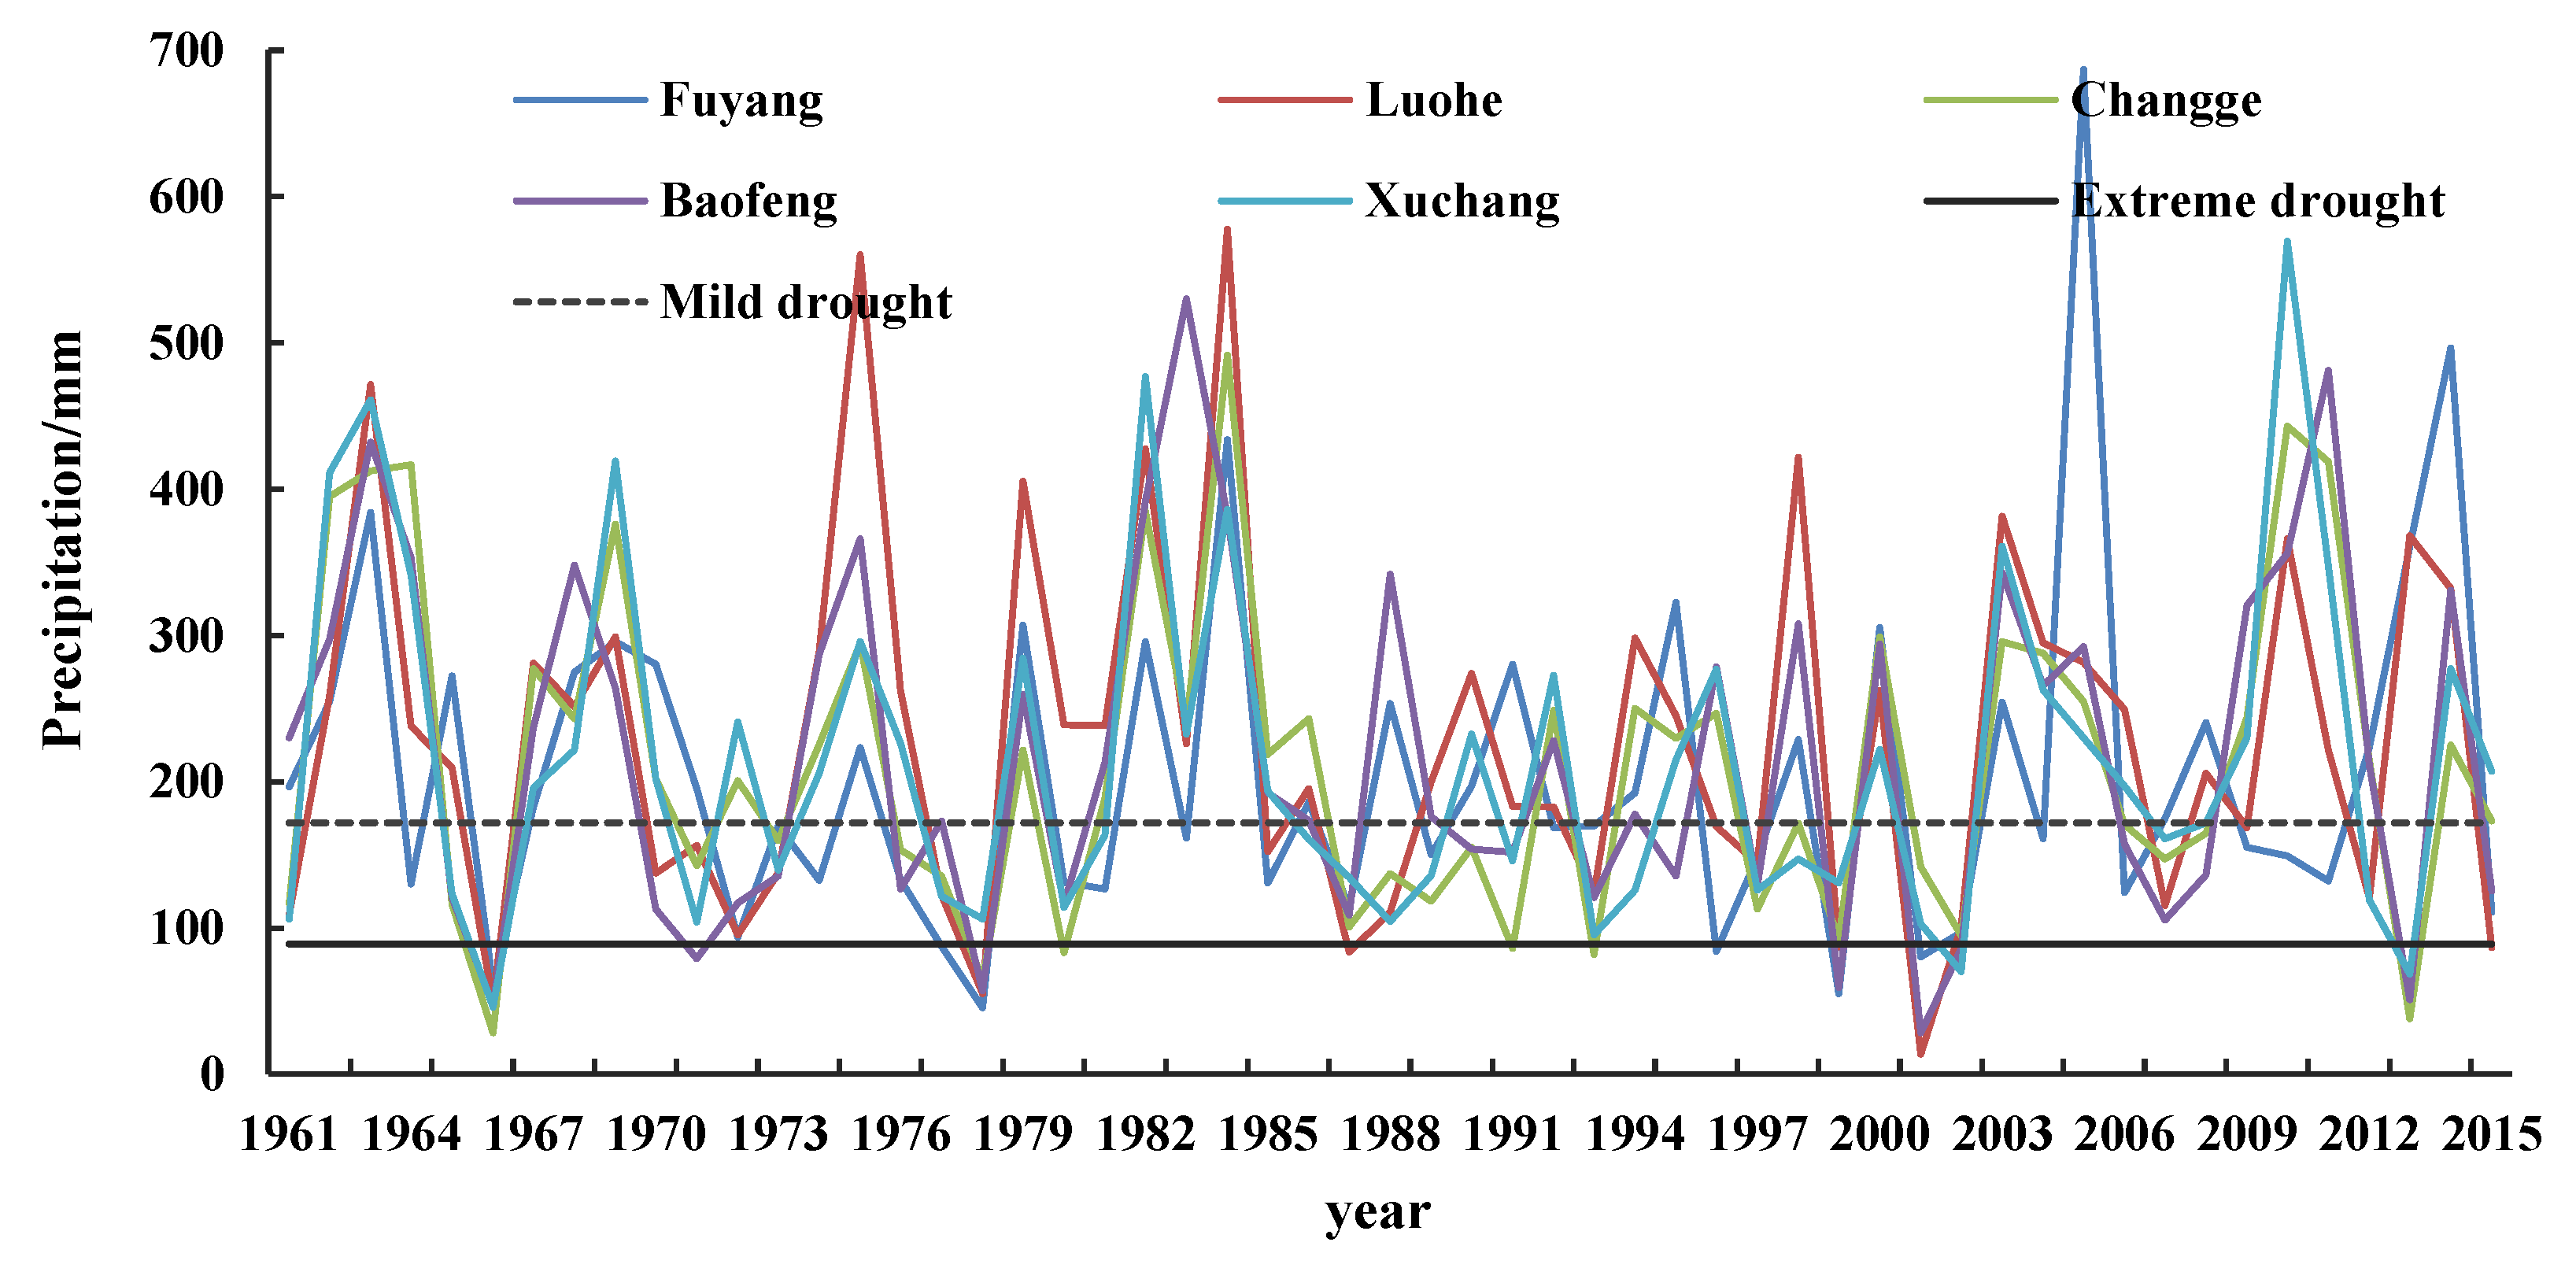
We selected Fuyang, Luohe, Xuchang, Changge, and Baofeng as representative stations to verify precipitation thresholds of drought disaster. As depicted in Figure 8, each station best indicated the year of serious drought that occurred during the tassel appearance-maturity period of summer maize: 1966, 1972, 1978, 1980, 1988, 1993, 1999, 2001, and 2013. As recorded in 1966, Yexian was seriously influenced by drought. Here, rivers dried up, half the maize died from dehydration, the autumn harvested crop output was seriously reduced, and people and livestock had problems obtaining drinking water. Baofeng also suffered, as there was a 70% reduction in autumn harvested crops, farming fields dried up, soil cracked, and it was difficult to sow wheat. In 1978, due to summer drought during the first few weeks in August, Changge county experienced a maize output reduction of a verified level, autumn drought, soil cracking, and a delay in wheat sowing time. Baofeng experienced summer drought in August, followed by an autumn drought in quick succession. In August 1996, the influence of drought in Fuyang was serious. Some farm crops rolled their leaves and withered, leading to 800,000 hectares of land being identified as a drought-stricken area. From 5 August to 10 September 1997, the rainfall in Luohe was only 2.6 mm. This led to a reduction in farm crop land of 55,000 with 150,000 tons of food being cut off. The economic loss caused by the drought was 252.5 million RenMinBi (RMB). Rainfall in Xuchang was only 0.3 mm from 3 August to 11 September, and approximately 253,000 people were affected, 21,300 hectares of farm crops were damaged, and 9200 hectares had no harvest. In 1999, Luohe experienced summer and autumn drought in quick succession that has rarely been seen in history. Soil moisture was only 9%, 146,000 people were affected, 9780 hectares of farmland were damaged, and 2030 hectares had no harvest. Above all, the time of occurrence and intensity of the drought at these five representative stations nearly match the actual facts in the disaster record.
5. Discussion
The precipitation thresholds determined in this paper can help to directly and quickly determine the different levels of summer maize drought based on cumulative precipitation, and the thresholds were proven to be accurate and effective. The method is simple and has certain promotional value in specific region. When the distribution function is used to fit the precipitation series, it is necessary to consider different types of probability distribution functions and test the methods in order to reduce errors and uncertainties coming from a single function simulation of a region with uneven rainfall distribution. Based on the critical period for water in summer maize growth, this study applied an optimal probability distribution model for typical sites and probability values of precipitation according to local climatic characteristics to obtain the precipitation thresholds of drought disaster. The study furthers the investigations of Li et al. [34], where only a single distribution function was considered to determine the indicators of drought. This study considered a more specifically affected entity, summer maize, compared to Gao et al. [13]. The scope is smaller, more targeted, and can be applied by meteorological services in the BHR.
Assessing the accuracy of drought is the key to the precipitation thresholds set in this paper, and it is also the biggest challenge of this paper. With regard to the improvement of the precipitation thresholds method identified in this paper, the Kolmogorov–Smirnov test and the Anderson-Darling test [56,57] can be used to determine the optimal distribution function, and compare the results obtained by the AICc and BIC tests. Based on the proposed precipitation threshold, this paper divides the summer maize drought grade. To evaluate the applicability of the precipitation drought thresholds, we selected typical years and sites for verification compared to some other studies [9,17,48]. The results showed that the actual drought situation and the actual disaster recorded in the disaster data were consistent with the occurrence, scope, and drought degree. Further verification of drought results can be based on summer maize yield data and drought-affected area data. The quantitative relationship between precipitation thresholds and yield of summer maize at all levels can be further established. Different degrees of drought conditions correspond to different summer maize yield reductions, thus verifying the accuracy of the precipitation thresholds. For the application of drought-affected areas, the precipitation thresholds can be used to divide the drought-affected area and then compare with the actual drought-affected area to verify the accuracy of the precipitation threshold.
At present, in the evaluation of summer maize drought in the Huaihe River Basin, the Crop Water Deficit Index (CWDI) is commonly used and has good applicability [58]. CWDI is based on the balance of water supply and demand, and consideration of the crop itself, soil, and meteorological factors. The cumulative effect of agricultural drought is also better reflected. CWDI can accurately reflect the drought status of summer maize during its growth period, but it requires many parameters, and the calculation is complicated, which decreases timeliness [10]. However, the summer maize disaster-causing precipitation thresholds based on precipitation can quickly and effectively assess drought. If the combined use of CWDI and the precipitation thresholds we set are used to assess summer maize drought, high and stable yields of summer maize can be guaranteed. The level of drought in different growth stages of summer maize can be assessed using CWDI; however, for the precipitation thresholds, we only set the precipitation thresholds during the critical period of summer maize growth, and we did not set thresholds for other growth periods. In order to better correspond the precipitation thresholds to CWDI, it is still necessary to further set the precipitation threshold of summer maize throughout the entire growth period.
The precipitation thresholds set in this paper is based on the summer maize in front of Bengbu Sluice in Huaihe River Basin, the method of judging drought in this paper has certain promotion value and can be applied in other regions. In addition, research can be carried out on crops such as winter wheat and rice, and cash crops such as sugar cane. The precipitation drought disaster thresholds for summer maize were calculated using mathematical methods, and only taking meteorological factors into consideration. Additionally, the thresholds of drought disasters for summer maize were related to crop water requirements, soil moisture, and other factors. Therefore, further study of the precipitation thresholds of maize would take these factors into consideration.
6. Conclusions
The precipitation during the tassel appearance-maturity period was determined to be the critical period affecting the final yield of summer maize in the BHR. The average precipitation over the years during the critical water period for summer maize growth at each site in the BHR showed that regional differences are small. From the viewpoint of spatial distribution, precipitation in the southern part is higher than in the northern part, and it is higher in mountainous areas than on the plains. However, the interannual variability in precipitation at each site is relatively large. The trend test results showed that the trend in precipitation is not obvious over the past 55 years, and shows fluctuations.
The results of the AICc and BIC showed that most of the 28 types of distribution from the four categories can fit the precipitation sequence during the critical water period for summer maize growth in the BHR. However, the precipitation at each site was different, and the optimal fitting function of the precipitation sequence at each site was also different. The optimal probability distribution function included 6 types of functions, and the optimal fitting model at 22 sites was the Beta function.
The spatial distribution of drought disaster thresholds at all levels was roughly the same, demonstrating an increasing trend from the northern to the southern regions. The drought thresholds of Tongbai in the west and Houshan in the south were the highest.
Author Contributions
Conceptualization, X.L.; Data curation, C.G.; Methodology, C.G. and X.L.; Resources, C.G.; Software, X.L.; Supervision, C.G.; Writing—original draft, C.G. and X.L.
Funding
This study has been financially supported by the National Natural Science Foundation of China (No. 41571018) and (No. 41871024).
Acknowledgments
The authors are grateful to the three reviewers who helped us to sustain high quality papers in the review process. The above financial support is gratefully acknowledged.
Conflicts of Interest
The authors declare no conflict of interest.
Appendix A

Table A1.
The actual disaster data of drought for typical years in the BHR.
| Year | Actual Disaster Data |
|---|---|
| 1973 | Henan province: About 1.1 million hectares of farmland were influenced, among which 733,300 hectares were seriously influenced in Shangqiu, Zhoukou, and Zhumadian during the first 10 days of August. Approximately 7300 hectares in three counties, Luyi, Dancheng, and Taikang, harvested no grain. Areas in Yongcheng, Tacheng, Minquan, Suixian, and Shangcaixian were seriously influenced by drought, whereas areas along the Huaihe River were slightly influenced. Anhui: In the beginning of August, most areas in Anhui Province had no rain, resulting in drought of different degrees in the whole province. |
| 1985 | Henan: There were no soaking rains in the south in August. The rainfall in Xinyang, the Nanyang Basin, and south of Zhumadian decreased by 60% to 75% from the average level over the past few years, leading to serious summer drought. Dwellers in partly hilly areas experienced difficulties in obtaining drinking water, which had to be transported to 780,000 dwellers and 400,000 draught animals from distant places under the most severe circumstances. The government invested 2100 million RMB to fight drought and natural disasters. |
| 1987 | Henan: About 18,500 dwellers and 3100 hectares of farm crops were hit by drought in Jiaxian, and 2700 hectares of farmland thus turned into a damage area. Approximately 1 million hectares of land were irrigated in the whole province and 3.04 million farmers worked daily. Anhui: It was continuously dry north of Huaibei after the summer drought was followed by autumn drought in quick succession, leading to a situation of high temperature and rapid evaporation. The drought increasingly spread in autumn to south of the Huaibei and Huaihe rivers. |
| 1994 | Henan: Drought developed rapidly due to low precipitation in Henan Province, and no rain fell in late September and early October, leading to high temperatures and more soil evaporation. Most areas were affected by different degrees of drought except Xinyang, in which drought was not obvious. Drought was especially serious north and west of Henan. Most of the soil at 30 cm in Henan contained 10% or less moisture. Anhui: Most parts of the province were hit by drought from September to November. Dry soil layers in Hefei, Huoqiu, and other areas occurred at 7–8 cm, which exerted negative impacts on sowing in autumn. In Linquan, about 1.12 million dwellers were victims of the disaster, with 94,333 hectares turning to damaged land and 8000 hectares having no harvest. |
| 1997 | Henan: The precipitation was nearly zero in the whole province from August 5 and the drought in 65 counties worsened sharply. About 3,084,000 hectares of autumn harvested crops were hit by drought, with 1,618,000 hectares seriously affected and 521,300 hectares of crops failing by the end of August. Rainfall in Luohe was only 2.6 mm over 37 days, leading to reduction in output of 55,000 hectares, and the economic loss triggered by drought was 25.25 million RMB. Anhui: The whole province experienced autumn drought from September to November. 70 counties turned to main drought areas from west of the Huaihe River to east of the Yangtze River. About 2,267,000 hectares of the main output area of summer harvested crops was seriously affected by drought. |
| 1999 | Henan: From 8 July to 3 September, Luohe was hit by summer drought and continuous autumn drought that has rarely been recorded in history. Soil moisture content was only 9%. The soil water shortage and farmland drought were serious; over 146,000 dwellers were affected, 9780 hectares of farmland became damaged, and 2030 hectares failed. Anhui: North of Hefei was hit by summer and autumn drought from June to September. Rainfall in the north was continuously low, leading to a sharply developed drought and rice land cracking from June to September. By 18 August, 1,333,000 hectares of farmland had been damaged, leading to 800,000 hectares of farmland becoming a disaster area. Some 380,000 dwellers had difficulties in obtaining drinking water and the direct economic loss was 2.9 billion RMB. |
References
- Guan, Y.H.; Zheng, F.L.; Zhang, P.; Qin, C. Spatial and temporal changes of meteorological disasters in China during 1950–2013. Nat. Hazards 2015, 75, 2607–2623. [Google Scholar] [CrossRef]
- Esfahanian, E.; Nejadhashemi, A.P.; Abouali, M.; Adhikari, U.; Zhang, Z.; Daneshvar, F.; Herman, M.R. Development and evaluation of a comprehensive drought index. J. Environ. Manag. 2017, 185, 31–43. [Google Scholar] [CrossRef] [PubMed]
- Wang, R.N.; Peng, W.Q.; Liu, X.B.; Wu, W.Q.; Chen, X.K.; Zhang, S.J. Responses of Water Level in China’s Largest Freshwater Lake to the Meteorological Drought Index (SPEI) in the Past Five Decades. Water 2018, 10, 137. [Google Scholar] [CrossRef]
- Leng, G.Y.; Tang, Q.H.; Rayburg, S. Climate change impacts on meteorological, agricultural and hydrological droughts in China. Glob. Planet. Chang. 2015, 126, 23–34. [Google Scholar] [CrossRef] [Green Version]
- Li, F.P.; Wang, Z.T.; Chao, N.F.; Song, Q.Y. Assessing the Influence of the Three Gorges Dam on Hydrological Drought Using GRACE Data. Water 2018, 10, 669. [Google Scholar] [CrossRef]
- Botai, C.M.; Botai, J.O.; de Wit, J.P.; Ncongwane, K.P.; Adeola, A.M. Drought Characteristics over the Western Cape Province, South Africa. Water 2017, 9, 876. [Google Scholar] [CrossRef]
- Zheng, P.N.; Li, Z.Q.; Bai, Z.P.; Wan, L.; Li, X.T. Influence of climate change to drought and flood. Disaster Adv. 2012, 5, 1331–1334. [Google Scholar]
- Du, X.D.; Jin, X.B.; Yang, X.L.; Yang, X.H.; Xiang, X.M.; Zhou, Y.K. Spatial-temporal pattern changes of main agriculture natural disasters in China during 1990–2011. J. Geogr. Sci. 2015, 25, 387–398. [Google Scholar] [CrossRef]
- Hao, Z.C.; Singh, V.P. Drought characterization from a multivariate perspective: A review. J. Hydrol. 2015, 527, 668–678. [Google Scholar] [CrossRef]
- Liu, X.F.; Zhu, X.F.; Pan, Y.Z.; Li, S.S.; Liu, Y.X.; Ma, Y.Q. Agricultural drought monitoring: Progress, challenges, and prospects. J. Geogr. Sci. 2016, 26, 750–767. [Google Scholar] [CrossRef]
- Zhou, L.; Xu, J.G.; Cai, B.M.; Jiang, J.L.; Sun, D.Q. The spatio-temporal changes of grain production and fertilizer consumption and its impact on water environment in the Huaihe River basin. J. Nat. Resour. 2015, 29, 1053–1064. (In Chinese) [Google Scholar]
- Zhang, J.J.; Wang, X.D. Spatial-temporal analysis of the water surplus deficit index for the summer corn’s key period in the Huaihe basin. Chin. Agric. Sci. B 2014, 30, 100–105. (In Chinese) [Google Scholar]
- Gao, C.; Zhang, Z.T.; Zhai, J.Q.; Yao, M.T. Research on meteorological thresholds of drought and flood disaster: A case study in the Huai River basin, China. Stoch. Environ. Res. Risk A 2015, 29, 157–167. [Google Scholar] [CrossRef]
- Mcquigg, J. A simple index of drought conditions. Weatherwise 1954, 7, 64–67. [Google Scholar] [CrossRef]
- Seiler, R.A.; Hayes, M.; Bressan, L. Using the standardized precipitation index for flood risk monitoring. Int. J. Climatol. 2002, 22, 1365–1376. [Google Scholar] [CrossRef] [Green Version]
- Livada, I.; Assimakopoulos, V.D. Spatial and temporal analysis of drought in Greece using the Standardized Precipitation Index (SPI). Theor. Appl. Climatol. 2007, 89, 143–153. [Google Scholar] [CrossRef]
- Labudová, L.; Labuda, M.; Takáč, J. Comparison of SPI and SPEI applicability for drought impact assessment on crop production in the Danubian Lowland and the East Slovakian Lowland. Theor. Appl. Climatol. 2016, 128, 491–506. [Google Scholar] [CrossRef]
- Shi, B.L.; Zhu, X.Y.; Hu, Y.C.; Yang, Y.Y. Drought characteristics of Henan province in 1961-2013 based on Standardized Precipitation Evapotranspiration Index. J. Geogr. Sci. 2017, 27, 311–325. [Google Scholar] [CrossRef]
- Shastri, H.; Ghosh, S.; Karmakar, S. Improving Global Forecast System of extreme precipitation events with regional statistical model: Application of quantile based probabilistic forecasts. J. Geophys. Res. Atmos. 2017, 122, 1617–1634. [Google Scholar] [CrossRef]
- Testi, L.; Goldhamer, D.A.; Iniesta, F.; Salinas, M. Crop water stress index is a sensitive water stress indicator in pistachio trees. Irrig. Sci. 2008, 26, 395–405. [Google Scholar] [CrossRef] [Green Version]
- Ganji, A.; Kaviani, S. Probability analysis of crop water stress index: An application of double bounded density function (DB-CDF). Water Resour. Manag. 2013, 27, 3791–3802. [Google Scholar] [CrossRef]
- Ghioca, M. Drought monitoring using self-calibrating Palmer’s indices in the Southwest of Romania. Rom. Rep. Phys. 2009, 61, 151–164. [Google Scholar]
- Edossa, D.C.; Woyessa, Y.E.; Welderufael, W.A. Spatiotemporal analysis of droughts using self-calibrating Palmer’s drought severity index in the central region of South Africa. Theor. Appl. Climatol. 2016, 126, 643–657. [Google Scholar] [CrossRef]
- Wery, J. Differential effects of soil water deficit on the basic plant functions and their significance to analyse crop responses to water deficit in indeterminate plants. Aust. J. Agric. Res. 2005, 56, 1201–1209. [Google Scholar] [CrossRef]
- Li, Q.S.; Willardson, L.S.; Deng, W.; Li, X.J.; Liu, C.J. Crop water deficit estimation and irrigation scheduling in western Jilin province, Northeast China. Agric. Water Manag. 2005, 71, 47–60. [Google Scholar] [CrossRef]
- Yang, X.J.; Liu, Y.; Bai, W.; Liu, B.C. Spatiotemporal Assessment of Drought Related to Soybean Production and Sensitivity Analysis in Northeast China. J. Appl. Meteorol. Clim. 2017, 56, 937–952. [Google Scholar] [CrossRef]
- Sterin, A.M.; Timofeev, A.A. Estimation of surface air temperature trends over the Russian Federation territory using the quantile regression method. Russ. Meteorol. Hydrol. 2016, 41, 388–397. [Google Scholar] [CrossRef]
- Cheng, Z.; Xu, M.; Luo, L.S.; Ding, X.J. Climate characteristics of drought-flood abrupt change events in Huaihe River basin. J. China Hydrol. 2012, 32, 73–79. (In Chinese) [Google Scholar]
- Yang, M.; Chen, X.; Cheng, C.S. Hydrological impacts of precipitation extremes in the Huaihe River basin, China. Springerplus 2016, 5, 1731. [Google Scholar] [CrossRef] [PubMed]
- Cheng, S.M.; Yan, D.H.; Yang, Z.Y.; Zhang, Z.B.; Yang, M.J.; Kan, G.Y. Characteristics analysis of summer maize yield loss caused by drought stress in the northern Huaihe Plain, China. Irrig. Drain. 2018, 67, 251–268. [Google Scholar] [CrossRef]
- Liu, X.F.; Zhu, X.F.; Pan, Y.Z.; Bai, J.J.; Li, S.S. Performance of different drought indices for agriculture drought in the North China Plain. J. Arid Land 2018, 10, 507–516. [Google Scholar] [CrossRef]
- Zhang, S.A.; Wang, A.P.; Yang, G.L.; Yang, J.Q. Thought and research on progress of drought severity monitoring and assessment. J. China Hydrol. 2010, 30, 15–31. (In Chinese) [Google Scholar]
- Mooley, D.A. Gamma Distribution probability model for Asian summer monsoon monthly rainfall. Mon. Weather Rev. 1973, 101, 160–176. [Google Scholar] [CrossRef]
- Li, D.; Qi, H.; Ma, X.Q. The climate index and assessment about drought and flood in maize’s key growth stage in Huaibei Plain in Anhui Province. Chin. Agric. Sci. Bull. 2013, 29, 208–216. (In Chinese) [Google Scholar]
- Feng, J.; Zhai, M.; Liu, Q.; Sun, J.; Guo, J. Residues of organochlorine pesticides (OCPs) in upper reach of the Huaihe River, East China. Ecotoxicol. Environ. Saf. 2011, 74, 2252–2259. [Google Scholar] [CrossRef] [PubMed]
- The China Meteorological Administration National Climate Center. Data service. Available online: http://cmdp.ncc-cma.net/cn/download.htm (accessed on 3 January 2018).
- Ministry of Agriculture and Rural Affairs of the People’s Republic of China. Crop Database. Available online: http://zzys.agri.gov.cn/nongqing.aspx (accessed on 7 February 2018).
- The Chinese Agricultural Data Network. Data Manual. Available online: http://www.agdata.cn/ dataManual/dataIndustryTree.html (accessed on 10 February 2018).
- Zhang, T.; Yang, X.; Wang, H.; Li, Y.; Ye, Q. Climatic and technological ceilings for Chinese rice stagnation based on yield gaps and yield trend pattern analysis. Glob. Chang. Biol. 2014, 20, 1289–1298. [Google Scholar] [CrossRef] [PubMed]
- Allen, R.G.; Smith, M.; Wright, J.L.; Raes, D.; Pereira, L.S. FAO-56 dual crop coefficient method for estimating evaporation from soil and application extensions. J. Irrig. Drain. E 2005, 131, 2–13. [Google Scholar] [CrossRef]
- Peng, S.Z.; Suo, L.S. Water requirement model for crop under the condition of water-saving irrigation. J. Hydraul. Eng. 2004, 35, 0017–0021. (In Chinese) [Google Scholar] [CrossRef]
- Akaike, H. A new look at the statistical model identification. IEEE Trans Autom. Control 1974, 19, 716–723. [Google Scholar] [CrossRef]
- Hurvich, C.M.; Tsai, C.L. Model selection for extended quasi-likelihood models in small samples. Biometrics 1995, 51, 1077–1084. [Google Scholar] [CrossRef] [PubMed]
- Burnham, K.P.; Anderson, D.R. Multimodel inference: Understanding AIC and BIC in Model Selection. Sociol. Methods Res. 2004, 33, 261–304. [Google Scholar] [CrossRef]
- Goovaerts, P. Geostatistical approaches for incorporating elevation into the spatial interpolation of rainfall. J. Hydrol. 2000, 228, 113–129. [Google Scholar] [CrossRef] [Green Version]
- Zhou, H.; Liu, Y.B. SPI based meteorological drought assessment over a humid basin: Effects of processing schemes. Water 2016, 8, 373. [Google Scholar] [CrossRef]
- Zhou, Z.F.; Zhang, S.Y.; Xiong, K.N.; Li, B.; Tian, Z.H.; Chen, Q.; Yan, L.H.; Xiao, S.Z. The spatial distribution and factors affecting karst cave development in Guizhou Province. J. Geogr. Sci. 2017, 27, 1011–1024. [Google Scholar] [CrossRef]
- Kisi, O.; Ay, M. Comparison of Mann–Kendall and innovative trend method for water quality parameters of the Kizilirmak River, Turkey. J. Hydrol. 2014, 513, 362–375. [Google Scholar] [CrossRef]
- Ropelewski, C.F.; Janowiak, J.E.; Halpert, M.S. The analysis and display of real time surface climate data. Mon. Weather Rev. 1985, 113, 1101–1106. [Google Scholar] [CrossRef]
- Zhang, Y.F.; Wang, R.T.; Chen, D.D.; Zhou, Y.; Wang, M.T.; Li, J.J. Evaluation on drought at maize growth stage in Sichuan basin based on water budget index. Chin. J. Agrometeorol. 2011, 32, 615–620. (In Chinese) [Google Scholar] [CrossRef]
- China Meteorological Administration (CMA). Drought Grade of Summer Maize in Northern China; CMA: Beijing, China, 2015. (In Chinese) [Google Scholar]
- Du, Y.; Jiang, S.M.; Jin, J.L.; Li, J.Q.; Liu, L.; Zhou, Y.L. Agricultural drought disaster risk assessment for Huaihe River basin. Water Res. Power 2013, 31, 1–4. (In Chinese) [Google Scholar]
- Bolten, J.D.; Crow, W.T.; Zhan, X.; Jackson, T.J.; Reynolds, C.A. Evaluating the utility of remotely sensed soil moisture retrievals for operational agricultural drought monitoring. IEEE J. STARS 2010, 3, 57–66. [Google Scholar] [CrossRef]
- Liu, R.J.; Zhang, W.C.; Pei, H.Q. Relationships between Soil Erosion and Its Influencing Factors of the Huaihe River Basin. Soil Water Conserv. China 2010, 5, 29–32. (In Chinese) [Google Scholar] [CrossRef]
- Hu, X.L.; Jiang, X.S.; Pan, J.J.; Yang, S.J.; Zhang, C.P. GIS-Based spatial analysis and evaluation of soil erosion in the Huaihe River Basin. Soils 2007, 39, 404–407. (In Chinese) [Google Scholar]
- Buda, S.; Tong, J.; Wenjie, D. Probabilistic characteristics of precipitation extremes over the Yangtze River Basin. J. Meteorol. Sci. 2008, 28, 625–629. (In Chinese) [Google Scholar]
- Guenang, G.M.; Kamga, F.M. Computation of the standardized precipitation index (SPI) and its use to assess drought occurrences in Cameroon over recent decades. J. Appl. Meteorol. Climatol 2014, 53, 2310–2324. [Google Scholar] [CrossRef]
- Xue, C.Y.; Liu, R.H.; Ma, Z.H. Drought grade classification of summer maize in Huang-Huai-Hai area. Trans. Chin. Soc. Agric. Eng. 2014, 30, 147–156. (In Chinese) [Google Scholar]
Figure 1.
Digital elevation map (DEM), meteorological stations, and river in study area.
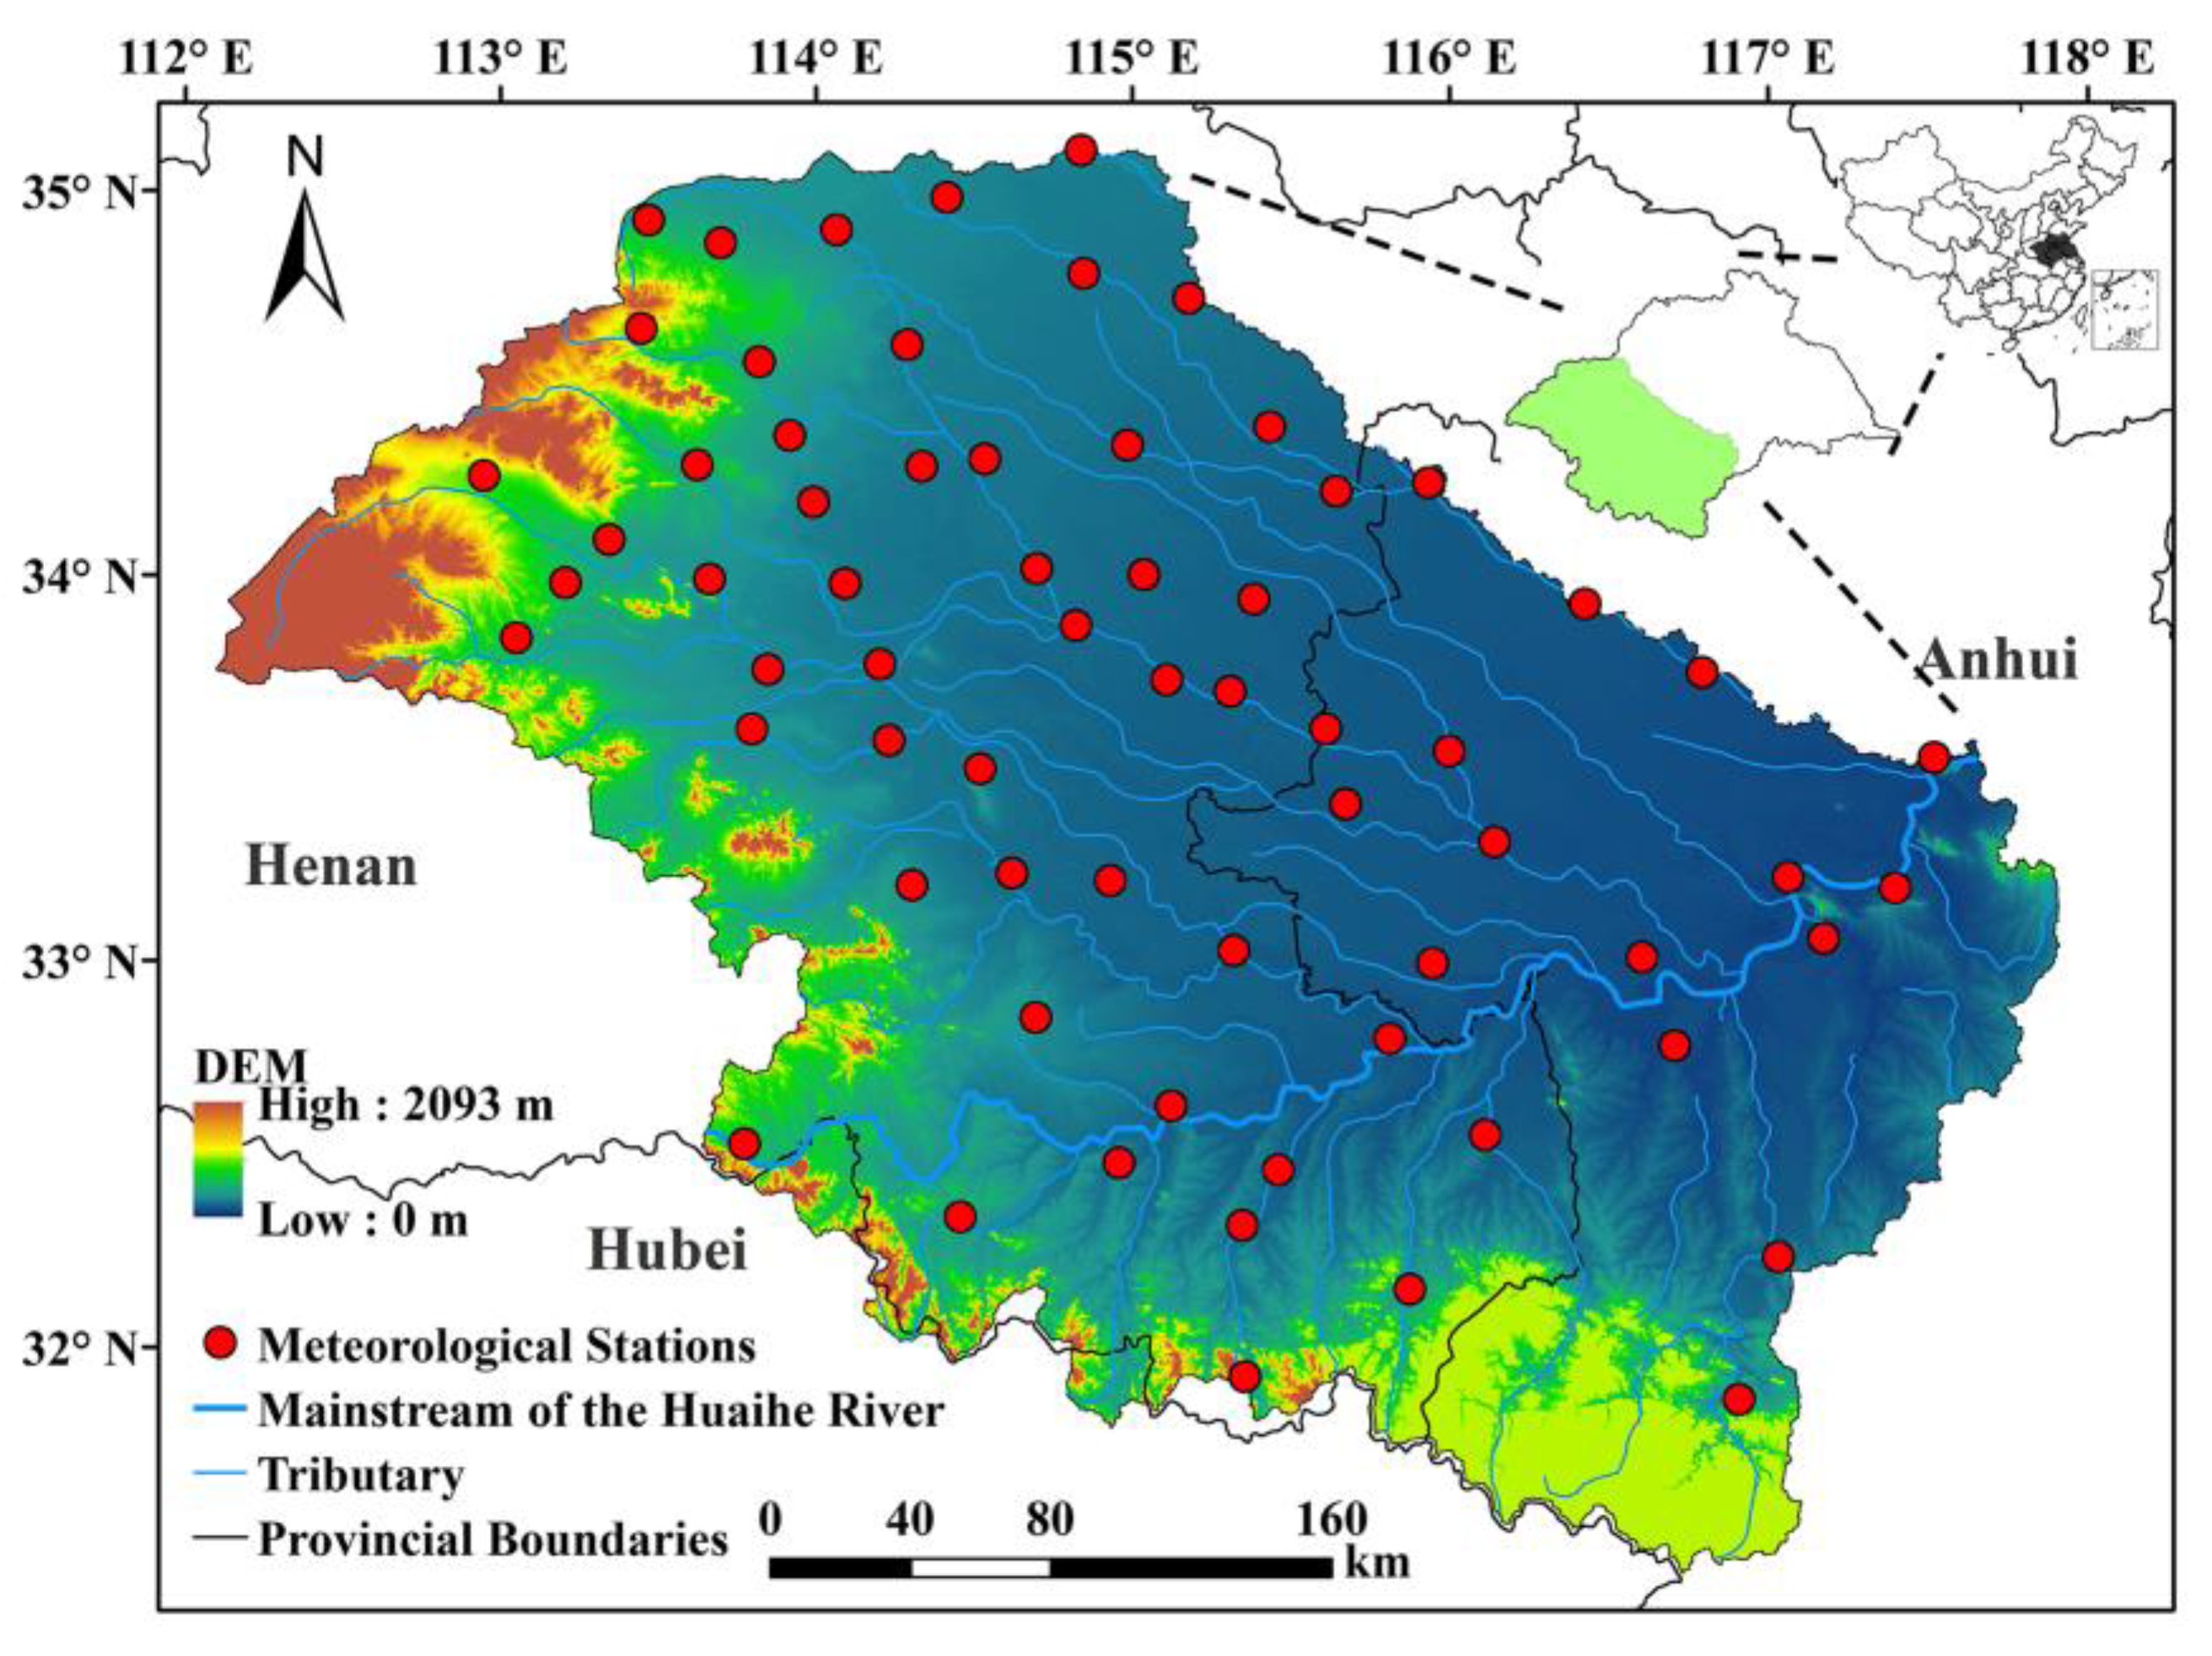
Figure 2.
The correlation between climatic yield and water deficit index during the growth period of summer maize at typical sites.
Figure 2.
The correlation between climatic yield and water deficit index during the growth period of summer maize at typical sites.

Figure 3.
Spatial distribution of annual average precipitation and trend determined using the Mann-Kendall (MK) test during the critical water period for summer maize growth. Note: ![Water 10 01395 i001]() ,
, ![Water 10 01395 i002]() denotes precipitation is on the rise or decline, respectively.
denotes precipitation is on the rise or decline, respectively.
 ,
,  denotes precipitation is on the rise or decline, respectively.
Figure 3.
Spatial distribution of annual average precipitation and trend determined using the Mann-Kendall (MK) test during the critical water period for summer maize growth. Note: ![Water 10 01395 i001]() ,
, ![Water 10 01395 i002]() denotes precipitation is on the rise or decline, respectively.
denotes precipitation is on the rise or decline, respectively.
, denotes precipitation is on the rise or decline, respectively.
Figure 4.
Statistics of the probability distribution function of precipitation sequence of summer maize at 66 sites.
Figure 4.
Statistics of the probability distribution function of precipitation sequence of summer maize at 66 sites.
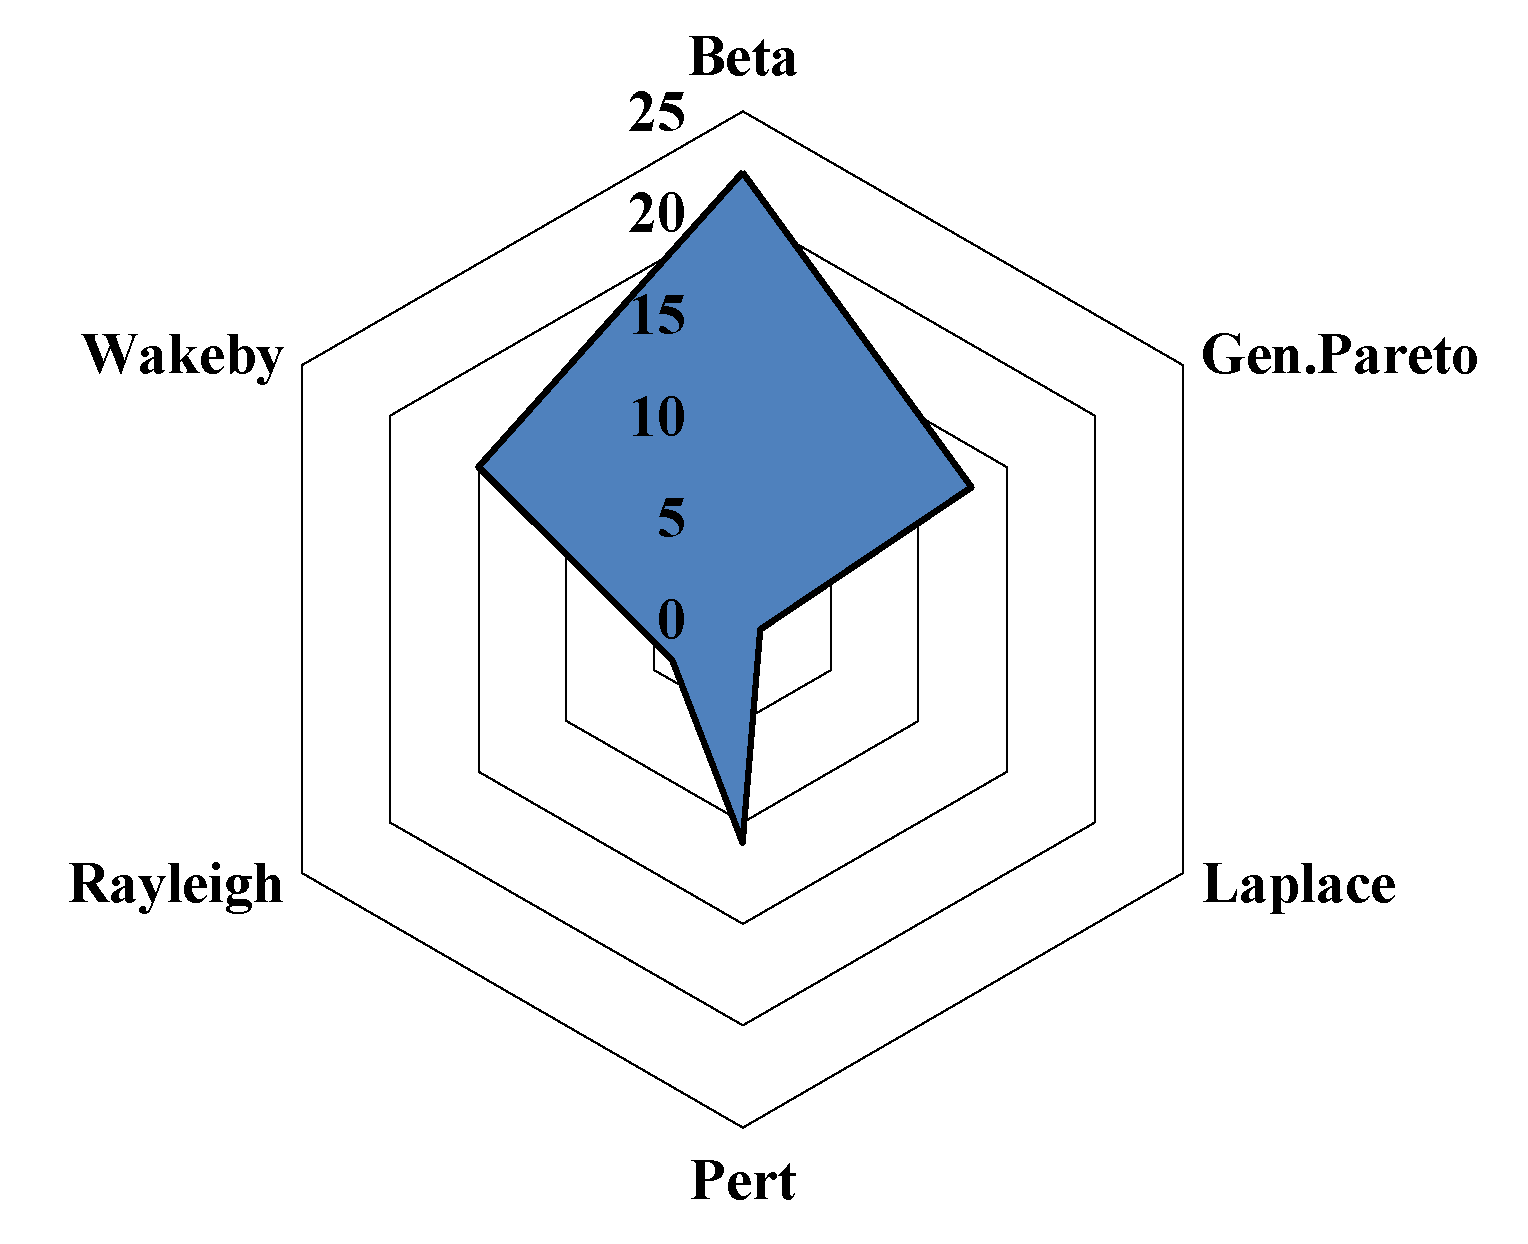
Figure 5.
Precipitation thresholds R (mm) of drought disaster during the critical water period during summer maize growth in the BHR. Note: BHR represent in areas in front of Bengbu Sluice in the Huaihe River Basin. R represents precipitation thresholds (mm).
Figure 5.
Precipitation thresholds R (mm) of drought disaster during the critical water period during summer maize growth in the BHR. Note: BHR represent in areas in front of Bengbu Sluice in the Huaihe River Basin. R represents precipitation thresholds (mm).

Figure 6.
Spatial distribution of precipitation thresholds R (mm) of drought disaster at different levels during the critical water period during summer maize growth in the BHR: (a) mild drought, (b) moderate drought, (c) severe drought, and (d) extreme drought.
Figure 6.
Spatial distribution of precipitation thresholds R (mm) of drought disaster at different levels during the critical water period during summer maize growth in the BHR: (a) mild drought, (b) moderate drought, (c) severe drought, and (d) extreme drought.

Figure 7.
Validation of typical years of precipitation thresholds of drought disaster in summer maize: (a) 1973, (b) 1985, (c) 1987, (d) 1994, (e) 1997, and (f) 1999.
Figure 7.
Validation of typical years of precipitation thresholds of drought disaster in summer maize: (a) 1973, (b) 1985, (c) 1987, (d) 1994, (e) 1997, and (f) 1999.

Figure 8.
Variation in precipitation during the critical water period during summer maize growth at typical sites from 1961 to 2015.
Figure 8.
Variation in precipitation during the critical water period during summer maize growth at typical sites from 1961 to 2015.

Table 1.
Main growth period and date of summer maize in the Huaihe River Basin (BHR).
| Date | 1 June–20 June | 21 June–10 July | 11 July–10 August | 11 August–30 September | 1 June–30 September |
| Growth Period | Sowing-seeding stage | Seeding-jointing stage | Jointing-tassel appearance stage | Tassel appearance-maturity | Whole period |
Table 2.
Crop coefficient of summer maize in different stages in the BHR.
| Growth Period | Sowing-Seeding Stage | Seeding-Jointing Stage | Jointing-Tassel Appearance Stage | Tassel Appearance-Maturity |
|---|---|---|---|---|
| Crop coefficient (Kc) | 0.65 | 0.98 | 1.55 | 1.40 |
Table 3.
Four kinds of probability distribution functions.
| Bounded Probability Distribution Function | Number of Parameters | Unbounded Probability Distribution Function | Number of Parameters | Non-Negative Probability Distribution Function | Number of Parameters | Generalized Distribution Function | Number of Parameters |
|---|---|---|---|---|---|---|---|
| Beta | 4 | Cauchy | 2 | Chi-Squared | 2 | Gen. Extreme Value | 3 |
| Johnson SB | 3 | Error Function | 1 | Erlang | 3 | Gen. Logistic | 3 |
| Pert | 3 | Gumbel Max | 2 | Exponential | 2 | Gen. Pareto | 3 |
| Gumbel Min | 2 | Frechet | 3 | Phased Bi-Exponential | 4 | ||
| Laplace | 2 | Gamma | 3 | Phased Bi-Weibull | 6 | ||
| Logistic | 2 | Log-Logistic | 3 | Wakeby | 5 | ||
| Normal | 2 | Inv. Gaussian | 3 | ||||
| Student’s t | 1 | Lognormal | 3 | ||||
| 1 | Pareto | 2 | |||||
| Rayleigh | 2 | ||||||
| Weibull | 3 |
Table 4.
The summer maize drought level and the different types of drought conditions in different growth stages.
Table 4.
The summer maize drought level and the different types of drought conditions in different growth stages.
| Mild Drought | Moderate Drought | Severe Drought | Extreme Drought |
|---|---|---|---|
| Sowing-jointing stage: the emergence rate is less than 80%, and the seedlings appear to be wilt at noon; Jointing-tassel appearance stage: the leaves of the plant are curled, and the growth and development are significantly affected; Tassel appearance-maturity: the 1000-grain weight drops slightly. | Sowing-jointing stage: the emergence rate is less than 60%, and leaves with wilting or dead seedlings; Jointing-tassel appearance stage: the leaves are wilted and twisted, and the growth and development are severely hindered; Tassel appearance-maturity: the plants could not be properly grouted and the 1000-grain weight drops significantly. | Sowing-jointing stage:seedlings died during the drought; Jointing-tassel appearance stage: the leaves are dry, the stems are short, the growth is stagnant, and some plants die during the drought; Tassel appearance-maturity: plant stems and leaves are premature, and the yield is greatly reduced. | Sowing-jointing stage: seedlings died during the drought; Jointing-tassel appearance stage: most plants died during the drought; Tassel appearance-maturity: the plant dies during the drought and the yields of crops are greatly reduced. |
© 2018 by the authors. Licensee MDPI, Basel, Switzerland. This article is an open access article distributed under the terms and conditions of the Creative Commons Attribution (CC BY) license (http://creativecommons.org/licenses/by/4.0/).
Share and Cite
MDPI and ACS Style
Gao, C.; Li, X. Precipitation Thresholds of Drought Disaster for Maize in Areas in Front of Bengbu Sluice, Huaihe River Basin, China. Water 2018, 10, 1395. https://doi.org/10.3390/w10101395
AMA Style
Gao C, Li X. Precipitation Thresholds of Drought Disaster for Maize in Areas in Front of Bengbu Sluice, Huaihe River Basin, China. Water. 2018; 10(10):1395. https://doi.org/10.3390/w10101395
Chicago/Turabian StyleGao, Chao, and Xuewen Li. 2018. "Precipitation Thresholds of Drought Disaster for Maize in Areas in Front of Bengbu Sluice, Huaihe River Basin, China" Water 10, no. 10: 1395. https://doi.org/10.3390/w10101395
Note that from the first issue of 2016, this journal uses article numbers instead of page numbers. See further details here.