Impact of Major Typhoons in 2016 on Sea Surface Features in the Northwestern Pacific


1
Institute of Physical Oceanography and Remote Sensing, Ocean College, Zhejiang University, No. 1 Zheda Road, Zhoushan 316021, China
2
32020 Unit, Chinese People’s Liberation Army, No. 15 Donghudong Road, Wuhan 430074, China
*
Author to whom correspondence should be addressed.
Water 2018, 10(10), 1326; https://doi.org/10.3390/w10101326
Submission received: 22 August 2018
/
Revised: 15 September 2018
/
Accepted: 24 September 2018
/
Published: 25 September 2018
(This article belongs to the Section Hydrology)
Abstract
:Studying the interaction between the upper ocean and the typhoons is crucial to improve our understanding of heat and momentum exchange between the ocean and the atmosphere. In recent years, the upper ocean responses to typhoons have received considerable attention. The sea surface cooling (SSC) process has been repeatedly discussed. In the present work, case studies were examined on five strong and super typhoons that occurred in 2016—LionRock, Meranti, Malakas, Megi, and Chaba—to search for more evidence of SSC and new features of typhoons’ impact on sea surface features. Monitoring data from the Central Meteorological Observatory, China, sea surface temperature (SST) data from satellite microwave and infrared remote sensing, and sea level anomaly (SLA) data from satellite altimeters were used to analyze the impact of typhoons on SST, the relationship between SSC and pre-existing eddies, the distribution of cold and warm eddies before and after typhoons, as well as the relationship between eddies and the intensity of typhoons. Results showed that: (1) SSC generally occurred during a typhoon passage and the degree of SSC was determined by the strength and the translation speed of the typhoon, as well as the pre-existing sea surface conditions. Relatively lower sea level (or cold core eddy) favors causing intense SSC; (2) After a typhoon passed, the SLA obviously decreased along with the SSC. The pre-existing positive SLAs or warm eddies decreased or disappeared during the typhoon’s passage, whereas negative SLAs or cold eddies were enhanced. It is suggested that the presence of warm eddies on the path has intensified the typhoons; (3) A criterion based on the ratio of local inertial period to application time of the typhoon wind-forcing was raised to dynamically distinguish slow- and fast-moving typhoons. And subcritical (slow-moving) situations were found in the LionRock case at its turning points where a cold core eddy was generated by long-time forcing. Moreover, the LionRock developed into a super typhoon due to reduced negative feedback when it was stalling over a comparably warmer sea surface. Therefore, the distinctive LionRock case is worthy of further discussion.
1. Introduction
The Northwestern Pacific Ocean is the largest ocean area with typhoons, hurricanes, or tropical cyclones, accounting for more than 30% of the total number worldwide [1]. As severe weather phenomena, typhoons not only cause serious damage to coastal areas, but also constantly change the thermodynamic characteristics of the ocean during their passage. It is generally thought that typhoons play an important role in regulating the momentum, heat, and material exchange between the upper ocean and the atmosphere. Improving our understanding of typhoon–ocean interactions is required to formulate more accurate typhoon predictions [2,3,4,5,6].
During a typhoon, one of the most remarkable responses of the ocean is a significant reduction in sea surface temperature (SST) [7,8,9,10,11,12,13,14], known as sea surface cooling (SSC). The observed drop in SST could vary tremendously from about 2 °C [11] to even 11 °C [10]. Typhoon-generated SSC and current velocity increases are often strongly rightward-biased [7,15,16,17], and shifts toward the typhoon track at depths exceeding roughly 100 m [18,19,20]. However, the left side of the typhoon track may also experience significant SSC due to intense precipitation [21,22]. The degree of SSC is generally thought to be determined by the intensity and translation speed of the typhoon and the pre-existing ocean conditions, such as SST, sea surface height (SSH), mixed layer depth (MLD), thermocline structure, etc.
It has been suggested that the typhoon’s translation speed has vital importance to typhoon–ocean interaction. Slow-moving intense typhoons generate strong upwelling, which enhances the entrainment underneath and reduces the rightward bias [7], while fast-moving ones cause a transient surface intensified response and expose themselves for a shorter period to the cooling sea surface, both of which tend to reduce the negative SST feedback [2]. Lin et al. [23] indicated that a lower translation speed demands a much higher enthalpy flux to maintain the intensity of a tropical cyclone, which is consistent with the argument that there exists a minimum translation speed for intensification whose value grows with the intensity of tropical cyclones [2]. A criterion to determine whether the typhoon is slow was raised upon the so-called Froude number (the ratio of translation speed to first baroclinic mode speed) [24]. A subcritical (slow-moving) situation was found to have facilitated SSC and mixed layer deepening due to the absence of inertial-gravity waves in the wake of the typhoon.
Moreover, the interactions between typhoons and ocean mesoscale eddies were also emphasized. The SST inside pre-existing cyclonic (cold) eddies drops remarkably after the passage of a typhoon because cold deep water is easily raised due to uplifted thermocline and large current shear under the base of the mixed layer [10,25,26,27,28,29,30,31,32,33]. A tremendous SSC of 10.8 °C was recorded when Typhoon Kai-Tak passed over the cyclonic West Luzon Eddy in 2000 [28]. However, in contrast to the significant SSC, only 10% of the cyclonic eddies passed by super typhoons were intensified during the period 2000–2008 [32]. This may suggest that only under slow-moving typhoons can strong upwelling due to long-time forcing efficiently enhance and enlarge the cyclonic eddies. In this case, new cyclonic eddies were also found to be generated [32,34,35,36].
Compared with cyclonic eddies, anticyclonic (warm) eddies are not significantly impacted by typhoons. The comparably warmer surface and higher heat content in anticyclonic eddies, however, tends to reduce the negative feedback due to SSC induced by upwelling and vertical mixing [37,38]. Lin et al. [39] reported that super typhoon Maemi caused a weak SSC of only 0.5 °C inside a warm eddy, quite smaller than the value (2 °C) outside, while the typhoon was rapidly intensified due to the presence of the warm eddy. On the contrary, the rapid collapse of category 4 hurricane Kenneth when it stalled over a cold eddy was reported [40]. It was said that the slow translation speed of Kenneth caused significant SSC of 8–9 °C which turned the enthalpy fluxes to negative and cut off direct ocean energy flux to the hurricane.
In the present work, we examined the impact of five major typhoons passing the Northwestern Pacific Ocean in 2016. We analyzed meteorological records and remote-sensing data and focused on the following: (1) the impact of the typhoon on SST and the relationship between SSC and pre-existing eddies; and (2) distribution of cold and warm eddies before and after a typhoon and the relationship between the eddy and intensity of typhoon. More evidence for typhoon-induced SSC was found and the pre-existence of a warm eddy was suggested to intensify the typhoon during its passage. Moreover, a subcritical (slow-moving) situation was found in the LionRock case at its turning points which is worth further discussion in the following research.
2. Data and Methods
Five strong and super typhoons (Table 1) that occurred in the Northwestern Pacific Ocean from 20 August 2016 to 5 October 2016 were selected for case studies in the present work, including LionRock, Meranti, Malakas, Megi, and Chaba. These five typhoons occurred consecutively with considerable impact, and followed three different types of path (Figure 1). The typhoon monitoring data were released by the Central Meteorological Observatory on the internet in real time (http://typhoon.nmc.cn/web.html). The data included typhoon center positions, minimum air pressures, maximum wind speeds, and average translation speeds.
The SST data were obtained using microwave (MW) remote-sensing (TMI, AMSR-E, AMSR2, and WindSat) and infrared (IR) remote sensing (Terra MODIS and Aqua MODIS). The time resolution is 1 day, and the spatial resolution is 9 km (ftp://ftp.remss.com/sst/daily_v04.0/mw_ir/). To avoid statistically insignificant effects, we considered the cooling of the typhoon track area during the typhoon’s birth and disappearance as being caused by the typhoon crossing. Therefore, we selected the lowest temperature of the grid during the statistical period as the temperature after typhoon transit, and the temperature field of the previous day was subtracted from the temperature field generated by the typhoon to obtain the cooling distribution of the study area.
Satellite altimeters provided us with a useful method of obtaining long-term data on global sea level anomaly (SLA), which has been proven to be in good agreement with in situ observations, such as the tide gauge [41]. The SLA data are released by the Satellite Oceanographic Data Center (AVISO) of the Centre National d’Etudes Spatiales through its official website. This data are mainly composed of TOPEX/POSEIDON, Jason-1, and ERS/Envisat altimeter satellites, with a time resolution of 1 day and a spatial resolution of 0.25°. The data included SLA and geostrophic flow velocity (u/v) data. In the study area, the determination of the center and extent of cold and warm eddies was performed using the geostrophic velocity field.
3. Results
3.1. LionRock
Typhoon LionRock developed from a disturbance in the Pacific open ocean. It moved slowly northwestward under the guidance of the subtropical high, and the typhoon intensity gradually strengthened. On 17–18 August 2016, it encountered a high-level eddy in the troposphere, resulting in a significant reduction in convection and intensity. However, on August 19–20, it experienced the Fujiwhara effect (two typhoon inter-rotational effects) with the Kompasu in the development stage. It turned south and entered the relatively warm ocean surface. Convection occurred, and its intensity increased. LionRock developed into a tropical storm. Subsequently, on August 21–22, LionRock displayed the Fujiwhara effect with Typhoon Mindulle and continued to move southward. The Fujiwhara effect occurs when cyclones are in proximity to one another; their centers will begin orbiting cyclonically about a point between the two systems due to their cyclonic wind circulations [42]. It became a strong tropical storm and developed into a typhoon at 8:00 a.m. on August 24, with a maximum wind speed of 35 m/s. At 2:00 p.m., it developed into a strong typhoon with a maximum wind speed of 42 m/s and was oriented in the southwest direction. At 2:00 a.m. on August 26, LionRock was affected by the Western North Pacific subtropical high (WNPSH) and changed its direction from southwest to northeast, with its intensity gradually strengthening. At 2:00 p.m. on August 28, it developed into a super typhoon and maintained its strength until August 29 at 2:00 p.m. From 8:00 p.m. on August 29 to 2:00 a.m. on August 30, it gradually turned to the northwest. It made landfall in Japan at 5:00 p.m. on August 30 and reached Northeast China at 5:00 a.m. on August 31, 2016.
LionRock caused a certain degree of cooling (>2 °C) in a large area where it passed over the sea (Figure 2). The cooling of the right side of the path was more obvious than that of the left side, and the cooling was greatest at the turning point of the typhoon path and when the typhoon wind speed was relatively large. The cooling area at the turning point of the typhoon path was concentrated in a circular area. The cooling center of the typhoon straight-through area was about 100 km on the right side of the typhoon path, and the cooling area was also approximately circular with a cooling radius of about 200 km. The SLA distribution (Figure 3a) before the passage of Typhoon LionRock was obviously related to the cooling distribution. From Figure 3a, before the typhoon crossing (19 August 2016), where the SLA value was positive (i.e., it was in a warm eddy area), the cooling was low (<3 °C). When the SLA before a typhoon crossing is negative (i.e., it is in a cold eddy area), the cooling caused by LionRock was relatively high and the cooling eddy center was close to the center of the cold eddy. The SLA distribution (Figure 3a) before the passage of Typhoon LionRock was obviously related to the cooling distribution. Before the typhoon crossing, where the SLA value was positive (i.e., it was in a warm eddy area), the cooling was low (<3 °C). When the SLA before a typhoon crossing was negative (i.e., it is in a cold eddy area), the cooling was relatively high and the cooling eddy center was close to the center of the cold eddy.
At the same time, it can be seen from Figure 3d that after LionRock passed (1 September 2016), the position of cold and warm eddies and their radii changed significantly. The cold eddies increased and moved toward the area close to the typhoon path, and the warm eddies weakened and moved away from the typhoon path. In particular, on 25 August, the typhoon reached the turning point and a new cold eddy was generated at the turning point (box A in Figure 3b). At 2:00 a.m. on 26 August, the typhoon turned from southwest to northeast, and the cold eddy generated in the box A disappeared. On 27 August, the typhoon traveled to the box B region, forming a new strong cold eddy on the left side of the path (Figure 3c). LionRock also strengthened the cold eddies in the southwest and northeast to some extent.
Figure 4 shows the maximum wind speed and the typhoon center pressure at various points along the typhoon path, as well as the day’s SLA. Two different degrees of typhoon enhancement (wind speed increase and pressure decrease) occurred after LionRock passed the high SLA area and continued for some time. On 24 August, the typhoon passed the high value SLA zone (15–30 cm), the maximum wind speed of the typhoon increased from 30 to 50 m/s, and the central pressure rapidly dropped from 980 hpa to 940 hpa. From 27 August to 29 August, LionRock passed through a relatively high-value SLA area twice (>15 cm). The center wind speed increased twice, from 42 s to 52 m/s, and the center pressure decreased by 20 hpa. However, when the typhoon passed through regions with low SLA values, it maintained its strength or was weakened to a certain extent.
3.2. Meranti and Malakas
Typhoon Meranti formed on the afternoon of 10 September 2016. It strengthened into a typhoon (at 17.6° N, 131.7° E) on the early morning of 12 September, strengthened into a strong typhoon at 8:00 a.m. on 12 September (at 18.0° N, 130.4° E), and strengthened to a super typhoon at 18.1° N, 129.9° E) at 11:00 a.m. on 12 September. In 24 h, the wind speed of Meranti increased from 25 to 62 m/s. This meant Meranti was a rapidly increasing typhoon. At 2:00 p.m. on 13 September, Meranti reached its peak intensity and the maximum wind speed near its center reached 70 m/s (over Beaufort scale 17), stronger than the peak strength of this year’s no. 1 typhoon, Nibbert (65 m/s, 17 or above). It was the strongest typhoon in the global sea area during 2016. Meranti traveled northwest all the way to the south of Taiwan and on 15 September it landed on the coast of Xiangan District, Xiamen, Fujian, China (at 24.57° N, 118.23° E).
As Typhoon Meranti was developing, another tropical depression was occurring near the typhoon formation at 08:00 a.m. on 13 September 2016, and it gradually developed into Typhoon no. 15, Malakas (at 15.8° N, 132.1° E). Malakas made its way to the northwest at the beginning of its generation, and it gradually developed into a strong typhoon. It turned northward on the southeastern side of Taiwan on 17 September and then turned northeast on 18 September. The intensity of the system continued to be strong. After landing on the southern side of Kyushu in Japan on 19 September, it gradually decreased.
Although Meranti was very intense, it did not have a strong cooling effect. It only caused a small degree of cooling in the southwestern part of the Philippines and the east side of Taiwan, with a maximum temperature drop of about 2 °C (Figure 5a). The largest area of cooling was close to the strong cold eddy shown in zone C in Figure 6a. Malakas caused a large range of cooling, and the cooling was obviously rightward biased (Figure 5b).
The formation dates of Typhoons Meranti and Malakas were quite close to each other and their affected areas were similar. The degree of SST cooling caused by them, however, was very different. The main reason that the two typhoons caused a great difference in cooling may be that Meranti’s path had a high SLA level (Figure 6a). At the same time, after Typhoon Meranti crossed, the area’s SLA was reduced to some extent (Figure 6b), and the SLA distribution also changed. This created favorable conditions for Typhoon Malakas to cool down. At the same time, Meranti moved quickly on the ocean, and the time of interaction between Meranti and its passage through the sea area was short, and this may also be the cause of its limited impact.
After the two typhoons passed the sea area, the SLA in the sea area showed different degrees of reduction (Figure 6). In particular, after the two typhoons strengthened, the existing warm eddy (at 20° N, 124.75° E in Figure 6a, box C) disappeared. Meranti’s transit caused a greater reduction than Malakas in the SLA level. The SLA level had already fallen somewhat during the pass of Malakas, which caused a certain degree of cooling after it passed.
As shown in Figure 7, the SLA level of the area through which Meranti passed was relatively high (20–40 cm), which may be one of the reasons for Meranti’s strength (maximum wind speed of 70 m/s), as typhoon enhancement occurs in high-value SLA regions. At 12:00 p.m. on 12 September, when the typhoon passed a SLA area with a relatively high value of 20–40 cm, the maximum wind speed of the typhoon increased from 62 to 70 m/s, and the system grew into a super typhoon. However, when Meranti passed an area with a relatively low SLA value, the typhoon maintained its original strength or changed only little. In addition, the apparent weakening of Meranti occurred when it arrived on land.
Malakas’ history includes three distinct growths and two reductions, shown in Figure 8. The three growths occurred after Malakas passed an area with a relatively high SLA value. Malakas continued to grow after being generated, on 14 September 2016 from 9:00 a.m. to 9:00 p.m. Malakas passed an area with a relatively low SLA value (−12–2 cm), and the typhoon’s growth stagnated. The maximum wind speed and center pressure of typhoon were maintained. From 15 September at 9:00 a.m. to 8:00 a.m. on 16 September, Malakas passed through an area with a relatively high SLA value (20–40 cm). The maximum wind speed of the typhoon increased from 42 to 50 m/s, and the central pressure dropped by 10 hpa. From 15 September at 3:00 p.m. to 9:00 p.m. on 17 September, Malakas passed through an area with a relatively low SLA value (−7–3 cm). After the typhoon maintained its strength for a period, it weakened and then passed through an area with a relatively high SLA value. Then the typhoon strengthened again at 3:00 p.m. on 18 September 2016.
3.3. Megi
Typhoon Megi was generated on the Northwest Pacific Ocean 2140 km south of Taitung City, Taiwan Province at 8:00 a.m. on 23 September 2016. After the typhoon was generated, it headed northwest toward Taiwan Island. On 25 September, it became a strong tropical storm at 19.4° N, 139.8° E. It became a super typhoon on 27 September, with a center pressure of 935 hpa and a maximum wind speed of 52 m/s. On the same day, it landed in Hualian County, Taiwan and weakened after landing. Then, it landed in Hui’an County, Fujian, China through the Taiwan Strait.
As shown in Figure 9, the cooling of the Typhoon Megi path area is obvious. The maximum cooling temperature was greater than 5 °C, and the resulting cooling distribution did not stop at the right side of the path. In the early period of typhoon development, it caused a temperature drop of 1–2 °C. The cooling area was mainly distributed on the left side of the typhoon’s path. On 24 September, Megi developed from a tropical depression to a tropical storm, causing a temperature drop of 1–2 °C on the right side of the typhoon path and gradually strengthening into a typhoon. On both sides of the typhoon path, we found a significant temperature drop of more than 3 °C. On 27 September, Megi developed into a super typhoon and caused strong cooling (>5 °C) centered on the typhoon track area. Comparing Figure 9 and Figure 10b, the positions of cooling centers match well those of the cold eddies, and the more cold eddies there are, the more obvious the cooling. On the contrary, in areas where the warm eddies were strong, the cooling was significantly lower than in the surrounding area.
After Megi passed through the research area, the SLA in the area demonstrated a certain degree of reduction (Figure 10). Before the typhoon passage, there were two small warm eddies and a small cold eddy on the southeast side of Taiwan Island (Figure 10a, box E). After the typhoon passage, the three small eddies merged into one big cold eddy and moved toward the typhoon path (Figure 10b). The SLA of the cold eddy center was reduced from −15 to −30 cm and the radius of the cold eddy increased from 30 to 200 km.
As shown in Figure 11, at the beginning of Megi’s formation, the area Megi passed was a high-value SLA area (0–20 cm), and the maximum wind speed and pressure in the typhoon center continued to grow until it became a strong typhoon with a maximum center wind speed if 52 m/s and center pressure of 935 hpa. From 3:00 p.m. on 26 September to 1:00 a.m. on 27 September, after the typhoon passed an area with a SLA low value (−13–0 cm), the typhoon intensity weakened after being maintained for some time. The maximum wind speed of the typhoon center dropped to 40 m/s before the typhoon landed in Taiwan, and the central pressure increased to 960 hpa. After landing in Taiwan, Megi continued to weaken.
3.4. Chaba
Typhoon Chaba was formed in the Northwestern Pacific on 28 September 2016. Its center was located on the ocean 580 km northeast of Guam in the United States (14.6° N, 150.0° E). After being generated, it traveled westward at a speed of 20–25 km per hour to the vicinity of the Malakas generation site. Then it turned to the northwest and became a super typhoon at 8:00 a.m. on 2 October. The minimum pressure in the center reached 920 hpa. The maximum wind speed reached 60 m/s. The typhoon went north to east of the East China Sea, and the strong typhoon continued until 7:00 p.m. on 4 October 2016. Then it weakened and turned to the northeast and finally hit the coast near South Korea’s Pusan. Later, it moved into the Sea of Japan and weakened into an extratropical cyclone.
When Chaba was still in the development stage, it traveled westward, causing the SST to drop by 1–2 °C (Figure 12). Most of the cooling area was located on the left side of the path, and then the typhoon turned to the northwest and gradually strengthened into a super typhoon, causing a significant reduction in the SST (>2 °C). The sea surface cooling caused by Typhoon Chaba was mainly distributed in areas with low SLA values. Compared to those of the previous typhoons, the cooling effect caused by Chaba was relatively small. The main reason may be that the SST dropped significantly, and the seawater mixed layer deepened. The water temperature of the shallow sea water was slightly different to the SST.
Similarly, Chaba caused a certain degree of decline in the SLA value of the area through which it passed. After the typhoon passed, the area’s low SLA value increased and a strong cold eddy was generated in the typhoon’s track (Figure 13b, box F). After the typhoon transited, the warm eddy around the typhoon path gradually weakened or even disappeared. For example, before the typhoon crossed this sea area, there was a warm eddy in the eastern part of Taiwan Island (Figure 13a, box G). After the typhoon transited, the main body of the warm eddy turned away from the typhoon path, and its intensity weakened.
As shown in Figure 14, at the beginning of the generation of Chaba, the SLA value of the sea area where the typhoon passed was small (−17 to 6 cm), and the maximum wind speed and pressure of the typhoon center did not change much. From 30 September to 2 October 2016, the typhoon passed through a region with a high SLA value (8–22 cm) and continued to strengthen and maintain its strength for a long time. When the typhoon was strongest, the wind speed reached 60 m/s and the center pressure was 920 hpa. After passing through the shallow sea area, the typhoon gradually weakened and disappeared.
4. Discussion
4.1. Impact of Tropical Cyclones on Sea Surface Temperature (SST)
To our knowledge, there have been many observations and simulations of sea temperature changes caused by typhoons, but most have been limited to the study of certain cases. We studied five consecutive typhoons that occurred in the Western Pacific in 2016, including LionRock, Meranti, Malakas, Megi, and Chaba. Through the analysis of SST data and SLA data from ocean remote sensing, we found that the typhoon-induced cooling of the sea surface is roughly distributed on the left and right sides of the typhoon track, with a range of about 100 km. We found that in areas where the SLA was positive before the typhoon, the degree of SSC after the typhoon passage was less than 3 °C. In areas where the SLA was negative before the typhoon, the degree of SSC after the typhoon passage was usually greater than 3 °C. The cooling center was closer to the center of the cold eddies. Among them, Typhoon LionRock caused the largest cooling area, as shown in Figure 2. In the warm eddies area where the SLA was positive, the degree of cooling was small, and was concentrated in the range of 2 to 3 °C. However, in the cold eddies area near the typhoon path with negative SLA, the cooling rate was relatively large, both above 3 °C and even reaching 5 °C. Moreover, at the turning point of Typhoon LionRock, a new cold eddy was formed, and the cooling rate was significantly higher than other regions (>5 °C).Typhoon Megi had an obvious cooling in the path area, as shown in Figure 9. The degree of cooling caused by the early typhoon was relatively small. However, after Megi developed into a super typhoon, it caused significant cooling in the path area. In addition, the location of the cooling area caused by Megi was basically the same as the distribution of cold eddies, and the cooling was more obvious in the area where the cold eddies were strong, while in the warm eddy areas, the cooling was lower than the surrounding area.
In particular, Malakas passed to the left (Figure 6c) and Megi passed over the center (Figure 10) of a cold eddy located to the east of Taiwan Island. The intense SSC over the cold eddy (shown in Figure 5b and Figure 9) suggested that both the shallower mixed layer and the uplifted thermocline structure favored the entrainment to bring deep cold water to the surface during the typhoon passage. As a comparison, Meranti passed to the southwest of the same cold eddy at a distance of around 250 km away from its track (Figure 9a), and it caused a relatively weaker SSC over the cold eddy center (Figure 5a).
4.2. Impact of Translation Speed of Tropical Cyclones
The time interval between typhoon positions indicated by colored dots on the tracks in Figure 1 is 12 h. Therefore, all the five typhoons are generally fast-moving except the LionRock near its turning points (note that the local inertial period at 30° N is 24 h). Since neither subsurface historical data nor any numerical model was applied here, accurate calculations of the first baroclinic mode speeds at each point are not available. However, an estimation of no more than 3 m/s in the sub-tropical and mid-latitude ocean is in principle reasonable, which means also only the LionRock near its turning points reflected a subcritical situation of slow-moving typhoon, following the criterion raised by Pan and Sun [24] upon the Froude number (the ratio of translation speed to first mode baroclinic speed).
Here, another criterion upon the ratio of local inertial period to application time of the typhoon wind-forcing is suggested, which reads:
where represents the local inertial period, means the level 7 wind-forcing diameter of the typhoon, and is the translation speed. The LionRock case is shown in Figure 15.
As shown in Figure 15, subcritical (slow-moving) situations were found near the two turning points of LionRock around 22 August and from 24 to 26 August. In particular, from 25 to early 26 August, LionRock stalled at its southwestern tip for almost one day. These subcritical situations generated strong upwelling, caused a significant surface temperature drop of nearly 5 °C, and reduced the rightward bias of SSC, which is consistent to the discussions in literature [7].
Another noticeable situation is the comparably higher initial sea surface near the southwestern most turning points (Figure 3a). Two warm eddies were found to the right of its track. It means that the LionRock was stalling over a warmer surface for quite a long time, absorbing vast energy, growing into a super typhoon and speeding up to move northeastward. It left behind a cold eddy generated by strong upwelling, which disappeared in two days possibly due to horizontal advection. This process can also be clearly seen in Figure 4.
4.3. Relationship between Tropical Cyclones and Sea Level Anomaly (SLA)
We found that when a typhoon crosses over a sea area, it causes SLA to respond strongly. The main action was that the SLA obviously decreased. After Typhoon LionRock passed over the sea, the cold eddies strengthened, while the warm eddies weakened, and the center of the cold eddy moved toward the area close to the typhoon path, while the warm eddy moved away from the typhoon path. After the passage of Typhoons Meranti and Malakas, SLA showed a different degree of reduction. After Typhoon Megi passed over, the small cold eddy that existed before the typhoon merged and intensified, and moved closer to the typhoon path. Similarly, the passage of Typhoon Chaba also created a low value SLA area, which was located in the southwest of the northwestern Pacific greater, and generated a stronger cold eddy at the typhoon path.
We also found that the mesoscale eddies, which existed in the upper ocean before the typhoon, not only played an important role in the extent and location of the cooling of the sea surface, but also had an important impact on the typhoon intensity during the typhoon passage. During Typhoon LionRock, two different degrees of typhoon intensification occurred after the typhoon passed the higher (or warm eddies) areas of SLA. However, when the typhoon passed through regions with low SLA values, it maintained a constant intensity or weakened to a certain extent. The apparent weakening of Typhoon Meranti also occurred when it passed SLA-reduced areas or arrived on land, and the three growths in the life of Malakas occurred after passing through the relatively high value area of SLA. At the beginning of Typhoon Megi, when it passed through the area with high SLA, the wind speed increased, the pressure decreased, and the typhoon continued to grow. However, at the beginning of Typhoon Chaba, the SLA of the passing sea area was small, so the maximum wind speed and center pressure of the typhoon did not change much. The above results support the view that a typhoon passing through a warm eddy region (i.e., relatively high SLA area) will increase in intensity. After passing through a cold eddy region (i.e., relatively low SLA area), the typhoon intensity will remain unchanged or gradually weaken.
5. Conclusions
In the present work, five strong or super typhoons in the Northwestern Pacific Ocean that occurred in 2016 were selected for case studies. Satellite altimeter data and SST data were used to analyze typhoon-induced sea surface response.
After a typhoon passed, it caused a significant cooling of the sea surface. The degree of SSC was determined by the intensity, the translation speed of the typhoon, as well as pre-existing sea surface conditions. In general, the SST was intensively reduced after a typhoon passed when the initial SLA was negative, and the cooling centers were consistent with the centers of the cold eddies. On the contrary, if the initial SLA was positive, the degree of SSC was not obvious.
Due to wind-induced upwelling, after a typhoon passed, the SLA obviously decreased. Therefore, typhoons have a significant impact on the distribution of cold and warm eddies. Pre-existing cold eddies are enhanced and their centers move toward the typhoon track, while warm eddies are weakened (or even disappeared) and moved away from the typhoon track.
Considering the feedback from the ocean to the typhoon, when a typhoon passed over a high SLA region, the maximum wind speed significantly increased and the central air pressure decreased, which means that the typhoon has been intensified. When it passed over a low SLA region, the maximum wind speed remained unchanged or decreased.
Upon a criterion based on the ratio of local inertial period to application time of the typhoon wind-forcing, subcritical (slow-moving) situations were found in the LionRock case. In particular, LionRock was stalling at its southwest-most turning points over a comparably warmer sea surface for more than one day. It absorbed vast energy, developed into a super typhoon and speeded up to move northeastward, leaving behind a cold core eddy generated by strong upwelling. This distinctive case is worthy of further discussion in subsequent research.
Author Contributions
Conceptualization, D.S.; Methodology, D.S. and L.G.; Software, L.G. and Z.D.; Validation, D.S., L.G. and L.X.; Formal Analysis, L.G.; Investigation, Z.D.; Resources, L.G. and Z.D.; Data Curation, L.G. and Z.D.; Writing-Original Draft Preparation, L.G.; Writing-Review & Editing, D.S. and L.X.; Visualization, L.G., Z.D. and L.X.; Supervision, D.S.; Project Administration, D.S.; Funding Acquisition, D.S.
Funding
This research was funded by the Ministry of Science and Technology of the People’s Republic of China under grant number 2016YFC1401404, the NSFC-Zhejiang Joint Fund for the Integration of Industrialization and Informatization under grant number U1709204, the Zhejiang Provincial Natural Science Foundation of China under grant number LY17D060003, and the Key Laboratory of Ocean Circulation and Waves of the Chinese Academy of Sciences under grant number KLOCW1704.
Acknowledgments
We would like to thank Shuangyan He, Jiawang Chen and some other colleagues for their inspiring advices on the present work. We also deeply thank Jin Liu for his help in programming, and Jianlei Fan for proofreading.
Conflicts of Interest
The authors declare no conflict of interest. The founding sponsors had no role in the design of the study; in the collection, analyses, or interpretation of data; in the writing of the manuscript, and in the decision to publish the results.
References
- Chen, D.K.; Lei, X.T.; Wang, W.; Wang, G.H.; Han, G.J.; Zhou, L. Upper ocean response and feedback mechanisms to typhoon. Adv. Earth Sci. 2013, 28, 1077–1086. (In Chinese) [Google Scholar]
- Mei, W.; Pasquero, C.; Primeau, F. The effect of translation speed upon the intensity of tropical cyclones over the tropical ocean. Geophys. Res. Lett. 2012, 39, L07801. [Google Scholar] [CrossRef]
- Balaguru, K.; Taraphdar, S.; Leung, L.R.; Foltz, G.R.; Knaff, J.A. Cyclone-cyclone interactions through the ocean pathway. Geophys. Res. Lett. 2014, 41, 6855–6862. [Google Scholar] [CrossRef] [Green Version]
- Kuo, Y.C.; Lee, M.A.; Chern, C.S. Typhoon-induced ocean responses off the southwest coast of Taiwan. Ocean Dyn. 2014, 64, 1569–1581. [Google Scholar] [CrossRef]
- Wada, A.; Uehara, T.; Ishizaki, S. Typhoon-induced sea surface cooling during the 2011 and 2012 typhoon seasons: Observational evidence and numerical investigations of the sea surface cooling effect using typhoon simulations. Prog. Earth Planet. Sci. 2014, 1, 11. [Google Scholar] [CrossRef]
- Heo, K.Y.; Ha, T.; Park, K.S. The effects of a typhoon-induced oceanic cold wake on typhoon intensity and typhoon-induced ocean waves. J. Hydro-Environ. Res. 2016, 14, 61–75. [Google Scholar] [CrossRef]
- Price, J.F. Upper ocean response to a hurricane. J. Phys. Oceanogr. 1981, 11, 153–175. [Google Scholar] [CrossRef]
- Wada, A. The processes of SST cooling by typhoon passage and case study of Typhoon Rex with a mixed layer ocean model. Pap. Meteorol. Geophys. 2002, 52, 31–66. [Google Scholar] [CrossRef]
- Walker, N.D.; Leben, R.R.; Balasubramanian, S. Hurricane-forced upwelling and chlorophyll a enhancement within cold-core cyclones in the Gulf of Mexico. Geophys. Res. Lett. 2005, 32, L18610. [Google Scholar] [CrossRef]
- Shang, S.L.; Li, L.; Sun, F.Q.; Wu, J.Y.; Hu, C.M.; Chen, D.W.; Ning, X.R.; Qiu, Y.; Zhang, C.Y.; Shang, S.P. Changes of temperature and bio-optical properties in the South China Sea in response to Typhoon Lingling, 2001. Geophys. Res. Lett. 2008, 35, L10602. [Google Scholar] [CrossRef]
- Sanford, T.B.; Price, J.F.; Girton, J.B. Upper-Ocean Response to Hurricane Frances (2004) Observed by Profiling EM-APEX Floats. J. Phys. Oceanogr. 2011, 41, 1041–1056. [Google Scholar] [CrossRef]
- D’Asaro, E.; Black, P.; Centurioni, L.; Harr, P.; Jayne, S.; Lin, I.-I.; Lee, C.; Morzel, J.; Mrvaljevic, R.; Niiler, P.P.; et al. Typhoon-ocean interaction in the western north pacific: Part 1. Oceanography 2011, 24, 24–31. [Google Scholar] [CrossRef]
- Pun, I.F.; Chang, Y.T.; Lin, I.-I.; Tang, T.Y.; Lien, R.C. Typhoon-ocean interaction in the western north pacific: Part 2. Oceanography 2011, 24, 32–41. [Google Scholar] [CrossRef]
- Zhang, W.Z.; Lin, S.; Jiang, X.M. Influence of Tropical Cyclones in the Western North Pacific. In Recent Developments in Tropical Cyclone Dynamics, Prediction, and Detection; Anthony, R.L., Ed.; IntechOpen: London, UK, 2016; pp. 3–24. ISBN 95351270399535127020. [Google Scholar]
- Mahapatra, D.K.; Rao, A.D.; Babu, S.V.; Srinivas, C. Influence of coast line on upper ocean’s response to the tropical cyclone. Geophys. Res. Lett. 2007, 34, 17601–17603. [Google Scholar] [CrossRef]
- Kuo, Y.C.; Chern, C.S.; Wang, J.; Tsai, Y.L. Numerical study of upper ocean response to a typhoon moving zonally across the Luzon strait. Ocean Dyn. 2011, 61, 1783–1795. [Google Scholar] [CrossRef]
- Wu, R.G.; Cao, X.; Chen, W. Surface wind speed-SST relationship during the passage of typhoons over the South China Sea. IEEE Geosci. Remote Sens. Lett. 2012, 9, 933–937. [Google Scholar] [CrossRef]
- Lin, S.; Zhang, W.-Z.; Shang, S.-P.; Hong, H.-S. Ocean response to typhoons in the western north pacific: Composite results from Argo data. Deep Sea Res. Part I Oceanogr. Res. Pap. 2017, 123, 62–74. [Google Scholar] [CrossRef]
- Wu, R.H.; Li, C.Y. Upper ocean response to the passage of two sequential typhoons. Deep Sea Res. Part I Oceanogr. Res. Pap. 2018, 132, 68–79. [Google Scholar] [CrossRef]
- Yue, X.X.; Zhang, B.; Liu, G.Q.; Li, X.F.; Zhang, H.; He, Y.J. Upper ocean response to typhoon Kalmaegi and Sarika in the south china sea from multiple-satellite observations and numerical simulations. Remote Sens. 2018, 10, 348. [Google Scholar] [CrossRef]
- Liu, Z.H.; Xu, J.P.; Zhu, B.K.; Sun, C.H.; Zhang, L.F. The upper ocean response to tropical cyclones in the northwestern pacific analyzed with Argo data. Chin. J. Oceanol. Limnol. 2007, 25, 123–131. [Google Scholar] [CrossRef]
- Subrahmanyam, M.V. Impact of typhoon on the north–west pacific sea surface temperature: A case study of typhoon kaemi (2006). Nat. Hazards 2015, 78, 569–582. [Google Scholar] [CrossRef]
- Lin, I.-I.; Pun, I.F.; Wu, C.C. Upper-ocean thermal structure and the Western North Pacific category 5 typhoons. Part II: Dependence on translation speed. Mon. Weather Rev. 2009, 137, 3744–3757. [Google Scholar] [CrossRef]
- Pan, J.Y.; Sun, Y.J. Estimate of Ocean Mixed Layer Deepening after a Typhoon Passage over the South China Sea by Using Satellite Data. J. Phys. Oceanogr. 2013, 43, 498–506. [Google Scholar] [CrossRef]
- Morey, S.L.; Bourassa, M.A.; Dukhovskoy, D.S.; O’Brien, J.J. Modeling studies of the upper ocean response to a tropical cyclone. Ocean Dyn. 2006, 56, 594–606. [Google Scholar] [CrossRef]
- Zheng, Z.W.; Ho, C.R.; Kuo, N.J. Importance of pre-existing oceanic conditions to upper ocean response induced by super typhoon hai-tang. Geophys. Res. Lett. 2008, 35, L20603. [Google Scholar] [CrossRef]
- Zheng, Z.W.; Ho, C.R.; Zheng, Q.; Lo, Y.T.; Kuo, N.J.; Gopalakrishnan, G. Efects of preexisting cyclonic eddies on upper ocean responses to Category 5 typhoons in the western North Pacific. J. Geophys. Res. Oceans 2010, 115, C09013. [Google Scholar] [CrossRef]
- Chiang, T.L.; Wu, C.R.; Oey, L.Y. Typhoon Kai-Tak: An ocean’s perfect storm. J. Phys. Oceanogr. 2011, 41, 221–233. [Google Scholar] [CrossRef]
- Nam, S.H.; Kim, D.J.; Moon, W.M. Observed impact of mesoscale circulation on oceanic response to Typhoon Man-Yi (2007). Ocean Dyn. 2012, 62, 1–12. [Google Scholar] [CrossRef]
- Sun, L.; Yang, Y.J.; Fu, Y.F. Impacts of Typhoon on the Kuroshio Large Meander: Observation Evidences. Atmos. Ocean. Sci. Lett. 2009, 2, 45–50. [Google Scholar] [CrossRef]
- Sun, L.; Yang, Y.J.; Tao, X.; Lu, Z.M.; Fu, Y.F. Strong enhancement of chlorophyll a concentration by a weak typhoon. Mar. Ecol. Prog. Ser. 2010, 404, 39–50. [Google Scholar] [CrossRef] [Green Version]
- Sun, L.; Li, Y.X.; Yang, Y.J.; Wu, Q.Y.; Chen, X.T.; Li, Q.Y.; Li, Y.B.; Xian, T. Effects of super typhoons on cyclonic ocean eddies in the western North Pacific: A satellite data-based evaluation between 2000 and 2008. J. Geophys. Res. Oceans 2014, 119, 5585–5598. [Google Scholar] [CrossRef] [Green Version]
- Ma, Z.H.; Fei, J.F.; Liu, L.; Huang, X.G.; Cheng, X.P. Effects of the cold core eddy on tropical cyclone intensity and structure under idealized air-sea interaction conditions. Mon. Weather Rev. 2013, 141, 1285–1303. [Google Scholar] [CrossRef]
- Hu, J.Y.; Kawamura, H. Detection of cyclonic eddy generated by looping tropical cyclone in the northern South China Sea: A case study. Acta Oceanol. Sin. 2004, 23, 213–224. [Google Scholar]
- Tseng, Y.H.; Jan, S.; Dietrich, D.E.; Lin, I.-I.; Chang, Y.T.; Tang, T.Y. Modeled oceanic response and sea surface cooling to Typhoon Kai-Tak. Terr. Atmos. Ocean. Sci. 2010, 21, 85–98. [Google Scholar] [CrossRef]
- Yang, Y.J.; Sun, L.; Duan, A.M.; Li, Y.B.; Fu, Y.F.; Yan, Y.F.; Wang, Z.Q.; Xian, T. Impacts of the binary typhoons on upper ocean environments in November 2007. J. Appl. Remote Sens. 2012, 6, 63581–63583. [Google Scholar] [CrossRef]
- Shay, L.K.; Goni, G.J.; Black, P.G. Effects of a warm oceanic feature on Hurricane Opal. Mon. Weather Rev. 2000, 128, 1366–1383. [Google Scholar] [CrossRef]
- Yablonsky, R.M.; Ginis, I. Impact of a warm ocean eddy’s circulation on hurricane-induced sea surface cooling with implications for hurricane intensity. Mon. Weather Rev. 2009, 141, 997–1021. [Google Scholar] [CrossRef]
- Lin, I.-I.; Wu, C.C.; Emanuel, K.A.; Lee, I.H.; Wu, C.R.; Pun, L.F. The Interaction of Super typhoon Maemi (2003) with a Warm Ocean Eddy. Mon. Weather Rev. 2005, 133, 2635–2649. [Google Scholar] [CrossRef]
- Walker, N.D.; Leben, R.R.; Pilley, C.T.; Shannon, M.; Herndon, D.C.; Pun, I.F.; Lin, I.-I.; Gentemann, C.L. Slow translation speed causes rapid collapse of northeast Pacific Hurricane Kenneth over cold core eddy. Geophys. Res. Lett. 2015, 41, 7595–7601. [Google Scholar] [CrossRef]
- Liu, J.; Dai, J.J.; Xu, D.F.; Wang, J.; Yuan, Y.P. Seasonal and interannual variability in coastal circulations in the northern south China sea. Water 2018, 10, 520. [Google Scholar] [CrossRef]
- Wu, C.C.; Huang, T.S. A New Look at the Binary Interaction: Potential Vorticity Diagnosis of the Unusual Southward Movement of Tropical Storm Bopha (2000) and Its Interaction with Super Typhoon Saomai (2000). Mon. Weather Rev. 2003, 131, 1289–1300. [Google Scholar] [CrossRef]
Figure 1.
Paths map of five major typhoons in 2016. The dotted colored lines show the trajectories of the typhoons, and the color through each dot represents the intensity of the typhoon in levels of the Beaufort wind scale. The time interval between every two dots on the path is 12 h.
Figure 1.
Paths map of five major typhoons in 2016. The dotted colored lines show the trajectories of the typhoons, and the color through each dot represents the intensity of the typhoon in levels of the Beaufort wind scale. The time interval between every two dots on the path is 12 h.
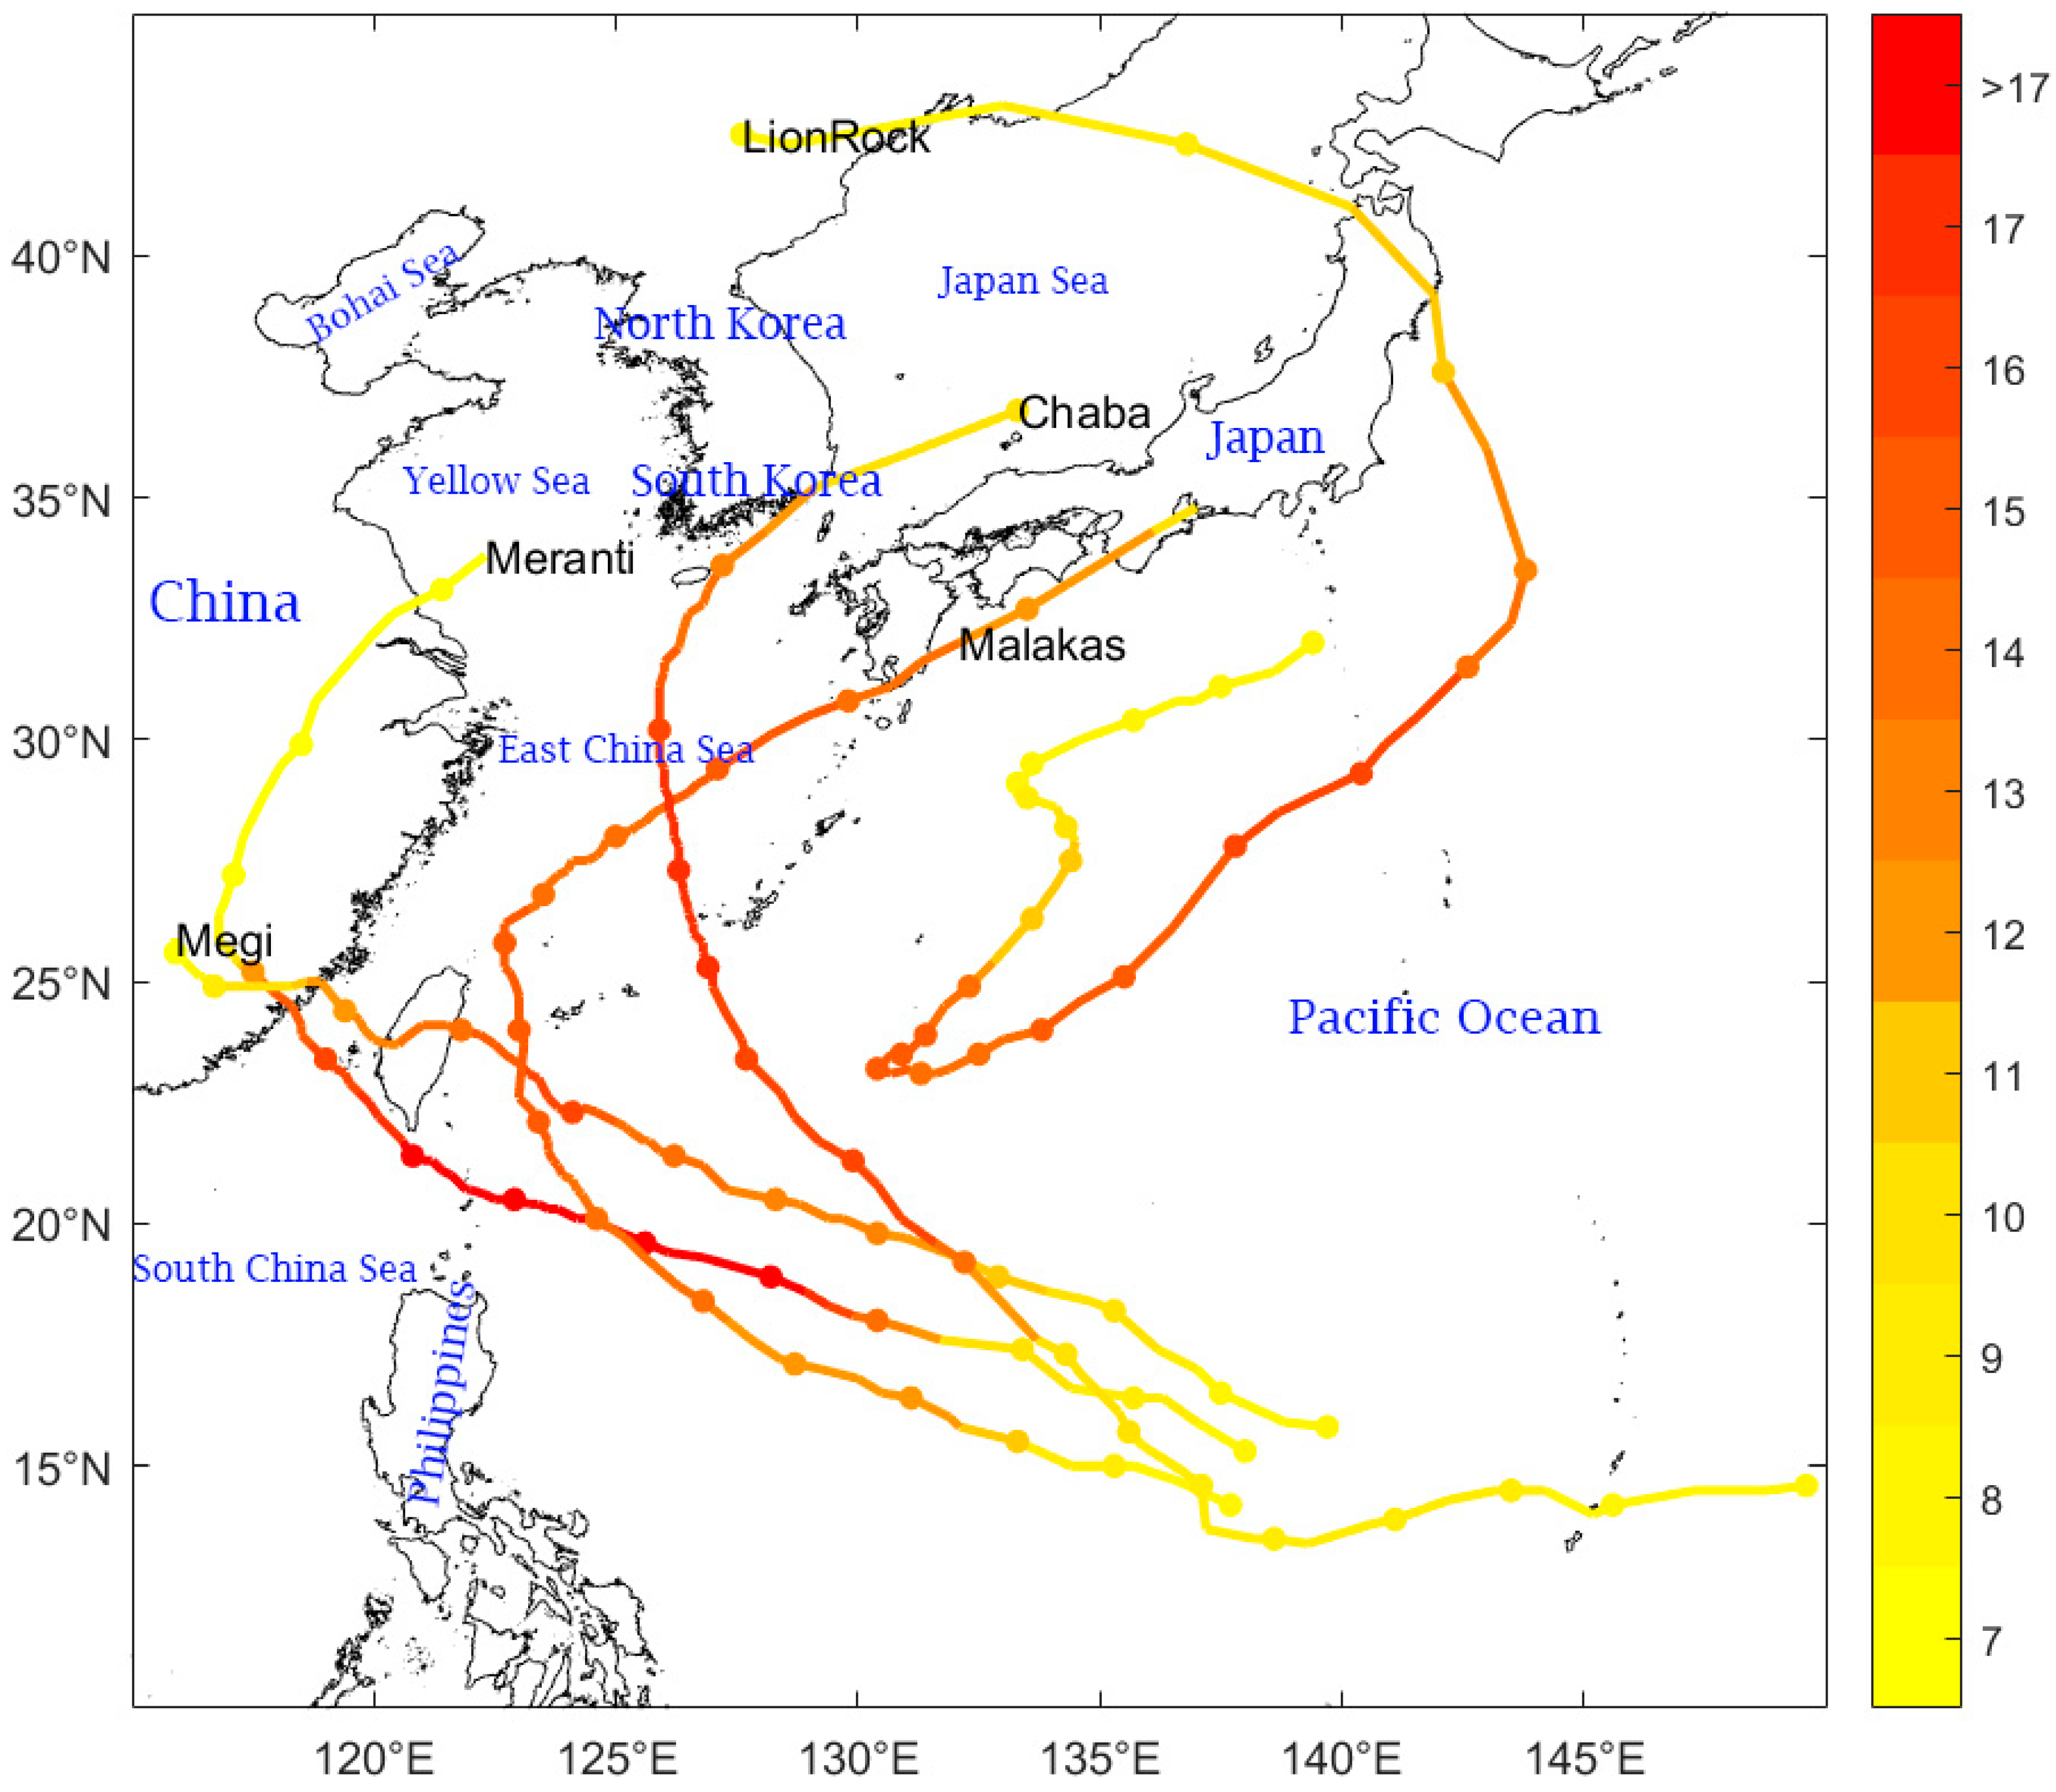
Figure 2.
Cooling of the sea surface after Typhoon LionRock passed through. The color bar represents the degree of cooling in °C. The meaning of the color of the typhoon trajectory is consistent with Figure 1.
Figure 2.
Cooling of the sea surface after Typhoon LionRock passed through. The color bar represents the degree of cooling in °C. The meaning of the color of the typhoon trajectory is consistent with Figure 1.
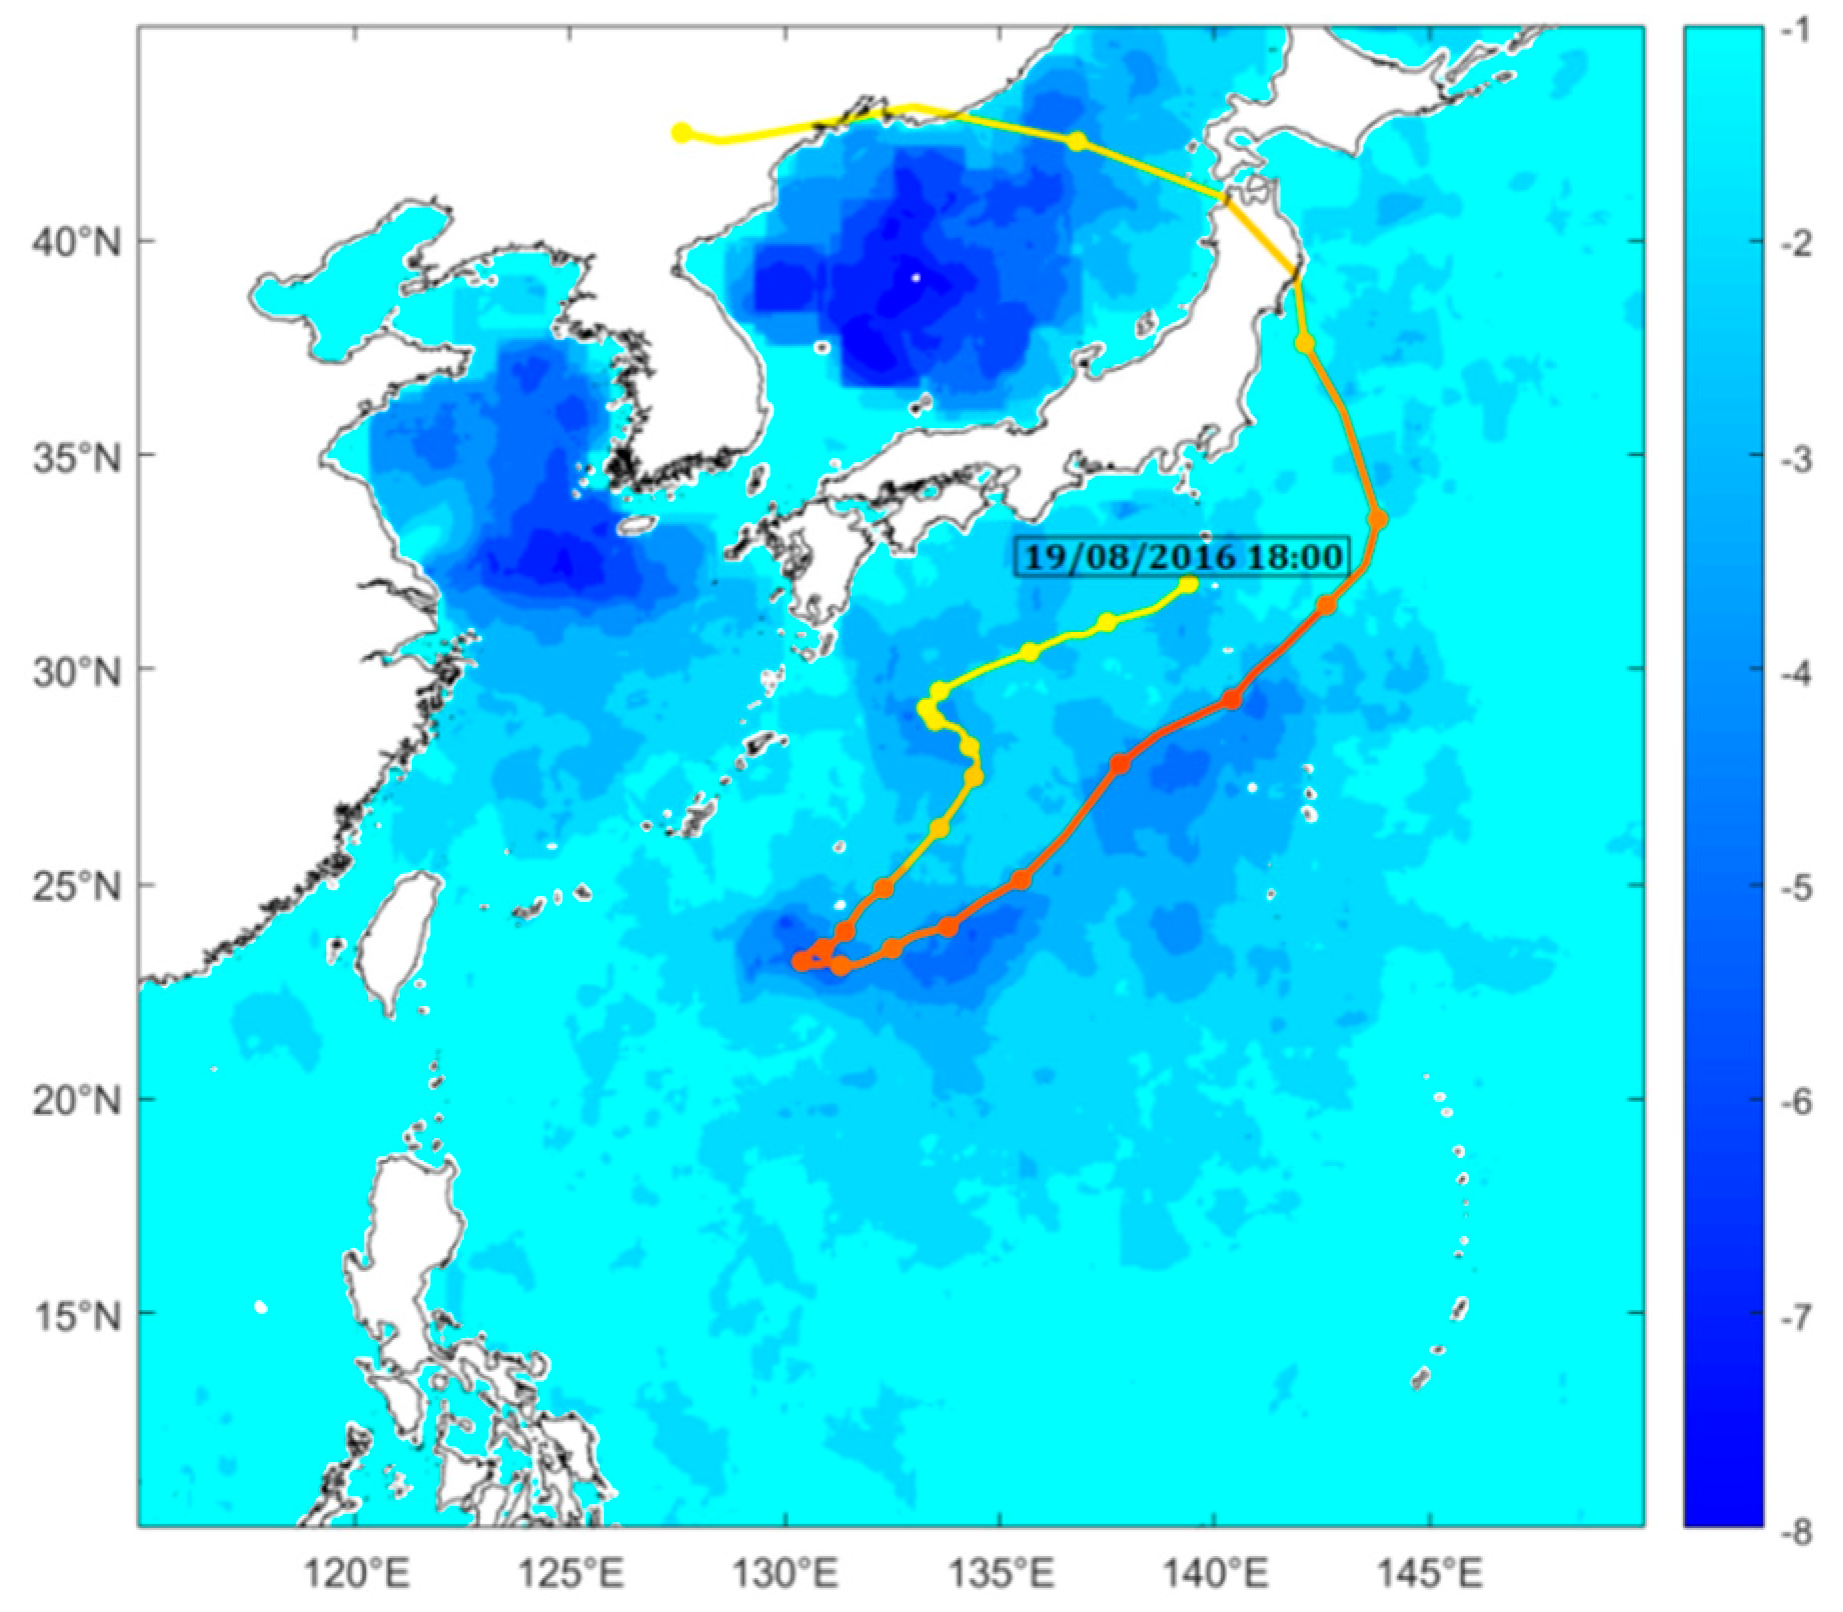
Figure 3.
Distribution of cold and warm eddies alongside the path of Typhoon LionRock (a) before the typhoon was generated (19 August 2016), (b) during the typhoon (25 August 2016), (c) during the typhoon (27 August 2016), and (d) after Typhoon LionRock passed (1 September 2016). The color on the typhoon path is consistent with Figure 1. The bold black solid line outside the blue * (cold eddy) and the red * (warm eddy) represents the boundary of that eddy. Red solid contours represent positive sea level anomaly (SLA), whereas blue dashed contours represent negative SLA or zero. The colored stars on the path represent the location of the typhoon during the day.

Figure 4.
Variations in maximum wind speed (blue solid line) and central pressure (green dotted line) of the Typhoon LionRock (upper), and change in SLA (black solid line, bottom) on the path of Typhoon LionRock. Black dotted boxes indicate where the typhoon changed dramatically.
Figure 4.
Variations in maximum wind speed (blue solid line) and central pressure (green dotted line) of the Typhoon LionRock (upper), and change in SLA (black solid line, bottom) on the path of Typhoon LionRock. Black dotted boxes indicate where the typhoon changed dramatically.

Figure 5.
(a) Map of cooling distribution after Typhoon Meranti passed. (b) Map of cooling distribution after Typhoon Malakas passed. The color bar represents the degree of cooling in °C. The color of the typhoon path is consistent with Figure 1.
Figure 5.
(a) Map of cooling distribution after Typhoon Meranti passed. (b) Map of cooling distribution after Typhoon Malakas passed. The color bar represents the degree of cooling in °C. The color of the typhoon path is consistent with Figure 1.
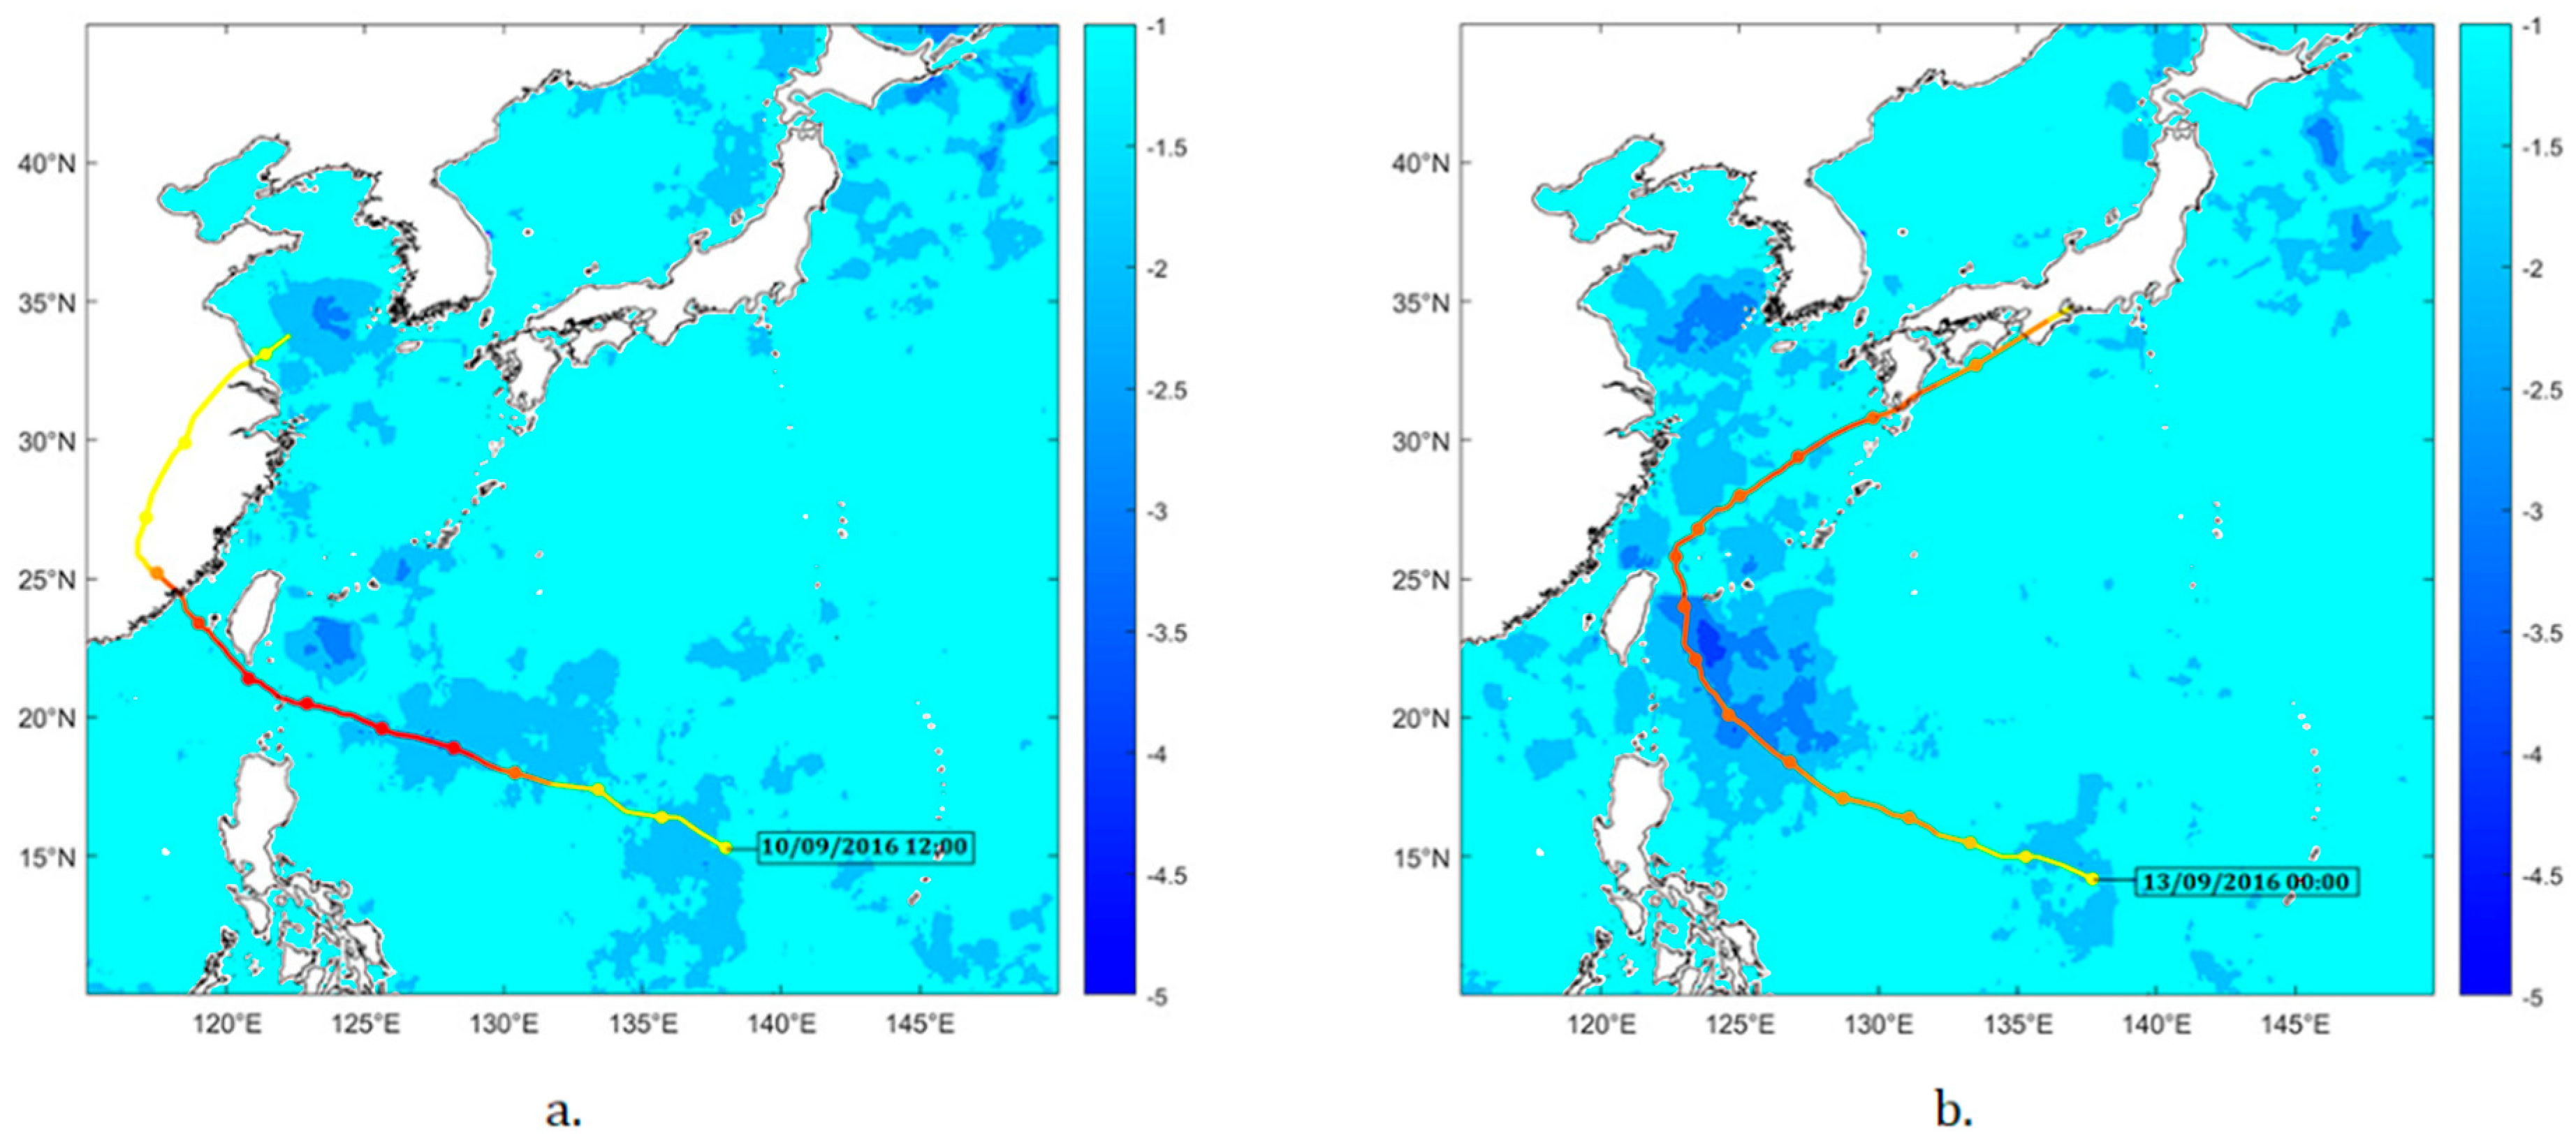
Figure 6.
Map of the cold and warm vortexes distribution caused by Typhoons Meranti and Malakas. (a) Before Typhoon Meranti passed (9 September 2016). (b) After Typhoon Meranti passed (17 September 2016). (c) Before Typhoon Malakas passed (12 September 2016). (d) After Typhoon Malakas passed (21 September 2016). The color on the typhoon path is consistent with Figure 1. The bold black solid line outside the blue * (cold eddy) and the red * (warm eddy) represents the boundary of that eddy. Red solid contours represent positive SLA, whereas blue dashed contours represent negative SLA or zero.
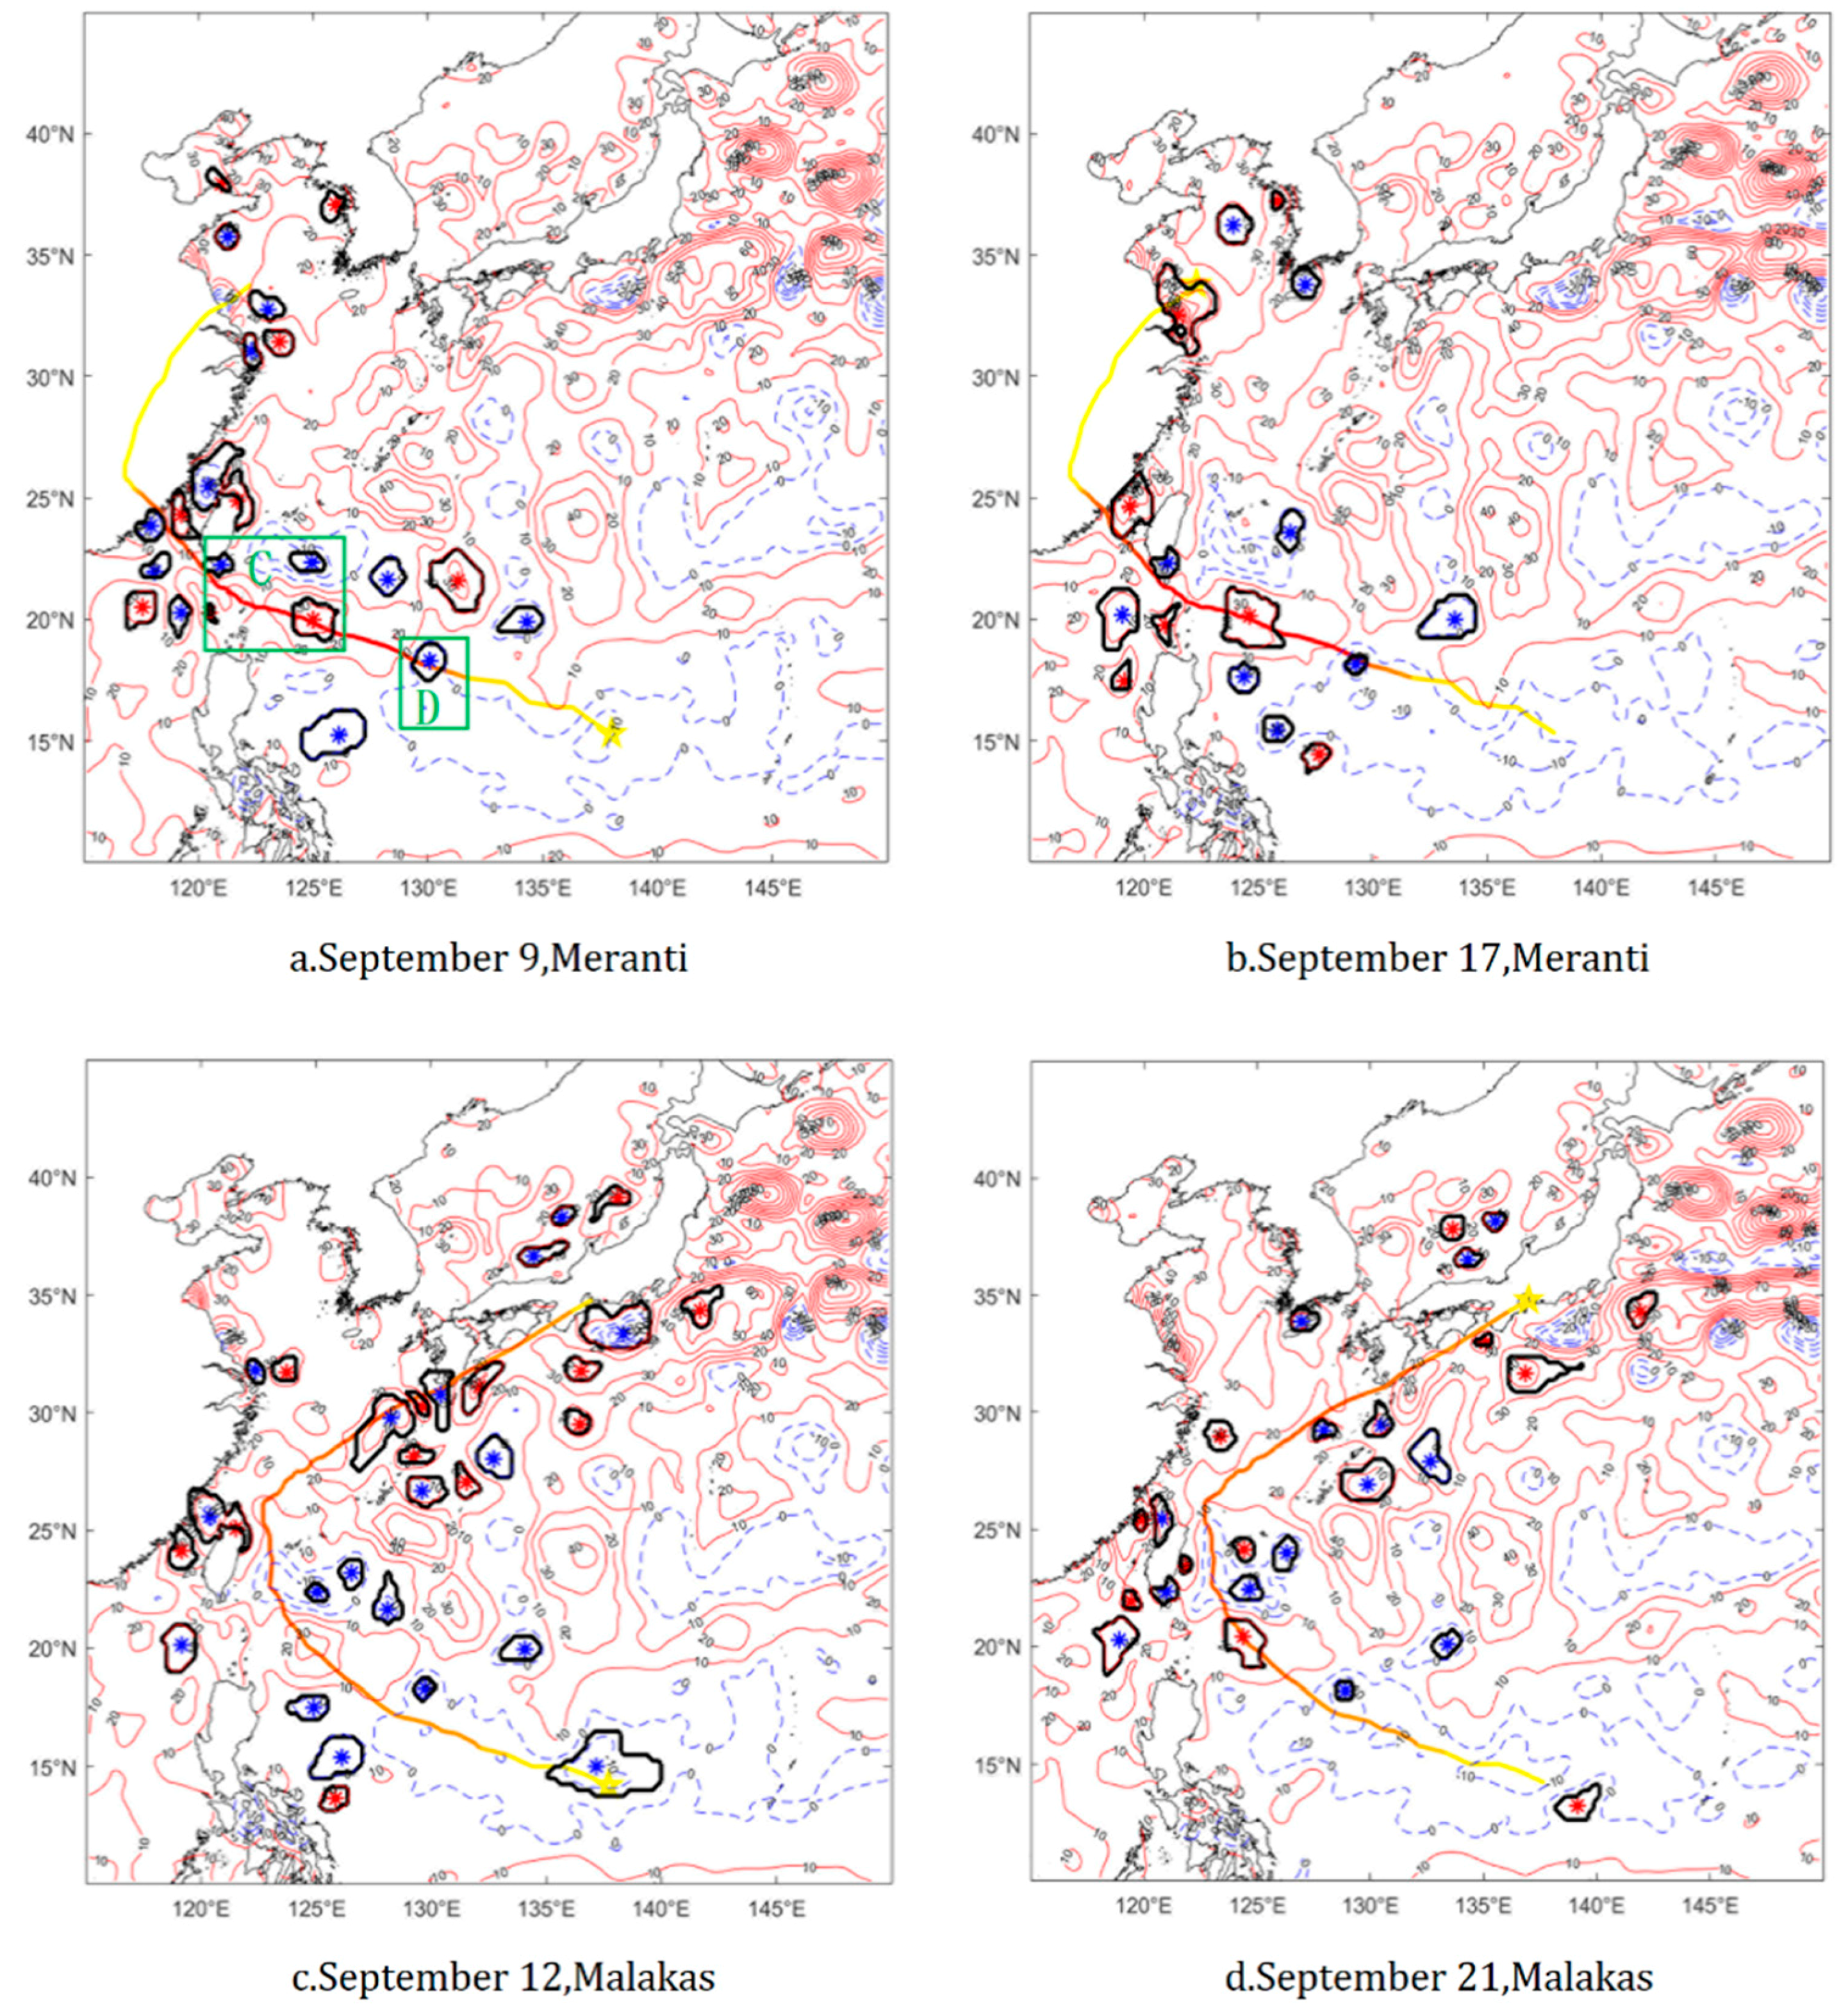
Figure 7.
Variations in maximum wind speed (blue solid line) and central pressure (green dotted line) of Typhoon Meranti (upper), and change in SLA (blue solid line, bottom) on the path of Typhoon Meranti. Black dotted boxes indicate where the typhoon changed dramatically. The part where the line suddenly disappears in the SLA is when the typhoon passed onto land.

Figure 8.
Similar to Figure 7 but for Typhoon Malakas.
Figure 8.
Similar to Figure 7 but for Typhoon Malakas.

Figure 9.
Map of cooling distribution after Typhoon Megi transit. The color bar value represents the degree of cooling in °C. The color of the typhoon path is consistent with Figure 1.
Figure 9.
Map of cooling distribution after Typhoon Megi transit. The color bar value represents the degree of cooling in °C. The color of the typhoon path is consistent with Figure 1.

Figure 10.
Map of the cold and warm eddy distribution caused by Typhoon Megi (a) before passage (22 September 2016) and (b) after passage (September 30). The color on the typhoon path is consistent with Figure 1. The bold black solid line outside the blue * (cold eddy) and the red * (warm eddy) represents the boundary of that eddy. Red solid contours represent positive SLA, whereas blue dashed contours represent negative SLA or zero.

Figure 11.
Variations in maximum wind speed (blue solid line) and central pressure (green dotted line) of Typhoon Megi (upper), and change in SLA (blue solid line, bottom) on the path of Typhoon Megi. Black dotted box indicates where the typhoon changed dramatically. The part where the line suddenly disappears in the SLA is when the typhoon passed onto land.

Figure 12.
Map of cooling distribution after Typhoon Chaba passed. The color bar value represents the degree of cooling in °C. The color of the typhoon path is consistent with Figure 1.
Figure 12.
Map of cooling distribution after Typhoon Chaba passed. The color bar value represents the degree of cooling in °C. The color of the typhoon path is consistent with Figure 1.
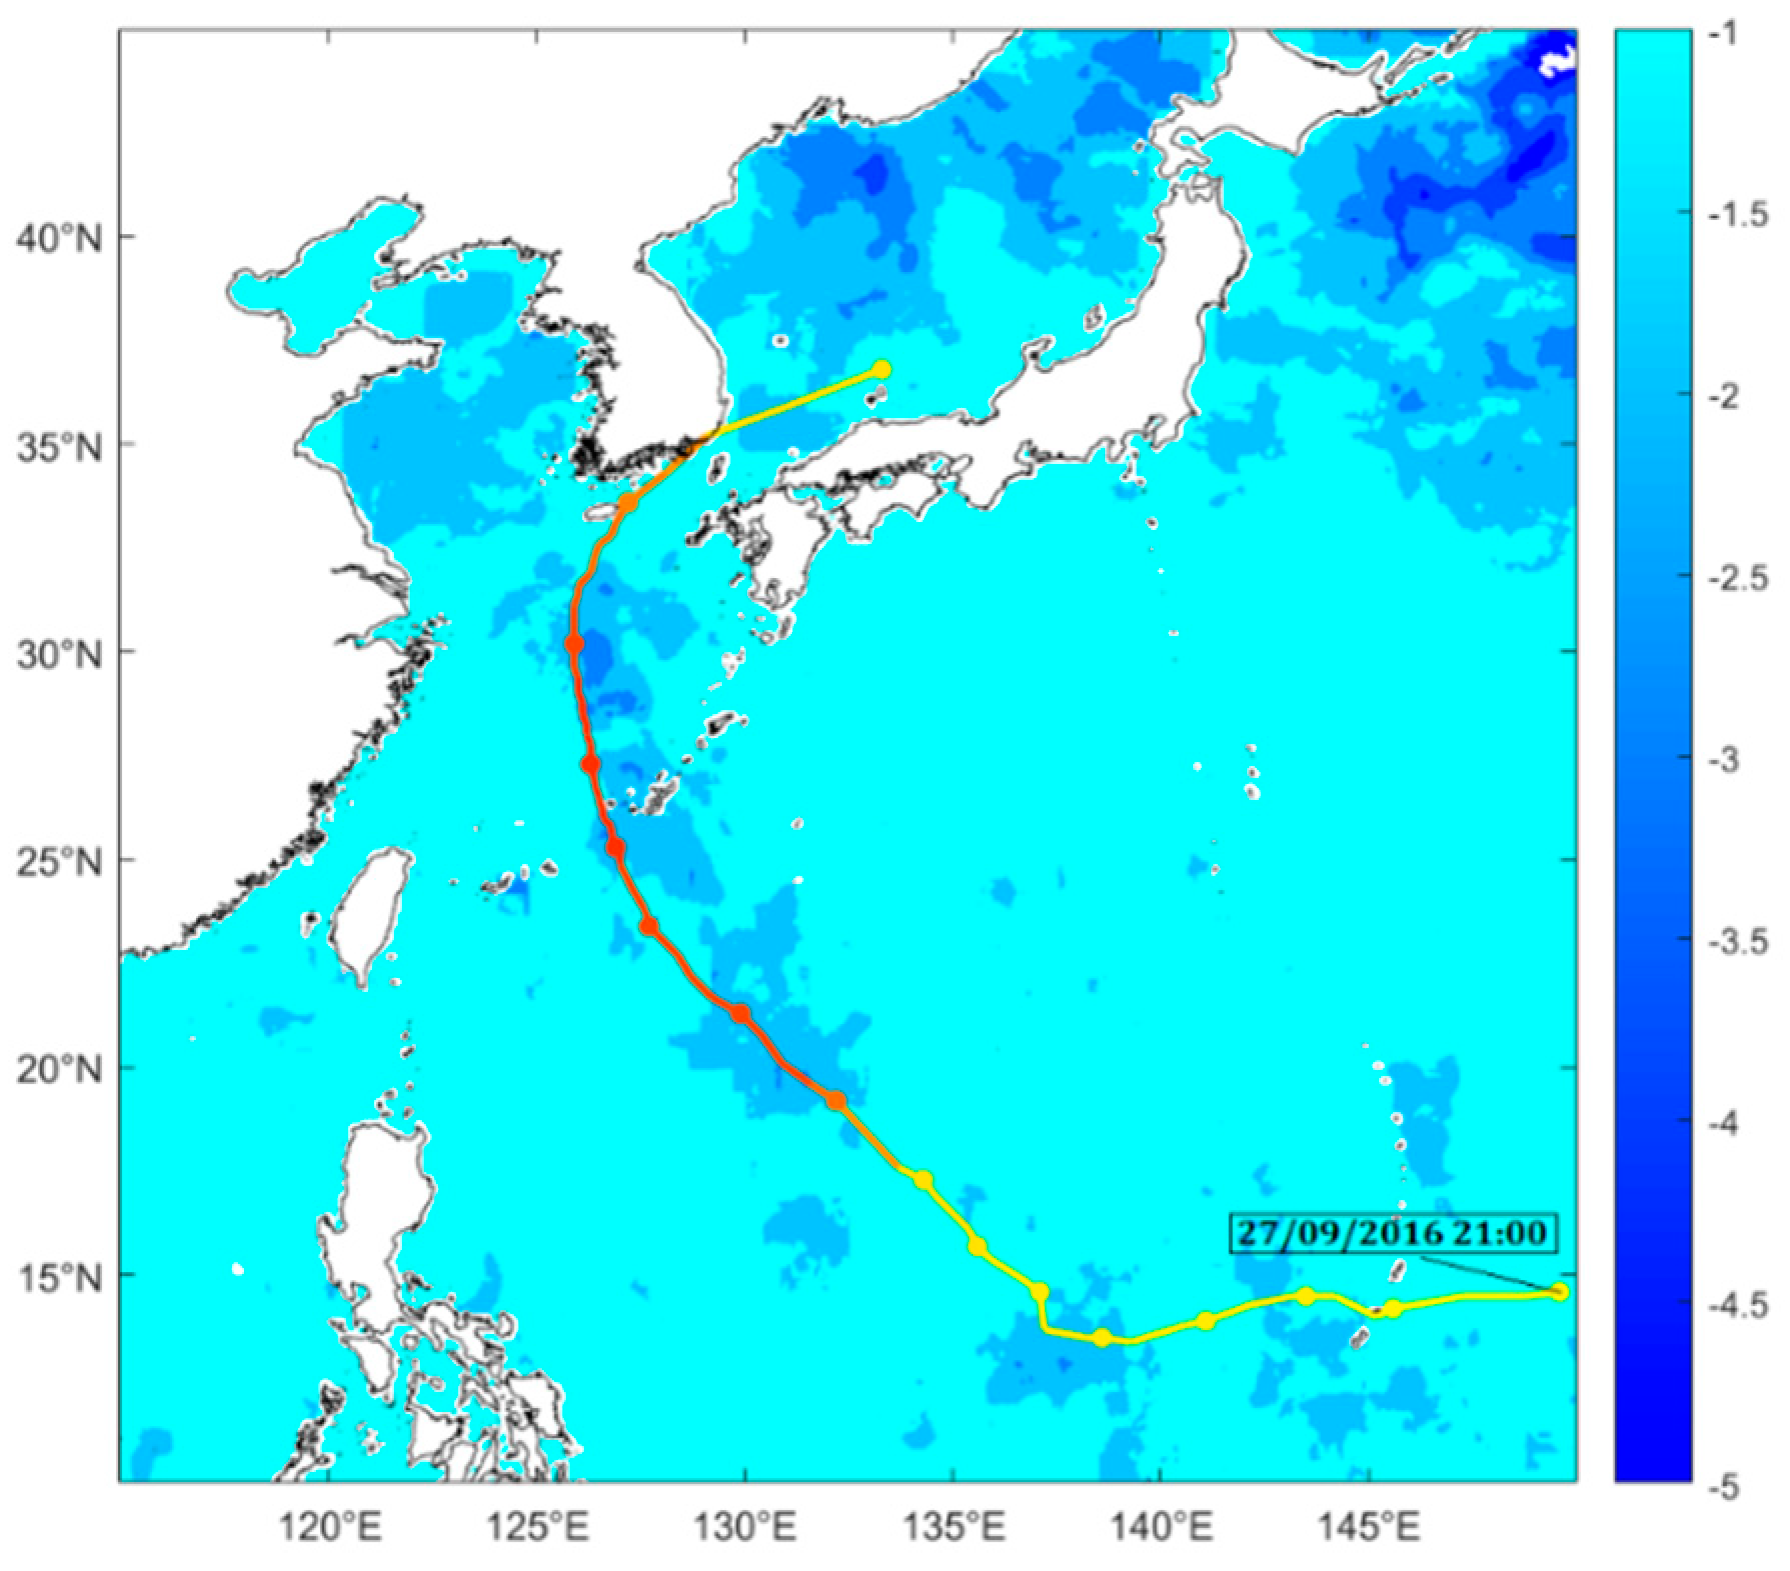
Figure 13.
Map of the cold and warm eddy distribution caused by Typhoon Chaba: (a) before Typhoon Chaba passed (27 September 2016) and (b) after Typhoon Chaba transit (6 October 2016). The color on the typhoon path is consistent with Figure 1. The bold black solid line outside the blue * (cold eddy) and the red * (warm eddy) represents the boundary of that eddy. Red solid contours represent positive SLA, whereas blue dashed contours represent negative SLA or zero.

Figure 14.
Variations in maximum wind speed (blue solid line) and central pressure (green dotted line) of Typhoon Chaba (upper), and change in SLA (blue solid line, bottom) on the path of Typhoon Chaba. Black dotted box indicates where the typhoon changed dramatically.
Figure 14.
Variations in maximum wind speed (blue solid line) and central pressure (green dotted line) of Typhoon Chaba (upper), and change in SLA (blue solid line, bottom) on the path of Typhoon Chaba. Black dotted box indicates where the typhoon changed dramatically.

Figure 15.
Ratio of local inertial period to application time of the typhoon wind-forcing. Miss values from 25 August to early 26 indicate zero translation speed.
Figure 15.
Ratio of local inertial period to application time of the typhoon wind-forcing. Miss values from 25 August to early 26 indicate zero translation speed.


Table 1.
Information about the five typhoons in 2016.
| Name | Code No. | Duration (h) | Path Type | Max Wind Speed (m/s) |
|---|---|---|---|---|
| LionRock | 1610 | 276 | SW to NE | 50 |
| Meranti | 1614 | 147 | NW (sea path) | 70 |
| Malakas | 1616 | 177 | NW to NE | 52 |
| Megi | 1617 | 135 | NW | 52 |
| Chaba | 1618 | 180 | NW to NE | 60 |
© 2018 by the authors. Licensee MDPI, Basel, Switzerland. This article is an open access article distributed under the terms and conditions of the Creative Commons Attribution (CC BY) license (http://creativecommons.org/licenses/by/4.0/).
Share and Cite
MDPI and ACS Style
Song, D.; Guo, L.; Duan, Z.; Xiang, L. Impact of Major Typhoons in 2016 on Sea Surface Features in the Northwestern Pacific. Water 2018, 10, 1326. https://doi.org/10.3390/w10101326
AMA Style
Song D, Guo L, Duan Z, Xiang L. Impact of Major Typhoons in 2016 on Sea Surface Features in the Northwestern Pacific. Water. 2018; 10(10):1326. https://doi.org/10.3390/w10101326
Chicago/Turabian StyleSong, Dan, Linghui Guo, Zhigang Duan, and Lulu Xiang. 2018. "Impact of Major Typhoons in 2016 on Sea Surface Features in the Northwestern Pacific" Water 10, no. 10: 1326. https://doi.org/10.3390/w10101326
Note that from the first issue of 2016, this journal uses article numbers instead of page numbers. See further details here.