Article

Long-Term Suspended Sediment Concentrations and Loads from a Relatively Undisturbed Agroforested Catchment in the Northwest of the Iberian Peninsula

by
M. Luz Rodríguez-Blanco
*,
M. Mercedes Taboada-Castro
and
M. Teresa Taboada-Castro
Faculty of Sciences, Centre for Advanced Scientific Research (CICA), University of A Coruna, A Coruña 15071, Spain
*
Author to whom correspondence should be addressed.
Water 2018, 10(10), 1302; https://doi.org/10.3390/w10101302
Submission received: 8 June 2018 / Revised: 23 August 2018 / Accepted: 19 September 2018 / Published: 21 September 2018
(This article belongs to the Special Issue Watershed Hydrology, Erosion and Sediment Transport Processes )

Abstract

:
The suspended sediment dynamics in small catchments are difficult to estimate accurately because they result from the coupling of complex processes occurring at different scales. In this study, the dynamics of suspended sediment concentrations (SSC) and loads were assessed in an agroforested humid catchment in NW Spain, based on a long-term rainfall, discharge and suspended sediment dataset (12 hydrological years) from high-frequency monitoring. The results highlight the episodic nature of sediment transport in the study area, given that about 78% of SS was exported over 10% of the study period. The SS transport was related to runoff generation and flooding, although sediment availability also played an important role in SS transport. The SS load was mainly driven by high-magnitude rainfall events, while intense rainfall episodes generated high SSC peaks. The mean annual suspended sediment yield was relatively low from a quantitative stand point (10 Mg km−2 y−1); however, during 11% of the monitoring, SS concentrations exceeding the threshold threatened surface water quality (Freshwater Fish Directive 78/659/EEC and Directive 75/440/EEC), mainly during runoff events, indicating the need to adopt management practices in order to reduce or mitigate sediment loss during such episodes.

1. Introduction

In recent decades, one of the main environmental problems is considered to be soil erosion and the subsequent sediment transfer to streams and oceans, and this is determined by a large number of complex natural processes strongly influenced by human activities, such as agriculture, urbanization, deforestation, etc. [1,2]. These activities can supply excessive suspended sediment (SS) to the water course, which causes reservoir siltation, degradation of aquatic ecosystems and reduces water quality by carrying sediment-associated pollutants, which may lead to higher drinking water treatment costs [3,4,5,6]. Soil erosion can be the major factor increasing the SS yield, so in the last few decades, there has been a growing interest in understanding the main drivers of soil erosion and its impact on the degradation and productivity of land and water resources. As a result, the soil erosion processes and the measures taken to reduce soil loss, the effect of land use on sediment yield, SS dynamics, reservoir sedimentation and the ecological aspect related to SS transport have been extensively studied in catchments [7,8,9], but determining the degree to which SS yield from catchments can be attributed to soil erosion in a specific area of the catchment is challenging.
Most of the studies focusing on SS dynamics have been conducted in larger catchments [5,10,11], although, with these, it is difficult to relate the SS dynamics observed to specific controlling factors, such as hydro-meteorological conditions, geology or land use and management. On the contrary, fluvial SS transport has been studied to a lesser extent in small catchments, even though they have been recognized as the most adequate systems to gain an understanding of the specific processes controlling SS transport [12,13,14,15]. Furthermore, most of these are often short-term studies with a low-frequency of data acquisition [6,11,12,13], which makes it difficult to interpret the SS temporal dynamics and trends and identify sediment sources, due to the high variability of SS [12,13]. Therefore, long-term datasets (>10 years) are crucial to understand the dynamics controlling soil erosion and sediment transport [16,17]. Most of the research in small catchments was carried out in areas with intensive agriculture [13,14] and Mediterranean or tropical climates [15,18,19]. Only a few SS studies have been conducted in Atlantic regions [13,20,21]; thus, there is an evident need for information on the temporal dynamics of SS in Atlantic rivers, particularly in Southern Europe.
Headwater catchments are of particular interest, because they are highly vulnerable to global change [22,23,24]. Although this type of environment is characterized by displaying low SS concentrations, their ecosystems are vulnerable and can be adversely affected by even small increases in SS concentration [25,26]. Therefore, for catchment management and to reduce sediment delivery to water bodies, a reliable determination of SS patterns and knowledge of SS sources within the system is needed. Given the importance to the preservation of aquatic ecosystems of headwater catchments as a water source for downstream reaches and ecological habitats, this study aims to contribute to a better understanding of fluvial transport of SS from headwater catchments under humid conditions by using a high-temporal scale rainfall, discharge and SS data from a small headwater catchment of the Mero basin, located in NW Spain. More specifically, the objectives were to: (i) investigate the dynamics of SS concentrations and loads at different time scales; and (ii) identify the potential driving forces in the variability of the SS response. Information concerning SS transport in this type of environment is limited, due to the difficulty of measuring SS concentrations with sufficiently high frequency, so it is expected that the results will enable a detailed explanation of SS transport and its potential driving forces in headwater catchments in humid environments in the Atlantic region.

2. Materials and Methods
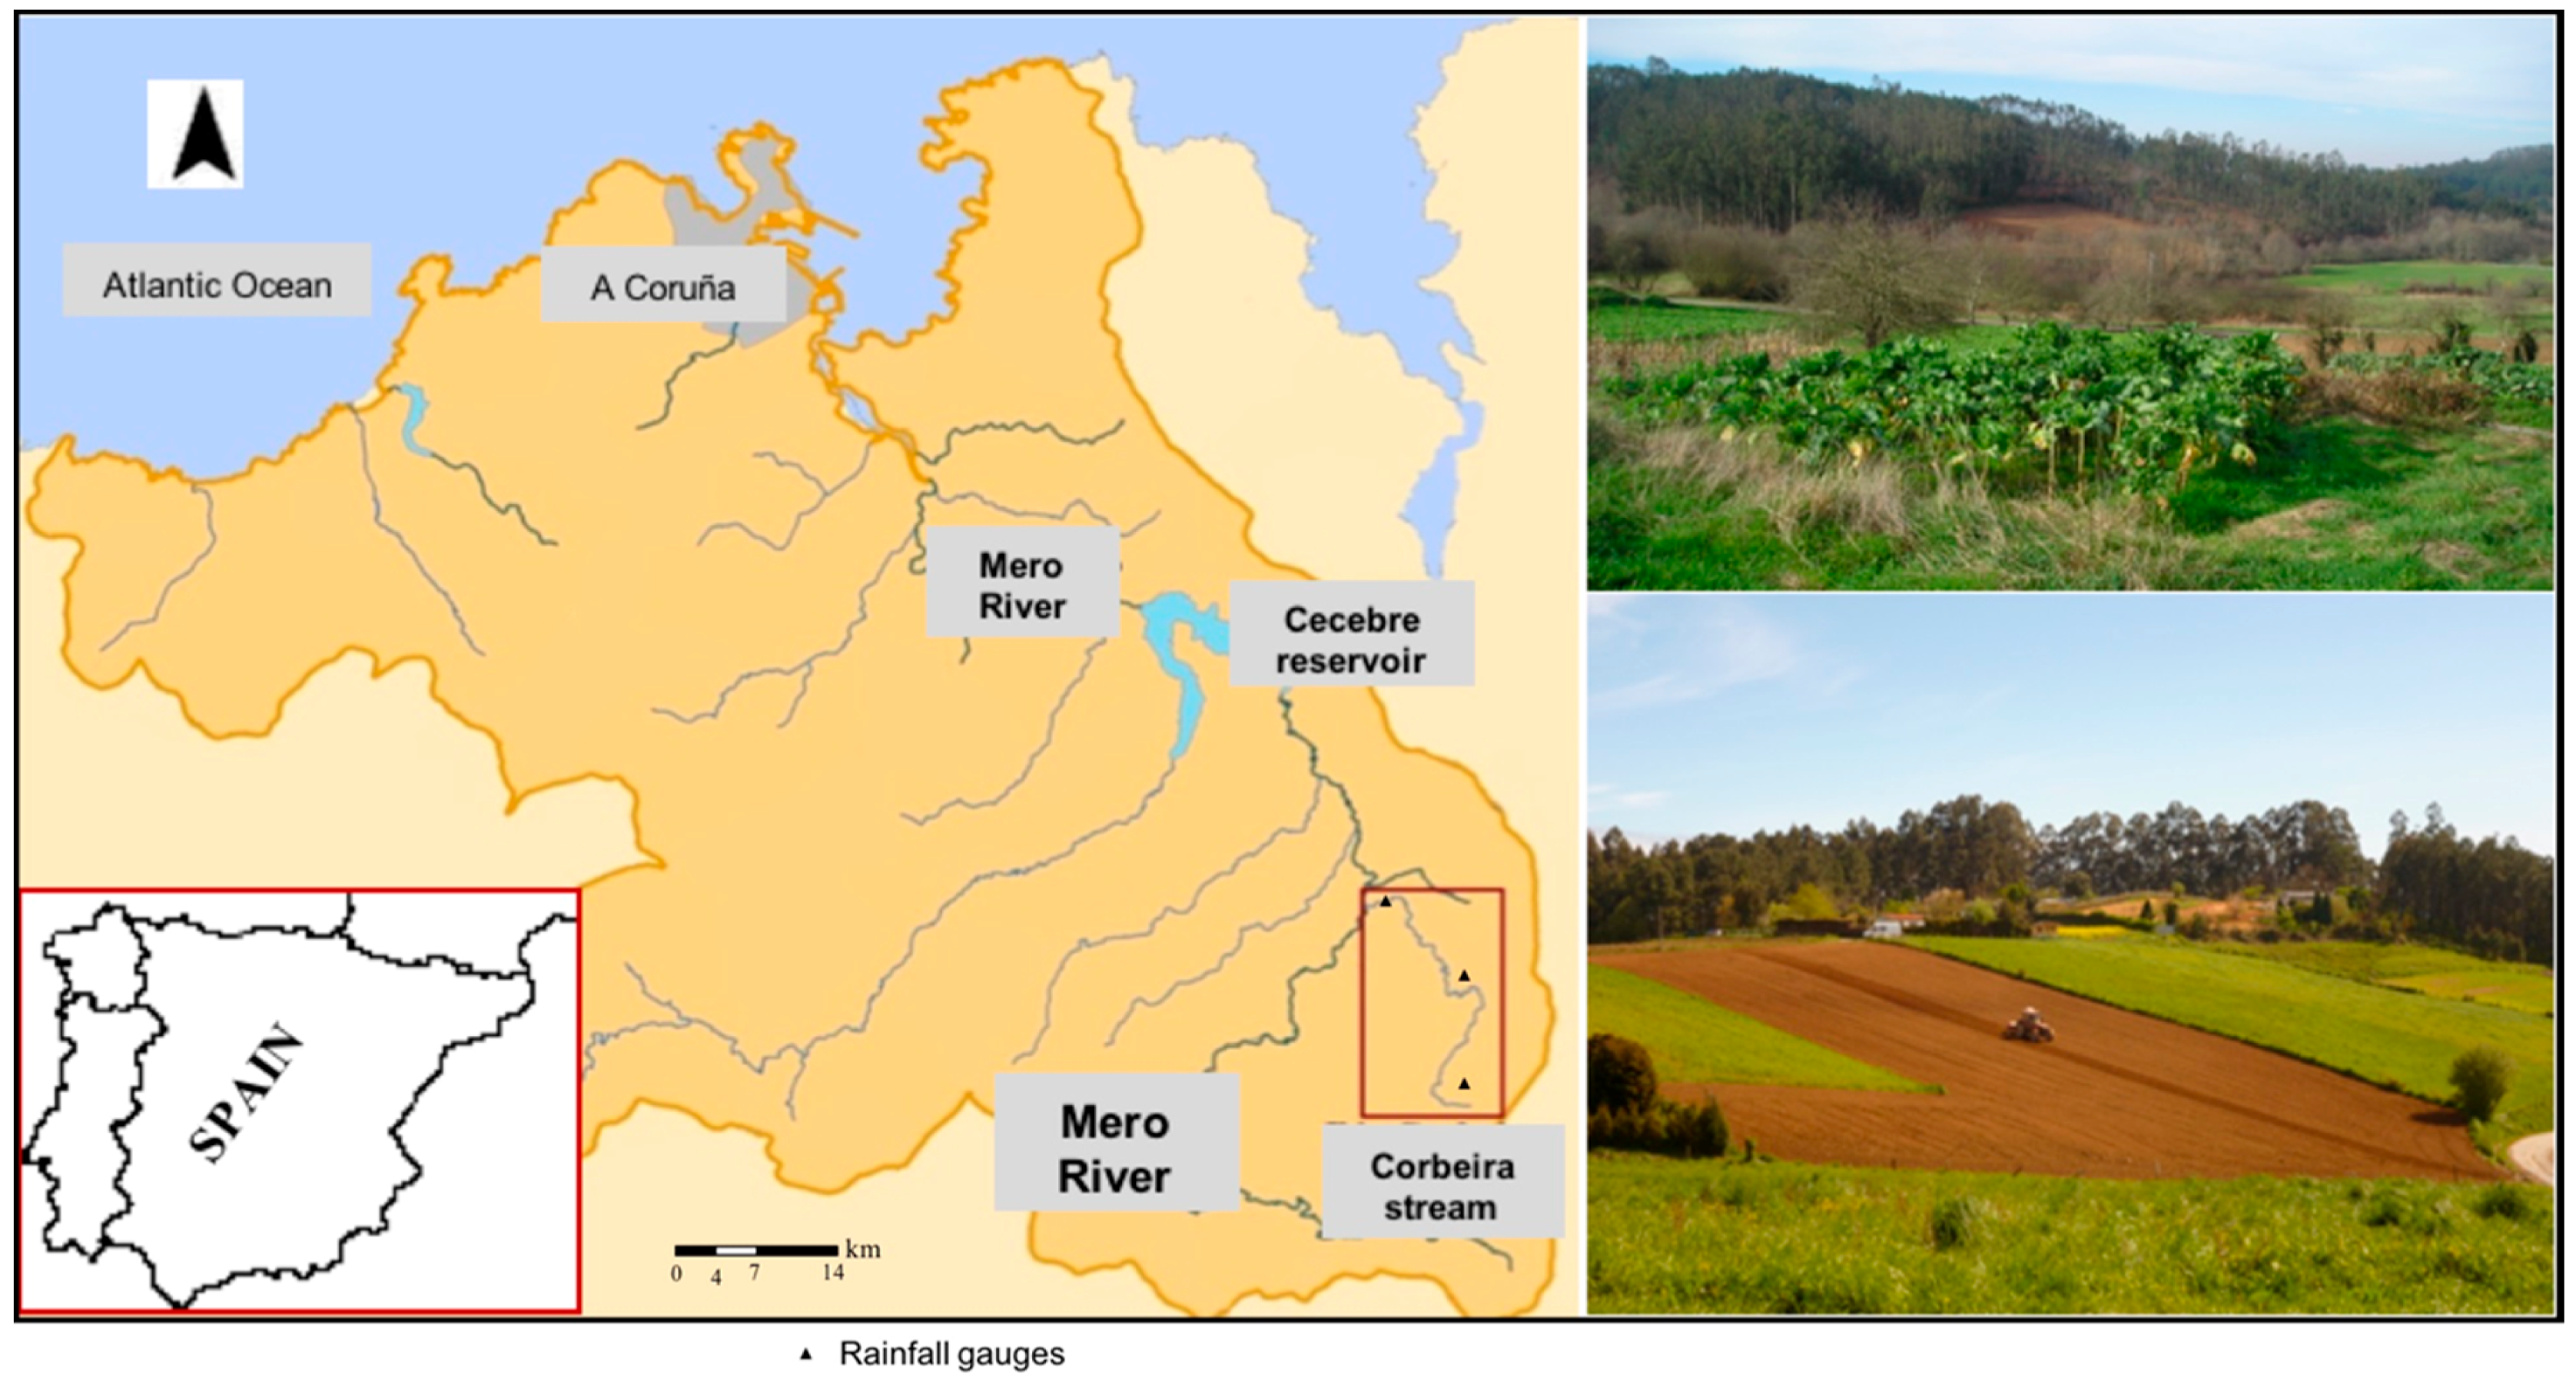
2.1. The Study Area

The study area is the Corbeira catchment, which covers an area of 16 km2 and is located in the headwater area of Mero basin (Figure 1) at an altitude of 60–470 m above sea level. The climate, which is uniform over the catchment area, is temperate and humid, with a mean annual rainfall of 1071 mm (1983–2017) occurring mainly from October–March and an average annual temperature of 13.1 °C. The topography is steep with a mean slope of 19 m km−1. The bedrock is composed of basic schist of the Órdenes Complex [27], and the prevailing soil classes are Umbrisols and Cambisols [28]. The soils are relatively deep with silt and silt loam texture and acid pH. The content of organic matter in the upper layer of soil ranges between 4.4% and 10.5%. The landscape is dominated by forest (65%), mainly commercial eucalyptus and pine plantations, and pastures (26%), while the remaining area is covered by impervious areas (5%) and cultivated land, mostly maize and winter cereal. The tillage is conventional and frequently follows the maximum slope and field length. Other soil management practices, such as the dates for planting and harvesting, and fertilization rates are typical for the area (see for example [29]). In late winter, the soil is ploughed and then left bare until spring when the soil is tilled for planting maize. Following the maize harvest (September/October), the fields are either left un-tilled until the late winter (often forage maize monoculture) or tilled in autumn for sowing winter cereal. Note that, during the study period, no important changes in land use occurred in the catchment. Detailed information on the catchment and its hydrological behavior can be found in [29,30].

2.2. Data Acquisition and Analysis

This study is based on a high-resolution database of rainfall, discharge and suspended sediment concentrations in the Corbeira catchment. Rainfall was monitored at 10-min intervals using three tipping-bucket rain gauges (0.2-mm resolution) distributed across the catchment, and the mean rainfall in the catchment was determined by the Thiessen method [31]. Discharge was calculated using a rating curve from stream stage data, which was monitored by a differential pressure transducer sensor (ISCO-720, Teledyne ISCO, Lincoln, NE, USA) connected to an autosampler recording at a 10-min time step.
The SS was monitored by both manual and automatic sampling. Water samples taken manually were collected bi-weekly and mostly during baseflow conditions, while automatic water samples were obtained during runoff events by means of an ISCO 6712-FS (Teledyne ISCO, Lincoln, NE, USA) autosampler with 24 bottles of 1-L sampling capacity. The water samples were collected at the midpoint of the channel cross-section and considered to be representative of the average, because of the approximately uniform distribution of SS concentration throughout the cross-section. The sampler was triggered by a specific threshold, generally 2–3 cm above the water level before the rainfall event. The sampling frequency was set at fixed intervals (1–8 h) and triggered manually prior to incoming rainfall events, depending on the weather forecast for the coming event and personal experience from past episodes. After each runoff event, field visits were carried out to check the monitoring equipment, collect the water samples from the autosampler and obtain information on soil erosion features (sheet erosion and rill development) in the cultivated land, the most important erosion-prone areas in the study catchment.
Suspended sediment concentrations (SSC) were determined gravimetrically by vacuum filtration of 100 mL of sample through a pre-weighted 0.45-μm filter, followed by oven drying at 105 °C for 24 h and re-weighing with a high precision balance.
The data used in this study were collected from October 2004–September 2017. This long-term period presented a complete meteorological record and continuous stage stream record, with only a few gaps (in the order of hours) and a large SS database complied during baseflow and runoff conditions. Three hundred and seventy-eight events occurred in the monitoring period, most of which were correctly sampled for SS, except ten events during which technical problems caused sampling interruptions.
Discharge data were used in combination with SS measured concentrations to compute SS load, which was calculated as the sum of the product of the mean concentration of adjacent samples multiplied by the flow during the interval between both samples, following the methodology recommended by Walling and Webb [32].

3. Results and Discussion

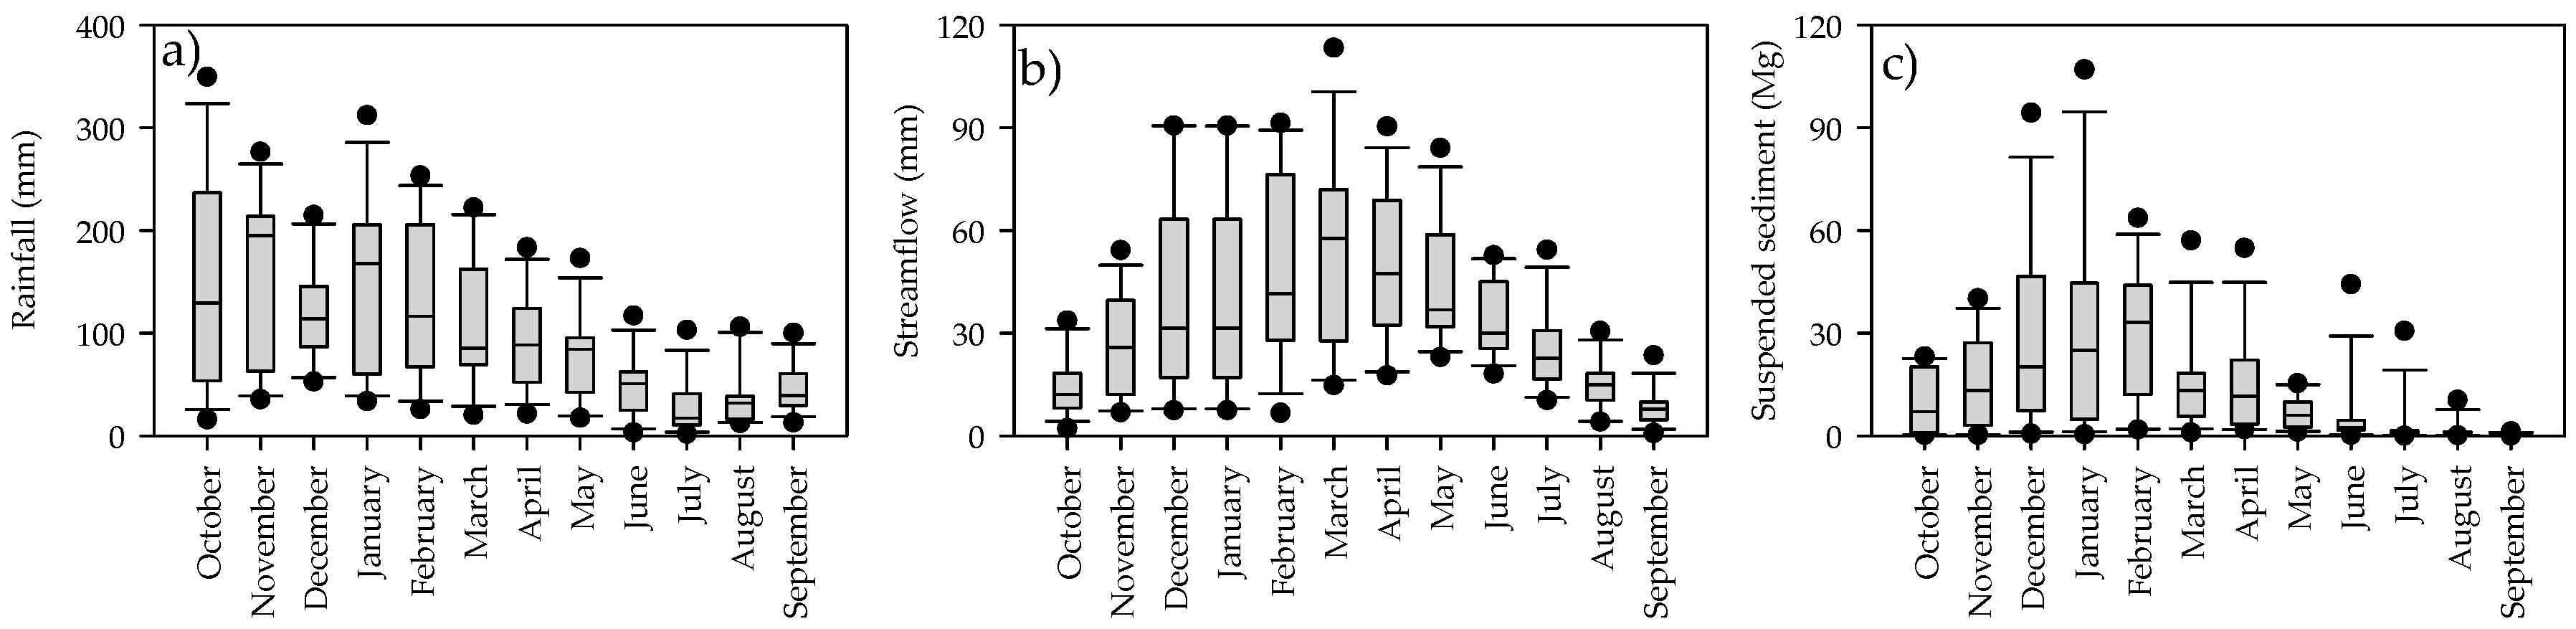
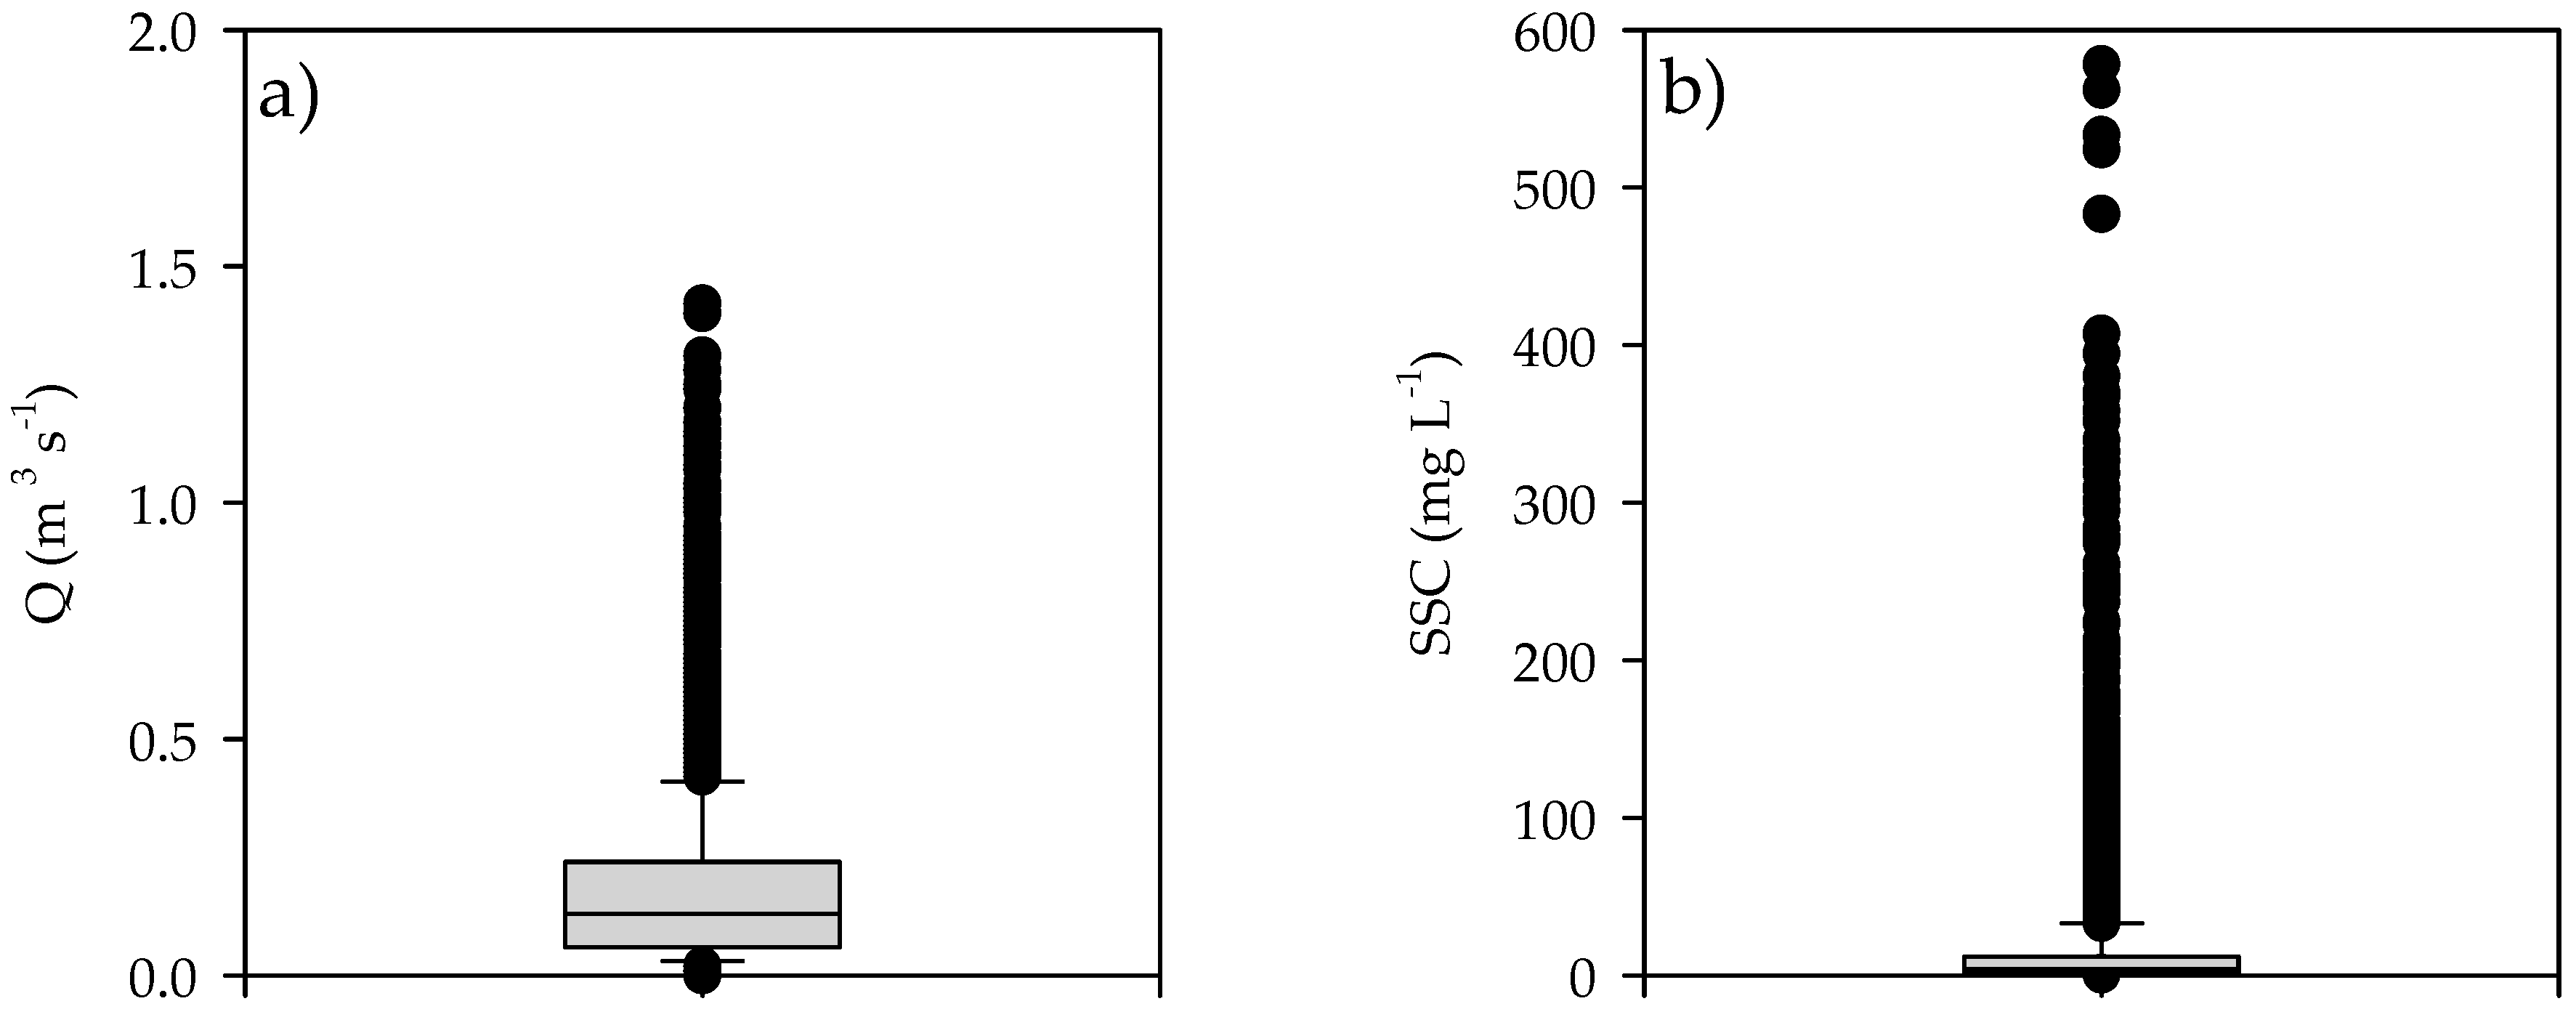
3.1. General Characterization of the Hydrological Context of the Study Period

During the hydrological years 2004/2005–2017/2018, annual rainfall ranged between 809 and 1483 mm, with a mean value of 1141 mm (standard deviation ± 209 mm) (Table 1). The hydrological year 2011/2012 was the driest, with rainfall almost two standard deviations below the mean (Table 1). In contrast, the rainfall in the wettest year was more than one standard deviation higher than the mean. For the same period, streamflow ranged from 225–544 mm, with a mean annual runoff coefficient of 31% (Table 1). This low value of the runoff coefficient (RC) in the study area is due to the high capacity for water storage of soils in the study area (estimated at 30% [30]).
With regard to seasonal distribution, most rainfall occurred during autumn, followed by winter and spring, with 37%, 34% and 19%, respectively (Figure 2). Due to this pattern of precipitation, intra-annual flow variability was also high, with the greatest values being registered in winter and spring (41% and 28%, respectively) once catchment water reserves were refilled, and rainfall more than compensated for evaporation losses [30,33]. The largest records were found in February and March, gradually reducing to minimum values in September (Figure 2).

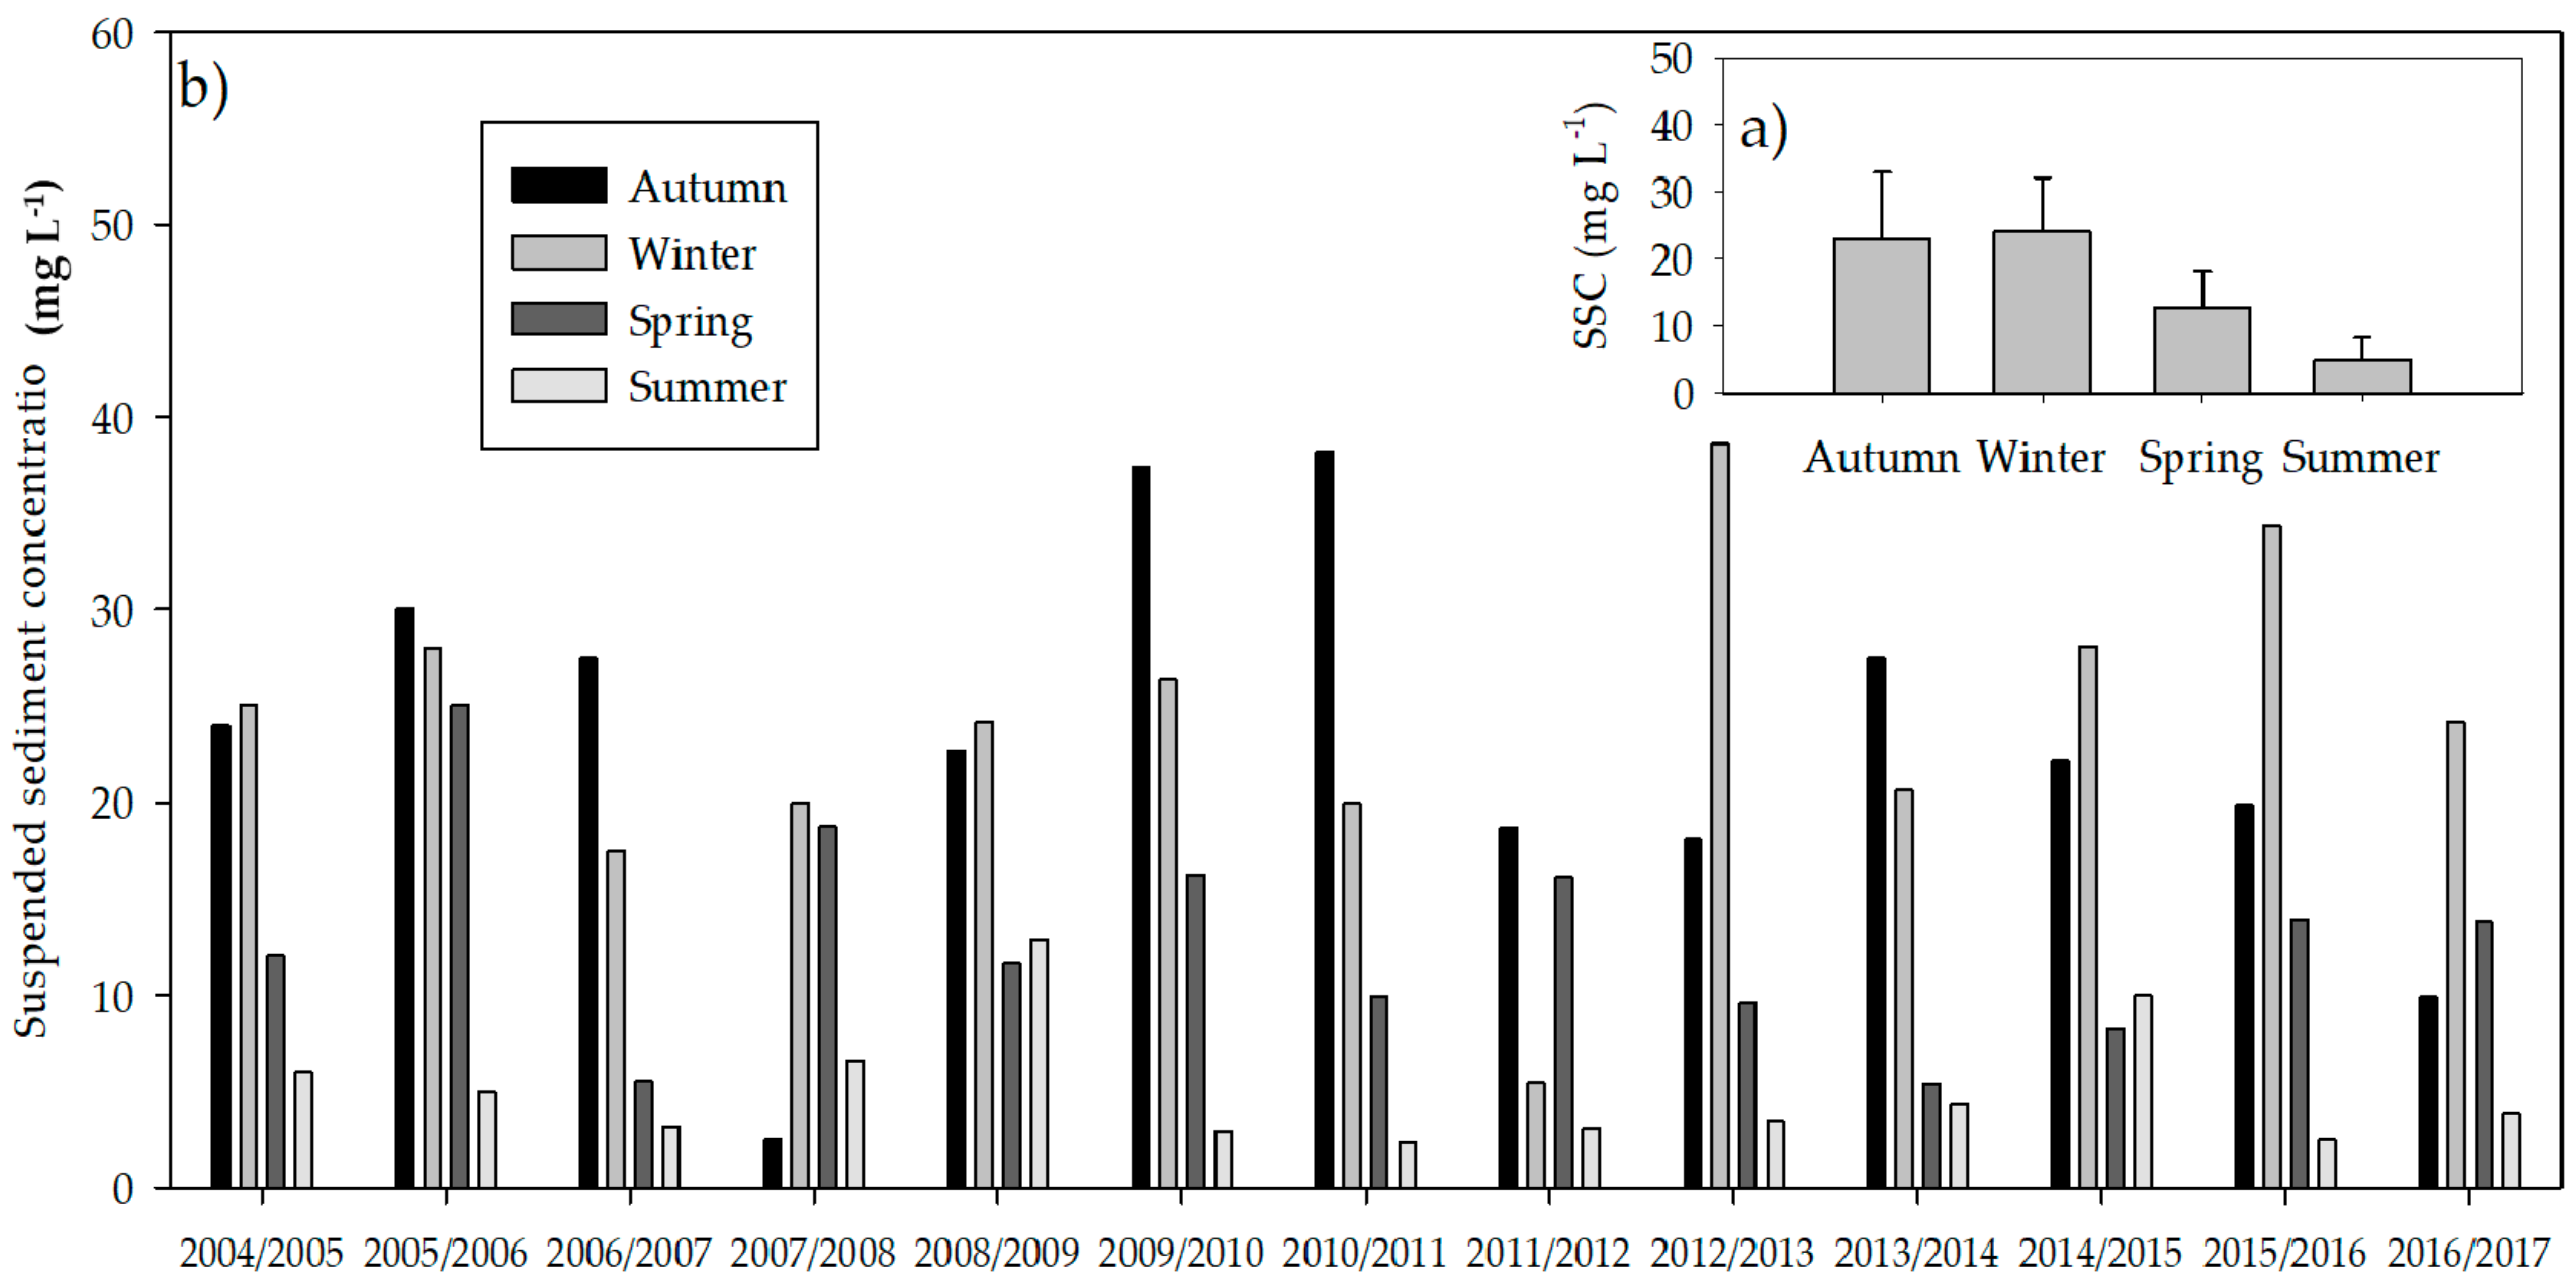
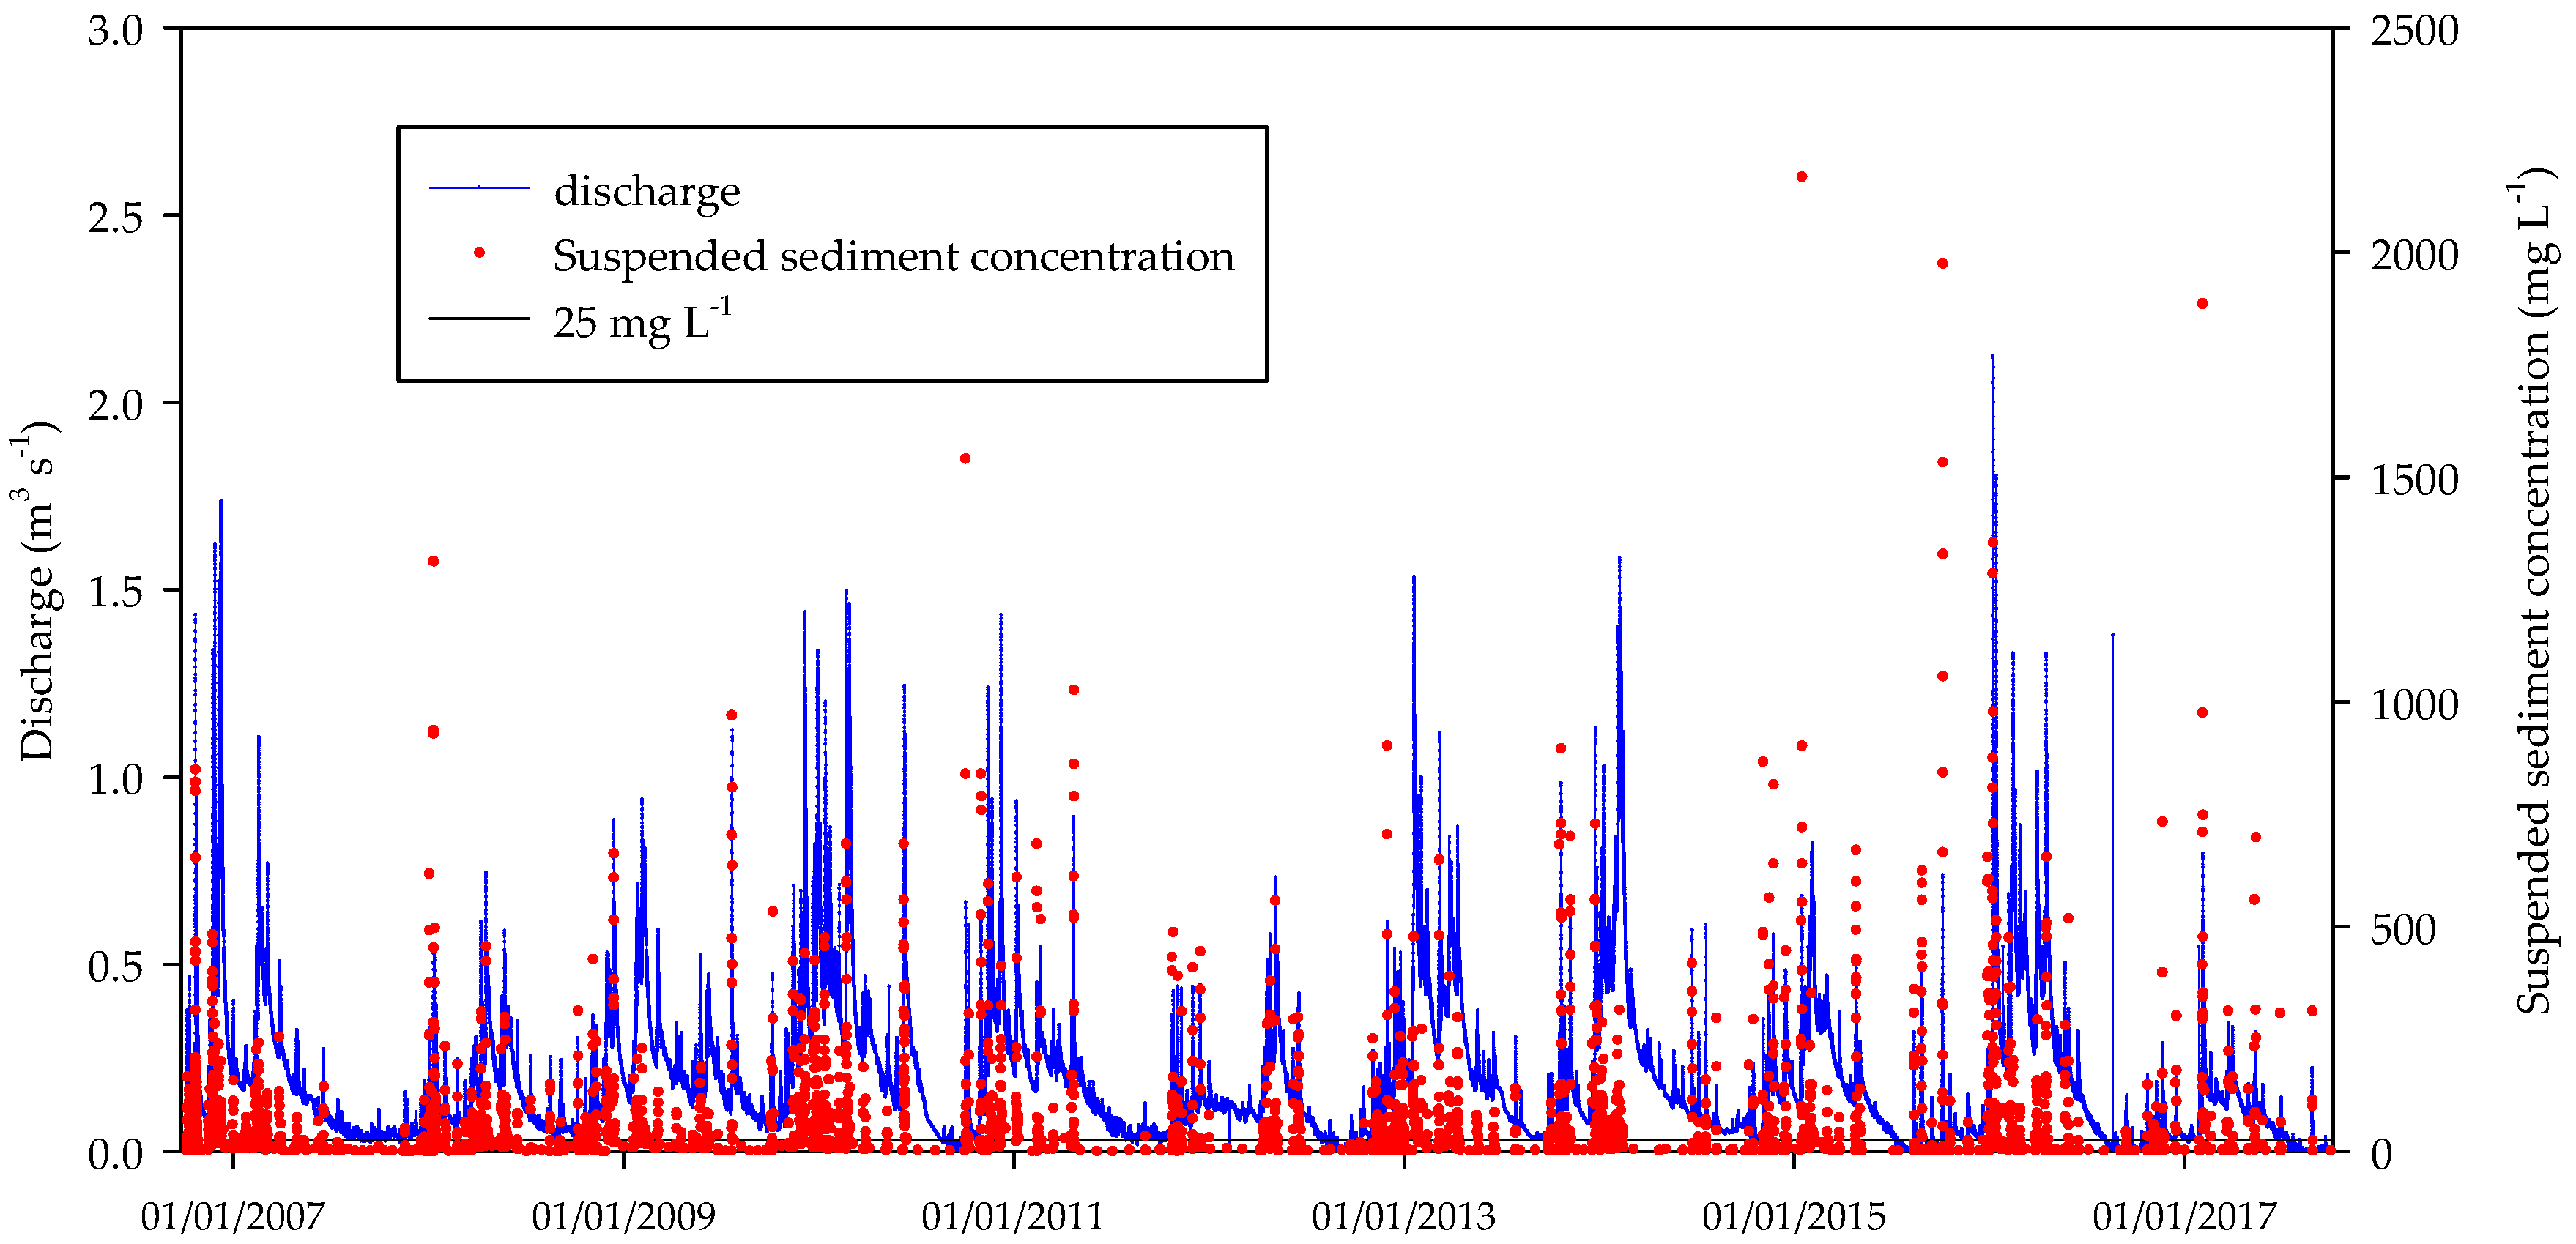
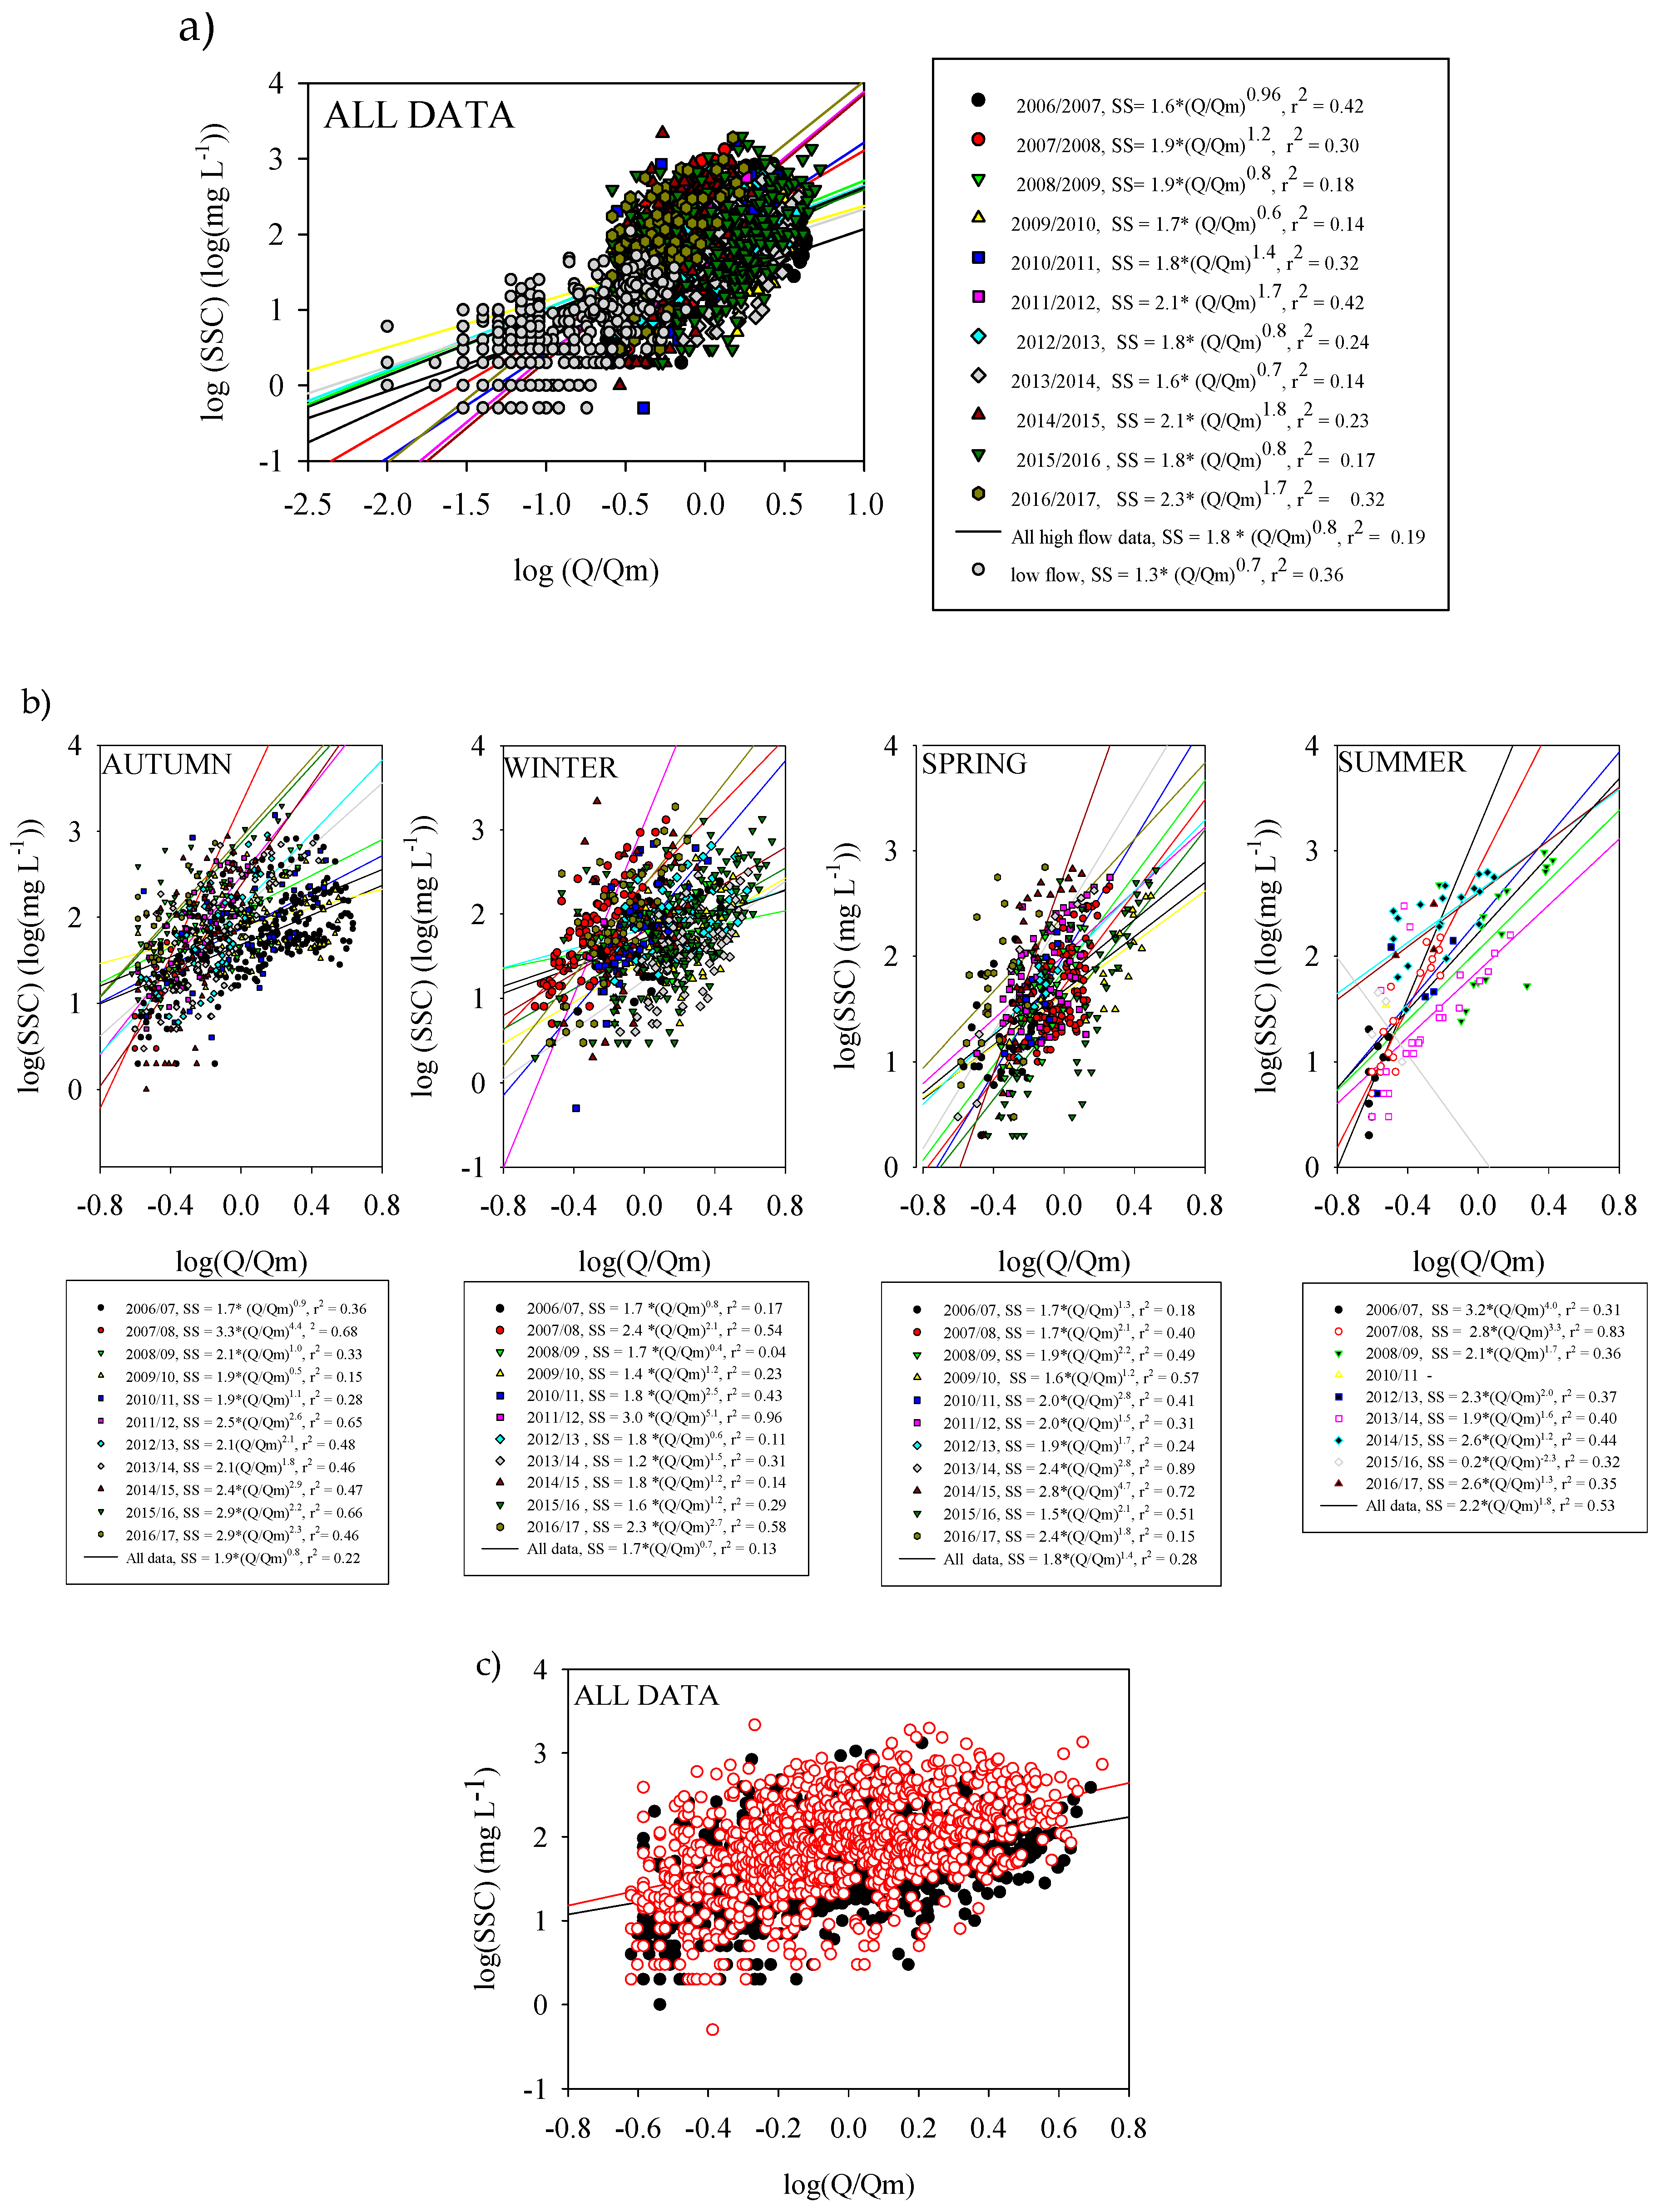
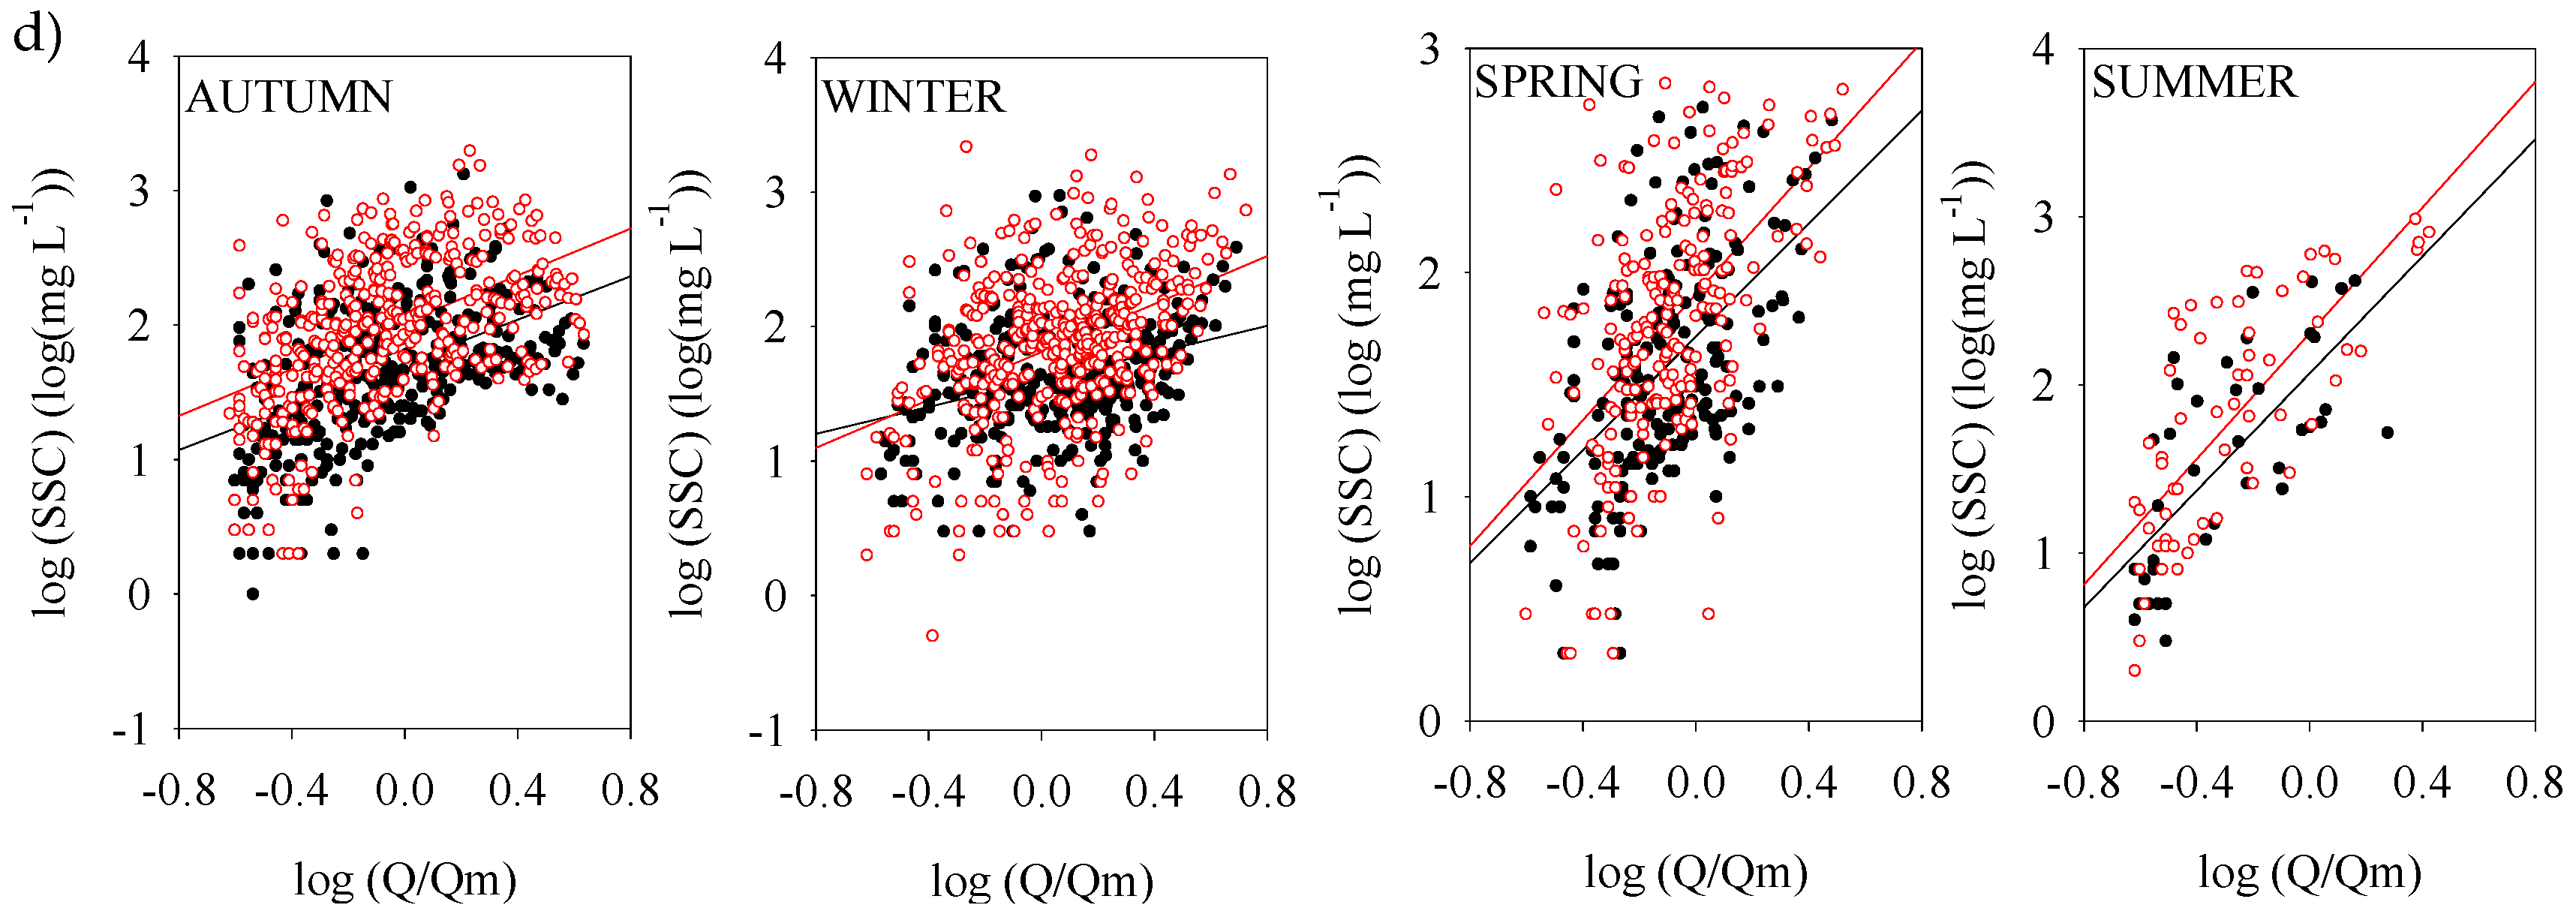
3.2. Dynamics in Suspended Sediment Concentrations

During the study period, the annual mean daily SSC was 16 mg L−1 and varied from 11–21 mg L−1 (Table 1). The hydrological year 2011/2012 was quite dry (almost two standard deviations below the mean; Table 1), and consequently, the streamflow was very low, which mainly explains the low mean SSC. In contrast, there was a high streamflow in the hydrological year 2009/2010, which may justify the highest SS values returned.
Regarding the seasonal pattern of SSC, the highest mean daily concentrations were obtained in autumn (22 mg L−1) and winter (24 mg L−1), whereas the lowest values were achieved in spring (12 mg L−1) and summer (5 mg L−1), although deviations from this seasonal pattern were observed in some years in response to particular hydroclimate conditions (Figure 3). For example, in the autumn of hydrological year 2007/2008 and the winter of 2011/2012, the mean daily SSC were very low (2 and 5 mg L−1, respectively) due to the scant rainfall recorded in these seasons (autumn 2007/2008: 124.4 mm and winter 2011/2012: 79.2 mm, i.e., about 30% and 21% lower than the mean for each of the seasons). However, the mean daily SSC in summer 2008/2009 was very high (13 mg L−1) in relation to the other years (Figure 3), due to the occurrence of two runoff events that carried out a huge amount of particulate matter. As a result of the foregoing, there is no clear seasonal pattern of SSC. Similar observations have been reported in other studies in rural catchments [20,34].
Daily mean SSCs varied widely during the monitoring period (Figure 4) and exhibited much more variability than discharge (coefficient of variation 272% vs. 100%). The lowest recorded mean daily concentrations occurred in baseflow conditions, particularly in summer months. The highest values were observed in those days experiencing erosive runoff events, but not necessarily in the days of greater discharge. In fact, the highest daily mean SSCs of the study period (578 mg L−1, registered on 22–23 October of 2006) were associated with a mean daily stream discharge of 0.22 m3 s−1, a value slightly higher than the mean daily discharge of the study period (0.18 m3 s−1). This indicates that other factors besides discharge control the SSCs in the study catchment. Other studies have reported similar results in small catchments [10,13,15,21], which are particularly vulnerable to natural and anthropogenic disturbances, such as changes in vegetative cover, debris flow and changes in SS inputs.
With regard to instantaneous values, the SSCs oscillated between 1 and 2138 mg L−1, although they were below 25 mg L−1 threshold of the EU Freshwater Fish Directive (78/659/EEC), replaced by the Water Framework Directive (2000/60/EC) [35] and Directive 75/440/EEC [36], most of the study period (Table 1 and Figure 5). Samples with a high SSC were collected during runoff (Figure 5), although SSCs were not aligned with discharge values (Figure 5 and Figure 6).
An increasing pattern of SSC with increasing discharge was observed, although discharge only explained 13% of the variance in the concentration data (Figure 6), with more than one order of magnitude of SSC for almost any order of magnitude in discharge (Figure 6). Note that the regression was conducted with log-transformed Q and SSC data. The discharge data were first normalized using the geometric mean of the sampled discharge as the normalization parameter, as suggested by [37,38], among others. This normalization leads to the center of mass of the distribution of sampled log (Q) values to be at the y intercept (parameter a in the regression), so the “a” parameter quantifies the SSC at the geometric mean of the Q data. With this procedure, the inverse relationship between parameters “a” and “b” (slope) that occurs with traditional rating curve analysis is eliminated, which makes the “a” parameter a better and more independent measurement of SSC at the median discharge value [37]. The data were classified as “low discharge” and “high discharge”, considering low flow 90% of the exceedance flow, based on sampled discharge values. The study was focused on the analysis of high discharge because SS transport is generally concentrated in runoff events over long time scales [15,17].
The remarkable observed scatter in the SS-Q relationship constitutes a common feature in this type of relationship [13,21,34,35,36,37,38], which depends on the patterns of supply and transport of SS over multiple timescales [13,15,37]. Changes in the parameters of the SS-Q relationship (i.e., a and b parameters) have been reported for many streams [37,38,39], highlighting the time dependence of the parameter values [37,39]. To identify any temporal change in the Q-SSC relationship and characterize it more accurately, data were subdivided into hydrological years and seasons. This division of data increased the determination coefficient (r2) for the sediment rating curve for both annual and seasonal scales. The higher r2 values of seasonal SS-Q relationships than those of annual ones, as observed by [39], among others, denotes that variability of SS transport is controlled by seasonal change rather than by annual discharge. Figure 6 show that the slopes of the relationships (i.e., the b parameter value) varied considerably; however, there were only moderate changes in the constant values between SS-Q curves. This indicates that SS transport varies from year to year and from season to season.
At the annual scale, a time-dependent pattern was not observed, probably due to the absence of significant changes in the land use and management in the catchment. The steepness (b parameter) of Q-SS relationships ranged from 0.8–1.8, whereas the “a” parameter varied between 1.6 and 2.3 mg L−1. The largest SS-Q relationship coefficients were obtained in dry hydrological years (2011/2012, 2014/2015 and 2016/2017) characterized by low streamflow, while coefficients in wet hydrological years (2006/2007, 2009/2010 and 2013/2014) were much smaller, which seems to indicate that SSC is most sensitive to stream discharge during dry years. Stepwise multiple regressions were conducted to identify the potential effect of several predictor variables such as baseflow index (BFI, calculated following [40]), rainfall kinetic energy of the events (KE, determined according to [41], rainfall (P) and runoff (R), SS yield and maximum SSC in the runoff events on the parameters of the SS-Q relationships (i.e., a and b parameters). The results indicated that the rainfall and the baseflow index were the more important variables explaining the values of “a”, whereas “b” is better explained by rainfall and the SS concentration (Table 2). From this, it follows that annual rainfall, which impacts stream flow, soil moisture conditions and vegetation, is an important control of the SS-Q relationship parameter values, which seem not to depend on rainfall kinetic energy, an indicative parameter of rainfall erosive power.
At the seasonal scale, the “a” parameter ranged from 1.7–3.3 mg L−1 in autumn, from 1.7–3.0 mg L−1 in winter, from 1.5–2.8 mg L−1 in spring and from 0.2–3.2 mg L−1 in summer, with a value of 1.9, 1.7, 1.8 and 2.2 mg L−1 for autumn, winter, spring and summer, respectively. The steepness varied between 0.5 and 4.4 in autumn (all autumn data = 0.8), between 0.4 and 5.1 in winter (all winter data = 0.7), between 1.2 and 4.7 in spring (all spring data = 1.4) and between −2.3 and 4.02 in summer (all summer data = 1.8). These results reveal a positive relationship between Q and SSC in all seasons, except in the summer of 2014/2015, when the relationship between these parameters was negative. Stepwise multiple regressions showed that rainfall is a strong driving force for “a” and “b” parameters in autumn, explaining 84% and 70% of the total variance of “a” and “b”, respectively. However, in winter and spring, when water catchment reserves are frequently refilled [30], runoff seems to be an important predictor variable of the parameters in winter and spring (Table 2). The different b values reflect the different stream erodibilities in the different seasons as the exponent represents the erosive power of a stream [37,39]. However, the higher “b” values in spring and summer suggest that the seasons with lower runoff and relatively smaller areas of exposed bare soils and wider coverage of vegetation were more powerful in delivering SS to the stream, and this obviously is not true. The faster increase in spring and summer is not the result of a greater amount of SS being transported from the catchment during these seasons, but the limited hydrological response of the catchment in summer limited the maximum amount of SS that could be transported. Consequently, the relatively smaller SS supply in summer was enough to generate a faster increase of SS with Q in summer. However, the higher SS supply in autumn and winter was not enough to satisfy the increased transport capacity, leading to comparably smaller SSC increase per unit of discharge. This behavior reflects the supply-limited nature of this fluvial system, as often reported in the literature [39,42].
The scatter in the SS-Q relationship is also frequently associated with the hysteretic effect (i.e., different concentrations for the same discharge on the rising and falling limbs of the hydrographs) on SSCs during runoff events [32] due to the highly variable nature of the sediment sources and transport processes within the catchment. In some cases, splitting the data into these different subsets (rising and falling limb) and plotting them separately can offset this effect. An inspection of data from the Corbeira catchment revealed that hysteresis is common, with rising limb SS values generally higher than falling limb SSCs (i.e., predominance of clockwise hysteresis) [12,43]. Consequently, the data were divided according to the rising and falling limb (Figure 6), and separate regression to the rising and falling limb data was fitted. Figure 6 shows that the slope of the regression line was slightly higher for data collected during the rising limb than those obtained during the falling limb. The steepness of rising limb ranged from 1.8–2.3 among seasons, with a value of 0.91 for all data, whereas the steepness of falling limb varied from 1.6–2.1, with a value of 0.73 for all data. In both cases, the greater values were obtained in summer.
In headwater catchments, the regression scatter of the rating curve is generally higher than in large basins [44] due to greater sensitivity of SSC to local sources, such as soil erosion, gullies, bank collapse, etc. This sensitivity is responsible for the complexity of the Q-SSC relationship. In the stream studied, the non-linearity in the Q-SSC relationship can be explained by several factors including variations in rainfall pattern in conjunction with the different antecedent soil moisture conditions, in addition to the influence of vegetation in crop and soil management practices on the availability of sediment. Field observations showed that soil cover in some cultivated land of the catchment played a key role in SS delivery to the water course. During the humid period (i.e., when the magnitude and frequency magnitude runoff events were greater), sheet and concentrated flow erosion frequently appeared in certain agricultural fields well connected with the drainage network, which promoted SS delivery to the stream. Erosion was observed in steep fields that were bare after maize harvesting and before the winter cereal developed, a period when the soil offered little resistance to splash and runoff erosion. However, runoff erosion features were less commonly seen in spring, even though there was sparse vegetation cover in the fields planted with maize. Other studies have also highlighted the influence of seasonal changes in land cover and tillage management practices in controlling sediment supply to the stream network [19,34], since vegetation offers protection against erosion and also traps part of the sediment before it reaches the stream.
The maximum value of the measured SSC (2138 mg L−1, registered on 15 January 2015) was associated with a heavy rainfall event (39.5 mm and maximum rainfall intensity: 22.2 mm h−1) and a streamflow of 0.28 m3 s−1. This event was highly erosive and caused interrill and rill erosion in several fields located in the vicinity of the stream (Figure 7a), which probably explains the high SS concentrations observed. During the wet season (October–March), another four events, in which the SSCs also exceeded 1000 mg L−1, were recorded (Figure 5). In two cases (event of 10–12 January 2008: SSCmax 1313 mg L−1, 2–8 February 2017: SSCmax 1886 mg L−1), it was confirmed that the high concentrations were associated with the development of rills and ephemeral gullies in cultivated land with good connectivity with the stream (Figure 7b,c). In another case (5–7 October 2015: SSCmax 1975 mg L−1), field inspections found that the rainfall event (51.4 mm) had caused a small landslide in the vicinity of the catchment outlet (Figure 7d). The sediment was deposited in a ditch that drained into the fluvial channel, which facilitated rapid evacuation to the stream. During the summer period, only two events were recorded with SSCs close to 1000 mg L−1 (21–22 and 23 July 2009: 970 and 810 mg L−1, respectively). Each of these events occurred within a few hours during which water carried a huge amount of suspended material, although the streamflow was not of great magnitude. The high SSCs were probably related to improvements in road infrastructure at the bottom of the catchment (Figure 7e,f), since the road-widening works and ditch cleaning in some areas of the catchment provided a great deal of easily available sediments to be transported. The combination of abundant rainfall (66.4 and 32.8 mm, values higher than the monthly mean recorded in July from 1983/1984–2016/2017: 27.4 mm) and the good connectivity of these surfaces to the stream facilitated the fast sediment delivery to the channel. In fact, only 5 h after the beginning of the event, the SSC had increased by 500%, reaching maximum concentrations of 970 mg L−1.
The different sediment sources were identified through detailed field observations made within the catchment. This information is very useful for the catchment management in order to anticipate possible impacts on water resources and to comply with guidelines on water quality values, and eventually design and implement mitigation actions within the management programs. Since sediment in this catchment, and in others with similar characteristics, comes mainly from cultivated land with a lack of a good vegetation cover when the runoff events occur, management practices are targeted at reducing runoff and particularly soil erosion in cultivated land. Minimum tillage, tillage perpendicular to the maximum slope or vegetation bands may be effective measures in reducing soil erosion and sediment delivery to the water course and consequent exportation of phosphorus and metals, which are closely linked to SS in this catchment [43,45]. This would lead to an improvement in water quality in the Corbeira stream.

3.3. Dynamics in Suspended Sediment Load at Different Time Scales

The SS load during the study period was estimated at 2118 Mg, resulting in a SS yield of 0.10 Mg ha−1 y−1 (Table 1), which is low according to the classification proposed by Meybeck et al. [46]. The estimated SSY yield in the Corbeira catchment falls within the same magnitude as estimates from other semi-natural (forest or recolonized by forest) and small agricultural catchments under humid temperate conditions [13,19,20]. For example, Sherriff et al. [13] reported SS yield of 0.09–0.25 Mg ha−1 y−1 for five small agricultural (pasture and arable) catchments in Ireland. The low values were attributed to the highly complex landscape, characterized by small and irregularly-shaped fields, isolated by a network of hedgerows and vegetated ditches. In the study catchment, the low SS yield was attributed to 91% of the soil being almost permanently covered by forest and pastures, as well as the mosaic of vegetation in agricultural landscapes; the majority of the cultivated land was surrounded by pastures and even, in some cases, by stone walls, which can make the connectivity of arable fields with the drainage network more difficult. Other studies also cite the crucial role of the distribution of land use and landscape elements in decreasing hydrological and sediment connectivity [8,19,47,48].
Cumulative distribution analyses of the suspended sediment load (SSL) data indicated that only 10% of the time produced 78% of the SSL, whereas 78% of the runoff was discharged in 45% of the time. In particular, 53% of the SS load was transported in very high flow (Q > percentile 95, 0.53 m3 s−1), whereas less than 1% was transported as low flow (Q < quartile 1, 0.06 m3 s−1). This behavior coincides with that reported for similar-sized agroforested catchments and highlights the episodic nature of SS, as already reported by several authors worldwide [13,19,21]. However, this clearly departs from results obtained in other small catchments [15,18]. This also differs from the results obtained in the neighboring Mero basin, in which 63% of the SS load was usually transported during 10% of the time [20], despite it having similar characteristics to the Corbeira catchment. Although this difference is considerable, it should be noted that values reported by Palleiro et al. [20] concern a three-year study period, and therefore, the probability of including high-magnitude events is less than in longer datasets, while the occurrence or otherwise of such events may influence the estimations [17]. This emphasizes the importance of including a wide variety of events (low magnitude/high-frequency events and high-magnitude/low-frequency events) in long-term data for estimating sediment loads.
On a monthly basis, about 90% of the recorded sediment load was transported from November–April, decreasing until September, when it reached the minimum values (Figure 2). Heavy SS transport during winter is due to the higher water yield and sediment availability from agricultural land with scant vegetation cover, and well-connected to the drainage network. However, that could easily act as a source of sediment when heavy rainfall events occur during spring months—a period with a high risk of erosion due to sparse vegetation cover in the fields planted with maize—as the SS transport was lower than in autumn months, although the streamflow was higher (Figure 2). This is probably due to the high baseflow and demonstrates the fact that large inputs of sediment-free water dilute SSC, as was widely suggested in other catchments [21,47].
The results highlight the predominant contribution of a few large events to the annual SS load in this catchment, as already reported by several authors worldwide [7,13,14,15,19,47]. Within the 12-year period (2004/2005–2016/2017), 15 events (<1% of time) produced about 40% of total recorded SS, suggesting a moderate irregularity in SS transport in the study area. The SS load in these episodes was mainly driven by widespread rainfall events (10 with rainfall > 62 mm) under wet conditions (nine with antecedent precipitation 21 days before the event- AP21d- over 110 mm), generating very high runoff, although the contemporaneous SSCs were not very high due to the inputs of clean water from heavily-vegetated areas causing the dilution, but not total sediment transport, as well as to the SS transport during previous events. Three examples of these events can be seen in Figure 8. The first (7–13 December 2006) was generated by persistent rainfall of 71.6 mm with a kinetic energy (KE) of 9.8 MJha−1 under an antecedent precipitation 21 days before the event (AP21d) of 272.2 mm and producing 30 Mg of SS. The second episode (4–13 February 2014) was caused by a succession of explosive cyclogeneses with a large amount of rainfall (143 mm), leading to very high flow in the catchment. The extraordinary nature of the flow made it the event with the highest water yield ever registered in the catchment (54 mm), which influenced the SS load (49 Mg). The third example (7 January 2016) was the most relevant event in terms of SS load (79 Mg) and occurred when a particularly heavy rainfall event (129 mm), along with high antecedent soil conditions (AP21d = 134 mm) gave rise to flood discharges at the bottom of the catchment, mobilizing and transporting a huge amount of suspended material. That event accounted for 31% of the entire SS generated that year and for 5% of the SS generated during the 12-year monitoring period. The water yield in this last event was almost half of the previous one (28 mm vs. 54 mm); however, the SS load was double, which underscores once again the nonlinear relation between water and SS discharge in the study area, as has been highlighted in previous studies in agroforested temperate humid catchments [13,19,20,21]. The crucial importance of sediment over the sediment transport capacity of the flow is also emphasized.

3.4. Implications of the Results

The results obtained in this study give a perspective on the sediment regimes of the Corbeira stream and the potential exposure of aquatic biota to SSC. The mean annual SSC was always lower than the guideline of the Freshwater Fisheries Directive (FFD) (78/659/EEC) [35] and Directive 75/440/EEC [36] (25 mg L−1). However, during 11% of the time (Table 1), mainly coinciding with runoff events, the SSC exceeded the FFD guideline, indicating that mitigation of sediment loss during runoff events might be enough to lessen the impact on ecology and comply with guideline water quality values. Therefore, it is critical for understanding the sources of sediment during the different types of runoff events.
It is widely known that high SSCs affect the aquatic biota by reducing the density, productivity and abundance of primary producer and macro-invertebrates [26,49]. However, some authors point out that certain freshwater organisms can be harmed, even when exposed to concentrations of approximately 10 mg L−1. For example, Lloyd [50] reported a reduction of 3–13% in the production of macrophytes and periphyton exposed to SSC of 8 mg L−1, while Quinn et al. [51] observed a decrease of 40% in the phytoplankton biomass exposed to SSC of 10 mg L−1. Concentrations above 80 mg L−1 start to affect some fish populations, and SSCs above 200 mg L−1 are assumed to be harmful to salmonids [52]. These thresholds were frequently exceeded during runoff events. However, some authors state that the duration of high SSC events is as important as the concentration itself [53], and even relatively low thresholds exceeded for a long time will result in sub-lethal and behavioral effects such as stress and increased activity; reduction in the capacity to search for food; reduced growth and resistance to disease; physical abrasion; and obstructed gills [52,53,54,55]. Fox example, [53] reported that more than six days of exposure to values >10 mg L−1 generates moderate stress in juvenile and adult salmon, similar to a day of exposure to SSCs > 50 mg L−1. Rosenber and Wiens [56] noted increased drifting of macroinvertebrates in response to SSC of 8 mg L−1 over periods of 2.5 h. In light of the results of these investigations, the SSC obtained in this study could have adverse effects on freshwater because the figures cited above were exceeded during the study period. Indeed, concentrations above 10 mg L−1 were measured in 30% of the study period, and in 86% of the runoff events, concentrations higher than 25 mg L−1 lasted for more than more than 2.5 h. Short-term pulsing of high SSCs (500 mg L−1) lasting 0–6 h has also been shown to reduce the abundance and diversity of invertebrates and restrict trout growth [57], although these conditions only occurred during <1% of the monitoring period.
With regard to SS yield, the rate obtained at the catchment outlet (0.11 Mg ha−1 year-1) is relatively insignificant from a quantitative standpoint given the generally accepted soil formation rate for the conditions prevalent in Europe [58,59]. However, the content of organic matter and loss of nutrients in the sediments can pose a threat to the quality of the water. For example, phosphorus concentrations frequently exceed the environmental thresholds for flowing water (50 mg L−1 for total phosphorus: Sharpley and Rekolainen [60]; 20 mg L−1 for dissolved phosphorus: [61]) during runoff events, suggesting that eutrophication may be accelerated [40]. Besides this, in earlier studies conducted by our research team in the same study area [8,62], soil loss ranging from 1.9–30.4 Mg ha has been measured in cultivated land as a consequence of intense rainfall events, so the soil erosion in arable land exceeded the rate of soil renewal. However, the majority of this soil does not leave the catchment, but the sediment is redistributed within the catchment [8].

4. Conclusions

The research reported in this paper shows the suspended sediment dynamics in an agroforested headwater under a humid climate, based on a long-term record (12 hydrological years). Suspended sediment concentration and loads were highly variable and depended on many factors, such as rainfall amount and intensity, antecedent soil moisture conditions and soil management practices in the cultivated land, which underline the crucial importance of long-term records in order to understand the SS dynamics and reliably estimate suspended sediment yield.
The episodic nature of suspended sediment transport has been demonstrated. In fact, 80% of the SS load was exported in only 12% of the study period. The suspended sediment transport dynamic was mainly influenced by streamflow, although the SS availability also played an important role in SS transport. The SS load was mainly driven by widespread rainfall events. In contrast, heavy local and short duration runoff events generated high SSC peaks, due mainly to the delivery of SS from areas close to the drainage network. Detailed field observations made within the catchment were extremely useful to identify the main sources of sediment within the catchment. The high sensitivity of SSC to local sources in the Corbeira catchment is responsible for the complexity of the Q-SSC relationship, which cannot be adequately characterized using a simple rating curve.
Despite having low suspended sediment yield (0.10 Mg ha−1 y−1), the catchment displayed during 11% of the monitoring SS concentrations exceeding the threshold threatened surface water quality, indicating the need to adopt management practices for cultivated land in order to reduce or mitigate sediment loss in such episodes.
The outcomes of this research provide a general understanding of SS transport dynamics in headwater environments that could be transferred to other small humid agroforested catchment and help to inform future management decisions to decrease the suspended sediment yield in catchments with similar characteristics to the Corbeira, where management of cultivated land plays an important role in water resources sustainability. The dataset is expected to serve as a highly valuable benchmark to test catchment sediment models requiring large input and validation data (which are generally unavailable for small catchments) and as an accurate description of erosion and transport processes.

Author Contributions

Methodology, M.L.R.-B., M.M.T.-C., M.T.T.-C.; Formal Analysis, M.L.R.-B., M.M.T.-C., M.T.T.-C.; Investigation, M.L.R.-B., M.M.T.-C., M.T.T.-C.; Resources, M.L.R.-B., M.M.T.-C., M.T.T.-C.; Data Curation, M.L.R.-B., M.M.T.-C., M.T.T.-C.; Writing-Original Draft Preparation M.L.R.-B., M.M.T.-C., M.T.T.-C.; Writing-Review & Editing, M.L.R.-B., M.M.T.-C., M.T.T.-C.; Supervision, M.T.T.-C.; Project Administration, M.L.R.-B., M.T.T.-C.; Funding Acquisition, M.L.R.-B., M.T.T.-C.

Funding

This research was funded by the projects 10MDS103031 of the Xunta de Galicia and CGL2014-56907-R of the Programa Estatal de Investigación, Desarrollo e Innovación Orientada a los Retos de la Sociedad, which was funded by the Spanish Ministry of Economy and Competitiveness. M.L. Rodríguez-Blanco has been awarded a post-doctoral research contract (Juan de la Cierva Programme), which was funded by the Spanish Ministry of Economy and Competitiveness.

Acknowledgments

The authors wish to thank three anonymous reviewers and the editor, who helped improve the quality of the paper.

Conflicts of Interest

The authors declare no conflicts of interest.

References

  1. Collins, A.L.; Zhang, Y.S.; Duethmann, D.D.; Walling, D.E.; Black, K.S. Using a novel tracing-tracking framework to source fine-grained sediment loss to watercourses at sub-catchment scale. Hydrol. Process. 2012, 27, 959–974. [Google Scholar] [CrossRef]
  2. Panagos, P.; Imeson, A.; Meusburger, K.; Borrelli, P.; Poesen, J.; Alewell, C. Soil conservation in Europe: Wish or reality? Land Degrad. Dev. 2016, 27, 1547–1551. [Google Scholar] [CrossRef]
  3. Owens, P.N.; Batalla, R.J.; Collins, A.J.; Gomez, B.; Hicks, D.M.; Horowitz, A.J.; Kondolf, G.M.; Marden, M.; Page, M.J.; Peacock, D.H.; et al. Fine-grained sediment in river systems: Environmental significance and management issues. River Res. Appl. 2005, 21, 693–717. [Google Scholar] [CrossRef]
  4. Horowitz, A.J. Determining annual suspended sediment and sediment-associated trace element and nutrient fluxes. Sci. Total Environ. 2008, 400, 315–343. [Google Scholar] [CrossRef] [PubMed]
  5. Grove, M.K.; Bilotta, G.S.; Woockman, R.R.; Schwartz, J.S. Suspended sediment regimes in contrasting reference-condition freshwater ecosystems: Implications for water quality guidelines and management. Sci. Total Environ. 2015, 502, 481–492. [Google Scholar] [CrossRef] [PubMed]
  6. Buendia, C.; Herrero, A.; Sabater, S.; Batalla, R.J. An appraisal of the sediment yield in western Mediterranean river basins. Sci. Total Environ. 2016, 572, 538–553. [Google Scholar] [CrossRef] [PubMed]
  7. de Vente, J.; Poesen, J. Predicting soil erosion and sediment yield at the basin scale: scale issues and semi-quantitative models. Earth Sci. Rev. 2005, 71, 95–125. [Google Scholar] [CrossRef]
  8. Rodríguez-Blanco, M.L.; Taboada-Castro, M.M.; Taboada-Castro, M.T. Linking the field to the stream: Soil erosion and sediment yield in a rural catchment, NW Spain. Catena 2013, 102, 74–81. [Google Scholar] [CrossRef]
  9. Rodrigues, V.; Estrany, J.; Ranzini, M.; de Cicco, V.; Tarjuelo Martín-Benito, J.M.; Hedo, J.; Lucas-Borja, M.E. Effects of land use and seasonality on stream water quality in a small tropical catchment: The headwater of Córrego Água Limpa, São Paulo (Brazil). Sci. Total Environ. 2018, 622, 1553–1561. [Google Scholar] [CrossRef] [PubMed]
  10. Bilotta, G.S.; Krueger, T.; Brazier, R.E.; Butler, P.; Freer, J.; Hawkins, J.M.B.; Haygarth, P.M.; Macleod, C.J.A.; Quinton, J.N. Assessing catchment-scale erosion and yields of suspended solids from improved temperate grassland. J. Environ. Monit. 2010, 12, 731–739. [Google Scholar] [CrossRef] [PubMed] [Green Version]
  11. López-Tarazón, J.A.; Estrany, J. Exploring suspended sediment delivery dynamics of two Mediterranean nested catchments. Hydrol. Process. 2017, 31, 698–715. [Google Scholar] [CrossRef]
  12. Rodríguez-Blanco, M.L.; Taboada-Castro, M.M.; Taboada-Castro, M.T. Factors controlling hydro-sedimentary response during runoff events in a rural catchment in the humid Spanish zone. Catena 2010, 82, 206–217. [Google Scholar] [CrossRef]
  13. Sherriff, S.C.; Rowan, J.S.; Melland, A.R.; Jordan, P.; Fenton, O.; Ó’hUallacháin, D. Identifying the controls of soil loss in agricultural catchments using ex situ turbidity-based suspended sediment monitoring. Hydrol. Earth Syst. Sci. Discuss. 2015, 12, 2707–2740. [Google Scholar] [CrossRef]
  14. Clark, K.E.; Shanley, J.B.; Scholl, A.M.; Perdrial, N.; Perdrial, J.N.; Plante, A.F.; McDowell, W.H. Tropical river suspended sediment and solute dyanmics in storm during an extreme drought. Water Resour. Res. 2017, 53, 3695–3712. [Google Scholar] [CrossRef]
  15. Nadal-Romero, E.; Peña-Angulo, D.; Regüés, D. Rainfall, runoff, and sediment transport dynamics in a humid mountain badland area: Long-term results from a small catchment. Hydrol. Process. 2018. [Google Scholar] [CrossRef]
  16. Moran, M.S.; Peters, D.P.C.; McClaran, M.P.; Nichols, M.H.; Adams, M.A. Long-term data collection at USDA experimental sites for studies of ecohydrology. Ecohydrology 2008, 1, 377–393. [Google Scholar] [CrossRef]
  17. García-Ruiz, J.M.; Beguería, S.; Nadal-Romero, E.; González-Hidalgo, J.C.; Lana-Renault, N.; Sanjuán, Y. A meta-analysis of soil erosion rates across the world. Geomorphology 2015, 239, 160–173. [Google Scholar] [CrossRef] [Green Version]
  18. Duvert, C.; Nord, G.; Gratiot, N.; Navratil, O.; Nadal-Romero, E.; Mathys, N.; Némery, J.; Regüés, D.; García-Ruíz, J.M.; Gallart, F.; et al. Towards prediction of suspended sediment yield from peak discharge in small erodible mountainous catchments (0.45–22 km2) of France, Mexico and Spain. J. Hydrol. 2012, 454, 42–55. [Google Scholar] [CrossRef]
  19. Nunes, J.P.; Bernard-Jannin, L.; Rodríguez-Blanco, M.L.; Santos, J.; de Oliveira Alves, C.; Keizer, J.J. Hydrological and erosion processes in terraced fields: Observations from a humid Mediterranean region in northern Portugal. Land Degrad. Dev. 2016. [Google Scholar] [CrossRef]
  20. Palleiro, L.; Rodríguez-Blanco, M.L.; Taboada-Castro, M.M.; Taboada-Castro, M.T. Hydroclimatic control of sediment and metal export from a rural catchment in northwestern Spain. Hydrol. Earth Syst. Sci. 2014, 18, 3663–3673. [Google Scholar] [CrossRef] [Green Version]
  21. Zabaleta, A.; Antigüedad, I.; Barrio, I.; Probst, J. Suspended sediment delivery from small catchments to the Bay of Biscay. What are the controlling factors? Earth Surf. Process. Landf. 2016, 43, 1894–1910. [Google Scholar] [CrossRef]
  22. IPCC (Intergovernmental Panel on Climate Change). Part A: Global and Sectoral Aspects. Contribution of Working Group II to the Fifth Assessment Report of the Intergovernmental Panel on Climate Change. In Impacts, Adaptation, and Vulnerability; Field, C.B., Barros, V.R., Dokken, D.J., Mach, K.J., Mastrandrea, M.D., Bilir, T.E., Chatterjee, M., Ebi, K.L., Estrada, Y.O., Genova, R.C., et al., Eds.; Cambridge University Press: Cambridge, UK; New York, NY, USA, 2014. [Google Scholar]
  23. Francipane, A.; Fatichi, S.; Ivanov, V.Y.; Noto, L.V. Stochastic assessment of climate impacts on hydrology and geomorphology of semiarid headwater basins using a physically based model. J. Geophys. Res. Earth Surf. 2015, 120, 507–533. [Google Scholar] [CrossRef] [Green Version]
  24. Zhou, Y.; Xu, Y.J.; Xiao, X.W.; Wang, J.; Huang, Y.; Yang, H. Climate change impacts on flow and suspended sediment yield in headwaters of high-latitude regions-A case study in China’s Far Northeast. Water 2017, 9, 966. [Google Scholar] [CrossRef]
  25. Kemp, P.; Sear, D.; Collins, A.; Naden, P.; Jones, I. The impacts of fine sediment on riverine fish. Hydrol. Process. 2011, 25, 1800–1821. [Google Scholar] [CrossRef]
  26. Jones, J.I.; Murphy, J.F.; Collins, A.L.; Sear, D.A.; Naden, P.S. The impact of fine sediment on macro-invertebrates. River Res. Appl. 2012, 28, 1055–1071. [Google Scholar] [CrossRef]
  27. IGME (Instituto Tecnológico Geominero de España). Mapa Geológico de España, 1:50,000. Hoja 45; Betanzos: Murcia, Spain, 1981. [Google Scholar]
  28. IUSS Working Group WRB. World Reference Base for Soil Resources 2014, update 2015 International Soil Classification System for Naming Soils and Creating Legends for Soil Maps; World Soil Resources Reports No. 106; Food and Agriculture Organization of the United Nation (FAO): Rome, Italy, 2015. [Google Scholar]
  29. Rodríguez-Blanco, M.L.; Taboada-Castro, M.M.; Taboada-Castro, M.T. Relating nitrogen export patterns from a mixed land use catchment in NW Spain with rainfall and streamflow. Hydrol. Process. 2015, 29, 2720–2730. [Google Scholar] [CrossRef]
  30. Rodríguez-Blanco, M.L.; Taboada-Castro, M.M.; Taboada-Castro, M.T. Rainfall-runoff response and event-based runoff coefficients in a humid area (northwest Spain). Hydrol. Sci. J. 2012, 57, 445–459. [Google Scholar] [CrossRef]
  31. Linsley, R.K.; Kohler, M.A.; Paulhus, J.C. Applied Hydrology; McGraw-Hill Book Co.: New York, NY, USA, 1949; p. 689. [Google Scholar]
  32. Walling, D.E.; Webb, B.W. The reliability of suspended sediment load data, in erosion and sediment transport measurement. IAHS Publ. 1981, 133, 177–194. [Google Scholar]
  33. Palleiro, L.; Rodríguez-Blanco, M.L.; Taboada-Castro, M.M.; Taboada-Castro, M.T. Hydrological response of a humid agroforestry catchment at different time scales. Hydrol. Process. 2014, 28, 1677–1688. [Google Scholar] [CrossRef]
  34. Estrany, J.; Garcia, C.; Batalla, R.J. Suspended sediment transport in a small Mediterranean agricultural catchment. Earth Surf. Process. Landf. 2009, 34, 929–940. [Google Scholar] [CrossRef]
  35. Directive 2000/60/EC of the European Parliament and of the Council of 23 00 of Establishing a Framework for Community Action in the Field of Water Policy; European Council: Brussel, Belgium, 2003; pp. 1–160.
  36. Directive 75/440/CEE of the 16 75 for Provision of Water to Provide Potable Water; European Council: Brussel, Belgium, 1975; p. 26.
  37. Warrick, J.A. Trend analyses with river sediment rating curves. Hydrol. Process. 2014, 29, 936–949. [Google Scholar] [CrossRef] [Green Version]
  38. Vaughan, A.A.; Belmont, P.; Hawkins, C.P.; Wilcock, P. Near-channel versus watershed controls on sediment rating curves. J. Geophys. Res. Earth Surf. 2017, 122, 1901–1923. [Google Scholar] [CrossRef]
  39. Gao, P.; Josefson, M. Temporal variations of suspended sediment transport in Oneida Creek watershed, central New York. J. Hydrol. 2012, 426, 17–27. [Google Scholar] [CrossRef]
  40. Gustard, A.; Bullock, A.; Dixon, J.M. Low Flow Estimation in the United Kingdom; Institute of Hydrology: Wallingford, UK, 1992; pp. 19–25. [Google Scholar]
  41. Wischmeier, W.H.; Smith, D.D. Rainfall energy and its relationship to soil loss. Trans. Am. Geophys. Union 1958, 39, 285–291. [Google Scholar] [CrossRef]
  42. Asselman, N.E.M. Fitting and interpretation of sediment rating curves. J. Hydrol. 2000, 234, 228–248. [Google Scholar] [CrossRef]
  43. Rodríguez-Blanco, M.L.; Taboada-Castro, M.M.; Taboada-Castro, M.T. Using hysteresis analysis to infer controls 1 on sediment-associated and metals transport in a small humid temperate catchment. J. Hydrol. 2018, 565, 49–60. [Google Scholar] [CrossRef]
  44. Klein, M. Anticlockwise hysteresis in suspended sediment concentration during individual storms: Holberck catchment; Yorkire, England. Catena 1984, 11, 251–257. [Google Scholar] [CrossRef]
  45. Rodríguez-Blanco, M.L.; Taboada-Castro, M.M.; Taboada-Castro, M.T. Phosphorus transport into a stream draining from a mixed land use catchment in Galicia (NW Spain): Significance of runoff events. J. Hydrol. 2013, 481, 12–21. [Google Scholar] [CrossRef]
  46. Meybeck, M.; Laroche, L.; Durr, H.H.; Syvitski, J.P.M. Global variability of daily total suspended solids and their fluxes in rivers. Glob. Planet Chang. 2003, 39, 65–93. [Google Scholar] [CrossRef]
  47. Lana-Renault, N.; Regüés, D. Seasonal patterns of suspended sediment transport in an abandoned farmland catchment in the Central Spanish Pyrenees. Earth Surf. Process. Landf. 2009, 34, 1291–1301. [Google Scholar] [CrossRef]
  48. Bracken, L.J.; Turnbull, L.; Wainwright, J.; Bogaart, P. Sediment connectivity: A framework for understanding sediment transfer at multiple scales. Earth Surf. Process. Landf. 2015, 40, 177–188. [Google Scholar] [CrossRef] [Green Version]
  49. Wood, P.J.; Armitage, P.D. Biological effects of fine sediment in the lotic environment. Environ. Manag. 1997, 21, 203–217. [Google Scholar] [CrossRef]
  50. Lloyd, D.S. Turbidity as a water quality standard for salmonid habitats in Alaska. N. Am. J. Fish Manag. 1987, 7, 34–35. [Google Scholar] [CrossRef]
  51. Quinn, J.M.; Davies-Colley, R.J.; Hickey, C.W.; Vickers, M.L.; Ryan, P.A. Effects of clay discharge on streams: 2. Benthic invertebrates. Hydrobiologia 1992, 248, 235–247. [Google Scholar] [CrossRef]
  52. Waters, T.F. Sediments in Streams: Sources, Biological Effects and Control; American Fisheries Society: Bethesda, MD, USA, 1995; p. 221. ISBN 978-0913235973. [Google Scholar]
  53. Newcombe, C.; Jensen, J.O. Channel suspended sediment and fisheries, a synthesis for quantitative assessment of risk and impact. N. Am. J. Fisheries Man. 1996, 16, 693–727. [Google Scholar] [CrossRef]
  54. Newcombe, C.P.; Macdonald, D.D. Effects of suspended sediments on aquatic ecosystems. N. Am. J. Fish. Manag. 1991, 11, 72–82. [Google Scholar] [CrossRef]
  55. Ouellette, C.; Courtenay, S.C.; St-Hilaire, A.; Boghen, A.D. Impact of a peat moss spill on an estuarine environment using the sand shrimp Crangon septemspinosa as a biosentinel. J. Appl. Ichtyol. 2006, 22, 15–24. [Google Scholar] [CrossRef]
  56. Rosenberg, D.M.; Wiens, A.P. Effects of sedimentation on macrobenthic invertebrates on a northern Canadian river. Water Res. 1978, 12, 753–763. [Google Scholar] [CrossRef]
  57. Shaw, E.A.; Richardson, J.S. Direct and indirect effects of sediment pulse duration on stream invertebrate assemblages and rainbow trout (Oncorhynchus mykiss) growth and survival. Can. J. Fish. Aquat. Sci. 2001, 58, 2213–2221. [Google Scholar] [CrossRef]
  58. Alexander, E.B. Rates of soil formation-implications for soil-loss tolerance. Soil Sci. 1988, 145, 37–45. [Google Scholar] [CrossRef]
  59. Verheijen, F.G.A.; Jones, R.J.A.; Rickson, R.J.; Smith, C.J. Tolerable versus actual soil erosion rates in Europe. Earth Sci. Rev. 2009, 94, 23–38. [Google Scholar] [CrossRef] [Green Version]
  60. Sharpley, A.N.; Rekolainen, S. Phosphorus in agriculture and its environmental implications. In Phosphorus Loss from Soil to Water; Tunney, H., Carton, O.H., Brookes, P.C., Johnston, A.E., Eds.; CAB International Publishing: Wallingford, UK, 1997; pp. 1–53. [Google Scholar]
  61. Gibson, G.R.; Carlson, R.; Simpson, J.; Smeltzer, E.; Gerritson, J.; Chapra, S.; Heiskary, S.; Jones, J.; Kennedy, R. Nutrient Criteria Technical Guidance Manual: Lakes and Reservoirs; EPA-822-B-00-002; United States Environmental Protection agency (USEPA): Washington, DC, USA, 2000. [Google Scholar]
  62. Taboada-Castro, M.M.; Rodríguez-Blanco, M.L.; Taboada-Castro, M.T. Runoff and erosion in agricultural soils from NW Spain: Interaction between agricultural practices and weather conditions. Geotemas 2008, 10, 109–112. [Google Scholar]
Figure 1. Location of the study area and view of the mosaic of vegetation in agricultural landscapes.
Water 10 01302 g001
Figure 2. Box plot summarizing monthly (a) rainfall, (b) streamflow and (c) suspended sediment load. Each box shows the 25th, 50th and 75th percentiles. Whiskers show the 10th and 90th percentiles. Outliers outside these ranges are shown as dots.
Water 10 01302 g002
Figure 3. (a) Seasonal mean daily suspended sediment concentration (SSC) and standard deviation; (b) seasonal distribution of mean daily suspended sediment concentration during the study period.
Water 10 01302 g003
Figure 4. Box plot summarizing daily (a) mean discharge (Q) and (b) suspended sediment concentration (SSC). Each box shows the 25th, 50th and 75th percentiles. Whiskers show the 10th and 90th percentiles. Outliers outside these ranges are shown as dots.
Water 10 01302 g004
Figure 5. Discharge and suspended sediment concentrations during the study period.
Water 10 01302 g005
Figure 6. Relationship (double-logarithmic scale) between stream discharge (Q) and suspended sediment concentration (SSC) at different temporal scales and limbs of the hydrograph. (a) all data; (b) data split by season; (c) data split based on rising and falling limb; and (d) seasonal data split based on rising and falling limb.
Water 10 01302 g006aWater 10 01302 g006b
Figure 7. Some sediment sources in the Corbeira catchment during the study period. (a) Interrill erosion in cultivated soils; (b,c) rill and ephemeral gullies in cultivated soils; (d) small landslide near the catchment outlet; (e,f) soil erosion in road infrastructures.
Water 10 01302 g007
Figure 8. Rainfall (P), discharge (Q) and suspended sediment concentrations (SSC) during some events registering high suspended sediment load. (a) 7–13 December 2006; (b) 4–13 February 2014; (c) 7–13 January 2016.
Water 10 01302 g008
Table 1. Annual rainfall, streamflow and suspended sediment.
Hydrological YearRainfall (mm)Streamflow (mm)RC (%)Daily Mean SSC (mg L−1)Max SSC (mg L−1)>25 mg L−1 (% ST)SSY (Mg ha−1 y−1)
2004/2005895298331253070.04
2005/200611924493819626120.09
2006/200713974122913850110.11
2007/200810542402312131370.05
2008/200911964213518970150.12
2009/201013825443921684150.19
2010/2011107837335181026150.12
2011/2012809225281155850.04
2012/201312074483717903160.16
2013/201412554343514895100.11
2014/201597930731172168110.10
2015/2016148343129171975110.16
2016/20179121401513188670.05
Mean ± S.D.1141 ± 209363 ± 11331 ± 716 ± 3-11 ± 40.10 ± 0.05
RC: runoff coefficient; SSC: suspended sediment concentration; ST: sampled time; SSY: suspended sediment yield; S.D.: standard deviation.
Table 2. Derived equation for the SS-Q relationship parameters applying the stepwise multiple regression technique and variance explained.
Regression EquationPercentage of Variance Explainedp-Value
Annual
a parametera = 3.74 − 0.01P − 1.27FB79%0.001
b parameter (slope)b = 2.89 − 0.02P + 0.02SSCmax83%<0.001
Seasonal
Autumn
a parametera = 3.38 − 0.008P84%<0.001
b parameter (slope)b = 4.41 − 0.015P70%0.001
Winter
a parametera = 3.44 − 1.4 × 10⁻⁶R − 2.10KE87%<0.001
b parameter (slope)b = 5.79−3.2 × 10⁻⁶R − 0.72KE74%0.02
Spring
a parametera = 2.9 − 1.7 × 10⁻⁶R52%0.007
P: rainfall; BFI: baseflow index; SSCmax: maximum SSC; R: runoff; KE: rainfall kinetic energy.

