Identifying Surface Runoff Pathways for Cost-Effective Mitigation of Pollutant Inputs to Drinking Water Reservoir


1
Institute of Environmental Engineering, Wrocław University of Environmental and Life Sciences, pl. Grunwaldzki 24, 50-363 Wroclaw, Poland
2
Institute of Environmental Protection and Development, Wrocław University of Environmental and Life Sciences, pl. Grunwaldzki 24, 50-363 Wroclaw, Poland
3
Institute of Meteorology and Water Management-National Research Institute, Wrocław Branch, ul. Parkowa 30, 51-616 Wroclaw, Poland
*
Author to whom correspondence should be addressed.
Water 2018, 10(10), 1300; https://doi.org/10.3390/w10101300
Submission received: 22 August 2018
/
Revised: 7 September 2018
/
Accepted: 19 September 2018
/
Published: 21 September 2018
(This article belongs to the Section Water Quality and Contamination)
Abstract
:Surface runoff (overland flow) is the main element of the water cycle and is also crucial in the delivery of phosphorus and nitrogen from catchments to water bodies. Watercourses and reservoirs in agricultural catchments are particularly vulnerable to the delivery of biogenic compounds via surface runoff. Forested riparian buffers are considered effective in reducing nutrients and sediment loads in runoff from agricultural areas. Regrettably, the concentration of surface runoff may significantly limit the buffering capacity of vegetation strips, as channelised overland flow tends to avoid buffers without making optimal use of their ability to retain nutrients and sediment. The aim of the undertaken research was to delineate surface runoff pathways from surrounding areas to a drinking water reservoir as well as to identify potential concentration spots of overland flow. The research was conducted for the Dobromierz drinking water reservoir (GPS N: 50°54′27″, E: 16°14′37″). The reservoir is situated in a submountain catchment, where rainfall is an important factor taking part in driving diffuse P and N loads from land to water. Presented GIS-based method using high resolution Digital Terrain Model obtained from Light Detection and Ranging (LiDAR) allowed to determine areas with a tendency for high accumulation (concentration) of overland flow in the direct catchment of the reservoir. As main surface runoff areas, three sites each exceeding 100 ha were designated. The analysis of spatial data also allowed to establish the risk of agricultural diffuse pollution transfer via channelised overland flow to the reservoir from individual accumulation areas. It was found that in the forested part of the catchment (serving as a riparian buffer) there is no visible tendency for concentration of surface runoff, but simultaneously the vegetation strip does not prevent the transfer of runoff waters from agricultural areas through the privileged pathways of concentrated flow.
1. Introduction
Eutrophication is one of the most important worldwide environmental challenges and the major problem for sustainable water management of water bodies. Human activities have accelerated the rate and extent of eutrophication through excessive nutrient (mostly phosphorus and nitrogen) loading to aquatic ecosystems from both point and nonpoint sources of pollution. In numerous regions of the world, the problem of point sources of pollution, connected mainly with insufficient wastewater treatment, is efficiently solved through the construction of new and the modernisation of existing wastewater treatment plants, as well as the expansion of sewage systems. Nonpoint source (NPS) pollution is the leading remaining cause of water quality problems on a local, regional and global scale [1,2,3,4,5].
Hydrological flow paths have been recognised as a crucial element in the investigation of phosphorus (P) and nitrogen (N) delivery from catchment to surface water. The transfer of diffuse nutrients from NPS to water bodies is carried out by overland quickflow pathways and belowground slowflow pathways. Overland flow is essential in the relocation of agricultural pollutants [6,7], being the main transport route for phosphorus compounds—dissolved and particulate forms and an important route for nitrogen compounds—organic forms associated with eroded soil and a soluble mineral form [8,9]. Pollutant transport via surface runoff is especially intensified in catchments which are hydrologically sensitive to rainfall (vulnerable to contamination following precipitation events). The factors facilitating this phenomenon are: low permeability of soils, high slope gradients and the lack of vegetation cover [10,11,12]. The observed climate change and increased heavy rainfall lead to significant and rapid transfers of nutrients to surface water. Numerous authors emphasise the fact that a precise calculation of annual loads of phosphorus and nitrogen in a catchment is only possible with high frequency water quality monitoring [13,14,15,16] and such a solution cannot be applied in agricultural catchments on a large scale. The data from classic water monitoring carried out by government institutions (with monthly or even biweekly sampling) are insufficient to accurately identify nitrogen and phosphorus loads entering surface waters. Nowadays, research related to the mitigation of surface runoff impact on water bodies concentrates on identifying pollution paths and: (i) designating areas within a catchment that are prone to generating runoff (hydrologically sensitive areas (HSAs)); (ii) designating areas with the highest transfer risk of pollutants—critical source areas (CSAs), potential pollutant loading is connected here to being prone to generating runoff (HSA + high risk of pollutant mobilisation); (iii) identifying interfaces between pollution source areas and buffer zones [6,10,15,17,18]. Such research is in turn the basis for cost-effective planning, targeted mitigation measures and the evaluation of the effectiveness of existing security measures i.e., riparian buffer zones (resource protection areas (RPAs)).
In case of drinking water reservoirs, the supply of sediment and nutrients from catchment causes not only eutrophication and storage capacity loss due to sediment deposition, but also technological problems and increased costs of water treatment. The toxins that appear in connection with harmful cyanobacteria blooms (HABs) and an enlarged amount of suspended solids (organic materials such as algae and inorganic materials such as sediment particles) enforce applying extensive technologies during drinking water treatment. The process requires the removal of algal cells and toxins, as well as related off-tastes and odours. HABs have become a significant driver of water treatment costs [2,19,20,21].
GIS-based solutions and remote sensing are now providing more and more support in water and soil resources management as well as in the monitoring of vegetation [22,23,24,25,26,27]. Remote sensing makes it easy to obtain data (from spaceborne, airborne and terrestrial sensors) for monitoring of natural resources, environmental processes and human activities i.e., surface water quality and quantity, soil moisture, snow cover, glaciers, crops and natural vegetation, land cover, drought and flooding, erosion, ecological footprints of cities [22,23,26,28]. GIS tools enable fast data processing, spatial analysis, modelling and visualisation; therefore, they are commonly used in decision support systems for environmental management [26,27]. The global challenge, in which remote sensing data and GIS software are widely used, is the adaptation to climate change (drought and flood risk mapping, sustainable urban water management and water-sensitive urban design, and land use management) [22,27]. Vegetation monitoring is mainly used in agriculture, forestry and water management. Data from sensors and their processing with the use of mapping tools enable optimising the profitability of crop production and reducing its environmental impact (i.e., in precision farming); the structure of riparian vegetation is very important in surface water quality protection (riparian buffers and wetlands) as well as for modelling the interactions between river flow and riparian vegetation [23,24,25]. Over the last decade, remote sensing and GIS tools have become increasingly integrated. Remotely sensed data can be processed and analysed fast using GIS software [10,17,22]. Wider and faster access to geospatial data enables a dynamic growth of research related to the risk of surface runoff generation [28]. Digital Elevation Models (DEMs) and Digital Terrain Models (DTMs) obtained from Light Detection and Ranging (LiDAR) turn out to be particularly useful [10,29].
Riparian buffers are one of the most commonly used solutions for protecting water quality in rivers, streams, lakes and reservoirs [30,31]. In studies conducted all over the world, their effectiveness is observed with regards to their retention of nitrogen and phosphorus compounds and sediment carried with overland flow. Great emphasis is placed on their proper design—appropriate width, species composition and plant zoning [30,31,32,33]. However, the results obtained from numerous field studies i.e., by Dosskey et al. [34] and Knight et al. [5], suggest that flow concentration commonly reduces the efficiency of riparian buffers (buffering capacity). The effective area of riparian buffer which takes part in pollutant and sediment removal is much smaller when concentrated (channelised) on surface flow crosses or even bypasses vegetation strips. Nowadays, methods based on using high resolution remote sensing data offer the opportunity to take a new look at the transport of nutrients and sediment to surface waters and to precisely indicate surface runoff pathways, taking into account terrain microtopography (small grooves or furrows) and to quickly diagnose the problem of concentrated surface flow, both on a field and catchment scale, omitting time-consuming field studies usually carried out in small areas [10,16,17,26,28,29].
The article introduces a GIS-based approach for mapping surface runoff pathways from surrounding areas to drinking water reservoir and detecting areas with a tendency for excessive flow accumulation. High resolution DTM (bare-earth DEM) generated from easily available LiDAR data was used in the research. The method enables targeting cost-effective mitigation efforts (shaping of surface runoff transport pathways—breaking up to prevent high flow concentration) or optimal location for runoff water monitoring, harvesting and treatment systems.
2. Materials and Methods
2.1. Study Area
The Dobromierz Reservoir (Figure 1) was built in the south-western part of Poland in the years 1977–1986, when the Strzegomka River valley was partitioned by an earth dam (GPS N: 50°54′27″, E: 16°14′37″). Its basic function is to serve as drinking water supply for the town of Świebodzice and the commune of Dobromierz (useful capacity 9 million m3) and flood protection of downstream areas (flood reserve capacity 1.35 million m3). At full reservoir level, the capacity of the reservoir is 11.35 million m3 and the surface area is 111 ha. The basic parameters of the Dobromierz Reservoir are presented in Table 1. In order to collect water from the reservoir, two steel pipelines with a diameter of 500 mm were installed. Each of them has three inlets situated at different heights of the tower. The water from the reservoir is treated in the process of double filtration with the use of disk and gravel filters, coagulation and final disinfection. Daily water production in the Dobromierz treatment plant is about 4500 m3. During algal bloom, disk filters are used and if needed, the depth of water collection from the reservoir is changed.
The Strzegomka River is a left-bank tributary of the Bystrzyca River, which in turn is a tributary of the Odra River (Figure 1). For the dam cross section of the Dobromierz Reservoir, mean annual flow is 0.781 m3·s−1, the surface of the catchment is 80.7 km2 and its mean slope is 5.2% [36,37].
The catchment of the Strzegomka River to the cross section of the dam is intensively used for agriculture, 60% is agricultural land, 32% forests and 2% is developed area. The surface layer is dominated by semipermeable deposits and in the region of Dobromierz, Chwaliszów and the Wałbrzyskie Mountains there are poorly permeable and impermeable deposits on the surface. In watercourses valleys, in turn, permeable deposits prevail [37].
In the analysed region, farmers use conventional tillage practices, agricultural best management practices are often violated—usually with regards to ploughing direction and improper fertiliser application. According to the data from the Local Data Bank provided by Statistic Poland, in plant production, winter wheat, spring and winter barley and winter rape are predominant. The usage of nitrogen fertilisers is high here, in the period 2000–2014 it doubled and in 2014 it amounted to ca. 135 kg·ha−1. Animal production is dominated by intensive breeding of laying hens, the poultry population exceeds 850,000 animals. The catchment is to a large extent covered by a sewage system and in 2006 a wastewater treatment plant was opened in Chwaliszów. The area is inhabited by about 3000 people. Nitrogen load in poultry manure produced in the catchment corresponds to the load produced with the faeces of 100,000 people and the phosphorus of 400,000 [36,38].
The reservoir is surrounded by upland mixed broadleaved forests, in which oaks (Quercus sp.), Norway spruce (Picea abies (L.) Karst.), Sycamore maple (Acer pseudoplatanus L.) and lindens (Tilia sp.) grow. There are trees of different ages—older, from forest age-class 61–80 and 81–100 years and also those planted during the construction of the reservoir 30 years ago. The forests are situated within the Natura 2000 area PLH020034 (under Habitats Directive). In Europe, Natura 2000 is a EU-wide network of protected areas established under the Habitats and Birds Directives.
The mean monthly precipitation and air temperatures (2000–2014) for the study area are presented in Table 2, mean annual flow (2000–2014) in the Strzegomka River above the Dobromierz Reservoir is shown in Table 3.
The waters of the Strzegomka River above the Dobromierz Reservoir are characterised by increased concentrations of nutrients; the process of eutrophication occurs here. The analysis shows that the most important factor influencing nutrients loads (both N and P compounds) in the Strzegomka River is precipitation [36,37]; there is a high risk that these pollutants will be mobilised. The concentrations of total nitrogen, nitrate and ammonia nitrogen examined for the period 2000–2014 showed a decreasing trend. For total Kjeldahl nitrogen, total phosphorus and phosphate no statistically significant trend was noted. Despite the implementation of the Water Framework Directive in Poland, no significant improvement of water quality and good surface water status had been achieved in the catchment by 2015 [36,38].
2.2. Geospatial Data and Digital Terrain Analysis
A digital terrain model was used to determine the area of direct surface runoff feeding the Dobromierz Reservoir (direct catchment). The model was created on the basis of LiDAR data from aerial laser scanning of April 2012. The data in the form of a 4 pts/m2 point cloud were obtained from the ISOK (IT System of the Country’s Protection against Extreme Hazards) project. They were made available under a license from the Main Centre for Geodesic and Cartographic Documentation, Poland. A digital terrain model with a spatial resolution of 0.4 m was generated from the point cloud in ArcGIS 10.3 software for further analysis. The model was hydrologically conditioned with the Fill function in the Spatial Analyst extension in order to designate and correct erroneous sinks and peaks. When correcting errors, care was taken not to remove real microtopographic features and to avoid excessive model generalization [17,39,40], especially as the studied area is characterised by diversified natural and anthropogenic relief (submountain catchment with different types of agricultural activity). A slope raster (Slope function) was also created on the basis of the DTM.
In the next steps, flow directions of surface runoff were established (Flow Direction function, force all edge cells to flow outward option was chosen) and then flow accumulation was determined (Flow Accumulation function). The Flow Direction tool implements the D8 algorithm to create a flow direction raster [41]. In order to determine a direct catchment of the reservoir (the part of the catchment from which waters flow directly or through a network of small watercourses to the reservoir) the Arc Hydro package was used. According to the size of the analysed area, six classes were established for the accumulation of the surface runoff: 1–10 ha, 10–25 ha, 25–50 ha, 50–100 ha, 100–200 ha and >200 ha. For surface runoff areas of less than 1 ha no flow accumulation was observed. The next step was to determine and characterise the following zones:
- Main surface runoff areas (main subcatchments) >100 ha
- Class > 200 ha
- Class 100–200 ha
- Mid-range subcatchments 10–100 ha
- Class 50–100 ha
- Class 25–50 ha
- Class 10–25 ha
- Microcatchments 0–10 ha
- Class 1–10 ha
Inshore surface runoff area <1 ha (areas with no tendency to flow accumulation)
To elaborate the characteristics of the studied area, orthophotomaps licensed by the Head Office of Land Surveying and Cartography, Poland were also used, as well as land usage data from Corine Land Cover 2012 provided by Chief Inspectorate of Environmental Protection, Poland. To verify the hydrological network, the Map of Hydrological Division of Poland (MHDP) was used. Meteorological and hydrological data provided by the Institute of Meteorology and Water Management-National Research Institute (IMGW-PIB) were elaborated for the study site characteristics. All the analyses and resulting maps were created on the basis of spatial data in the PL-92 EPSG: 2180 coordinate system.
The proposed approach can be replicable in most GIS software (including free software). High resolution LiDAR data are available free of charge for research and teaching purposes and are also offered for commercial purposes and their reasonable price does not prevent them from being used in practice.
3. Results and Discussion
On the basis of the DTM, the surface area of the direct catchment was determined—998 ha (terrestrial and aquatic part). In the majority of the studied lands, terrain slopes do not exceed 10°, in the vicinity of the reservoir the slope increases to more than 40° and to a maximum of 86° (Figure 2). The western and central parts of the direct catchment are intensively used for agriculture, with areas of dispersed development. In the eastern part, where the Dobromierz Reservoir is located, forests dominate and the width of the forest strip around the reservoir reaches 650 m (Figure 3). In the analysed area, arable lands and rural settlements constitute 55.4%, forests 33.5%, water bodies 11.0% and discontinuous urban fabric 0.1% (Figure 3). The asymmetrical layout of the direct catchment is visible; the western part has a much larger area than the eastern part and is used mainly for agriculture; the western bank is deprived of riparian buffer zone on two 500 m sections, vegetation strips have a residual width here. The eastern part is almost entirely covered by forests (Figure 3).
Figure 4 presents an exact flow accumulation map (flow accumulation counted from junction to junction). The obtained layout of the surface transport pathways was verified with cartographic material (orthophotomaps and the Map of Hydrological Division of Poland). It is compatible with the hydrological network (according to the MHDP) illustrated in Figure 3. Figure 4 shows that our pathways are a development of a network of small (temporary and perennial) streams depicted in Figure 3. We obtained a very detailed image showing also the temporary pathways by which water flows only during heavy rainfall and the concentration of runoff. Temporary pathways are situated in the vicinity of the reservoir and in the eastern part of the direct catchment; in the western part they constitute a structure feeding small watercourses. On the basis of Figure 4, a flow accumulation map was created, which illustrates:
● Main surface runoff areas (main subcatchments) >100 ha
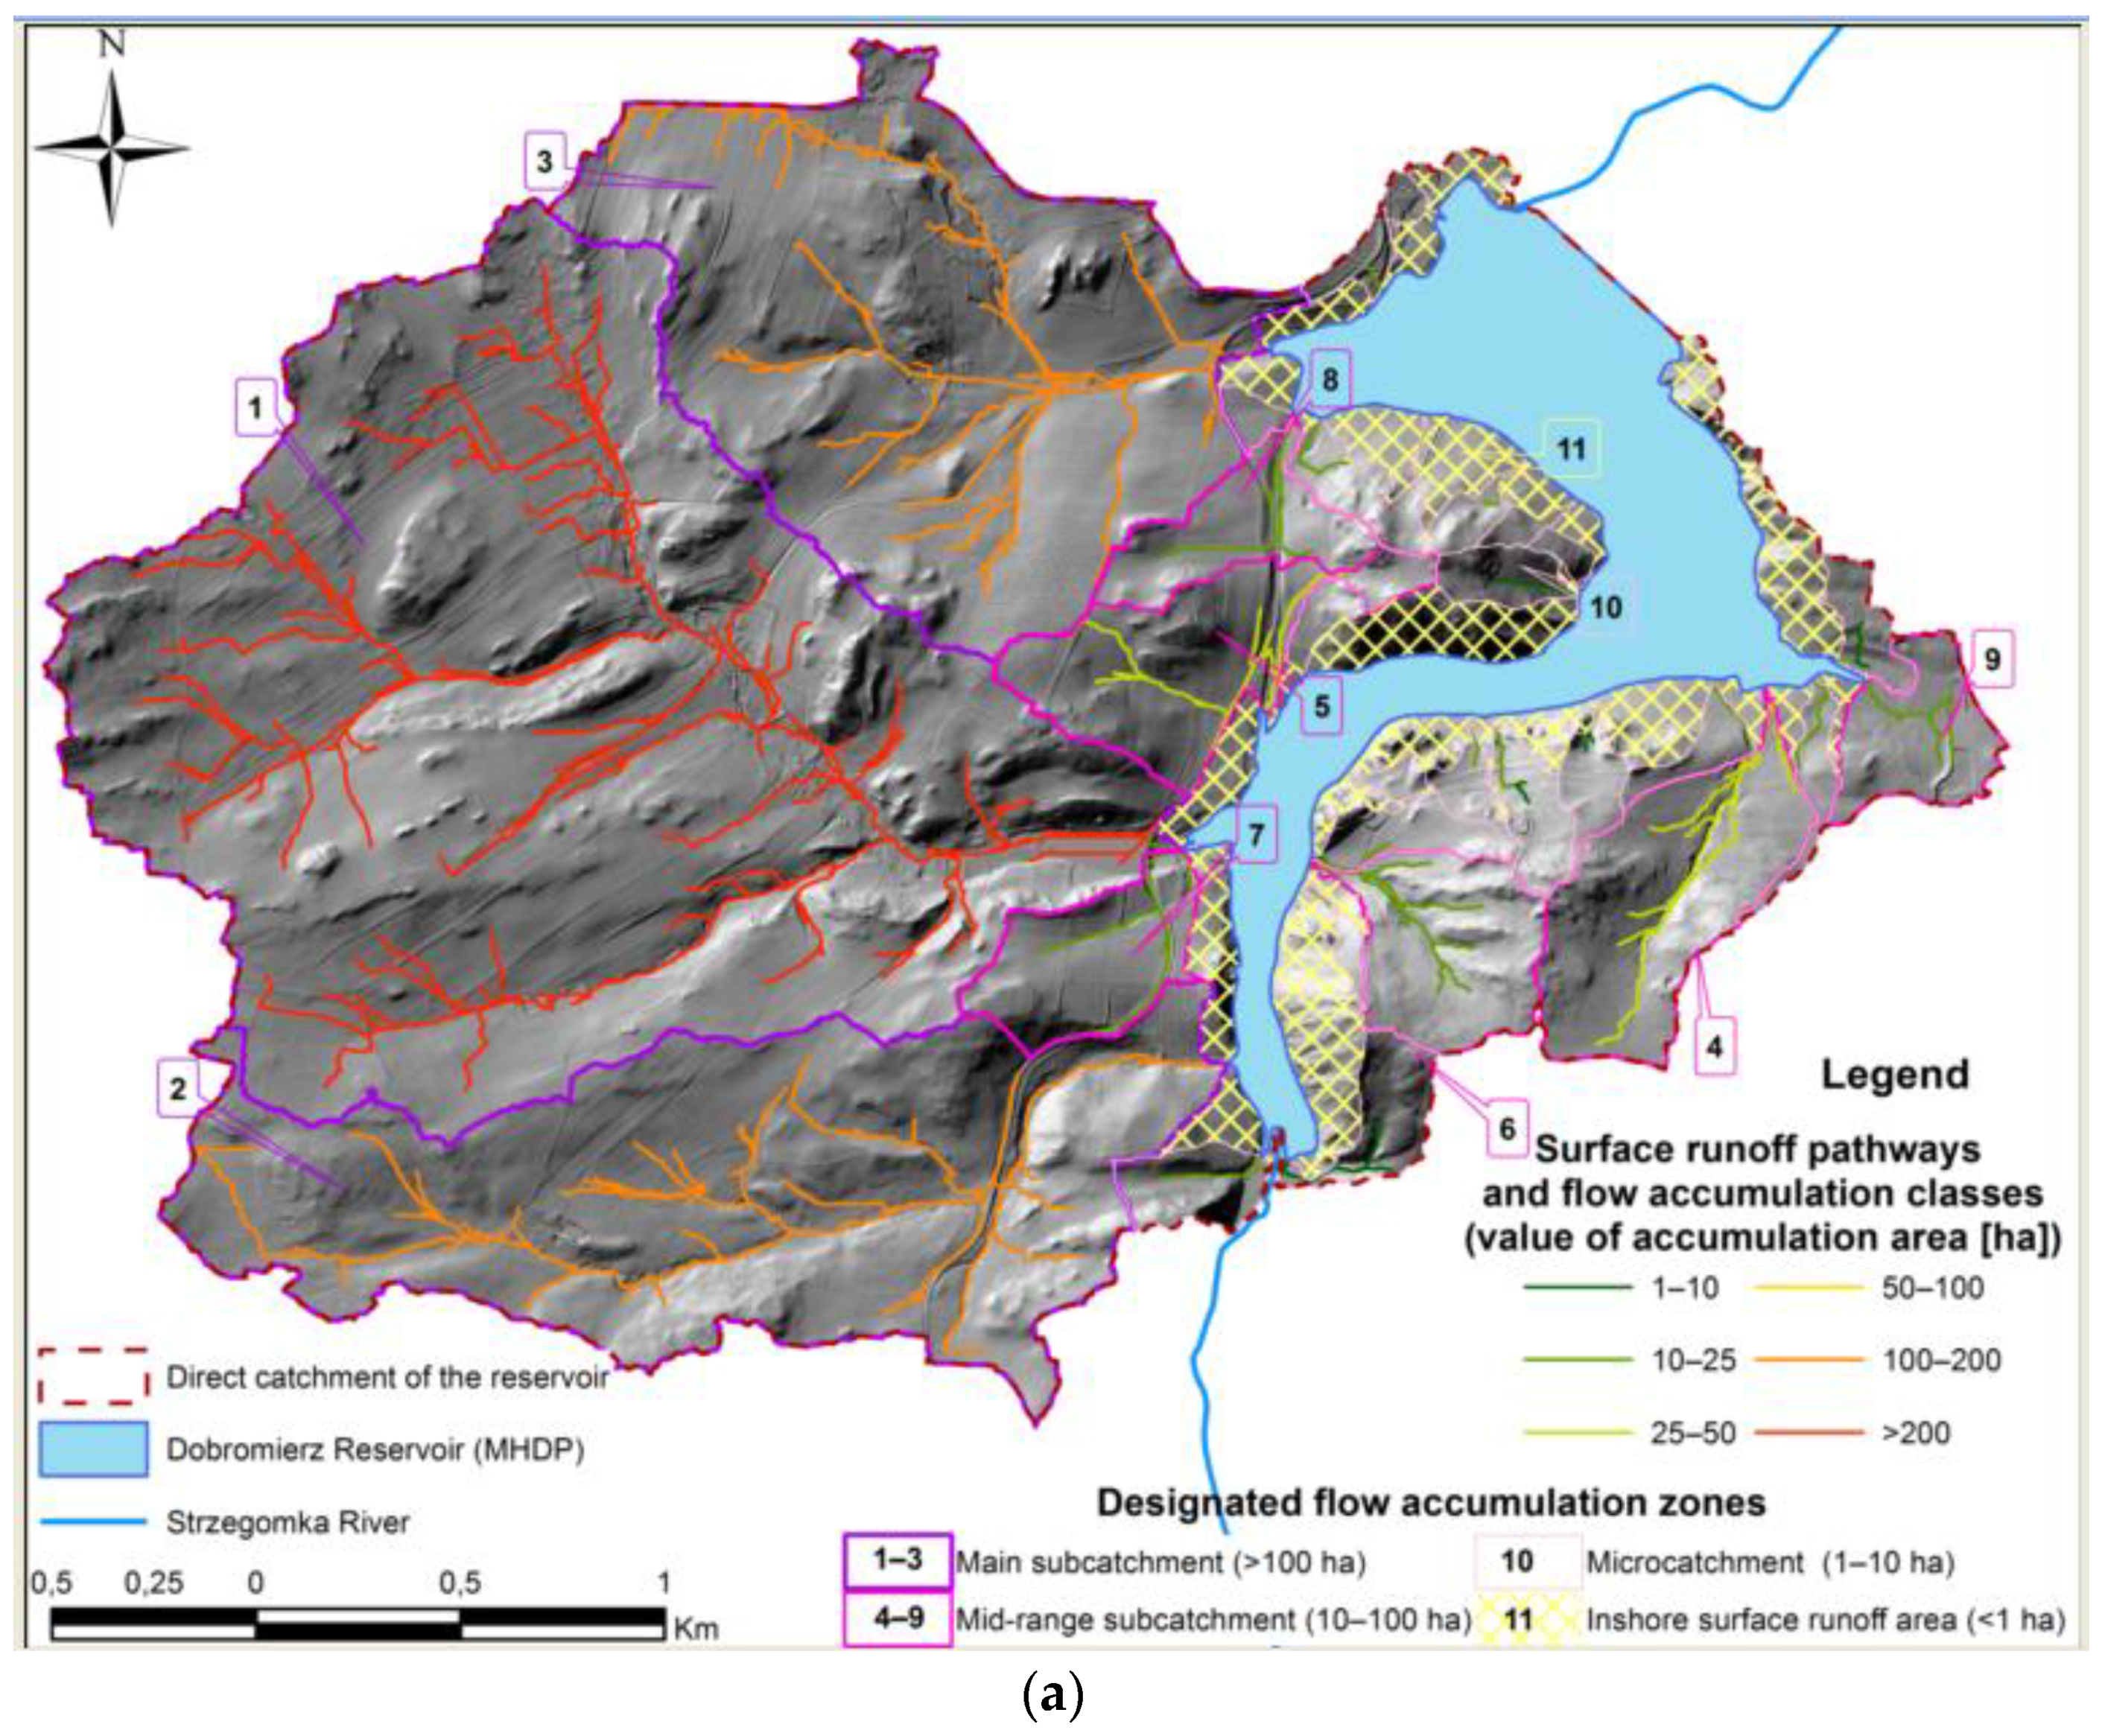
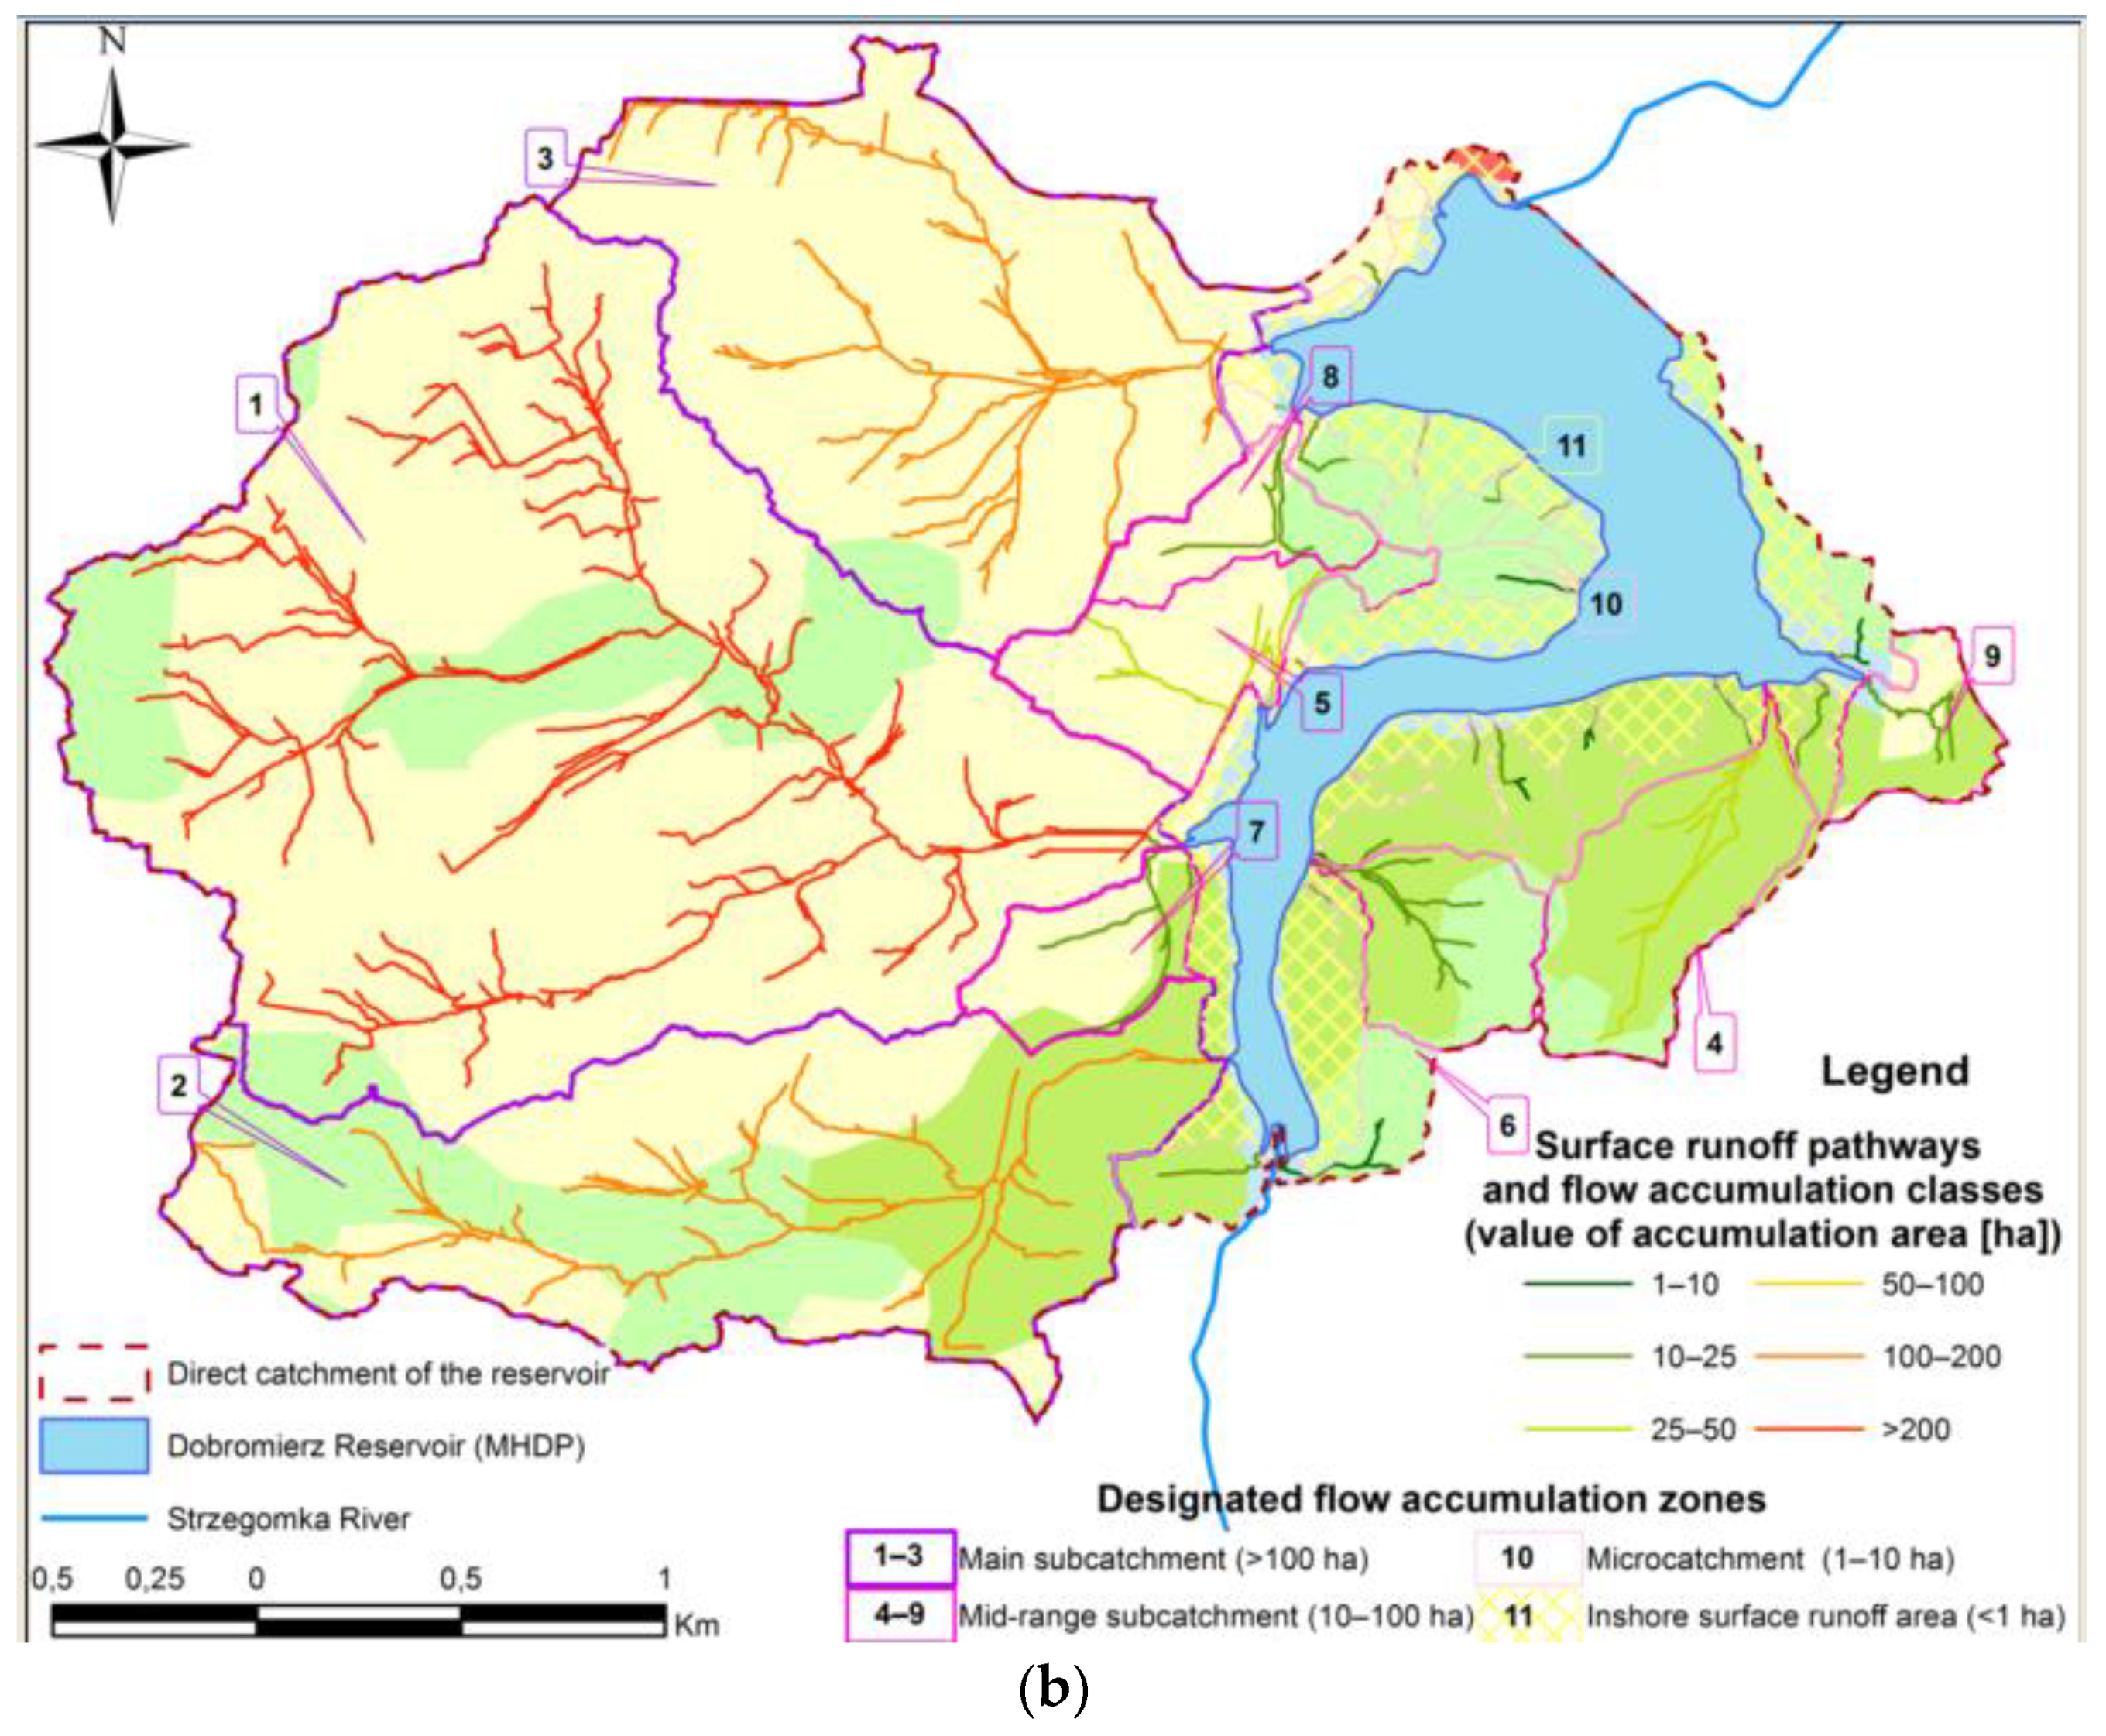
On the basis of the conducted analyses of surface runoff accumulation, area No. 1 (Figure 5) was designated in the catchment, where the concentration of overland flow takes place from over 200 ha (353 ha) and arable land is prevailing. Two other areas were identified, from the range 100–200 ha—No. 2 (152 ha) with predominant forests (62%) and No. 3 (147 ha) with the majority of arable land (97%). Those three sites were selected as the main surface runoff areas > 100 ha (Figure 5) with a high tendency for surface runoff concentration (Table 4). In case of Nos. 1 and 3, the concentration of overland flow takes place mostly along the roads connecting rural settlements and is largely corresponding to the road drainage system; for area No. 2 these are natural hollows and to a lesser extent, parts of the road drainage system. For area No. 1 (as the only one), the pathway of concentrated flow corresponds to the perennial stream (Figure 3 and Figure 5).
Areas No. 1 and 3 pose the greatest problem with regards to the threat to the quality of water retained in the reservoir. They are mostly covered with arable land, with some rural settlements. The analysis of the maps shows that some fields are not cultivated in accordance with agricultural best management practices, as they are not ploughed parallel to the slopes. Accumulated surface runoff reaches the reservoir on the western bank, in places lacking forested buffer strip (Figure 5). This part of the catchment does not have buffering capacity. At the same time, it should be recognised that in connection with the relationship between nutrient load and precipitation observed for the Strzegomka catchment, there is a high risk of pollutants mobilisation [36,37].
Area No. 2 lies outside of the protected Natura 2000 network. The structure of the forests is not homogeneous here, they are crossed by roads and there are also fields not cultivated in accordance with agricultural best management practices. Runoff water from the fields through the forests flows in a channelised way to the reservoir on the western bank. The buffering capacity and active area of forest described by Knight et al. [5] is used only partly here (Figure 5).
● Mid-range subcatchments 10–100 ha
Class 25–50 ha comprises areas Nos. 4 and 5: 31 ha, 100% of forests and 26 ha, 87% of arable land, respectively. Four areas: 19 ha (No. 6), 17 ha (No. 7), 13 ha (No. 8), 12 ha (No. 9), are included in the range 10–25 ha, the largest one is completely overgrown with forest, the remaining three are dominated by arable land. Areas Nos. 4−7 assigned as >10 ha (<100 ha) (Figure 5) were attributed a medium tendency for surface runoff concentration (Table 4).
● Microcatchments 0–10 ha
The smallest accumulation of overland flow takes place in the vicinity of the reservoir, where 21 areas of more than 1 ha (<10 ha) were designated—No. 10 and in the shore zone (No. 11), wherefrom water in a direct and unconcentrated way flows into the reservoir from forested areas (several dozens of microcatchments, 0–1 ha each), in total comprising 62 and 74 ha, respectively (Figure 5). For those parts of the catchment there is a low tendency for surface runoff concentration (Figure 5 and Table 4). Despite large slope gradients, there is no significant concentration of overland flow. The area is covered with a forest (protected within Natura 2000), which serves as a riparian buffer zone. The structure of the forest is not homogenous, there is no well-developed regular network of roads and skid trails along which increased erosion processes usually take place [42,43]. Inconsiderable overland flow occurs here via natural pathways, a minor part of it along dirt roads (Figure 4).
According to the method of assessment of a catchment as a supplier of biogenic matter to a lake presented by Bajkiewicz-Grabowska [44], high exposure of the reservoir to the supply of biogenic matter (by overland flow) from a direct catchment may be affected primarily by average land slopes significantly exceeding 20 m·km−1 (Figure 2); the development of the western part of the direct catchment, where agricultural areas with settlements predominate and the proportion of forests is small (Figure 3), an open (throughflow) character of the reservoir, a developed network of small watercourses and a negligible percentage of depression areas that lack any water outflow to other external bodies of water (Figure 3). An undoubted advantage of the proposed method is the possibility to observe the effects of overlapping factors influencing surface runoff. In the studied area, positive and negative factors often occur in the same places, e.g., in the terrain with the greatest slopes there are forests, which partially levelled out the surface runoff accumulation (Figure 2, Figure 3, Figure 4 and Figure 5).
Forests provide ecosystem services of water regulation and purification, and lower surface runoff generation occurs here [45,46,47]. Studies conducted in European forests show that the influence of a forest on surface runoff reduction is visible, when over 30% of the catchment is forested. In case of a 30–70% cover, retention increases by 25%. Evaporation losses (transpitation + interception) for different land covers receiving 1000 mm annual rainfall are as follows: coniferous forest 550–800 mm, broadleaved forest 400–640 mm, grass 400–600 mm, heather 360–610 mm [46]. The basic characteristics of designed flow accumulation areas prepared on the basis of spatial data (Figure 2, Figure 3, Figure 4 and Figure 5) and their references to literature [44,45] are presented in Table 4. For simplification, there is a division in the Table 4 into three levels of surface runoff concentration according to accumulation zones from Figure 5—High: >100 ha, Medium: 10–100 ha, Low: <10 ha. For agricultural diffuse pollution present in a given area—High: agricultural areas constitute >70%, Medium: agricultural areas 30–70%, Low: <30% of agricultural areas. For possibility of reducing the surface runoff generation by the forest—Low: forests <30%, Medium: forests 30–70%, High: >70% of forests.
The analysis shows that in microcatchments situated entirely within forested riparian buffer there is no tendency for concentration of surface runoff. On the eastern forested side there are no privileged pathways of concentrated flow in the direct catchment. In the western part, three large areas were detected where both the concentration of surface runoff takes place and the sources of diffuse agricultural pollution are located. For these areas, mitigation strategies related to breaking up of surface runoff transport pathways to prevent high flow concentration or stormwater harvesting and treatment should be planned first. To avoid overland flow it is necessary to change the direction of ploughing according to BMPs and to adopt anti-erosion tillage practices, to propose a change of management of some areas, to introduce natural cover plants and plant cover crops. To control (slow down) surface runoff, it is recommended to apply infiltration techniques compatible with sustainable rural stormwater management. Establishing additional riparian buffer zones on concentrated surface runoff pathways gives the possibility to trap and treat surface runoff water. Such actions are recommended first for the largest main surface runoff area No. 1 where the pathway of concentrated flow corresponds to the perennial stream.
The designed map of concentrations of overland flow (Figure 5) connected with land use characteristics, on the basis of spatial data available, allows to indicate areas (Nos. 1, 2 and 3) where mitigation measures can be applied in a cost-effective way, or places recommended for the location of facilities for surface runoff monitoring of high frequency (i.e., points where concentrated overland flow reaches the tank from the main surface runoff areas). The next areas for which the mitigation of surface runoff may be considered are in turn: Nos. 5, 7, 8, 9.
In the studies on the determination of catchment areas with highest risk of transfer of pollutants to receiving water bodies [6,7,10,17], it is emphasised that these areas must simultaneously contain sources of pollutants, a high risk of mobilisation of these pollutants (i.e., as in the catchment of the Dobromierz Reservoir a strong relationship between precipitation and NPS nutrient load in surface water), surface runoff generation capacity and hydrological connectivity. Pollutant transfer continuum proposed for this process comprise the path from source, via mobilisation, transport + hydrological connectivity, delivery, to impact [10,48]. Our approach is completely in line with this theory.
The research conducted in the subject matter discussed in this paper can be divided into four groups: The effectiveness of riparian buffer zones [5,32,34,49], the determination of critical source areas and hydrologically sensitive areas [6,7,10,17,50,51,52], modelling of non-point source pollution [16,53] and sustainable stormwater management [27,53]. In order to develop a method of identifying surface runoff pathways, we tried to use the advantages of mitigation efforts and to eliminate the existing gaps and disadvantages in the approaches applied so far.
The effectiveness of riparian buffers is most often studied using field methods [5,32,34] and the authors increasingly notice the problem of concentrated flow through riparian buffers [5,34,49]. Compared to these studies, our approach gives an opportunity to quickly diagnose the state of vegetation strips, it may also be a preliminary phase of research, indicating the locations of cost-effective net monitoring.
Determination of critical source areas and hydrologically-sensitive areas is based mainly on remote sensing data and GIS software [6,7,10,17,51]. The research presented in literature mostly has the character of case studies conducted in catchments with high availability of spatial data and data from environmental monitoring (land use, precipitation, slope, detailed soil characteristics, water quality data). One of the elements of the model here are surface runoff pathways maps. These studies may be helpful when selecting the optimal DEM resolutions and point densities for identifying surface runoff pathways. For the determination of CSAs and HSAs, a wide range of DEM resolutions is used. Thomas et al. [17] showed that 1–2 m LiDAR DEMs with reduced bare-earth point densities 2–5 pts/m2 were optimal to determine flow pathways controlled by both microtopography and hillslope convergence in the catchments under study. Five metre and 30 m DEMs are currently being replaced in studies of diffuse agricultural pollution by high resolution DEMs (3 m and less) [10,17,51,52]. In each individual case, one should choose the optimal DEM resolutions, which depends primarily on the topography of the catchment area [10,17]. DEM resolution and the quality of LiDAR data is one of the few limitations of our method, it requires high resolution data and DEM. In the submountain catchment we used LiDAR data in the form of a 4 pts/m2 point cloud and we created a digital terrain model with a spatial resolution of 0.4 m.
The most commonly used NPS water quality models are AGNPS, ANSWERS, SWAT, CREAMS and many other solutions created by scientists can be found in current research [16,53]. When developing models, the balance between user-friendliness and model complexity should be maintained. Application constraints usually result from catchment size, data availability and resolution and computing power [53]. It is extremely difficult to find models which have adequate flexibility in terms of input data; for small catchments, a part of the data is unavailable and a part is collected at uneven intervals [16]. More and more often the existence of a gap between science and practice is emphasised [6]. The proposed methods must be simple enough to be implemented by water managers and policy makers. In surface water-dominated catchments, breaking up of pollution transfer pathways and designing of stormwater detention features are the basis of current strategies for mitigation of nonpoint source pollution [15]. Our solution requires data available for most small catchments (LiDAR and land use data), the methodology is simple and research can be carried out using a wide range of GIS software. The method is intended to be quick, user-friendly and of direct practical relevance, dedicated for catchments where data essential to advanced NPS pollution modelling (e.g., hydrological, meteorological and geological data, as well as high frequency surface water quality data) are not collected.
Sustainable stormwater management is mainly connected with Sustainable Urban Drainage Systems (SUDS) [54]. In urban areas, tools based on GIS and remote sensing data [22,27] are being developed to support stormwater management. For Rural Sustainable Drainage Systems (RSuDS) such solutions are missing. The approach proposed by the authors is especially recommended for the establishment and restoration of riparian buffer zones, but can be successfully used to locate RSuDS.
4. Conclusions
The proposed GIS-based method for identifying surface runoff pathways from surrounding areas to drinking water reservoir allows for a simple and quick diagnosis of the problem of transport of pollutants and sediment from land to water in areas of different sizes. The potential for high concentration of overland flow was indicated for three main surface runoff areas exceeding 100 ha. The results show that in forested parts of the catchment and especially in forested riparian buffers there is no tendency for the concentration of surface runoff. Unfortunately, concentrated overland flow from the two largest agricultural areas enters the reservoir in a channelised way in places where vegetation buffer has the smallest width (or practically does not exist). This work has highlighted the problem of concentrated surface runoff, moreover our method and findings are of direct practical relevance. The presented approach may be used in designing and maintaining reservoirs for their optimal protection by ecohydrological measures, however, the results should be applicable also for the location of Rural Sustainable Drainage Systems.
We believe that our research will serve as a base for future studies, among others to model the impact of changes in the way part of the catchment is managed (i.e., the establishment of new riparian zones) on surface runoff flow direction and flow accumulation, to develop GIS procedure and combine it with soil loss models or to create a network of high-frequency monitoring in the catchment and advanced modelling of NPS including surface runoff quality and quantity.
Author Contributions
Conceptualization, J.D.; Data curation, J.D., P.B.D. and I.L.; Formal analysis, J.D. and P.B.D.; Funding acquisition, J.D.; Investigation, J.D., P.B.D. and I.L.; Methodology, J.D. and P.B.D.; Project administration, J.D.; Resources, J.D. and P.B.D.; Supervision, J.D.; Validation, J.D. and P.B.D.; Visualization, P.B.D.; Writing-original draft, J.D., P.B.D. and I.L.; Writing-review & editing, J.D. and P.B.D.
Funding
This research received no external funding.
Acknowledgments
The study was based on LiDAR ALS data-license No. DIO.7211.197.2016_PL_N, orthophotomaps were also used in the article-license No. DIO.7211.226.2018_PL_N. (Geospatial data are available free of charge for research and teaching purposes from the Main Centre for Geodesic and Cartographic Documentation and Head Office of Land Surveying and Cartography, Poland). Licenses have been issued for Paweł B. Dąbek, Wrocław University of Environmental and Life Sciences, Institute of Environmental Protection and Development.
Conflicts of Interest
The authors declare no conflict of interest.
References
- Kim, K.; Kim, B.; Eum, J.; Seo, B.; Shope, C.L.; Peiffer, S. Impacts of land use change and summer monsoon on nutrients and sediment exports from an agricultural catchment. Water 2018, 10, 544. [Google Scholar] [CrossRef]
- Almaarofi, H.; Etemad-Shahidi, A.; Stewart, R.A. Strategic evaluation tool for surface water quality management remedies in drinking water catchments. Water 2017, 9, 738. [Google Scholar] [CrossRef]
- Smith, V.H.; Joye, S.B.; Howarth, R.W. Eutrophication of freshwater and marine ecosystems. Limnol. Oceanogr. 2006, 51, 351–355. [Google Scholar] [CrossRef] [Green Version]
- Spanhoff, B.; Bischof, R.; Bohme, A.; Lorenz, S.; Neumeister, K.; Nothlich, A.; Kusel, K. Assessing the impact of effluents from a modern wastewater treatment plant on breakdown of coarse particulate organic matter and benthic macroinvertebrates in a lowland river. Water Air Soil Pollut. 2007, 180, 119–129. [Google Scholar] [CrossRef]
- Knight, K.W.; Schultz, R.C.; Mabry, C.M.; Isenhart, T.M. Ability of emnant riparian forests, with and without grass filters, to buffer concentrated surface runoff. J. Am. Water Resour. Assoc. 2010, 46, 311–322. [Google Scholar] [CrossRef]
- Agnew, L.J.; Lyon, S.W.; Gerard-Marchant, P.; Collins, V.B.; Lembo, A.J.; Steenhuis, T.S.; Walter, M.T. Identifying hydrologically sensitive areas: Bridging the gap between science and application. J. Environ. Manag. 2006, 78, 63–76. [Google Scholar] [CrossRef] [PubMed]
- Mellander, P.E.; Jordan, P.; Shore, M.; Melland, A.R.; Shortle, G. Flow paths and phosphorus transfer pathways in two agricultural streams with contrasting flow controls. Hydrol. Process. 2015, 29, 3504–3518. [Google Scholar] [CrossRef]
- Ahmad, N. Nitrogen Economy in Tropical Soils; Kluwer Academic Publishers: Dordrech, The Netherlands, 1996; Volume 69. [Google Scholar]
- Sharpley, A.N.; Chapra, S.C.; Wedepohl, R.; Sims, J.T.; Daniel, T.C.; Reddy, K.R. Managing agricultural phosphorus for protection of surface waters: Issues and options. J. Environ. Qual. 1994, 23, 437–451. [Google Scholar] [CrossRef]
- Thomas, I.A.; Jordan, P.; Mellander, P.E.; Fenton, O.; Shine, O.; Huallachain, D.O.; Creamer, R.; McDonald, N.T.; Dunlop, P.; Murphy, P.N.C. Improving the identification of hydrologically sensitive areas using LiDAR DEMs for the delineation and mitigation of critical source areas of diffuse pollution. Sci. Total Environ. 2016, 556, 276–290. [Google Scholar] [CrossRef] [PubMed]
- El Kateb, H.; Zhang, H.F.; Zhang, P.C.; Mosandl, R. Soil erosion and surface runoff on different vegetation covers and slope gradients: A field experiment in Southern Shaanxi Province, China. Catena 2013, 105, 1–10. [Google Scholar] [CrossRef]
- Huber, U.M.; Bugmann, H.K.M.; Reasoner, M.A. Global Change and Mountain Regions: An Overview of Current Knowledge; Springer: Dordrecht, The Netherlands, 2005; p. 650. [Google Scholar]
- Cassidy, R.; Jordan, P. Limitations of instantaneous water quality sampling in surface-water catchments: Comparison with near-continuous phosphorus time-series data. J. Hydrol. 2011, 405, 182–193. [Google Scholar] [CrossRef]
- Sharpley, A.N.; Gburek, W.J.; Folmar, G.; Pionke, H.B. Sources of phosphorus exported from an agricultural watershed in Pennsylvania. Agric. Water Manag. 1999, 41, 77–89. [Google Scholar] [CrossRef]
- Ockenden, M.C.; Hollaway, M.J.; Beven, K.J.; Collins, A.L.; Evans, R.; Falloon, P.D.; Forber, K.J.; Hiscock, K.M.; Kahana, R.; Macleod, C.J.A.; et al. Major agricultural changes required to mitigate phosphorus losses under climate change. Nat. Commun. 2017, 8. [Google Scholar] [CrossRef] [PubMed]
- Adu, J.T.; Kumarasamy, M.V. Assessing Non-Point Source Pollution Models: A review. Pol. J. Environ. Stud. 2018, 27, 1913–1922. [Google Scholar] [CrossRef]
- Thomas, I.A.; Jordan, P.; Shine, O.; Fenton, O.; Mellander, P.E.; Dunlop, P.; Murphy, P.N.C. Defining optimal DEM resolutions and point densities for modelling hydrologically sensitive areas in agricultural catchments dominated by microtopography. Int. J. Appl. Earth Obs. Geoinf. 2017, 54, 38–52. [Google Scholar] [CrossRef]
- Dupas, R.; Delmas, M.; Dorioz, J.M.; Garnier, J.; Moatar, F.; Gascuel-Odoux, C. Assessing the impact of agricultural pressures on N and P loads and eutrophication risk. Ecological Indic. 2015, 48, 396–407. [Google Scholar] [CrossRef]
- Lee, J.; Rai, P.K.; Jeon, Y.J.; Kim, K.H.; Kwon, E.E. The role of algae and cyanobacteria in the production and release of odorants in water. Environ. Pollut. 2017, 227, 252–262. [Google Scholar] [CrossRef] [PubMed]
- Yan, C.; Song, X.; Yu, M.; Tong, Y.; Zhang, W. Determining the effects of polyaluminum chloride alkalinities and dosage treatments on various microalgal growth phases for the treatment of microalgae-laden water. Sep. Purif. Technol. 2019, 209, 202–210. [Google Scholar] [CrossRef]
- He, X.X.; Liu, Y.L.; Conklin, A.; Westrick, J.; Weavers, L.K.; Dionysiou, D.D.; Lenhart, J.J.; Mouser, P.J.; Szlag, D.; Walker, H.W. Toxic cyanobacteria and drinking water: Impacts, detection and treatment. Harmful Algae 2016, 54, 174–193. [Google Scholar] [CrossRef] [PubMed]
- Wang, X.; Xie, H. A Review on Applications of Remote Sensing and Geographic Information Systems (GIS) in Water Resources and Flood Risk Management. Water 2018, 10, 608. [Google Scholar] [CrossRef]
- Joshi, N.; Baumann, M.; Ehammer, A.; Fensholt, R.; Grogan, K.; Hostert, P.; Jepsen, M.R.; Kuemmerle, T.; Meyfroidt, P.; Mitchard, E.T.A.; et al. A review of the application of optical and radar remote sensing data fusion to land use mapping and monitoring. Remote Sens. 2016, 8, 70. [Google Scholar] [CrossRef]
- Kaluza, T.; Tymkow, P.; Strzelinski, P. Use of remote sensing for investigating riparian shrub structures. Pol. J. Environ. Stud. 2012, 21, 115–122. [Google Scholar]
- Holman, F.H.; Riche, A.B.; Michalski, A.; Castle, M.; Wooster, M.J.; Hawkesford, M.J. High throughput field phenotyping of wheat plant height and growth rate in field plot trials using UAV based remote sensing. Remote Sens. 2016, 8, 1031. [Google Scholar] [CrossRef]
- Tokarczyk-Dorociak, K.; Kazak, J.; Szewranski, S. The Impact of a Large City on Land Use in Suburban Area - The Case of Wroclaw (Poland). J. Ecol. Eng. 2018, 19, 89–98. [Google Scholar] [CrossRef]
- Szewranski, S.; Chruscinski, J.; Kazak, J.; Swiader, M.; Tokarczyk-Dorociak, K.; Zmuda, R. Pluvial flood risk assessment tool (PFRA) for rainwater management and adaptation to climate change in newly urbanised areas. Water 2018, 10, 386. [Google Scholar] [CrossRef]
- Dabek, P.; Zmuda, R.; Cmielewski, B.; Szczepanski, J. Analysis of water erosion processes using terrestrial laser scanning. Acta Geodyn. Geomater. 2014, 11, 45–52. [Google Scholar] [CrossRef]
- Woodrow, K.; Lindsay, J.B.; Berg, A.A. Evaluating DEM conditioning techniques, elevation source data and grid resolution for field-scale hydrological parameter extraction. J. Hydrol. 2016, 540, 1022–1029. [Google Scholar] [CrossRef]
- Mander, U.; Tournebize, J.; Tonderski, K.; Verhoeven, J.T.A.; Mitsch, W.J. Planning and establishment principles for constructed wetlands and riparian buffer zones in agricultural catchments. Ecol. Eng. 2017, 103, 296–300. [Google Scholar] [CrossRef]
- Correll, D.L. Principles of planning and establishment of buffer zones. Ecol. Eng. 2005, 24, 433–439. [Google Scholar] [CrossRef]
- Lee, K.H.; Isenhart, T.M.; Schultz, R.C. Sediment and nutrient removal in an established multi-species riparian buffer. J. Soil Water Conserv. 2003, 58, 1–8. [Google Scholar]
- Dabrowska, J.; Kaczmarek, H.; Markowska, J.; Tyszkowski, S.; Kempa, O.; Galeza, M.; Kucharczak-Moryl, E.; Moryl, A. Shore zone in protection of water quality in agricultural landscape-the Msciwojow Reservoir, southwestern Poland. Environ. Monit. Assess. 2016, 188, 467. [Google Scholar] [CrossRef] [PubMed]
- Dosskey, M.G.; Helmers, M.J.; Eisenhauer, D.E.; Franti, T.G.; Hoagland, K.D. Assessment of concentrated flow through riparian buffers. J. Soil Water Conserv. 2002, 57, 336–343. [Google Scholar]
- Putowski, M. Instruction Manual for the Maintenance and Water Management of the Dobromierz Retention Reservoir; Regional Water Management Board in Wrocław: Wrocław, Poland, 2002; pp. 1–48. [Google Scholar]
- Dabrowska, J.; Lejcus, K.; Kusnierz, M.; Czamara, A.; Kaminska, J.; Lejcus, I. Phosphate dynamics in the drinking water catchment area of the Dobromierz Reservoir. Desalin. Water Treat. 2016, 57, 25600–25609. [Google Scholar] [CrossRef]
- Lejcus, K. Nitrate concentration changeability under strong anthropopressure in the Strzegomka River and Dobromierz Reservoir. Arch. Environ. Prot. 2004, 30, 63–72. [Google Scholar]
- Dabrowska, J.; Moryl, A.; Kucharczak-Moryl, E.; Zmuda, R.; Lejcus, I. Content of nitrogen compounds in the waters of the Strzegomka river above the Dobromierz Reservoir. Acta Sci.Pol. Form. Cir. 2016, 15, 57–69. [Google Scholar] [CrossRef]
- Wechsler, S.P. Uncertainties associated with digital elevation models for hydrologic applications: A review. Hydrol. Earth Syst. Sci. 2007, 11, 1481–1500. [Google Scholar] [CrossRef]
- Brubaker, K.M.; Myers, W.L.; Drohan, P.J.; Miller, D.A.; Boyer, E.W. The use of LiDAR terrain data in characterizing surface roughness and microtopography. Appl. Environ. Soil Sci. 2013, 2013, 1–13. [Google Scholar] [CrossRef]
- Jenson, S.K.; Domingue, J.O. Extracting topographic structure from digital elevation data for geographic information-system analysis. Photogramm. Eng. Remote Sens. 1988, 54, 1593–1600. [Google Scholar]
- Akbarimehr, M.; Naghdi, R. Reducing erosion from forest roads and skid trailsby management practices. J. For. Sci. 2012, 58, 165–169. [Google Scholar] [CrossRef]
- Dabek, P.B.; Zmuda, R.; Kowalczyk, T.; Dabrowska, J.; Moryl, A.; Kucharczak-Moryl, E. Forest roads system in mountain relief: Indicator evaluation of water-erosion risk. EJPAU 2017, 20. [Google Scholar] [CrossRef]
- Bajkiewicz-Grabowska, E. Assessment of the ecological state of lakes as proposed by the Polish Limnological Society. Limnol. Rev. 2010, 10, 105–116. [Google Scholar] [CrossRef]
- European Environment Agency. Water-Retention Potential of Europe’s Forests: A European Overview to Support Natural Water-Retention Measures; European Environment Agency: Copenhagen, Denmark, 2015; pp. 1–46. Available online: https://www.eea.europa.eu/publications/water-retention-potential-of-forests (accessed on 21 September 2018).
- Chandler, K.R.; Stevens, C.J.; Binley, A.; Keith, A.M. Influence of tree species and forest land use on soil hydraulic conductivity and implications for surface runoff generation. Geoderma 2018, 310, 120–127. [Google Scholar] [CrossRef]
- Liberacki, D.; Korytowski, M.; Kozaczyk, P.; Stachowski, P.; Stasik, R. Effects of implementation of small retention programme on the example of two forest districts of lowland area. Rocz. Ochr. Sr. 2016, 18, 428–438. [Google Scholar]
- Haygarth, P.M.; Condron, L.M.; Heathwaite, A.L.; Turner, B.L.; Harris, G.P. The phosphorus transfer continuum: Linking source to impact with an interdisciplinary and multi-scaled approach. Sci. Total Environ. 2005, 344, 5–14. [Google Scholar] [CrossRef] [PubMed] [Green Version]
- Hancock, G.; Hamilton, S.E.; Stone, M.; Kaste, J.; Lovette, J. A geospatial methodology to identify locations of concentrated runoff from agricultural fields. J. Am. Water Resour. Assoc. 2015, 51, 1613–1625. [Google Scholar] [CrossRef]
- Tiwari, T.; Lidman, F.; Laudon, H.; Lidberg, W.; Agren, A.M. GIS-based prediction of stream chemistry using landscape composition, wet areas and hydrological flow pathways. J. Geophys. Res. Biogeosci. 2017, 122, 65–79. [Google Scholar] [CrossRef]
- Lou, H.Z.; Yang, S.T.; Zhao, C.S.; Shi, L.H.; Wu, L.N.; Wang, Y.; Wang, Z.W. Detecting and analyzing soil phosphorus loss associated with critical source areas using a remote sensing approach. Sci. Total Environ. 2016, 573, 397–408. [Google Scholar] [CrossRef] [PubMed]
- Shore, M.; Jordan, P.; Mellander, P.E.; Kelly-Quinn, M.; Wall, D.P.; Murphy, P.N.C.; Melland, A.R. Evaluating the critical source area concept of phosphorus loss from soils to water-bodies in agricultural catchments. Sci. Total Environ. 2014, 490, 405–415. [Google Scholar] [CrossRef] [PubMed]
- Ockenden, M.C.; Tych, W.; Beven, K.J.; Collins, A.L.; Evans, R.; Falloon, P.D.; Forber, K.J.; Hiscock, K.M.; Hollaway, M.J.; Kahana, R.; et al. Prediction of storm transfers and annual loads with data-based mechanistic models using high-frequency data. Hydrol. Earth Syst. Sci. 2017, 21, 6425–6444. [Google Scholar] [CrossRef] [Green Version]
- Zhou, Q.Q. A review of sustainable urban drainage systems considering the climate change and urbanization impacts. Water 2014, 6, 976–992. [Google Scholar] [CrossRef]
Figure 1.
Location of the Dobromierz Reservoir.
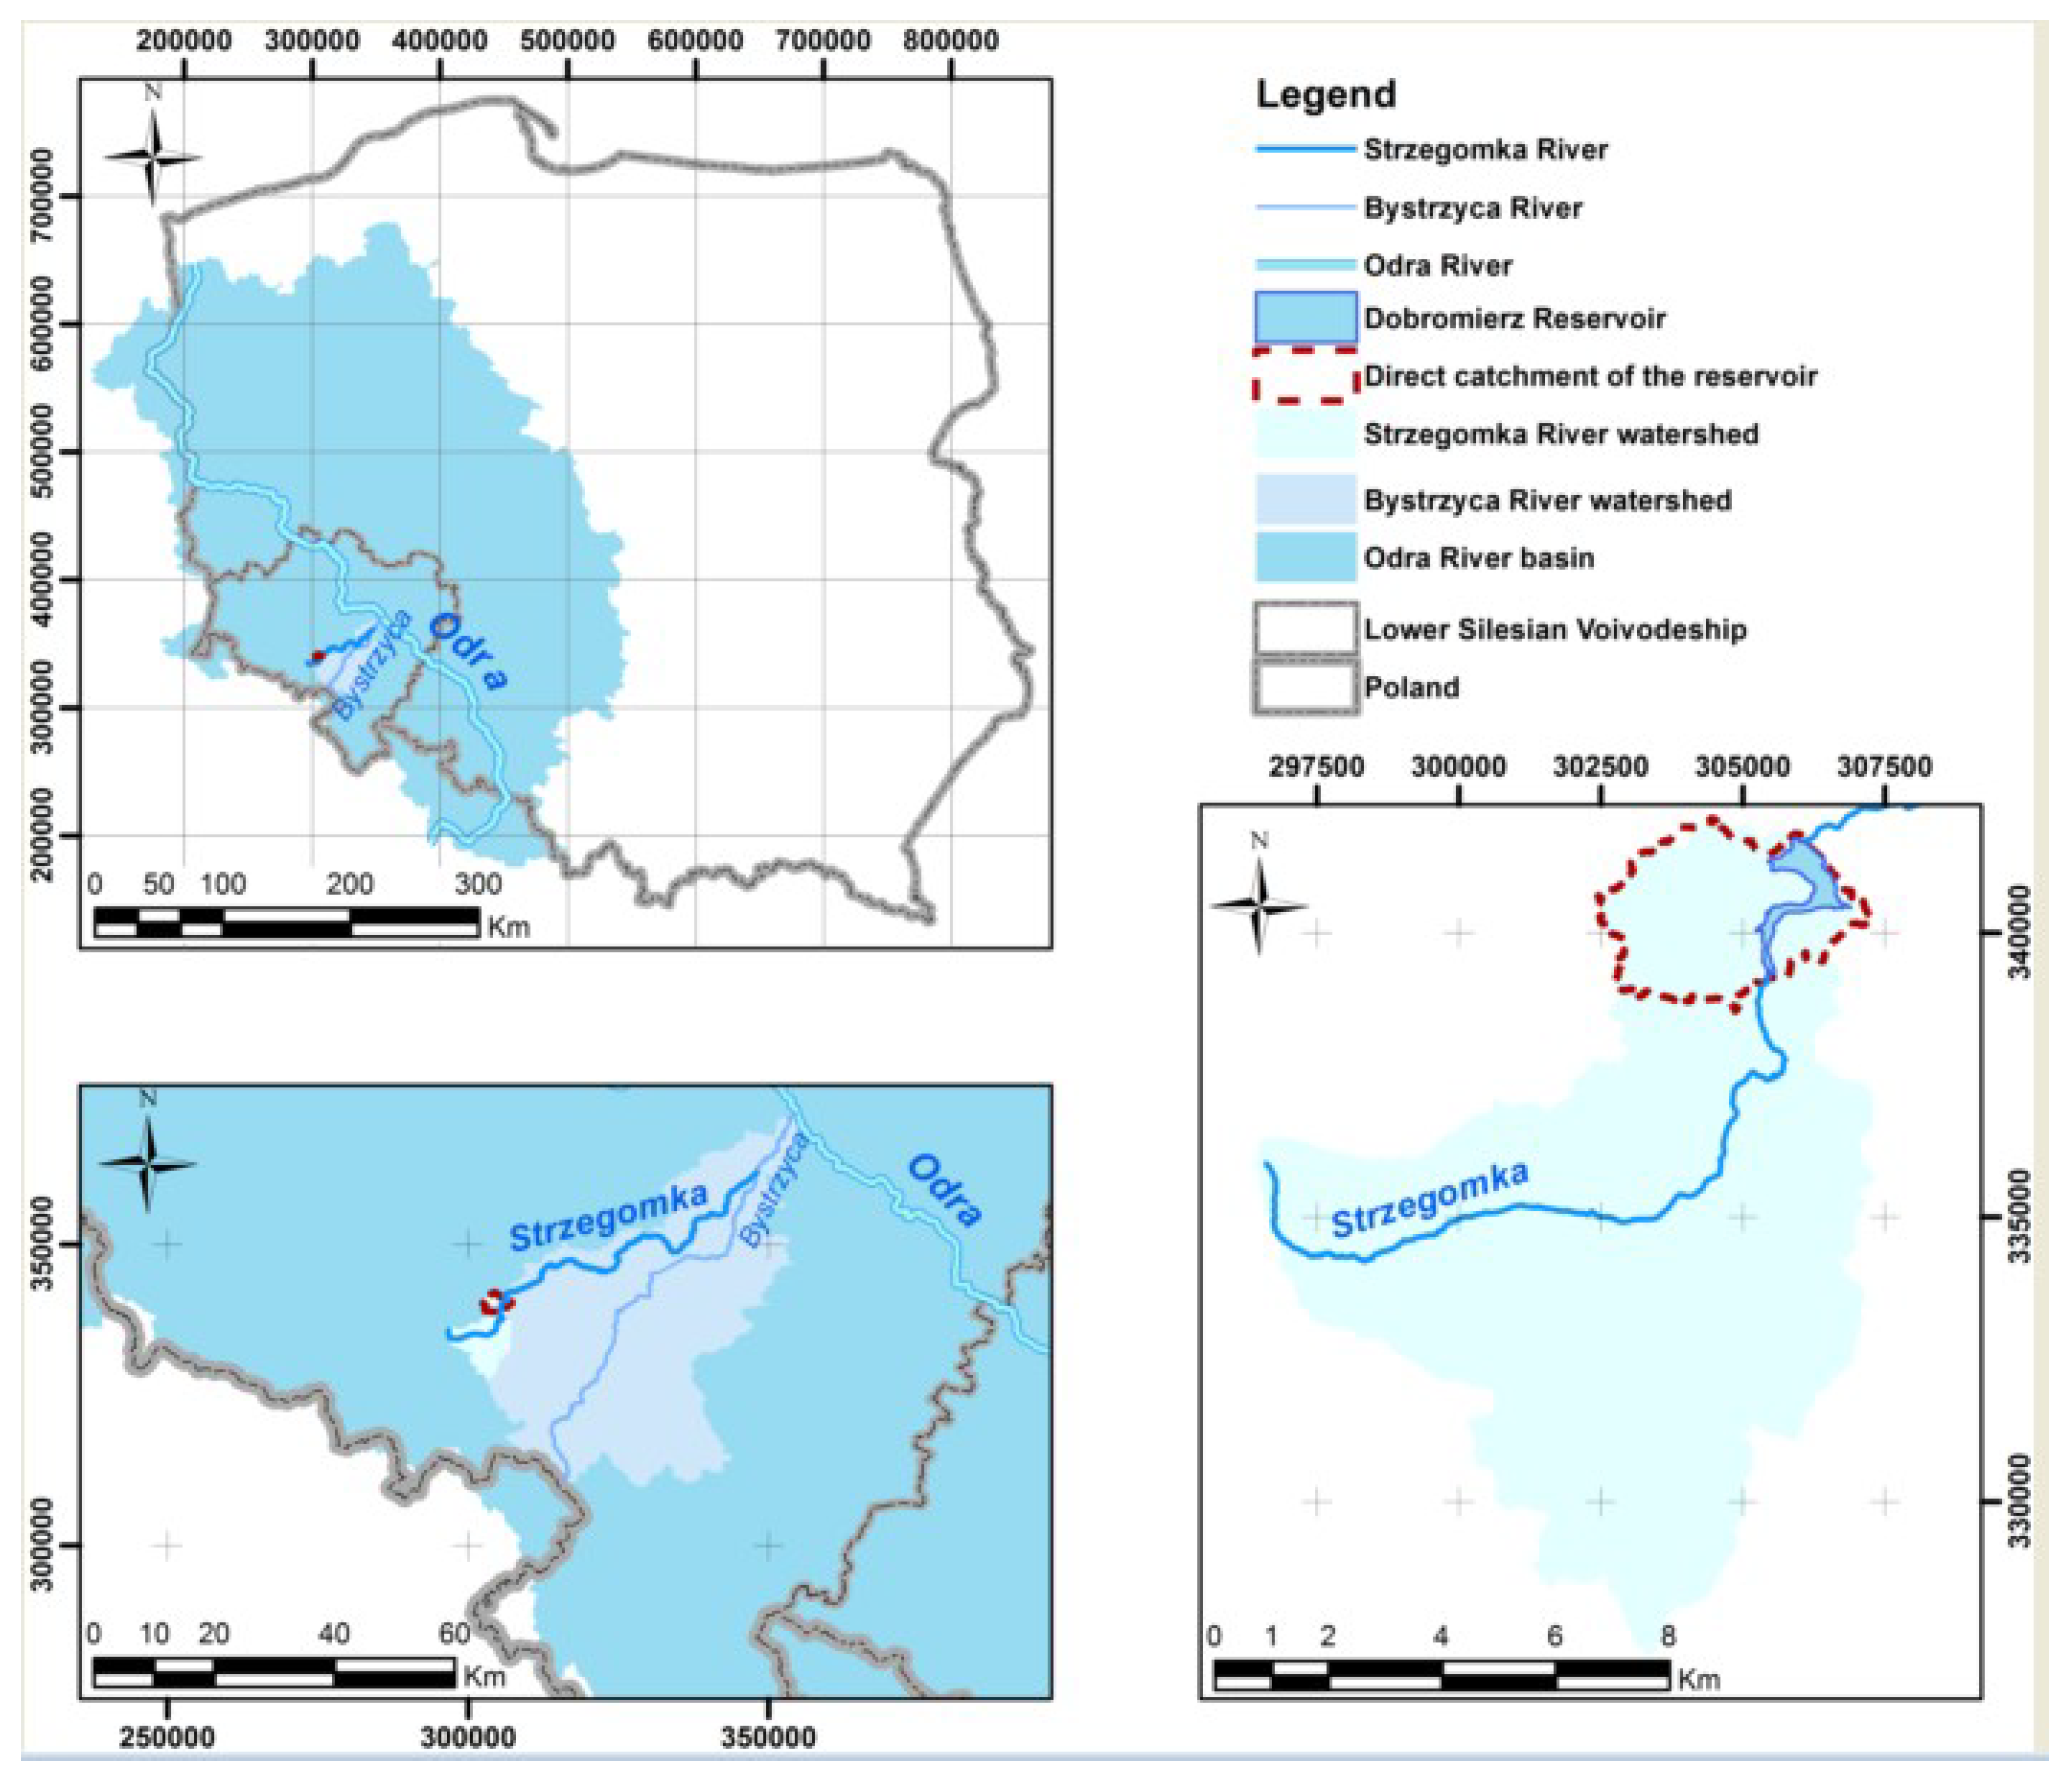
Figure 2.
Slope map of the direct catchment of the Dobromierz Reservoir.
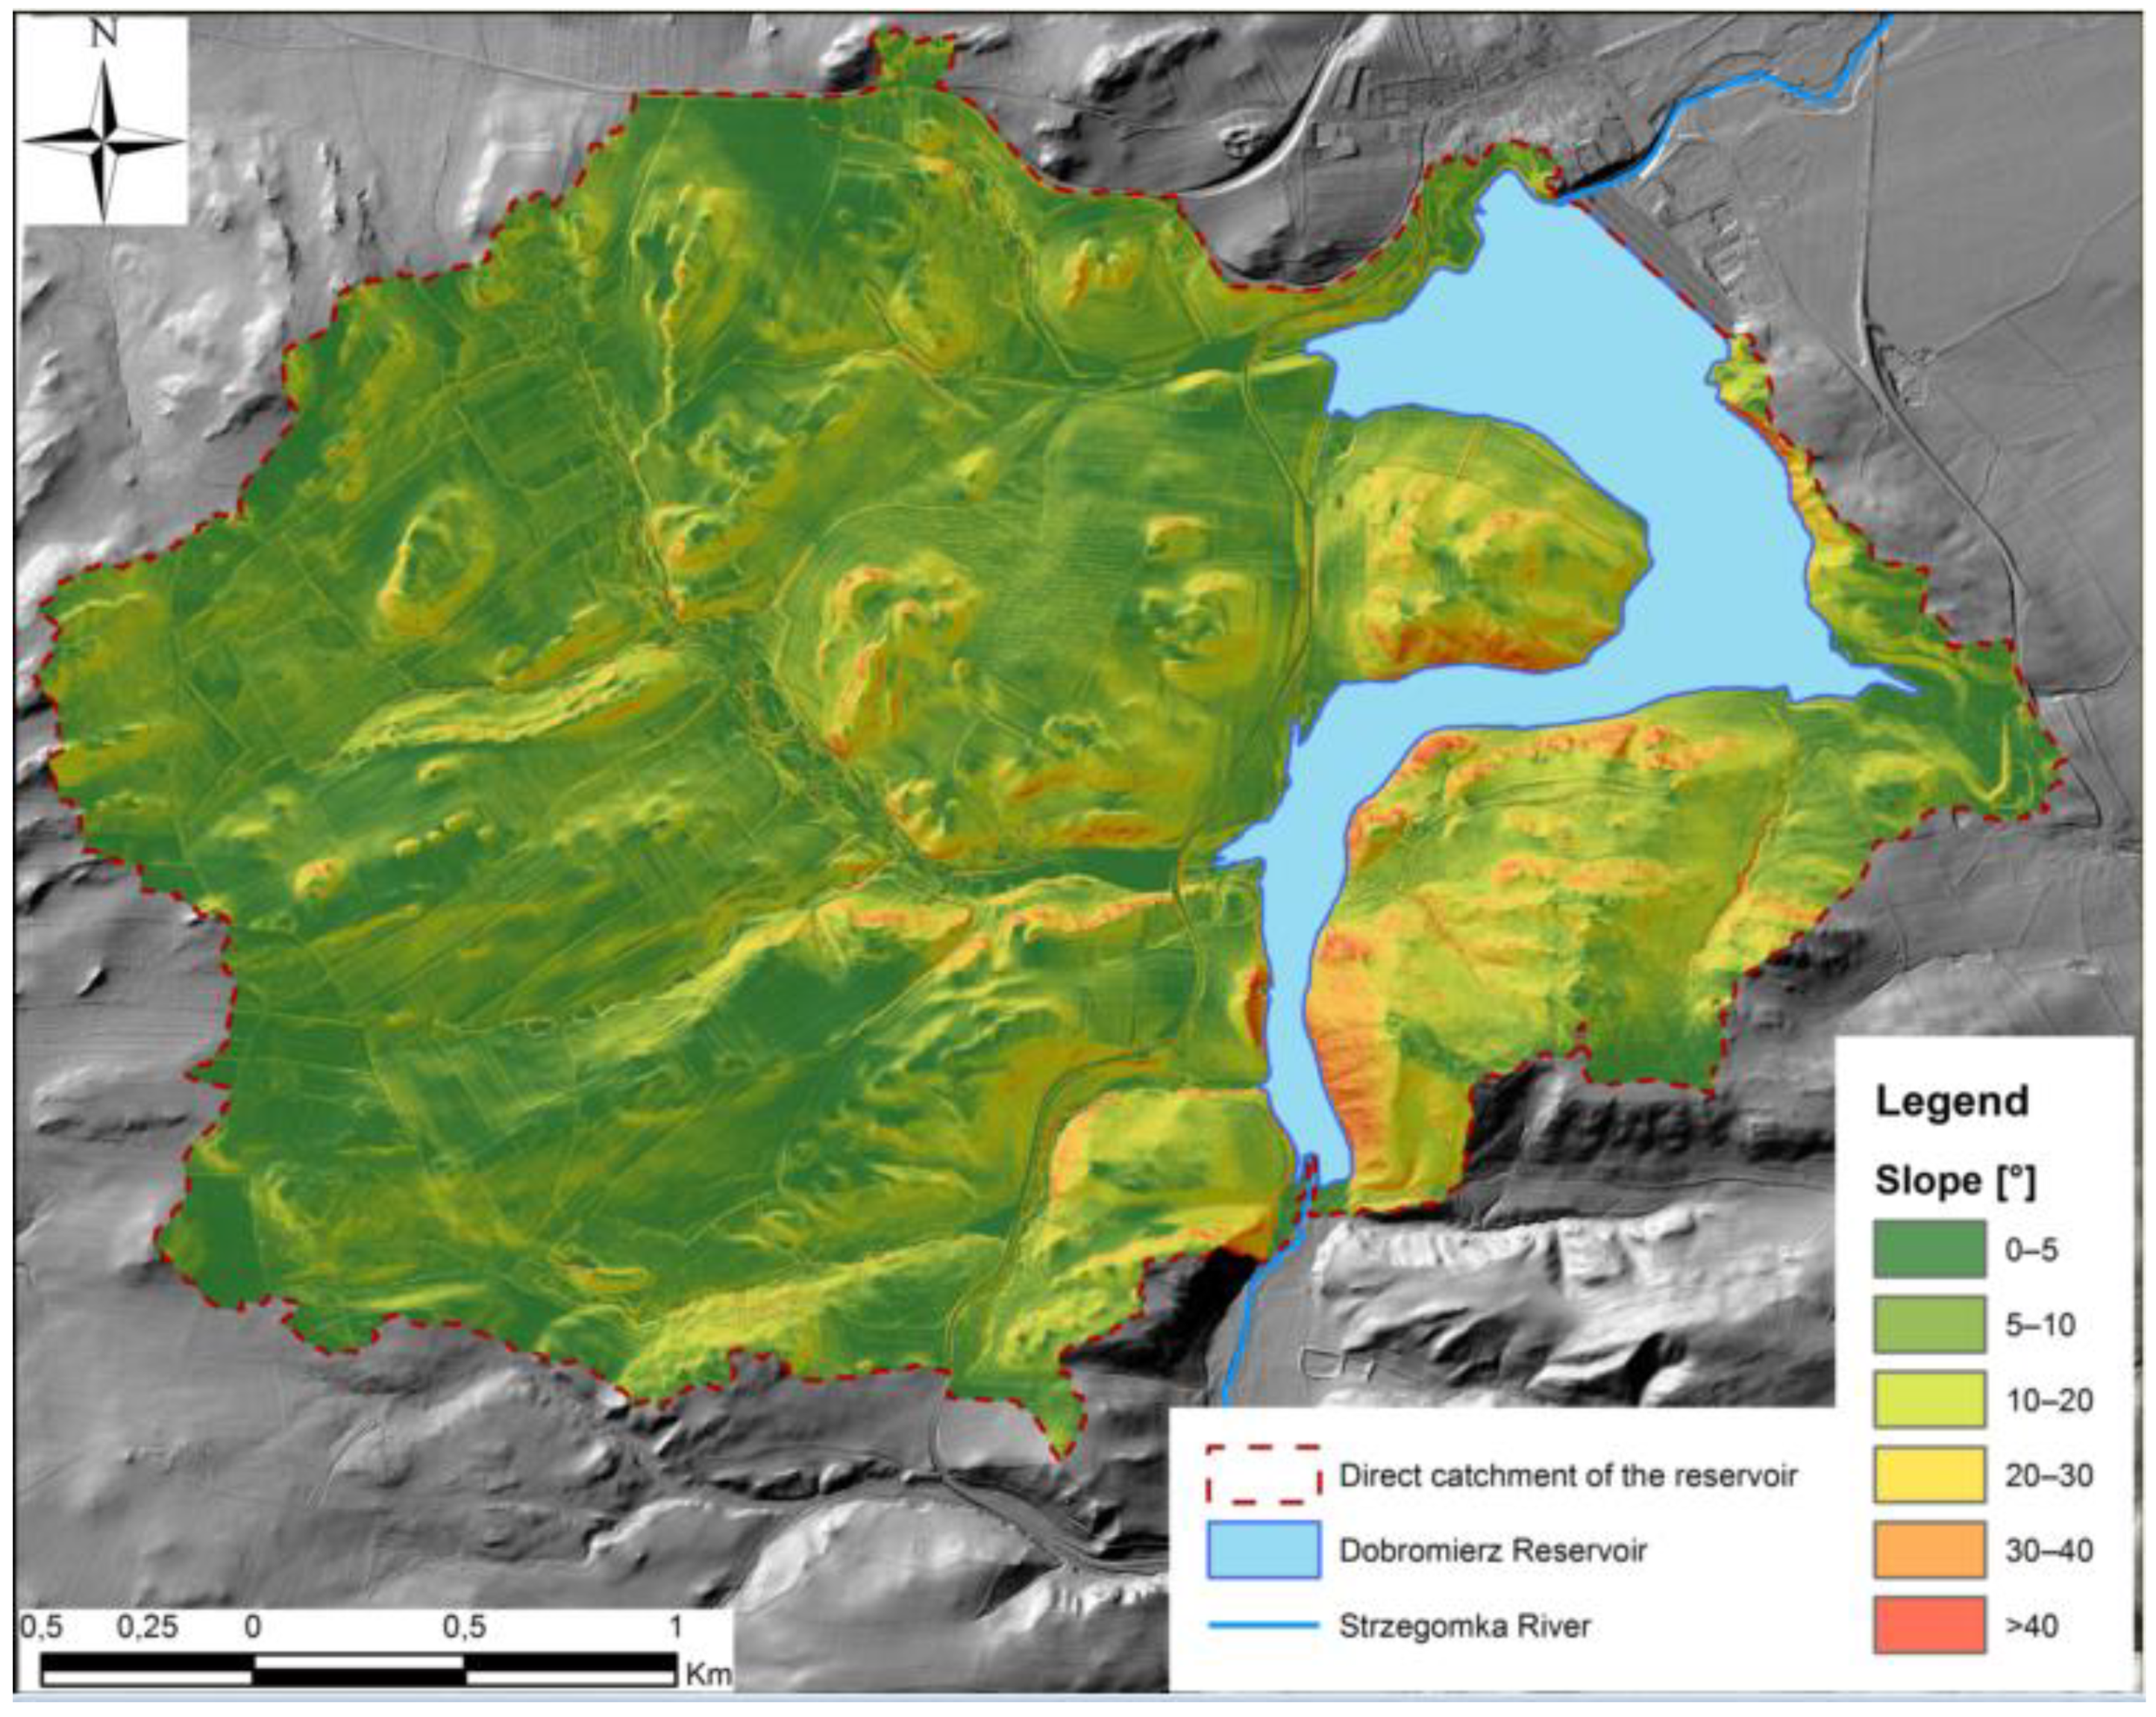
Figure 3.
Land use pattern in the direct catchment of the Dobromierz Reservoir.
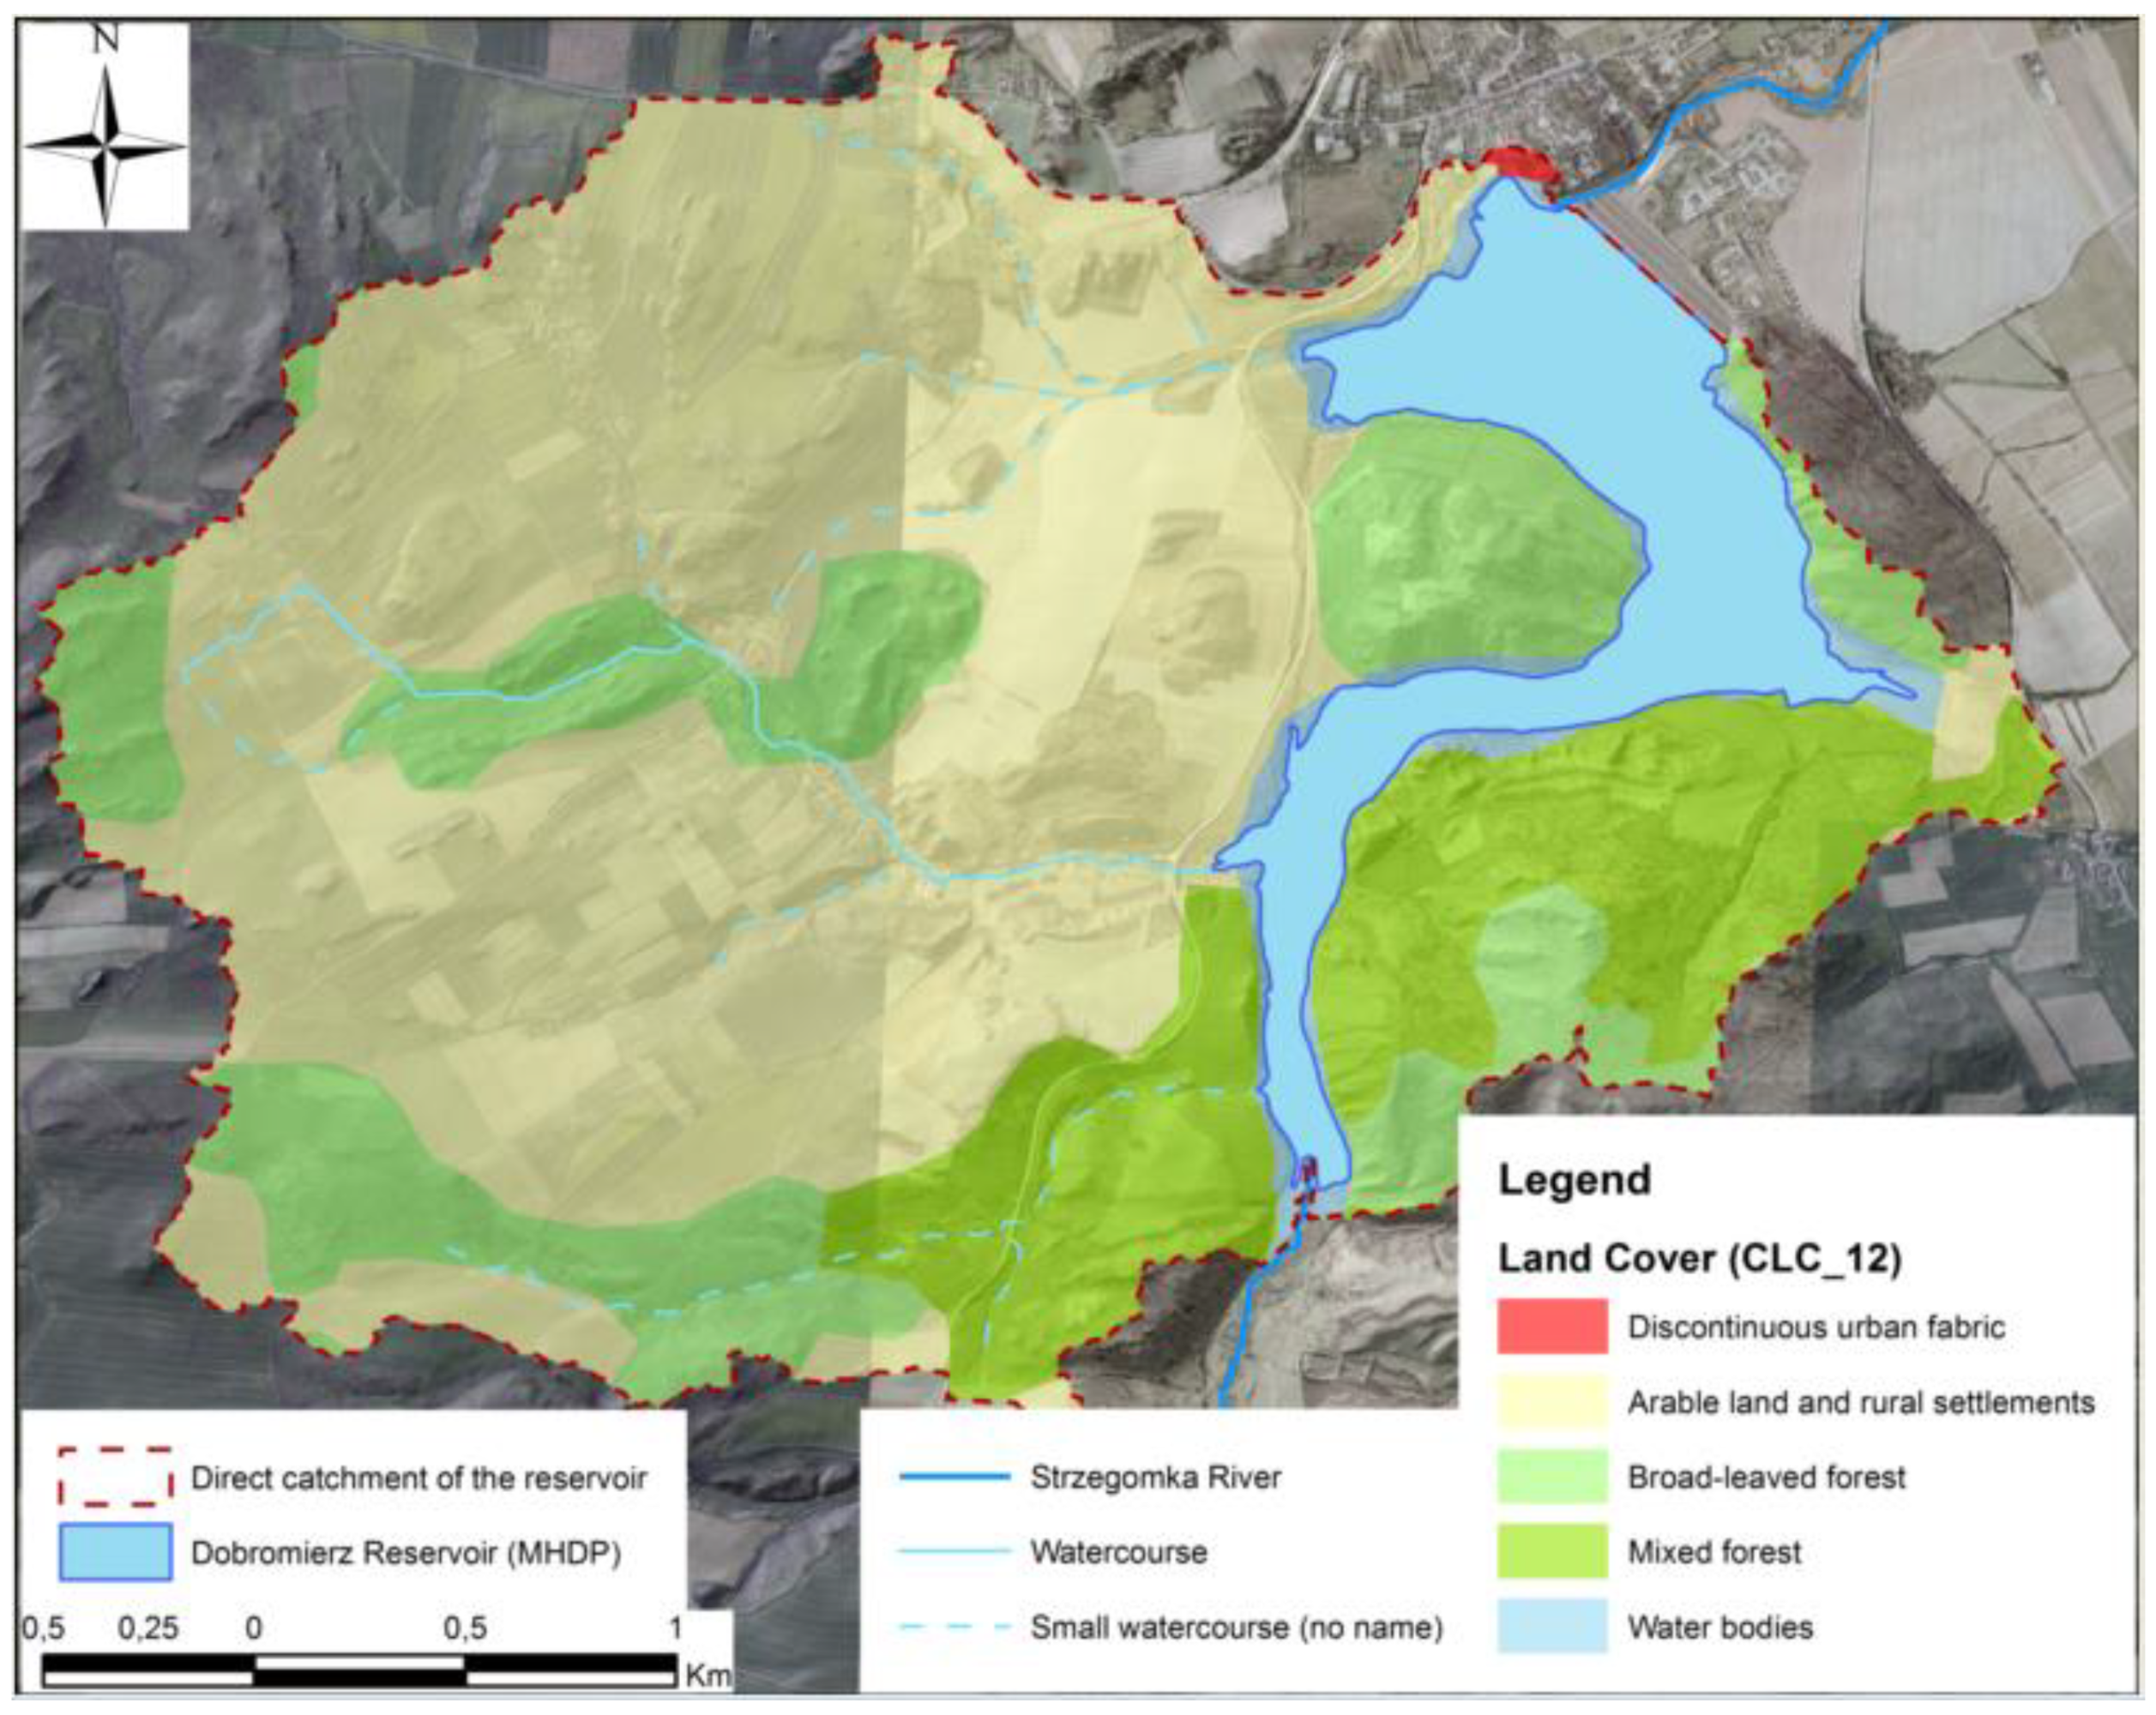
Figure 4.
Flow accumulation map of the direct catchment of the Dobromierz Reservoir—flow accumulation counted from junction to junction.
Figure 4.
Flow accumulation map of the direct catchment of the Dobromierz Reservoir—flow accumulation counted from junction to junction.
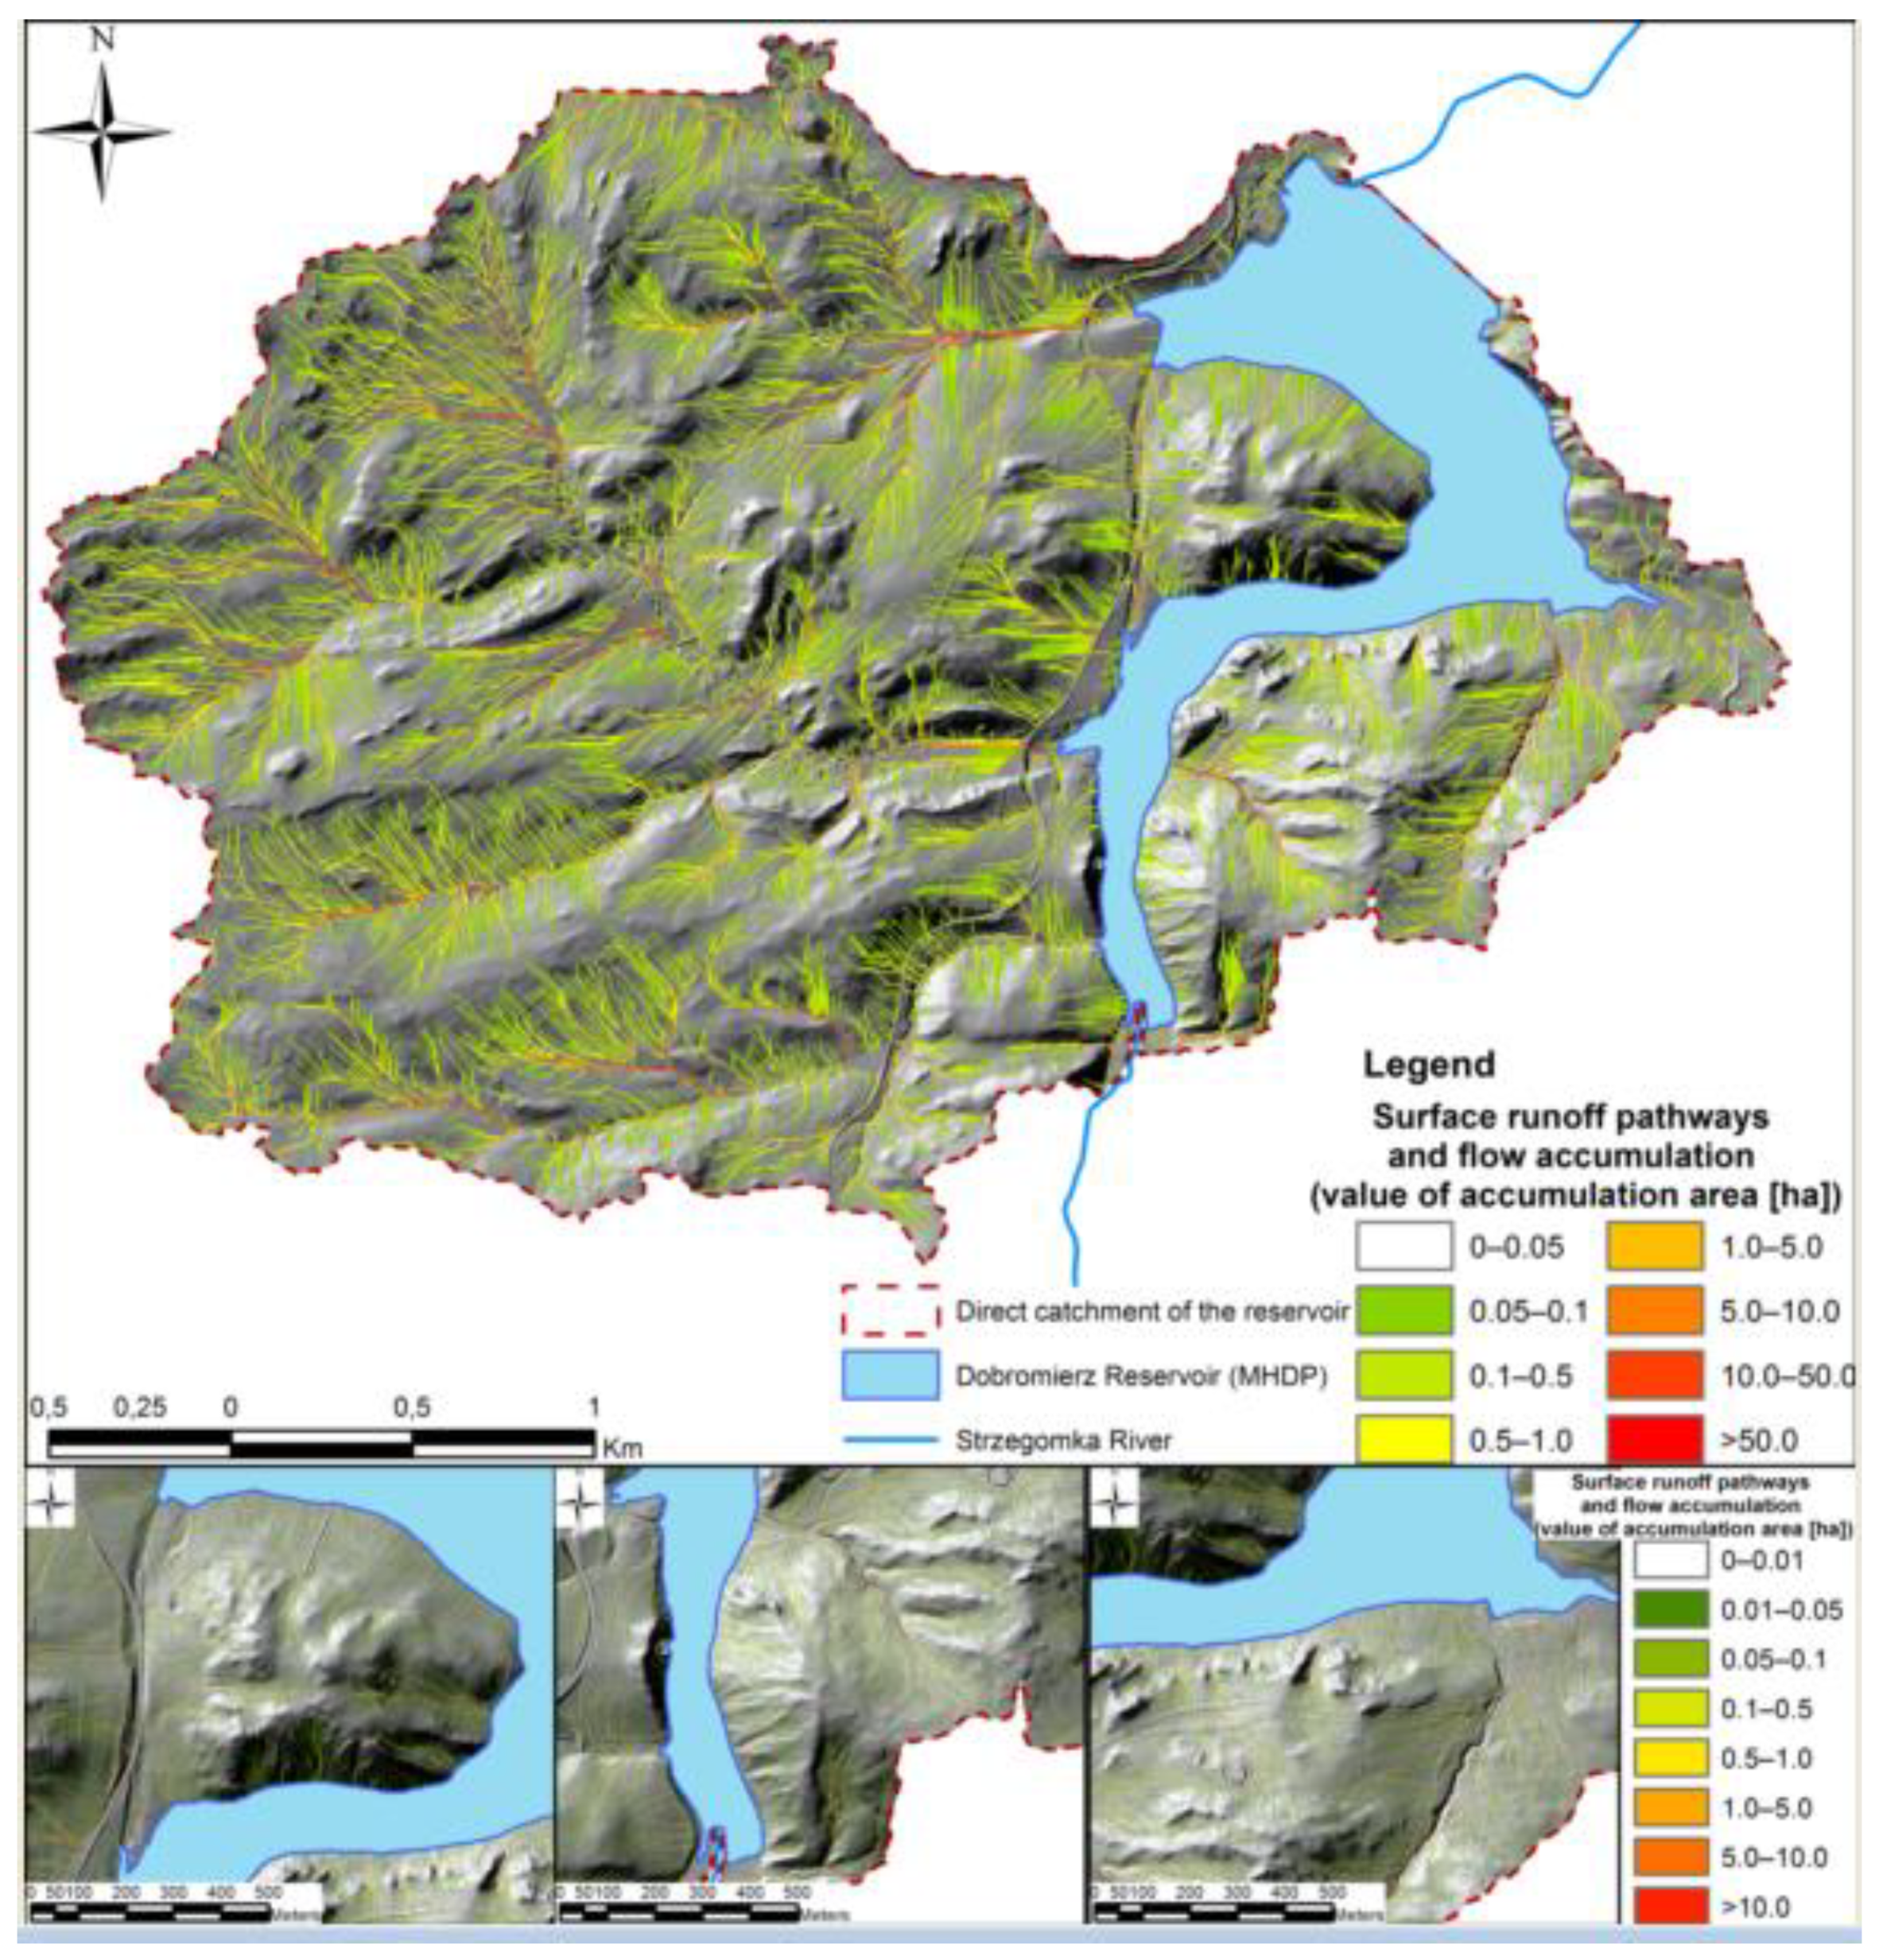
Figure 5.
(a) Designed flow accumulation areas in the direct catchment of the Dobromierz Reservoir; (b) designed flow accumulation areas on the background of land use pattern (legend as in Figure 3).
Figure 5.
(a) Designed flow accumulation areas in the direct catchment of the Dobromierz Reservoir; (b) designed flow accumulation areas on the background of land use pattern (legend as in Figure 3).

Table 1.
Basic parameters of the Dobromierz Reservoir [35].
Table 1.
Basic parameters of the Dobromierz Reservoir [35].
| Parameter | Unit | Amount |
|---|---|---|
| Normal Water Level (NWL) | m a.s.l. | 298.50 |
| Full Reservoir Level (FRL) | m a.s.l. | 299.70 |
| Maximum Water Level (Highest Flood Level (MWL)) | m a.s.l. | 300.10 |
| Mean Annual Flow | m3·s−1 | 0.781 |
| Surface of the Reservoir at NWL | ha | 103.00 |
| Surface of the Reservoir at FRL | ha | 111.00 |
| Surface of the Reservoir at MWL | ha | 114.50 |
| Water Surface Elevation at NWL | m | 25.5 |
| Water Surface Elevation at FRL | m | 26.7 |
| Mean Depth at NWL | m | 10.0 |
| Dead Capacity | million m3 | 1.0 |
| Useful Capacity at NWL | million m3 | 9.0 |
| Flood Reserve Capacity | million m3 | 1.35 |
| Capacity at FRL | million m3 | 11.35 |
| Surcharge Storage | million m3 | 0.40 |
| Maximum Capacity at MWL | million m3 | 11.75 |
Table 2.
Mean monthly precipitation (mm) and air temperatures (°C)—multi-annual data 2000–2014 (meteorological station Szczawno-Zdrój GPS N: 50°48′24″, E: 16°14′28″).
Table 2.
Mean monthly precipitation (mm) and air temperatures (°C)—multi-annual data 2000–2014 (meteorological station Szczawno-Zdrój GPS N: 50°48′24″, E: 16°14′28″).
| Month | I | II | III | IV | V | VI | VII | VIII | IX | X | XI | XII |
|---|---|---|---|---|---|---|---|---|---|---|---|---|
| Precipitation | 43.1 | 34.6 | 47.0 | 45.5 | 85.8 | 80.0 | 121.4 | 113.4 | 71.6 | 39.0 | 43.7 | 40.4 |
| Temperature | −1.6 | −0.8 | 2.4 | 8.1 | 13.0 | 16.0 | 18.1 | 17.2 | 12.4 | 8.3 | 4.4 | −0.4 |
Table 3.
Mean annual flow (m3·s−1) in the Strzegomka River above the Dobromierz Reservoir—multi-annual data 2000–2014 (gauging station Chwaliszów GPS N: 50°52′39″; E: 16°13′59″).
Table 3.
Mean annual flow (m3·s−1) in the Strzegomka River above the Dobromierz Reservoir—multi-annual data 2000–2014 (gauging station Chwaliszów GPS N: 50°52′39″; E: 16°13′59″).
| Year | 2000 | 2001 | 2002 | 2003 | 2004 | 2005 | 2006 | 2007 | 2008 | 2009 | 2010 | 2011 | 2012 | 2013 | 2014 |
|---|---|---|---|---|---|---|---|---|---|---|---|---|---|---|---|
| Mean Annual Flow | N/D | N/D | N/D | 0.56 | 0.49 | 0.63 | 1.12 | 0.58 | 0.47 | 0.66 | 0.79 | 0.69 | 0.36 | 0.85 | 0.38 |
Table 4.
Basic characteristics of designed flow accumulation areas (numbers according to Figure 5).
Table 4.
Basic characteristics of designed flow accumulation areas (numbers according to Figure 5).
| Number | Type of Designed Flow Accumulation Area | Surface Area (ha) | Mean Slope (°) | Slope Aspect (Majority) | Land Use Pattern | Surface Runoff Concentration | Level of Agricultural Diffuse Pollution | Possibility of Reducing the Surface Runoff Generation by the Forest | ||
|---|---|---|---|---|---|---|---|---|---|---|
| Arable land | Forests | Others | ||||||||
| Main surface runoff areas (main subcatchments) >100 ha | ||||||||||
| 1 | Single area of >200 ha | 353.09 | 8.2 | NW | 82.7 | 17.3 | 0.0 | High | High | Low |
| 2 | Single area of 100–200 ha | 152.03 | 8.0 | NW | 38.3 | 61.7 | 0.0 | High | Medium | Medium |
| 3 | Single area of 100–200 ha | 146.81 | 8.0 | W | 96.5 | 3.4 | 0.1 | High | High | Low |
| Mid-range subcatchments 10–100 ha | ||||||||||
| 4 | Single area of 25–50 ha | 30.64 | 11.2 | SW | 0.0 | 100.0 | 0.0 | Medium | Low | High |
| 5 | Single area of 25–50 ha | 26.35 | 10.1 | NW | 87.0 | 12.2 | 0.8 | Medium | High | Low |
| 6 | Single area of 10–25 ha | 19.28 | 15.4 | SE | 0.0 | 100.0 | 0.0 | Medium | Low | High |
| 7 | Single area of 10–25 ha | 16.62 | 8.8 | SW | 71.5 | 28.5 | 0.0 | Medium | High | Low |
| 8 | Single area of 10–25 ha | 13.32 | 9.8 | S | 74.2 | 25.4 | 0.4 | Medium | High | Low |
| 9 | Single area of 10–25 ha | 12.05 | 6.8 | SE | 35.4 | 59.8 | 4.8 | Medium | Medium | Medium |
| Microcatchments 0–10 ha | ||||||||||
| 10 | 21 areas of 1–10 ha; Total area: 61.85 | Single area 1–10 ha | 13.7 | N | 9.6 | 86.7 | 3.7 | Low | Low | High |
| 11 | The area includes several dozens of microcatchments, 0–1 ha each; Total area: 74.05 | Single area <1 ha | 17.0 | N | 8.2 | 67.5 | 24.3 (out of which 23% are water bodies) | Low | Low | High |
© 2018 by the authors. Licensee MDPI, Basel, Switzerland. This article is an open access article distributed under the terms and conditions of the Creative Commons Attribution (CC BY) license (http://creativecommons.org/licenses/by/4.0/).
Share and Cite
MDPI and ACS Style
Dąbrowska, J.; Dąbek, P.B.; Lejcuś, I. Identifying Surface Runoff Pathways for Cost-Effective Mitigation of Pollutant Inputs to Drinking Water Reservoir. Water 2018, 10, 1300. https://doi.org/10.3390/w10101300
AMA Style
Dąbrowska J, Dąbek PB, Lejcuś I. Identifying Surface Runoff Pathways for Cost-Effective Mitigation of Pollutant Inputs to Drinking Water Reservoir. Water. 2018; 10(10):1300. https://doi.org/10.3390/w10101300
Chicago/Turabian StyleDąbrowska, Jolanta, Paweł B. Dąbek, and Iwona Lejcuś. 2018. "Identifying Surface Runoff Pathways for Cost-Effective Mitigation of Pollutant Inputs to Drinking Water Reservoir" Water 10, no. 10: 1300. https://doi.org/10.3390/w10101300
Note that from the first issue of 2016, this journal uses article numbers instead of page numbers. See further details here.