1. Introduction
China is the world’s most populated country and a core emitter of greenhouse gases. Therefore, the major thrust of their current research is on climate change but comparatively little has been published so far. Global air temperature trends show a rise of 0.85 °C between 1880 and 2012 with a higher contribution during the last 30 years [
1]. China is no exception to this phenomenon, and water resources of China are highly sensitive to climate change [
2,
3,
4,
5]. Research studies show that particularly the northern parts of China are becoming warmer more rapidly than the southern parts [
6,
7], and it is predicted that the average temperature in China will increase by +3.9 to 5.6 °C by the end of 2100 under B2 and A2 scenarios, respectively [
8].
Several regional and local scale studies have been conducted to study the climate change impacts on Chinese water resources and on an estimation of precipitation trends in different parts of China. Ding et al. reported non-significant annual averaged precipitation trends in the country, while interdecadal trends and variability have been found on a regional basis [
9]. Meanwhile [
6,
10] have found a decreasing trend in the mean annual precipitation during 1961–2001 in the northeastern, northern and central regions of China. Piao et al. [
6] found North China and Northeast China are receiving less and less precipitation in summer and autumn compared to the wetter region of southern China, which is experiencing more rainfall during both summer and winter. Feng et al. [
11] found a significant increase in both extreme precipitation and mean annual precipitation intensity over south-eastern China. A significant increasing trend has been found in south-western and south-eastern China [
12]. Studies have also reported an adjustment in the precipitation trends in eastern China since the 1970s [
13,
14], with southern China and the Yangtze River basin suffering the most by precipitation and severe flooding, while northeastern and northern China experienced severe droughts [
9,
15]. On the local scale, Wang et al. [
16] used precipitation data from 1961–2008 of the Jinshajiang River basin and found insignificant increases in trends. Li and Yan [
17] observed decreasing trends in the annual precipitation in the Mianyang Basin of Sichuan Province, China. Xu et al. [
18] have observed an increase in precipitation amount during 1960–2007 in the Tarim River basin. Although many large-scale watershed studies have been carried out in different regions of China [
19,
20], not much work has been done to determine the climate change effects on water resources in medium-scale watersheds particularly in the current study region, which could be very important for water supply and power production.
General Circulation Models (GCMs) have been found to be promising tools for the prediction of future climatic scenarios [
21] and future assessment not only for the surface hydrology but also for water allocation and modeling of the groundwater resources [
22,
23,
24,
25,
26,
27]. To evaluate regional changes in daily rainfall and temperature, global climate model (GCM) output needs to be downscaled to a local appropriate scale. Many approaches to attain this can be generally classified as dynamical, and statistical downscaling techniques [
28]. In any case, some adjustments need to be made before the use of any downscaled data to account for the GCM biases [
29]. We emphasize here a common method of bias correction, namely quantile mapping technique, which has been used extensively for downscaling precipitation and temperature [
30,
31,
32] around the globe. The quantile mapping method has the advantage of accounting for GCM biases in all statistical moments; however, as with all other statistical downscaling methods, it is expected that biases will be constant in the future projections. Quantile mapping has some drawbacks, so the calibration period for the bias correction should be at least 10 years so that the internal inconsistency is not a leading source of bias between the climate model and observations [
33]. Despite its drawbacks, this technique is extensively used and commonly effective in removing biases [
34,
35,
36,
37,
38].
Coupling of climate models with hydrological models such as the Soil and Water Assessment Tool (SWAT, developed by the Agricultural Research Service and the US Department of Agriculture, USA) is widely used for the simulation of stream flows, sediment yields and loss of nutrients in watersheds [
39], which is well validated all over the world including America [
40], Europe [
41], Australia [
42], Africa [
43], and Asia [
44,
45,
46]. As water resources have become more important, their optimal use and allocation also become very important yet complex. During 1970–1980, some algorithms were developed for the solution of problems through optimization. For instance, programming techniques such as linear, nonlinear and dynamic have been applied to find the solutions to the problems of reservoir operation [
47,
48,
49]. Several studies have used these techniques for the solution of multidimensional problems [
50,
51,
52]. Particle swarm optimization (PSO) is another popular optimization technique developed by [
53]. This technique performed significantly robustly for the solution of multi-stage continuous optimal hydropower generation and performed better than other techniques to find the optimal solution of hydropower optimization [
46,
54,
55,
56]. Contrary to the previous studies [
57,
58,
59,
60,
61,
62], this paper is written with an overall goal to project future stream flows hydrologically, and to figure out the projected hydropower generation based on these future streamflows with the application of a newly developed numerical model for Xin’anjiang hydropower station.
2. Location of the Study Area
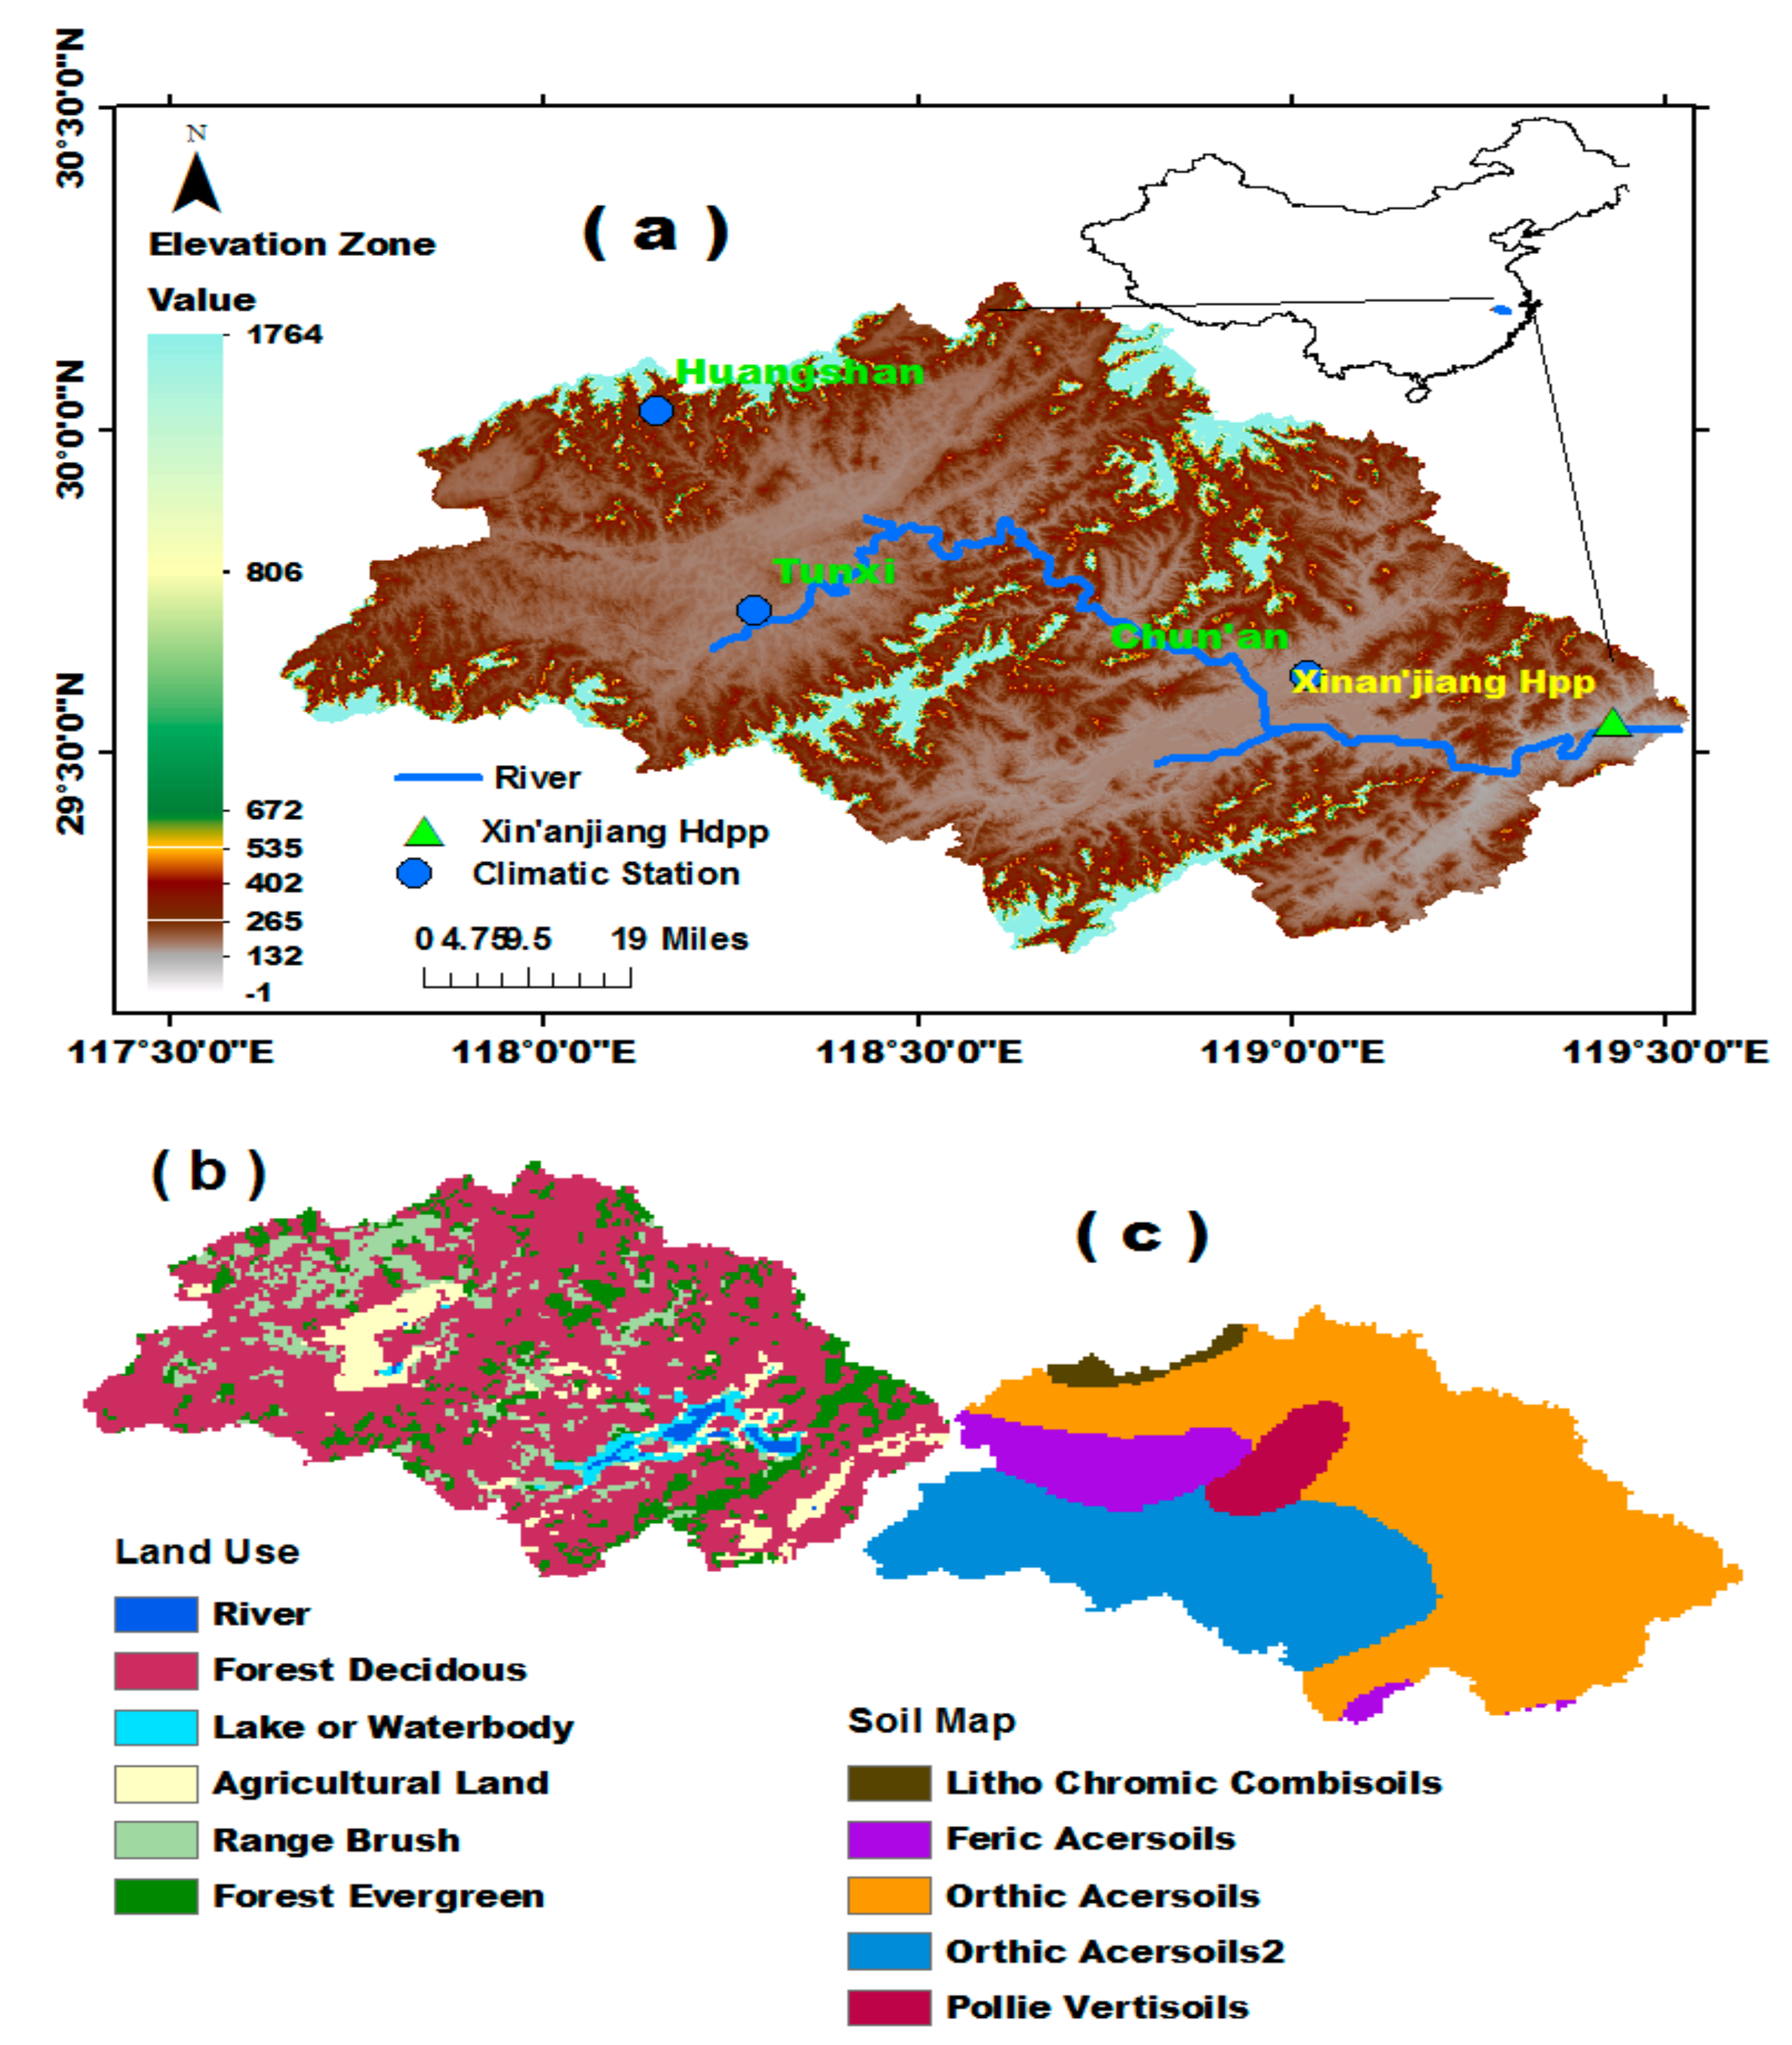
Xin’anjiang watershed is located between 117°38′15″–119°31′56″ longitude and 29°11′9.9″–30°13′49″ latitude, as shown in
Figure 1a. The watershed has an area of about 11,675.710 km
2. The average annual rainfall is more than 500 mm. There is a famous hydropower station in the study area named as Xin’anjiang hydropower station, which is situated at the Qiantang River tributary named as Xin’an River, with a total capacity of 845,000 kW and annual estimated output of 1.86 billion kW·h (18.6 × 10
8 kW·h).The location of the hydropower station is 29°28′38″ Latitude and 119°13′31″ Longitude in the Xin’anjiang watershed where a well-known China’s oldest Xin’anjiang Dam (466.5 m long and 105 m high) is located. This dam carries a huge reservoir capacity of about 22 billion m
3 and flood discharging capability of 14,000 m
3/s. The dam reservoir links Mount Huangshan of Anhui Province with Hangzhou, which is the capital of Zhejiang province. The average discharge of the river upstream of the Hangzhou City is 1043 m
3/s. The flow in the river is higher during March to July and lower in the remaining months.
Mainly the water supply of Hangzhou Region depends on the Qiantang River. Water is distracted directly from this river through various intakes and no severe water shortages have been observed in the recent years, yet flooding remains an important issue. The region is currently going rapid economic development and population growth and, these developments, in combination with climate change effects, expecting to cause future changes in the water supplies and demands.
Furthermore, About 1708 km2 area is considered irrigated land (out of which 1571 km2 irrigated by the Xin’anjiang reservior) in the Xin’anjiang watershed with major crops including rice, wheat, soybean, potato, corn and some other high value crops The changes in the water resources not only affects the domestic water availability, but also can affect the command area under irrigation and hydropower generation.Moreover, changes in the future flows may harmful for the dam structure and can cause severe damages.
3. Data Collection
Daily metrological data of precipitation, maximum and minimum temperature, wind speed and solar radiation for the period of 1979–2010 was obtained from the China Metrological Department (
http://data.cma.cn/). Six GCMs (CCSM4, HadGEM2-ES, MPI-ESM-MR, MPI-ESM-LR, ACCESS1.0 and MIROC-ESM) of CMIP5 (Coupled Model Intercomparsion Project Phase 5,
https://cmip.llnl.gov/index.html?submenuheader=0) were selected for future hydrological projections under very high (RCP8.5) and medium stabilization scenarios (RCP4.5). The GCMs models are divided into different scenarios as given in
Table 1. The future climatic parameters such as precipitation, maximum and minimum temperature, winnd speed and solar radition were downscaled for these six GCMs to a finer scale. The selection of these GCMs is based on the previous studies conducted in the current region [
46,
63,
64,
65]. The analysis is based on the metrological data from 1979 to 2010. The downscaled data of six GCMs for three future periods of 2010–2039, 2040–2069 and 2070–2099, have been termed as the 2020s (near future), 2050s (far future) and 2080s (very far future), respectively. The hydrological data series (Streamflows) of the watershed are required for the calibration and validation of the model. The streamflows data were collected from the Hydrology Bureau of Zhejiang Province. Streamflows data from 1979–1993 were used for the calibration, while the data from 1994–2005 were used for the validation of the hydrological model.
6. Discussion on Uncertainties and Limitations of the Current Study
Uncertainty is a very common problem in most of the hydrological modeling studies, especially at larger scales. Majority of the uncertainties in the projected precipitation and stream flows emerge due to different resolutions of different GCMs. Future, according to [
83], climate change projections in CMIP5 GCM scenarios are quite uncertain [
83].
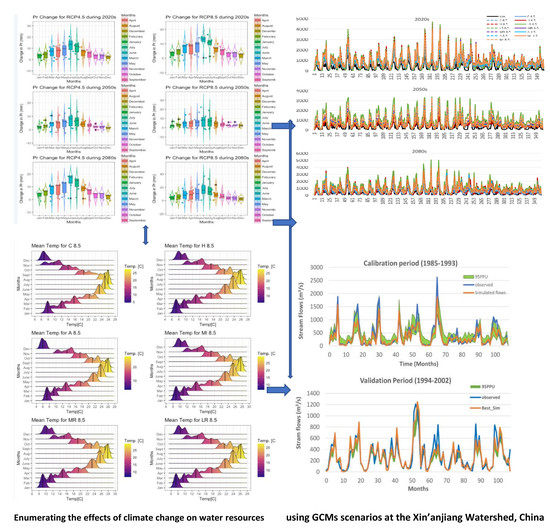
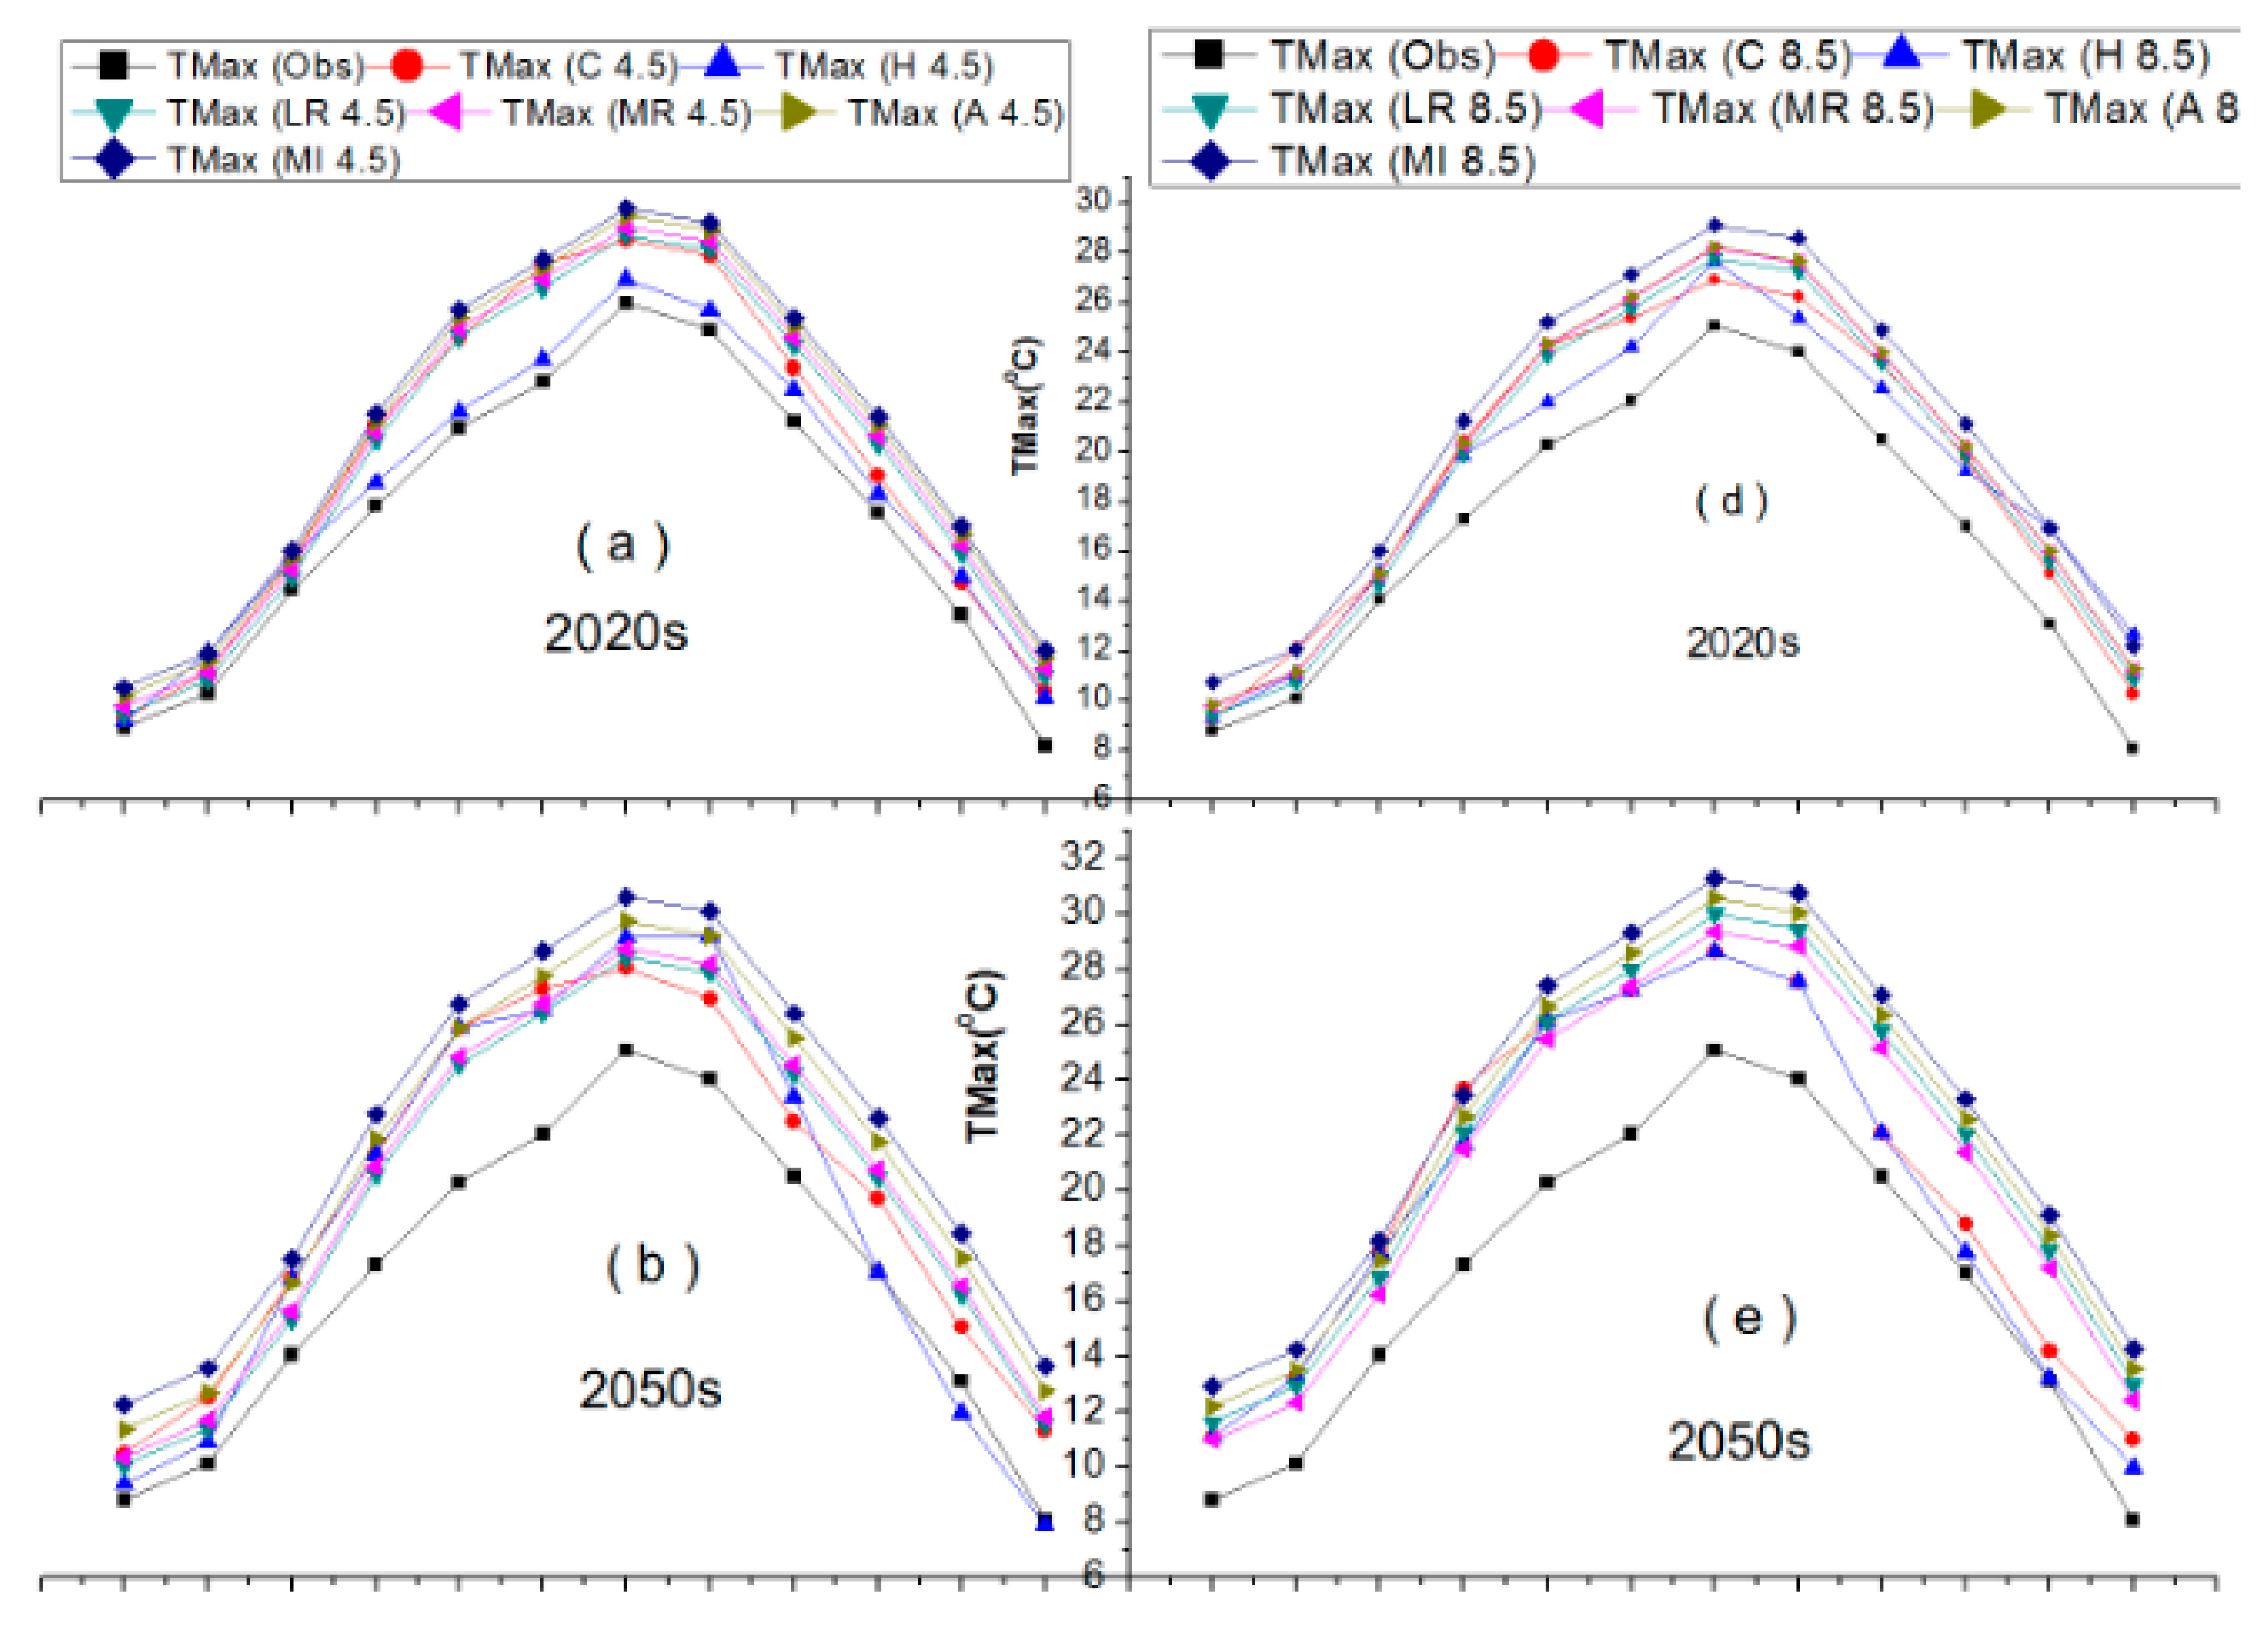
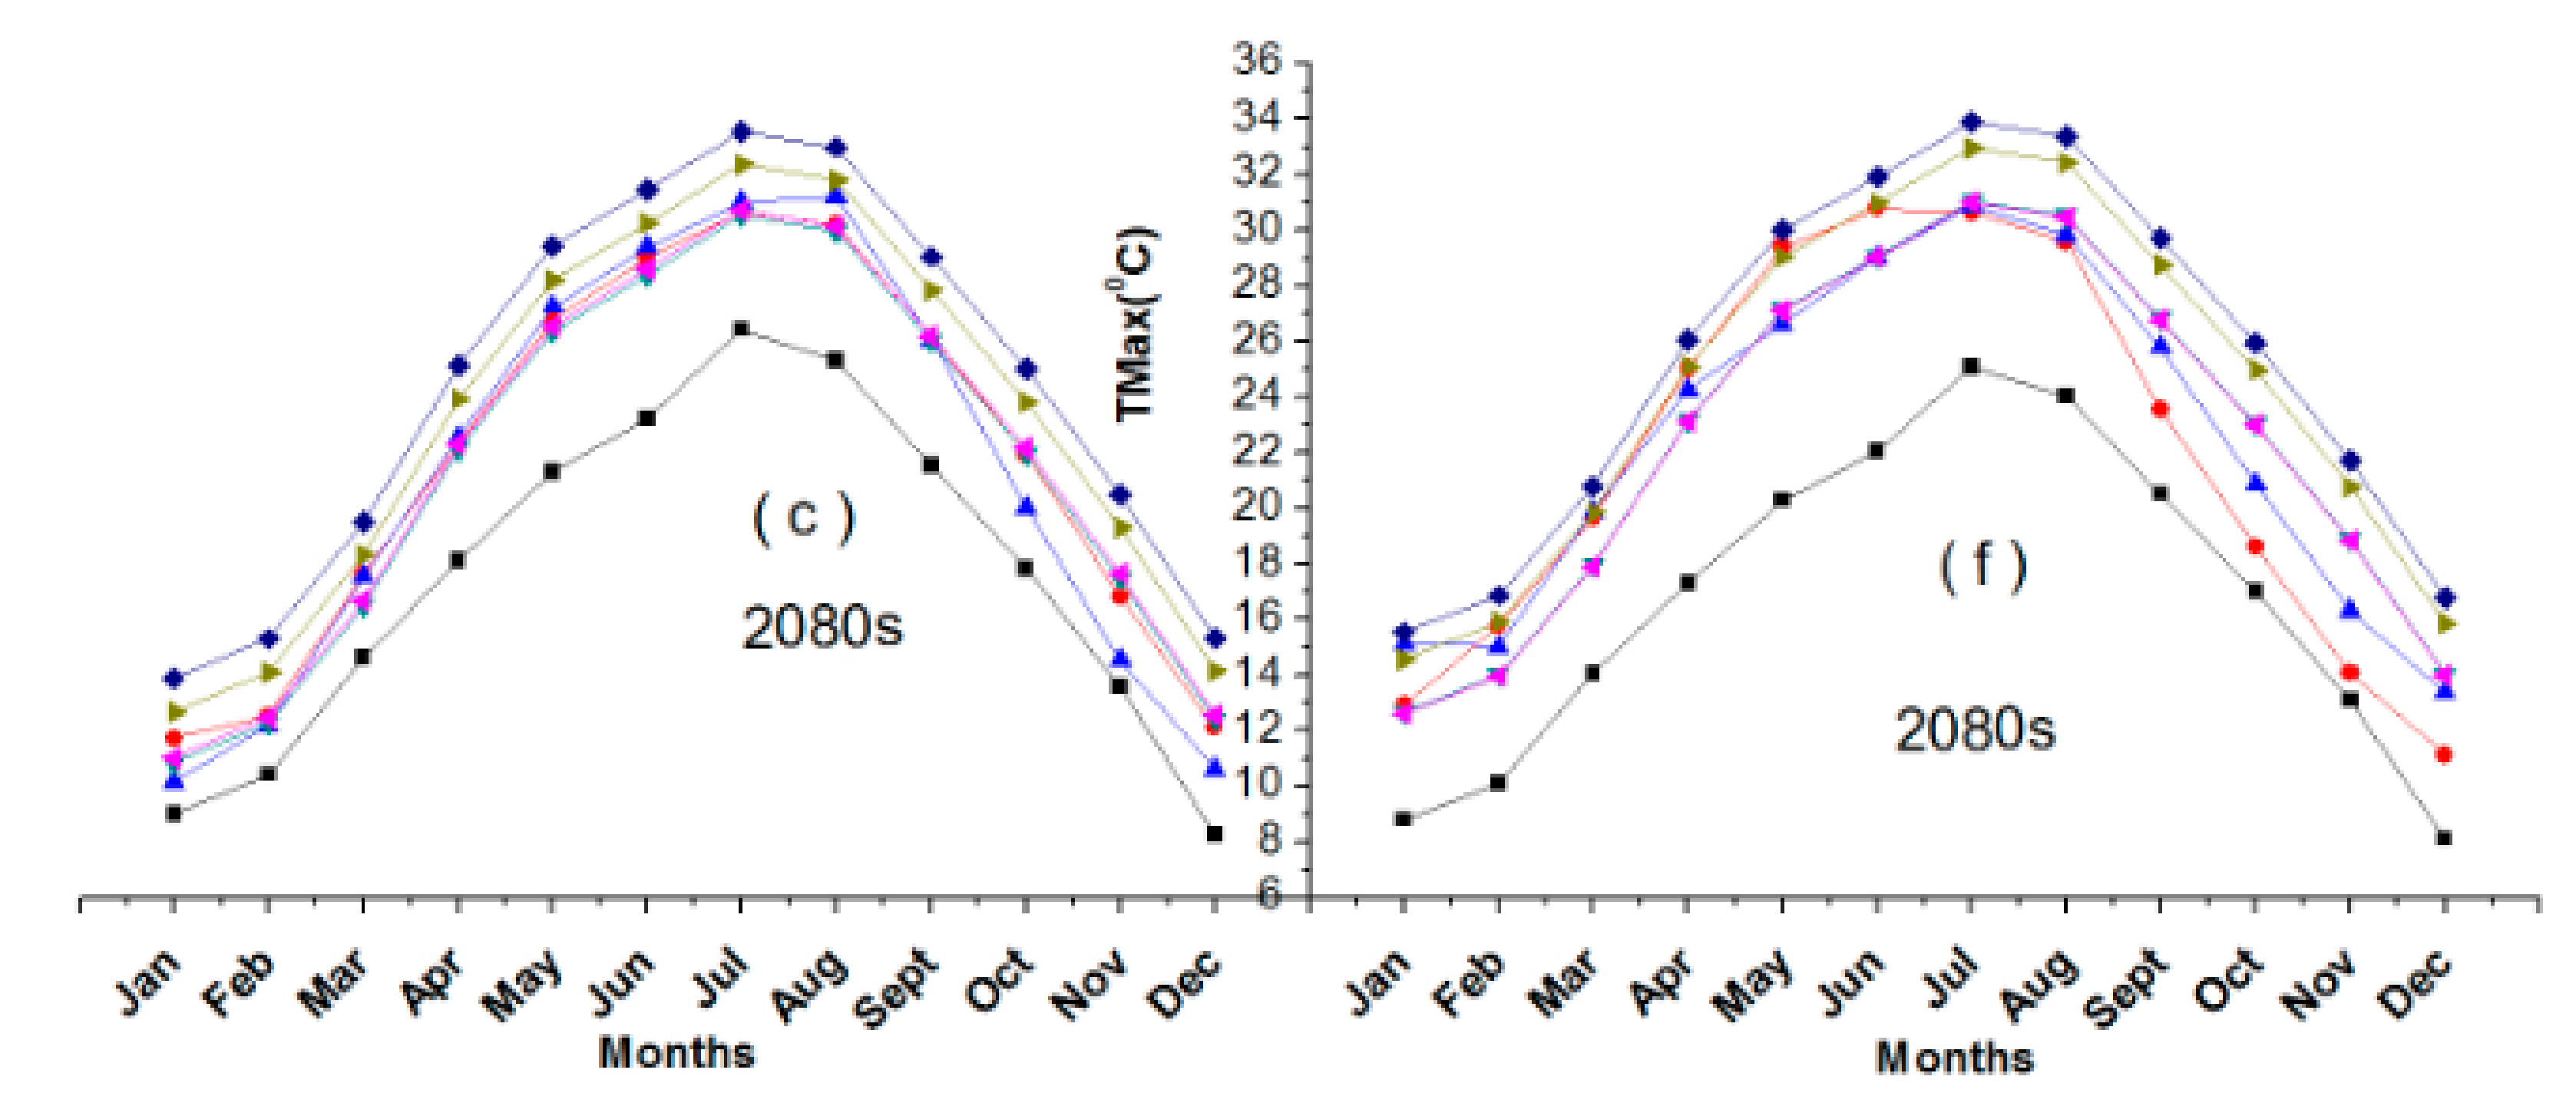
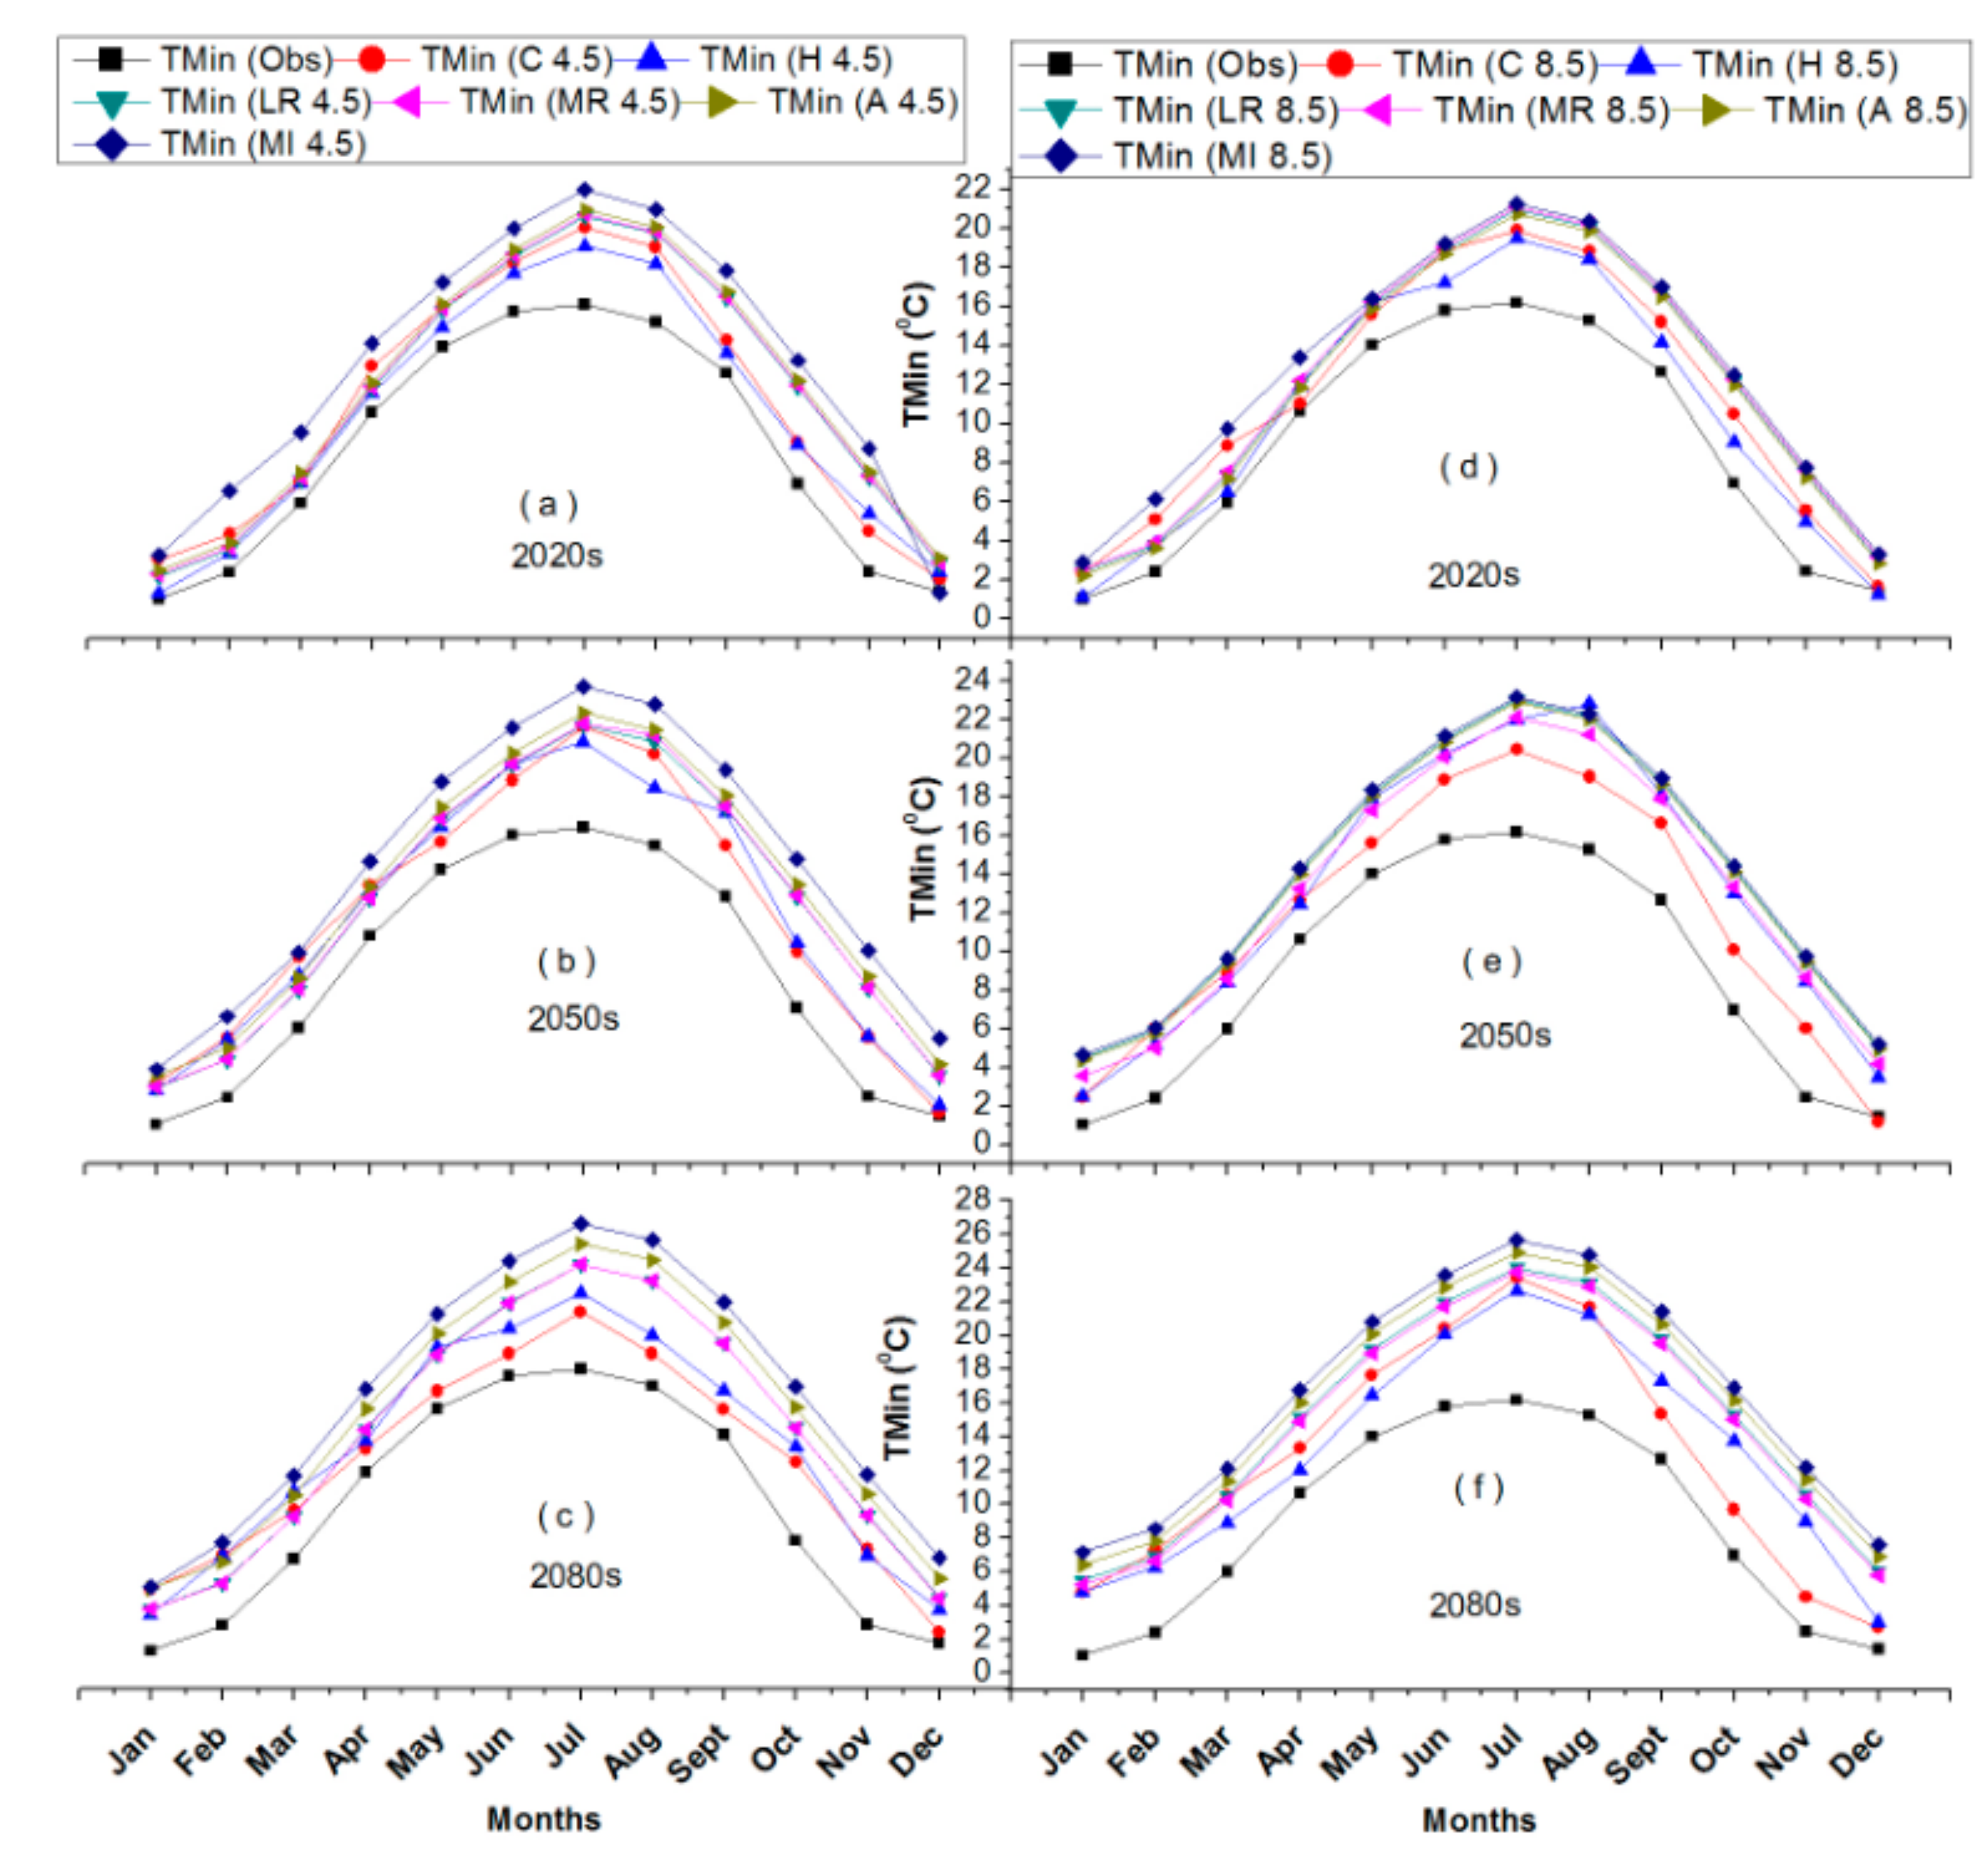
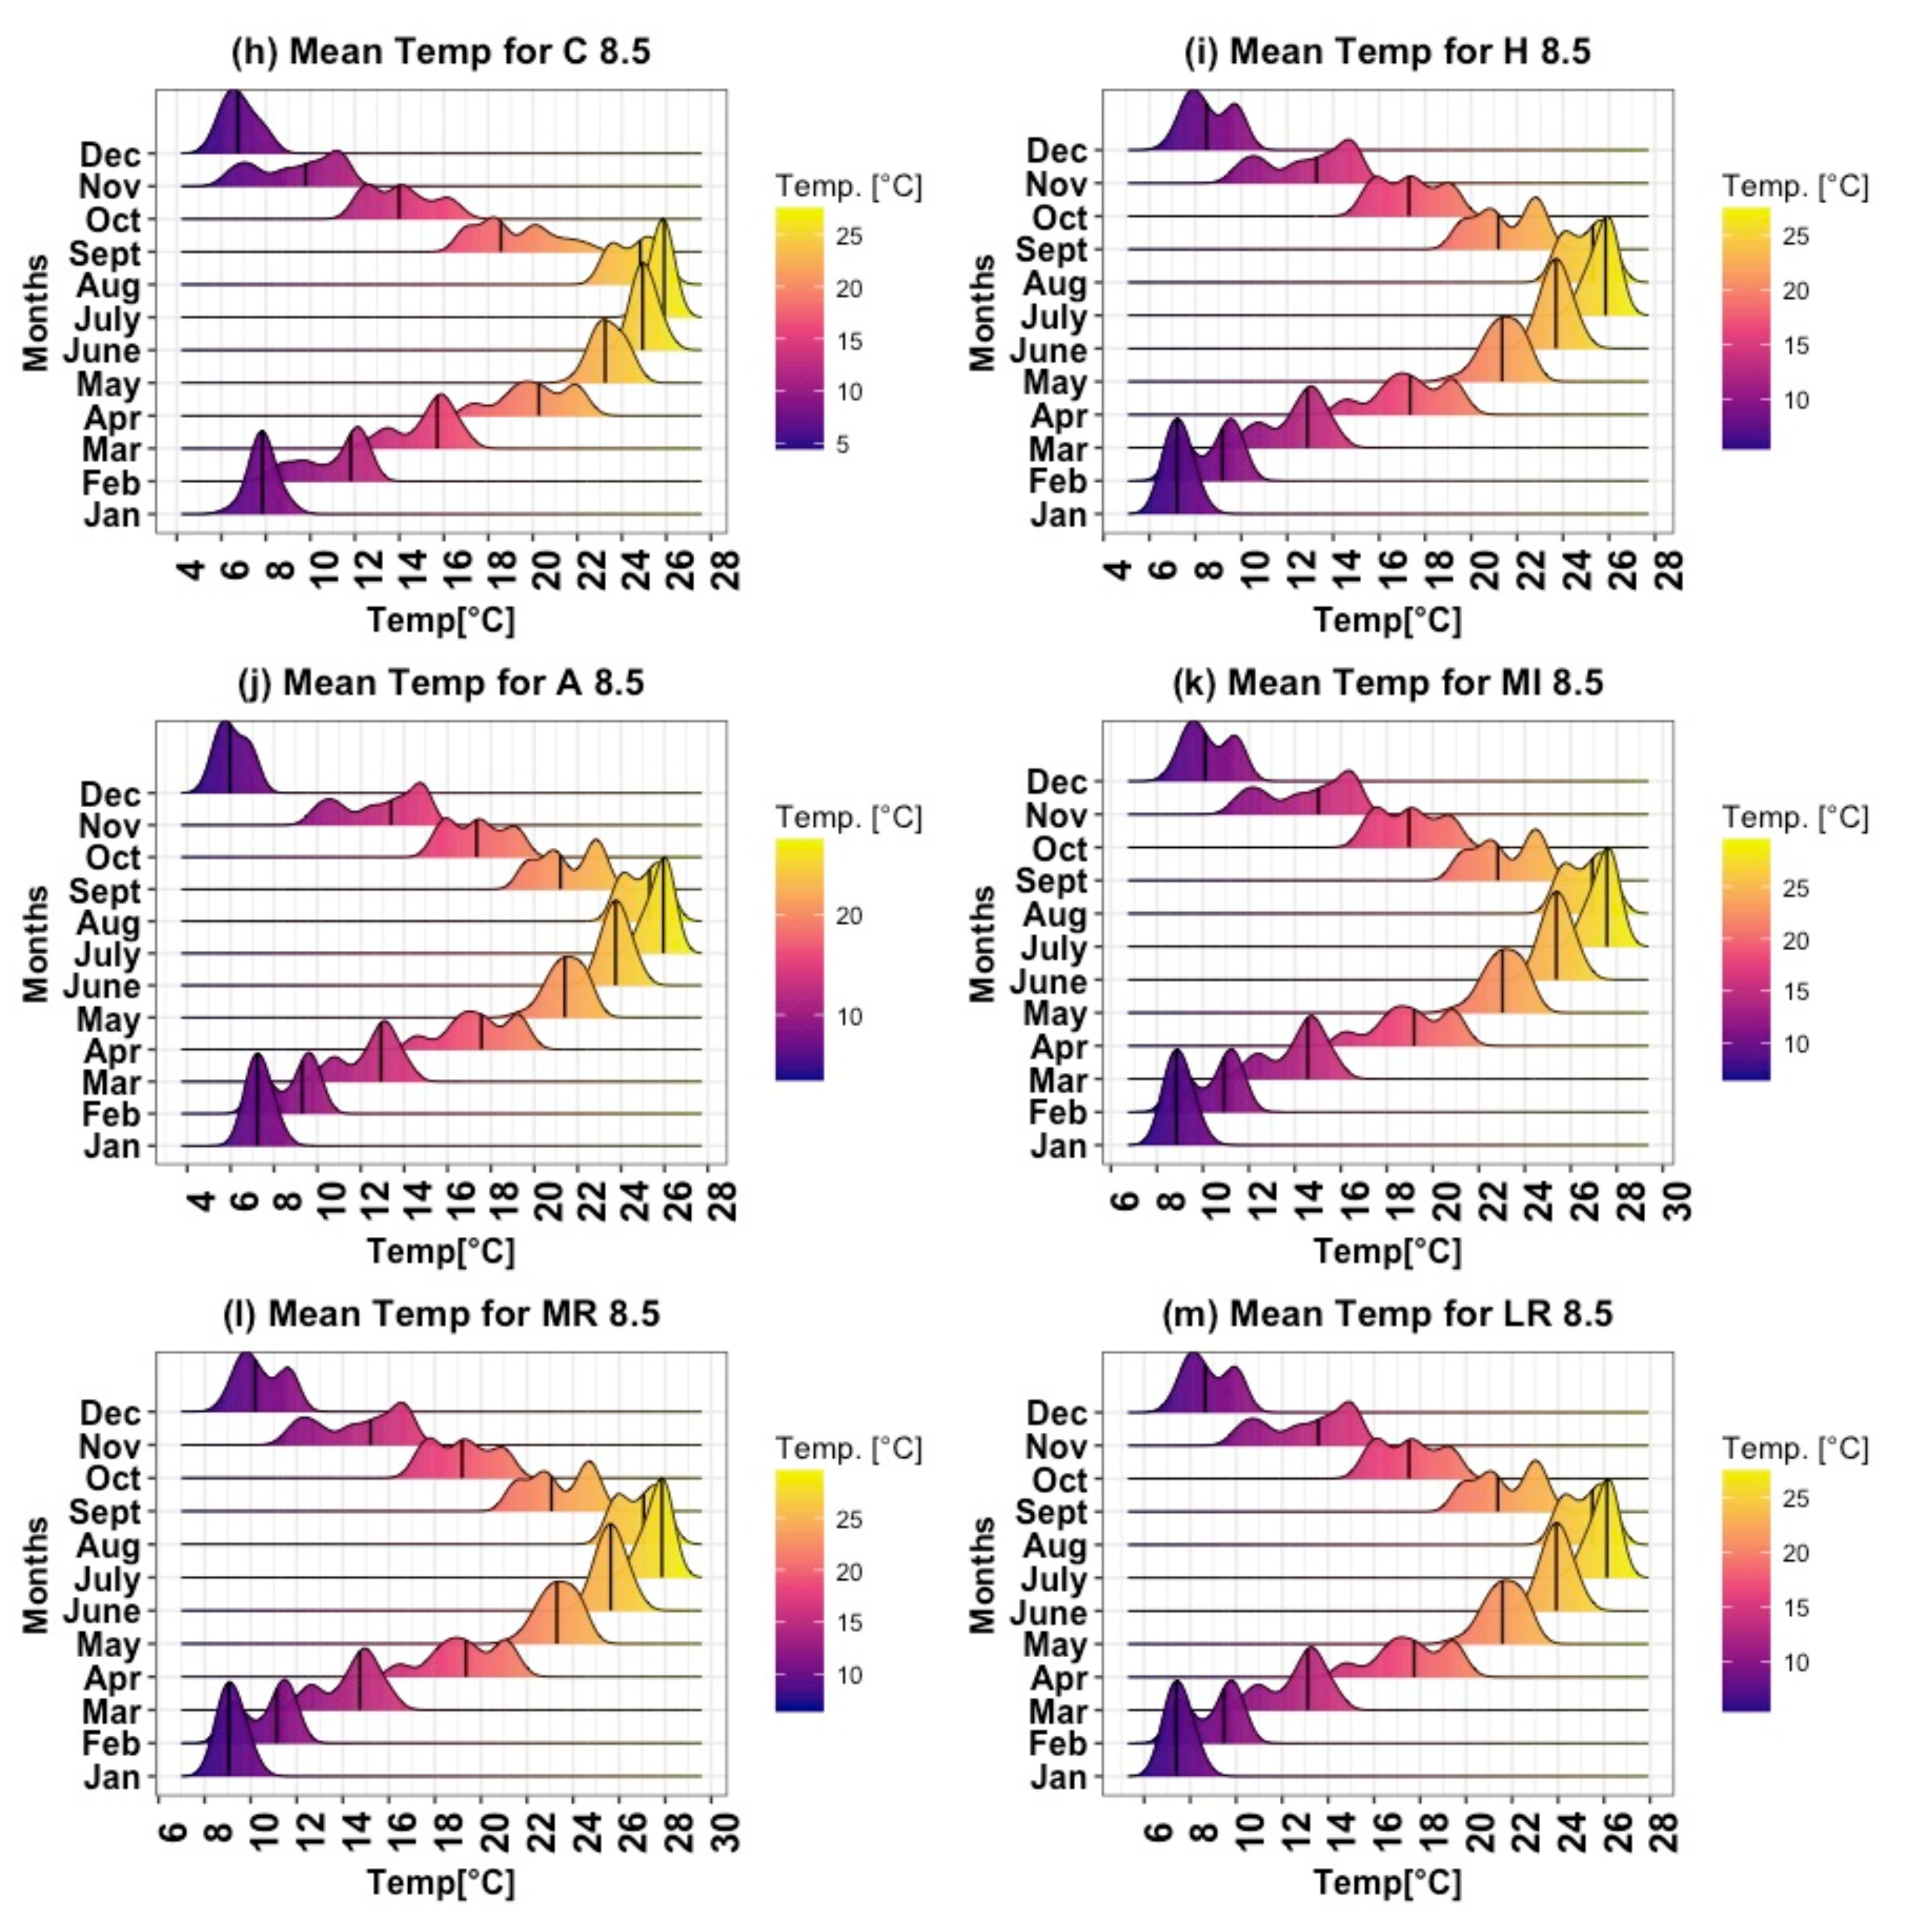
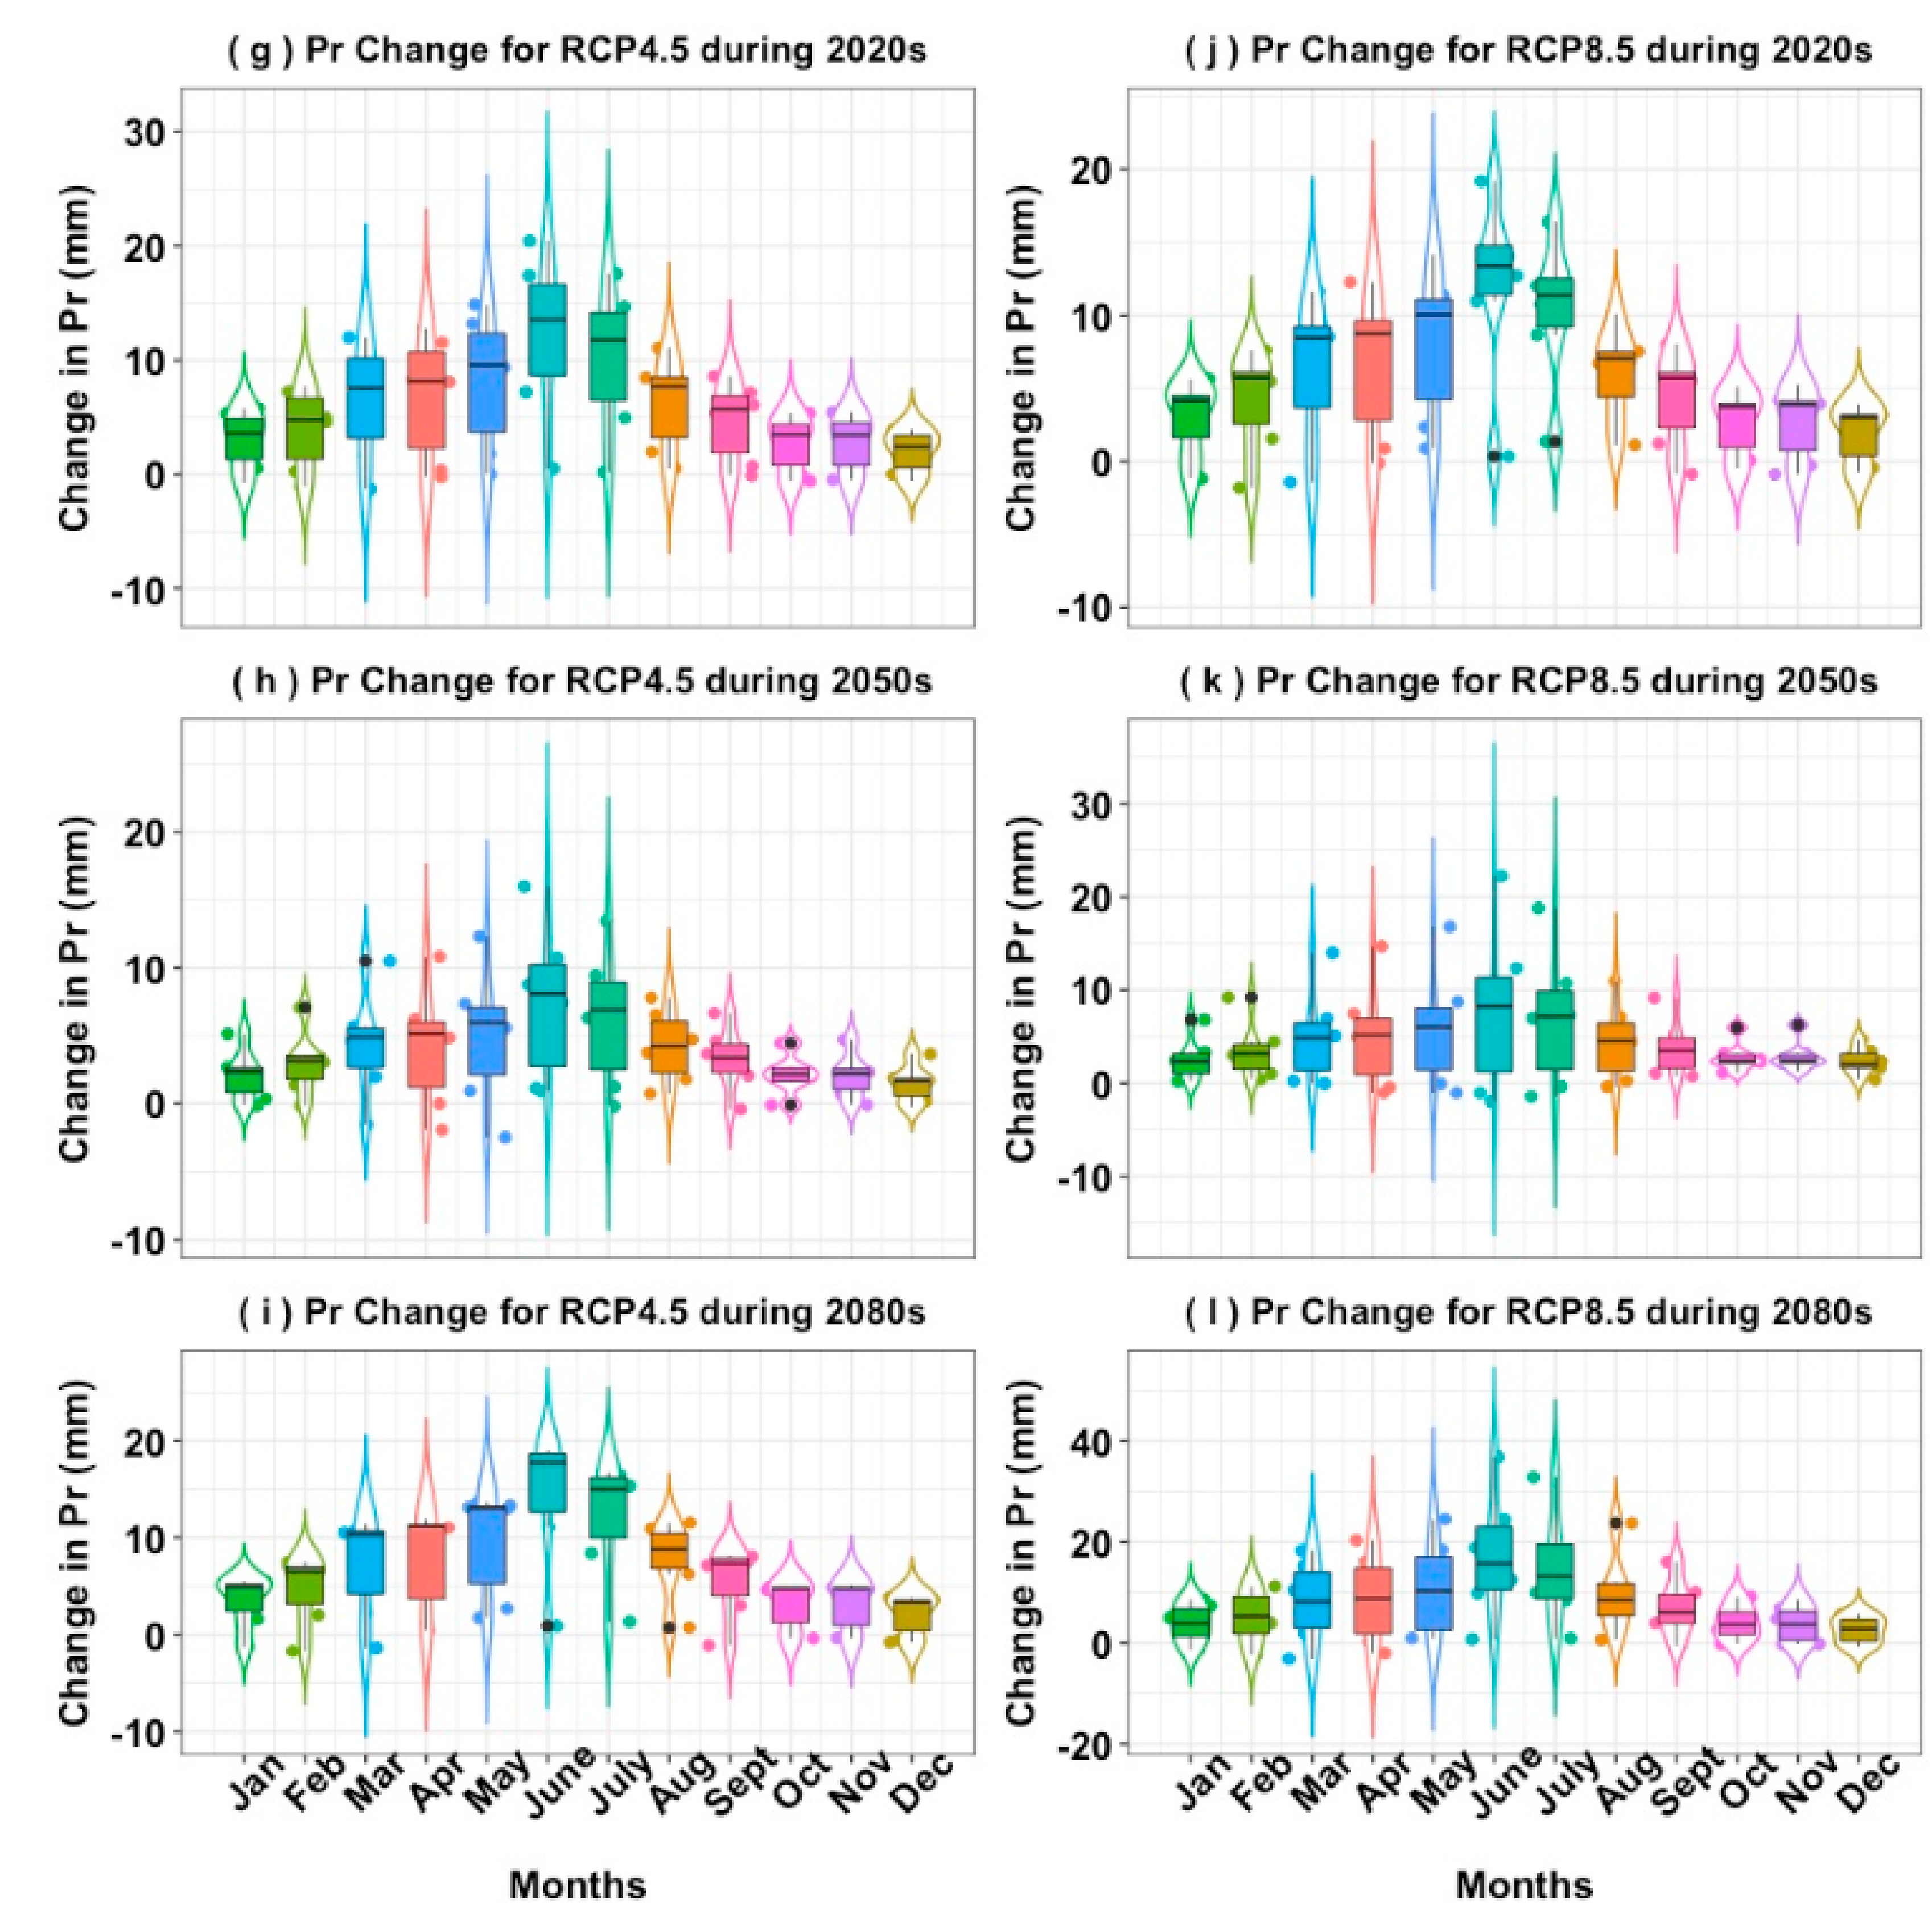
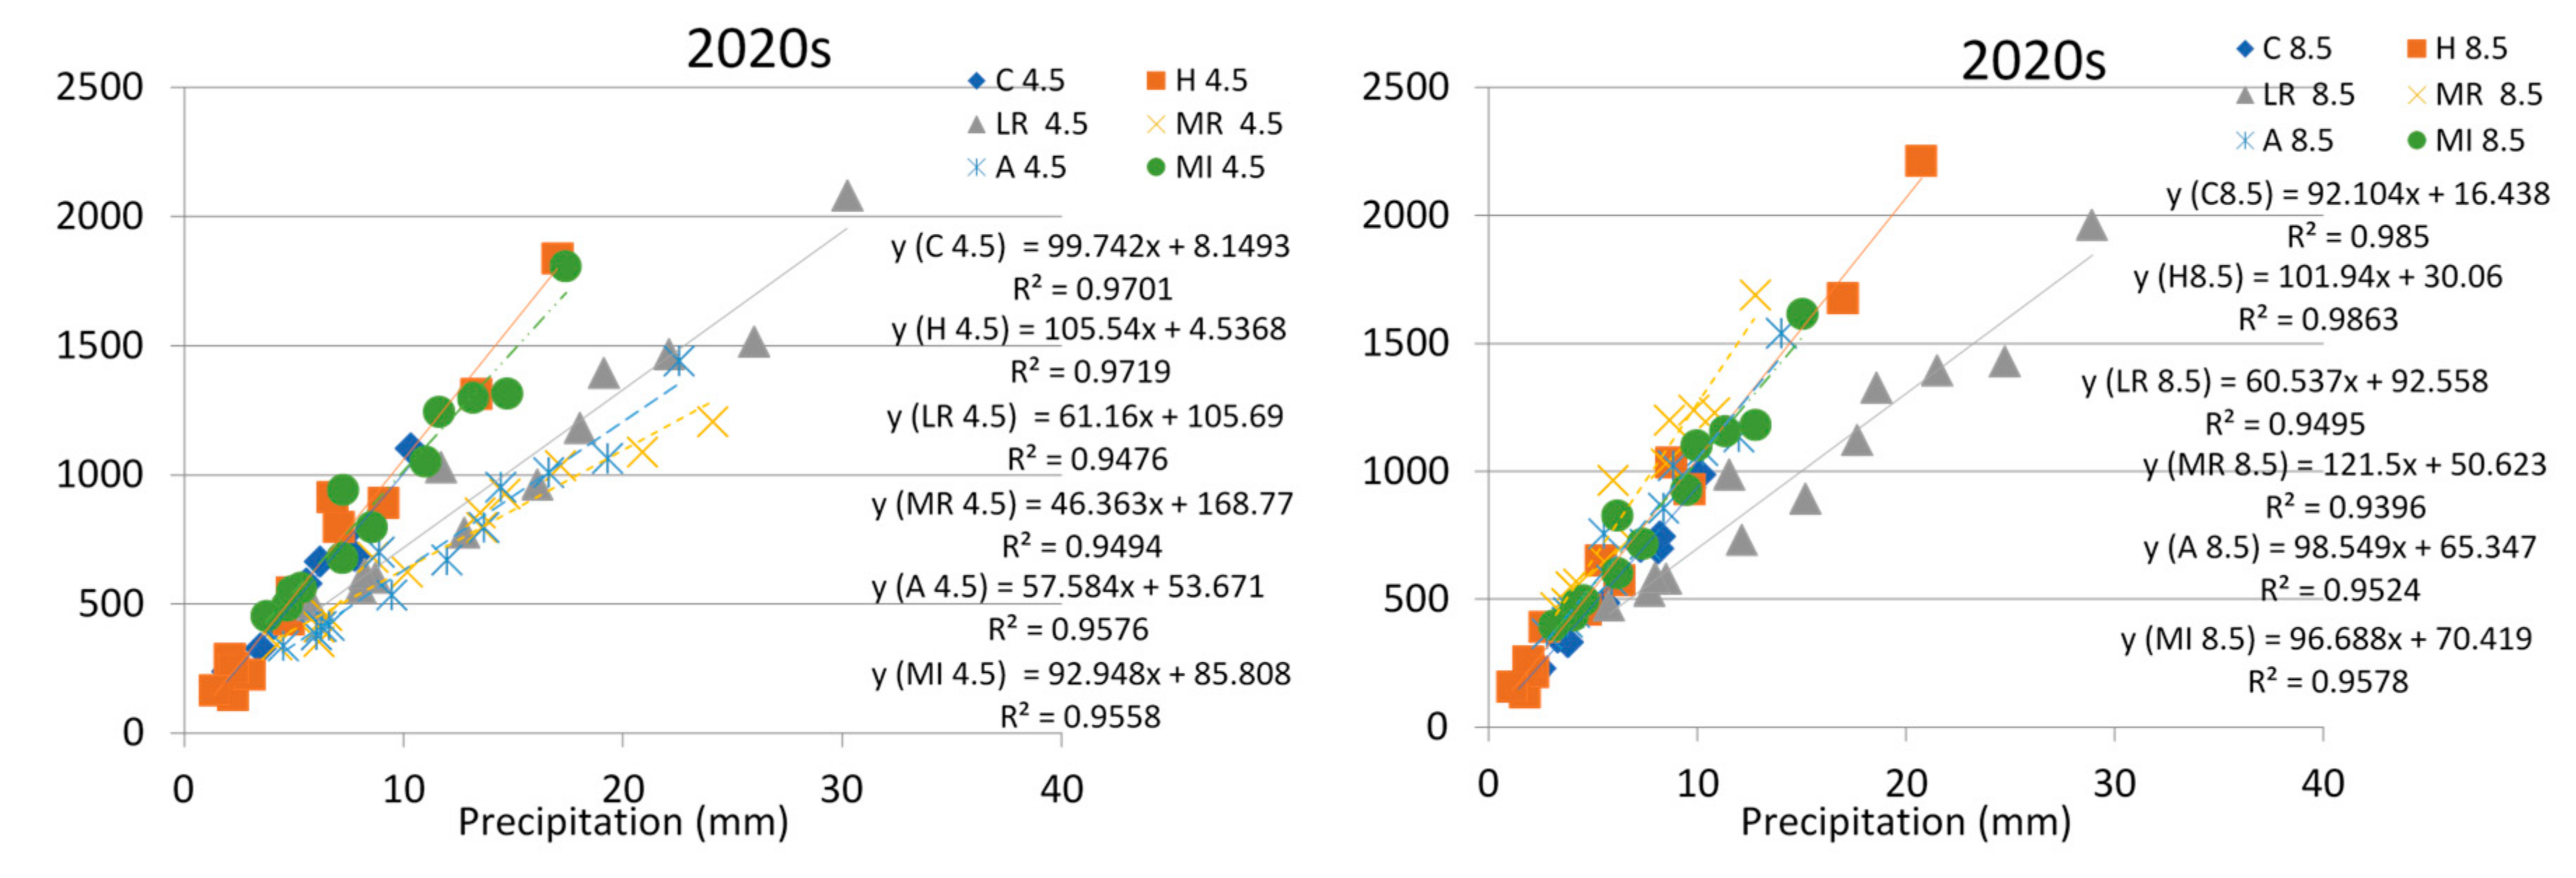
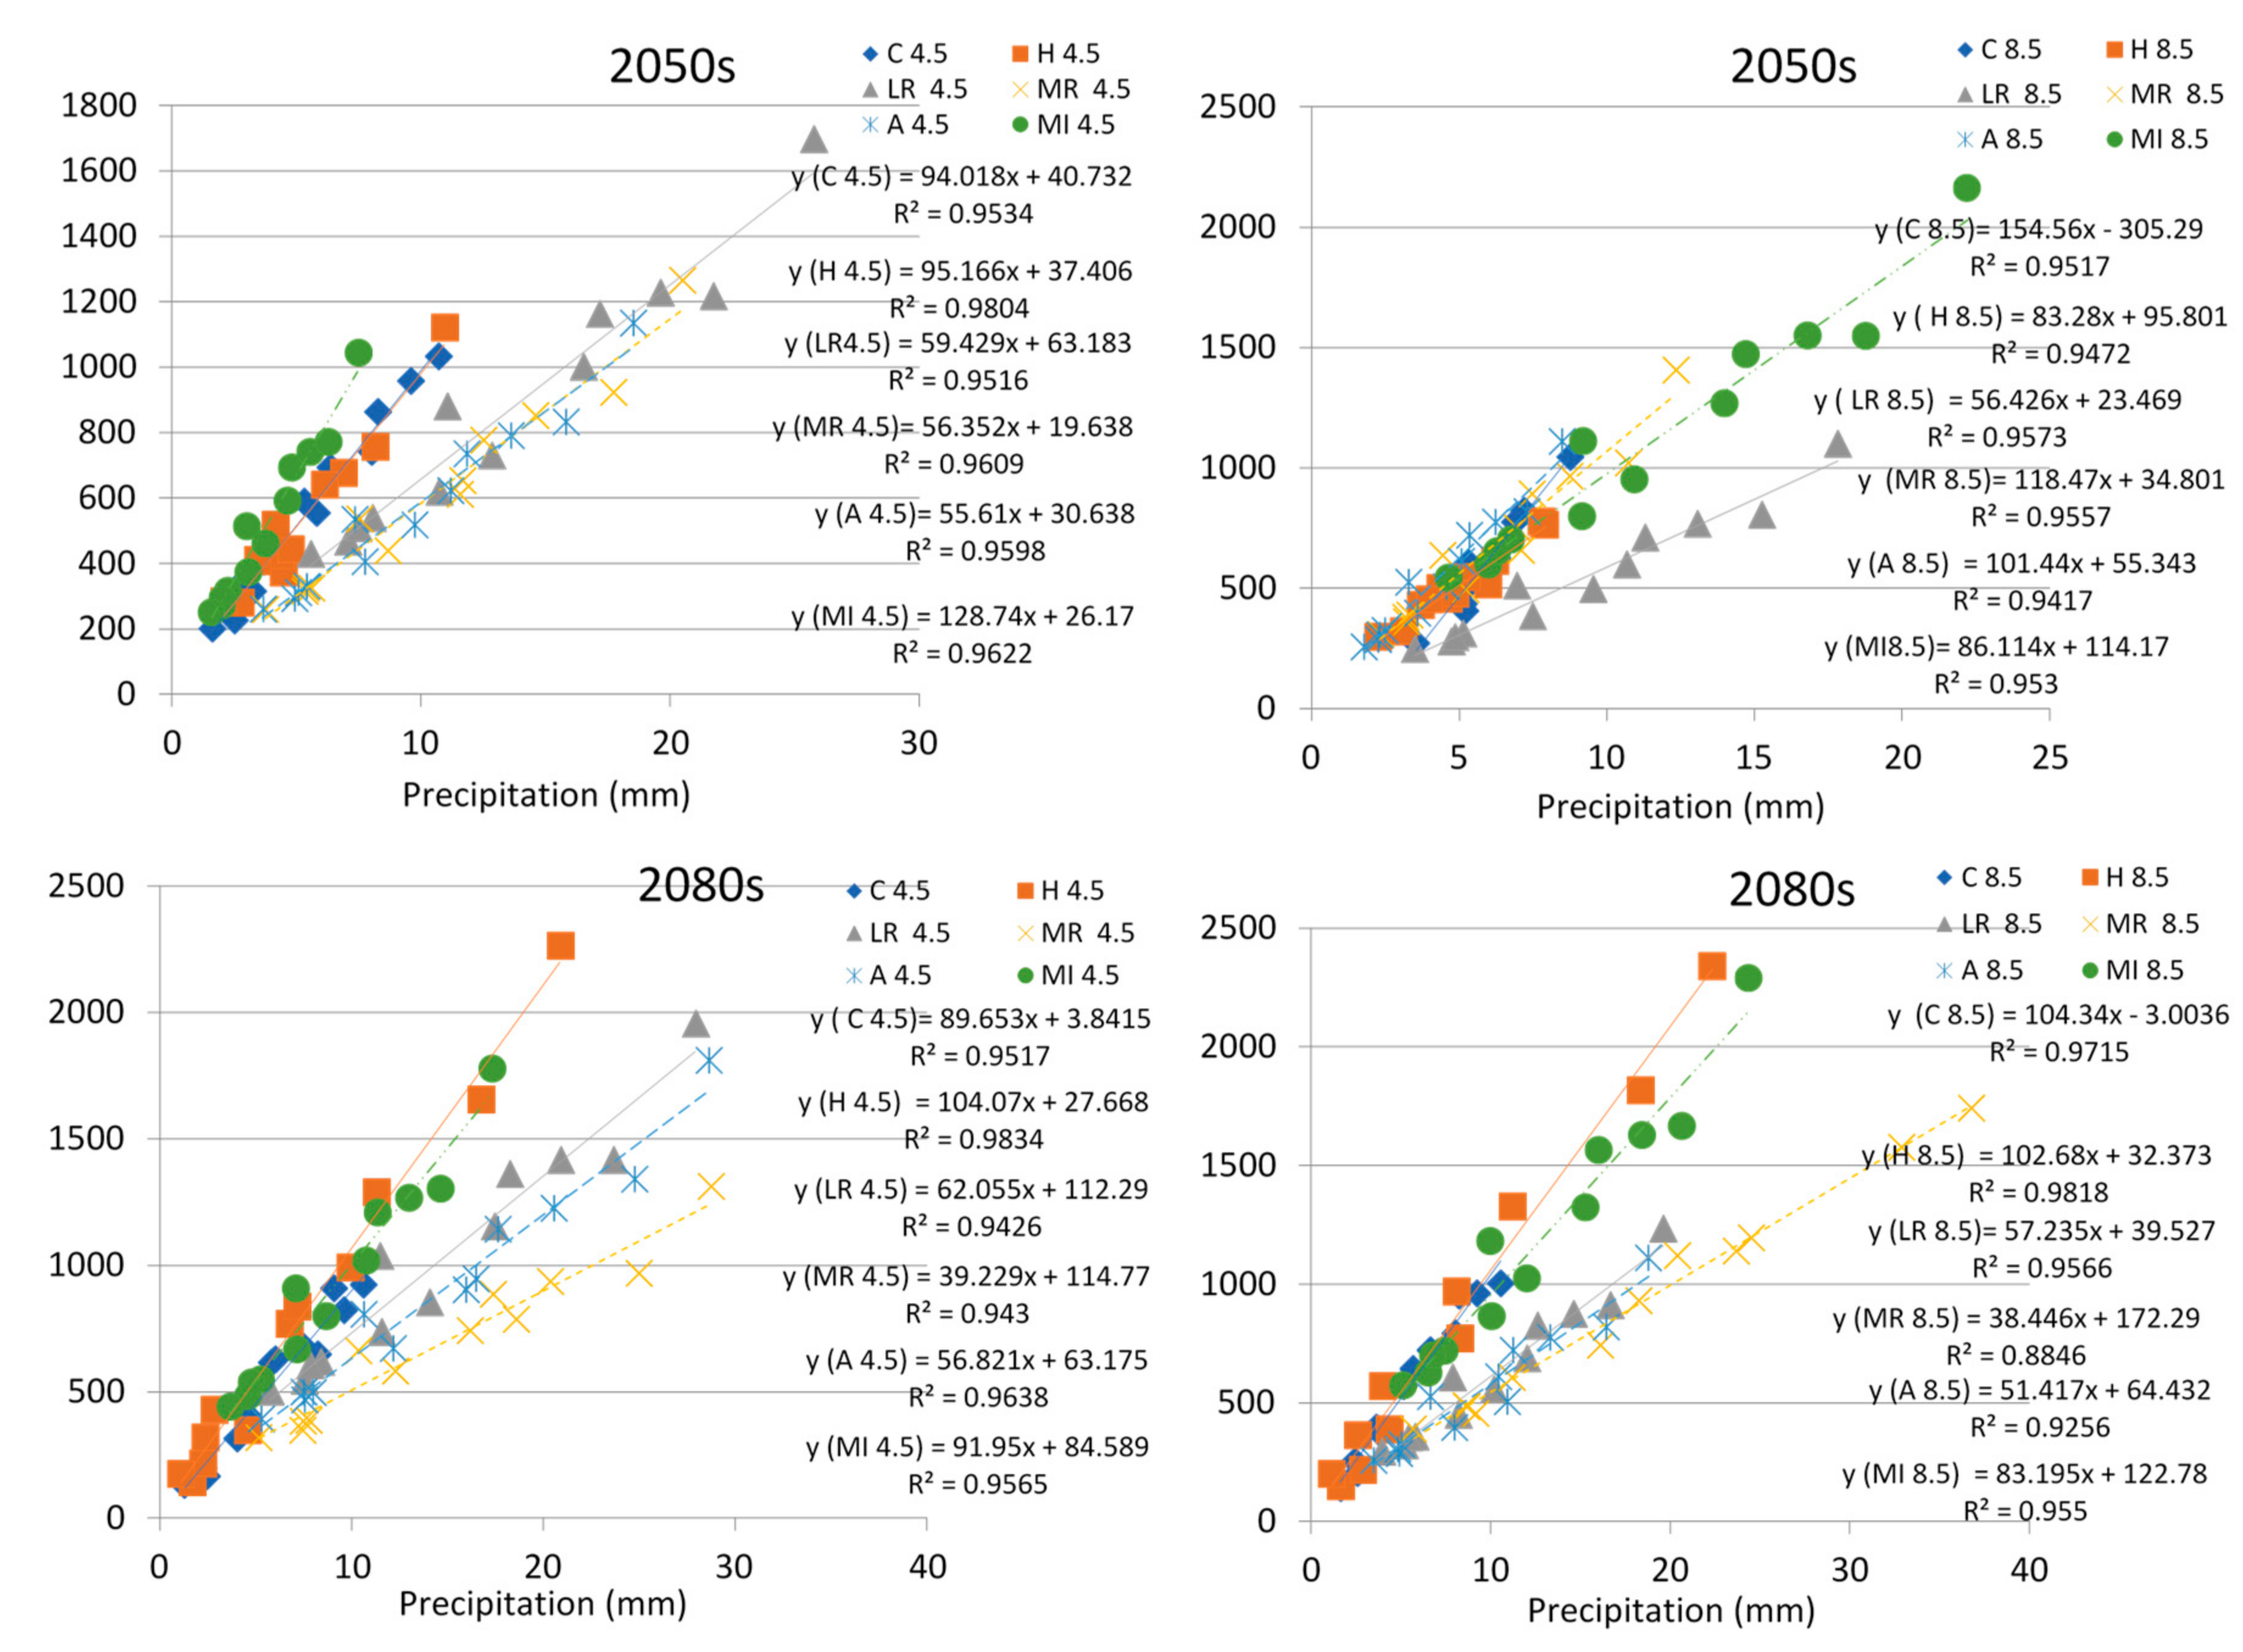
In the present study, six GCMs resulted in high differences in predicted maximum temperatures which range between 0.8 to 4.2 °C and 0.6 to 4.9 °C for RCP4.5 and RCP8.5, respectively. Similarly, the variability in the minimum temperature for different GCMs was observed between 1.1 to 4.1 °C and 0.9 to 4.8 °C under RCP4.5 and RCP8.5, respectively. The variation in projected mean monthly precipitation results under various GCMs is even larger (
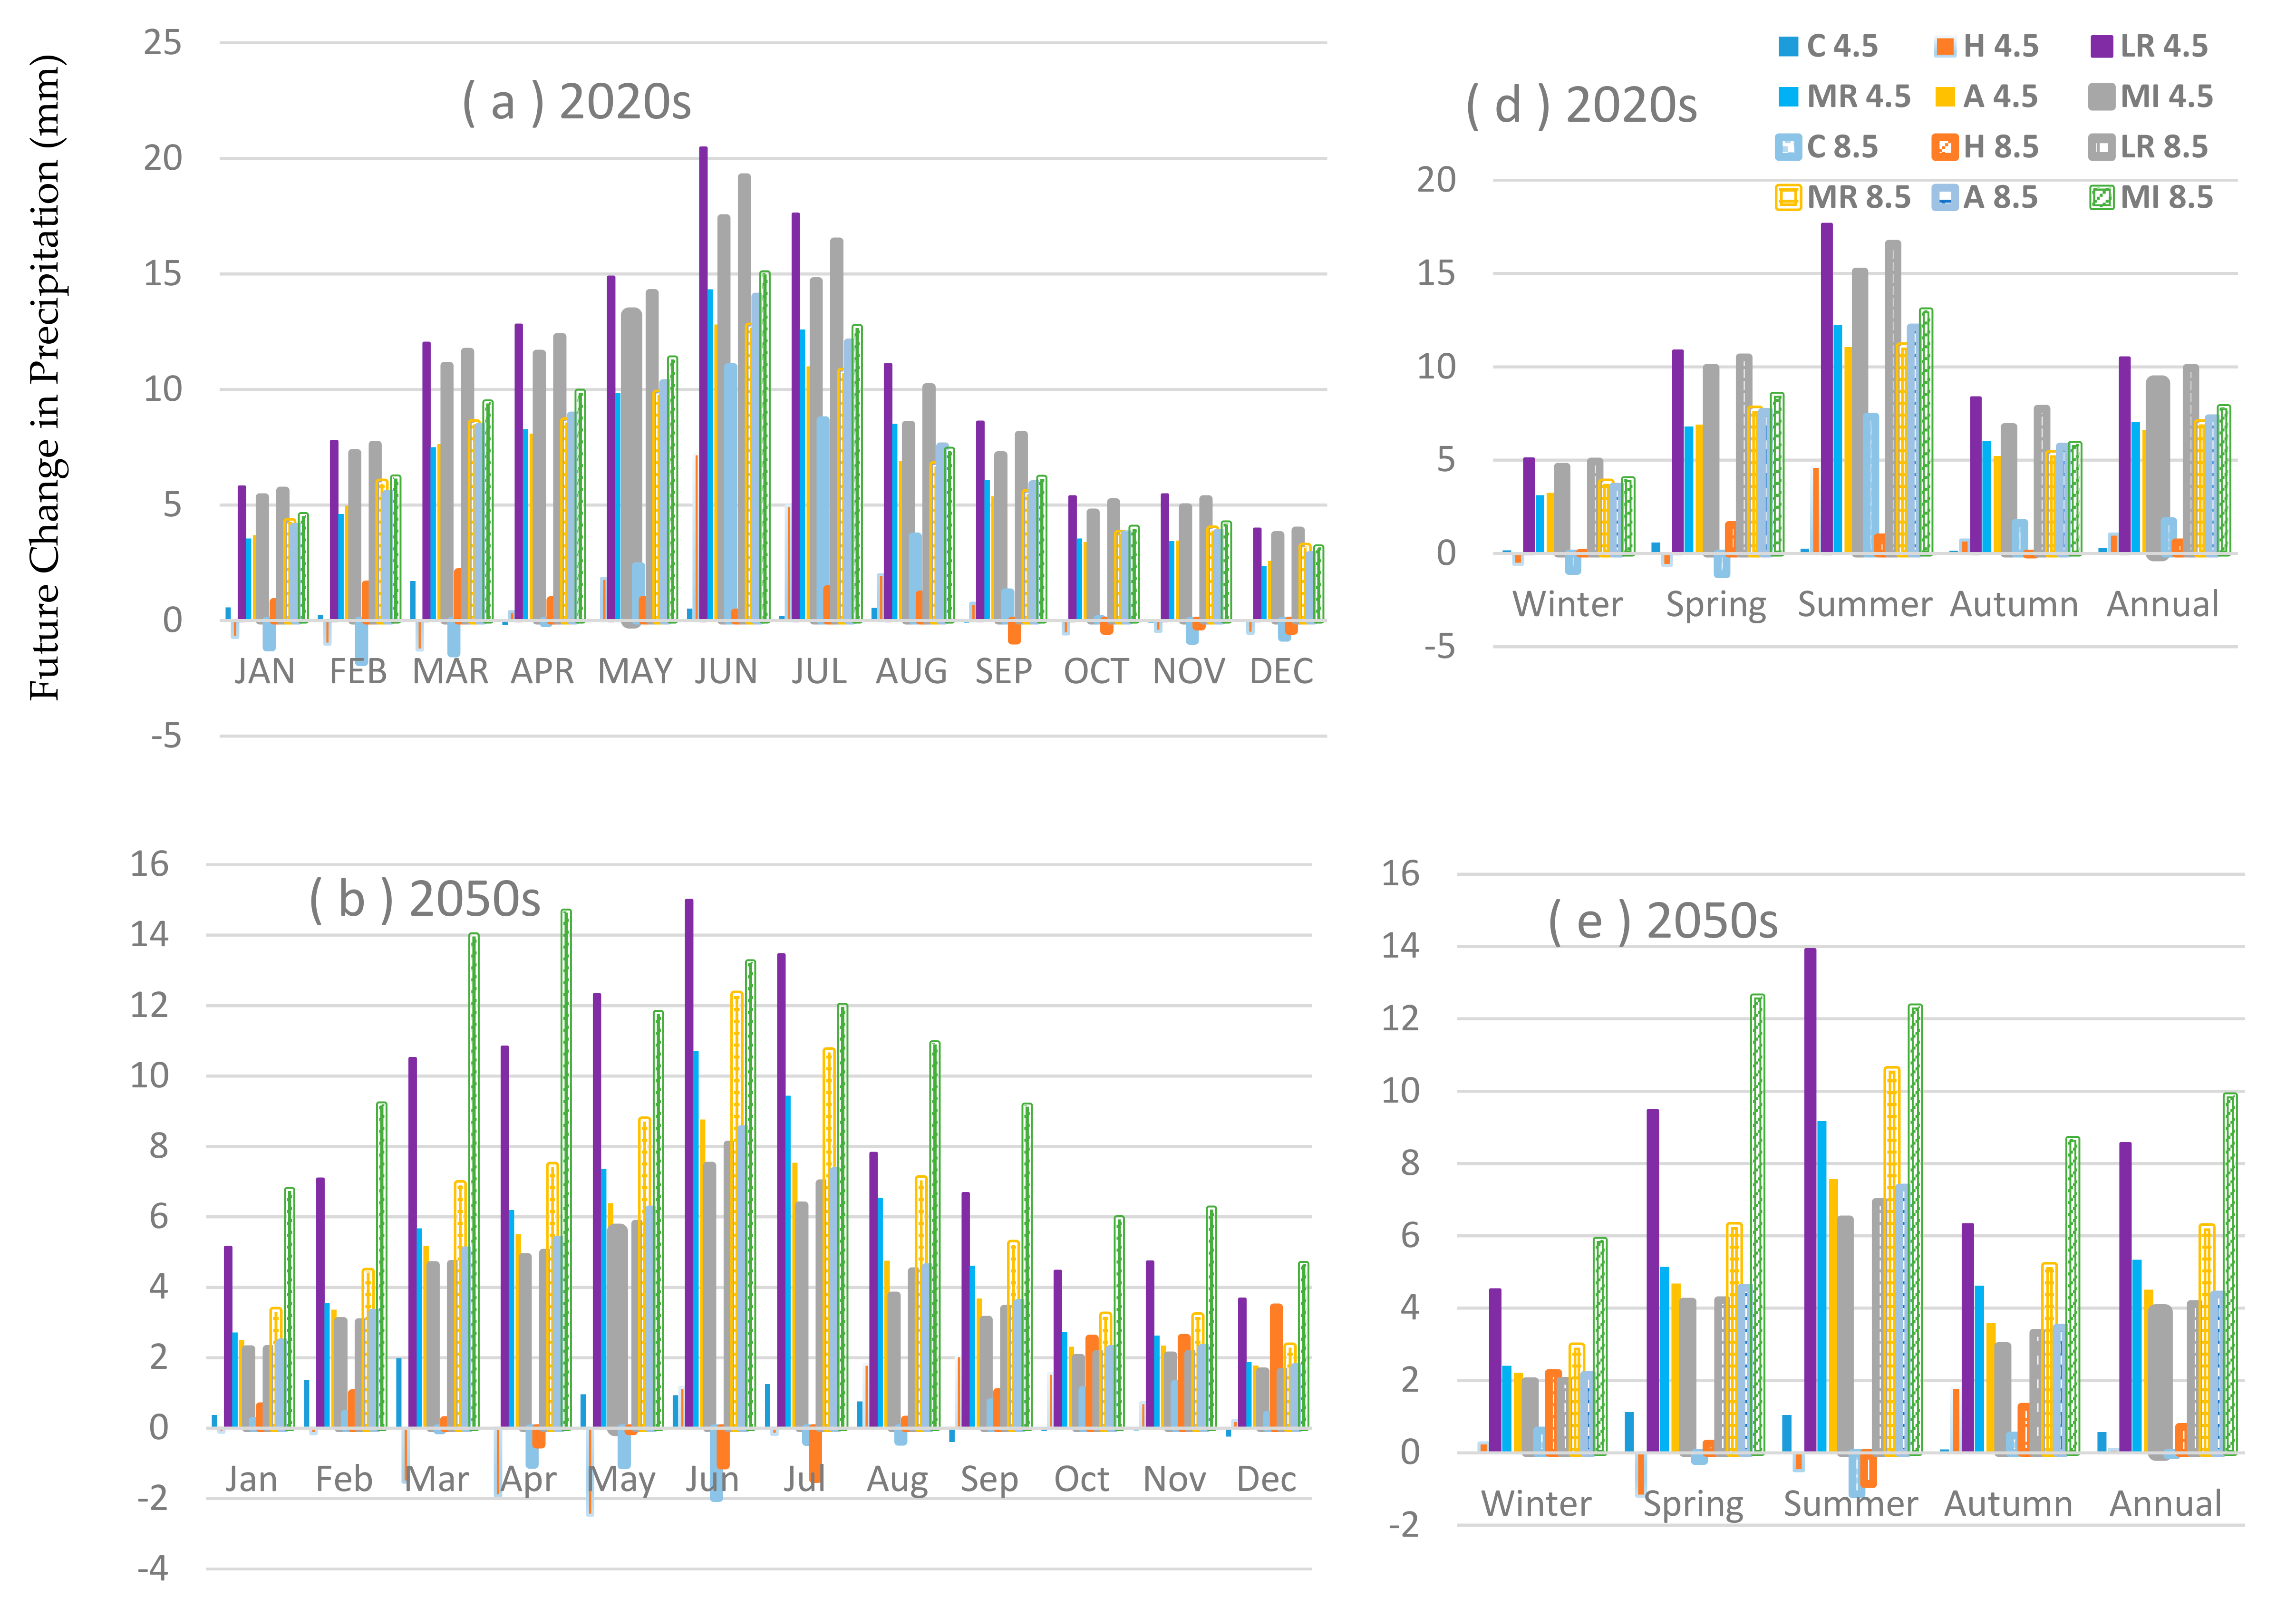
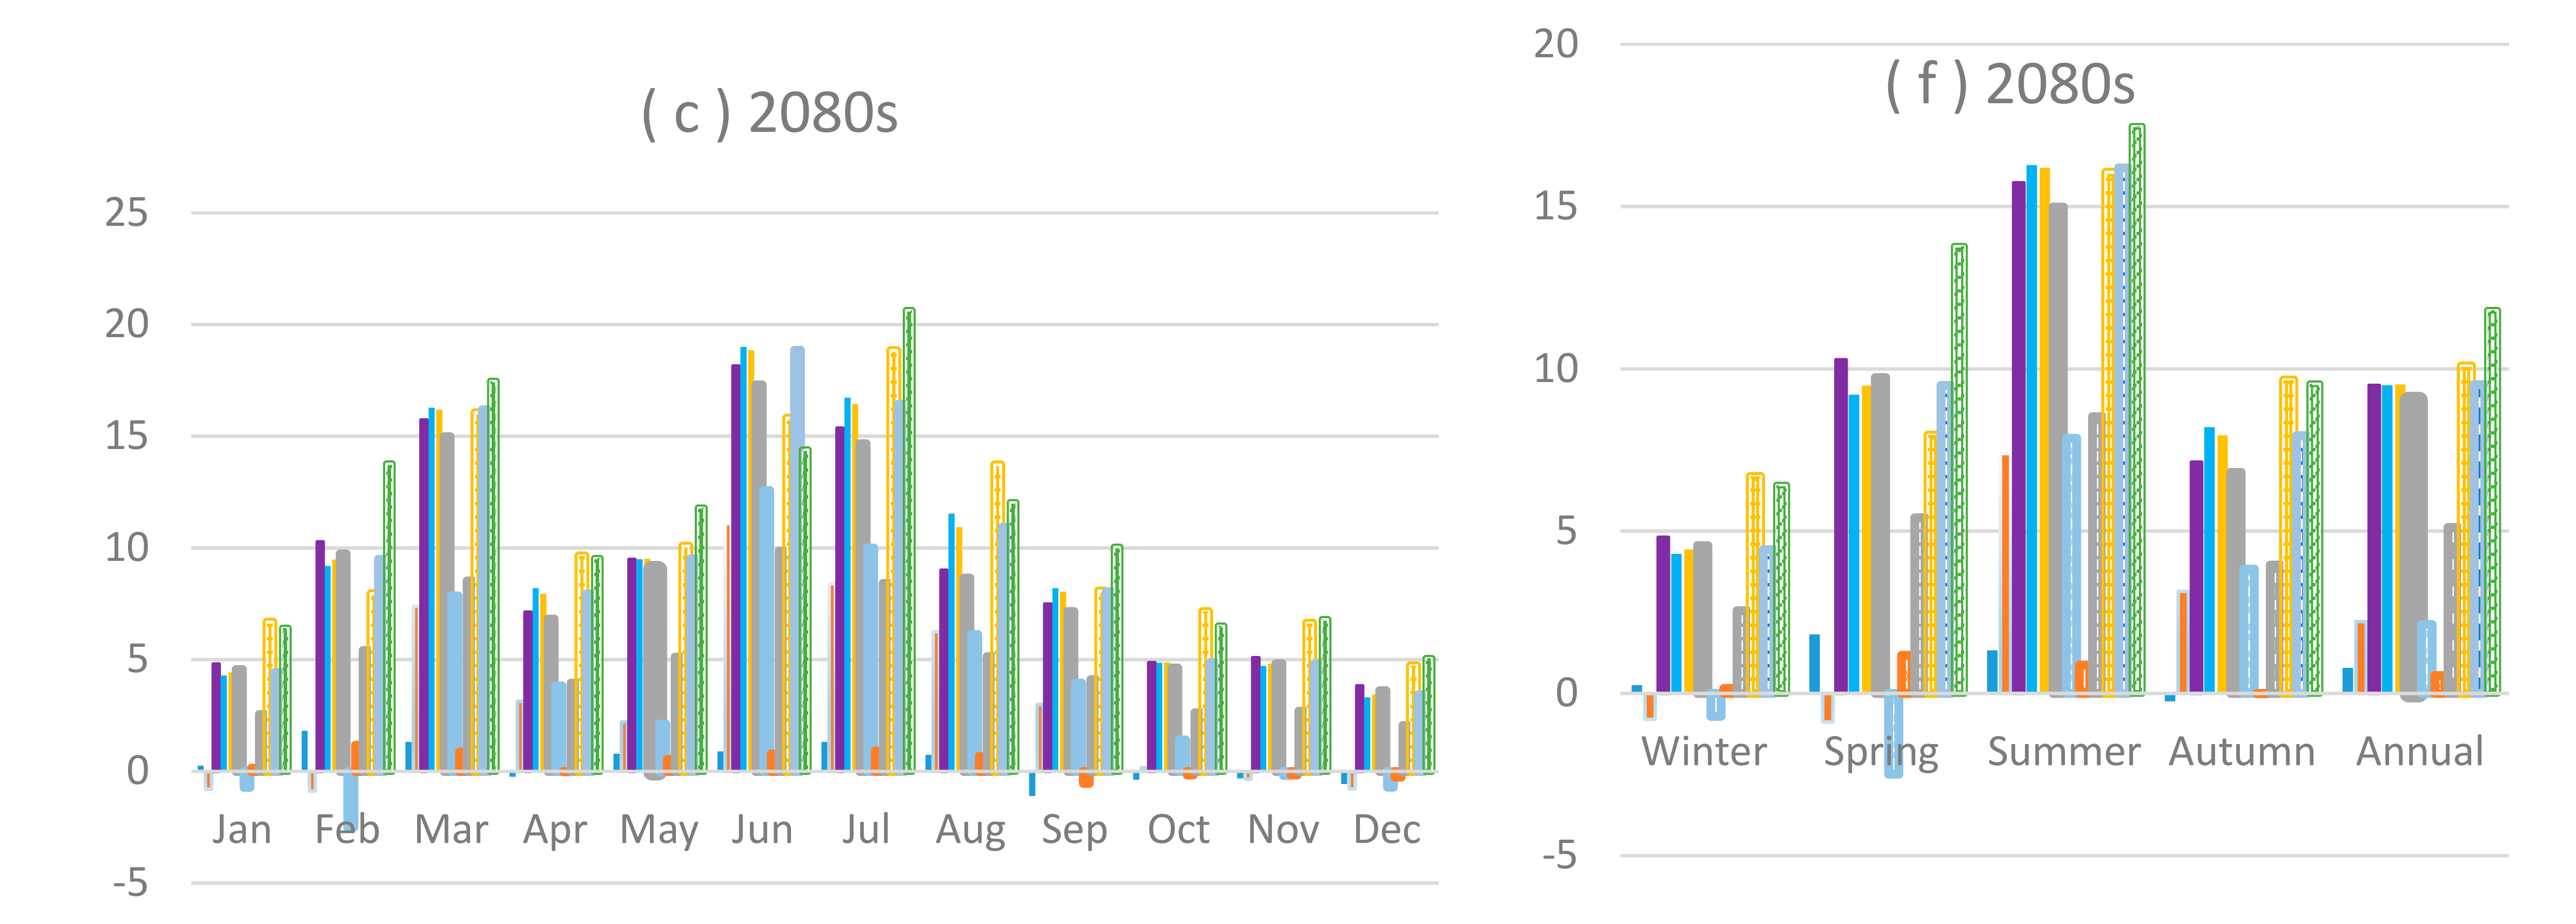
Figure 7). In this case, the variability in projected precipitation range from −0.44 to 20 mm and −0.6 to 15 mm during the 2020s and 2050s, for RCP4.5 and RCP8.5, respectively. A variation ranges from −1.1 to 18.8 mm was observed in mean monthly precipitation during the 2080s for different GCMs. According to [
64], it is generally difficult to accurately project climatic variables, especially precipitation, and thus uncertainties in projected temperatures and precipitations could result in associated uncertainties for projected streamflows.
Based on the results of six GCMs under RCP4.5 and 8.5 scenarios, changes in the precipitation and temperature could influence directly or indirectly the water resources of the area and as these projected streamflows were used to predict the optimal future hydropower production. Therefore, these changes in streamflows impact the hydropower production of Xin’anjiang hydropower station, based on these GCMs projections. The projected GCMs show an increase in the precipitation amount in the study area compared to base years. The precipitation is strongly influenced by several circulation systems such as southerly moisture transport, East Asia Monsoon and anthropogenic affects. Southerly moisture transport and the interdecadal variation of the East Asian monsoon are key factors which can cause an increase in the precipitation amount in eastern China [
84,
85,
86]. Another key factor behind the increase in the precipitation amount of eastern China is the temperature variability at the interdecadal and interannual timescales in high latitudes, such as Tibetan Plateau and nearby oceans [
87,
88]. These are the major reasons behind the increase in the precipitation amount and further investigated by climate modeling need to be carried out in the future to study this phenomenon in detail.
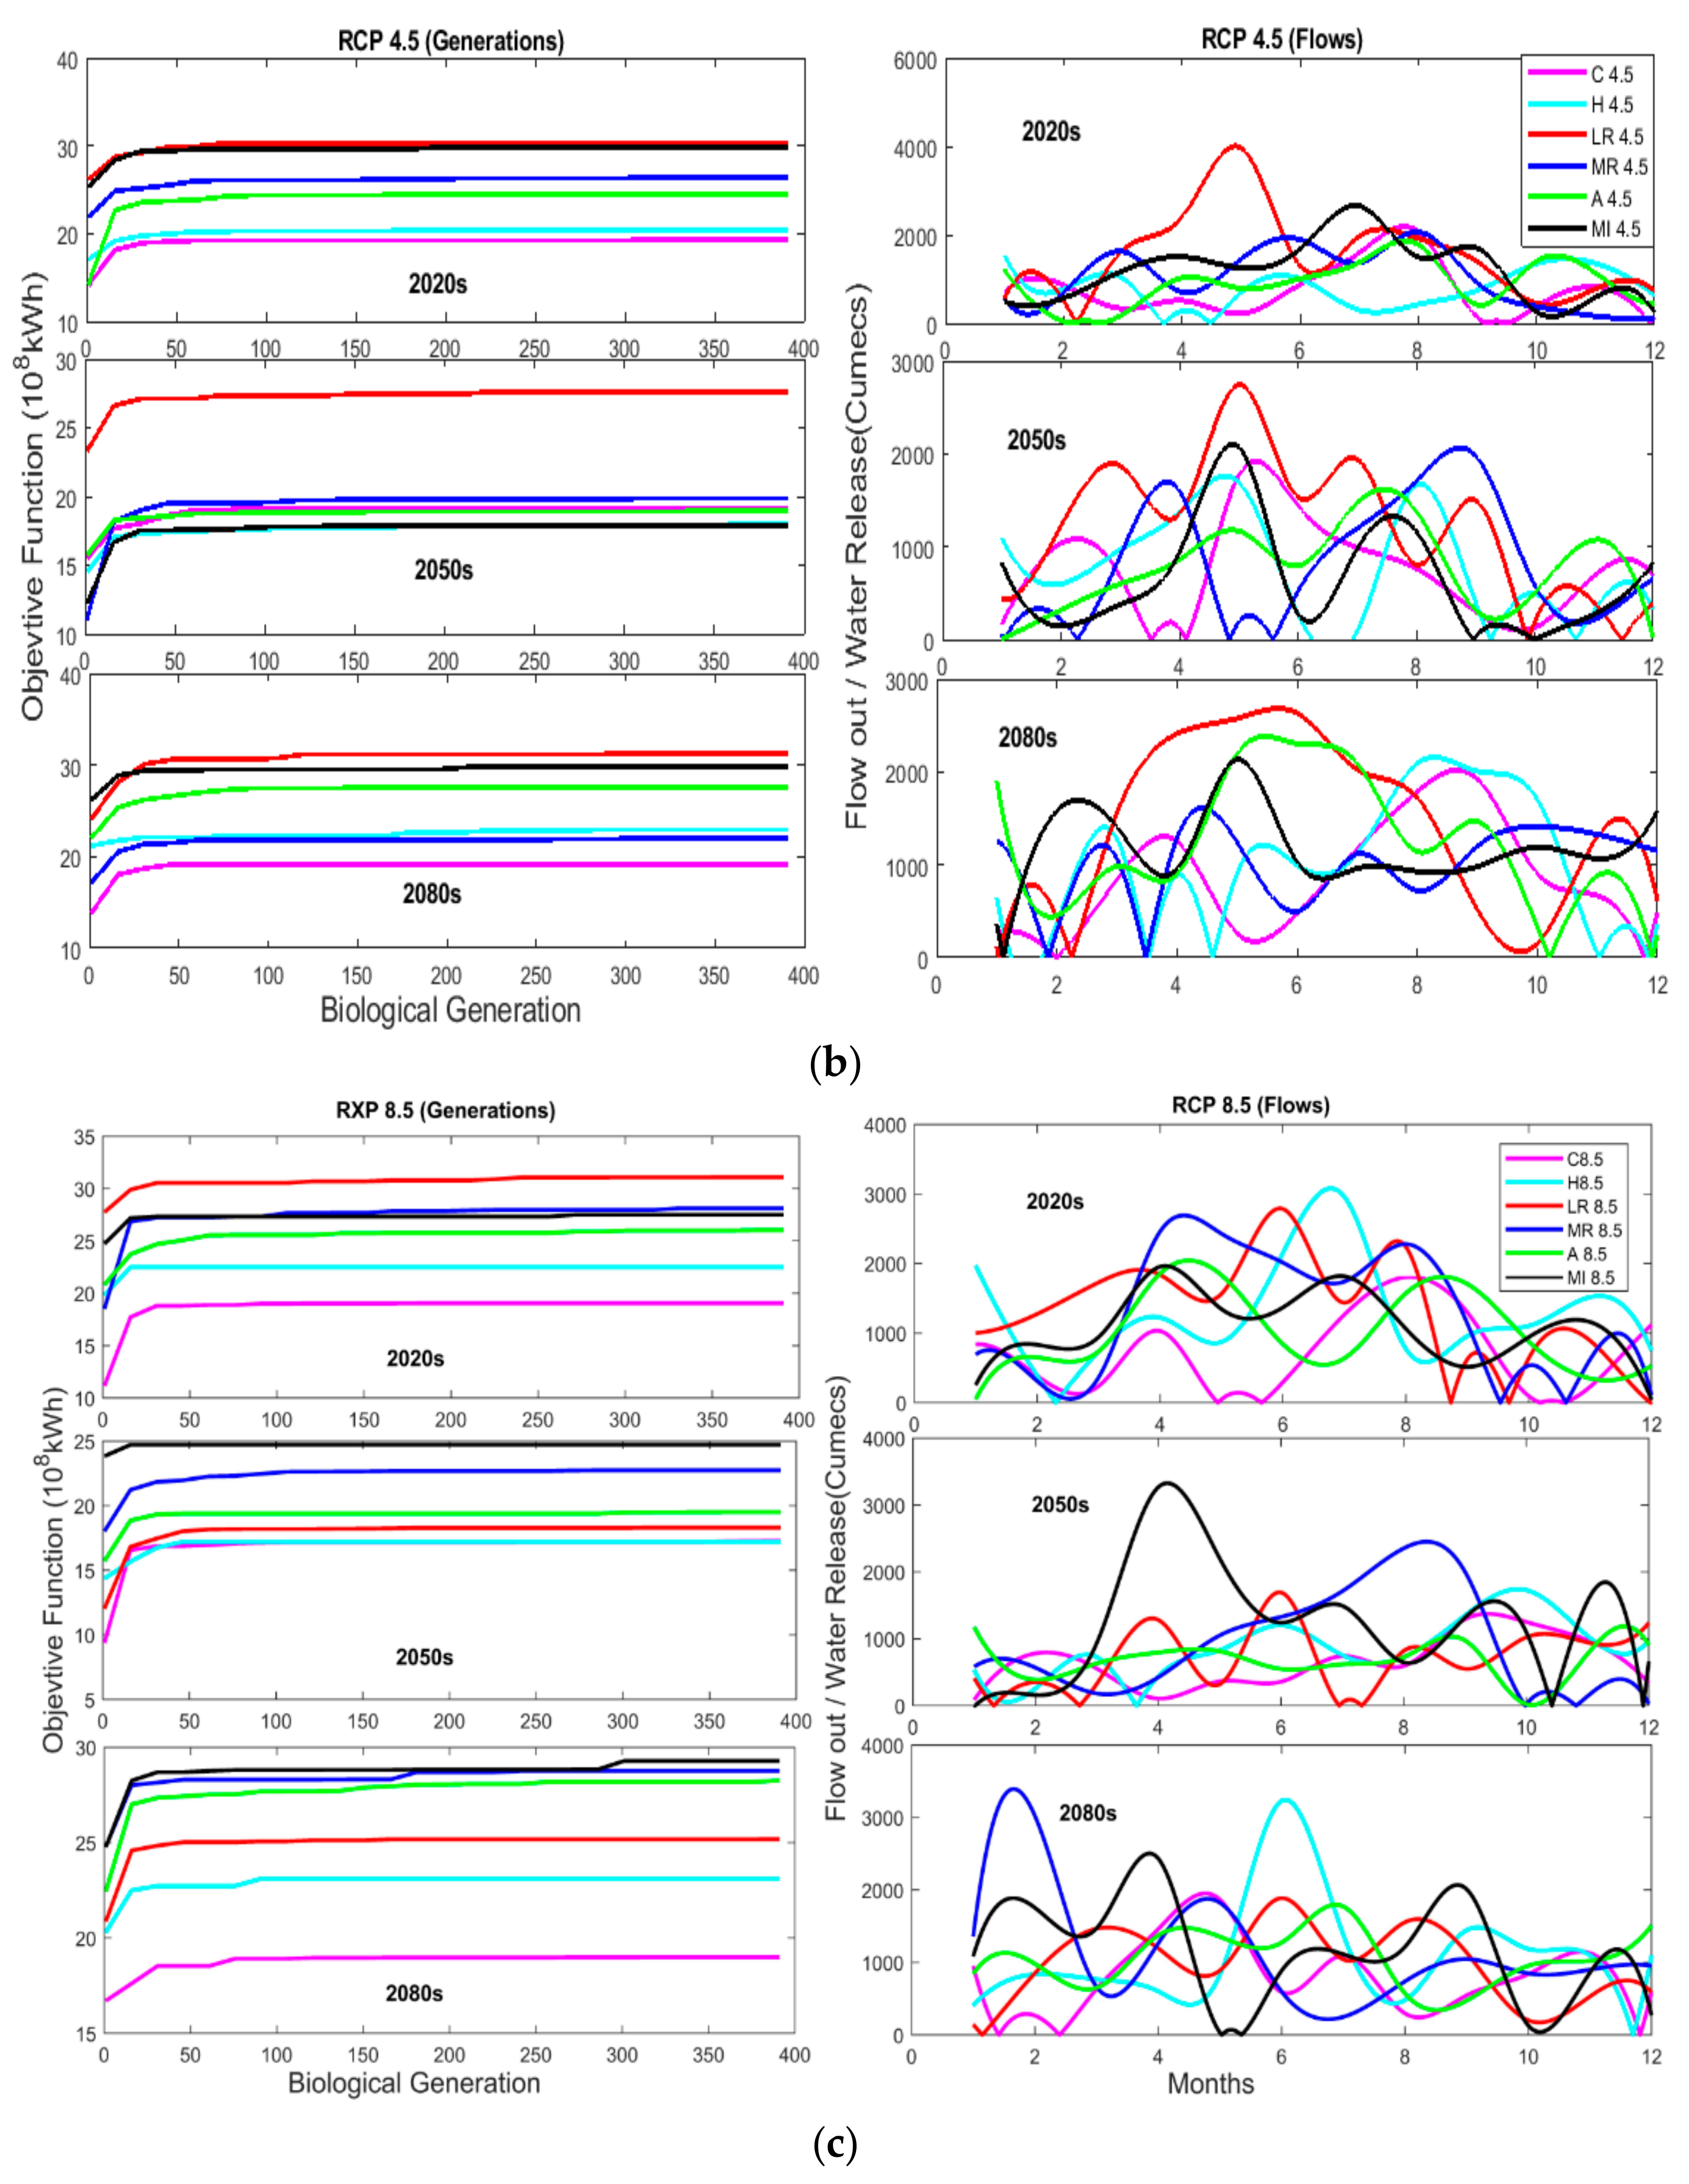
The projected GCMs shows an increment in the streamflows of the area with the increase in the precipitation amount. These projected flows are used for optimal electricity generation. Moreover, change in these streamflows directly affect electricity production. As was observed, the scenarios with a large amount of stream flow give maximum optimal electricity generation as given in
Table 6. The results of this study are consistent with the results of precipitation and temperature as stated by [
88,
89]. The results are also consistent with the results found by [
10,
90]. The increasing trend of stream flows is consistent with the results found by [
6] during the 20th century for the same region.
A major limitation of the present work is to ignore evaporation losses from the reservoir, water release from turbines and turbine efficiencies in accordance with hydropower generation due to unavailability of reliable data. The records of hydropower scheduling and generation were also unavailable; thus, the hydropower prediction was carried out based on the projected flows, the maximum and minimum reservior levels and reservior area and flow rating curve.Because of this, we were unable to compare the future and present hydropower generation curve due to the above-mentioned constraint, which could be carried out in the near future with the accessability of the data.
Although some techniques used in the presented work are similar to those found in the literature, we adopted a comparatively innovative method to study the impact of climate change on streamflows and possible ultimate change in hydropower generation in the area. The use of these projected streamflows for optimal hydropower generation makes this study entirely different to the work already published in the literature. These projected past and future streamflows could be useful for decision makers and water resource planners to make plans for the management of water resources. Some future water projections show a frightening rise in future flows, which can be helpful for water resource planners to manage the possible future water and to avoid flooding conditions in the area by improving management strategies and re-examining designs and operations of the existing dam. This study will also be beneficial in assessing the maximum optimal electricity generation against the future projected streamflows. The information of the future water resources in the area could be helpful for planning hydropower operations. The presented work shows that the selected optimization method is a dominant way to enhance reservoir performance. More benefits could be accomplished in the form of hydropower generation by following the optimal water release patterns for future flows as presented in this study. However, further research is essential to improve these methods before the complete implementation in the hydro-climatic and hydropower fields.
7. Conclusions and Recommendations
In the present study, we examined the future projections of climate change and their possible impacts on water resources in the Xin’anjiang watershed during the 21st century. Moreover, projected optimal electricity generation based on these future stream flows for the 2020s, 2050s and 2080s have also been investigated in this study. Six GCMs of CMIP5 were used under RCP4.5 and RCP8.5 scenarios to assess the future temperature, precipitation, stream flow and power generation in the study area. To achieve reliable precipitation, TMax and TMin data series under different climate change scenarios, we employed QM downscaling technique to downscale the future climate projections.
The calibrated SWAT hydrological model was applied to simulate projected future streamflows based on the downscaled outputs of QM downscaling technique. Furthermore, these projected streamflows have been used for the projected optimal electricity generation and we employed PSO techniques, along with a mathematical model, to investigate the optimal electricity generation. Finally, the influences of climate change on water resources and optimal electricity generation under six GCMs and RCP scenarios were comprehensively studied. The most prominent conclusion drawn from this study can be summarized as below:
- (1)
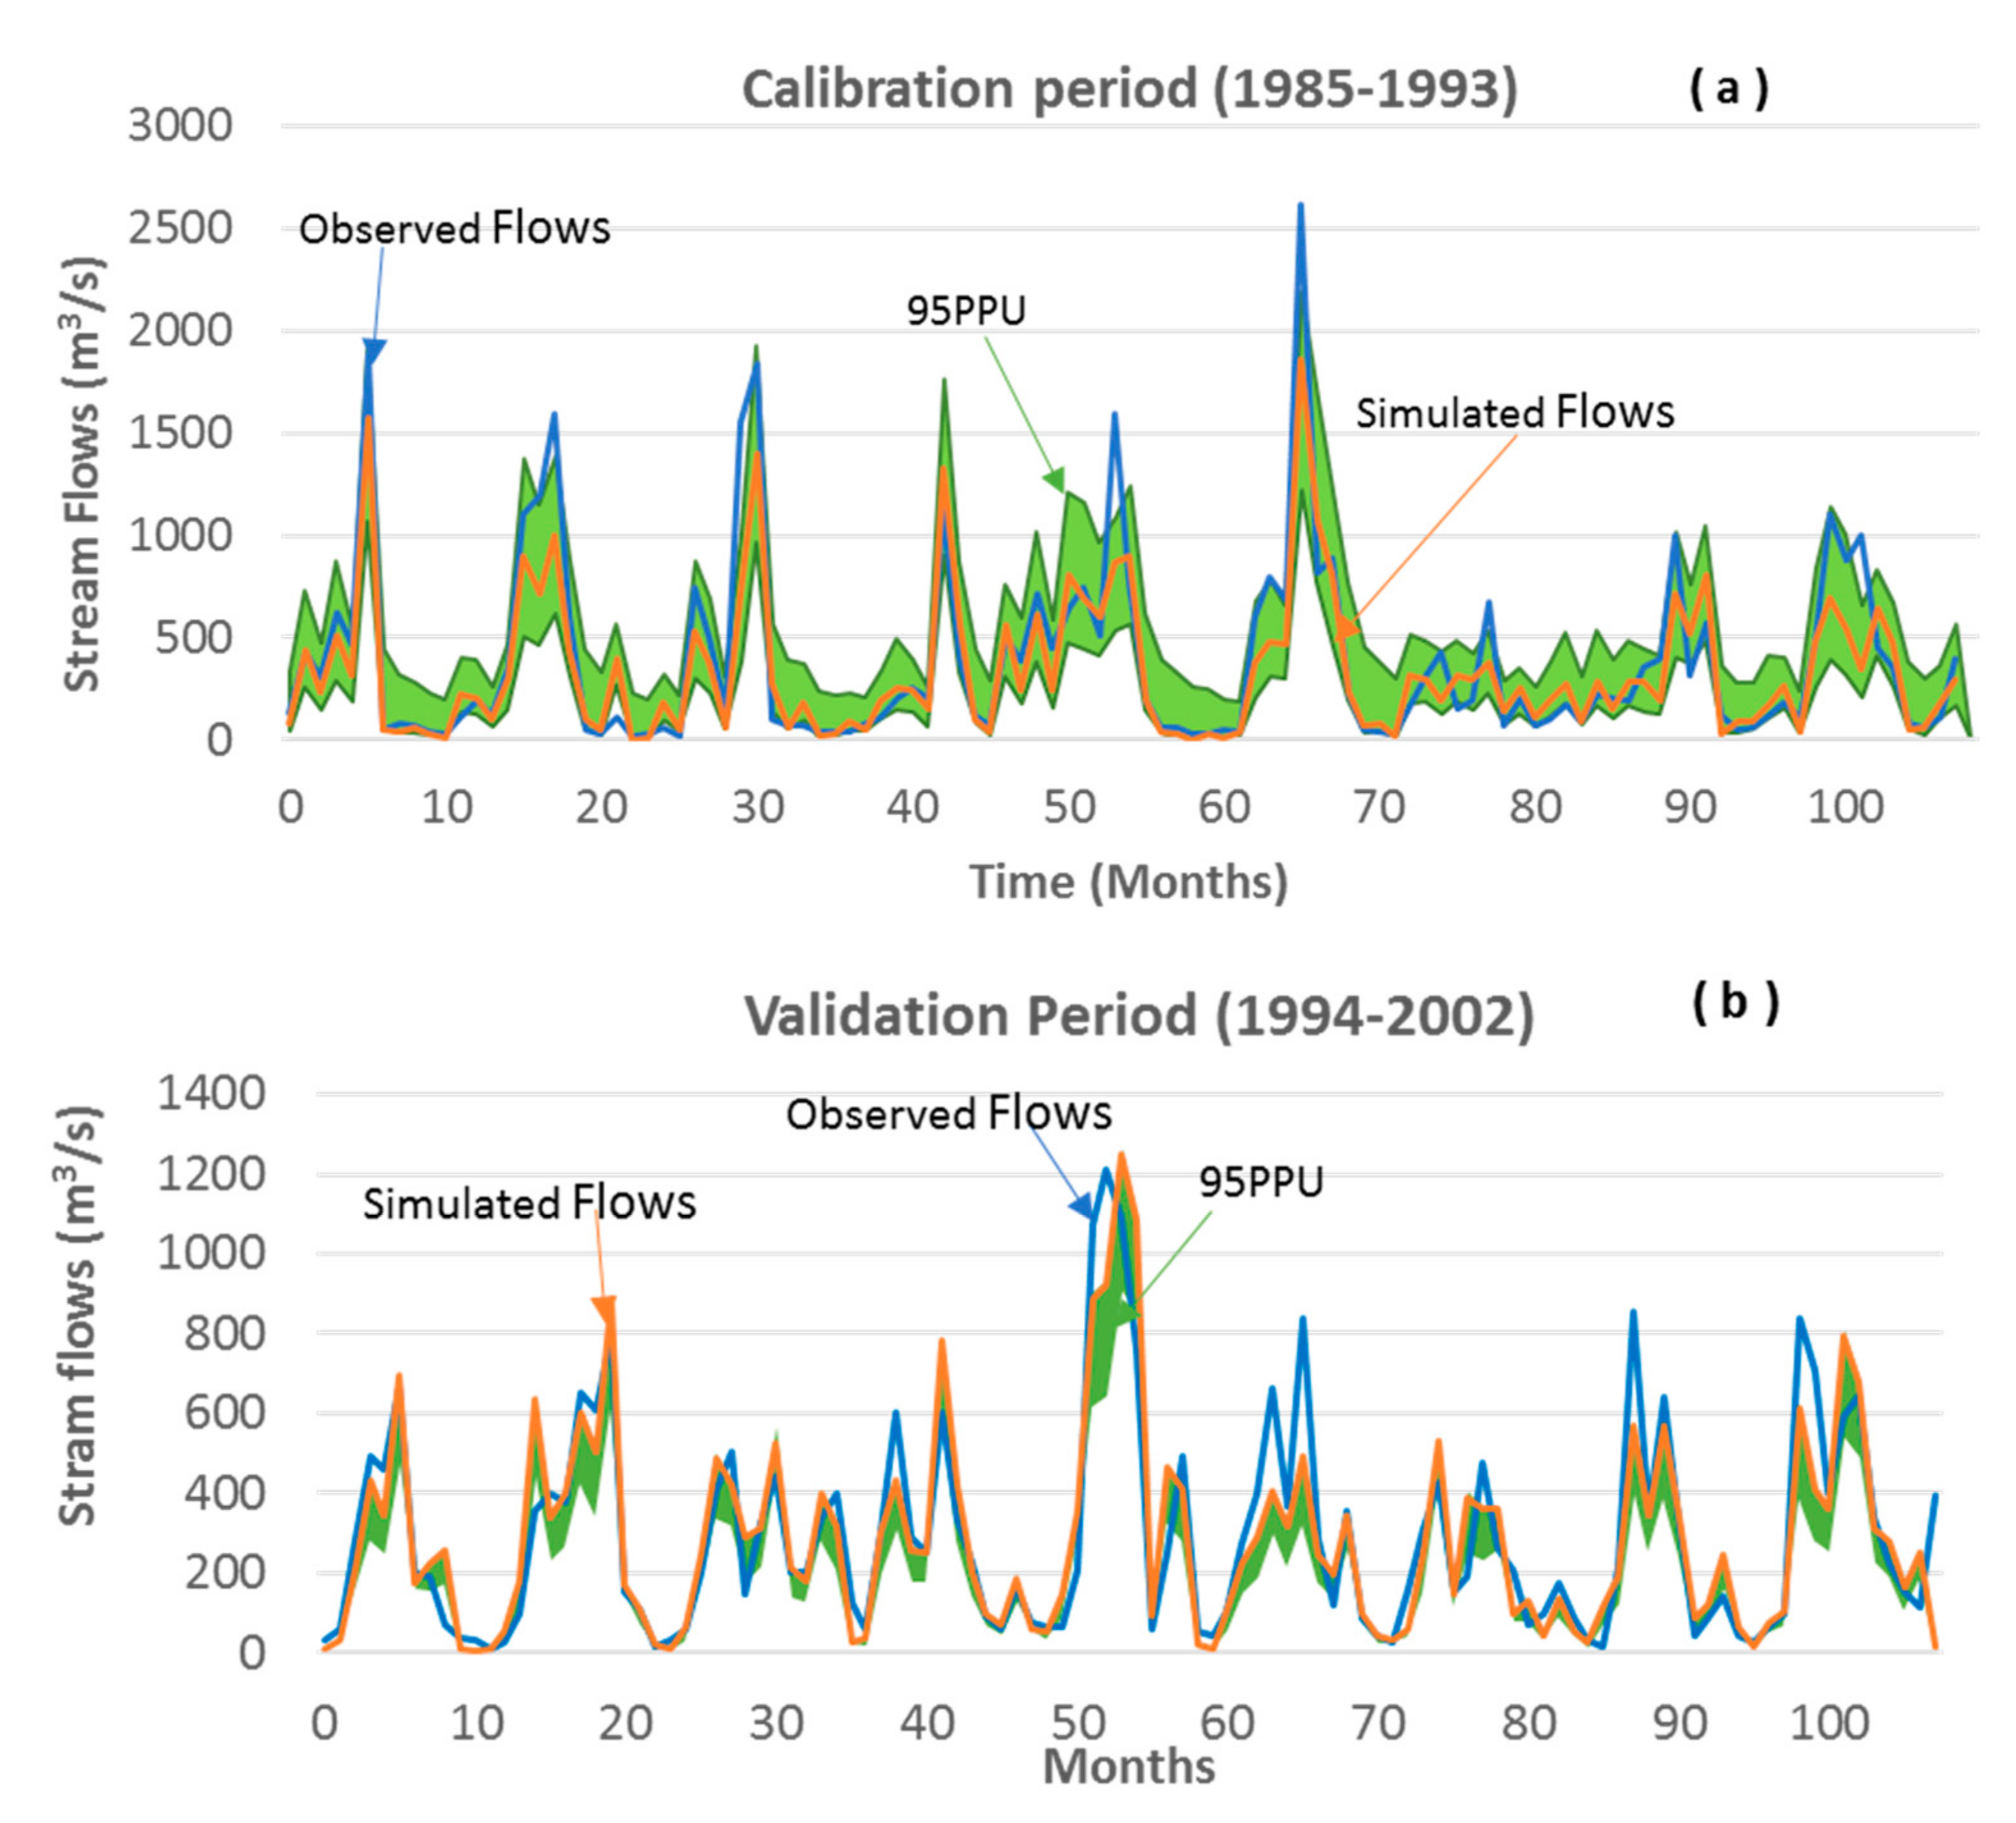
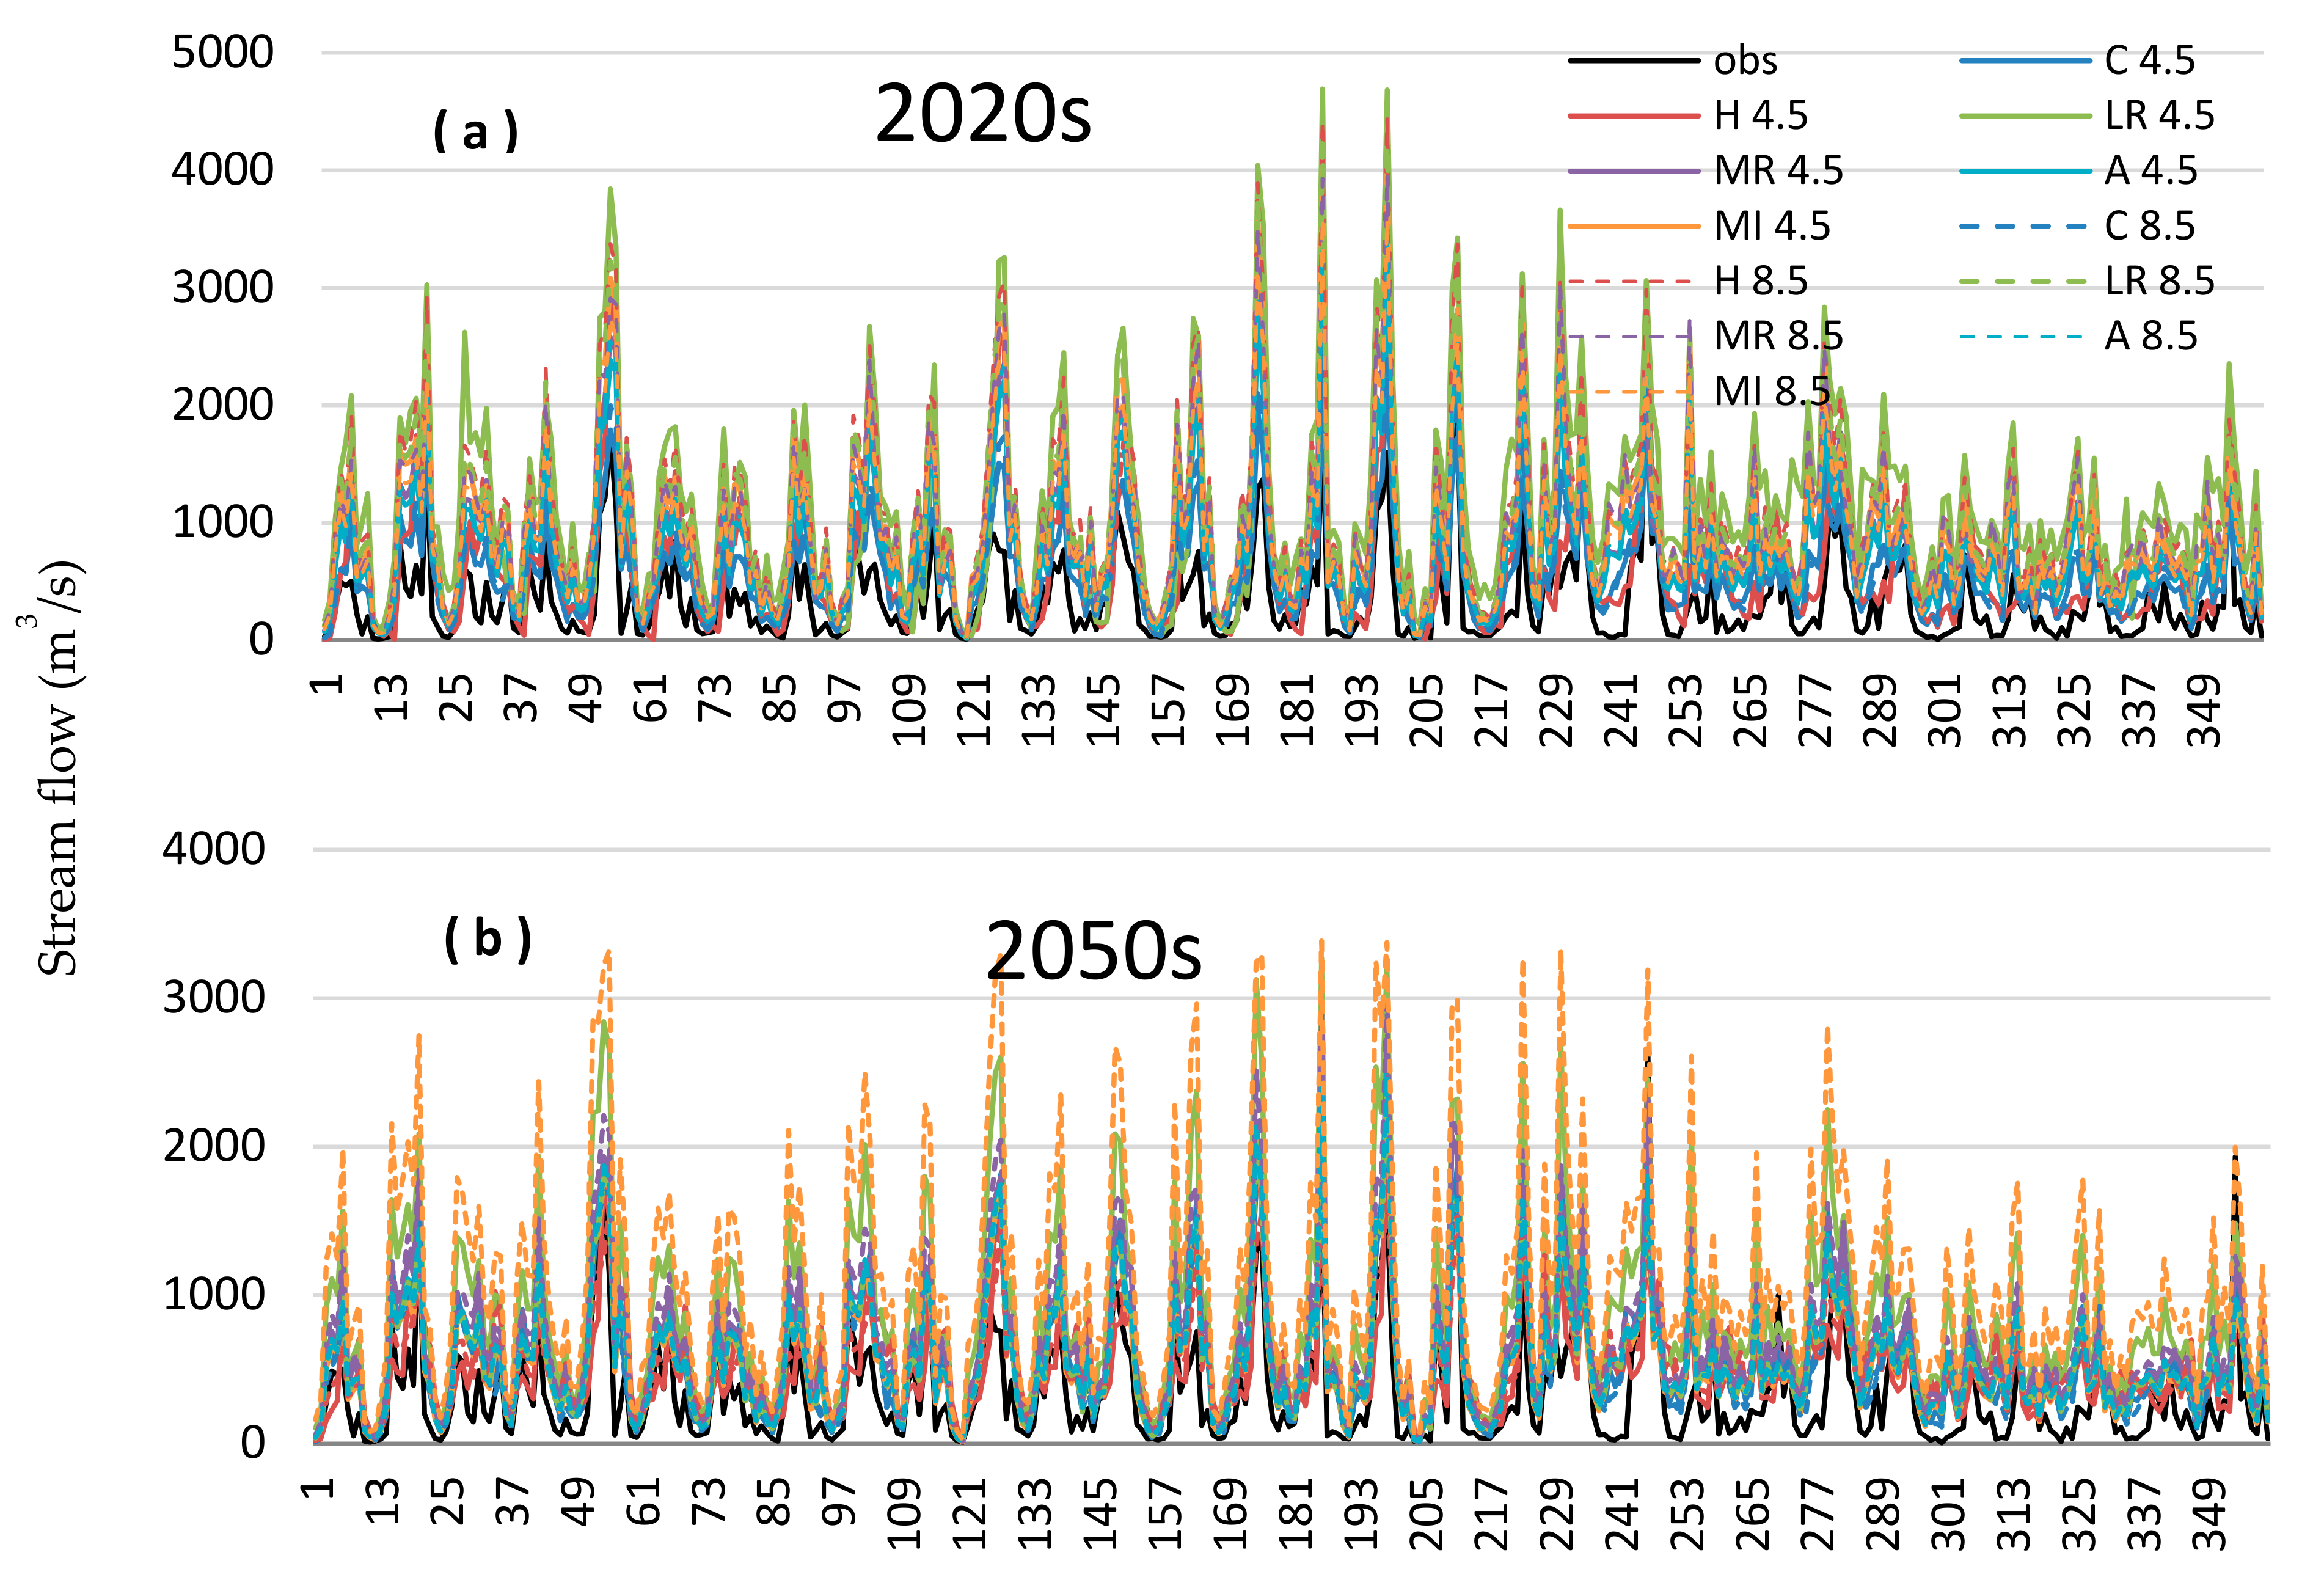
Calibration and validation of the SWAT indicated that evaluation indices e.g., NSE and R2, were satisfactory within monthly timescale. The calibrated SWAT accurately reproduced stream flows in the Xin’anjiang watershed.
- (2)
The downscaled results of the GCMs and RCPs showed that maximum and minimum temperature will continually increase in the future with a maximum increase during April to July. However, future projections of precipitations for six GCMs grow more uncertain and complex, for monthly and seasonal series shows overall increase in precipitation (except HadGEM2-ES, which shows decrease in monthly and seasonal series during some months and seasons) with maximum increase during the months of June and July for monthly series and in summer season for seasonal series. Overall, monthly and seasonal precipitation will apparently increase during this century with a maximum increase for the 2020s followed by 2080s, but 2050s appear to less increase in future precipitation amount. The average increase in precipitation for seasonal and monthly series is more significant under RCP4.5 as compared to RCP8.5 scenarios.
- (3)
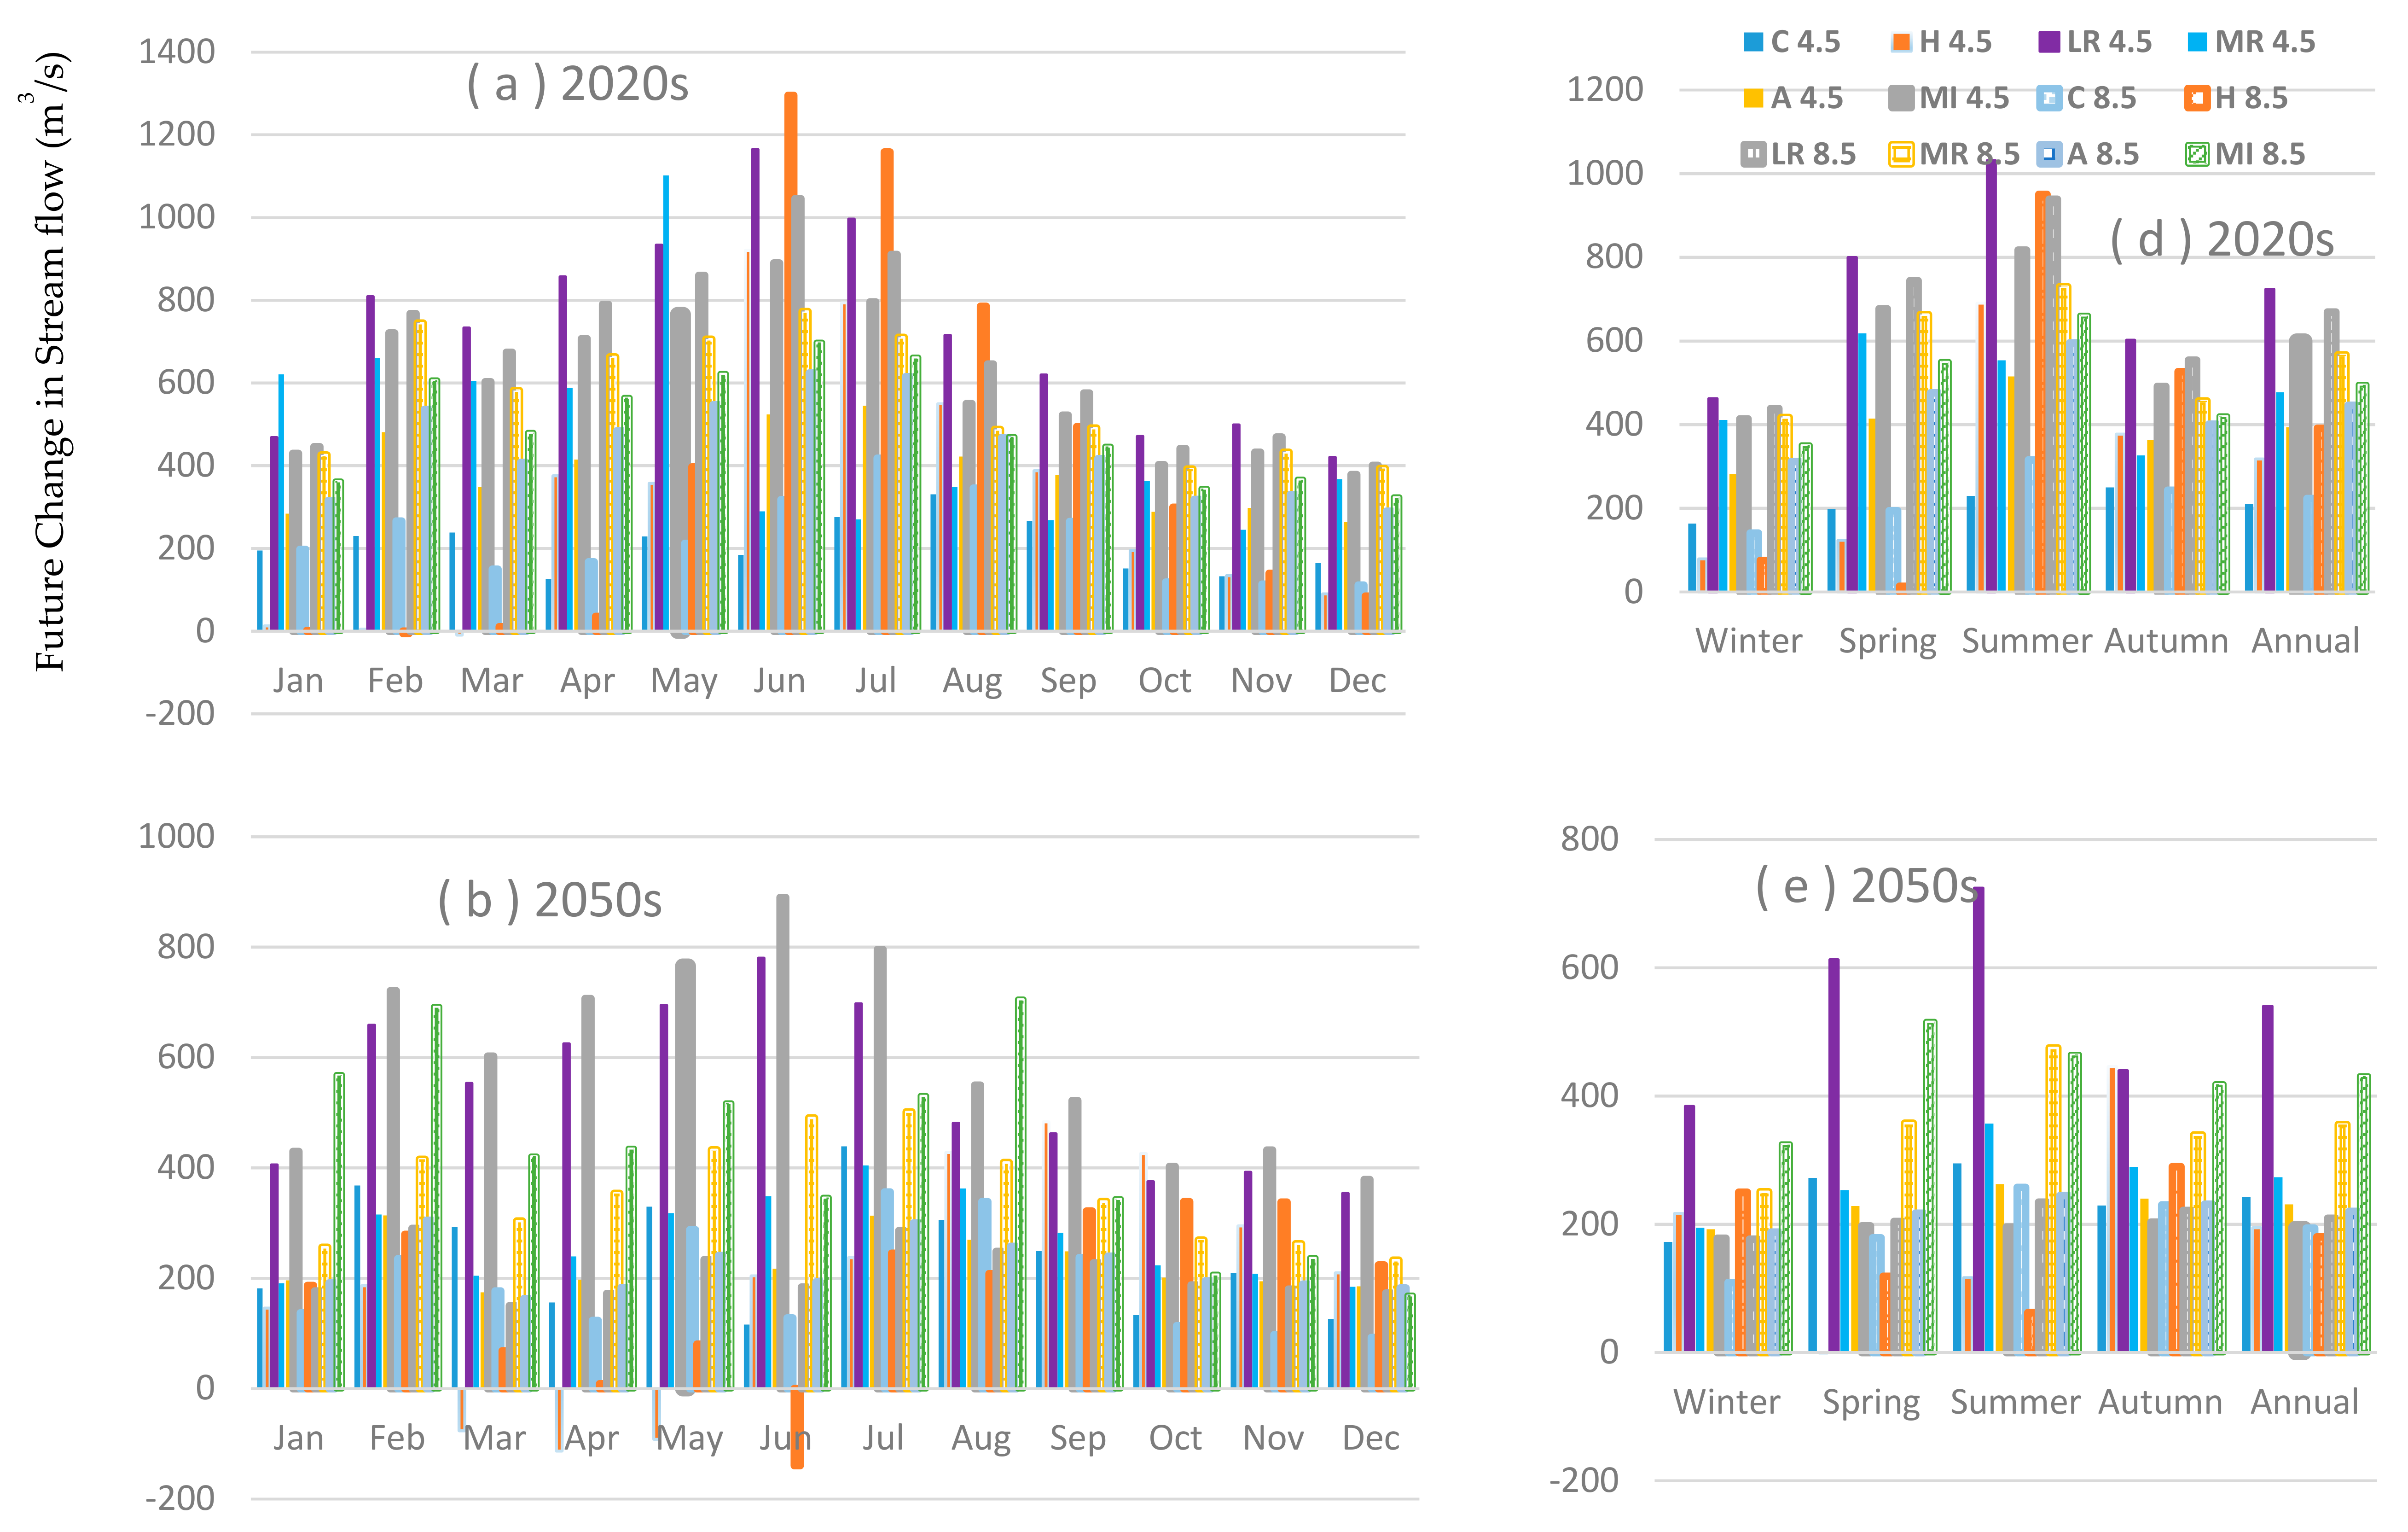
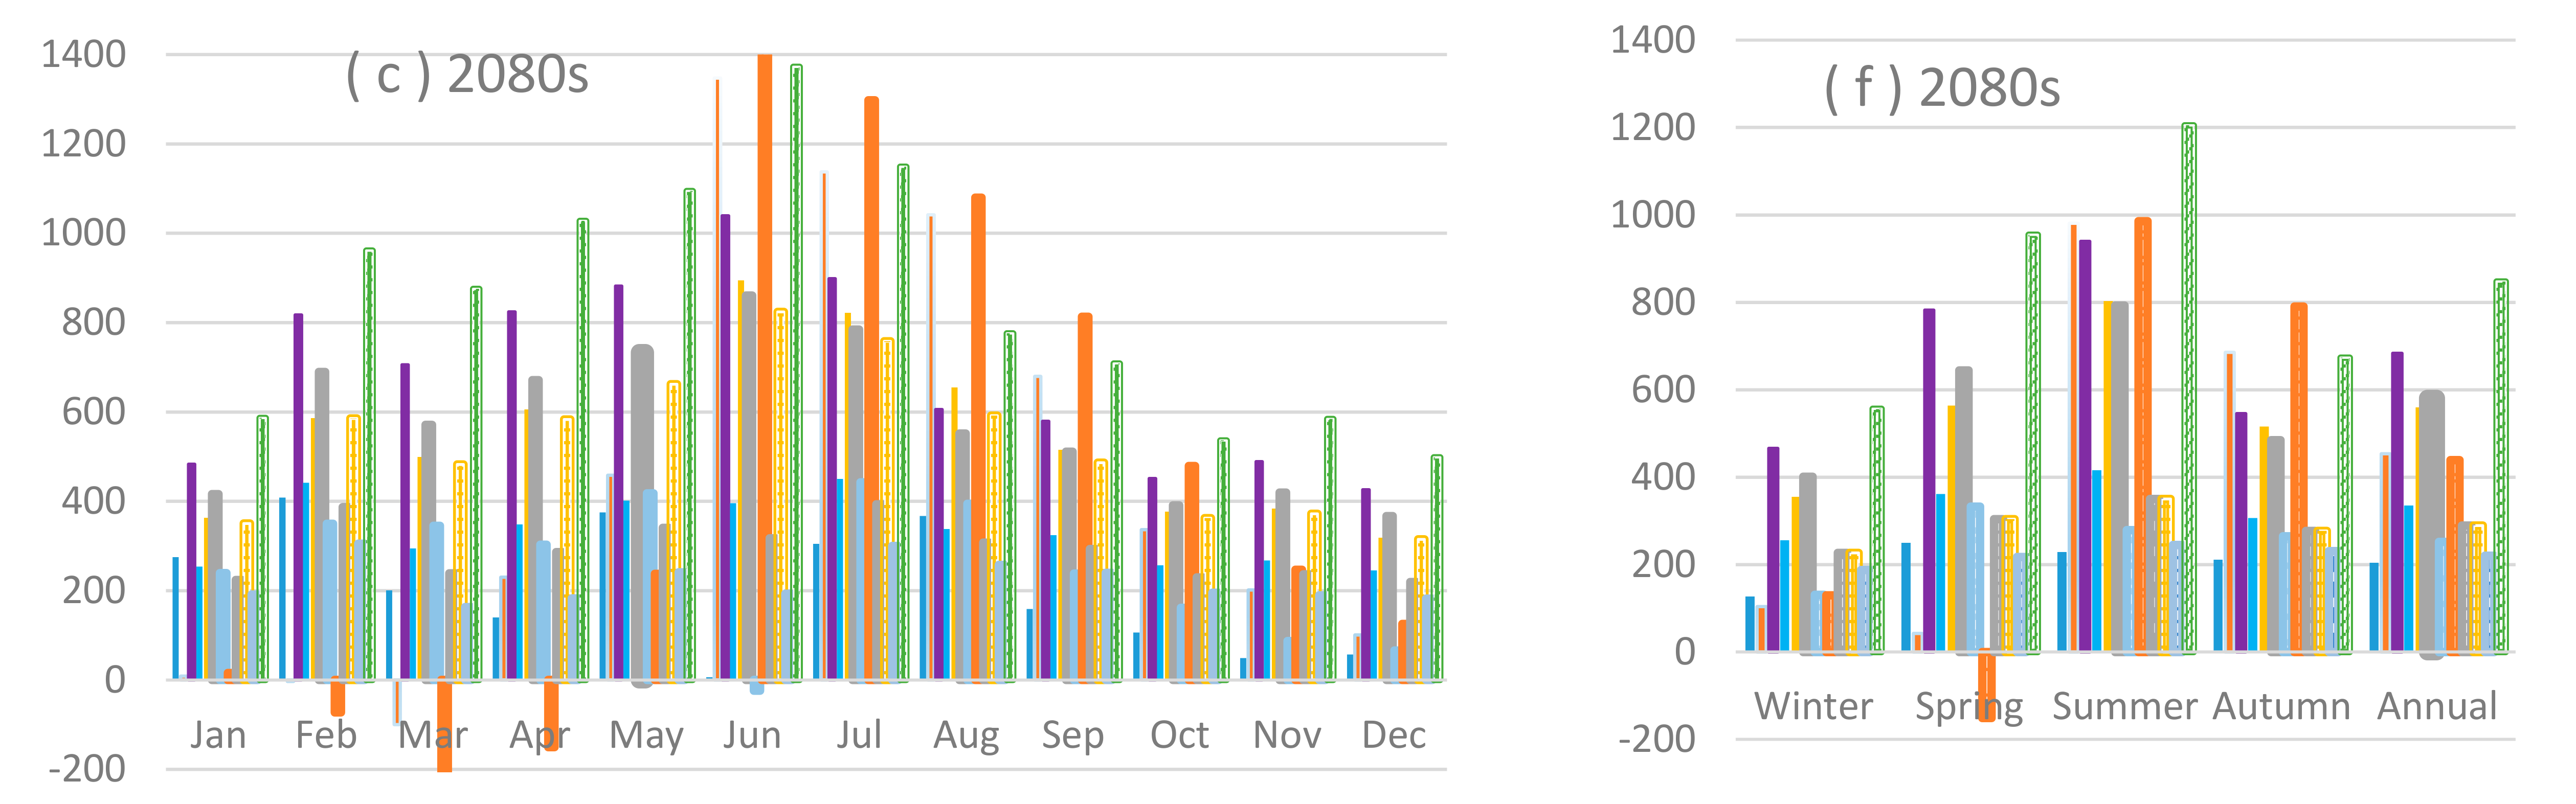
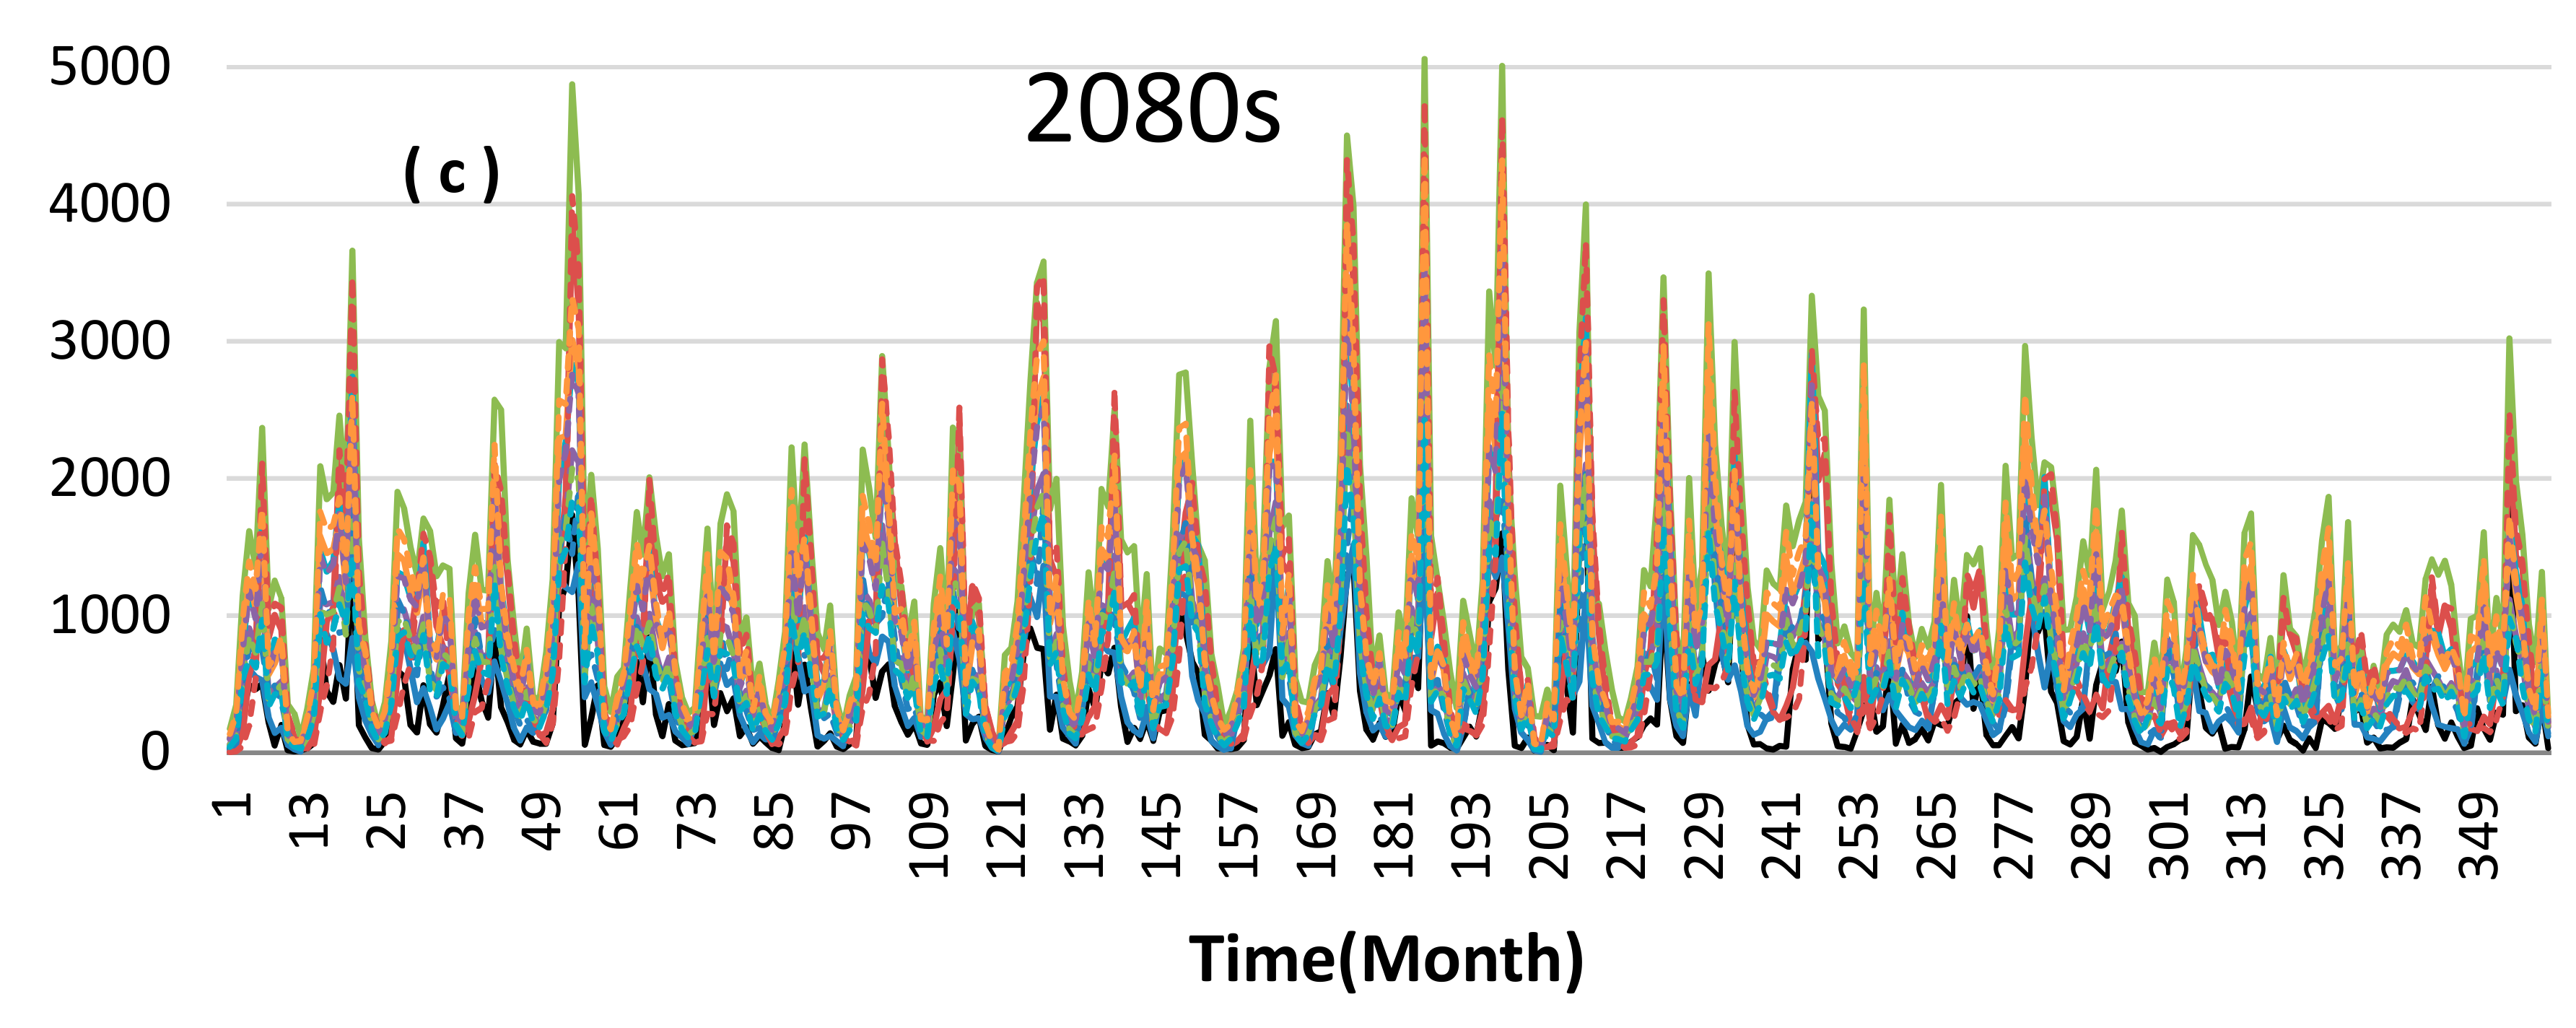
Six GCMs generated large magnitude increase in stream flows during summer and autumn than in winter and spring seasons. The average of six GCMs and RCPs for monthly series stated that mostly GCMs and RCPs exhibit increase in streamflow with maximum increase during June and July. The mean of multi GCMs and RCPs showed that stream flow exhibits a strong correlation with precipitation and clearly indicated that any change in stream flows is typically affected by simultaneous variations in precipitations. The results of streamflows indicated that maximum increase in the stream flow is during the 2020s and 2080s as precipitation amount increases, while the lesser increase is expected in precipitation and stream flows during 2050s. Moreover, MPI-ESM-LR generated the large magnitude of stream flows in the 21st century than any other GCMs.
- (4)
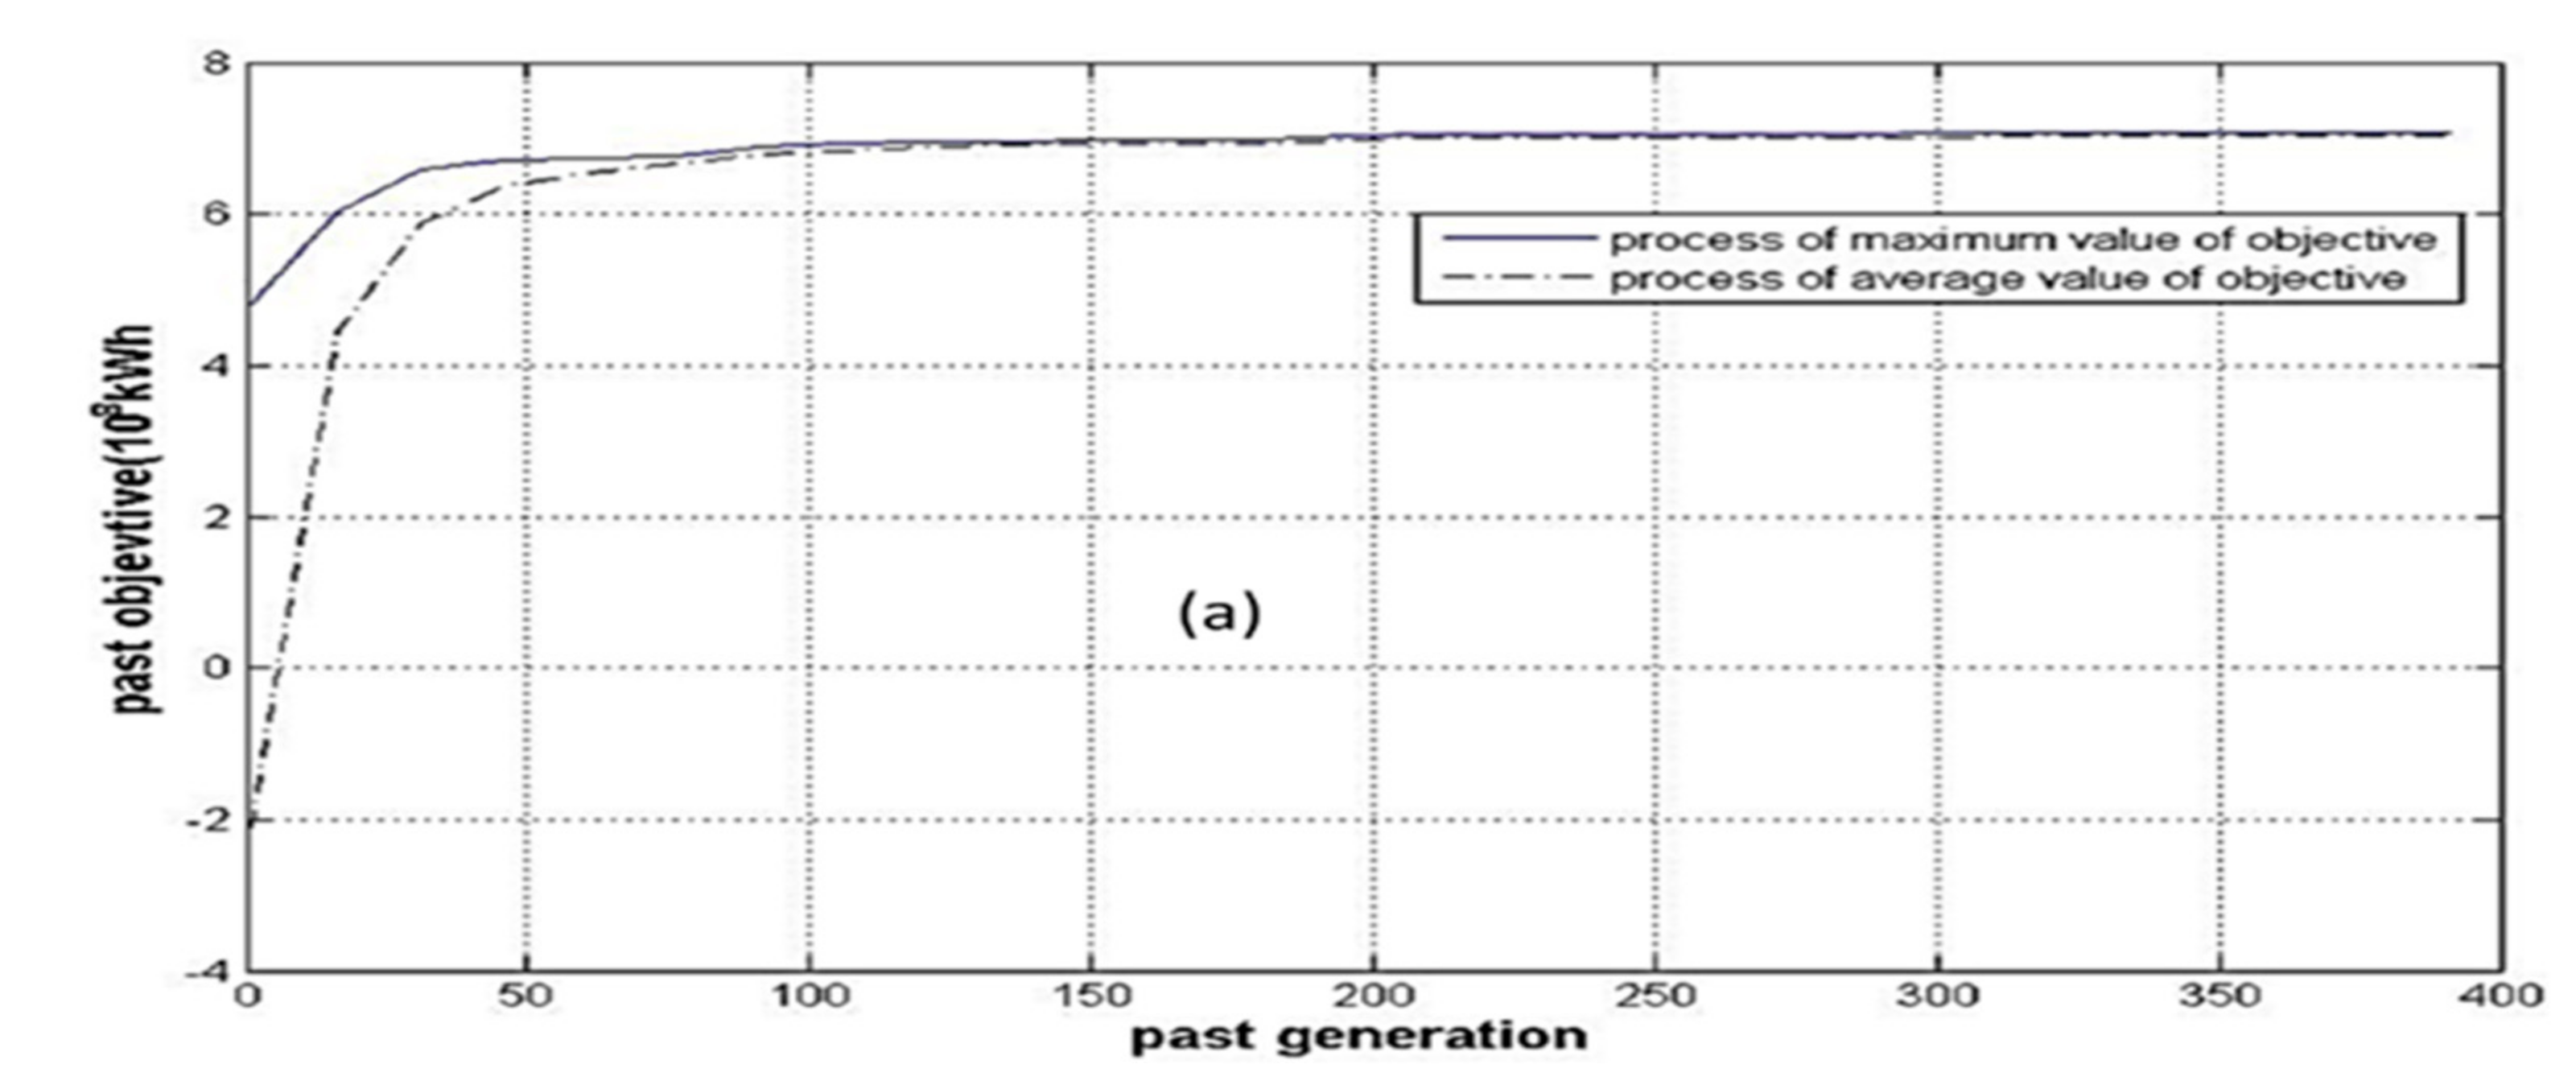
The ensemble optimization technique and mathematical model used for hydropower production for six GCMs under RCP scenarios can enhance the electricity amount than using the flows traditionally. The maximum amount of electricity generation is expected during the 2020s by optimal use of stream flows for GCMs. Results indicated that MPI-ESM-LR generated the maximum amount of electricity using 2020s flows under RCP8.5 and 4.5 followed by MIROC-ESM.
Therefore, based on these findings, a more assured GCMs ensemble scenario could be used to project the climatic parameters in the future. Nevertheless, further investigations of climate change scenarios is highly recommended to reduce the uncertainty from the future projections and explore the impact of climate change on optimal hydropower generation by considering the present hydropower production and scheduling.

 ,
, 


