Abstract
Reclaimed water (RW) is a reliable alternative water supply for irrigation in the agricultural sector, which is the predominant consumer of water in Iraq. A mixed-integer nonlinear programming reclaimed water allocation optimization model was developed to maximize the net benefit generated from the cultivation of different types of crops, comparing the use of reclaimed water type A (tertiary treated water), and reclaimed water type B (secondary treated water). The model was solved using the Algorithms for coNTinuous/Integer Global Optimization of Nonlinear Equations (ANTIGONE) optimizer in the general algebraic modeling system (GAMS). A total of 84 agricultural farms located on 5300 ha to the south of Baghdad, Iraq were available for irrigation with reclaimed water. Analysis considered varying quantities of available reclaimed water and different irrigation efficiencies (45–85%). The net benefits from using lower quantities of reclaimed water were similar for both types of reclaimed water, and the highest net benefit crop was cultivated on 384 ha. As the quantities of water increased, the amount of cultivated land increased and the net benefit per hectare decreased as the model required the cultivation of more crops with lower economic value. Irrigation with reclaimed water has potential to increase agricultural and economic activity adjacent to Baghdad.
1. Introduction
Mesopotamia, present day Iraq, has been proud of its abundance of water in the Tigris and the Euphrates Rivers which has historically enabled the development of a vibrant civilization and economy. Recently, Iraq survived a serious threat from the Islamic State in Iraq and Syria (ISIS) on its water supplies. The Tigris and the Euphrates Rivers originate in the eastern and the southeastern part of Turkey, respectively, flowing downstream through Syria to Iraq. The Tigris River also includes many tributaries originating in Iran and Iraq. For many reasons, Iran and Turkey have been reducing and/or eliminating Iraq’s water resources to gain the economic benefits associated with increased water resources. Turkey recently completed most of the hydraulic structures for the Southeastern Anatolia Project (GAP) which includes 22 dams and 19 hydropower facilities that impact flows in both the Tigris and Euphrates Rivers. Iran has fully or partially cut or diverted the water from more than 45 small rivers and tributaries that were supplying the eastern part of Iraqi rivers and marshlands with water, forming about 12% of Iraq’s transboundary water supplies.
These water supply issues have resulted in a deterioration in both water quantity and quality in Iraq. The most serious impact is on the agricultural sector south of Baghdad along the Tigris and the Euphrates Rivers, resulting in enormous economic losses. During water shortage crises there is a need for management to distribute existing water supplies for the greatest societal benefit while satisfying the water demands in various sectors. It is a common practice for arid and semiarid regions [1], such as in Iraq, to use reclaimed water for agricultural irrigation and thereby create an alternative water resource without importing water.
Use of reclaimed water (RW) as an alternative source has emerged as common practice to meet the demands of increasing populations in many arid and semi-arid regions around the world. Many water demands are currently met with reclaimed water as the main or alternative water resource depending on quality and availability. Industrial, municipal, agricultural and recreational uses are the most common applications for reclaimed water use. In Iraq, there is a daily flow of more than six million cubic meters (MCM) of treated, untreated, or partially treated wastewater that is currently discharged directly to the environment. For instance, in Baghdad, there is secondary treated wastewater of more than 1.0 MCM that is discharged to the Tigris River. These large quantities of treated wastewater contribute to the pollution of the receiving waters. The treated wastewater could be a significant source of water for a variety of applications. This paper explores the opportunity to use these large flows of treated wastewater for agriculture in lands directly south of Baghdad where the majority of treated wastewater could be delivered by gravity.
The goal of this research project is the development of an optimization model for the allocation of reclaimed water for agriculture. Specifically, the objective function maximizes the net benefit generated from the cultivation of different types of crops using reclaimed water. The mixed integer nonlinear optimization programming problem (MINLP) was solved using the Algorithms for coNTinuous/Integer Global Optimization of Nonlinear Equations (ANTIGONE) optimizer [2] in the general algebraic modeling system (GAMS) [3]. Different solvers, including the Branch-And-Reduced Optimization Navigator (BARON) [4], the Basic Open-source Nonlinear Mixed Integer (BONMIN) [5], the Convex Over and Under ENvelopes for Nonlinear Estimation (COUENNE) [6], and the DIscrete and Continuous OPTimizer (DICOPT) [7], were also investigated for solving the MINLP problem.
In this MINLP water allocation optimization model, reclaimed water was allocated proportionally on farms where each farm’s water share was equal to the ratio of its agricultural area to the total agricultural area of all farms. The quality of two types of reclaimed water was compared, reclaimed water type A (tertiary treated wastewater) and reclaimed water type B (secondary treated wastewater). Different RW availabilities and irrigation efficiencies were evaluated to determine the sensitivity of the results on these parameters. Reclaimed water availability and the cultivated area form the main constraints in this model in addition to the farm–crop connectivity, farm–RW connectivity, and minimum net benefit constraints.
2. Literature Review
With the development of wastewater treatment technologies, the quality of the reclaimed water has been enhanced to allow for a wide variety of applications. For decades, many countries have been practicing reclaimed water use in common applications such as in agricultural irrigation, cooling towers, recreational uses, etc. Iraq is a country that faces a severe shortage in its water supplies due to the aforementioned reasons, and it is crucial to determine how to mitigate the impacts of water shortages by implementing water conservation measures and developing alternative water supplies. Reclaimed water use is one of these alternative resources which has not been developed in Iraq even though there is excellent potential for water reuse if developed properly. Implementing integrated and sustainable water management strategies in arid regions helps to mitigate water stresses and has led to the development of a variety of water allocation optimization models.
An assessment of water appropriations in Iraq was previously modeled by developing a non-linear water allocation optimization programming model that maximizes the agricultural net benefit from the cultivation of different kinds of crops in the Tigris–Euphrates Basin [8]. The maximization of the net farm income in Iraq producing different types of crops was presented by Aljanabi, et al. [9] with the development of a water allocation optimization model. Three water allocation strategies and three water supply scenarios were considered. The various conditions were compared in terms of their capacity to minimize losses in net farm water-related income. The proportional sharing water allocation strategy consistently resulted in the greatest agricultural net benefit under the different water supply scenarios which included drought conditions. Proportional sharing ensures that water is allocated to all provinces that use the Tigris and Euphrates Rivers as water sources for irrigation. A mixed integer non-linear programming water allocation optimization model solved using the branch and reduce optimization navigator (BARON) was developed by Aljanabi, et al. [10] for water allocation in Iraq. The model compares the maximized net benefit from the use of reclaimed water type A, reclaimed water type B, and reclaimed water type C for cultivating different types of crops on 106 agricultural farms. Crop selection considered applicable water quality standards and different irrigation efficiencies. The model showed the excellency of reclaimed water type A as compared to the the other two types of reclaimed water.
Water allocation models have been used to address a variety of different water supply needs around the world. Different water allocation rules were tested by the development of a Computer Aided and Management Simulation of Irrigation Systems (CAMSIS) model, which simulates farm income for an irrigation scheme in East Africa [11]. A decision-making tool for agricultural production sector was developed by the development of a linear water allocation optimization model considering the local and the regional levels by analyzing the inter-seasonal irrigation water allocation and their effects on the net farm income applied to the Jordan Valley in Jordan [12]. An optimization model maximizing the sustainable net economic benefit over a long-term planning horizon was applied to the Prescott Active Management Area in Arizona, USA [13]. The validity of the developed model that incorporated unique measures of sustainability was evaluated by testing four different scenarios. Chong, et al. [14] developed and applied linear programming water allocation optimization model based on water resource sustainability. The model tends to improve the water use benefits in the Zhangjiakou Region of northern China in 2020. The eco-environmental and socio-economic benefits were considered to meet the domestic and environmental water demand and to assure sustainable water use at the regional scale.
Different agricultural irrigation water allocation optimization models maximizing the net benefit were developed using a variety of allocation scenarios. Singh, et al. [15] reviewed agricultural irrigation water allocation optimization models which were implemented using different programming for optimizing irrigation management. Multiple agricultural water resource allocation was presented using a dynamic programming optimization model applied on Yangling, China [16]. Multiple cropping patterns were tested using a stochastic dynamic programming water allocation optimization model developed for the Ardak area, Iran [17]. The total farm income on the Havrias River in northern Greece was maximized using an integrated soil water balance non-linear programming optimization model [18]. The Shapely games methodology was proposed Sadegh, et al. [19] to be used in Karoon River Basin water resource allocation with the goal of developing an equity standard to increase the total net benefit of the system.
Models have been developed with the specific goal of aiding water supply decision makers who face complex decisions that require consideration of many different factors. Bekri, et al. [20] developed an optimal water allocation optimization model using fuzzy-boundary-interval linear programming methodology. The model adopted the uncertainty of the random water inflows through the simultaneous generation of stochastic equal-probability hydrologic scenarios using various inflow scenarios applied on the Alfeios River Basin (Greece) to enhance the attitude of decision makers. Lu, et al. [21] constructed an Inexact Rough-Interval Fuzzy Linear Programming (IRFLP) model, which was compared with an interval-valued linear programming model for water allocation to provide more information for decision makers. The results proved the IRFLP can handle the interaction between dual intervals of highly uncertain parameters, as well as their joint impact on the system. An integer linear programming decision support model was developed to optimally allocate water resources by minimizing water treatment, allocation, and environmental costs [22]. The model has the flexibility of including multiple water sources to be allocated for different uses constrained by different quality requirements.
Multi-objective programming has been developed to analyze water allocation where more than one objective must be considered. A fuzzy Multi-Objective Particle Swarm Optimization (f-MOPSO) was presented by Rezaei, et al. [23] to improve conjunctive surface water and groundwater management in Najafabad Plain, Iran. The model used a weighting method to define the partial performance of each objective’s potential solution to reach an optimal solution on the Pareto front. A multi-objective programming was applied to analyze the water deficit of the Heihe River Basin by optimizing the allocation of water resources and embedding land uses as constraints [24]. Results demonstrate that the optimal program can predict the actual situation of water allocation in the future. A multi-objective evolutionary algorithm to simultaneously solve the problem of land use planning and resource allocation was developed by Fotakis, et al. [25]. The model performs optimization on a cellular automaton domain, applying suitable transition rules on the individual neighborhoods. Lalehzari, et al. [26] developed a multi-objective water allocation optimization model to maximize crop yields applied on farmlands located on the Baghmalek plain, Iran. A multi-objective cropping pattern optimization model was developed by Yousefi, et al. [27] to maximize the benefits and minimize the potential negative quantitative-qualitative impacts of agricultural reclaimed water and groundwater uses. The developed model maximizes the benefits from crop patterns, reducing nitrogen leaching, and improves the rate of groundwater recharge in the Varamin irrigation network in Iran.
Other models have included a comprehensive list of objectives regarding water allocation in water-constrained regions considering the water/food/energy nexus. Fang, et al. [28] concluded it is possible to effectively balance the benefits among all regions and sections in the Wuwei Basin using a comprehensive optimization model for water resource allocation. Maximizing the economic benefits considering integrated land-use and water allocation planning while minimizing water extraction and transportation cost under ecological constraints was also developed [29]. A framework for identifying, designing, and implementing water allocation rules for food security in the developing world’s irrigated areas was developed considering Afghanistan as a case study [30].
Ant colony optimization is another modeling technique that can be applied for the allocation of water for agricultural purposes. An agricultural crop and water allocation model using ant colony optimization (ACO) was developed by enabling the dynamic decision variable option (DDVO) [31]. The model maximizes the net benefit from allocating a fixed total volume of water to cultivate selected kinds of crops in an irrigation district located in Loxton, South Australia. Meanwhile, a general optimization framework was introduced by Nguyen, et al. [32], optimizing crop and water allocation using ant colony optimization and dynamic decision variable option (ACO-DDVO) which reduces search space size and increases the computational efficiency of the evolutionary algorithm application. Another ant colony optimization (ACO) program was used under genetic simulation-optimization framework to optimize irrigation and fertilizer scheduling applied for corn production using different water availabilities with various rates of fertilizer application in eastern Colorado, USA [33].
The particle swarm optimization (PSO) algorithm was used in a water allocation optimization model [34]. The numbers of the generated jobs in both agricultural and industrial sectors in the central desert region of Iran were maximized to provide an indication about the optimal solution which should be followed in case of certain policies.
Genetic algorithms (GAs) provide another useful optimization technique for water allocation models. For the Sri Ram Sagar project in India, a genetic algorithm agricultural irrigation water allocation optimization model was developed [35]. A water allocation optimization model for agricultural irrigation was presented, maximizing the net benefit from the use of certain types of crops and cropping patterns in Karnataka, India [36]. By optimizing reservoir releases and cropping patterns, Sadati, et al. [37] presented a nonlinear programming optimization model using a GA to maximize farm income around the Doroudzan Dam in the southwest of Iran. Anwar, et al. [38] presented a sequential irrigation scheduling problem using GA models allocating water on 94 agricultural farms, adopting four different consecutive irrigation scenarios.
3. Problem Definition and Objective
The Euphrates River has suffered severe water quality deterioration which has negative impacts on human health and the environment [39,40], so that the majority of the flow in the river south of Baghdad is considered unsuitable for irrigation. It was concluded that the suitability of Iraq’s surface water for irrigation decreases as it flows downstream [41]. According to reports from the Iraqi Ministry of Environment for 2009, waterborne diseases are widespread due to bacteriological contamination, as 16% of the water supply exceeds the limits of bacteria stipulated in both Iraq’s National Drinking Water Standards and the World Health Organization Guidelines for Drinking Water [41]. Diverting the majority of wastewater flows through treatment plants while allowing for the irrigation with reclaimed water will not only provide benefits to the agricultural economy but will also improve the water quality in the Euphrates River south of Baghdad.
In Iraq, extended droughts have previously exhausted significant amounts of water stored in reservoirs. One such drought is that which occurred between 2007 and 2009, strongly affecting the agricultural sector. Iraq’s most recent water shortage took place in June 2018 Iraq; this was due to Turkey diverting flow to fill the reservoirs behind the Ilisu Dam. Fortunately, Turkey has been temporarily reduced the flow diversions in response to Iraq’s need to avoid water shortages. The filling of the reservoir has stopped due to the agreement between the two countries which will allow the reservoir to be filled while still allowing adequate water supplies to Iraq. The fact that Mesopotamia is currently experiencing water shortages needs to be recognized by the Iraqi people who are keeping inefficient practices and traditional habits of water use including the use of conventional flooding irrigation techniques. Furthermore, they should recognize that water is a source of national wealth which must be conserved and used sustainably to satisfy both recent and future demands.
One of the fastest and most efficient methods to develop alternative water sources is to adopt reclaimed water as a sustainable source of drought-resistant water to satisfy agricultural irrigation requirements and mitigate pressure on surface water resources. In Iraq, the main wastewater treatment plants were built on rivers and streams close to agricultural farmlands (Figure 1). The Karkh and the Rustumia wastewater treatment plants (WWTPs) treat received inflows from the western and the eastern regions of Baghdad, respectively. The Karkh WWTP’s daily treatment capacity is 0.375 million cubic meters (MCM) and it is expected to reach 0.55 MCM with proposed expansion. Currently, it produces only 0.2 MCM of treated wastewater, which is discharged to the Tigris River south of Baghdad. This due to the need for extensive repairs and maintenance. The Rustumia WWTP treats a daily flow of 0.575 MCM of wastewater, which is discharged directly to the Diyala River a few kilometers before confluence with the Tigris River to the south of Baghdad about 5 km downstream of the Karkh WWTP. Downstream villages and cities mostly suffer from the deterioration of the water quality in the Tigris River. The implementation of tertiary treatment in these WWTPs has the potential to enhance the reclaimed water quality and increases its potential uses.
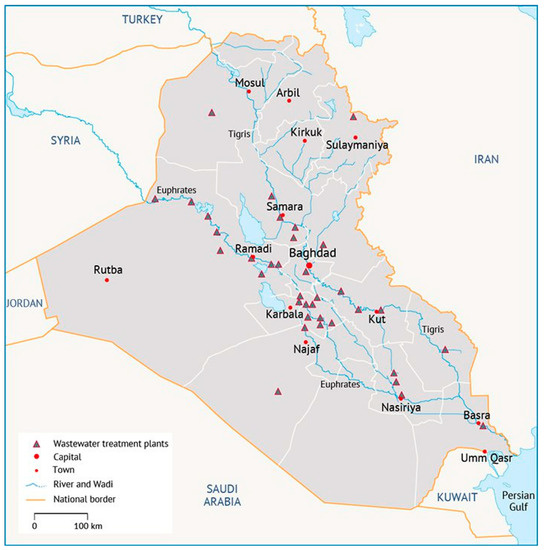
Figure 1.
Locations of wastewater treatment plants in Iraq [41].
4. Mathematical Formulation of the Optimization Model
4.1. Objective
The objective function of this optimization model is to maximize the net benefit predicted from the cultivation of different types of crops using reclaimed water. The maximized net benefit, , using reclaimed water () type i is:
where is the computed net benefit (US $) for each farm x cultivating crop c using RW type i.
The total cost to produce crop c which is cultivated in farm x using RW type i is the sum of the crop’s production cost plus the cost of the assigned RW type i to cultivate crop c. The production cost ($) of crop c in farm x using RW type i is written as:
The cost ($) of RW type i used to irrigate farm x cultivating crop c is expressed as:
By merging Equations (2) and (3), the total production cost ($) of crop c in farm x using RW type i yields:
where is the assigned area of farm x in hectares (ha) to cultivate crop c using RW type i; is crop c production cost ($/ha); is the assigned RW of type i to irrigate farm x cultivating crop c (m3); and is the cost of RW type i ($/m3).
The revenue, , of farm x is computed by considering the crop’s c yield (ton/ha) multiplied by the selling price ($/ton) of that crop times the cultivated area (ha) of farm x, which is as follows:
The net benefit generated from the cultivation of crop c in farm x using RW type i is:
Considering the quality of the RW used and the quality standard and salinity tolerance of each cultivated crop, a binary 0/1 coefficient of connectivity, , is used allowing crop c to get its appropriate RW type i. Thus, Equation (6) yields:
In this model, more than one crop is allowed to be cultivated in farm x, which can be satisfied using the 0/1 binary variable . On the other hand, the model assumes that there is only RW type i is available to irrigate farm x which is implemented using the second binary variable . By considering the two connectivity binary variables, and , the net benefit equation can be re-arranged as:
4.2. Decision Variables
Since the optimization model allocates farmland areas and RW to cultivate different types of crops, the decision variables are:
- (1)
- : assigned area of farm x to cultivate crop c using RW type i (ha)
- (2)
- : assigned RW of type i to farm x farming crop c (m3)
- (3)
- : defines the connectivity of RW type i to farm x (binary variable)
- (4)
- : defines the connectivity of crop c to farm x (binary variable)
4.3. Constraints
4.3.1. Reclaimed Water Availability Constraints
Two types of RW are considered in this optimization model: RW type A (i = 1) from tertiary treated wastewater and RW type B (i = 2) from secondary treated wastewater.
(1) Total consumed RW type i
The sum of the total use of reclaimed water () of a certain type i must be equal to or less than the total amount of RW () of the same type i released from the same WWTP in the same cultivation season.
where represents the total amount of RW type i (m3) discharged from the WWTP.
(2) Consumed RW from source i by farm x irrigating crop c
where is the ratio of the observed area of farm x () to the total observed area in the system (), defined as:
which assures that each farm x will get its share of water proportionally to the ratio of its observed area to the total observed farmlands’ areas in the system.
(3) Consumed RW by type i and farm x
The sum of the assigned RW type i to irrigate farms (x = 1 to X) cultivating crops (c = 1 to C) must be equal to or less than the hydraulic loading (m3/ha) of each crop c times the cultivated area (ha), which is:
The hydraulic loading (m3/ha) considering each cultivated crop c is computed as:
where is the evapotranspiration requirements (mm/season) to cultivate crop c; is the irrigation efficiency to cultivate crop c; represents the net irrigation requirements (mm/season) to cultivate crop k; is the leaching requirements to cultivate crop c; and number 10 is a conversion factor to m3/ha.
4.3.2. Irrigated Farmland Constraints
(1) Irrigated area of farm x
The area (ha) in production of farm x cultivating crop c using RW type i must be equal to or less than the observed area (ha) of farm x, as:
(2) Total irrigated farmland area per RW type i
The sum of the total irrigated area in the system must be equal to or less than the area of the total observed farmlands, which is:
(3) Minimum farmland area to be cultivated with crop c in farm x
This constraint assures the cultivated area with each crop c must be more than the minimum limit of hectares to satisfy the feasible investment, which represented as follows:
(4) Maximum farmlands area to be cultivated by crop c
In order not to exceed the upper limit of the area cultivated using crop c, to avoid the domination of the most economic crop over all others, and to force the model to select as many crops as it could to satisfy the variety in production, the following constraint is considered:
where is the minimum area (ha) to be cultivated by crop c using RW type i; and is the maximum area (ha) to be cultivated by crop c using RW type i.
4.3.3. Connectivity Constraints
(1) Connectivity of crop c to farm x constraint
The binary variable assures at least one crop is cultivated at farm x. So, the sum of binary variable, for the same farm x, must be equal to or greater than 1. On the other hand, the model allows a maximum number of crops to be cultivated on each farm x. Up to four crops are allowed to be cultivated on the same farm. So, the farm–crop connectivity constraint is written as:
(2) Connectivity of RW type i to farm x constraint
The binary variable assures that farm x will be irrigated by one source of RW type i. So, the sum of binary variable, for the same RW type i, must be equal to 1.0, as in the following:
4.3.4. Minimum Allowed Net Benefit by the Farm x Constraint
To assure a suitable minimum margin of net benefit per farm x, the computed net benefit from cultivating crop/s must be at least 20% of the total cultivation cost of the same farm, which can be satisfied as:
5. Baghdad as a Case Study
In Baghdad, there are two main wastewater treatment plants; the Karkh WWTP and the Rustumia WWTP, which provide daily secondary treatment to a total of 1.0 MCM of wastewater that discharges to the Tigris River south of Baghdad. Several kilometers downstream of Baghdad, there are towns, villages, and cities which get their municipal and agricultural water supplies from the Tigris River. Furthermore, these WWTPs are surrounded by agricultural farmlands which are suitable to cultivate a wide variety of crops. Some of the best citrus and date palm orchards are located on the banks of the Tigris River, enhancing the beauty and the environment of the region while contributing to the local economy. These two WWTPs may have negative environmental impacts on the people and the aquatic life downstream when the treated wastewater does not meet the basic standards for organic matter and pathogens. Utilization of the treated wastewater for agricultural irrigation has the potential to improve water quality in the river and to further develop the local agricultural economy. Both the Karkh and the Rustumia WWTPs provide secondary treatment for their influent and plans to implement tertiary treatment have been made, recognizing the need for further treatment for agricultural reuse.
In this water allocation optimization model, reclaimed water type A (RWA) (tertiary treated wastewater), and reclaimed water type B (RWB) (secondary treated wastewater) are to be allocated on a total of 84 farms with a total area of 5300 ha to the south of Baghdad allowing up to four crops to be cultivated in each farm. Each cultivated farm is based on actual land ownership and is therefore of different land areas starting from a minimum area of 17.5 ha up to a maximum area of 193 ha.
6. Data Input for the Model
The Iraqi Ministry of Water Resources has specified a variety of 34 strategic crops which were chosen to be cultivated in Iraq [41] that can be irrigated using RW as an alternative source considering water quality, crop type, and the irrigation method. Those crops can be divided into human edible and inedible crops in addition to the industrial crops. In this study, two groups of crops were chosen to be cultivated (Table 1). Group A crops are to be irrigated using RWA, and group B crops are to be irrigated using RWB. RWA will be tertiary treated water with both filtration and disinfection to reduce both pathogens and suspended solids. RWB will be secondary treated water that includes basic disinfection and this water cannot be used on root crops including potatoes and onions. To limit the cultivated area of each crop to ensure a variety in production, the maximum area to be cultivated by each crop is listed in Table 1.

Table 1.
Maximum allowed areas (ha) to be cultivated by certain types of crops irrigated using two reclaimed water (RW) qualities.
Each crop’s water requirements (ETc) were adopted from Salman, et al. [8] and updated from the Iraqi Ministry of Water Resources [41]. Each crop’s and production costs in US dollars per hectare ($/ha) are presented in Table 2, based on data secured from the Iraqi Ministry of Agriculture and the Iraqi Central Statistical Organization (ICSO).
Table 2.
Crop production costs exclusive of water costs (US $ per ha).
In Iraq, farm productivity fluctuates due to soil fertility, weather, and water availability and quality. Each crop’s yield, as shown in Table 3, was secured from the Iraqi Central Statistical Organization (ICSO) considering Baghdad as the case study.
Table 3.
Crop yield (tons per ha).
7. Results and Discussion
The optimization model was solved using ANTIGONE in GAMS, allowing up to four crops to be cultivated in each farm. Before choosing ANTIGONE to run the model, an investigation of different MINLP solvers, including the Branch-And-Reduced Optimization Navigator (BARON) computational system for the solution of nonlinear programming problems (NLPs) and mixed-integer nonlinear programming problems (MINLPs), was performed. An Intel Core i7 2.2 GHz computer (Aspire V3-571G, ACER, Xizhi, New Taipei City, Taiwan) with Turbo Boost up to 3.2 GHz and 16 GB Double Data Rate Type 3 (DDR3) memory was used. Computed values of the net benefit using ANTIGONE were higher than the predicted values using BARON. For instance, solving the same problem, the computed net benefit using BARON is about 7 × 10⁵ $ lower than the computed value using ANTIGONE. ANTIGONE was 11.6 times faster than BARON for solving the same optimization model. For example, BARON took about 186 s to solve the problem to find the optimal solution after 109 iterations by exploring 109 nodes. Meanwhile, ANTIGONE took only 17 s to solve the same problem, exploring only one node. Other models such as BONMIN, COUENNE, and DICOPT were also evaluated solving the same MINLP optimization problem, but all these solvers resulted in infeasible solutions.
The current optimization model has 3946 variables and 956 constraints with 31,936 Jacobian elements, 27,552 of which are nonlinear. The Hessian of the Lagrangian has 0 elements on the diagonal, 5880 elements below the diagonal, and 3612 nonlinear variables. The total central processing unit (CPU) time which was taken for one optimization attempt ranged from about 12 s to less than 1 min depending on the number of iterations used to find the optimal solution.
The analysis was completed using two different reclaimed water qualities with different reclaimed water availabilities and different irrigation efficiencies. The analysis generated the maximum net benefit, total cultivated area, net benefit per hectare, and the area dedicated to each crop. The selected irrigation efficiencies were proposed regarding the irrigation technique used. In Iraq, the vast majority of agricultural irrigation is done using the traditional flooding system with an estimated irrigation efficiency (IE) ranging from 45% to 55% [41]. The irrigation efficiency should increase with the development of modern irrigation techniques which could reach up to 85% with the use of automated drip irrigation systems. While there is debate regarding the impact of increasing irrigation efficiency on water consumption at the basin scale [42], increasing irrigation efficiency should increase water availability in Iraq at the basin scale. In Iraq, agricultural return flows are considered unsuitable for irrigation and they are diverted into drains that transport the water into the Arabian (Persian) Gulf. Furthermore, groundwater is currently not used extensively in Iraq. Increasing irrigation efficiency will decrease irrigation return flows and flows to groundwater, however, the infrastructure in Iraq does not currently utilize these flows so the basin-scale impact on water resources should be positive. The model was run for different irrigation efficiencies ranging from 45% to 85% to help determine the potential benefits of improving the irrigation systems.
The maximized net benefits using RWA and RWB on the proposed 84 farms for different irrigation efficiencies and different quantities of water are presented in Figure 2 and Figure 3. Results showed that the net benefit of using RWA and RWB increases with the increase of the amount of reclaimed water used. The use of 6.0 MCM of RWA with a 45% irrigation efficiency (IE) has a net benefit of 2.21 × 10⁶ $ from the cultivation of approximately 384 ha of tomatoes. For the use of 6.0 MCM of RWA with 85% IE, the model predicts a net benefit of 4.55 × 10⁶ $ while cultivating a total of 701.2 ha comprised of 500 ha of tomatoes and 201.2 ha of potatoes. The model demonstrates that the use of higher irrigation efficiencies, which means more water availability due to advanced irrigation techniques, can produce a higher net benefit and greater crop diversity. On using the same 6.0 MCM of RWA with irrigation efficiencies of 55, 65, 75, and 85%, the net benefit increases by 30.7, 57.3, 81.7, and 106.1%, respectively, as compared to the results for a 45% IE. Small increases in irrigation efficiency are clearly beneficial. The use of 6.0 MCM of RWA with 65% IE has a net benefit increase of 20.4% as compared to a 55% IE, and the 75% IE has a net benefit increase of 15.5% higher as compared to a 65% IE. Finally, the use of 85% IE has a net benefit increase of about 13.4% as compared to a 75% IE. The increase in net benefit will decrease as higher IEs are achieved.
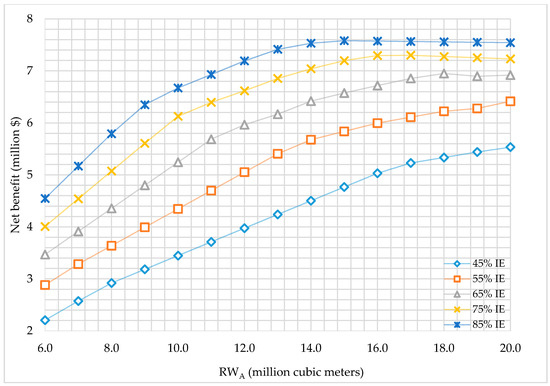
Figure 2.
Total net benefit (million $) predicted using reclaimed water type A (RWA) with five different irrigation efficiencies (IEs).
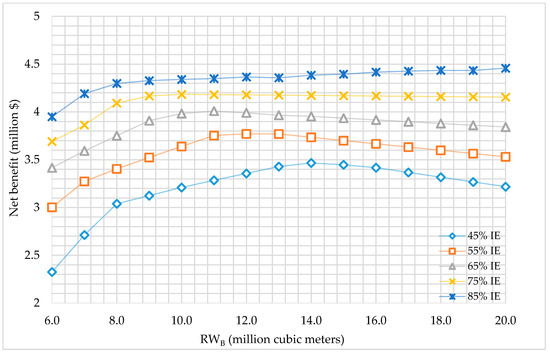
Figure 3.
Total net benefit (million $) predicted using reclaimed water type B (RWB) with five different irrigation efficiencies (IEs).
The optimum maximized net benefit using RWB was 4.46 × 10⁶ $ with 20.0 MCM of RWB with an 85% IE while cultivating 2031 ha with 10 different types of crops. As illustrated in Figure 3, optimizing the use of RWB results in lower net benefit values in comparison to RWA (Figure 2), due to the difference in the crops allowed to be cultivated using both RW types.
The maximization of the net benefit from the use of RWB has followed a different trend to that observed with RWA. Using 6.0 MCM of RWB with a 45% IE produces a net benefit of 2.33 × 10⁶ $. In contrast, the use of 6.0 MCM of RWB with 55, 65, 75, and 85% IEs results in increases of about 29.1, 46.9, 58.7, and 69.8%, respectively, in comparison to a 45% IE. The increase in net benefit decreases as the quantity of RWB used increases, and the same is true for the increases in IEs. On using 12.0 MCM of RWB with 55, 65, 75, and 85% IEs, the net benefit increases by 12.3, 18.9, 24.5, and 30.1%, respectively, as compared to a 45% IE which has a net benefit of about 3.4 × 10⁶ $. The decreases in the ratio of the net benefit with higher irrigation efficiencies is due to the increase in the practically employed amount of water which tends to irrigate the maximum allowed area of the most economic crops first and later finds crops of lower economic value. The most economic crops identified by the water allocation optimization model using RWB are tomatoes, eggplant, cucumber, okra, and clover.
Using 6.0 MCM of RWB with 45% IE has a computed net benefit of 2.33 × 10⁶ $, which is higher than the net benefit computed using RWA, cultivating the same area of 384 ha of tomatoes. RWB has shown a significant advantage over RWA when both are used to cultivate the same types of crops on the same areas as with the cultivation of tomatoes using of 6.0 MCM of RWB with 45 and 55% IE and using 7.0 and 8.0 MCM of RWB with 45% IE. The advantage of RWB over RWA is because the cultivation cost and the selling price of the cultivated crops are the same, although RWB is less expensive than RWA.
The higher quantities of reclaimed water in combination with higher irrigation efficiencies results in the cultivation of more land which produces a higher net benefit when crops with higher economic value are cultivated. In this study, the maximized net benefit from using RWA had a peak value of 7.6 × 10⁶ $ when 15.0 MCM of RWA has been used with 85% IE, as illustrated in Figure 2. Thereafter, the maximized net benefit declined with an increase in the quantity of water used because the model reached the maximum area for the highest economic value crops (Table 1), such as tomatoes, while lower economic value crops are cultivated until crops with negative economic value, such as clover, are the only crops available for cultivation. Optimizing the use of higher water availabilities with RWB results in a similar decline in the net benefit with higher irrigation efficiencies, as illustrated in Figure 3, due to the previously mentioned reason.
The cultivated areas predicted from optimizing the allocation of RWA are presented in Figure 4. Increasing the quantities of RWA used results in a commensurate increase in the cultivated area. Using 6.0 MCM of RWA with 45, 55, 65, 75, and 85% IEs results in irrigated areas of 384.8, 470.3, 549.5, 625.3, and 701.2 ha, respectively. The model satisfies the maximum allowed area of the most economic crop then it starts cultivating the crop with the next higher economic value and so on. Therefore, tomatoes were selected first by the model to be cultivated using RWA followed by potatoes, onion, eggplant, cucumber, and okra. For instance, using 6.0 MCM of RWA with 45% IE, the model selected tomatoes to be cultivated first and when the quantity of RWA reached 8.0 MCM with 45% IE, the model cultivated 500 ha of tomatoes, then 11.6 ha of potatoes, which is the second most economical crop in the system.
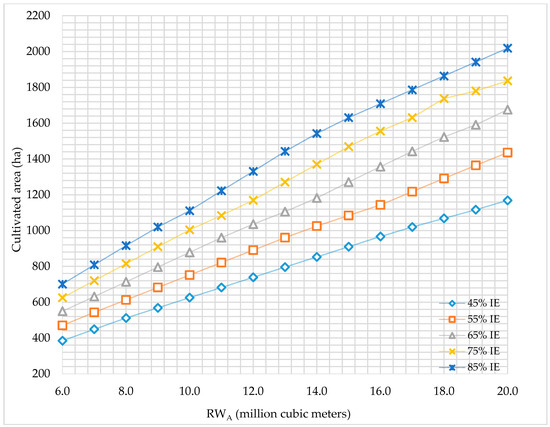
Figure 4.
Total cultivated area (ha) predicted using reclaimed water type A (RWA) with five different irrigation efficiencies (IEs).
The total cultivated areas using RWB with different irrigation efficiencies are presented in Figure 5. The results show that the increase in the reclaimed water quantities used, the served area will increase accordingly depending on the evapotranspiration of the crops cultivated. The model predicts the maximum net benefit by cultivating the optimum area using a variety of crops as a function of the available quantity of water. Using 10.0 MCM of RWB with 85% IE results in the cultivation of the maximum allowable hectares of tomatoes, eggplant, cucumber, and okra followed by the cultivation of 131.7 ha of clover (Table 1). Meanwhile, using 11.0 MCM of RWB with 85% IE results in the cultivation of the maximum allowable area of tomatoes, eggplant, and cucumber, followed by 176.3 ha of clover, 93.5 ha of sesame, and 9.3 ha of alfalfa. Instead of cultivating only 209.3 ha of clover, the model maximizes the net benefit by including sesame and alfalfa which provide a similar net benefit to clover (Figure 5). The same trend was predicted by the model using from 13.0 MCM to 19.0 MCM of RWB with 85% IE. One of the features of the model is to allow for cultivating as many crops as possible which satisfy the maximum net benefit. In addition, the minimum allowed area of crops to be cultivated may be adjusted based on specific conditions to provide constraints in the model consistent with supply and demand.
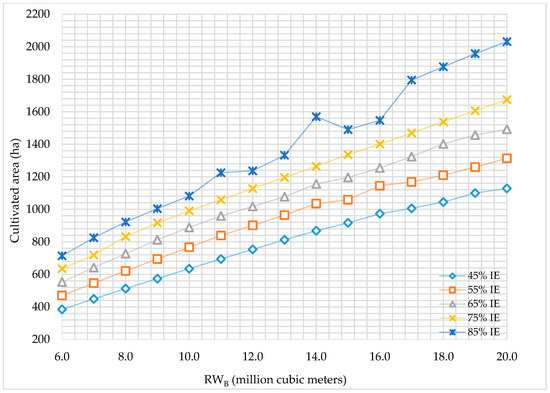
Figure 5.
Total cultivated area (ha) predicted using reclaimed water type B (RWB) with five different irrigation efficiencies (IEs).
The average net benefit per hectare ($/ha) predicted from optimizing the allocation of RWA and RWB is presented in Figure 6 and Figure 7, respectively. With an increase in irrigation efficiency using a specific quantity of water, the computed net benefit per cultivated hectare of crops increased until a limit was reached. The factors that limit the net benefit are the increase in the cultivated area along with the requirement to grow more lower economic value crops. For instance, using 6.0 MCM of RWA with 45% IE predicted a net benefit of about 5732 $/ha when only tomatoes are cultivated on 384 ha. Meanwhile, the model predicted a net benefit of 6483 $/ha when it cultivated 500 ha of tomatoes, and 201 ha of potatoes using 6.0 MCM of RWA with 85% IE. In contrast, the model results experienced a significant decline in the predicted net benefit per hectare with the increase in irrigation efficiencies using higher quantities of water due to the increase in the cultivated area, and the decrease of the total maximized net benefit computed from the cultivation of crops with a lower net benefit. Using 20.0 MCM of RWA with 45% IE has predicted a net benefit of about 4734 $/ha while cultivating 500 ha of tomatoes, 500 ha of potatoes, 15 ha of onion, and 19 ha of eggplant. A net benefit of 3737 $/ha was predicted by cultivating 500 ha of tomatoes, 500 ha of potatoes, 200 ha of eggplant, 150 ha of onion, 150 ha of cucumber, 100 of okra, and 419 ha of clover using 20.0 MCM of RWA with 85% IE (Figure 6). The net benefit per hectare using different availabilities of RWB with different irrigation efficiencies, as illustrated in Figure 7, decreases with the increase in the quantities of RWB with the increase in IEs due to the same reasons mentioned under the use of RWA.
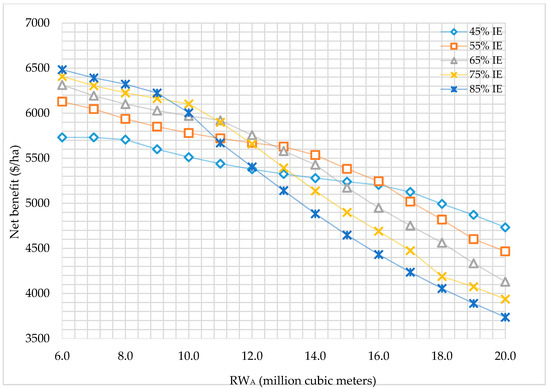
Figure 6.
Net benefit per hectare ($/ha) predicted using reclaimed water type A (RWA) with five different irrigation efficiencies (IEs).
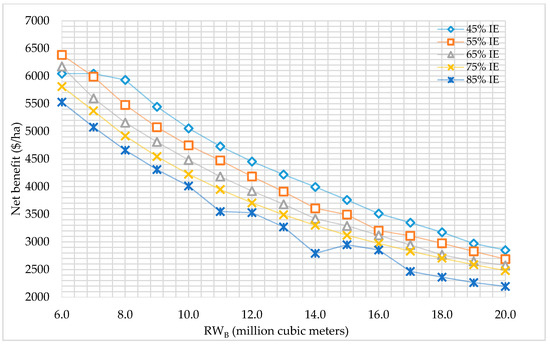
Figure 7.
Net benefit per hectare ($/ha) predicted using reclaimed water type B (RWB) with five different irrigation efficiencies (IEs).
The cultivated crops using different availabilities of RWA with 45, 65, and 85% IEs are presented in Figure 8, Figure 9 and Figure 10, respectively. There are 14 different types of crops available for cultivation using RWA as listed in group A in Table 1. Each crop has its own evapotranspiration value, selling price, production cost, and yield per hectare. Starting with 6.0 MCM with 45% IE, the model predicted cultivation of 384 ha of tomatoes. Tomato is the crop which satisfied the highest net benefit per hectare as compared to the other competitive crops in Table 1. All of the 84 cultivated farms of the system have the opportunity to cultivate tomatoes depending on the ratio of their areas to the total observed area of farms. Increasing the quantity of RWA and/or increasing the irrigation efficiency, increases the quantity of water which is allocated on farms cultivating more crops. With 45% IE using different RWA availabilities, tomatoes, potatoes, onion, and eggplant have been cultivated, respectively, starting from the highest economic value crop then next highest and so on, as illustrated in Figure 8. Increasing the irrigation efficiencies using a certain quantity of reclaimed water provides the opportunity to cultivate more crops after cultivating the maximum allowed area for each crop. For example, at 65% IE the model predicts the cultivation of up to 8 crops (Figure 9). Meanwhile, with 85% IE using certain availabilities of RWA, the model has predicted the cultivation of up to seven different crops when 20.0 MCM of RWA was used (Figure 10).
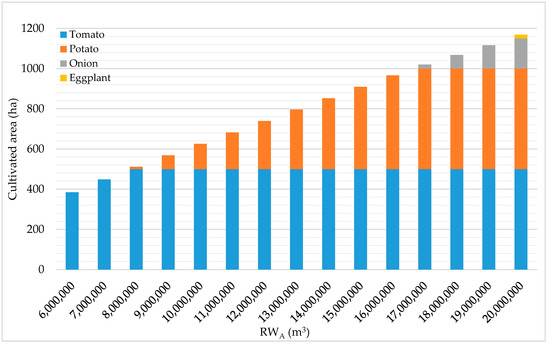
Figure 8.
Predicted area (ha) of crops irrigated using reclaimed water type A (RWA) with 45% IE.
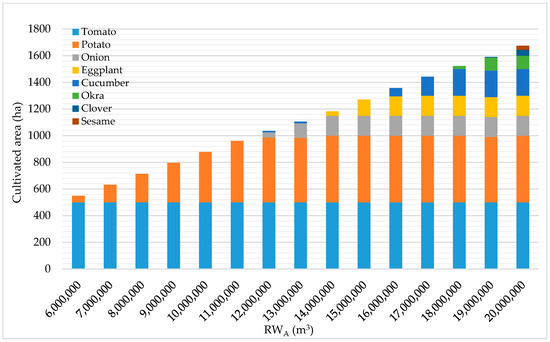
Figure 9.
Predicted area (ha) of crops irrigated using reclaimed water type A (RWA) with 65% IE.
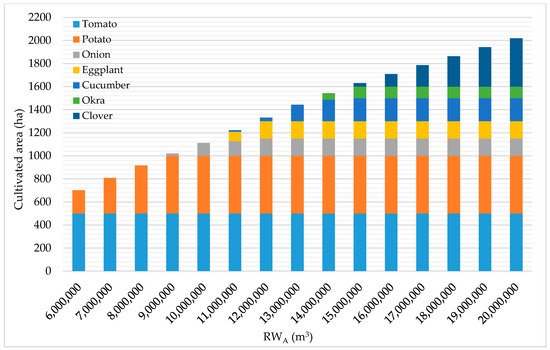
Figure 10.
Predicted area (ha) of crops irrigated using reclaimed water type A (RWA) with 85% IE.
The cultivated crops using different availabilities of RWB with 45, 65, and 85% IEs are illustrated in Figure 11, Figure 12 and Figure 13, respectively. The use of RWB has followed the same trends observed with RWA by cultivating the highest economic value crop then the next highest and so on while selecting from the 12 crops listed in group B in Table 1. This began with irrigating only 384 ha of tomatoes using 6.0 MCM of RWB with 45% IE, later reaching the irrigation of 500 ha of tomatoes, 150 ha of eggplant, 200 ha of cucumber, 100 ha of okra, 177 ha of clover, and 1.6 ha of sesame by using 20.0 MCM of RWB, as illustrated in Figure 11. Figure 12 and Figure 13 illustrate the cultivated crops using different RWB availabilities with 65% and 85% IEs, respectively. Even though the optimization model allows up to 4 crops to be cultivated simultaneously on the same farm, results showed that most of the farms cultivated up to 2 crops depending on the RW availability and the IE implemented.
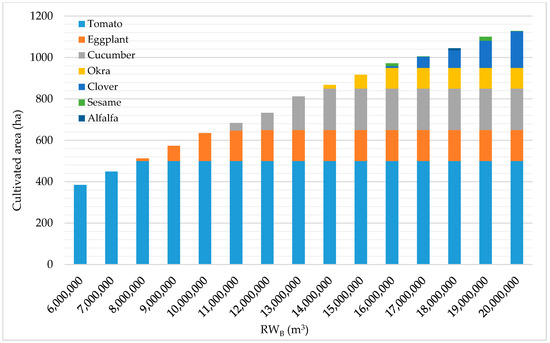
Figure 11.
Predicted area (ha) of crops irrigated using reclaimed water type B (RWB) with 45% IE.
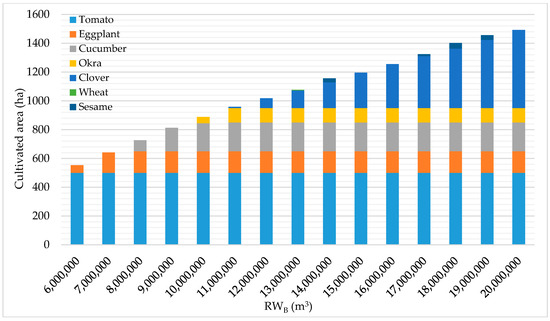
Figure 12.
Predicted area (ha) of crops irrigated using reclaimed water type B (RWB) with 65% IE.
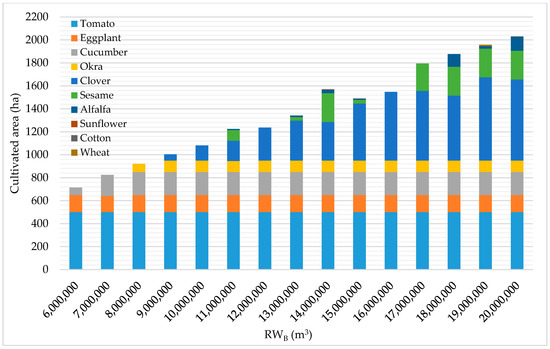
Figure 13.
Predicted area (ha) of crops irrigated using reclaimed water type B (RWB) with 85% IE.
8. Summary and Conclusions
The reclaimed water allocation optimization model (the mixed-integer nonlinear programming problem) was used to determine the optimum allocation of water on 84 proposed farms south of Baghdad. It was demonstrated that increasing irrigation efficiencies can produce a higher net benefit and greater crop diversity. Even small increases in irrigation efficiency are clearly beneficial, as increasing the irrigation efficiency from 45% to 55% can result in a net benefit increase of 30.7%. The net benefit per hectare of cultivated land increases until high irrigation efficiencies (>75%) are used as the increase in the available water allows for irrigation of the maximum allowed area for the most economic crops. Therefore, crops with lower economic value are cultivated with increased water availability while at lower irrigation efficiencies, only the highest economic value crops are selected. The model demonstrated that RWA results in a higher net benefit as compared to RWB. With lower quantities of available water, only the most economic crops are grown with both RWA and RWB, while the cost of RWB is less than that of RWA. For instance, using 6.0 MCM of RWB with 45% IE has a predicted a net benefit of 2.33 × 10⁶ $, which is higher than the net benefit of 2.21 × 10⁶ $ using RWA while cultivating the same area of 384 ha of tomatoes.
Even though most Iraqi WWTPs use secondary treatment, the model predicts it is more efficient to upgrade to tertiary treatment to produce RWA. Using reclaimed water for irrigation will help in reducing the potential negative environmental impacts of wastewater discharge while increasing the potential uses of RW for agriculture. Since most of Iraq’s built or under construction WWTPs are located in or adjacent to agricultural lands, it is logical and efficient to invest in using their secondary or tertiary treated wastewater for agricultural irrigation to enhance the economy of farmers and the environment while providing a diverse range of crops.
Author Contributions
A.A.A. was responsible for the literature review, identification of available data, model development, analysis, and paper writing as the principal author with the greatest contribution to the manuscript. L.W.M. enhanced the paper with input on optimization model development and software. P.F. contributed to the conceptual aspects of water reuse and provided extensive editing of the final manuscript.
Funding
The research was funded by the Iraqi Ministry of Higher Education and Scientific Research.
Acknowledgment
Special thanks and gratitude to the Ministry of Higher Education and Scientific Research—Iraq for sponsoring and funding Ahmed A. Aljanabi’s graduate study at Arizona State University.
Conflicts of Interest
The authors declare no conflict of interest.
References and Note
- Metcalf, E.; Asano, T.; Burton, F.; Leverenz, H.; Tsuchihashi, R.; Tchobanoglous, G. Water Reuse: Issues, Technologies, and Applications; McGraw-Hill Professional: New York, NY, USA, 2007. [Google Scholar] [CrossRef]
- Misener, R.; Floudas, C.A. ANTIGONE: Algorithms for continuous/integer global optimization of nonlinear equations. J. Glob. Optim. 2014, 59, 503–526. [Google Scholar] [CrossRef]
- GAMS Development Corporation. General Algebraic Modeling System (GAMS); GAMS: Washington, DC, USA, 2016. [Google Scholar]
- Tawarmalani, M.; Sahinidis, N.V. A polyhedral branch-and-cut approach to global optimization. Math. Program. 2005, 103, 225–249. [Google Scholar] [CrossRef]
- Bonami, P.; Lee, J. BONMIN user’s manual. Numer. Math. 2007, 4, 1–32. [Google Scholar]
- Belotti, P. Couenne: A User’S Manual. Available online: https://www.coin-or.org/Couenne/couenne-user-manual.pdf (accessed on 15 June 2018).
- Grossmann, I.E.; Viswanathan, J.; Vecchietti, A.; Raman, R.; Kalvelagen, E. GAMS/DICOPT: A Discrete Continuous Optimization Package; GAMS Corporation Inc.: Washington, DC, USA, 2002. [Google Scholar]
- Salman, D.A.; Amer, S.A.; Ward, F.A. Water appropriation systems for adapting to water shortages in Iraq. J. Am. Water Resour. Assoc. 2014, 50, 1208–1225. [Google Scholar] [CrossRef]
- Aljanabi, A.A.; Mays, L.W.; Fox, P. Application of an optimization model for assessing the performance of water appropriation in Iraq. Environ. Nat. Resour. Res. 2018, 8. [Google Scholar] [CrossRef]
- Aljanabi, A.A.; Mays, L.W.; Fox, P. A reclaimed wastewater allocation optimization model for agricultural irrigation. Environ. Nat. Resour. Res. 2018, 8. [Google Scholar] [CrossRef]
- Burton, M. A simulation of water allocation policies in times of water shortage. Irrig. Drain. Syst. 1994, 8, 61–81. [Google Scholar] [CrossRef]
- Salman, A.; Al-Karablieh, E.; Fisher, F. An inter-seasonal allocation of irrigation water system (SAWAS). Agric. Syst. 2001, 68, 233–252. [Google Scholar] [CrossRef]
- Oxley, R.L.; Mays, L.W. Application of an optimization model for the sustainable water resource management of river basins. Water Resour. Manag. 2016, 30, 4883–4898. [Google Scholar] [CrossRef]
- Chong, M.; Wang, X.; Li, Y. An optimization model for water management based on water resources and environmental carrying capacities: A case study of the Yinma River Basin, Northeast China. Water 2018, 10, 565. [Google Scholar] [CrossRef]
- Singh, A. Irrigation planning and management through optimization modelling. Water Resour. Manag. 2014, 28, 1–14. [Google Scholar] [CrossRef]
- Shangguan, Z.; Shao, M.; Horton, R.; Lei, T.; Qin, L.; Ma, J. A model for regional optimal allocation of irrigation water resources under deficit irrigation and its applications. Agric. Water Manag. 2002, 52, 139–154. [Google Scholar] [CrossRef]
- Ghahraman, B.; Sepaskhah, A. Linear and non-linear optimization models for allocation of a limited water supply. Irrig. Drain. 2004, 53, 39–54. [Google Scholar] [CrossRef]
- Georgiou, P.; Papamichail, D. Optimization model of an irrigation reservoir for water allocation and crop planning under various weather conditions. Irrig. Sci. 2008, 26, 487–504. [Google Scholar] [CrossRef]
- Sadegh, M.; Mahjouri, N.; Kerachian, R. Optimal inter-basin water allocation using crisp and fuzzy Shapley games. Water Resour. Manag. 2010, 24, 2291–2310. [Google Scholar] [CrossRef]
- Bekri, E.; Disse, M.; Yannopoulos, P. Optimizing water allocation under uncertain system conditions for water and agriculture future scenarios in Alfeios River Basin (Greece)—Part B: Fuzzy-boundary intervals combined with multi-stage stochastic programming model. Water 2015, 7, 6427–6466. [Google Scholar] [CrossRef]
- Lu, H.; Huang, G.; He, L. An inexact rough-interval fuzzy linear programming method for generating conjunctive water-allocation strategies to agricultural irrigation systems. Appl. Math. Model. 2011, 35, 4330–4340. [Google Scholar] [CrossRef]
- Abdulbaki, D.; Al-Hindi, M.; Yassine, A.; Najm, M.A. An optimization model for the allocation of water resources. J. Clean. Prod. 2017, 164, 994–1006. [Google Scholar] [CrossRef]
- Rezaei, F.; Safavi, H.R.; Mirchi, A.; Madani, K. f-MOPSO: An alternative multi-objective PSO algorithm for conjunctive water use management. J. Hydro-Environ. Res. 2017, 14, 1–18. [Google Scholar] [CrossRef]
- Wang, Z.; Yang, J.; Deng, X.; Lan, X. Optimal water resources allocation under the constraint of land use in the Heihe River Basin of China. Sustainability 2015, 7, 1558–1575. [Google Scholar] [CrossRef]
- Fotakis, D.; Sidiropoulos, E. A new multi-objective self-organizing optimization algorithm (MOSOA) for spatial optimization problems. Appl. Math. Comput. 2012, 218, 5168–5180. [Google Scholar] [CrossRef]
- Lalehzari, R.; Boroomand Nasab, S.; Moazed, H.; Haghighi, A. Multiobjective management of water allocation to sustainable irrigation planning and optimal cropping pattern. J. Irrig. Drain. Eng. 2015, 142. [Google Scholar] [CrossRef]
- Yousefi, M.; Banihabib, M.E.; Soltani, J.; Roozbahani, A. Multi-objective particle swarm optimization model for conjunctive use of treated wastewater and groundwater. Agric. Water Manag. 2018, 208, 224–231. [Google Scholar] [CrossRef]
- Fang, S.; Guo, P.; Li, M.; Zhang, L. Bilevel multiobjective programming applied to water resources allocation. Math. Probl. Eng. 2013, 2013. [Google Scholar] [CrossRef]
- Fotakis, D.; Sidiropoulos, E. Combined land-use and water allocation planning. Ann. Oper. Res. 2014, 219, 169–185. [Google Scholar] [CrossRef]
- Ward, F.A.; Amer, S.A.; Ziaee, F. Water allocation rules in Afghanistan for improved food security. Food Secur. 2013, 5, 35–53. [Google Scholar] [CrossRef]
- Nguyen, D.; Dandy, G.; Maier, H.; Ascough, J. Improved ant colony optimization for optimal crop and irrigation water allocation by incorporating domain knowledge. J. Water Resour. Plan. Manag. 2016, 142. [Google Scholar] [CrossRef]
- Nguyen, D.C.H.; Maier, H.R.; Dandy, G.C.; Ascough II, J.C. Framework for computationally efficient optimal crop and water allocation using ant colony optimization. Environ. Model. Softw. 2016, 76, 37–53. [Google Scholar] [CrossRef]
- Nguyen, D.C.H.; Ascough, J.C., II; Maier, H.R.; Dandy, G.C.; Andales, A.A. Optimization of irrigation scheduling using ant colony algorithms and an advanced cropping system model. Environ. Model. Softw. 2017, 97, 32–45. [Google Scholar] [CrossRef]
- Davijani, M.H.; Banihabib, M.; Anvar, A.N.; Hashemi, S. Optimization model for the allocation of water resources based on the maximization of employment in the agriculture and industry sectors. J. Hydrol. 2016, 533, 430–438. [Google Scholar] [CrossRef]
- Raju, K.S.; Kumar, D.N. Irrigation planning using genetic algorithms. Water Resour. Manag. 2004, 18, 163–176. [Google Scholar] [CrossRef]
- Nagesh Kumar, D.; Raju, K.S.; Ashok, B. Optimal reservoir operation for irrigation of multiple crops using genetic algorithms. J. Irrig. Drain. Eng. 2006, 132, 123–129. [Google Scholar] [CrossRef]
- Sadati, S.K.; Speelman, S.; Sabouhi, M.; Gitizadeh, M.; Ghahraman, B. Optimal irrigation water allocation using a genetic algorithm under various weather conditions. Water 2014, 6, 3068–3084. [Google Scholar] [CrossRef]
- Anwar, A.A.; Haq, Z.U. Genetic algorithms for the sequential irrigation scheduling problem. Irrig. Sci. 2013, 31, 815–829. [Google Scholar] [CrossRef]
- Frenken, K. Irrigation in the Middle East Region in Figures AQUASTAT Survey-2008; Food and Agriculture Organization of the United Nations (FAO): Rome, Italy, 2009. [Google Scholar]
- Rahi, K.A.; Halihan, T. Changes in the salinity of the Euphrates River system in Iraq. Reg. Environ. Chang. 2010, 10, 27–35. [Google Scholar] [CrossRef]
- Strategy for Water and Land Resources in Iraq; Iraqi Ministry of Water Resources: Baghdad, Iraq, 2014.
- Grafton, R.; Williams, J.; Perry, C.; Molle, F.; Ringler, C.; Steduto, P.; Udall, B.; Wheeler, S.; Wang, Y.; Garrick, D. The paradox of irrigation efficiency. Science 2018, 361, 748–750. [Google Scholar] [CrossRef] [PubMed]
© 2018 by the authors. Licensee MDPI, Basel, Switzerland. This article is an open access article distributed under the terms and conditions of the Creative Commons Attribution (CC BY) license (http://creativecommons.org/licenses/by/4.0/).