1. Introduction
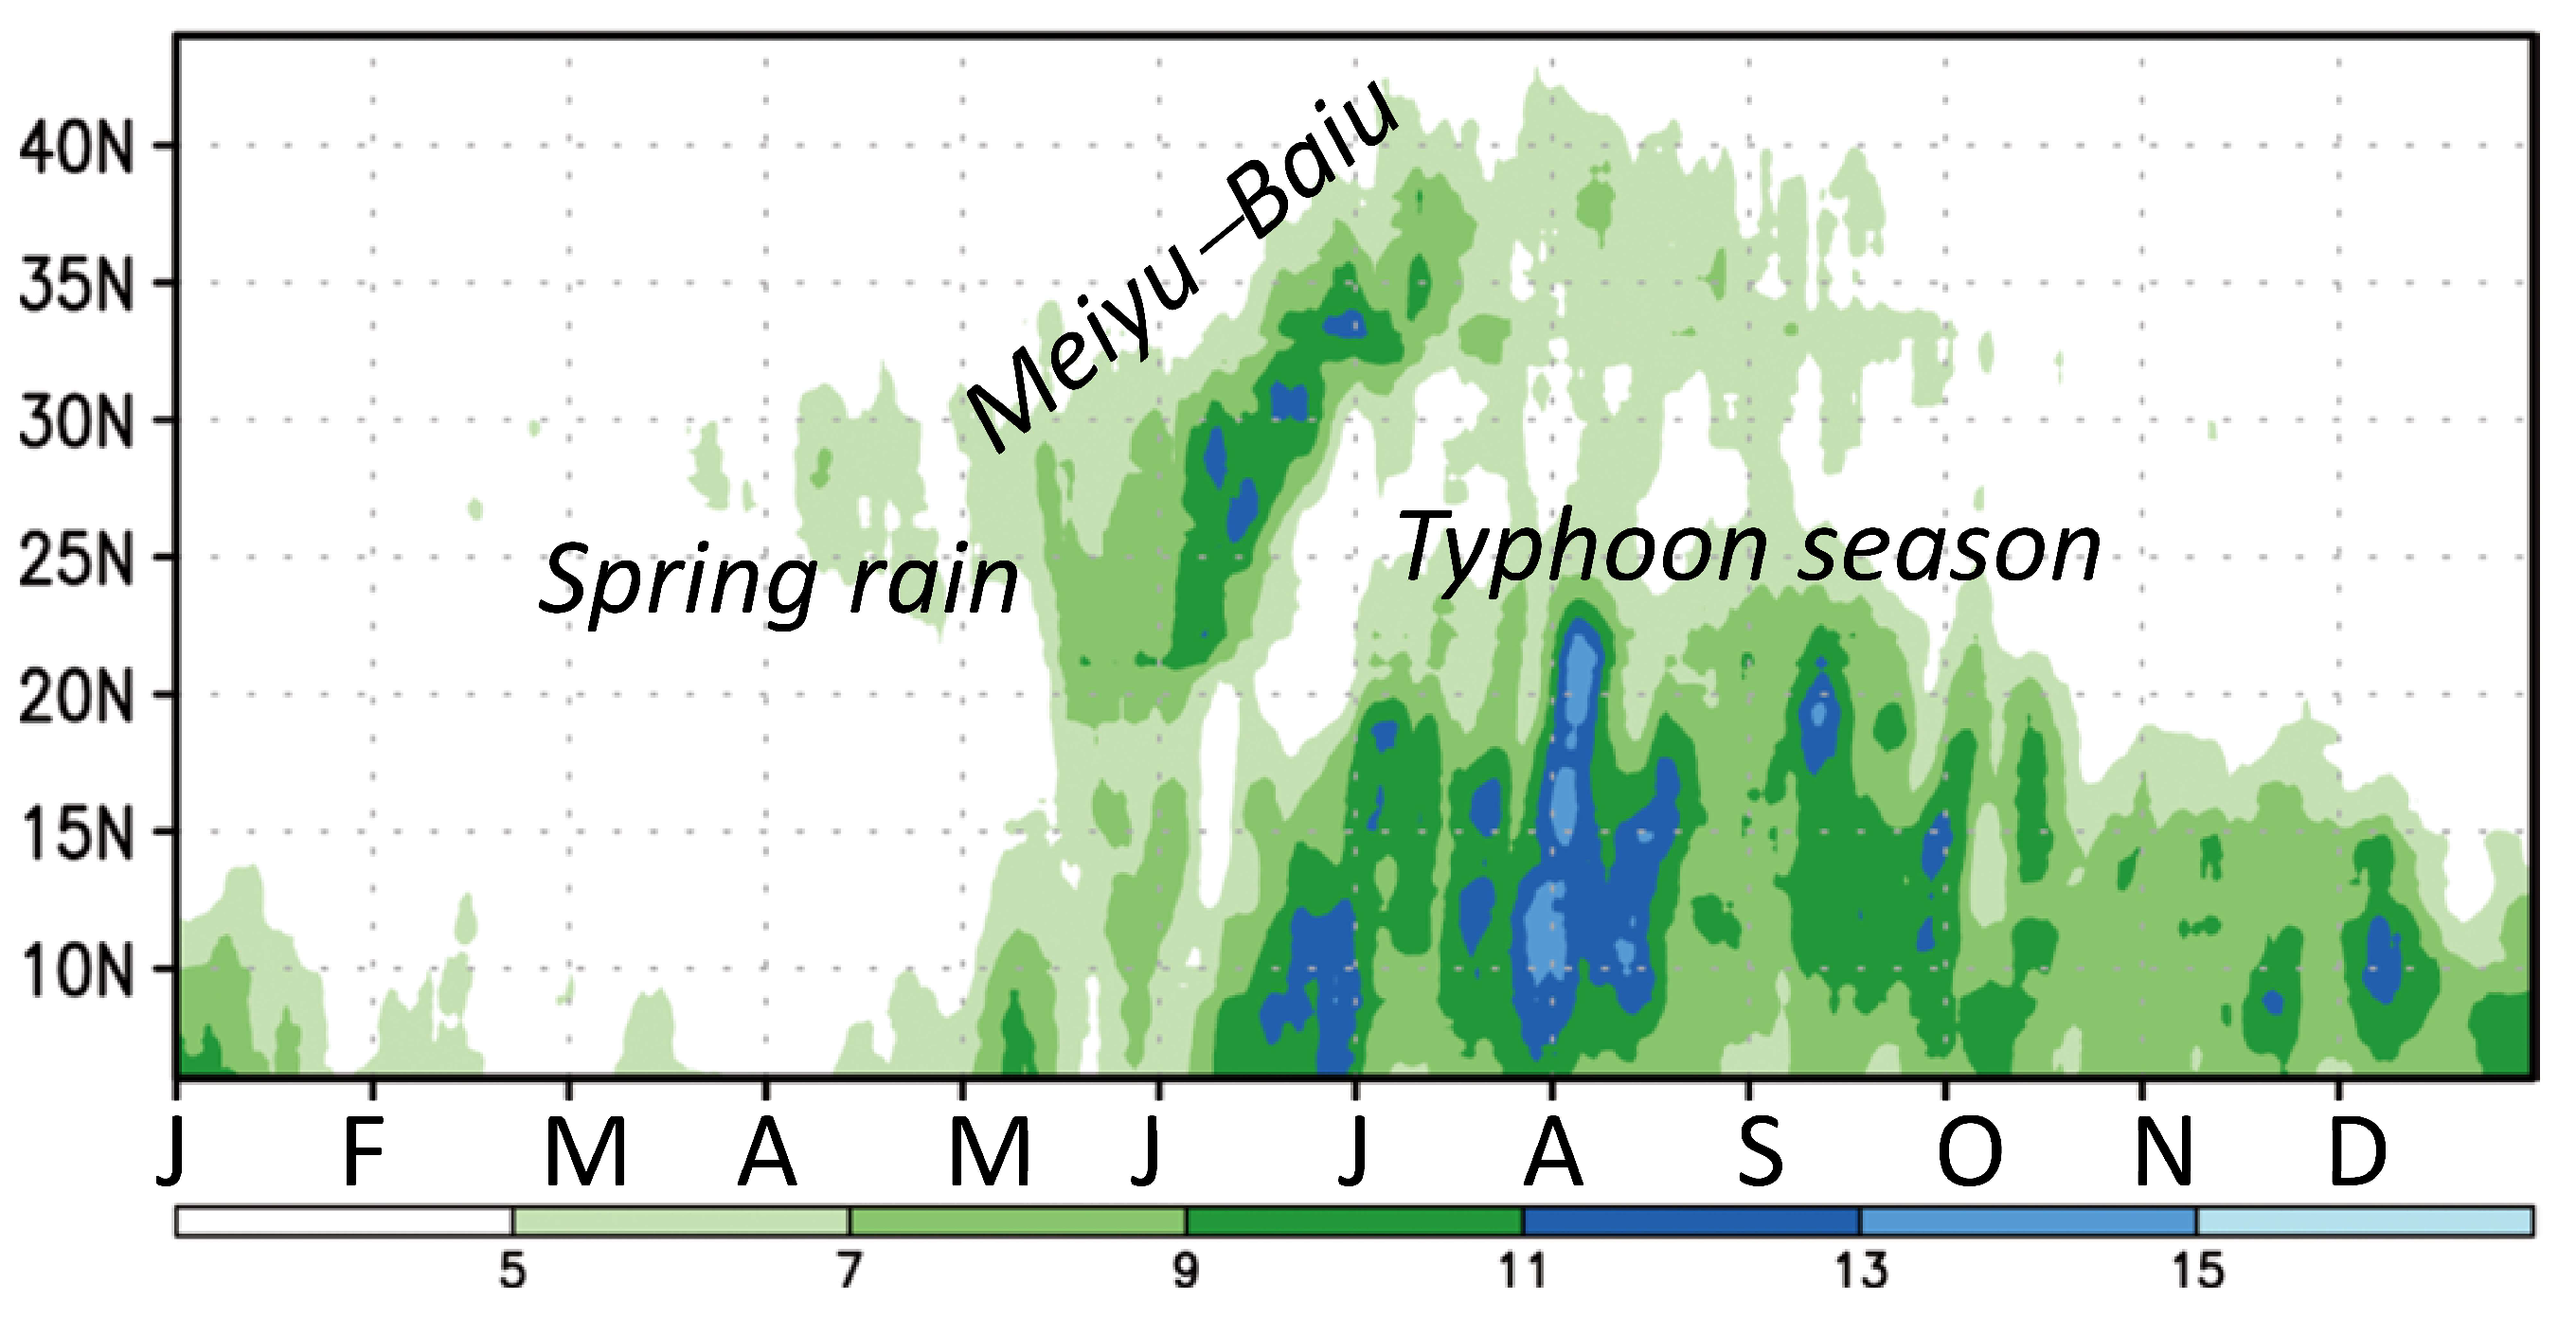
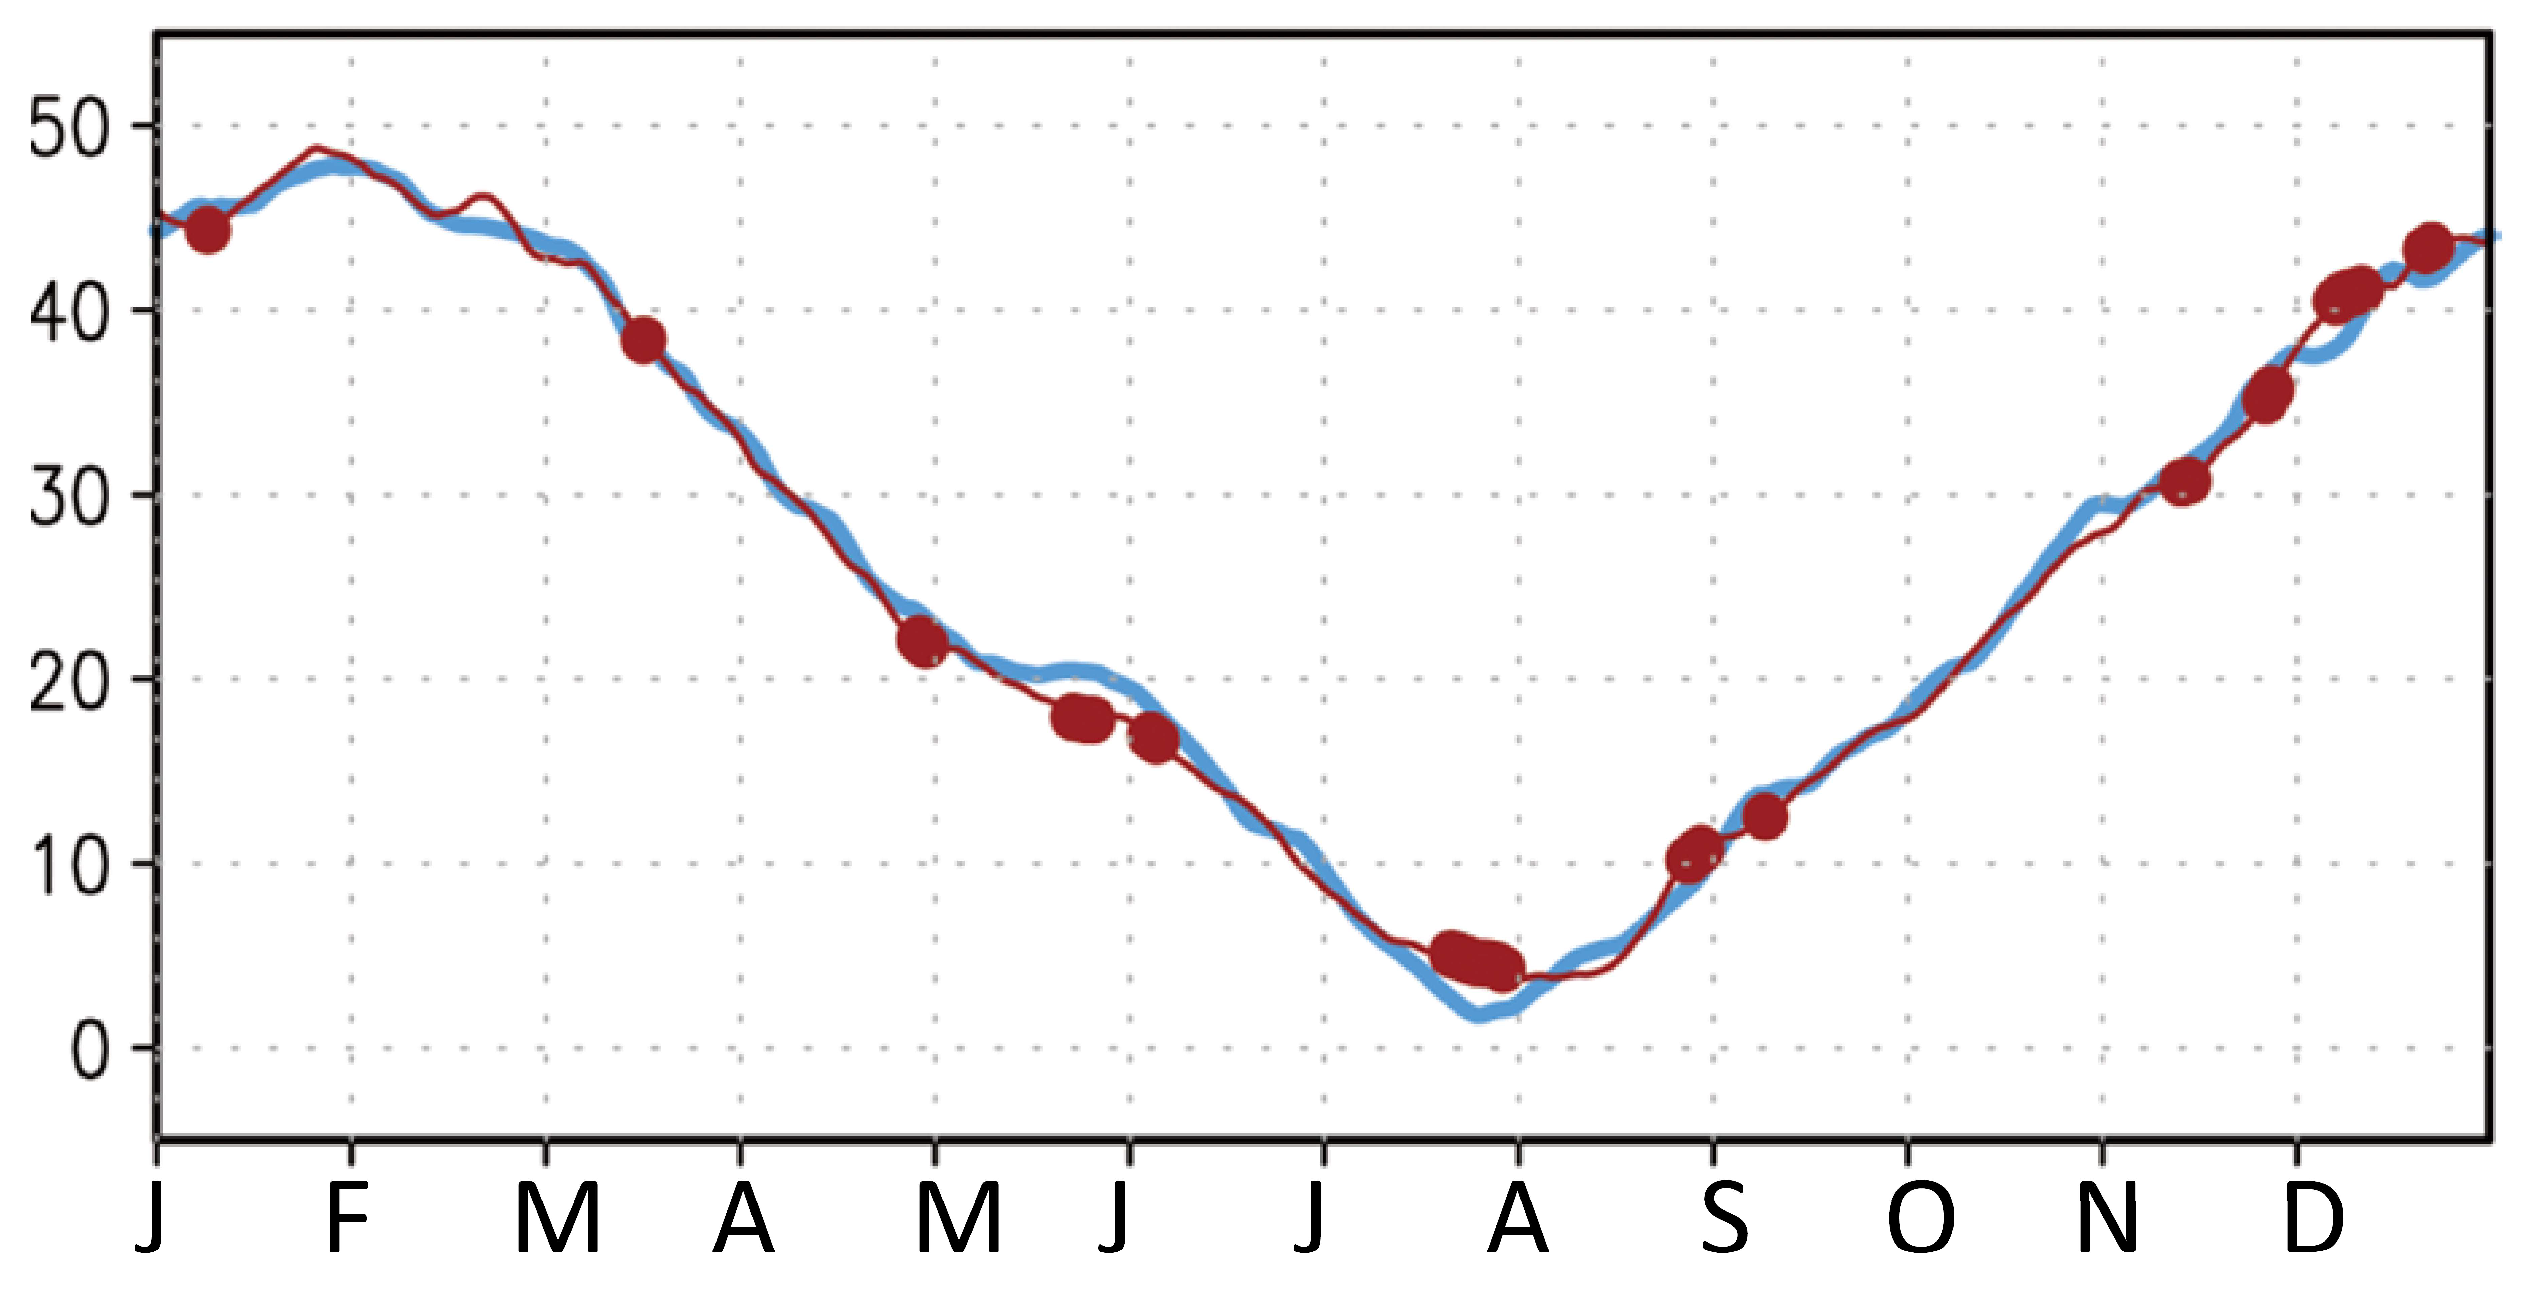
Every year, beginning in March, subtropical East Asia (20° N–35° N) undergoes a series of dynamical stages in precipitation [
1,
2,
3,
4], including persistent spring rains [
5], stepwise development of the Meiyu-Baiu [
6,
7], and the typhoon season [
8] (
Figure 1). The onset of the East Asian spring rain is usually considered to be part of the boreal winter-to-spring transition on a global scale [
4,
9], and the Meiyu-Baiu migration (late May–late July) can develop in parallel to the South Asian summer monsoon advancement [
10]. Corresponding to the Western North Pacific (WNP) summer monsoon onset in late July [
11,
12], the Meiyu-Baiu terminates, subtropical East Asia enters the typhoon season [
8], and Japan enters the post-Baiu season [
13]. These diverse stages of East Asian precipitation, which displays asymmetric monsoon seasonality (rapid development in early summer, gradual decline (subtropical WNP) in late summer–autumn, and the rapid shift of Baiu, as shown in
Figure 1), show linkage to nearby monsoons.
Relative to the widely discussed mechanisms of monsoon onsets that occur rapidly and abruptly, little attention has been paid to the mechanisms of monsoon retreats [
14], as well as monsoon breaks [
15,
16,
17]. Recently, research has investigated the coevolution of subtropical monsoons on a broad scale from Africa and across East Asia and the WNP in July–August, and the synchronous development of subtropical monsoons followed by a zonal expansion of the upper tropospheric anticyclonic circulation has been reported [
18]. In late spring-early summer, interior Asian continental heating drives the South and East Asian monsoons. In late summer, the inland/highland origin of the Asian continental monsoon no longer has dominant control of the large-scale circulation feature [
18] and what drives the summer monsoon retreat process has not been well understood.
In Asia, the topographic driving of seasonal characteristics is dramatic and has been considered a crucial factor affecting the East Asian seasonality [
10,
19,
20]. In addition to the roles played by large mountains, such as the Tibetan Plateau and Himalayas [
21,
22,
23,
24], the role of the Indochina Peninsula has emerged recently as a modulating component to the seasonality of the Asian monsoon [
25,
26,
27]. The north-south-oriented mountain ranges over the Indochina Peninsula have been suggested as a driving factor of the early South Asian and East Asian summer monsoons [
28,
29]. The role of the peninsula’s narrow mountains in strengthening the WNP monsoon trough in late July was further reported [
29]. In addition, as was demonstrated in this study, the existence of the mountains on the Indochina Peninsula could intensify the seasonal variation of larger-scale circulation and precipitation.
Following the series of studies in which we examine the role of the Indochina Peninsula topography in modulating the Asian monsoon, this study expanded the analysis to (1) explore the onset versus retreat processes of the summer monsoon (i.e., the spring-to-autumn seasonality) over subtropical East Asia, and (2) examine whether the asymmetric seasonality (precipitation stages) in subtropical East Asia is topographically related upstream to the Indochina Peninsula. In
Section 2, the data, model, and experimental design are introduced.
Section 3 examines the asymmetric seasonal migration of westerly winds, subtropical highs, and the Asian summer monsoons. In
Section 4, simulations that include and do not include the Indochina Peninsula topography are performed to clarify how this topography affects the simulated seasonal evolution.
Section 5 provides concluding remarks.
2. Data, Model, and Experimental Design
The data used in this study comprised of (a) precipitation recorded by the Tropical Rainfall Measuring Mission (TRMM) 3B42 Version 7 [
30] during the period, 1998–2010, and (b) atmospheric circulation fields obtained from the National Centers for Environmental Prediction (NCEP) Climate Forecast System Reanalysis (CFSR) [
31] for the period, 1979–2010. The TRMM precipitation production has been shown to resemble rain gauge observations with a good representation of the warm season diurnal rainfall variability over the East Asian monsoon region [
32,
33,
34,
35]. The temporal and spatial resolutions were 3 h and 0.25° for the TRMM data and 6 h and 0.5° for the CFSR dynamical field data. The precipitation data corresponds to a shorter time period than the dynamical field data. Regarding a climatological mean, however, our diagnostic analysis should not be data-period dependent. Topographic data were obtained from the U.S. Geological Survey (USGS), with a latitude-longitude spatial resolution of approximately 0.16°.
A combination of the Community Atmospheric Model (CAM) Version 5.1 of the National Center for Atmospheric Research (NCAR) and the slab ocean model (SOM) (available at the website of
http://www.cesm.ucar.edu) was used, with the CAM having a horizontal resolution of approximately 1°. Parameterizations in CAM include cloud macrophysics/microphysics and radiation, moisture processes, vertical diffusion, boundary layer, and turbulent mixing, etc. [
36]. The boundary and initial conditions of the simulations were adopted from the Community Earth System Model (CESM) preindustrial control experiment [
37]. The integration length was 50 years, and the outputs for the period, 31–50 years, were analyzed.
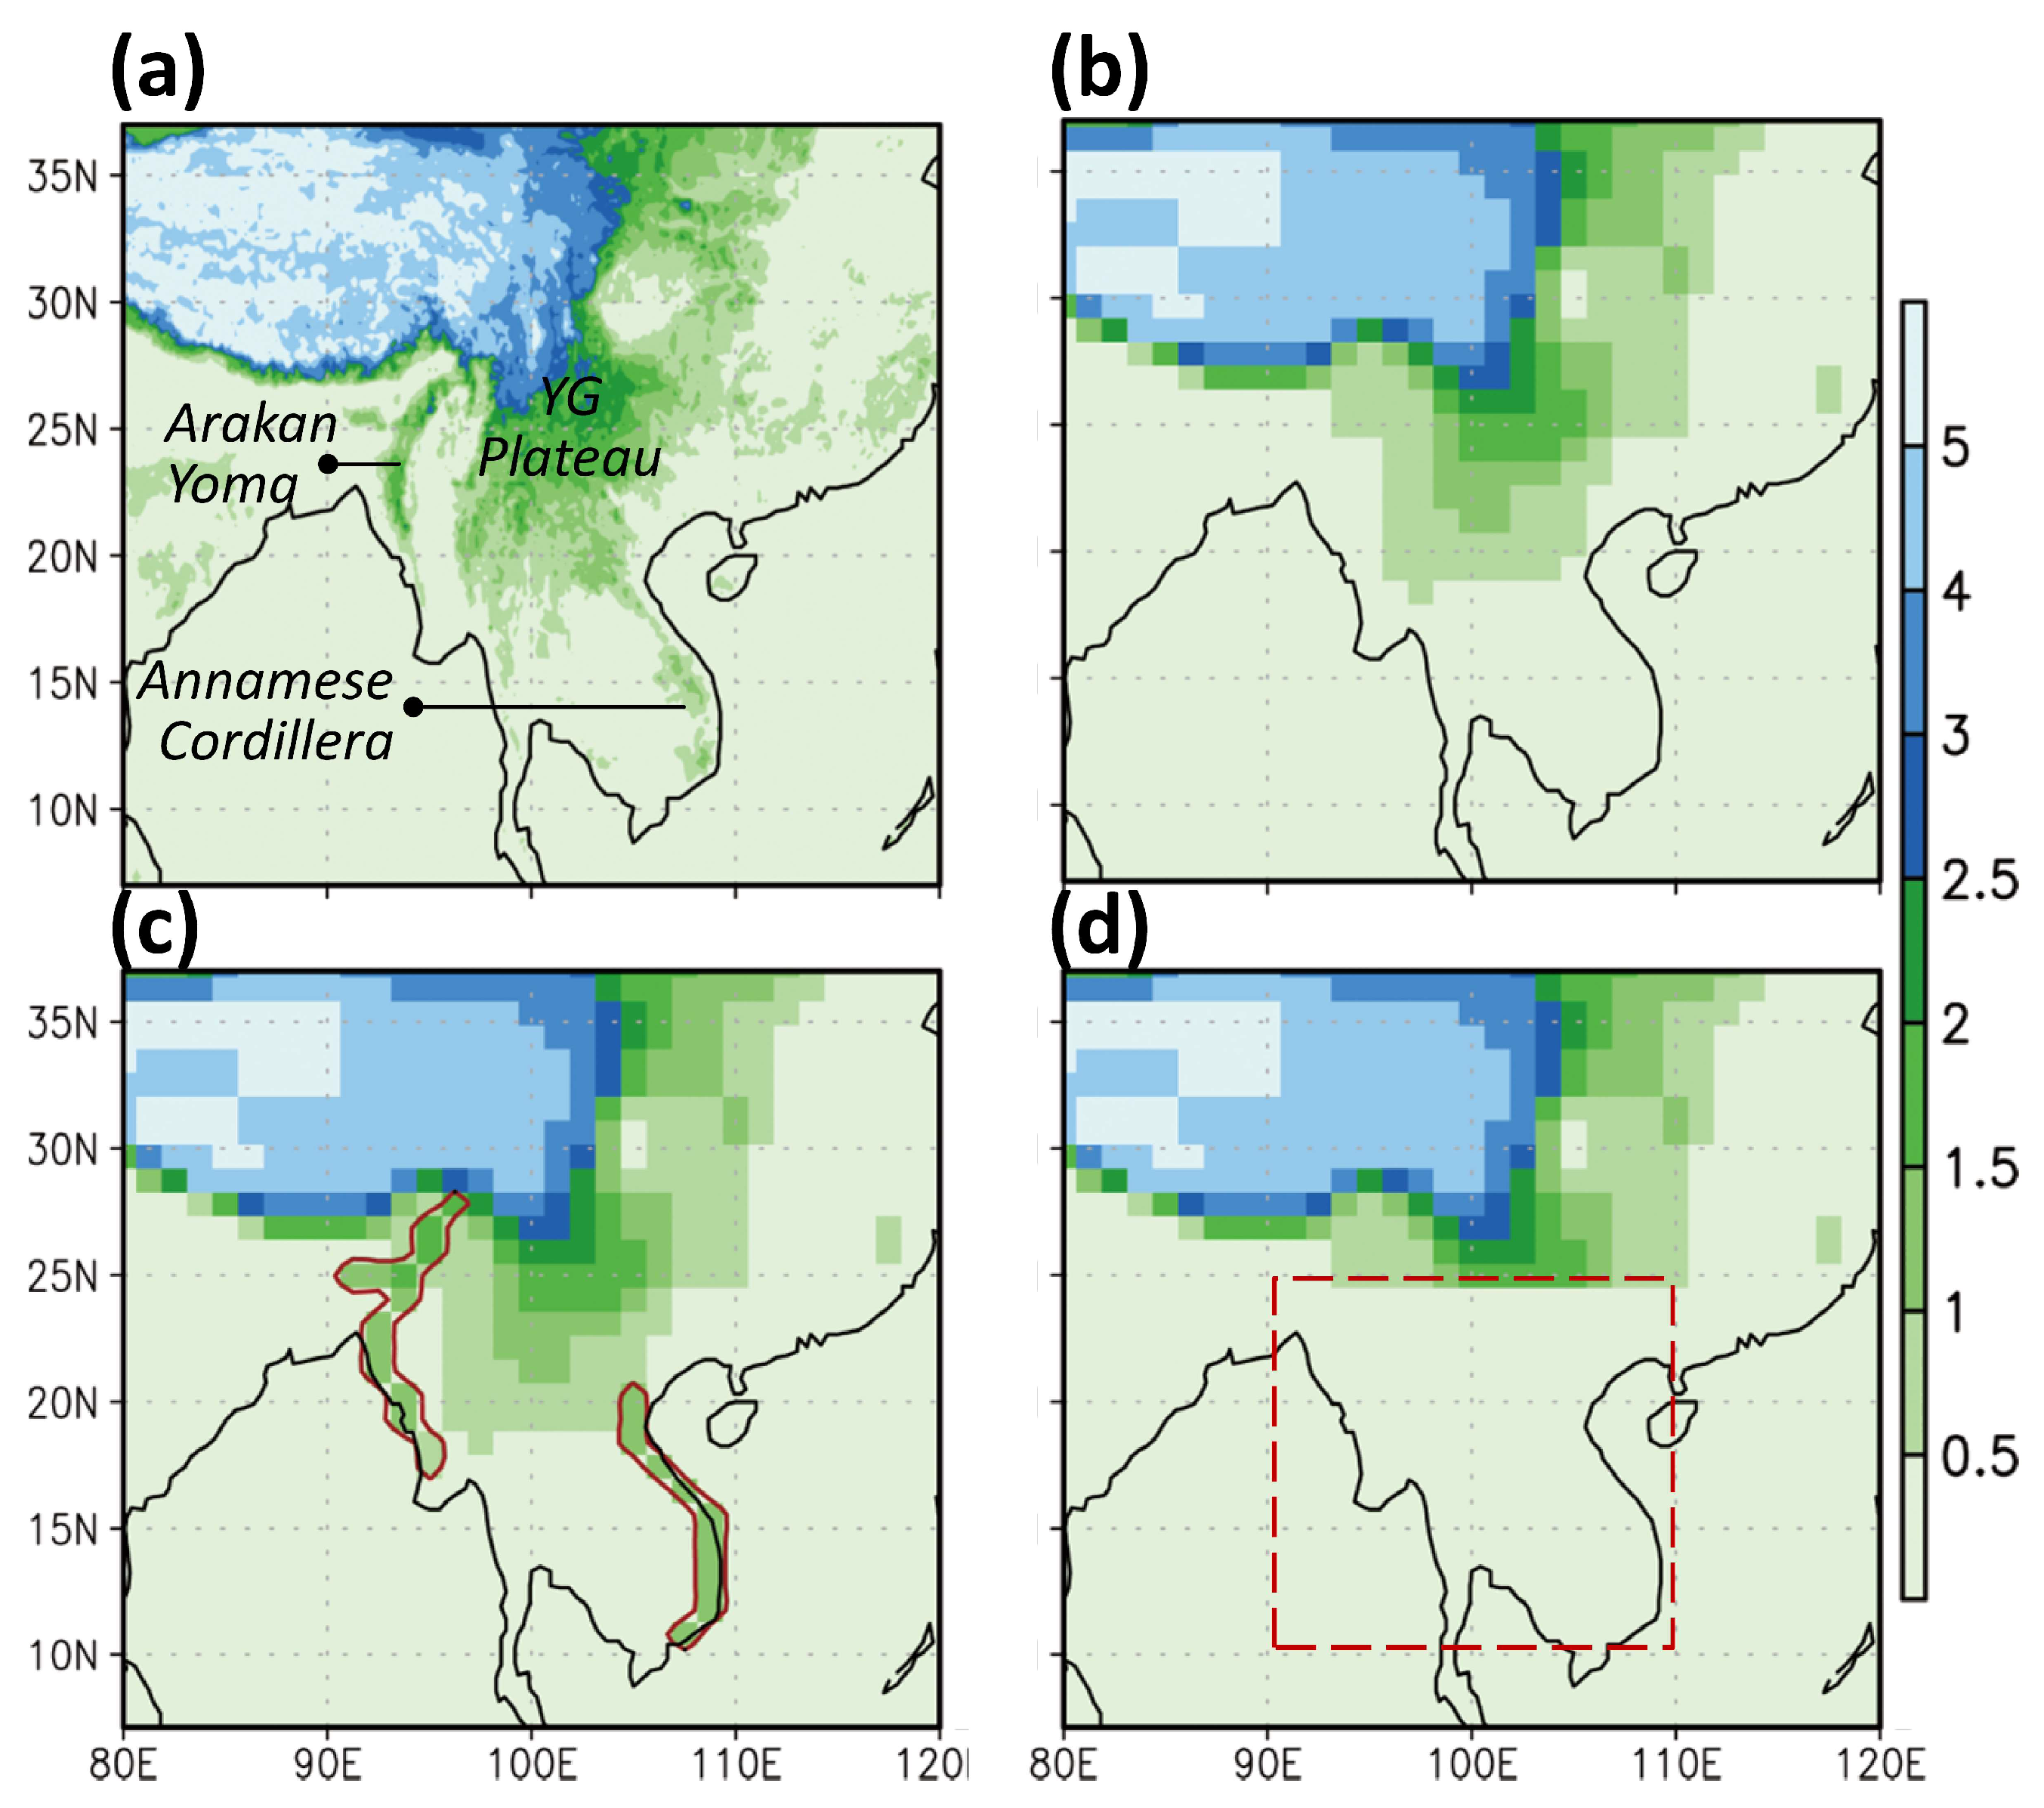
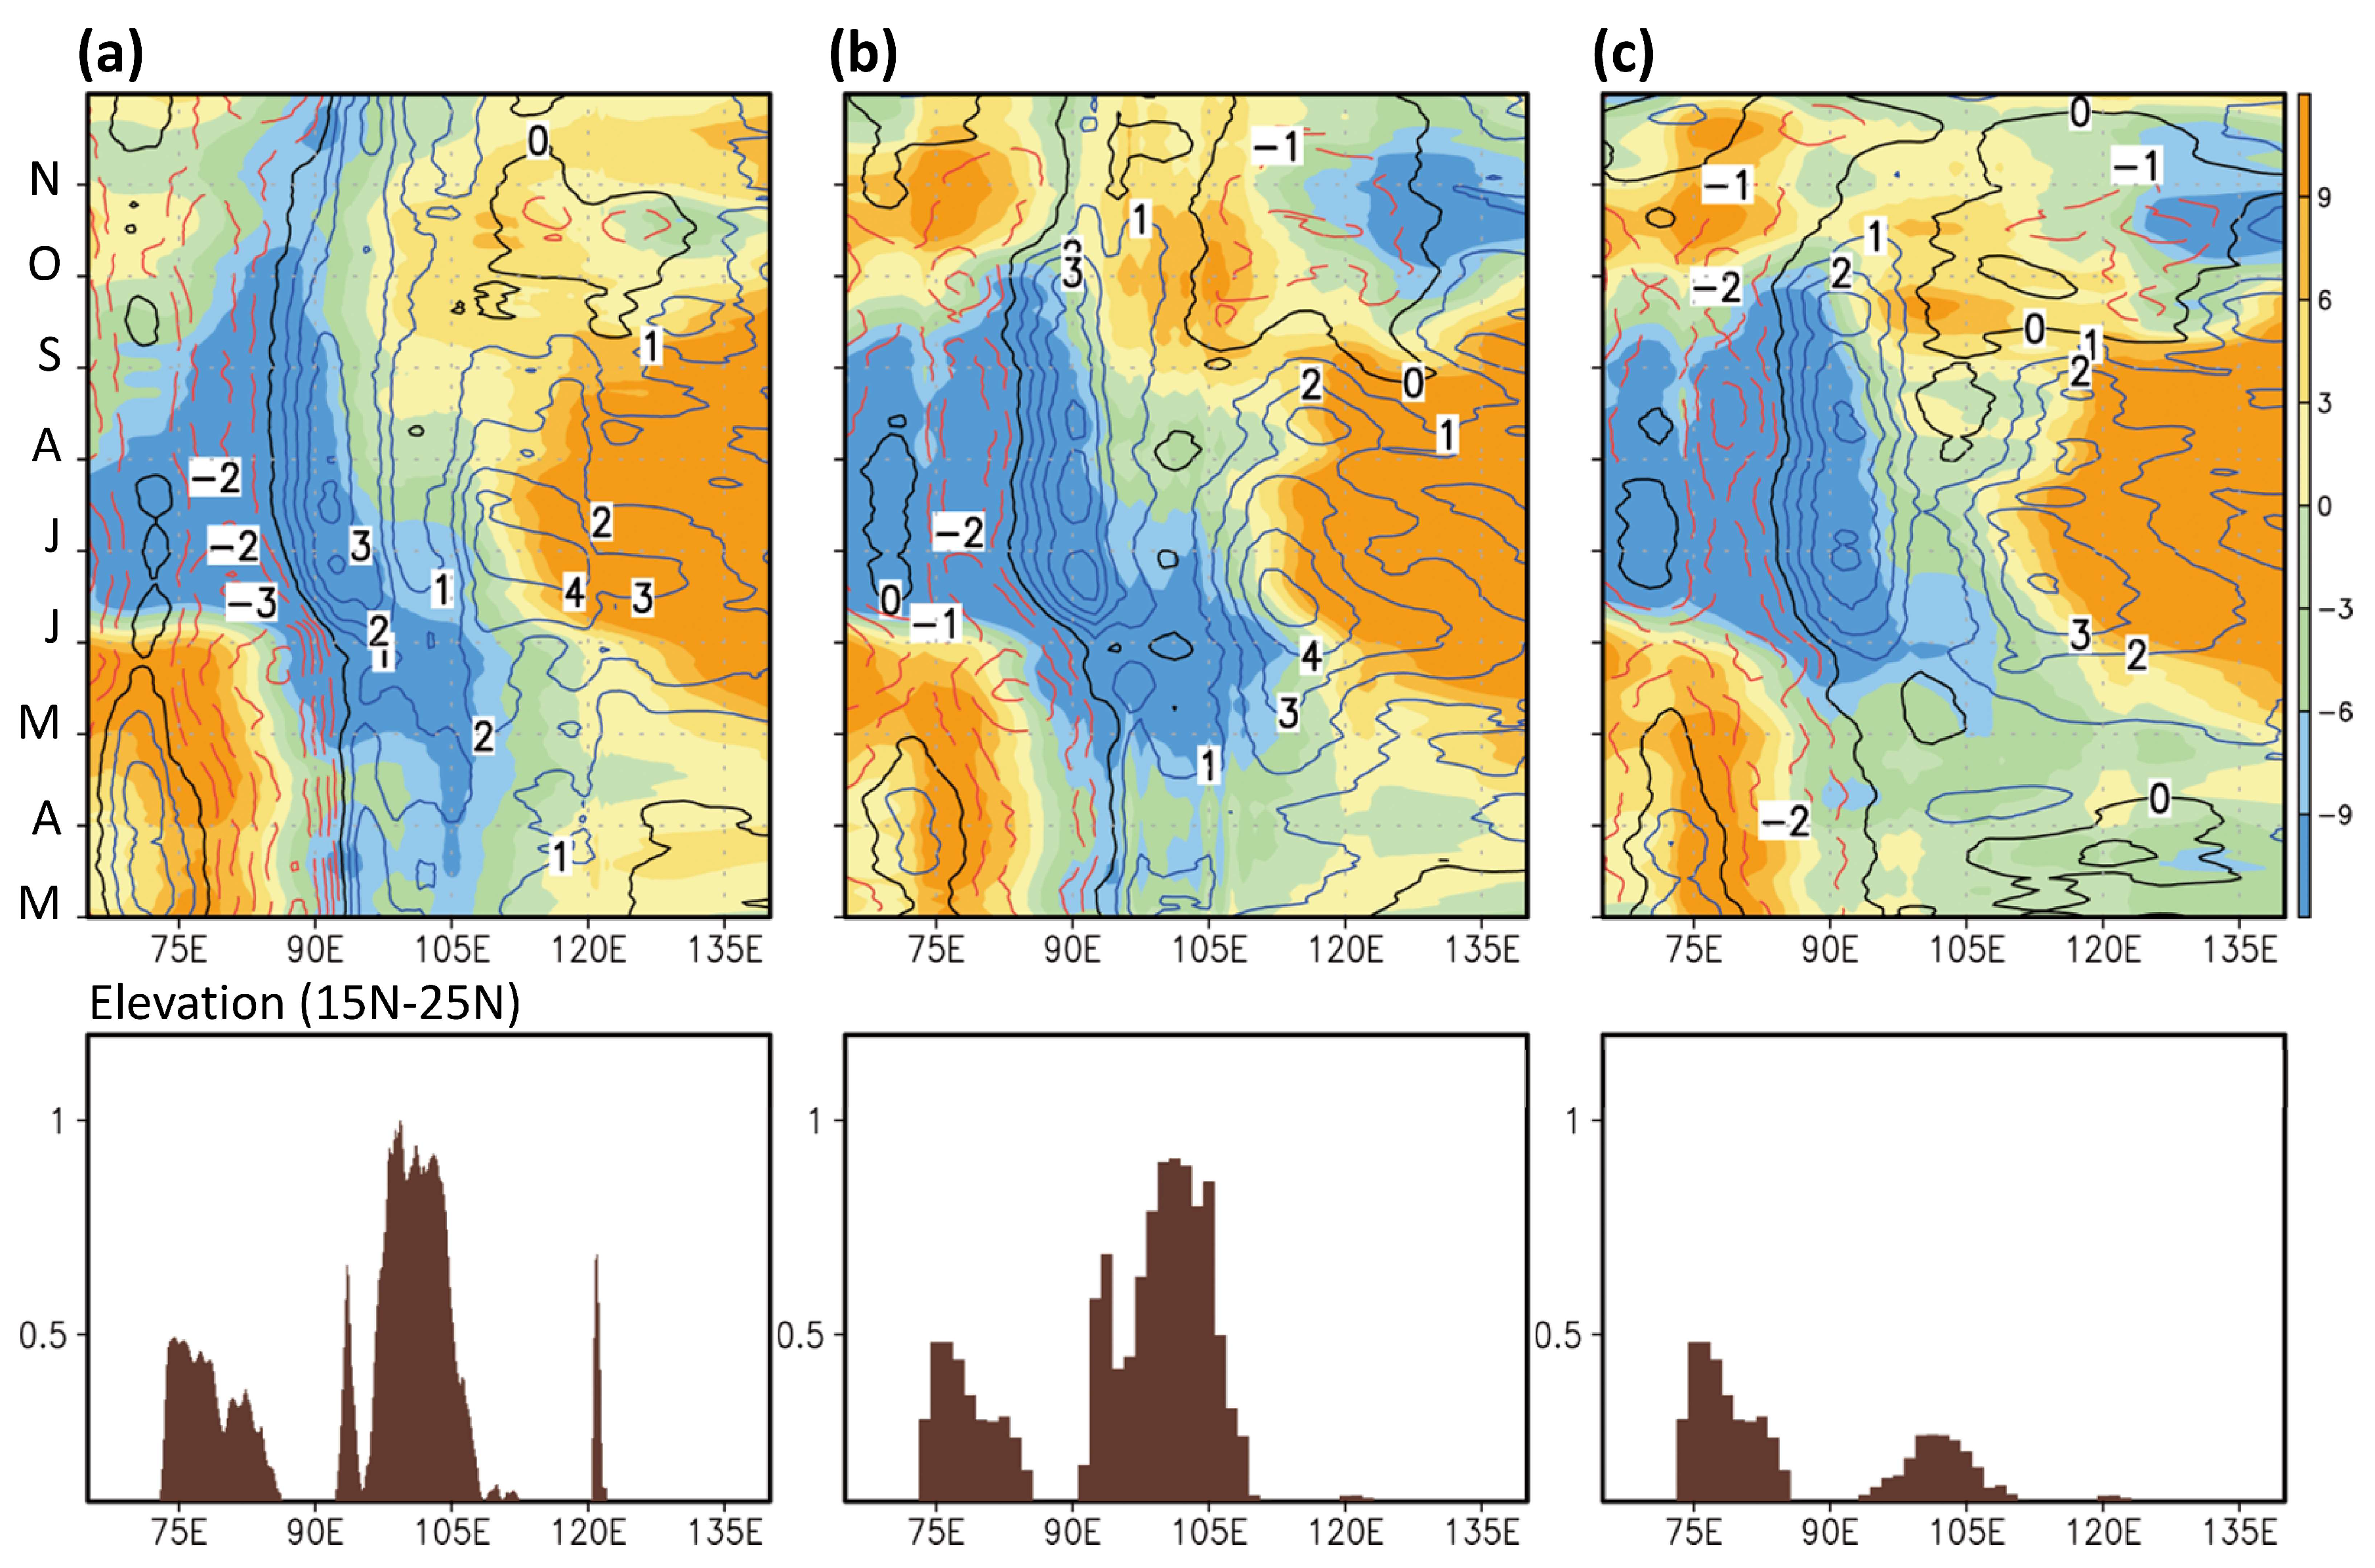
Previous studies have indicated that the seasonality and regional characteristics of the Asian summer monsoon can be effectively simulated by the CAM [
28]. However, as shown in
Figure 2a, the 1° topography in a CAM/SOM control simulation does not resolve the Arakan Yoma and Annamese Cordillera. Two simulations were conducted to test the role of the Indochina Peninsula topography in the simulation of seasonal evolution. The “AA” simulation, conducted by including the Arakan Yoma and Annamese Cordillera (
Figure 2c), suggests that the subseasonal details of the monsoon can be simulated more realistically than in the control simulation (
Figure 2b) [
29]. However, the coarse resolution should not be the only reason of the model biases; biases contributed by parameterizations are not well understood. To further explore the topographic effect of the Indochina Peninsula, the “IP0” simulation was conducted, which primarily included the Yunnan–Guizhou Plateau and the downstream narrow mountains, with the height of the region 90° E–110° E, 10° N–25° N being reduced to 100 m (
Figure 2d). The comparison of the AA and IP0 simulation results provide insight into the role of the Indochina Peninsula topography in seasonal evolution.
3. Seasonal Migration of Westerly Winds, Subtropical Highs, and Asian Summer Monsoons
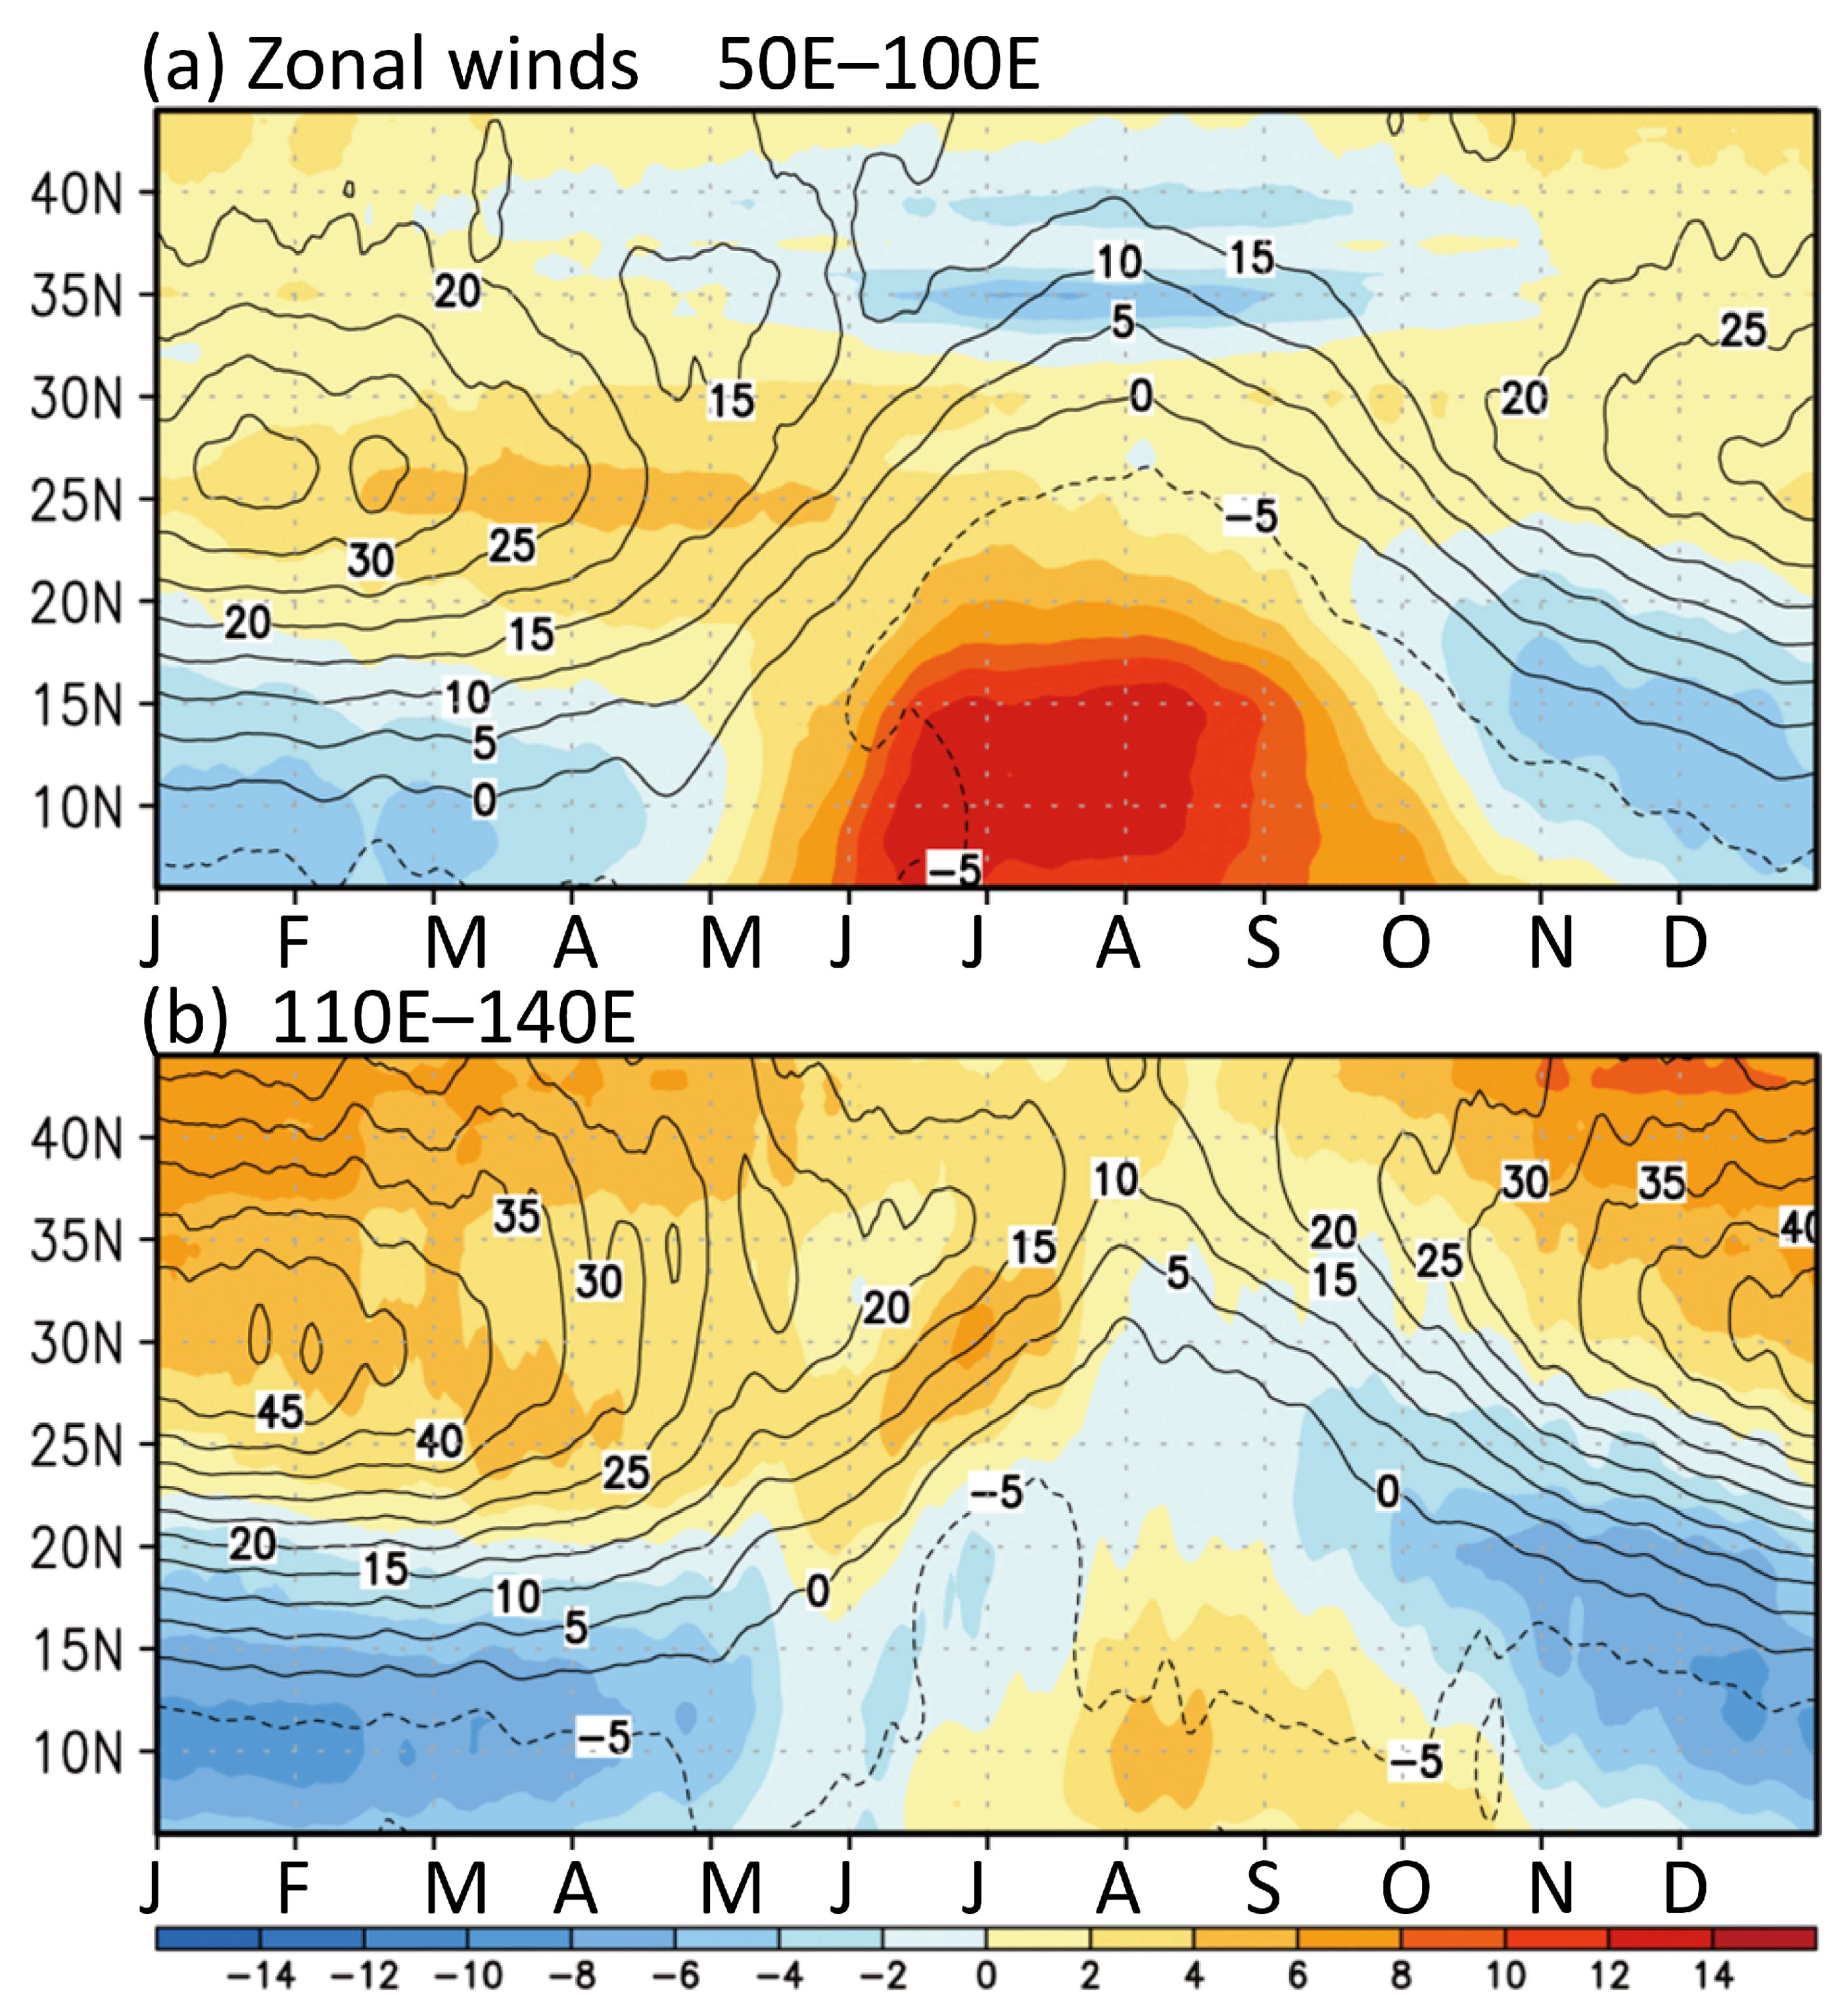
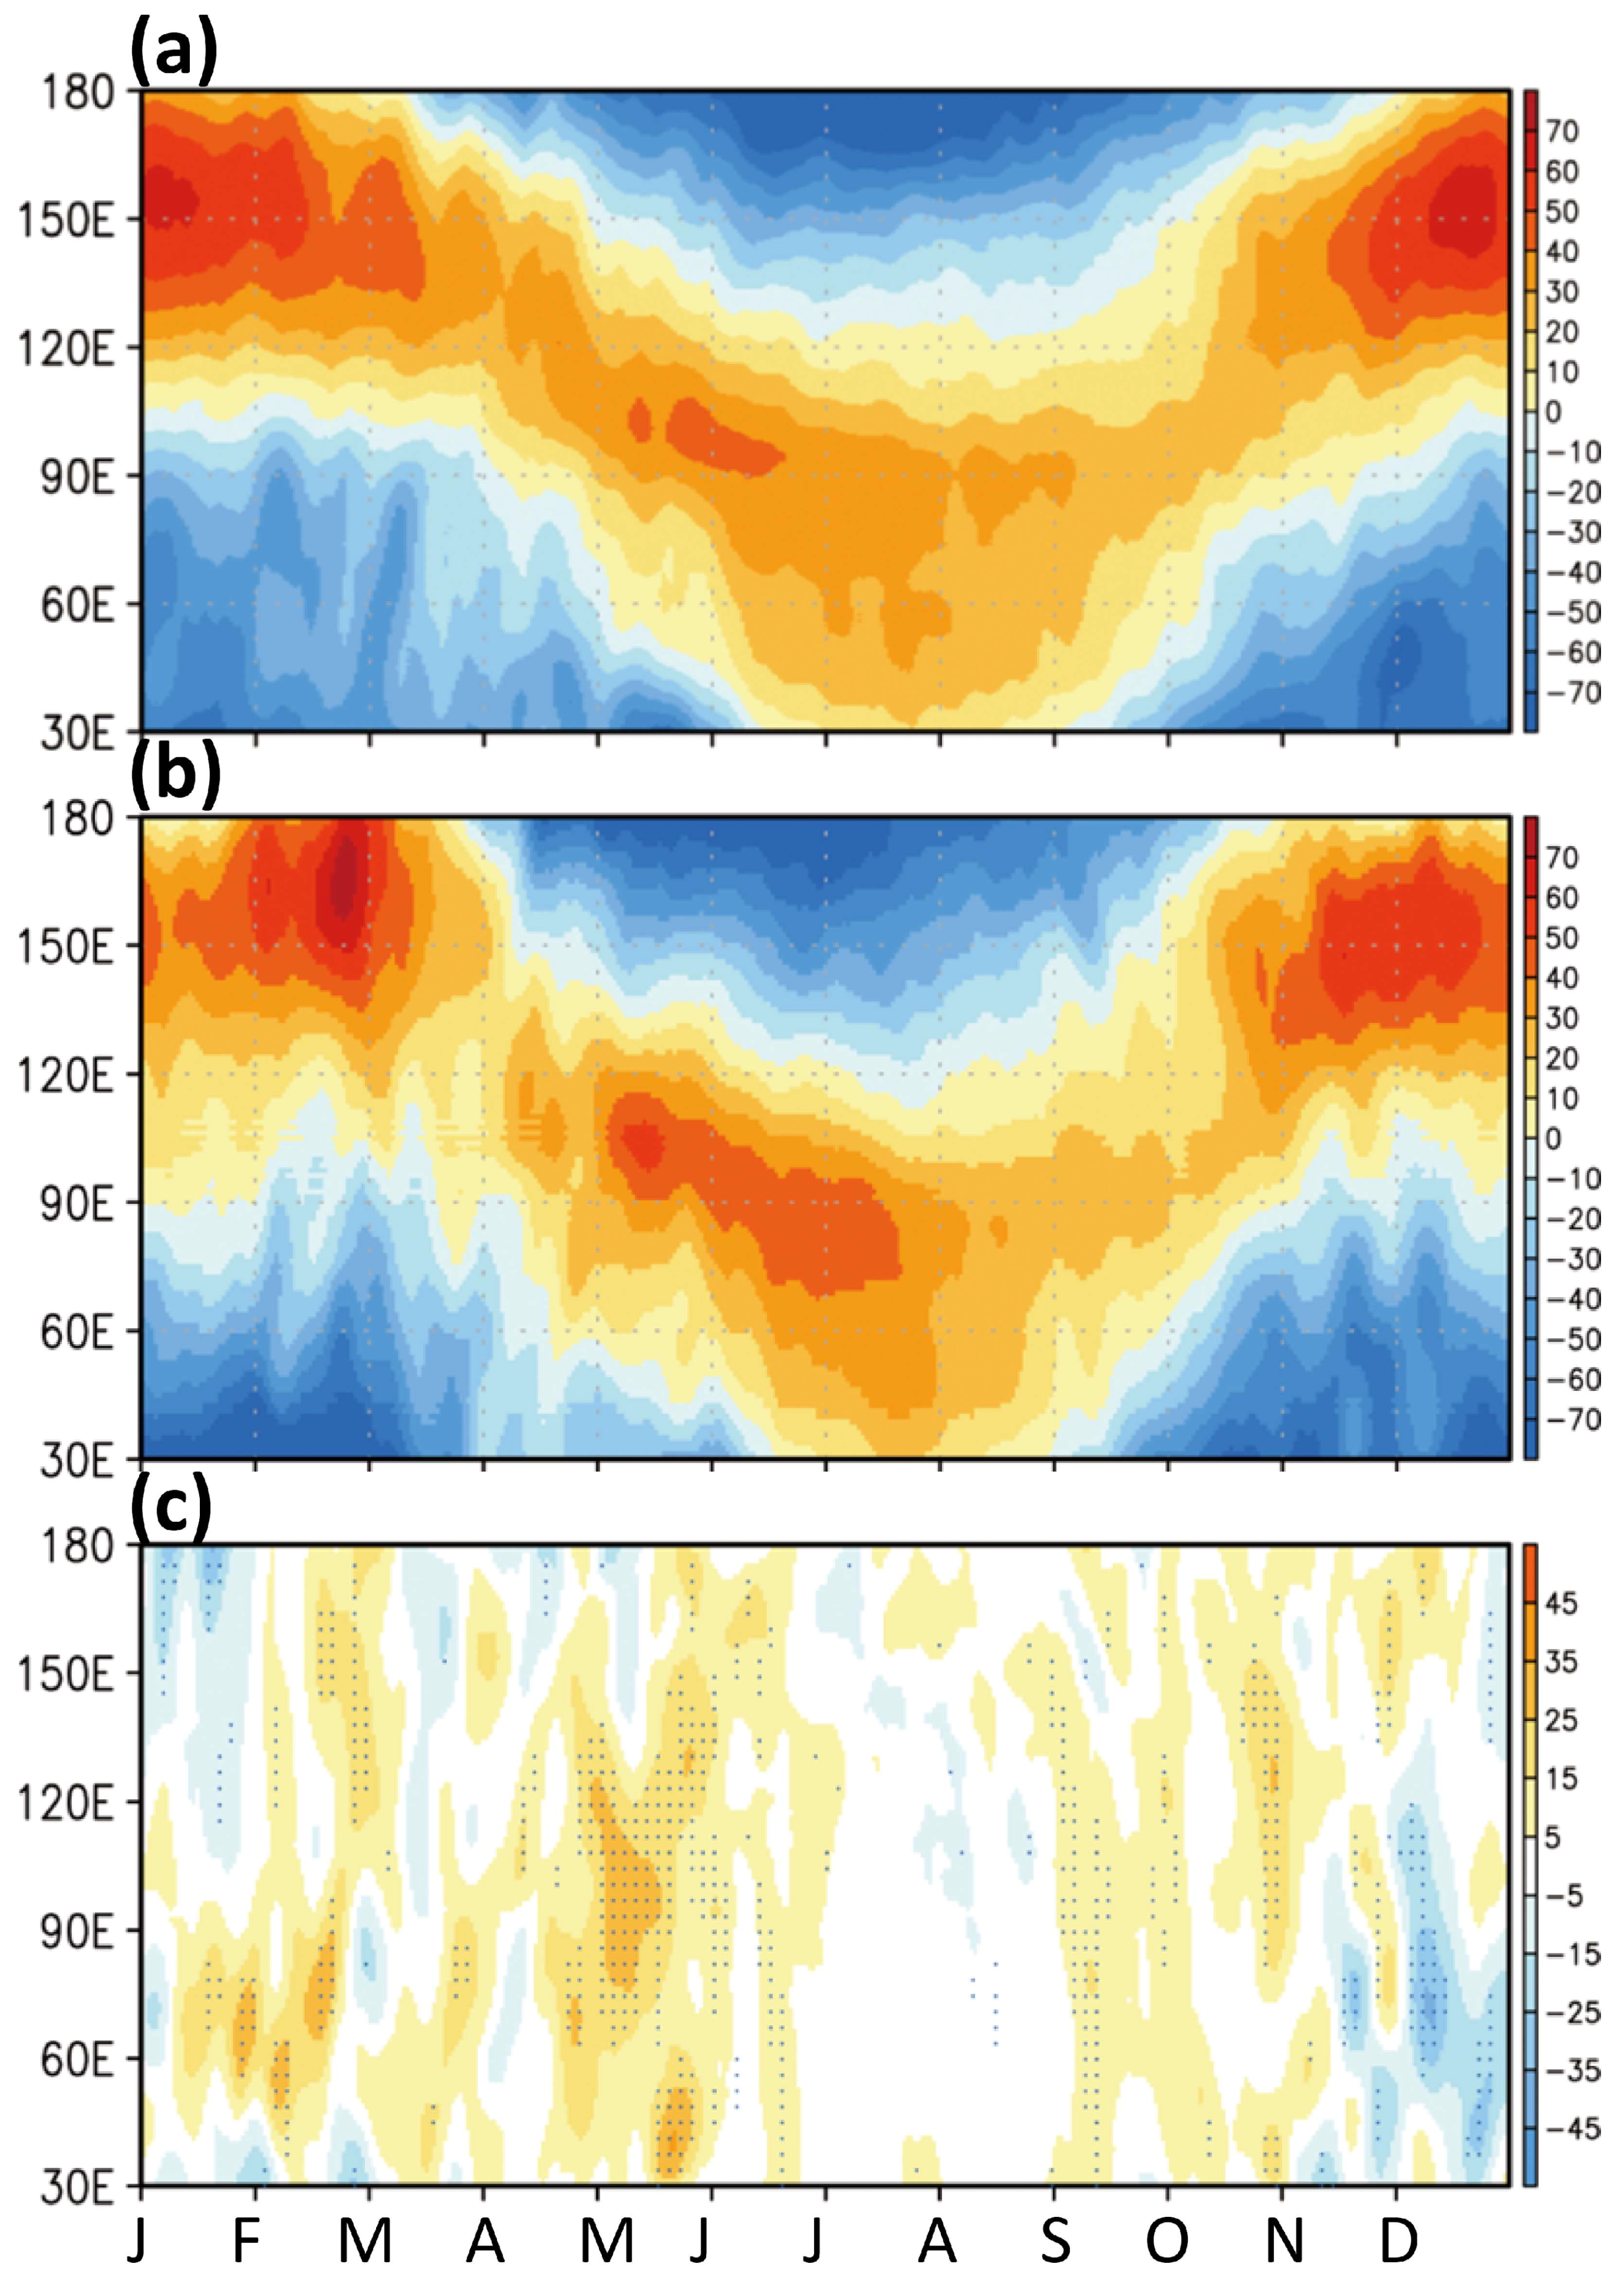
This section examines the spring-to-autumn seasonality of the Asian summer monsoon regions and focuses on asymmetric seasonal evolution of the westerly winds and subtropical highs. As observed in
Figure 3, the westerly wind bursts into the lower troposphere, corresponding to the summer monsoon onset in South Asia, East Asia, and the subtropical WNP. In the early summer monsoon over South Asia (May–June, 50° E–100° E), the northward advancement of the lower tropospheric monsoonal westerly (color shadings,
Figure 3a) competes with the mid-to-upper tropospheric westerly (contour lines,
Figure 3a) over the southern Tibetan Plateau; the latter westerly weakens with the onset of the former westerly (over the latitude around 25° N), which corresponds with the beginning of the summer monsoon. By contrast, in the East Asia–WNP (110° E–140° E,
Figure 3b), the vertical westerly coupling (i.e., lower-level westerly along the northern flank of the WNP high and upper-level westerly jet stream) is a control factor of the Meiyu-Baiu [
29,
38]. In both South Asia (
Figure 3a) and the East Asia–WNP (
Figure 3b), the mid-to-upper tropospheric easterly reaches its northern end in late July (contour line u = 0), thereafter retreating, with an approximately symmetric seasonal variation. Nevertheless, the strength of the lower tropospheric westerly suggests a retreat of the South Asian and the WNP summer monsoons in September–October. From
Figure 3b, the lower tropospheric easterly is observed to exist south of 20° N in spring, whereas, in autumn, it is located further north than 20° N, indicating that seasonal variation of the lower tropospheric circulation (but not the mid-to-upper tropospheric circulation) is considerably asymmetric in the Asian monsoon regions.
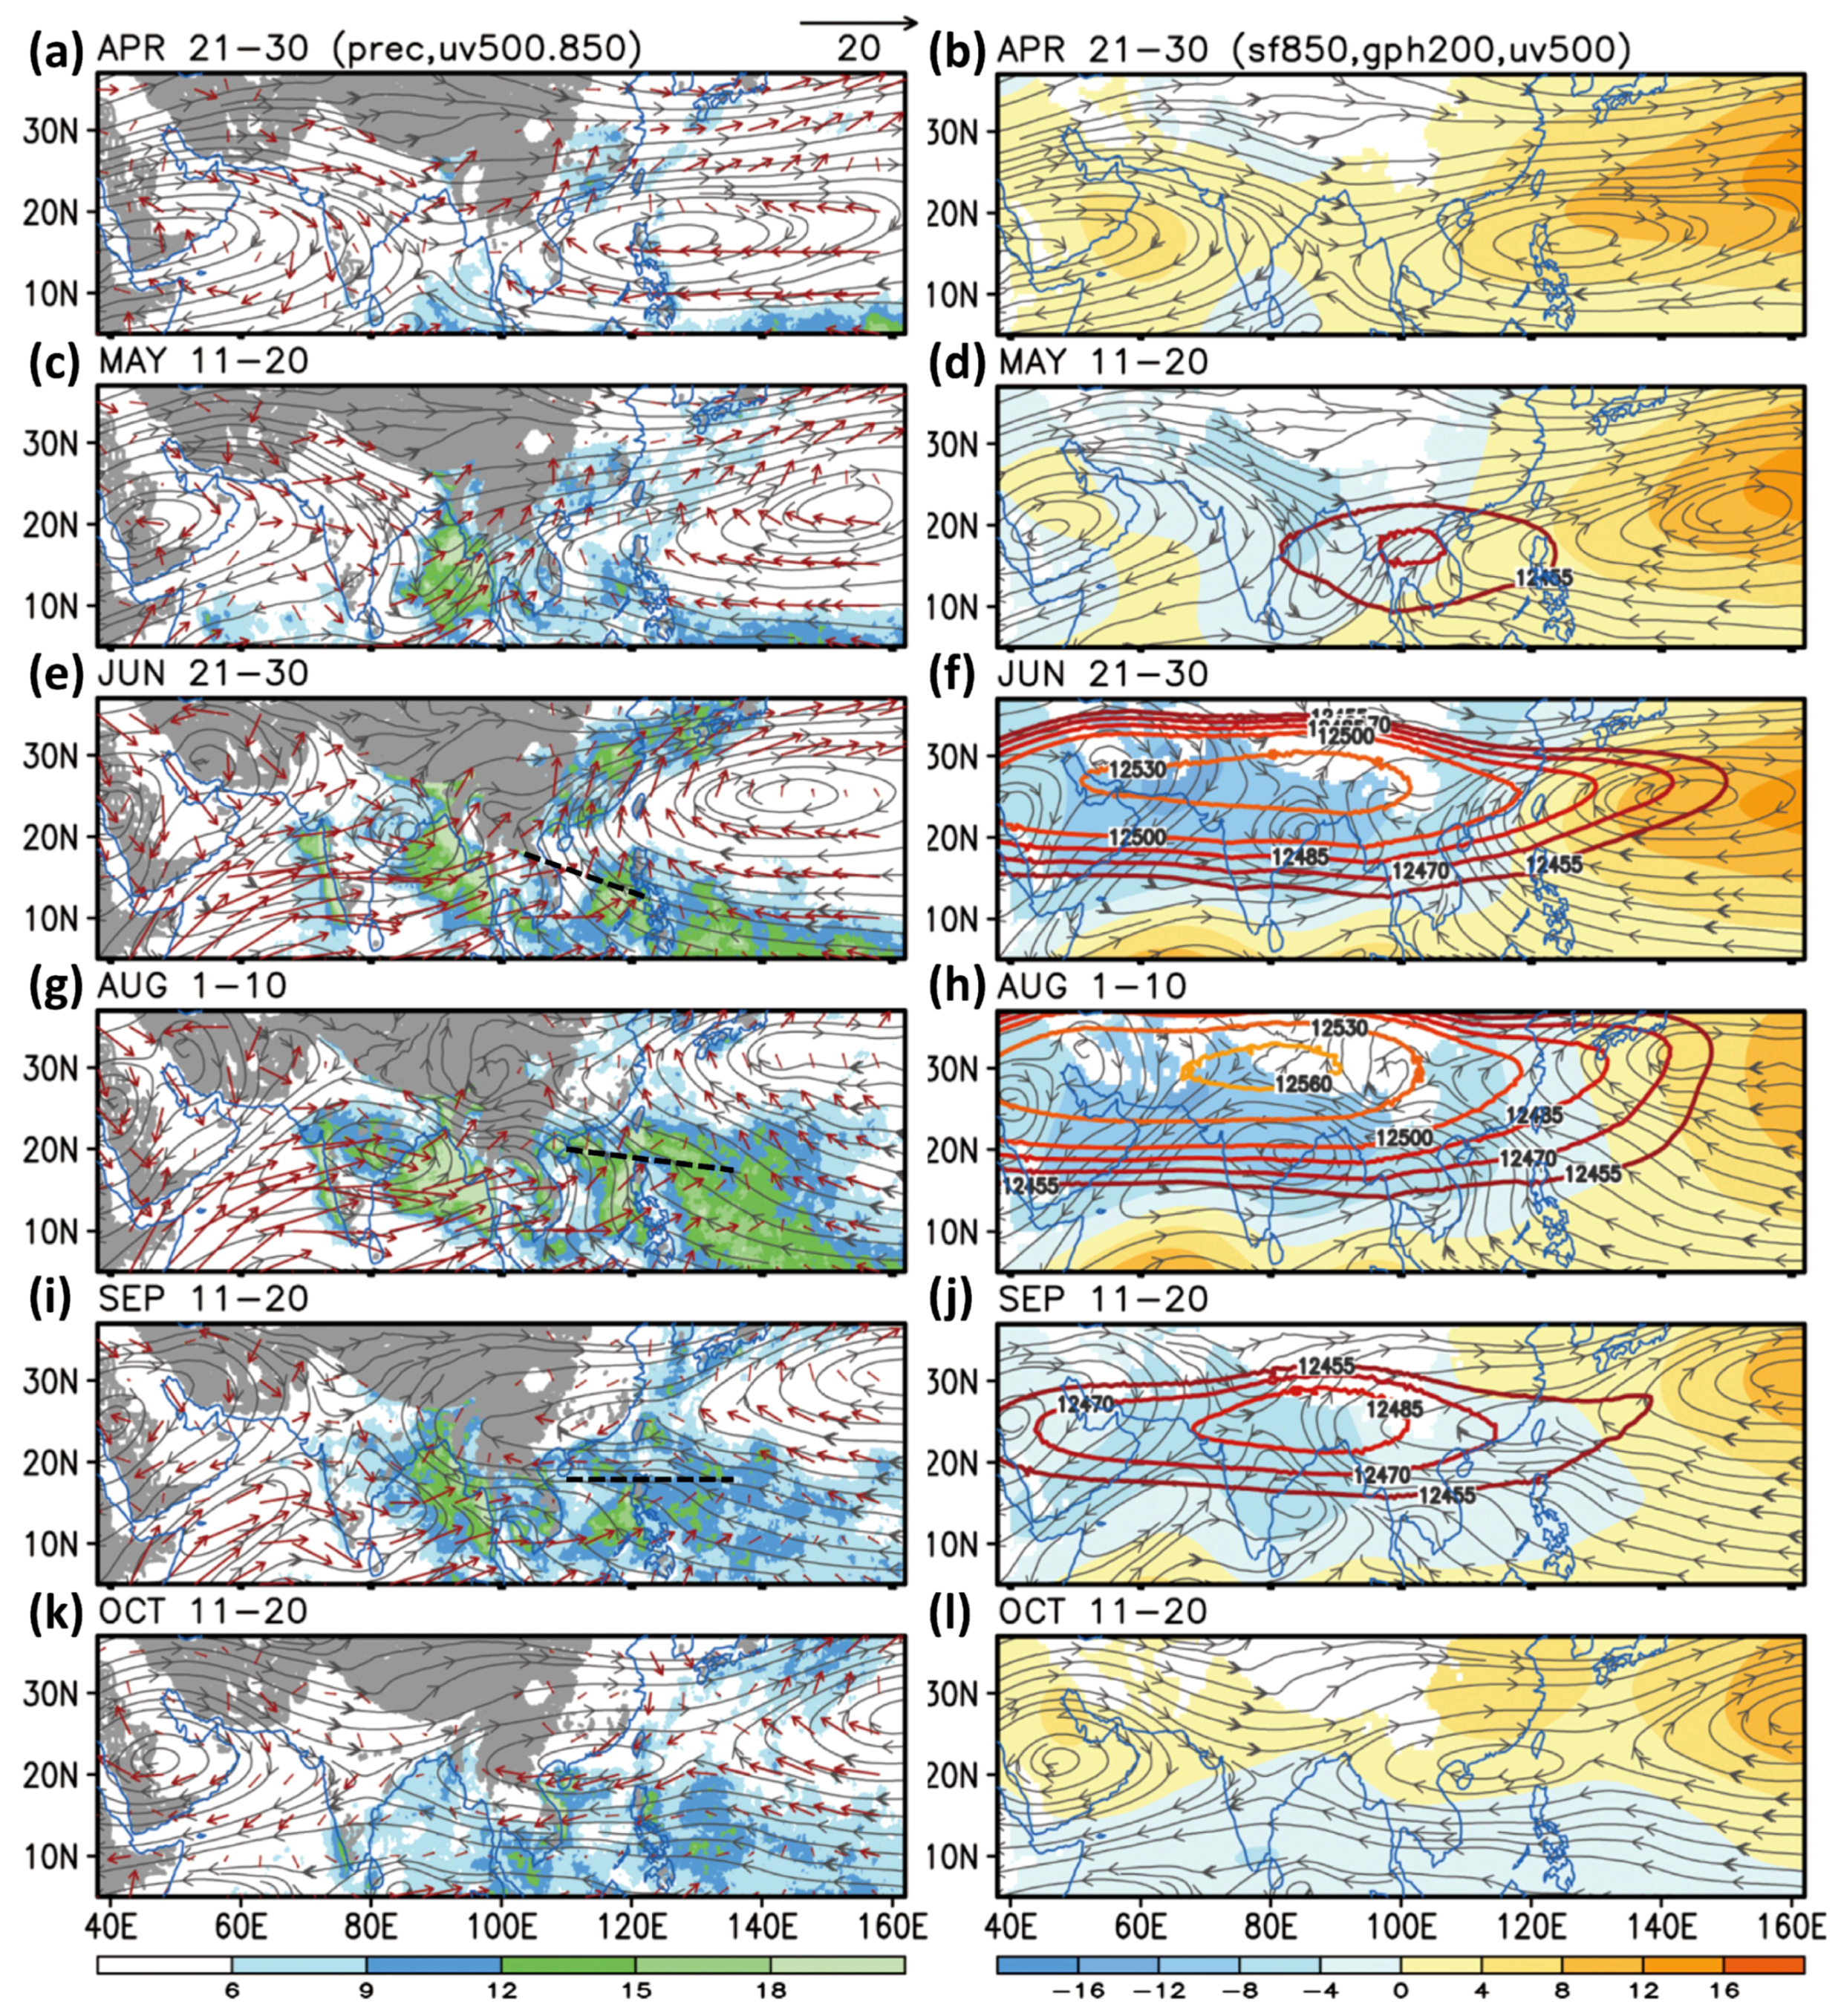
Figure 4 shows ten-day averaged wind, geopotential height, and precipitation, illustrating details of the subseasonal variation from April to October. In late April (
Figure 4a,b), the subtropical high belt (10° N–20° N) splits slightly in the east-west direction because of an increase in atmospheric heating over the Indochina Peninsula and southern Bay of Bengal [
5]. A couple of anticyclones form in the lower-to-middle troposphere (one each in the west and east of the Bay of Bengal), corresponding to the splitting of the subtropical high belt. The development of the anticyclone in the west of the Bay of Bengal strengthens the northerly winds over India, whereas the development of the anticyclone in the east of the Bay strengthens the southerly winds over East Asia and supports the East Asian spring rains. In mid-to-late May (
Figure 4c,d), the splitting of the subtropical high belt enlarges because of the establishment of the Bay of Bengal monsoon trough. The vertical coupling of the lower tropospheric westerly, midlevel trough, and upper tropospheric high accelerates the first Asian summer monsoon transition [
28]. Furthermore, the topographically driven trough effect contributes to the vertical coupling of the westerly over subtropical East Asia in the early Meiyu-Baiu [
29]. In late June (
Figure 4e,f), the monsoons in South and East Asia reach a mature stage and northward migration of the overall Asian early summer monsoons occurs almost simultaneously [
10].
In August, the East Asia–WNP enters another monsoon phase, as characterized by the deepening of the tropical WNP monsoon trough over the South China Sea and northward shift of the WNP high in the lower troposphere (
Figure 4g,h). The broad-scale atmospheric heating shifts southeastward, corresponding to the WNP monsoon onset (the pattern is similar to precipitation; not shown in the figure). The upper tropospheric anticyclonic circulation expands zonally, which is associated with the broad-scale development of the subtropical monsoons from West Africa, South Asia, and subtropical WNP; the South Asian monsoon weakens [
18]. In late September (
Figure 4i,j), the monsoon-associated midtropospheric cyclonic circulation and lower tropospheric westerly in South Asia retreat with a strength much weaker than that during the mature phase of the monsoon. In this period, the lower tropospheric WNP monsoon trough remains strong regardless of the southward retreat of the midlevel high (the high ridge is located over Taiwan). Corresponding to the southward shift of the WNP high, the easterly-driven precipitation is considerable over Southeast Asia in late October (
Figure 4k,l). Instead of the westerly having control, the easterly has a strong effect in maintaining the Southeast Asian precipitation after the summer monsoon season.
In May–September, the meridional migration of the upper tropospheric South Asian high is identical to that of the lower tropospheric WNP high (
Figure 4c–j). Intriguingly, the lower tropospheric subtropical high belt splits in an east-west direction in late April over the Bay of Bengal, uniting in late October over India; the location difference indicates asymmetric seasonal migration of the monsoon circulation. Studies have demonstrated that the existence of the Indochina Peninsula topography modulates the monsoon subseasonal variation [
28,
29]; these studies have indicated a topographic effect on the late-summer monsoon transition over the East Asia–WNP in addition to the mountains-induced trough effect, which can accelerate the early summer monsoon advancement.
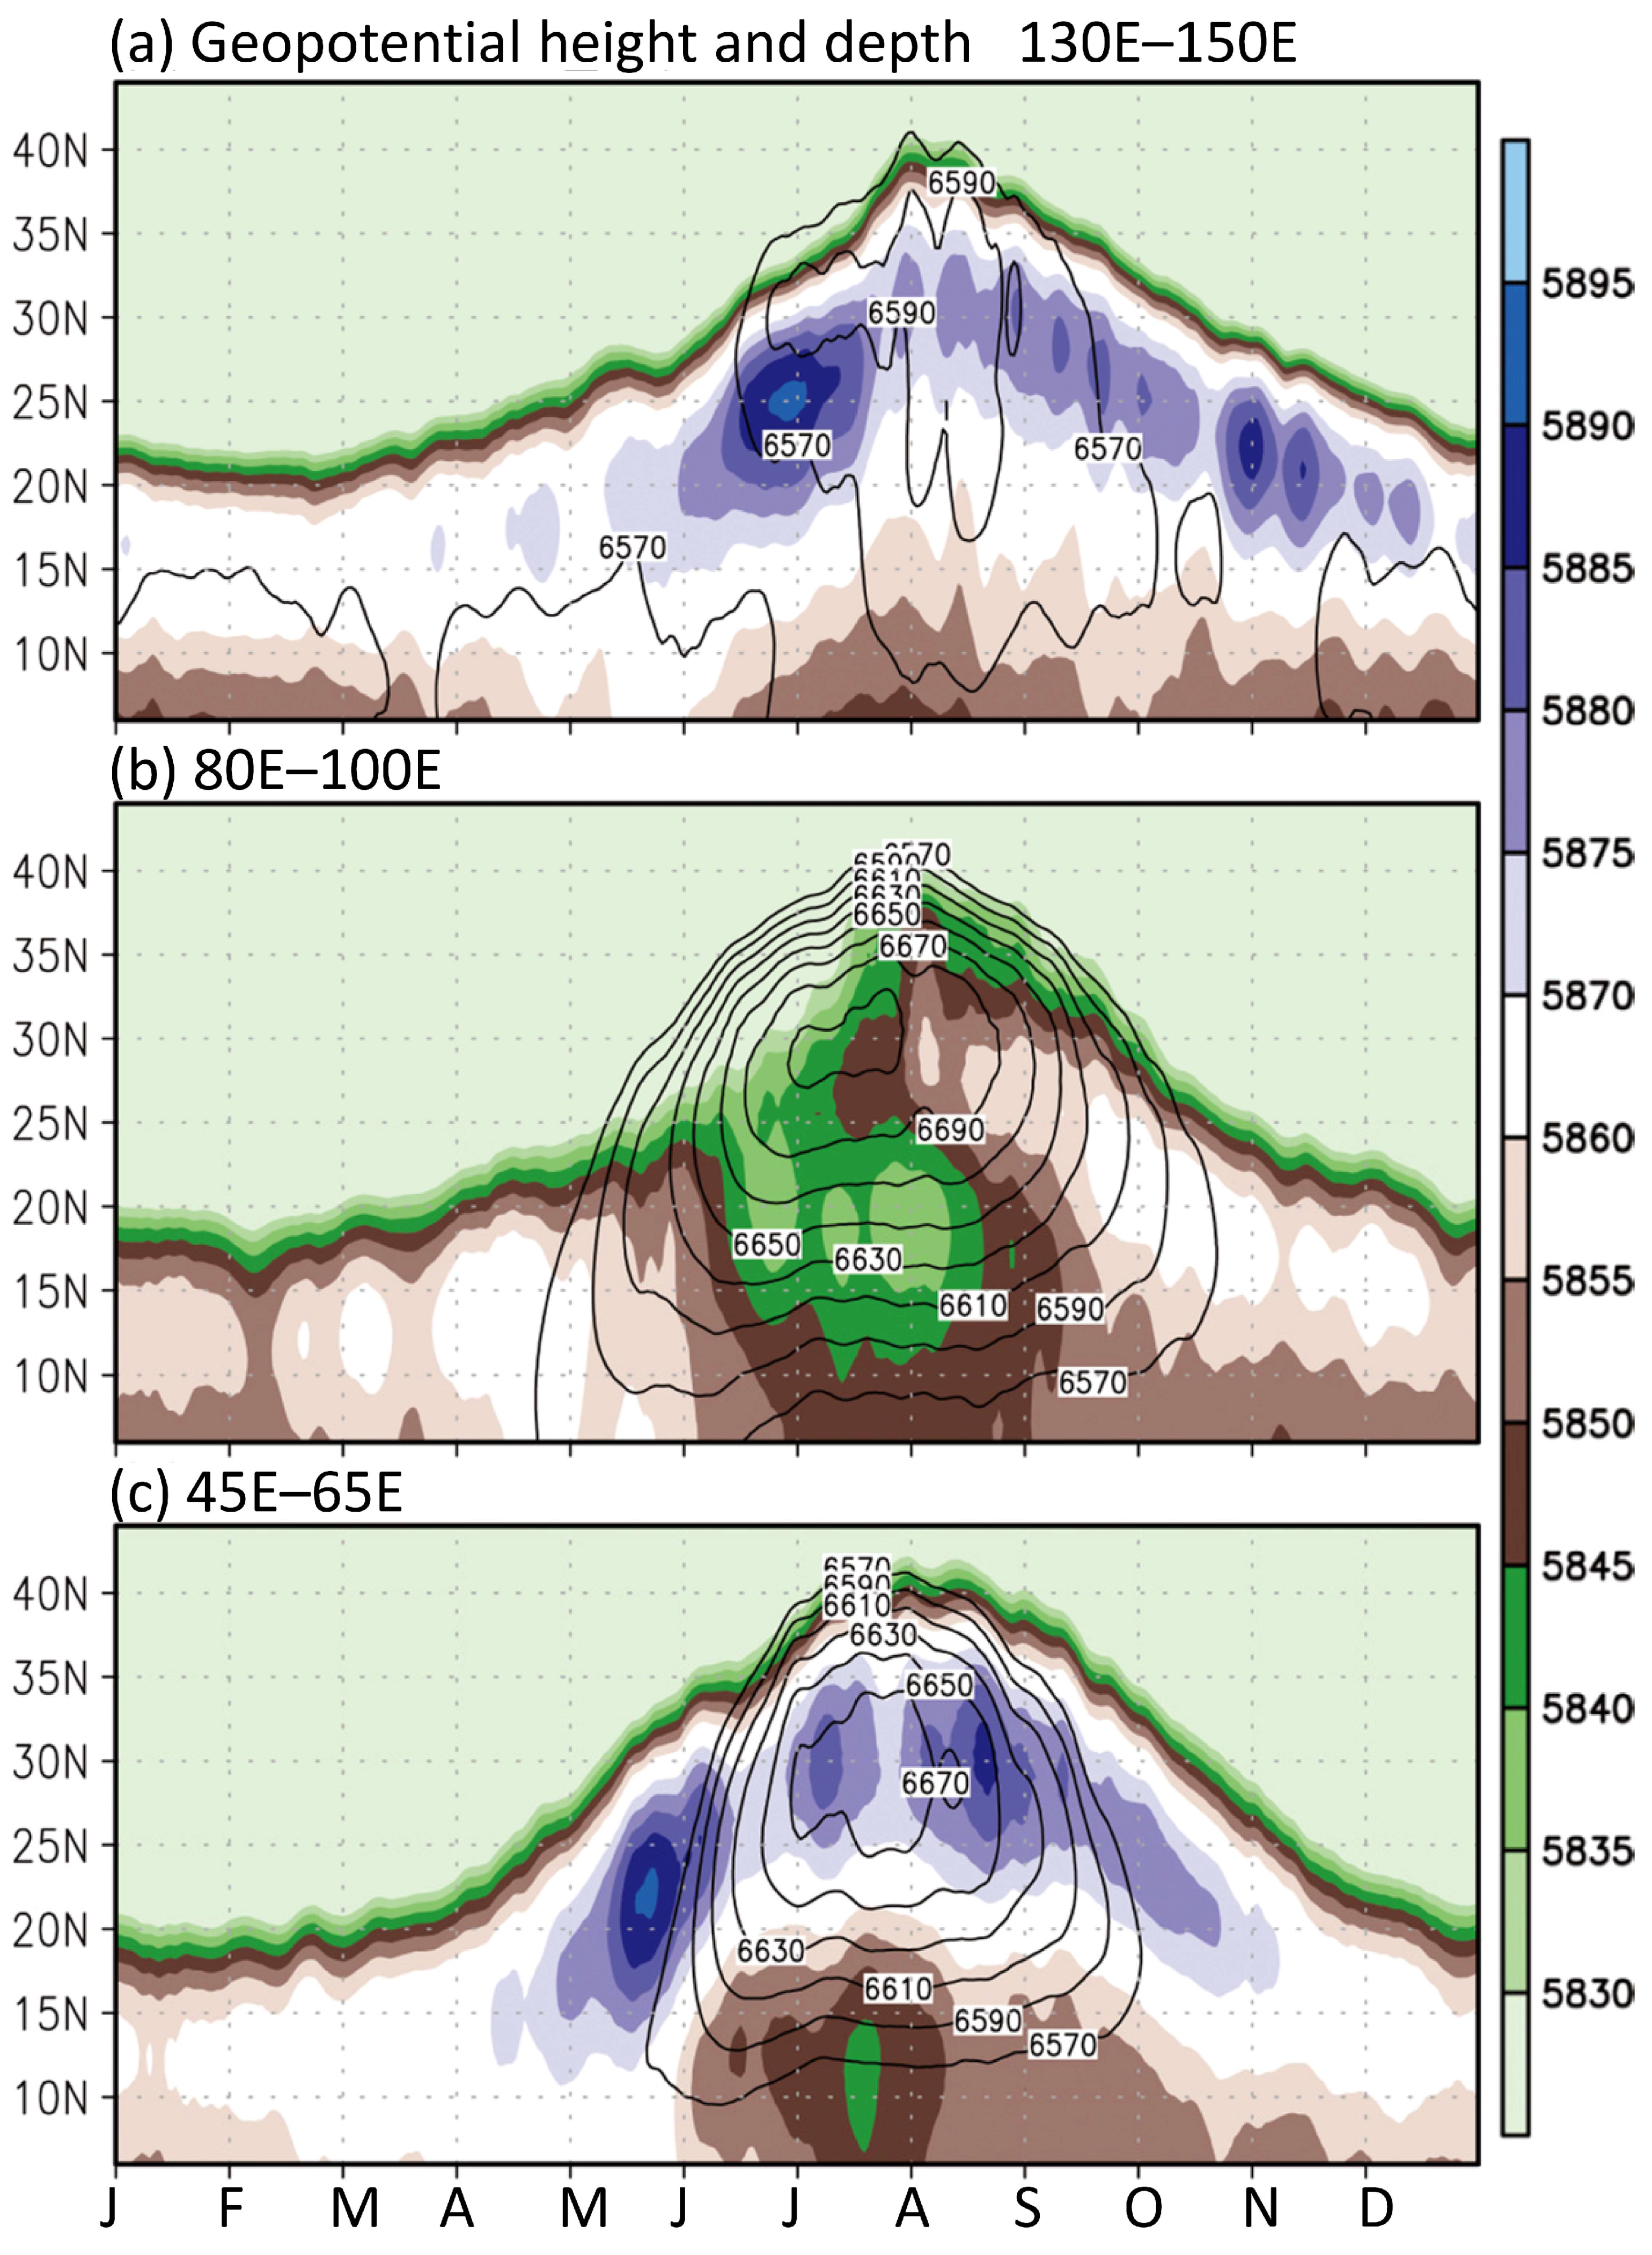
The seasonal variation of geopotential height at 500 hPa and upper-level geopotential depths in 200–500 hPa over the WNP (130° E–150° E), South Asia (80° E–100° E), and West Asia (45° E–65° E) is displayed in
Figure 5. In July, the South Asian high (contours in
Figure 5) is well established with the largest value for the upper-level geopotential depths (shadings in
Figure 5) along 30° N on a broad scale. A watershed in the seasonal evolution of the heights is clearly observed for the end of July (
Figure 5), consistent with the peak timing of the mid-to-upper tropospheric zonal wind (
Figure 3). In contrast to the rapid and stepwise changes in the midlevel geopotential heights in May–July, for example, a rapid decrease of geopotential heights at 500 hPa in South Asia (south of 25° N) that is associated with the development of the monsoon low (
Figure 5b), and for the stage-wise development of the WNP high (
Figure 5a), the mid-to-upper–level geopotential depths around 25° N gradually diminish from August. The late-summer-to-autumn evolution of the broad-scale monsoon circulation is characterized by a gradual southward shift of the midlevel high. Note that the seasonal asymmetry in geopotential heights is less obvious in West Asia (
Figure 5c). Since the focus of this study is East Asian seasonality, we reserve this interest point for a further study. In the next section, we investigate the seasonality of the Asian summer monsoons by removing the Indochina Peninsula topography.
4. Topographic Effects of the Indochina Peninsula on Seasonal Variation: Monsoon Onset Versus Retreat
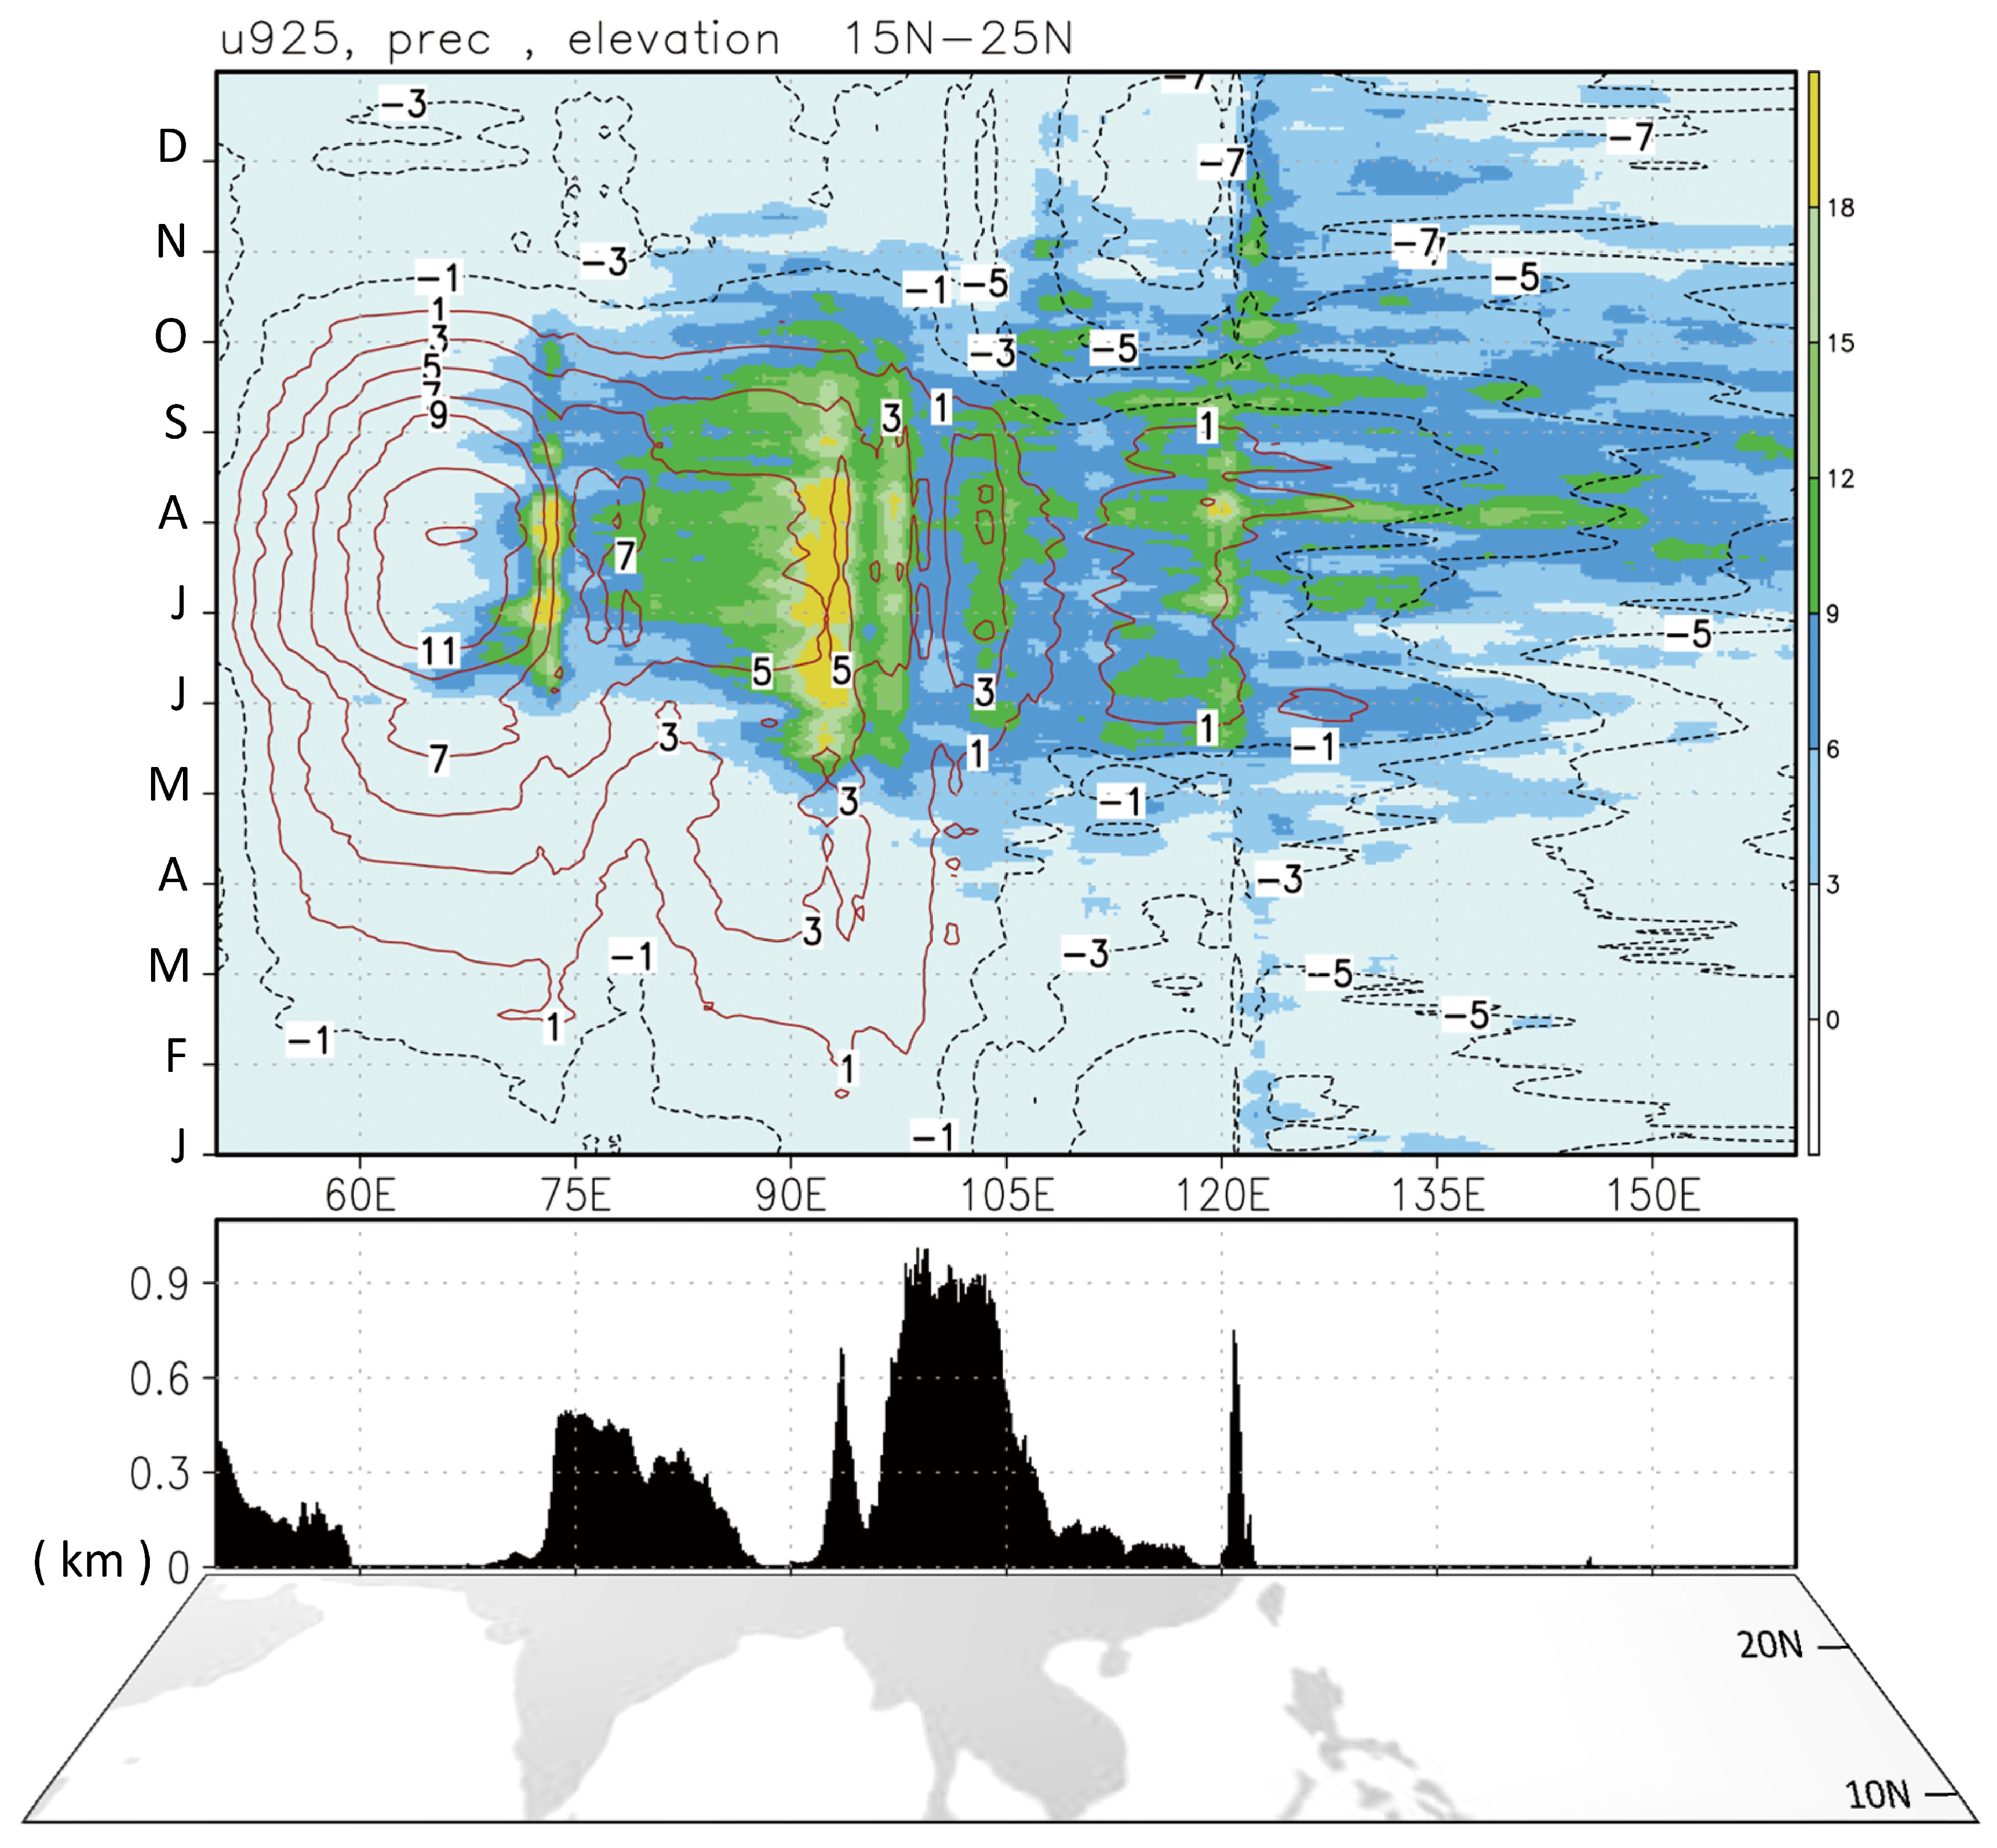
Analysis of satellite observations has suggested that heavy precipitation is topographically dependent in the subtropical Asian monsoon regions [
39]. Whether under the control of the westerly or easterly winds, topographically anchored precipitation is prominent in 15° N–25° N during May–October (
Figure 6). Driven by the summer monsoon westerly (including southwesterly), the heaviest precipitation occurs in the coastal region of the Indian Subcontinent along the Western Ghats and on the Indochina Peninsula along the Arakan Yoma. The earliest Asian summer monsoon onset is May over the Indochina Peninsula [
40,
41], which corresponds to the splitting of the lower tropospheric South Asian–WNP subtropical high belt, the establishment of the Bay of Bengal monsoon trough, and the genesis of the upper tropospheric South Asian high atop the monsoon trough (
Figure 4c,d). The topography-wind-precipitation interaction has been considered as a driving force in the vertical circulation coupling [
28].
The westerly onset in the lower troposphere of the South China Sea occurs in mid-to-late May (contours in
Figure 6), immediately after the establishment of the Bay of Bengal monsoon trough (
Figure 4c,d). By the end of August, an easterly reoccurs over the South China Sea (110° E–120° E in
Figure 6), much earlier than that over the Bay of Bengal (85° E–95° E in
Figure 6). Precipitation over the east of the Indochina Peninsula in September is easterly driven, in contrast to the westerly driven precipitation over the Bay of Bengal and India (
Figure 6).
Figure 7a shows the simulation conducted when the topography of the narrow mountains in the Indochina Peninsula was included (AA simulation); the result indicates the topographically associated precipitation and abrupt changes in the lower tropospheric westerly (refer to Wu and Hsu [
29] for more details). By contrast, in the IP0 simulation with a flat topography, less precipitation occurs over the Indochina Peninsula (
Figure 7b), and the westerly gradually expands eastward in May and retreats gradually in September. The sharp change in zonal circulation disappear when the Indochina Peninsula topography is flattened. The results of
Figure 7 suggest again that the topography is crucial for the simulation of precipitation over the Asian monsoon region.
We further examine the lower tropospheric meridional winds and geopotential heights over the Indochina Peninsula (
Figure 8) to check the trough effects of the mountains; as highlighted in Wu, Hsu, and Chou [
28], the existence of the Arakan Yoma has substantial effects on driving the midlevel trough in late May over the Bay of Bengal–Indochina Peninsula (
Figure 8a,b show northerly winds in the west of the Arakan Yoma and southerly winds to the east of the mountains). The comparison of the AA and IP0 simulations suggests that the existence of the Yunnan–Guizhou Plateau and the downstream narrow mountains is a crucial element driving the early summer monsoon. When a flattened topography is imposed, the southerly winds disappear in May over the Indochina Peninsula (90° E–105° E,
Figure 8c); furthermore, the east-west contrast in geopotential heights over 90° E–105° E in May is much weaker than that observed in the AA simulation (
Figure 8a,b). In contrast to the modulation in the early-summer geopotential heights, the difference between the AA and IP0 simulations for late summer and autumn is negligible, although model biases in late summer–autumn conditions may be a challenge (compare
Figure 8a,b).
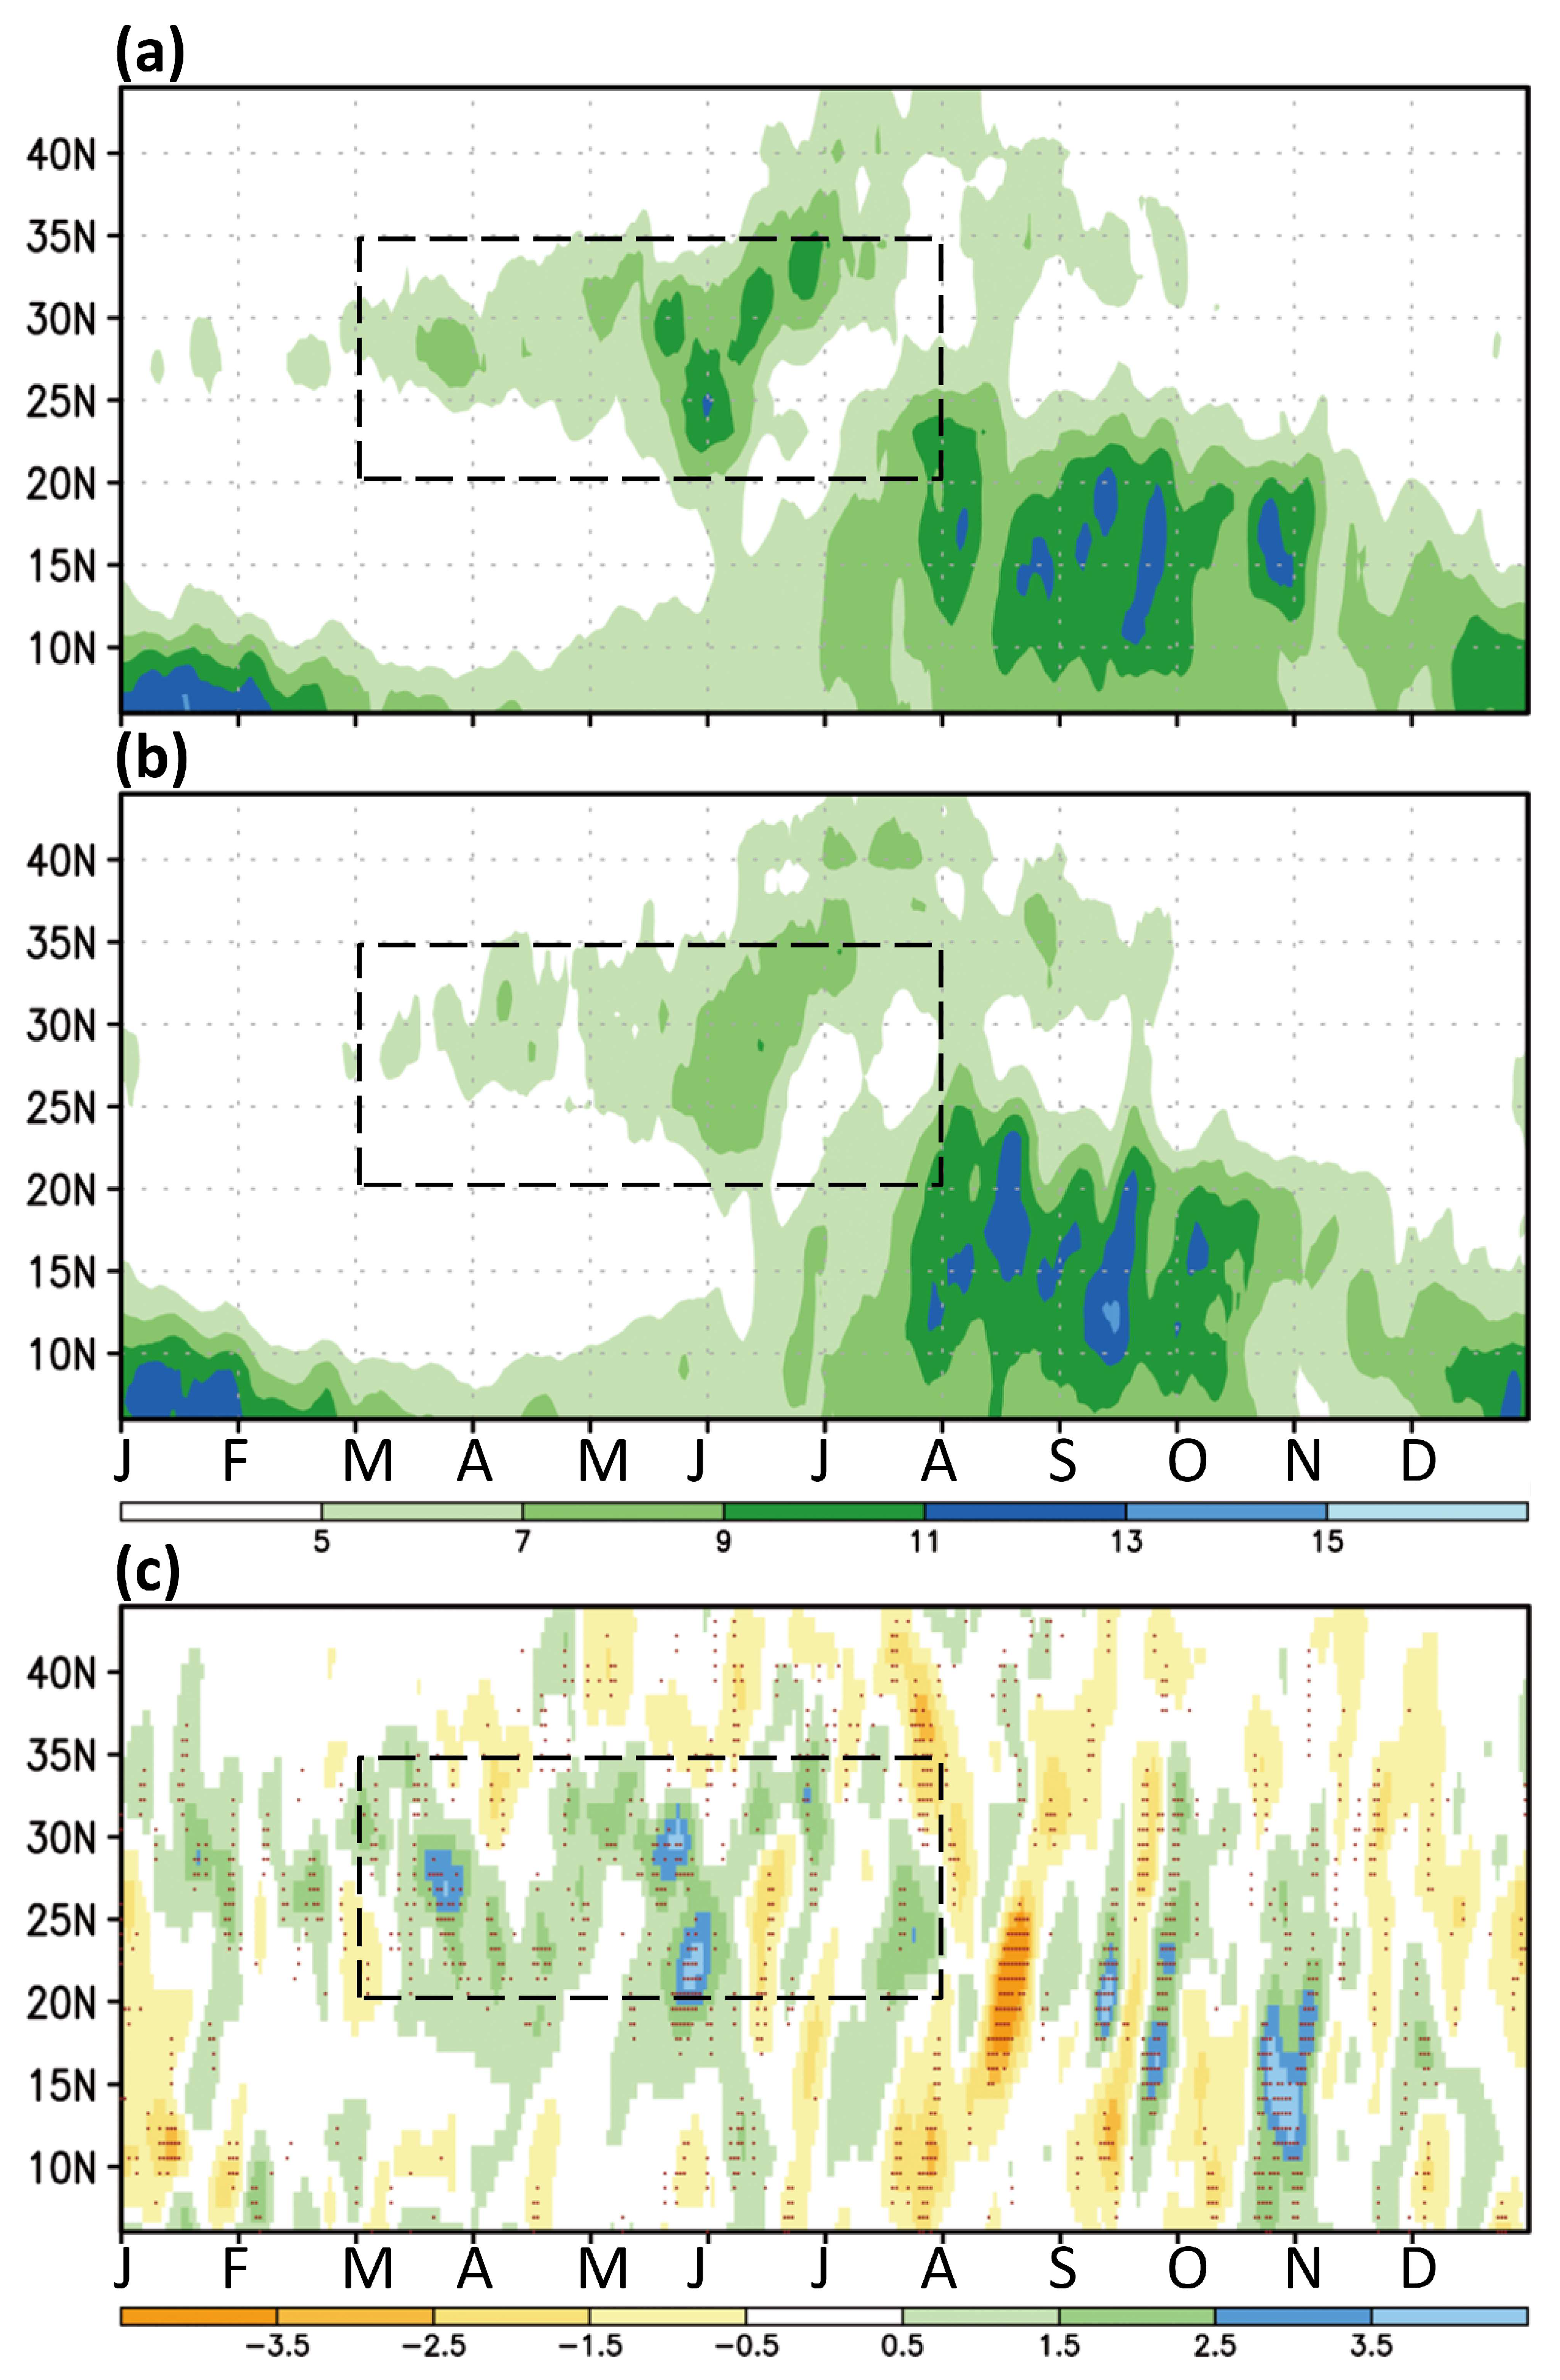
Figure 9 shows the seasonal variation in the simulated upper tropospheric geopotential heights at 200 hPa for 15° N–25° N (the eddy geopotential heights is shown by subtracting the zonal average in 30° E–180° E). Similar to the seasonal migration of the observed mid-to-upper tropospheric westerly winds (
Figure 3), the simulated eddy geopotential heights also represent symmetric seasonal evolution, with the high centered over the ocean in winter and over the Asian continent in summer. The most prominent contrast between the AA and IP0 simulations is for the early summer over 90° E–120° E (
Figure 9c), suggesting that the existence of the complex topography strengthens the upper level high, which is consistent with the large decrease in the lower level geopotential heights and increase in the southerly shown in
Figure 8.
To determine the overall influence on the monsoons, a commonly used Asian summer monsoon index was examined; this index (Webster-Yang index) is defined as the vertical wind shear between the 200- and 850-hPa levels averaged over the tropical northern Indian Ocean (0°–20° N; 40° E–110° E) [
42]. The monsoon, as measured by the wind-shear index, is 73% stronger in May in the AA compared with the IP0 simulations (from 4.8 m s
−1 to 8.3 m s
−1), but only 3% stronger in June (from 20.7 m s
−1 to 21.3 m s
−1). The index value of the AA simulation compared with that of the IP0 simulation is closer to the value obtained in the CFSR (8.1 m s
−1 in May and 23.3 m s
−1 in June). The topographic effect on strengthening the summer monsoon is considerable in May, suggesting a triggering of the Indochina monsoon on accelerating the first Asian summer monsoon transition.
We postulate that a latitude location near the tropics, where solar heating in April and May is strong, favors the early summer monsoon onset (the earliest in Asia) over the Indochina Peninsula. The topographic effect on driving the vertical circulation coupling over the Plateau accelerates the development of the continental monsoon. The lower tropospheric subtropical high belt east-west is found to split over the Bay of Bengal, corresponding to the deepening of the monsoon trough over the Bay. As shown in
Figure 4k, the subtropical high belt reunites in late October over India, not the Indochina Peninsula. The Indochina Peninsula may have secondary or minor control during the monsoon retreat process.
We now examine simulations of the dynamical stages of the East Asian precipitation (compare
Figure 10a,b with
Figure 1 for the model performance). Although the stage-wise development of precipitation remains visible in the IP0 simulation (
Figure 10b), the precipitation is greatly reduced compared with the AA simulation (
Figure 10c). The average of precipitation in March–July over the region, 110° E–140° E, 20° N–35° N (boxed region in
Figure 10), is 6.2 mm day
−1 in the AA simulation (
Figure 10a), and 5.5 mm day
−1 in the IP0 simulation (
Figure 10b) (5.8 mm day
−1 in TRMM,
Figure 1), indicating that the existence of complex topography over the Indochina Peninsula results in 12.7% (6.4% for the annual mean) more precipitation.
The large-scale contrasts driven by the complex topography are further shown in
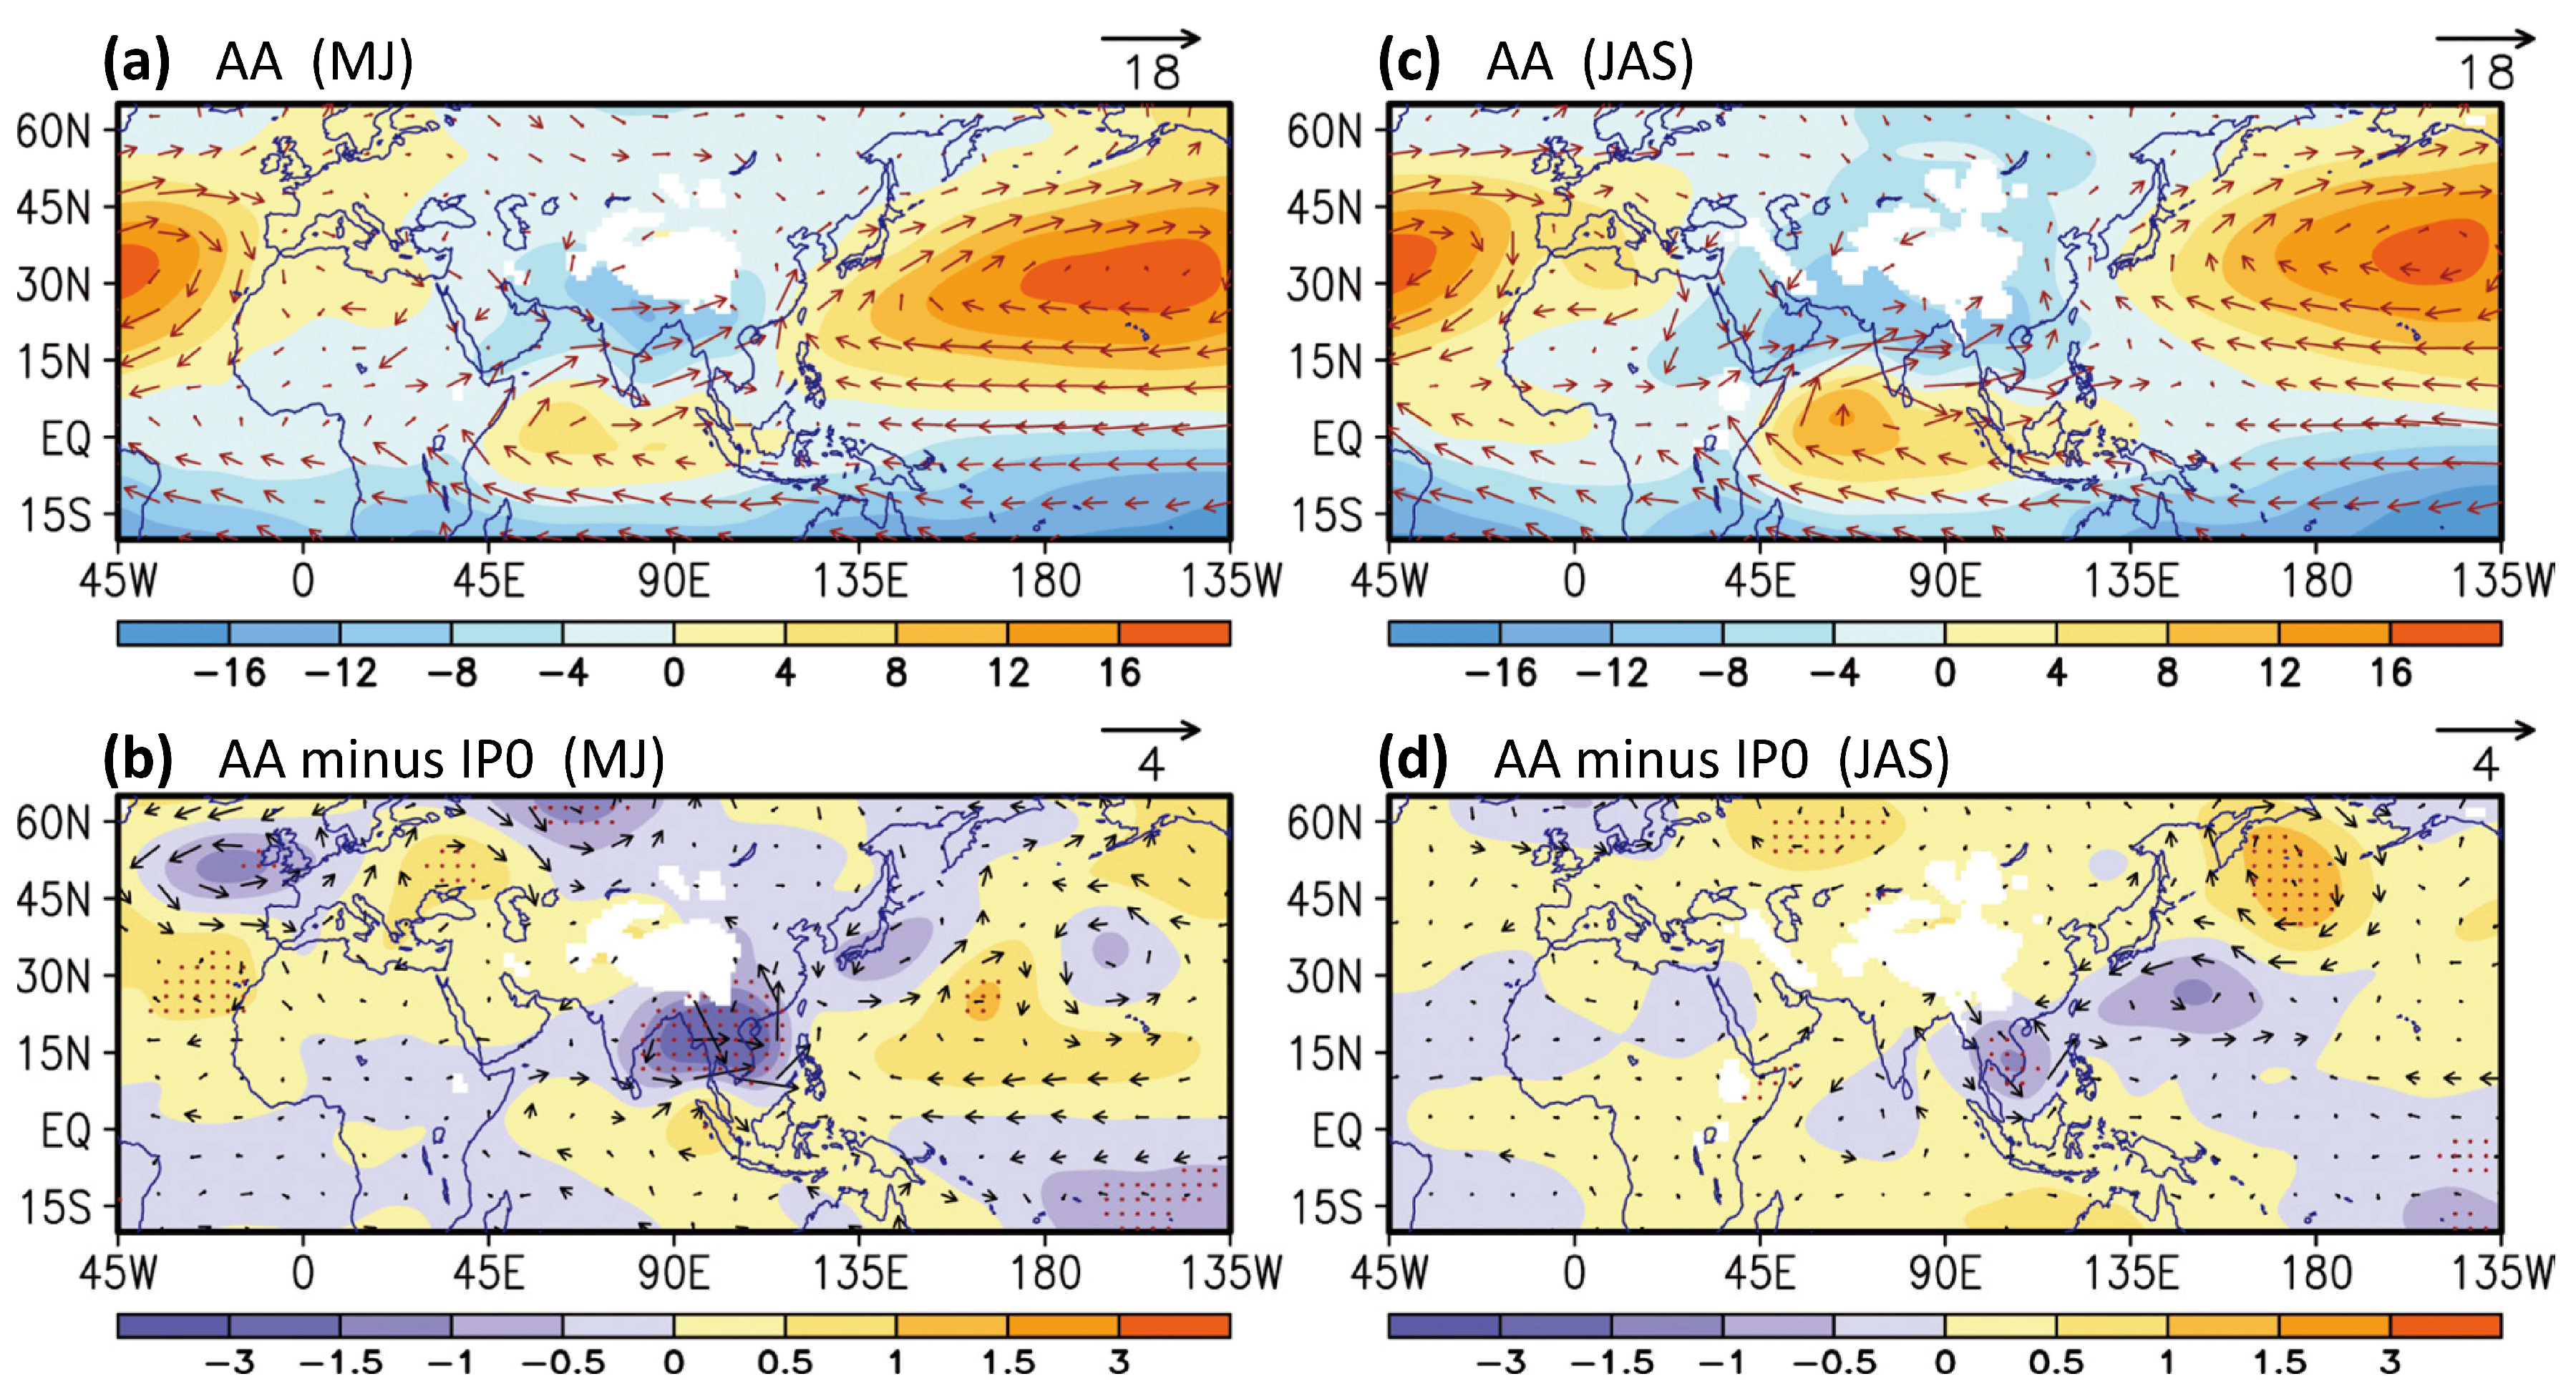
Figure 11, with the focus on the lower tropospheric circulation in early summer (May–June) and late summer (July–September). A major difference between early and late summer is for the East Asia–WNP. In early summer, the AA simulation shows that the western edge of the WNP subtropical high is located over the South China Sea, with the easterly competing with the monsoonal southwesterly (
Figure 11a). Including the complex topography of the Indochina Peninsula strengthens the cyclonic streamfunction in South and East Asia, whereas it strengthens the anticyclonic streamfunction in the subtropical WNP (
Figure 11b). The monsoonal southwesterly is intensified on the continental scale because of the topography. In late summer, the AA simulation shows that the subtropical high shifts northward, corresponding to the deepening of the WNP monsoon trough (
Figure 11c). Including the Indochina Peninsula topography strengthens the cyclonic streamfunction over the Peninsula and apparently favors the existence of the monsoon trough (
Figure 11d). In the AA simulation relative to the IP0 simulation, an anomalously cyclonic circulation in the south of Japan and an anomalously anticyclonic circulation in the east of Japan are driven, representing an intensified south-north ridge-trough pattern in the East Asia–WNP (
Figure 11d).
Finally, we return to examining the westerly evolution in 110° E–140° E, by comparing the simulated westerly between the AA and IP0 simulations in 200–500 hPa in the region, 110° E–140° E, 25° N–40° N (
Figure 12). The asymmetric seasonal variation in the westerly is clearly larger when the complex topography is included on the Indochina Peninsula. The topographic effect of the Indochina Peninsula on East Asian seasonality is thus suggested.
5. Concluding Remarks
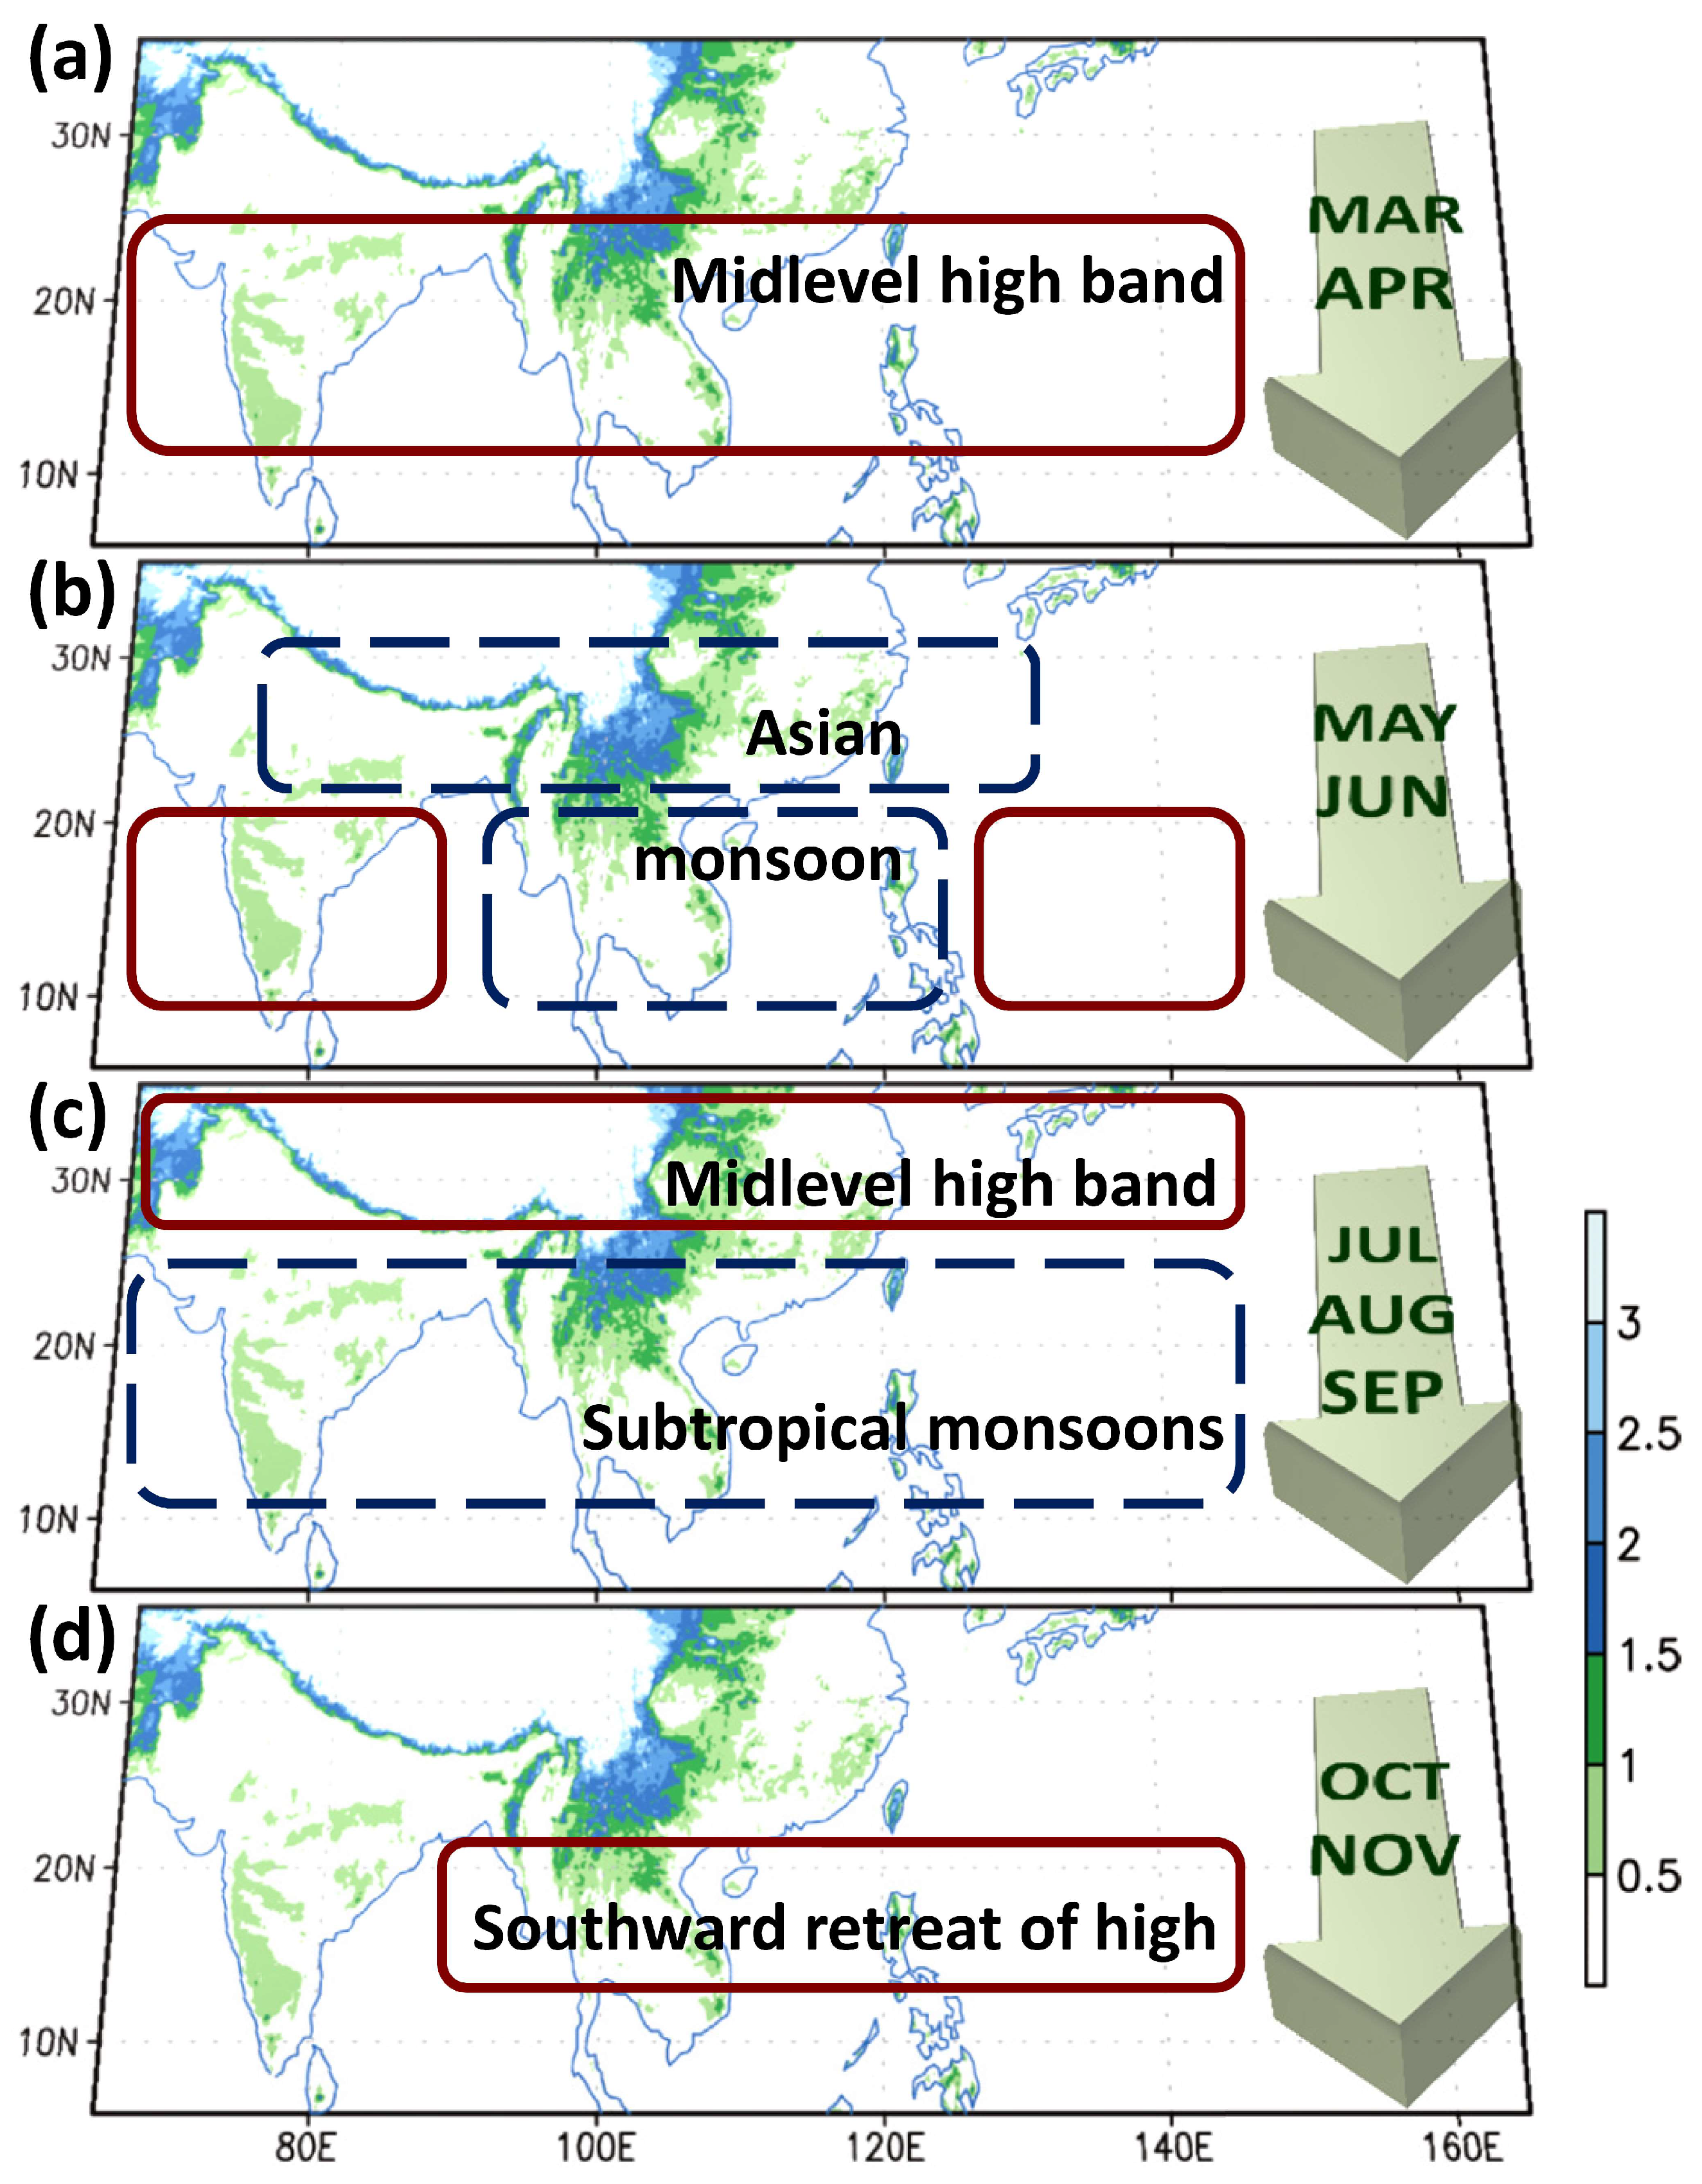
Following previous modeling works in which we explored the role of the Indochina Peninsula’s narrow mountains in modulating the Asian monsoon (i.e., AA simulation), this study expanded the analysis to investigate the onset versus retreat processes of the subtropical East Asian summer monsoon. An extra simulation assuming a flattened Indochina Peninsula (achieved by reducing the elevation to 100 m; IP0 simulation) was compared to the AA simulation to qualitatively assess the peninsula’s topographic effects. The results suggest that the Indochina Peninsula topography can be a driving factor of the asymmetric seasonal variation in subtropical East Asia. Including the complex topography of the Indochina Peninsula results in 6.4% higher annual mean precipitation over the region of 110° E–140° E, 20° N–35° N; spring-to-summer (i.e., March–July) precipitation of East Asia is 12.7% higher in the AA simulation compared with the IP0 simulation. We summarize the seasonal pattern of the monsoon and subtropical high (
Figure 13), and discuss the role of the Indochina Peninsula topography.
Scholars may have emphasized the mechanical effect over the thermal effect of the Indochina Peninsula, for example, when compared with the role of the Indian Subcontinent [
43]. As suggested by Tian and Yasunari [
5], because of a seasonal increase in the zonal temperature and pressure contrasts centered on the Indochina Peninsula, the low-level southerlies over southern China, the Indochina Peninsula, and the South China Sea are enhanced in spring through early summer. We examined the zonal thermal contrast between the Indochina Peninsula (95° E–105° E, 12.5° N–22.5° N) and the Philippine Sea (130° E–140° E, 10° N–20° N) in the AA simulation and compared the results with those of the IP0 simulation (not shown in the figure). In the AA simulation, the largest temperature difference between the two regions (Indochina Peninsula minus Philippine Sea) occurs in April, consistent with the observation. The largest contrast in the 850-hPa temperature difference between the two simulations also occurs in April, with the AA simulation (4.5 °C) obtaining a 12.5% larger contrast than the IP0 simulation (4 °C). The larger temperature gradients cause larger southerlies (
Figure 8) and support spring rains (
Figure 10). However, the midlevel high band splits until the summer monsoon onset after mid-May; this suggests that an increase in the zonal temperature contrast alone cannot drive the splitting of the subtropical high in March–April (schematic in
Figure 13a).
For early summer (
Figure 13b), including the complex topography of the Indochina Peninsula strengthens the cyclonic streamfunction in South and East Asia, whereas it strengthens the anticyclonic streamfunction in the subtropical WNP. The continental monsoon (southwesterly) is primarily intensified. For late summer (
Figure 13c), including the Indochina Peninsula topography strengthens the cyclonic streamfunction over the Peninsula, deepening the monsoon trough. Regarding the intraseasonal variation, Joseph and Sijikumar [
44] suggested that active convection over the Bay of Bengal can accelerate the whole interhemispheric low-level jet stream and activate the monsoon. Topographically induced monsoonal heating over the Indochina Peninsula and eastern Bay of Bengal may have similar effects on justifying large-scale circulation and strengthening the WNP monsoon trough.
The subtropical high belt east-west splits in late April over the Bay of Bengal, while it unites in late October over India (
Figure 13d), indicating asymmetric seasonal migration of the monsoon circulation. The inclusion of the complex topography of the Indochina Peninsula may only slightly increase the upper-level high in September–October (
Figure 9c). Assuming a flattened topography, the easterly reoccurs from the South China Sea to the Bay of Bengal much more gradually (comparing the IP0 simulation with the AA simulation,
Figure 7). In contrast to the early summer monsoon largely influenced by the inland/highland heating, the development of summer monsoons in West Africa and the subtropical WNP, as well as a sizable increase in convection over the equatorial Indian Ocean, favors a zonal expansion of broad-scale monsoonal circulation in August [
18,
45]. Weak topographic effects on the late-summer monsoon and retreat of the monsoonal circulation coincide well with the development of the subtropical monsoons. Briefly, the modeling results suggest that the existence of the complex topography of the Indochina Peninsula can enlarge the asymmetric seasonal variation not only in terms of wind and precipitation surrounding the Peninsula, but also large-scale monsoon circulation. A secondary role of the topographic effect could be suggested in modulating a gradual nature of the monsoon retreat.
In addition to the modulation of asymmetric monsoonal flow, the effect of the complex topography is known as a critical factor in modulating the diurnal cycle of rainfall over various regions (e.g., the Indochina Peninsula, Tibetan Plateau, and Himalayas) during the Asian summer monsoon [
46,
47,
48,
49,
50]. Some other studies (e.g., Deshpande and Goswami [
51]) have further noted that the spatial variation in daily rainfall patterns during active and break phases over India can be attributed to the orographic effect and heterogeneous convective development in different parts of the country, implying that the interaction between orography, diurnal cycle, and intraseasonal oscillation is important to the formation of summer monsoon rainfall over India. Together, these studies lead to the suggestion that understanding the role of orographic effects in modulating the formation of precipitation over the Asian summer monsoon region, as was attempted in the current study, is essential and deserves research attention.


