Precipitation Preventing a Deficit of Readily Available Soil Water in Arable Soils in Poland


1
Institute of Technology and Life Sciences, Kuyavian-Pomeranian Research Centre, Glinki 60, 85-174 Bydgoszcz, Poland
2
Institute of Technology and Life Sciences, Department of Nature Protection and Rural Landscape, Falenty, 05-090 Raszyn, Poland
*
Author to whom correspondence should be addressed.
Atmosphere 2018, 9(4), 121; https://doi.org/10.3390/atmos9040121
Submission received: 27 February 2018
/
Revised: 19 March 2018
/
Accepted: 21 March 2018
/
Published: 23 March 2018
(This article belongs to the Special Issue Precipitation: Measurement and Modeling)
Abstract
:Plants grown in arable soils mainly use rainwater stored in the soil at matric potential between −10 kPa and −100 kPa, which corresponds to the readily available soil water (RASW). RASW in the 100-cm soil layer of Polish arable soils is relatively low and ranges from about 12 mm in mountain clay soils up to 75 mm in black earths, which, at an average daily evapotranspiration of 3.8 mm·day−1 and spatio—temporal variability of precipitation, determines water scarcity of crop plants. The aim of the study is to estimate the values and the frequency of critical rainfall which ensures that soil water is kept in the range of readily available to plants and prevents water shortages for plants in arable soils. In order to meet this condition, the decade (10-day) sums of this precipitation, included in the ranges 16–27, 22–31, 26–35 and 33–39 mm, occur in 20.8, 13.4, 11.3 and 5.9%, respectively, of the decades of the vegetation period (April to September). Maps of critical rainfall spatial diversity in the background of the actual soil cover in Poland were generated. They may be useful for preliminary, estimated operational planning of irrigation needs.
1. Introduction
The economic effects of agriculture, and in particular in crop production, depend to a large extent on the hydro-climatic conditions, which, as a natural factor, are not subject to direct regulation by agricultural producers under field conditions. Indirect interventions through land drainage or crop irrigation require recognition of the frequency and intensity of extreme weather phenomena, especially precipitation, and their impact on soil moisture and supply of water from soil to plants that satisfies water requirements of arable crops. Research in this field, both in agrometeorology and soil science as well as in agronomy, is extensive and widely known [1,2,3,4,5]. Different approaches in quantifying the precipitation-evapotranspiration-soil water storage relationship have been presented. For example, it was shown that the spatial characteristics of rainfall influence the spatial variability of soil moisture within a catchment [1]. A probabilistic approach was used by Milly [2]. The probabilistic response of soil water content to given climatic forcing was described using a supply-demand-storage model, reducing the complex interaction of soil, climate and plant to a relatively simple expression for the equilibrium probability density function of soil water as a function of mean potential evaporation to the mean precipitation ratio and soil water capacity. Ramos and Martínez-Casasnovas [3] performed an analysis of the interrelations between precipitation distribution, temperature, evapotranspiration, runoff rates and the resulting water storage in vineyards soils of the Penedès region (NE Spain). They applied a hierarchical cluster analysis to classify the years according to water availability. Xie and Yang [4] studied the relation between antecedent precipitation and soil water content using a neural network model. They showed that the variation of antecedent precipitation was consistent with the soil water content and it displayed significant correlations with the soil water content in both the 20 and 50 cm soil layer. Xiaohua et al. [5] drew attention to the importance of precipitation, soil water storage, actual evapotranspiration and their relationship in hydrological research, hydrological modeling, water resource management, environmental protection. The authors of this article, being involved in these issues, have recently published two monographic studies containing spatial analyses regarding the assessment of crop water deficits [6] and excess of rainwater causing oxygen deficit in soils [7].
Deepening this issue in this publication, the authors present the results of model research, which parameterizes the potential rainfall conditions optimizing the supply of water during the growing season necessary for keeping soil water in a range that is readily available to plants and preventing water shortages for plants against the background of the natural water retention capacity of Poland’s arable soils.
2. Problem Identification
Soil as a physical body is a three-phase system whose natural homeostasis creates optimal habitat conditions for the development of biotic elements (plants, soil microorganisms). The most stable component of this arrangement is the solid phase, which is the mineral skeleton of soil. The gas phase is the most labile (supplier of molecular oxygen indispensable in plant root and soil biotope respiration processes). The contribution of the gas phase depends on the more vigorous liquid phase (aqueous soil solution) destabilized by evapotranspiration and the supply of rainwater. Shifting the proportion of this system towards increasing the share of the liquid or gas phase worsens the growing conditions, whose production efficiency depends directly on the deficiency and not the excess of one of the above-mentioned components (liquid or gas phase) [2]. Excess water worsens the conditions of oxygenation of soils—the cause of destabilization is the lack of oxygen [8]. In the case of excess air, the conditions of water uptake by roots and evapotranspiration deteriorate, and with them the inflow of mineral components for plants and soil macro- and microflora. Water shortage causes a reduction in the water potential of the soil and as a result, deterioration of conditions and reduction of water uptake by the roots.
As commonly known research results show [9,10,11], the state of homeostasis in the three-phased system of soil occurs in the case of capillary pores being filled with water (the state of the field water capacity, FWC). Plants efficiently have at their disposal readily available soil water, RASW, maintained by the suction force expressed by the potential of soil water in range of −10 kPa and −100 kPa. At higher values of this indicator, there are energy losses associated with water intake by plants and inhibition of plant growth.
The conducted research has shown [10,11] that the arable soils of Poland are characterized by a relatively low retention capacity of RASW, usually 3–6 or 6–9% cm3·cm−3, which suggests that in periods without rainfall there is a shortage of water in the soil under the climatic conditions of Poland. This is confirmed by the results obtained by Ostrowski et al. [6], which indicate the need for irrigation of field plants.
In conditions of RASW deficit, plants must access HASW (hardly available soil water bound with potentials of −100 kPa and −1.5 MPa). The volume relations of RASW to HASW are in the range of 1:2.3–2.6 in most post-glacial soils, 1:3.3 in mountain soils and 1:4.0 in loess soils (estimated values based on data from the monographs by Walczak et al. [10] and Witkowska-Walczak et al. [11]).
The cognitive problem in this issue is the answer to the questions:
- −
- what amount of natural precipitation is required to provide crop plants with continuous access to readily available water under field conditions without groundwater and without supplying the root zone with water by capillary rise from the groundwater table?
- −
- how often does such precipitation occur in a multi-year period?
The aim of this work is to present a parametrically documented view of this problem, using the modeling method in the unitary aspect (characteristics of individual arable soils) and spatial in the country aspect (cartographic visualization of the area structure).
3. Materials and Methods
The solution to the problem posed was carried out in two stages:
- −
- stage I consisted of determining critical precipitation resulting from the properties of soils to prevent the depletion of readily available soil water,
- −
- stage II was aimed at examining, based on the long-term data on rainfall obtained from meteorological observations, whether during the growing season, with what frequency and what amount critical rainfall occurs that could prevent the depletion of readily available soil water.
Critical precipitation is defined as the amount of rainfall in a given period, at the occurrence of which there will be no depletion of readily available water in the soil. This is the minimum rainfall, below which there is no readily available water in the soil and plants begin to use hardly available water. Each rainfall amount greater than the critical one ensures that the water content in the soil is maintained in the range of readily available water.
Critical precipitation is a function of three parameters: the length of the period, the potential evapotranspiration and the reserve of readily available water in the soil. It is calculated from the equation:
- when
- when
where Pc—critical precipitation in the period (mm); —daily potential evapotranspiration, mean in the period (mm·day−1); t—length of the period (days); RASW—readily available soil water (mm).
It was assumed that the critical precipitation will be set for the maximum value of the potential evapotranspiration of a given crop as the daily average value in the periods of the calendar decades (10-day period) of the growing season. It was also assumed that every decade of the growing season is treated as independent and at the beginning there is a full reserve of readily available soil water. Under the conditions of high evapotranspiration, the required precipitation is greater than under low evapotranspiration conditions, to avoid the exhaustion of readily available water.
The calculations were made for 29 soil units and for three layers: surface arable (I), subsurface (II) and subsoil (III), on which the 0–100 cm profile was divided. The thickness of these layers was adopted according to Ostrowski et al. [6], derived from the soil-cartographic database containing digital records of a generalized map of arable soils in Poland in the scale 1:1,000,000 [12]. RASW was taken as the middle values of the intervals given by Walczak et al. [10] in % cm3·cm−3 in the Table 8 of this monograph. In order to carry out further calculations, RASW was converted into a water layer (in mm) retained in the soil (Table 1).
Potential evapotranspiration being the actual evapotranspiration of plants at sufficient soil moisture under conditions of RASW, is calculated as:
where —reference evapotranspiration according to the FAO-56 Penman-Monteith method [13,14] (mm·day−1); kc—crop factor according to Allen et al. [13] and Ostrowski et al. [6].
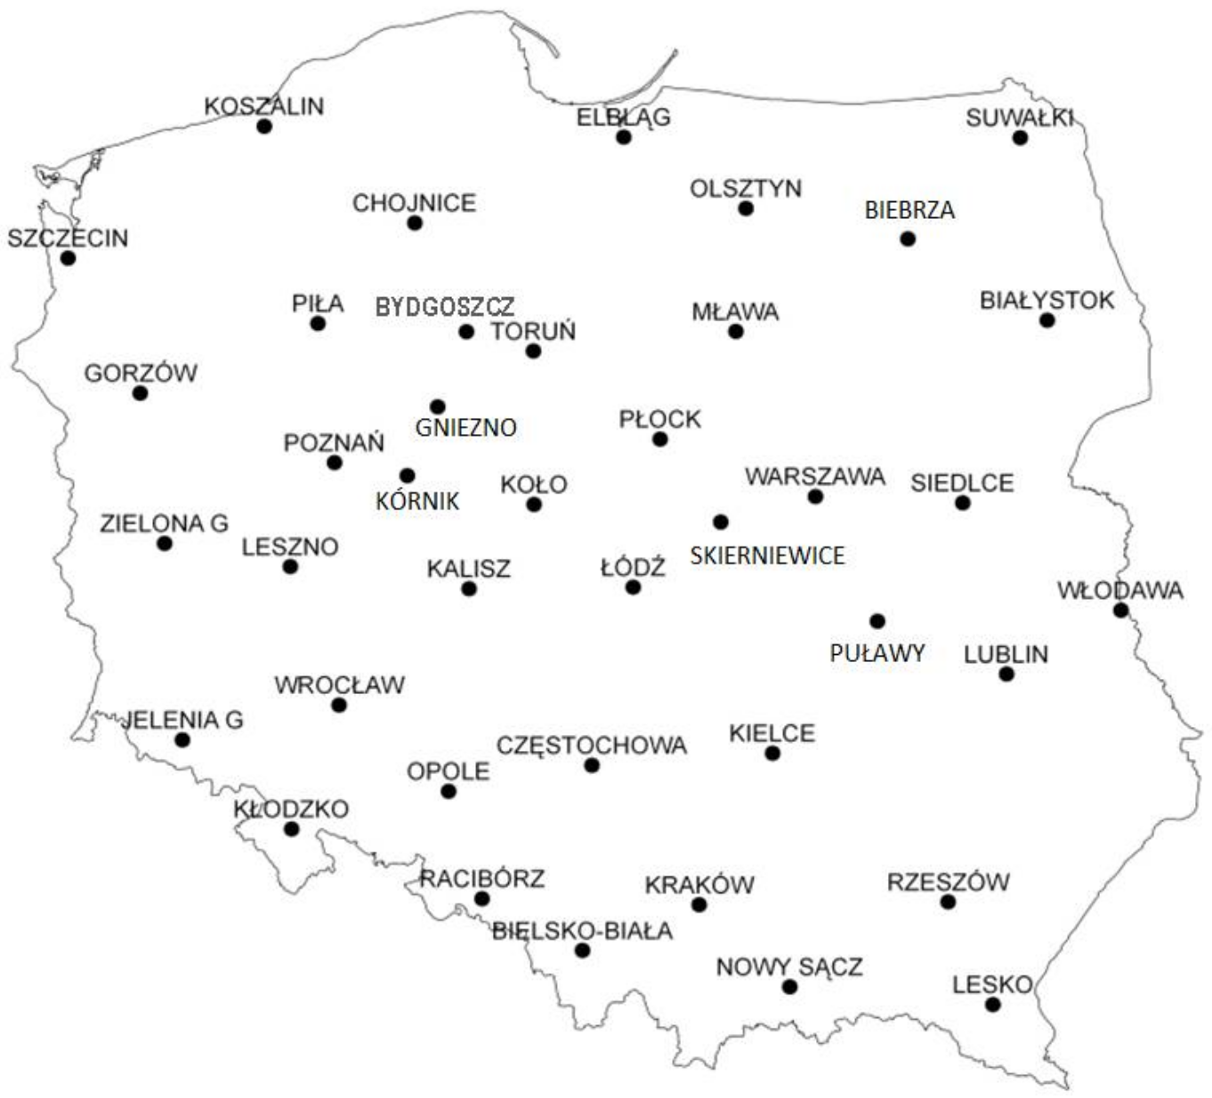
was calculated for selected utility groups and plant species in field cultivation on arable land characterized by the largest cultivation area in Poland: winter rape (950 thousand hectares), winter rye (725 thousand hectares), winter wheat (2100 thousand hectares), spring barley (840 thousand hectares), spring wheat (315 thousand hectares), maize for grain (670 thousand hectares), maize for green (555 thousand hectares), late potato (300 thousand hectares), sugar beet (180 thousand hectares), meadow (red) clover, alfalfa, field pastures (1500 thousand hectares together). was calculated in the periods of calendar decades (t = 10 days) in the months of the vegetation period of a given plant in 1970–2004 on the basis of meteorological elements measured at 40 meteorological stations in Poland (Figure 1) [6].
Decades were chosen in which the average evapotranspiration in the years 1970–2004 was the highest for a given plant and station, and then from the sequence of the maximum values of the average evapotranspiration for all plants and stations, 25, 50 and 75% quartiles were determined. The 25% quartile determines the value of the maximum evapotranspiration that can occur with the smaller ones with a probability of 0.25; a 50% quartile (median) determines a value that can occur with smaller ones with a probability of 0.50, and a 75% quartile determines a value that can occur with smaller ones with a probability of 0.75. Quartiles 25, 50 and 75% are respectively 3.5 mm·day−1, 4.0 mm·day−1 and 4.2 mm·day−1.
For such determined values of the maximum potential evapotranspiration, which may occur in Poland for various crops (among those that were the subject of the analysis), the critical precipitation Pc according to the Formulas (1) and (2) was calculated. Critical precipitation was determined for the surface arable layer and for the entire profile as the maximum value in one of the three diagnostic soil layers. The critical precipitation ranges determined by the 25% quartile and the 75% quartile of potential evapotranspiration were the basis for generating maps of spatial diversity in Poland of critical rainfall, which ensure the maintenance of readily available soil water and prevent water shortages for plants.
The implementation of this cartographic project based on software processing procedures in the soil–cartographic database [7,12] required the aggregation of the soil unit data and their inclusion in the natural ranges of decade critical rainfall necessary to generate maps.
The analysis of the critical rainfall values (listed in Table 2) showed that they aggregate into 7–mm overlapping intervals. For the map regarding the surface arable layer, these values form 10 ranges within the limits of 13–39 mm in a decade, and for a map characterizing a 100-cm soil profile of 8 compartments within the limits of 16–39 mm.
Maps prepared according to these ranges (scale 1:2,500,000) proved to be unreadable. In order to increase the transparency of the cartographic projection, aggregations of the ranges were made combining two adjacent ranges, which increased their spread to about 10 mm. In this way, 5 overlapping ranges were obtained for the surface arable layer and 4 for the whole profile. The limits of the ranges are given in the headings of Table 3 and Table 4 and on the respective maps of critical precipitation.
After the spatial data were processed using the processing procedures in the soil-cartographic database, the surface area structure of arable soils with different demand for decade critical rainfall was estimated.
4. Background—General Characteristics of Rainfall Conditions in Poland in 1970–2004
Air-water soil conditions, the amount of water accumulated in the soil, and the amount of water in the soil available to plants are shaped by the two main climatic factors—precipitation and evaporation. Poland lies in the transitional climate of the temperate zone. In such a climate there is considerable variability of these meteorological elements in particular years and months. Their variability causes the occurrence of scarcity or excess of water at various time and spatial scales, causing either shortages of soil water and its low availability to plants or excessive waterlogging of the soil and deficiencies of air and oxygen in the soil.
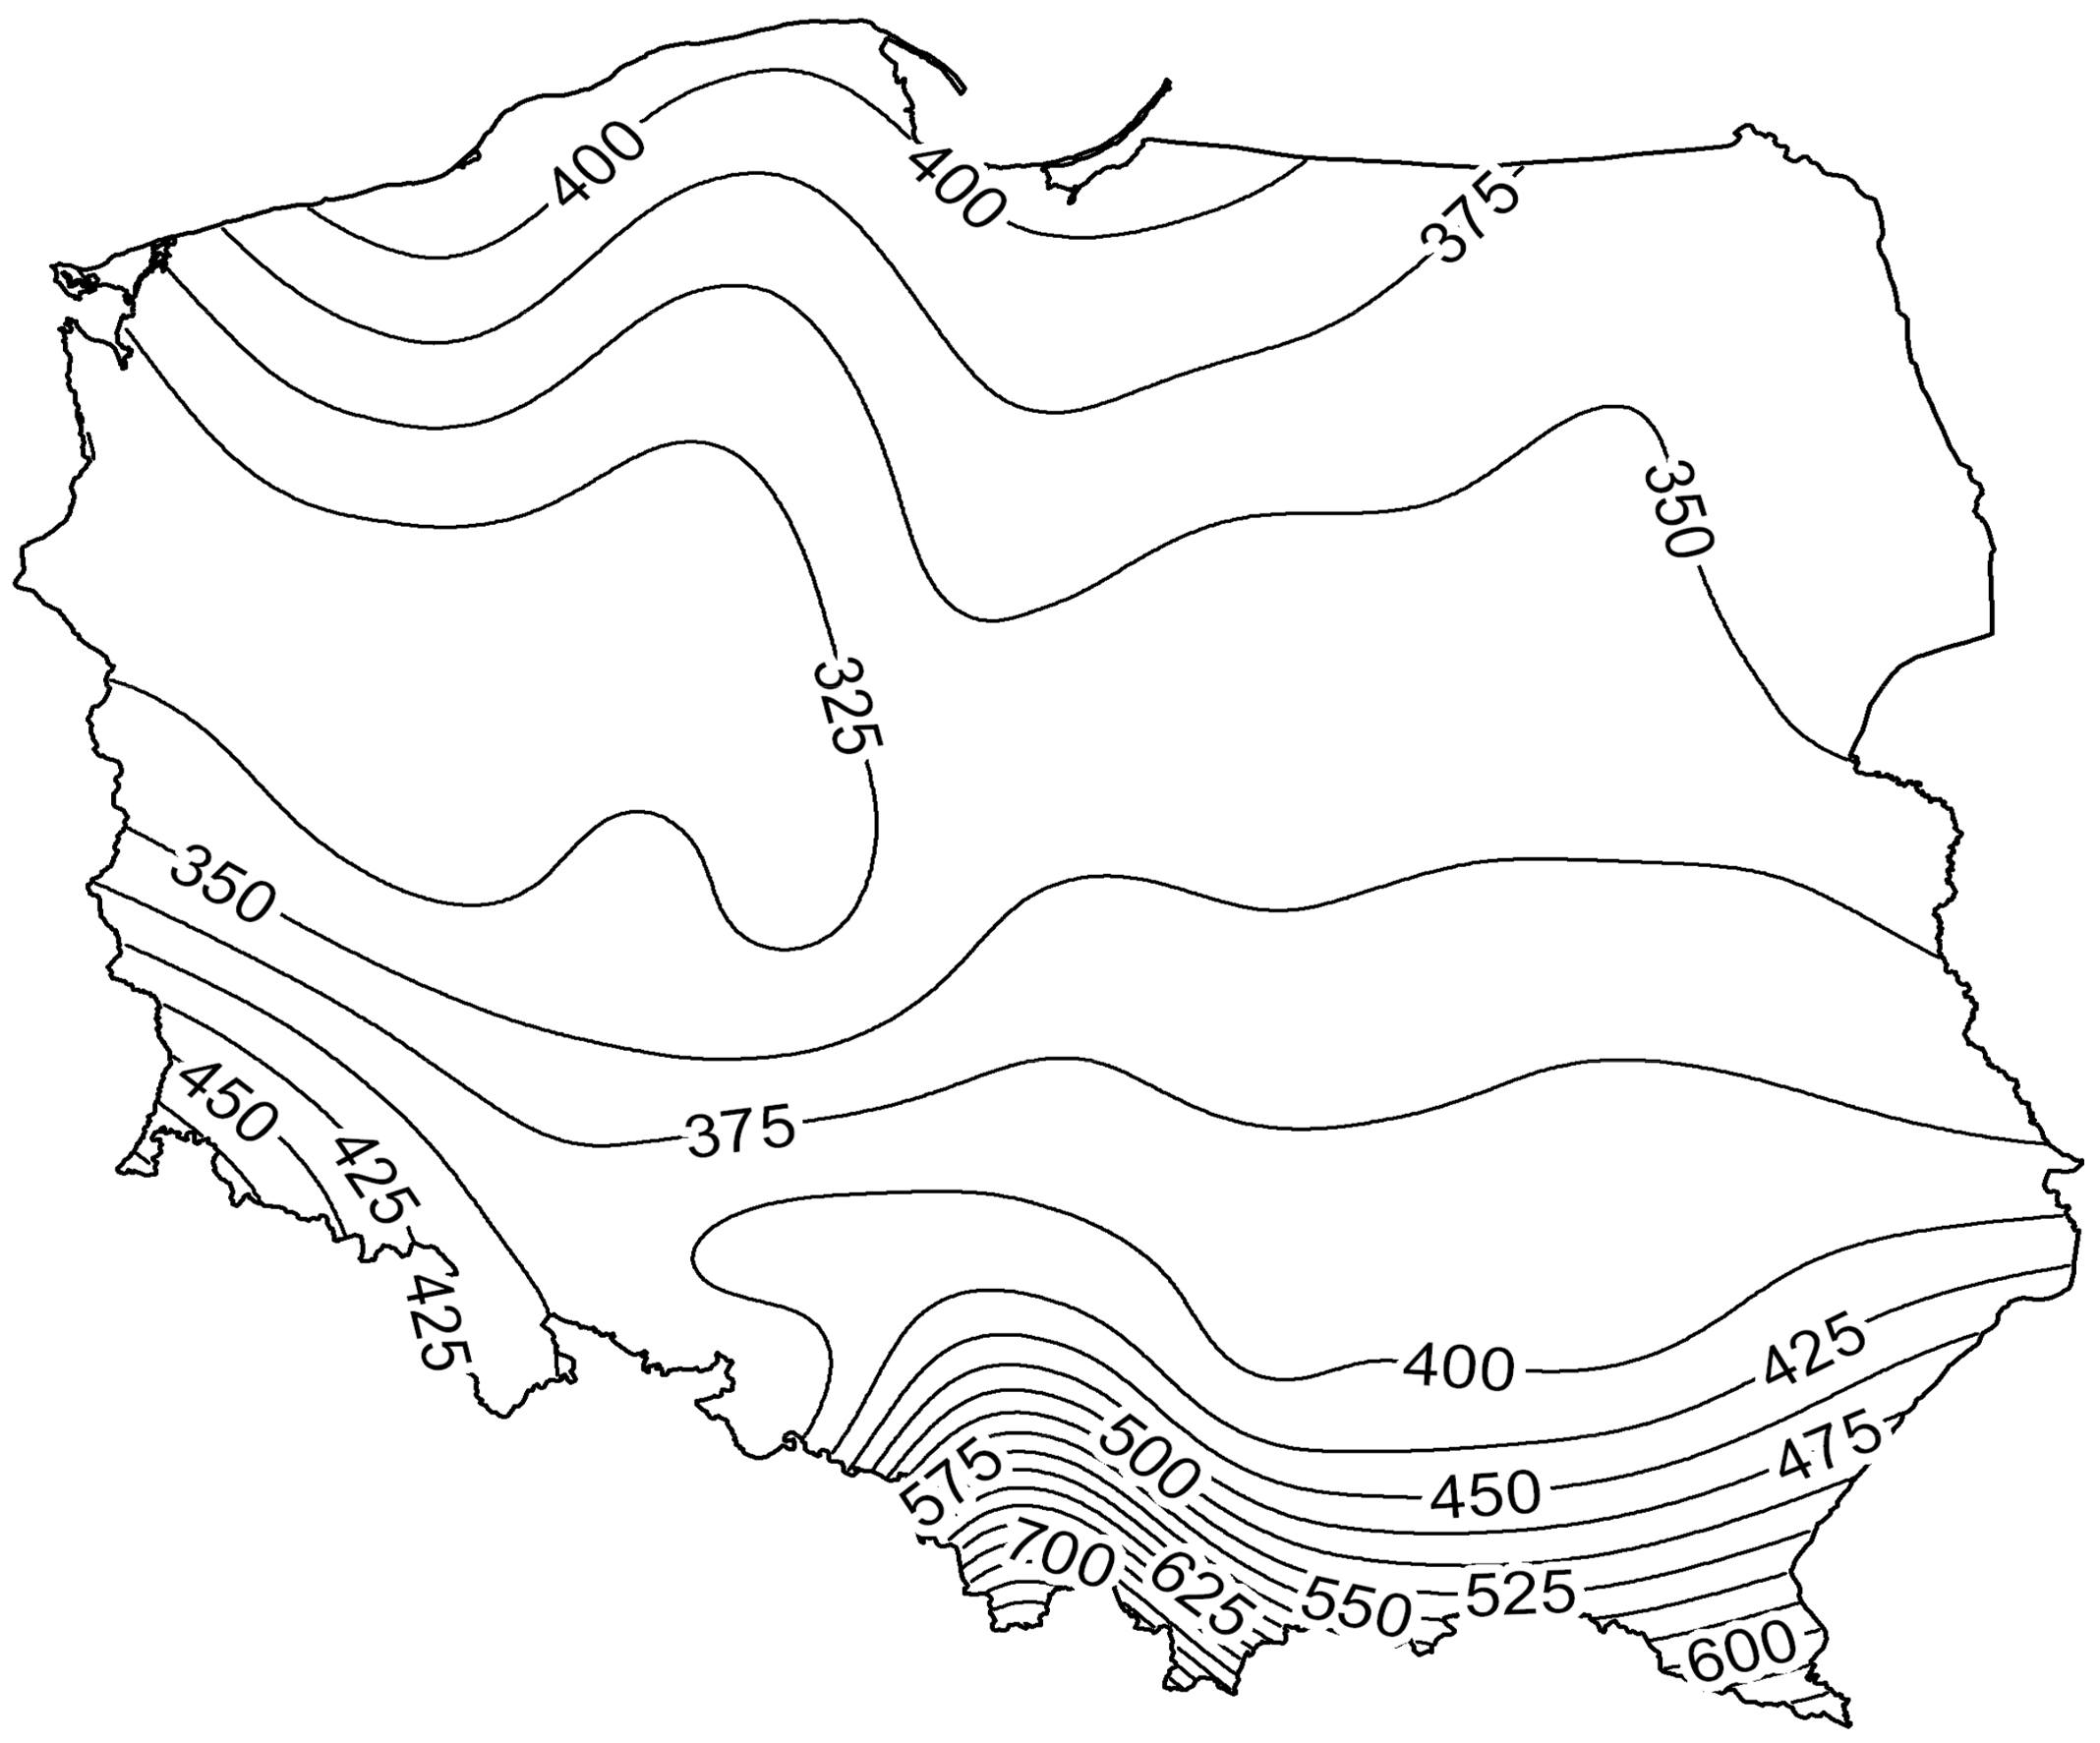
The average annual precipitation, based on measured rainfall at 40 stations in the years 1970–2004, is 600 mm in Poland, and 350 mm in the vegetation period (April–September) (Figure 2). In the central-western and north-western part of Poland, in the area of Kujawy, north and west of Wielkopolska and the western part of the Pomeranian Lake District, average annual precipitation does not exceed 500 mm, and in the growing season, 320–340 mm. These are regions with the lowest precipitation sums in Poland. This region of the country is also characterized by a high value of the coefficient of variation of precipitation (up to 250%). In the last 50 years there have been years in which the rainfall in the summer half-year (IV–IX) in this area was smaller than the many year average by half and more (e.g., in 1989 it was only 113 mm, and in 1992—160 mm). In 1992, from mid-April, there were significant rainfall deficits, exceeding 50% in relation to the average and reaching 100% in June in the north-west of the country (zero precipitation). In Kujawy, the rainfall in the second half of the growing season (July–September) this year was 40–55% of the long-term average. There were also years with extremely high rainfall, e.g., in 1980 annual rainfall in the vicinity of Bydgoszcz amounted to 809 mm, and in the growing season—651 mm. Extremely high rainfall occurred in this region in June (317 mm) and July (192 mm) this year.
Regional distribution inequality, seasonal variation and variation between years are the main features of the irregularity of precipitation in Poland.
5. Results and Discussion
5.1. Critical Precipitation and Its Frequency
Relations between the state of soil moisture and rainfall during the growing season, under the meteorological conditions prevailing in Poland, are dynamic. With respect to the subsequent precipitation, that retained in the soil water reserve available for arable crops is depleted completely or partially. The determinant of the amount of critical rainfall, as indicated in formulas (1) and (2), is the relation between the amount of soil water readily available for plants, characteristic for a given soil and plant, and the intensity of the evapotranspiration process. Critical precipitation indirectly indicates how sensitive soils are to the occurrence of water deficiency, which may cause a state of their drying, limiting the water intake by plant roots, parameterized by the value of potential evapotranspiration. The greater the critical precipitation, the more sensitive the soil. This is the minimum rainfall in a decade that must occur to avoid running out of available water under the conditions of potential evapotranspiration.
The critical rainfall values for the individual layers of the considered soils listed in Table 2 show a large spread. Under the conditions of higher diurnal evapotranspiration, the sum of precipitation in a decade, which is required to provide readily available water in the soil, is greater. Differences in the critical rainfall values obtained and listed in Table 2 between individual soils are also the result of the amount of readily available soil water RASW in the distinguished diagnostic layers, depending on the granulometric composition and thickness of the layers. Thus, a cursory analysis of the results suggests their apparent discrepancy. For the surface arable layer, in which the predominant number of plant roots is found, the critical rainfall is from 12.5 mm in black earth sols (Haplic Phaeozems), when the maximum evapotranspiration is 3.5 mm·day−1 to 39.3 mm in brown and pseudo-clayey soils formed from massive rocks (Haplic Luvisols and Eutric Cambisols) under conditions of maximum evapotranspiration of 4.2 mm·day−1.
On average, for all considered soil units, the critical decade rainfall is 24 mm for the surface arable layer, 22 mm for the subsurface layer and 19 mm for the subsoil under low evapotranspiration conditions (3.5 mm·day−1); 29 mm, 27 mm and 23 mm in terms of medium evapotranspiration (4.0 mm·day−1) and 31, 29 and 25 mm under high evapotranspiration conditions (4.2 mm·day−1).
One must be aware that the values of critical precipitation are determined assuming a full reserve of readily available soil water at the beginning of each decade period. In fact, critical precipitation can be higher if initial soil moisture is lower than field water capacity. This indicates the importance of quantifying initial soil moisture conditions to enhance the prediction of required precipitation. A similar conclusion was drawn by Huza et al. [1] when analyzing the importance of quantifying catchment initial conditions to enhance the prediction of flash flood occurrences in southern France.
Another simplicity of the approach used (Equations (1) and (2)) is to not account for capillary rise from groundwater table. The available space for moisture storage in the unsaturated zone depends not only on the active soil layer but also on the rise of the capillary fringe [5]. Groundwater rise up into the soil can significantly decrease the soil moisture deficit. The capillary rise is associated with the physical properties of soil, its porosity and particle diameter. In clay soils, where capillary rise is strong, a water table depth of 2 m and more can supply the root zone with water. In sandy soils, the water table and capillary rise from it have a small role as a source of water in the root zone [5]. Because most Polish soils (60%) are characterized by light granulometric composition and deep groundwater, failure to consider capillary rise does not cause major errors in the assessment of critical rainfall.
Next, it was analyzed how often critical rainfall occurred in the 1970–2004 multi-year period in the analyzed 40 stations. The frequency of critical precipitation in the determined ranges of cartographic presentation was calculated as the ratio of the number of decades in which the sum of precipitation occurred in a given range to the number of all decades of the vegetation period of 1970–2004 (630 decades) and expressed as a percentage.
The obtained results indicate that the frequency of decade precipitation sums in separate intervals (Table 3 and Table 4) varies across Poland. This diversity is also marked between the intervals. For the surface arable layer, rainfall usually occurred in the range of 13–23 mm—the average frequency in all stations and in all decades of the surveyed multiannual period was 21.9%. Precipitation in the range of 20–30 mm occurred on average in 16.2% of all decades; in the range of 24–33 mm—12.3%, and in the range of 27–35 mm—9.8%. Rainfall in the range of 31–39 mm was the least frequent—its average frequency was only 8.3%. With regard to layers in the entire soil profile, the most frequent critical precipitation occurred in the range of 16–27 mm—the average frequency in all stations and in all decades of the surveyed period was 20.8%. Precipitation in the range of 22–31 mm occurred on average in 13.4% of all decades; in the range of 26–35 mm—11.3%, and in the range of 33–39 mm they were the least frequent—5.9%.
5.2. Cartographic Presentation of Critical Precipitation Conditioning the Provision of Water Reserves Readily Available in the Soil
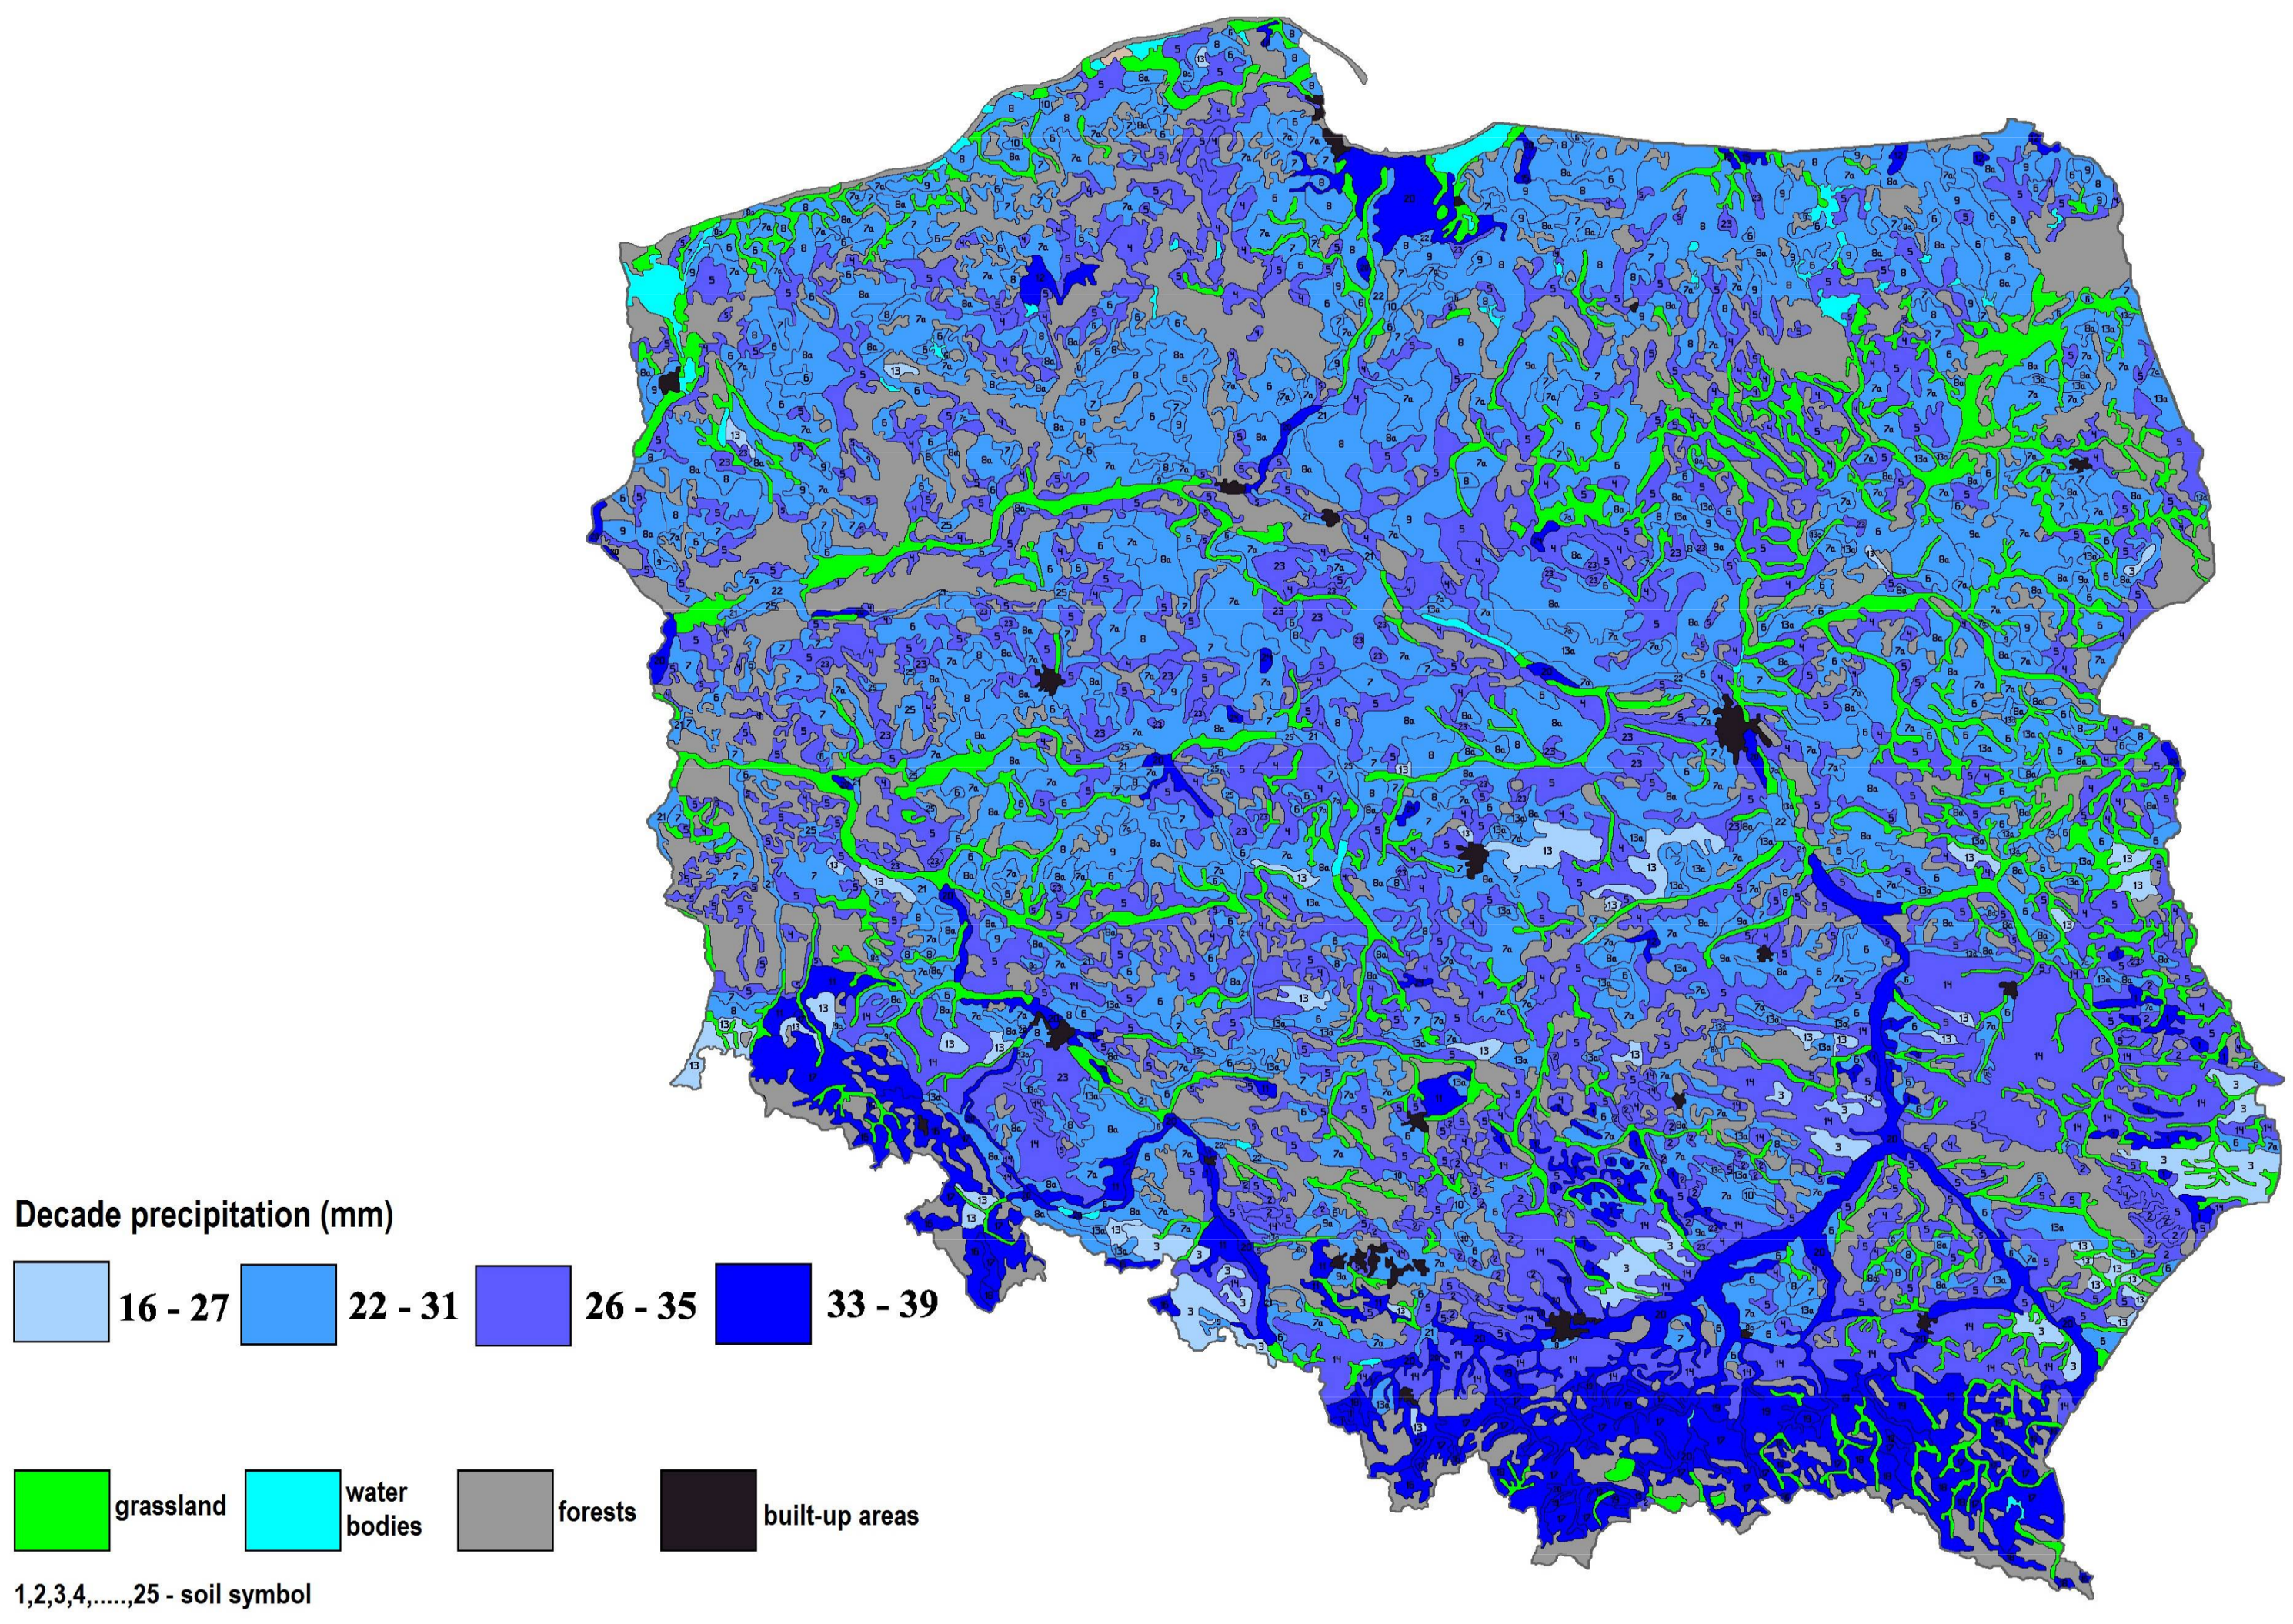
Irregularity of precipitation and diversity of water retention capacity of arable soils in Poland induce spatial presentation of the considered relations between these parameters. Therefore, an attempt was made to cartographically present the above unit characteristics using software processing procedures in the soil-cartographic database [6], in the form of a map of critical rainfall providing soil water readily available to plants in the surface arable layer (Figure 3) and throughout the 100-cm soil profile (Figure 4). This second map contains the critical rainfall ranges designated as maximum values occurring in one of the three soil layers: surface arable, subsurface and subsoil. At the same time, the surface area shares of arable soils according to critical rainfall intervals determined for potential evapotranspiration with a probability of 25 and 75%, necessary to ensure continuity in access to water readily available for crops, were estimated (Table 5).
As it results from the data contained in Table 5, across approximately ¾ of the arable land area, to ensure the continuity of RASW availability in the arable layer, a critical decade precipitation in the range from 24 mm to 33 mm is required. The decade critical precipitation related to the whole profile and corresponding to the largest RASW values in the distinguished soil layers ranges from 22 to 31 mm for about half of the arable land. It is worth noting that for about 85% of the arable land area, these values do not exceed 35 mm·decade−1.
A separate map for the surface arable layer (Figure 3) was made bearing in mind its importance in the development and yielding of arable crops. Analyzing the cartographic display of the spatial structure depicted on it, it points out that the essential background is the areas of critical rainfall within the limits of 24–33 mm·decade−1. Larger spatial diversity occurs in the southern part of the country. In highland areas, required critical rainfall is 20–30 mm·decade−1, and in mountain areas, 27–35 mm·decade−1.
On a synthetic map (Figure 4), showing the critical rainfall related to the entire profile and corresponding to the largest RASW value in the distinguished soil layers, the prevailing area of the country is dominated by a mosaic of areas with critical rainfall in the ranges of 22–31 mm·decade−1 and 26–35 mm·decade−1, with the advantage of the former. In the southern part (upland and mountain), this mosaic is made up of areas with critical values of 26–35 mm·decade−1 and 33–39 mm·decade−1. Greater variation in critical precipitation in the southern part of the country is associated with the occurrence of soils with more contrasting properties (rendzinas, black earths, loess and mountain soils).
6. Conclusions
- The applied method of modeling and the procedure of computer data processing made it possible to determine critical precipitation preventing readily available soil water depletion in relation to the analyzed arable soils and cartographic presentation of its spatial distribution.
- The obtained results of the calculations indicate a significant variation of critical precipitation and its spatial area variability on arable land.
- The analysis of the 35-year period of precipitation measured at 40 national meteorological stations shows a relatively small share of decades in which there were estimated values of precipitation treated as a minimum for maintaining continuity in the availability of soil water for arable crops.
- The most common (about 20%) are decades in which the required precipitation does not exceed 20–25 mm. Decades in which there should be more rainfall to prevent the exhaustion of readily available water occur less often.
- The estimated rainfall values can be considered as one of the parametric criteria for the need to take into account irrigation to preserve the stability of crop management on arable land.
- Spatial visualization of critical rainfall variation in the background of the actual soil cover in Poland may be useful for farmers for preliminary, estimated operational assessment of irrigation needs under conditions of water consumption by field crops in the range of 3.5–4.2 mm·day−1.
- Using the maps, you can assess the irrigation needs based on the daily measurement of precipitation and precipitation forecast for the next 10 days, with knowledge of the type of soil. Precipitation measured or predicted less than the critical rainfall indicates the need for irrigation.
- Despite the simplicity of the problem considered and the method used, the solution shows a valuable and useful data input. Because of the simplicity of the analysis, the results can be interpreted easily.
Acknowledgments
This study was done within the project “Operationalizing the increase of water use efficiency and resilience in irrigation (OPERA)” under the WATER JOINT PROGRAMMING INITIATIVE (Water JPC), funded via the Horizon 2020 “ERA-NET CO-FUND WaterWorks2015” by the European Commission (EC) and the Polish National Centre for Research and Development. The funds for covering the costs of the publication come from the Polish National Centre for Research and Development.
Author Contributions
Janusz Ostrowski conceived the presented idea and carried out the cartographic work and analysis. Leszek Łabędzki developed the method for determining critical precipitation and performed calculations and analysis as well as contributed to the literature review and analysis tools. All authors discussed the results, contributed to the manuscript and wrote the paper.
Conflicts of Interest
The authors declare no conflict of interest.
References
- Huza, J.; Teuling, A.J.; Braud, I.; Grazioli, J.; Melsen, L.A.; Nord, G.; Raupach, T.H.; Uijlenhoet, R. Precipitation, soil moisture and runoff variability in a small river catchment (Ardèche, France) during HyMeX Special Observation Period 1. J. Hydrol. 2014, 516, 330–342. [Google Scholar] [CrossRef] [Green Version]
- Milly, P.C.D. A minimalist probabilistic description of root zone soil water. Water Resour. Res. 2001, 37, 457–463. [Google Scholar] [CrossRef]
- Ramos, M.C.; Martínez-Casasnovas, J.A. Effects of precipitation patterns and temperature trends on soil water available for vineyards in a Mediterranean climate area. Agric. Water Manag. 2010, 97, 1495–1505. [Google Scholar] [CrossRef]
- Xie, W.; Yang, J. Assessment of soil water content in field with antecedent precipitation index and groundwater depth in the Yangtze River Estuary. J. Integr. Agric. 2013, 12, 711–722. [Google Scholar] [CrossRef]
- Xiaohua, X.; Xiaoling, W.; Xi, C.; Qifeng, S.; Xianwu, X. Integrating Topography and Soil Properties for Spatial Soil Moisture Storage Modeling. Water 2017, 9, 647. [Google Scholar] [CrossRef]
- Ostrowski, J.; Łabędzki, L.; Kowalik, W.; Kanecka-Geszke, E.; Kasperska-Wołowicz, W.; Smarzyńska, K.; Tusiński, E. Atlas of Water Deficits of Cultivated Plants and Grasslands in Poland; IMUZ: Falenty, Poland, 2008; p. 19. ISBN 978-83-88763-8-16. [Google Scholar]
- Ostrowski, J.; Łabędzki, L. Excess rainwater and hypoxia of arable soils in Poland. In Woda Środowisko Obszary Wiejskie. Rozprawy Naukowe i Monografie 43; ITP: Falenty, Poland, 2016; p. 118. ISSN 1644-1095. [Google Scholar]
- Ostrowski, J. Oxygen determinants of arable soil melioration. In Agrophysics—Processes, Properties, Methods; Gliński, J., Horabik, J., Lipiec, J., Sławiński, C., Eds.; Instytut Agrofizyki im. Bohdana Dobrzańskiego PAN: Lublin, Poland, 2014; pp. 57–65. ISBN 978-83-89969-34-7. [Google Scholar]
- Sławiński, C. Soil-plant-atmosphere system as a continuum. In Agrophysics—Processes, Properties, Methods; Gliński, J., Horabik, J., Lipiec, J., Sławiński, C., Eds.; Instytut Agrofizyki im. Bohdana Dobrzańskiego PAN: Lublin, Poland, 2014; pp. 81–88. ISBN 978-83-89969-34-7. [Google Scholar]
- Walczak, R.; Ostrowski, J.; Witkowska-Walczak, B.; Stawiński, C. Hydrophysical Characteristics of Mineral Arable Soils in Poland. Acta Agrophys. 2002, 79, 1–14. [Google Scholar]
- Witkowska-Walczak, B.; Gliński, J.; Sławiński, C. Hydrophysical Properties of Soils; Polish Academy of Sciences: Lublin, Poland, 2012; p. 132. ISBN 978-83-930665-6-8. [Google Scholar]
- Ostrowski, J. Base of soil-cartographic data—Structure and use. In Proceedings of the VI Science Conference Technology PTIP on Systems of Geospatial Information, Warsaw, Poland, 18–20 June 1996; pp. 471–480. [Google Scholar]
- Allen, R.G.; Pereira, L.S.; Raes, D.; Smith, M. Crop Evapotranspiration. Guidelines for Computing Crop Water Requirements; FAO Irrigation and Drainage Paper No. 56; FAO: Rome, Italy, 1998; p. 300. ISBN 92-5-104219-5. [Google Scholar]
- Łabędzki, L.; Bąk, B.; Smarzyńska, K. Spatio–temporal variability and trends of Penman–Monteith reference evapotranspiration (FAO–56) in 1971–2010 under climatic conditions of Poland. Polish J. Environ. Stud. 2014, 23, 2083–2091. [Google Scholar] [CrossRef]
- Polish Soil Classification; Roczniki Gleboznawcze—Soil Science Annual; Marcinek, J.; Komisarek, J. (Eds.) Polskie Towarzystwo Gleboznawcze: Warszawa, Poland, 2011; Volume 62, pp. 1–193. ISSN 0080-3642. [Google Scholar]
- Global Reference Base of Soil Resources 2014; Polskie Towarzystwo Gleboznawcze: Toruń, Poland, 2015; p. 239. ISBN 978-83-934096-7-9.
- IUSS Working Group WRB. World Reference Base for Soil Resources 2014, Update 2015. International Soil Classification System for Naming Soils and Creating Legends for Soil Maps; World Soil Resources Reports No. 106; FAO: Rome, Italy, 2015; p. 203. ISBN 978-92-5-108369-7. [Google Scholar]
Figure 1.
Location of the meteorological stations.
Figure 2.
Precipitation (mm) in the growing season (April–September), mean in 1970–2004.
Figure 3.
Map of the decade precipitation (mm) preventing readily available soil water depletion in the surface layer of arable soils in Poland.
Figure 3.
Map of the decade precipitation (mm) preventing readily available soil water depletion in the surface layer of arable soils in Poland.
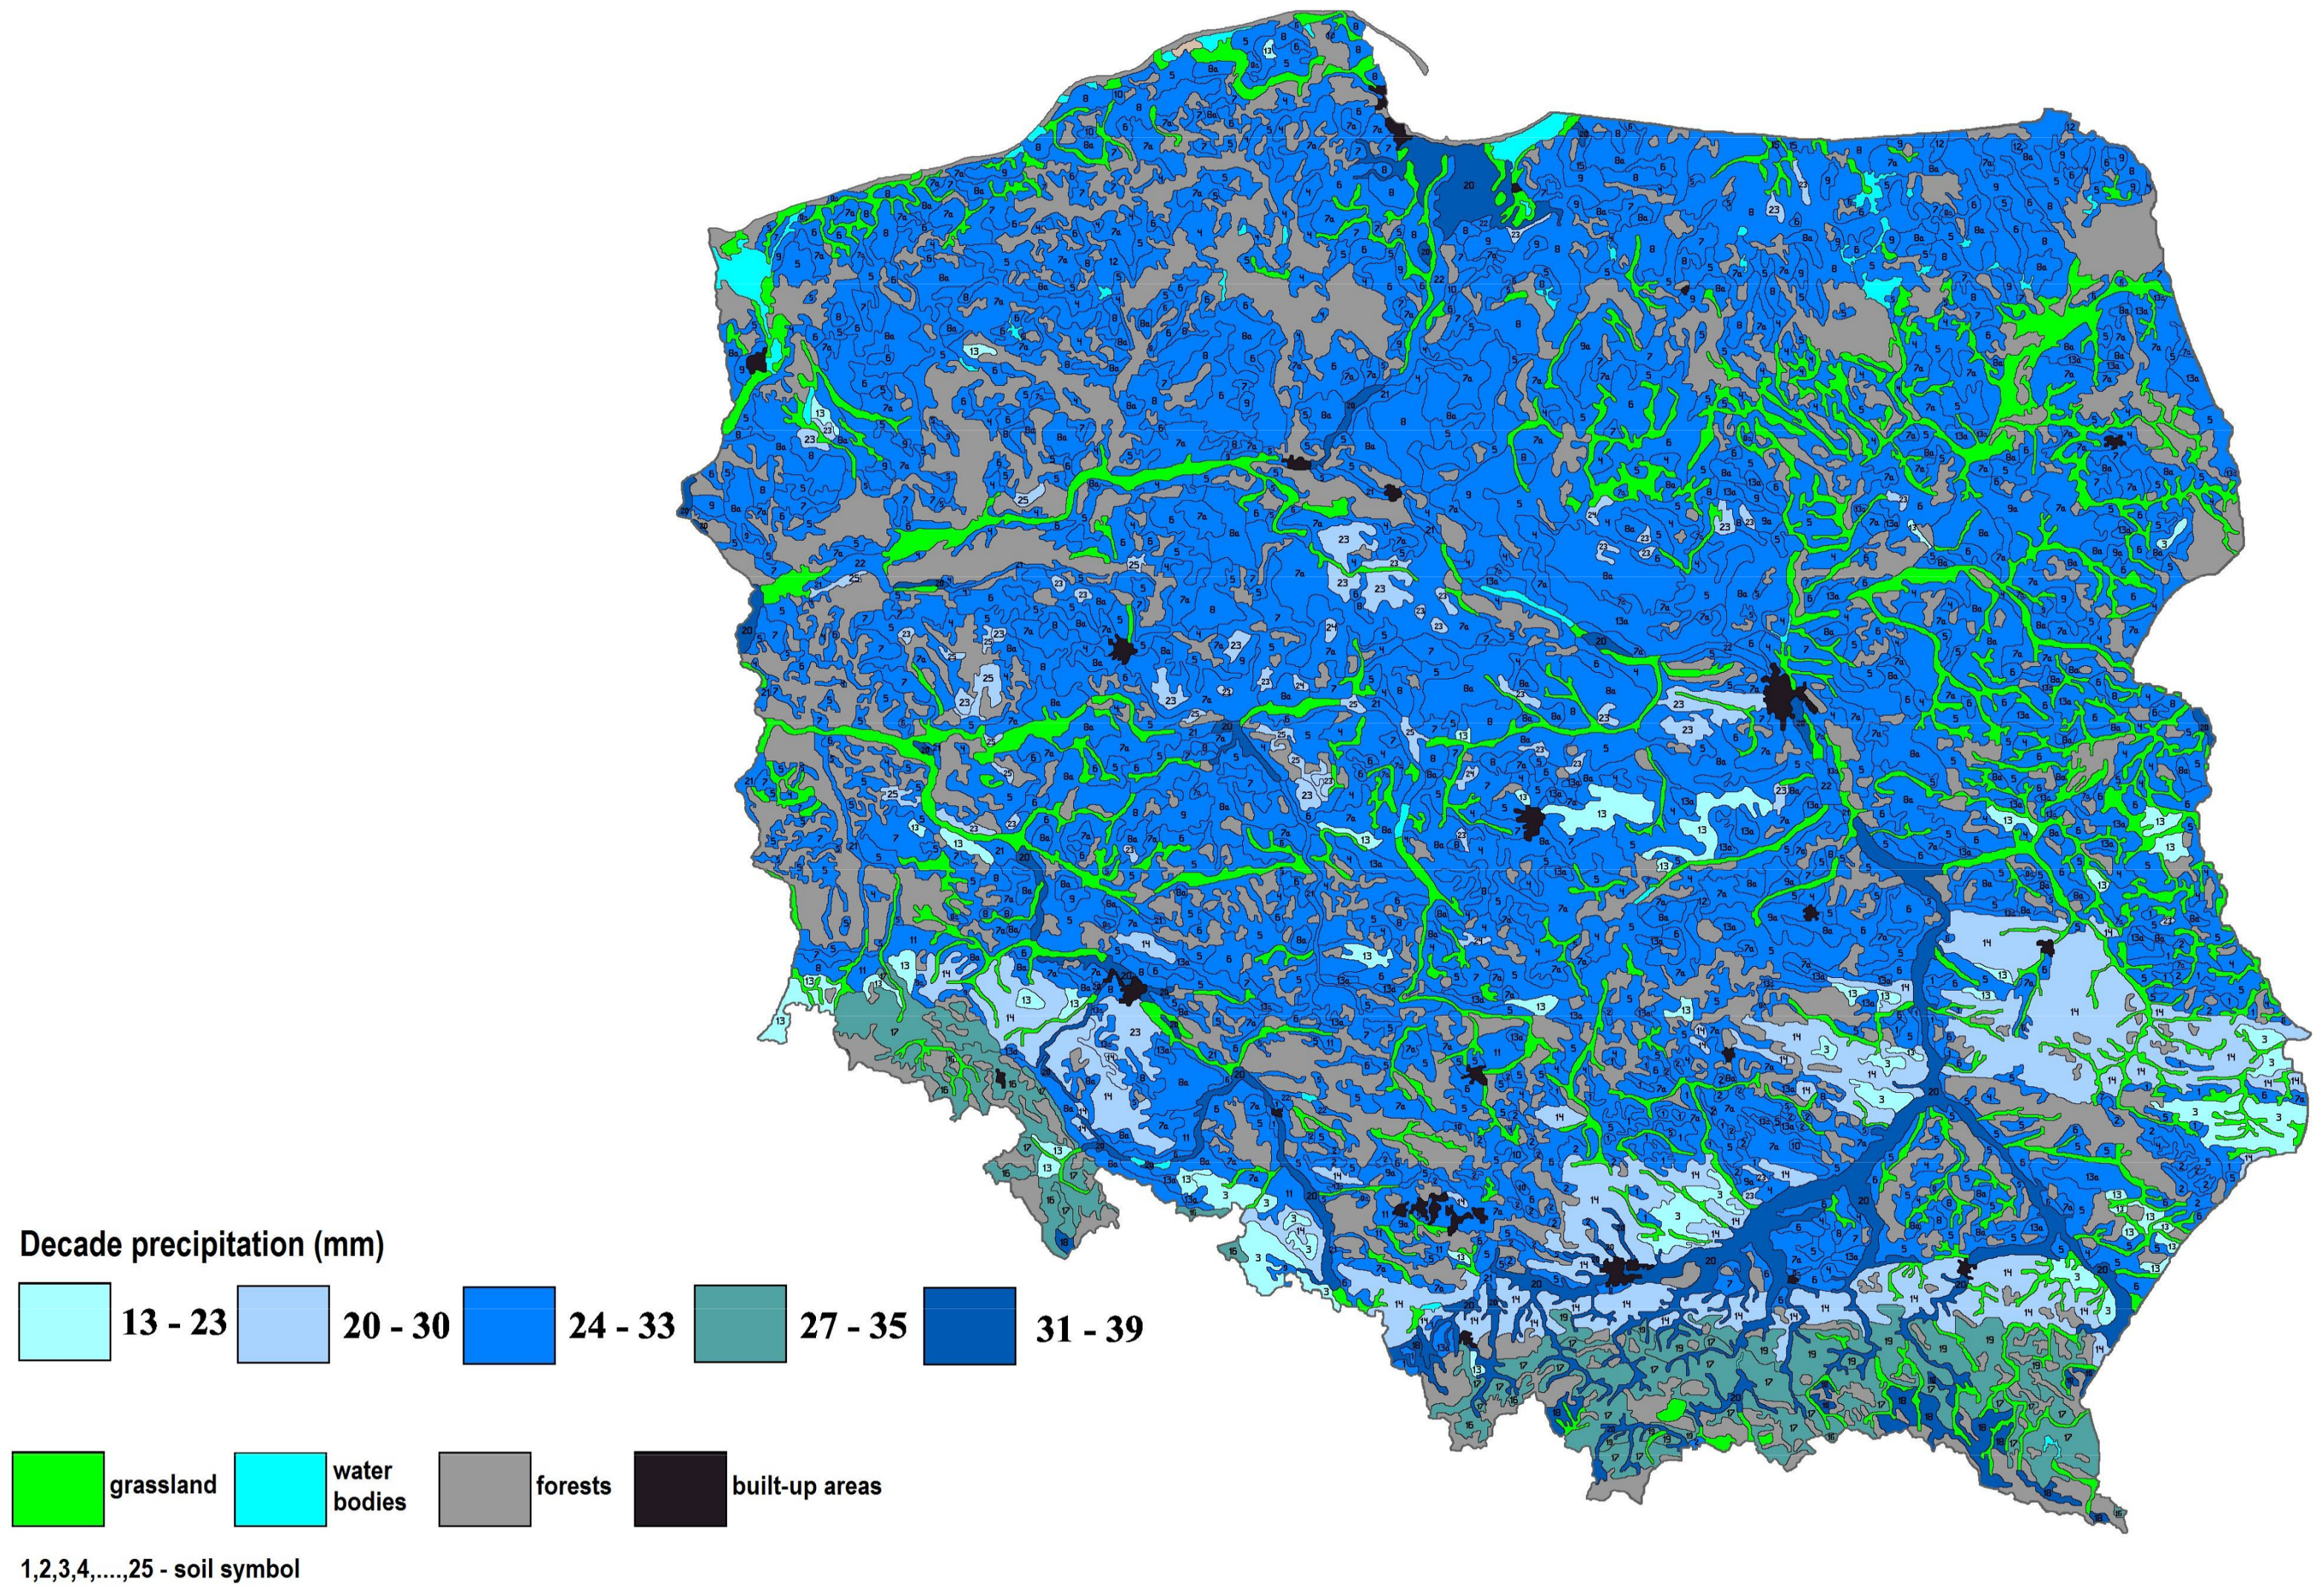
Figure 4.
Map of the decade precipitation (mm) preventing readily available soil water depletion in the profile of arable soils in Poland.
Figure 4.
Map of the decade precipitation (mm) preventing readily available soil water depletion in the profile of arable soils in Poland.

Table 1.
Soil layer thickness and readily available soil water RASW.
| Soil Symbol | Generalized Soil Unit—Derived from 1 | Thickness of the Layer (cm) | RASW (mm) in the Layer | ||||
|---|---|---|---|---|---|---|---|
| I | II | III | I | II | III | ||
| 1 | Rendzic Leptosols (pure) | 20 | 30 | 10 | 9.0 | 13.5 | 4.5 |
| 2 | Rendzic Leptosols (mixed) | 20 | 30 | 10 | 9.0 | 13.5 | 7.5 |
| 3 | Haplic Phaeozems—silt | 30 | 20 | 50 | 22.5 | 15.0 | 37.5 |
| 4 | Haplic Luvisols and Dystric Cambisols—loose sand | 20 | 30 | 50 | 9.0 | 13.5 | 7.5 |
| 5 | Haplic Luvisols and Dystric Cambisols—light loamy sand | 20 | 30 | 50 | 9.0 | 13.5 | 22.5 |
| 6 | Haplic Luvisols and Eutric Cambisols—loamy sand | 25 | 45 | 30 | 11.3 | 33.8 | 13.5 |
| 7 | Eutric Cambisols—loamy sand over loam | 25 | 45 | 30 | 11.3 | 20.3 | 13.5 |
| 7a | Haplic Podzols—loamy sand over loam | 25 | 25 | 50 | 11.3 | 11.3 | 22.5 |
| 8 | Eutric Cambisols—light loam | 25 | 25 | 50 | 11.3 | 11.3 | 22.5 |
| 8a | Haplic Podzols—light loam | 25 | 25 | 50 | 11.3 | 11.3 | 22.5 |
| 9 | Eutric Cambisols—medium loam | 25 | 25 | 50 | 11.3 | 11.3 | 22.5 |
| 9a | Haplic Podzols—medium loam | 25 | 25 | 50 | 11.3 | 11.3 | 22.5 |
| 10 | Eutric Cambisols and Haplic Luvisols—heavy loam | 25 | 25 | 50 | 11.3 | 11.3 | 22.5 |
| 11 | Eutric Cambisols and Haplic Luvisols—loam | 25 | 45 | 30 | 11.3 | 20.3 | 4.5 |
| 12 | Haplic Luvisols and Dystric Cambisols—gravel | 20 | 30 | 50 | 9.0 | 4.5 | 37.5 |
| 13 | Eutric Cambisols—hydrogenic silt | 25 | 25 | 50 | 18.8 | 18.8 | 22.5 |
| 13a | Haplic Podzols—hydrogenic silt | 25 | 25 | 50 | 11.3 | 11.3 | 37.5 |
| 14 | Haplic Luvisols and Eutric Cambisols—loess | 27 | 23 | 50 | 12.2 | 17.3 | 7.5 |
| 15 | Haplic Luvisols and Eutric Cambisols—clay | 20 | 30 | 50 | 9.0 | 4.5 | 22.5 |
| 16 | Haplic Luvisols and Eutric Cambisols—loams and skeleton loam | 15 | 35 | 10 | 6.8 | 15.8 | 4.5 |
| 17 | Haplic Luvisols and Eutric Cambisols—loam | 18 | 32 | 10 | 8.1 | 14.4 | 4.5 |
| 18 | Haplic Luvisols and Eutric Cambisols—massive rock clay | 18 | 32 | 10 | 2.7 | 4.8 | 4.5 |
| 19 | Haplic Luvisols and Eutric Cambisols—silt | 18 | 32 | 10 | 8.1 | 14.4 | 4.5 |
| 20 | Eutric Fluvisols—heavy loam and silt | 25 | 25 | 50 | 3.8 | 3.8 | 7.5 |
| 21 | Distric Fluvisols—sand | 25 | 25 | 50 | 11.3 | 11.3 | 22.5 |
| 22 | Eutric Fluvisols—light silty loam | 25 | 25 | 50 | 11.3 | 11.3 | 22.5 |
| 23 | Gleyic Charnozem—loam and silt | 27 | 23 | 50 | 12.2 | 10.4 | 7.5 |
| 24 | Gleyic Charnozem—sand | 27 | 23 | 50 | 12.2 | 3.5 | 7.5 |
| 25 | Mollic Gleysol | 20 | 30 | 50 | 15.0 | 13.5 | 22.5 |
Table 2.
Critical precipitation Pc in a decade (10-day period) preventing readily available soil water deficit in arable soils in Poland under conditions of maximum evapotranspiration ETPmax.
Table 2.
Critical precipitation Pc in a decade (10-day period) preventing readily available soil water deficit in arable soils in Poland under conditions of maximum evapotranspiration ETPmax.
| Soil Symbol | Generalized Soil Unit—Derived from 1 | Pc (mm) at ETPmax (mm·day−1) | ||||||||
|---|---|---|---|---|---|---|---|---|---|---|
| 3.5 | 4.0 | 4.2 | ||||||||
| I | II | III | I | II | III | I | II | III | ||
| 1 | Rendzic Leptosols (pure) | 26.0 | 21.5 | 30.5 | 31.0 | 26.5 | 35.5 | 33.0 | 28.5 | 37.5 |
| 2 | Rendzic Leptosols (mixed) | 26.0 | 21.5 | 27.5 | 31.0 | 26.5 | 32.5 | 33.0 | 28.5 | 34.5 |
| 3 | Haplic Phaeozems—silt | 12.5 | 20.0 | 0.0 | 17.5 | 25.0 | 2.5 | 19.5 | 27.0 | 4.5 |
| 4 | Haplic Luvisols and Dystric Cambisols—loose sand | 26.0 | 21.5 | 27.5 | 31.0 | 26.5 | 32.5 | 33.0 | 28.5 | 34.5 |
| 5 | Haplic Luvisols and Dystric Cambisols—light loamy sand | 26.0 | 21.5 | 12.5 | 31.0 | 26.5 | 17.5 | 33.0 | 28.5 | 19.5 |
| 6 | Haplic Luvisols and Eutric Cambisols—loamy sand | 23.8 | 1.3 | 21.5 | 28.8 | 6.3 | 26.5 | 30.8 | 8.3 | 28.5 |
| 7 | Eutric Cambisols—loamy sands over loam | 23.8 | 14.8 | 21.5 | 28.8 | 19.8 | 26.5 | 30.8 | 21.8 | 28.5 |
| 7a | Haplic Podzols—loamy sand over loam | 23.8 | 23.8 | 12.5 | 28.8 | 28.8 | 17.5 | 30.8 | 30.8 | 19.5 |
| 8 | Eutric Cambisols—light loam | 23.8 | 23.8 | 12.5 | 28.8 | 28.8 | 17.5 | 30.8 | 30.8 | 19.5 |
| 8a | Haplic Podzols—light loam | 23.8 | 23.8 | 12.5 | 28.8 | 28.8 | 17.5 | 30.8 | 30.8 | 19.5 |
| 9 | Eutric Cambisols—medium loam | 23.8 | 23.8 | 12.5 | 28.8 | 28.8 | 17.5 | 30.8 | 30.8 | 19.5 |
| 9a | Haplic Podzols—medium loam | 23.8 | 23.8 | 12.5 | 28.8 | 28.8 | 17.5 | 30.8 | 30.8 | 19.5 |
| 10 | Eutric Cambisols and Haplic Luvisols—heavy loam | 23.8 | 23.8 | 12.5 | 28.8 | 28.8 | 17.5 | 30.8 | 30.8 | 19.5 |
| 11 | Eutric Cambisols and Haplic Luvisols—loam | 23.8 | 14.8 | 30.5 | 28.8 | 19.8 | 35.5 | 30.8 | 21.8 | 37.5 |
| 12 | Haplic Luvisols and Dystric Cambisols—gravel | 26.0 | 30.5 | 0.0 | 31.0 | 35.5 | 2.5 | 33.0 | 37.5 | 4.5 |
| 13 | Eutric Cambisols—hydrogenic silt | 16.3 | 16.3 | 12.5 | 21.3 | 21.3 | 17.5 | 23.3 | 23.3 | 19.5 |
| 13a | Haplic Podzols—hydrogenic silt | 23.8 | 23.8 | 0.0 | 28.8 | 28.8 | 2.5 | 30.8 | 30.8 | 4.5 |
| 14 | Haplic Luvisols and Eutric Cambisols—loess | 22.9 | 17.8 | 27.5 | 27.9 | 22.8 | 32.5 | 29.9 | 24.8 | 34.5 |
| 15 | Haplic Luvisols and Eutric Cambisols—clay | 26.0 | 30.5 | 12.5 | 31.0 | 35.5 | 17.5 | 33.0 | 37.5 | 19.5 |
| 16 | Haplic Luvisols and Eutric Cambisols—loam and skeleton loam | 28.3 | 19.3 | 30.5 | 33.3 | 24.3 | 35.5 | 35.3 | 26.3 | 37.5 |
| 17 | Haplic Luvisols and Eutric Cambisols—loam | 26.9 | 20.6 | 30.5 | 31.9 | 25.6 | 35.5 | 33.9 | 27.6 | 37.5 |
| 18 | Haplic Luvisols and Eutric Cambisols—massive rock clay | 32.3 | 30.2 | 30.5 | 37.3 | 35.2 | 35.5 | 39.3 | 37.2 | 37.5 |
| 19 | Haplic Luvisols and Eutric Cambisols—silt | 26.9 | 20.6 | 30.5 | 31.9 | 25.6 | 35.5 | 33.9 | 27.6 | 37.5 |
| 20 | Eutric Fluvisols—heavy loam and silt | 31.3 | 31.3 | 27.5 | 36.3 | 36.3 | 32.5 | 38.3 | 38.3 | 34.5 |
| 21 | Distric Fluvisols—sand | 23.8 | 23.8 | 12.5 | 28.8 | 28.8 | 17.5 | 30.8 | 30.8 | 19.5 |
| 22 | Eutric Fluvisols—light silty loam | 23.8 | 23.8 | 12.5 | 28.8 | 28.8 | 17.5 | 30.8 | 30.8 | 19.5 |
| 23 | Gleyic Charnozem—loam and silt | 22.9 | 24.7 | 27.5 | 27.9 | 29.7 | 32.5 | 29.9 | 31.7 | 34.5 |
| 24 | Gleyic Charnozem—sand | 22.9 | 31.6 | 27.5 | 27.9 | 36.6 | 32.5 | 29.9 | 38.6 | 34.5 |
| 25 | Mollic Gleysol | 20.0 | 21.5 | 12.5 | 25.0 | 26.5 | 17.5 | 27.0 | 28.5 | 19.5 |
Table 3.
Relative frequency of critical precipitation for the surface layer.
| Station | Frequency (%) of Critical Precipitation in the Ranges (mm) | ||||
|---|---|---|---|---|---|
| 13–23 | 20–30 | 24–33 | 27–35 | 31–39 | |
| Białystok | 22.1 | 17.8 | 13.8 | 12.5 | 11.0 |
| Biebrza | 21.1 | 16.8 | 12.1 | 9.5 | 8.1 |
| Bielsko–Biała | 19.2 | 17.0 | 12.7 | 13.2 | 11.4 |
| Bydgoszcz | 20.2 | 15.4 | 10.5 | 8.4 | 6.3 |
| Chojnice | 22.2 | 14.3 | 12.2 | 9.5 | 7.8 |
| Częstochowa | 19.7 | 15.4 | 11.9 | 9.2 | 8.9 |
| Elbląg | 22.1 | 17.8 | 13.8 | 12.5 | 11.0 |
| Gniezno | 21.7 | 12.4 | 10.2 | 8.6 | 7.1 |
| Gorzów Wlkp. | 20.3 | 11.7 | 12.2 | 9.0 | 7.6 |
| Jelenia Góra | 20.8 | 22.2 | 16.3 | 12.4 | 10.6 |
| Kalisz | 24.8 | 14.9 | 10.0 | 7.1 | 6.8 |
| Kielce | 23.5 | 15.7 | 11.4 | 8.7 | 9.2 |
| Kłodzko | 23.7 | 16.5 | 12.4 | 9.0 | 7.5 |
| Koło | 20.2 | 15.9 | 11.1 | 8.3 | 5.6 |
| Koszalin | 19.0 | 14.8 | 12.1 | 11.3 | 9.2 |
| Kórnik | 21.6 | 16.5 | 12.2 | 10.6 | 8.1 |
| Kraków | 24.6 | 17.9 | 12.4 | 9.7 | 10.3 |
| Lesko | 20.5 | 17.8 | 15.2 | 14.8 | 12.1 |
| Leszno | 22.9 | 14.3 | 10.8 | 7.6 | 6.7 |
| Lublin | 22.1 | 17.6 | 13.8 | 10.3 | 7.9 |
| Łódź | 22.7 | 17.0 | 12.2 | 8.7 | 7.1 |
| Mława | 23.3 | 16.7 | 12.5 | 9.5 | 8.9 |
| Nowy Sącz | 22.5 | 18.4 | 15.2 | 11.7 | 10.5 |
| Olsztyn | 20.5 | 17.9 | 14.3 | 10.2 | 7.1 |
| Opole | 22.9 | 15.4 | 12.2 | 9.8 | 10.8 |
| Piła | 22.9 | 14.9 | 12.1 | 9.7 | 7.5 |
| Płock | 22.2 | 16.2 | 11.9 | 9.2 | 8.1 |
| Poznań | 21.3 | 15.9 | 12.9 | 8.9 | 5.1 |
| Puławy | 22.7 | 16.3 | 12.7 | 10.2 | 7.5 |
| Racibórz | 23.7 | 16.7 | 13.8 | 12.5 | 10.0 |
| Rzeszów | 20.6 | 18.6 | 14.8 | 10.6 | 8.6 |
| Siedlce | 19.8 | 17.3 | 12.2 | 9.0 | 7.8 |
| Skierniewice | 22.1 | 14.8 | 11.9 | 9.5 | 6.3 |
| Suwałki | 20.8 | 17.9 | 13.3 | 10.2 | 5.9 |
| Szczecin | 23.5 | 12.4 | 9.5 | 8.9 | 8.3 |
| Toruń | 21.4 | 14.9 | 10.6 | 8.4 | 7.1 |
| Warszawa | 24.3 | 16.0 | 10.5 | 8.3 | 8.6 |
| Włodawa | 21.0 | 14.6 | 11.0 | 9.2 | 10.0 |
| Wrocław | 21.6 | 17.0 | 11.9 | 9.0 | 6.5 |
| Zielona Góra | 22.5 | 15.1 | 9.0 | 6.5 | 5.7 |
| mean | 21.9 | 16.2 | 12.3 | 9.8 | 8.3 |
| max | 24.8 | 22.2 | 16.3 | 14.8 | 12.1 |
| min | 19.0 | 11.7 | 9.0 | 6.5 | 5.1 |
Table 4.
Relative frequency of critical precipitation for the soil profile 0–100 cm.
| Station | Frequency (%) of Critical Precipitation in the Ranges (mm) | |||
|---|---|---|---|---|
| 16–27 | 22–31 | 26–35 | 33–39 | |
| Białystok | 21.1 | 14.8 | 14.3 | 7.1 |
| Biebrza | 21.9 | 14.4 | 11.3 | 6.3 |
| Bielsko–Biała | 19.4 | 14.1 | 14.1 | 8.6 |
| Bydgoszcz | 18.7 | 12.1 | 9.5 | 4.1 |
| Chojnice | 19.8 | 12.2 | 10.8 | 5.6 |
| Częstochowa | 20.5 | 13.7 | 10.5 | 7.1 |
| Elbląg | 21.1 | 14.8 | 14.3 | 7.1 |
| Gniezno | 18.9 | 11.3 | 10.0 | 5.1 |
| Gorzów Wlkp. | 16.8 | 11.9 | 9.4 | 4.8 |
| Jelenia Góra | 24.0 | 17.8 | 14.1 | 8.3 |
| Kalisz | 22.2 | 11.6 | 8.1 | 5.1 |
| Kielce | 21.7 | 12.9 | 10.0 | 6.5 |
| Kłodzko | 24.4 | 13.8 | 11.6 | 5.7 |
| Koło | 19.7 | 11.7 | 8.9 | 3.2 |
| Koszalin | 16.8 | 13.0 | 12.5 | 6.2 |
| Kórnik | 20.6 | 12.1 | 11.6 | 5.4 |
| Kraków | 23.7 | 13.2 | 11.0 | 7.0 |
| Lesko | 19.2 | 15.7 | 16.5 | 9.2 |
| Leszno | 19.8 | 11.6 | 8.7 | 4.8 |
| Lublin | 21.0 | 14.4 | 11.7 | 5.6 |
| Łódź | 21.4 | 14.3 | 11.1 | 4.8 |
| Mława | 21.4 | 13.0 | 11.4 | 5.9 |
| Nowy Sącz | 22.9 | 15.7 | 14.0 | 6.5 |
| Olsztyn | 21.4 | 15.4 | 11.6 | 4.8 |
| Opole | 21.6 | 13.2 | 11.3 | 7.8 |
| Piła | 20.6 | 12.2 | 11.6 | 4.4 |
| Płock | 20.6 | 12.2 | 11.0 | 5.6 |
| Poznań | 19.0 | 13.8 | 10.3 | 3.2 |
| Puławy | 20.5 | 14.3 | 11.9 | 5.1 |
| Racibórz | 21.4 | 13.8 | 13.8 | 7.1 |
| Rzeszów | 23.0 | 17.1 | 12.4 | 6.8 |
| Siedlce | 21.0 | 15.2 | 11.7 | 6.2 |
| Skierniewice | 18.1 | 11.3 | 11.3 | 4.3 |
| Suwałki | 21.0 | 15.4 | 11.9 | 4.0 |
| Szczecin | 19.4 | 9.5 | 10.0 | 5.9 |
| Toruń | 19.5 | 12.1 | 9.7 | 5.6 |
| Warszawa | 23.0 | 12.7 | 10.2 | 7.0 |
| Włodawa | 20.8 | 12.4 | 10.8 | 7.3 |
| Wrocław | 21.7 | 12.9 | 10.8 | 4.6 |
| Zielona Góra | 21.6 | 11.9 | 7.1 | 4.8 |
| mean | 20.8 | 13.4 | 11.3 | 5.9 |
| max | 24.4 | 17.8 | 16.5 | 9.2 |
| min | 16.8 | 9.5 | 7.1 | 3.2 |
Table 5.
Indicative area distribution of arable soils of Poland according to the ranges of critical precipitation preventing readily available soil water depletion in the growing period of arable crops.
Table 5.
Indicative area distribution of arable soils of Poland according to the ranges of critical precipitation preventing readily available soil water depletion in the growing period of arable crops.
| Layer | |||||
|---|---|---|---|---|---|
| Surface arable | |||||
| 100-cm soil profile | – | ||||
© 2018 by the authors. Licensee MDPI, Basel, Switzerland. This article is an open access article distributed under the terms and conditions of the Creative Commons Attribution (CC BY) license (http://creativecommons.org/licenses/by/4.0/).
Share and Cite
MDPI and ACS Style
Łabędzki, L.; Ostrowski, J. Precipitation Preventing a Deficit of Readily Available Soil Water in Arable Soils in Poland. Atmosphere 2018, 9, 121. https://doi.org/10.3390/atmos9040121
AMA Style
Łabędzki L, Ostrowski J. Precipitation Preventing a Deficit of Readily Available Soil Water in Arable Soils in Poland. Atmosphere. 2018; 9(4):121. https://doi.org/10.3390/atmos9040121
Chicago/Turabian StyleŁabędzki, Leszek, and Janusz Ostrowski. 2018. "Precipitation Preventing a Deficit of Readily Available Soil Water in Arable Soils in Poland" Atmosphere 9, no. 4: 121. https://doi.org/10.3390/atmos9040121
Note that from the first issue of 2016, this journal uses article numbers instead of page numbers. See further details here.