Review

Sources of Airborne Endotoxins in Ambient Air and Exposure of Nearby Communities—A Review

1
School of Engineering and Innovation, Open University, Milton Keynes MK7 6AA, UK
2
School of Water, Energy and Environment, Cranfield University, Milton Keynes M43 0AL, UK
3
Peninsula Schools of Medicine and Dentistry, Plymouth University, Plymouth PL4 8AA, UK
4
Air Quality Management Resource Centre, Faculty of Environment and Technology, University of the West of England, Bristol BS16 1QY, UK
5
Biosafety, Air and Water Microbiology Group, Public Health England, Porton Down SP4 0JG, UK
6
Environment Agency, Environment and Business Directorate, Deanery Road, Bristol BS1 5AH, UK
*
Author to whom correspondence should be addressed.
Atmosphere 2018, 9(10), 375; https://doi.org/10.3390/atmos9100375
Submission received: 15 July 2018 / Revised: 18 September 2018 / Accepted: 19 September 2018 / Published: 26 September 2018
(This article belongs to the Special Issue Impacts of Air Pollution on Human Health)

Abstract

:
Endotoxin is a bioaerosol component that is known to cause respiratory effects in exposed populations. To date, most research focused on occupational exposure, whilst much less is known about the impact of emissions from industrial operations on downwind endotoxin concentrations. A review of the literature was undertaken, identifying studies that reported endotoxin concentrations in both ambient environments and around sources with high endotoxin emissions. Ambient endotoxin concentrations in both rural and urban areas are generally below 10 endotoxin units (EU) m−3; however, around significant sources such as compost facilities, farms, and wastewater treatment plants, endotoxin concentrations regularly exceeded 100 EU m−3. However, this is affected by a range of factors including sampling approach, equipment, and duration. Reported downwind measurements of endotoxin demonstrate that endotoxin concentrations can remain above upwind concentrations. The evaluation of reported data is complicated due to a wide range of different parameters including sampling approaches, temperature, and site activity, demonstrating the need for a standardised methodology and improved guidance. Thorough characterisation of ambient endotoxin levels and modelling of endotoxin from pollution sources is needed to help inform future policy and support a robust health-based risk assessment process.

1. Introduction

Endotoxin, a cellular component of the outer membrane of the cell wall of Gram-negative bacteria, consisting of lipids and lipopolysaccharides (LPS), is one component of bioaerosols that can cause symptomatic effects in exposed individuals. Endotoxin is found in high concentrations in the air at sites that handle organic material such as composting facilities, intensive farms, and wastewater operations [1,2,3]. Occupational exposure to endotoxins from such sites was previously documented [4,5]. However, much less is known about the emissions of endotoxins from these facilities to the wider environment and the potential exposure of communities around bio-waste facilities.
Inhaled endotoxin is linked to various health outcomes, for example, fever, headaches, wheezing, and nose and throat irritation, and was also shown to cause an immune response in humans [6,7]. There is also evidence that endotoxin exposure may offer some protective effects, reducing cases of allergic sensitisation, particularly in children, for example, atopic asthma [5,8,9]. Despite this, endotoxin is more widely associated with negative health outcomes [8]. There are currently no exposure limits for endotoxin in the United Kingdom (UK); however, an occupational health limit for endotoxin (averaged over 8 h) of 90 endotoxin units (EU) m−3 was suggested by the Heath Council of The Netherlands [10] based on a no-observed-effect level (NOEL). A 30 EU m−3 exposure limit is proposed for the general public which is the occupational NOEL of 90 EU m−3 divided by an uncertainty factor of 3. This is due to a lack of understanding as to how to discount the averaging time used in occupational health limits for the general public [10].
This review aims to identify reported endotoxin levels in ambient environments and at sites where high endotoxin concentrations may be expected. Factors that may influence endotoxin concentration such as temperature, size fraction, and sampling environment are also considered. To our knowledge, no studies currently summarise existing data on airborne endotoxin concentrations from different sources of pollution at varying distances from the source.

2. Materials and Methods

A review of the literature was undertaken using three databases (PubMed, ScienceDirect, and Web of Science). The grey literature was also searched using Google and Google Scholar. All searches included the keyword endotoxin or bioaerosol or airborne first, followed by additional relevant keywords separately in turn (Supplementary Materials). Studies were excluded if they did not measure and analyse endotoxin in outdoor air and report endotoxin concentrations per m3. They were also excluded if gas chromatography–mass spectrometry (GC–MS) was used to measure endotoxin due to lack of a standardised GC–MS method for endotoxin analysis and a potential overestimation of endotoxin concentrations [4,11]. Where necessary, endotoxin concentrations were converted from nanograms (ng) to endotoxin units (EU) using a conversion factor of 10 (United States Pharmacopeia (USP) Reference Standard Endotoxin; 1 EU = 0.1 ng).

3. Endotoxins in Ambient Air

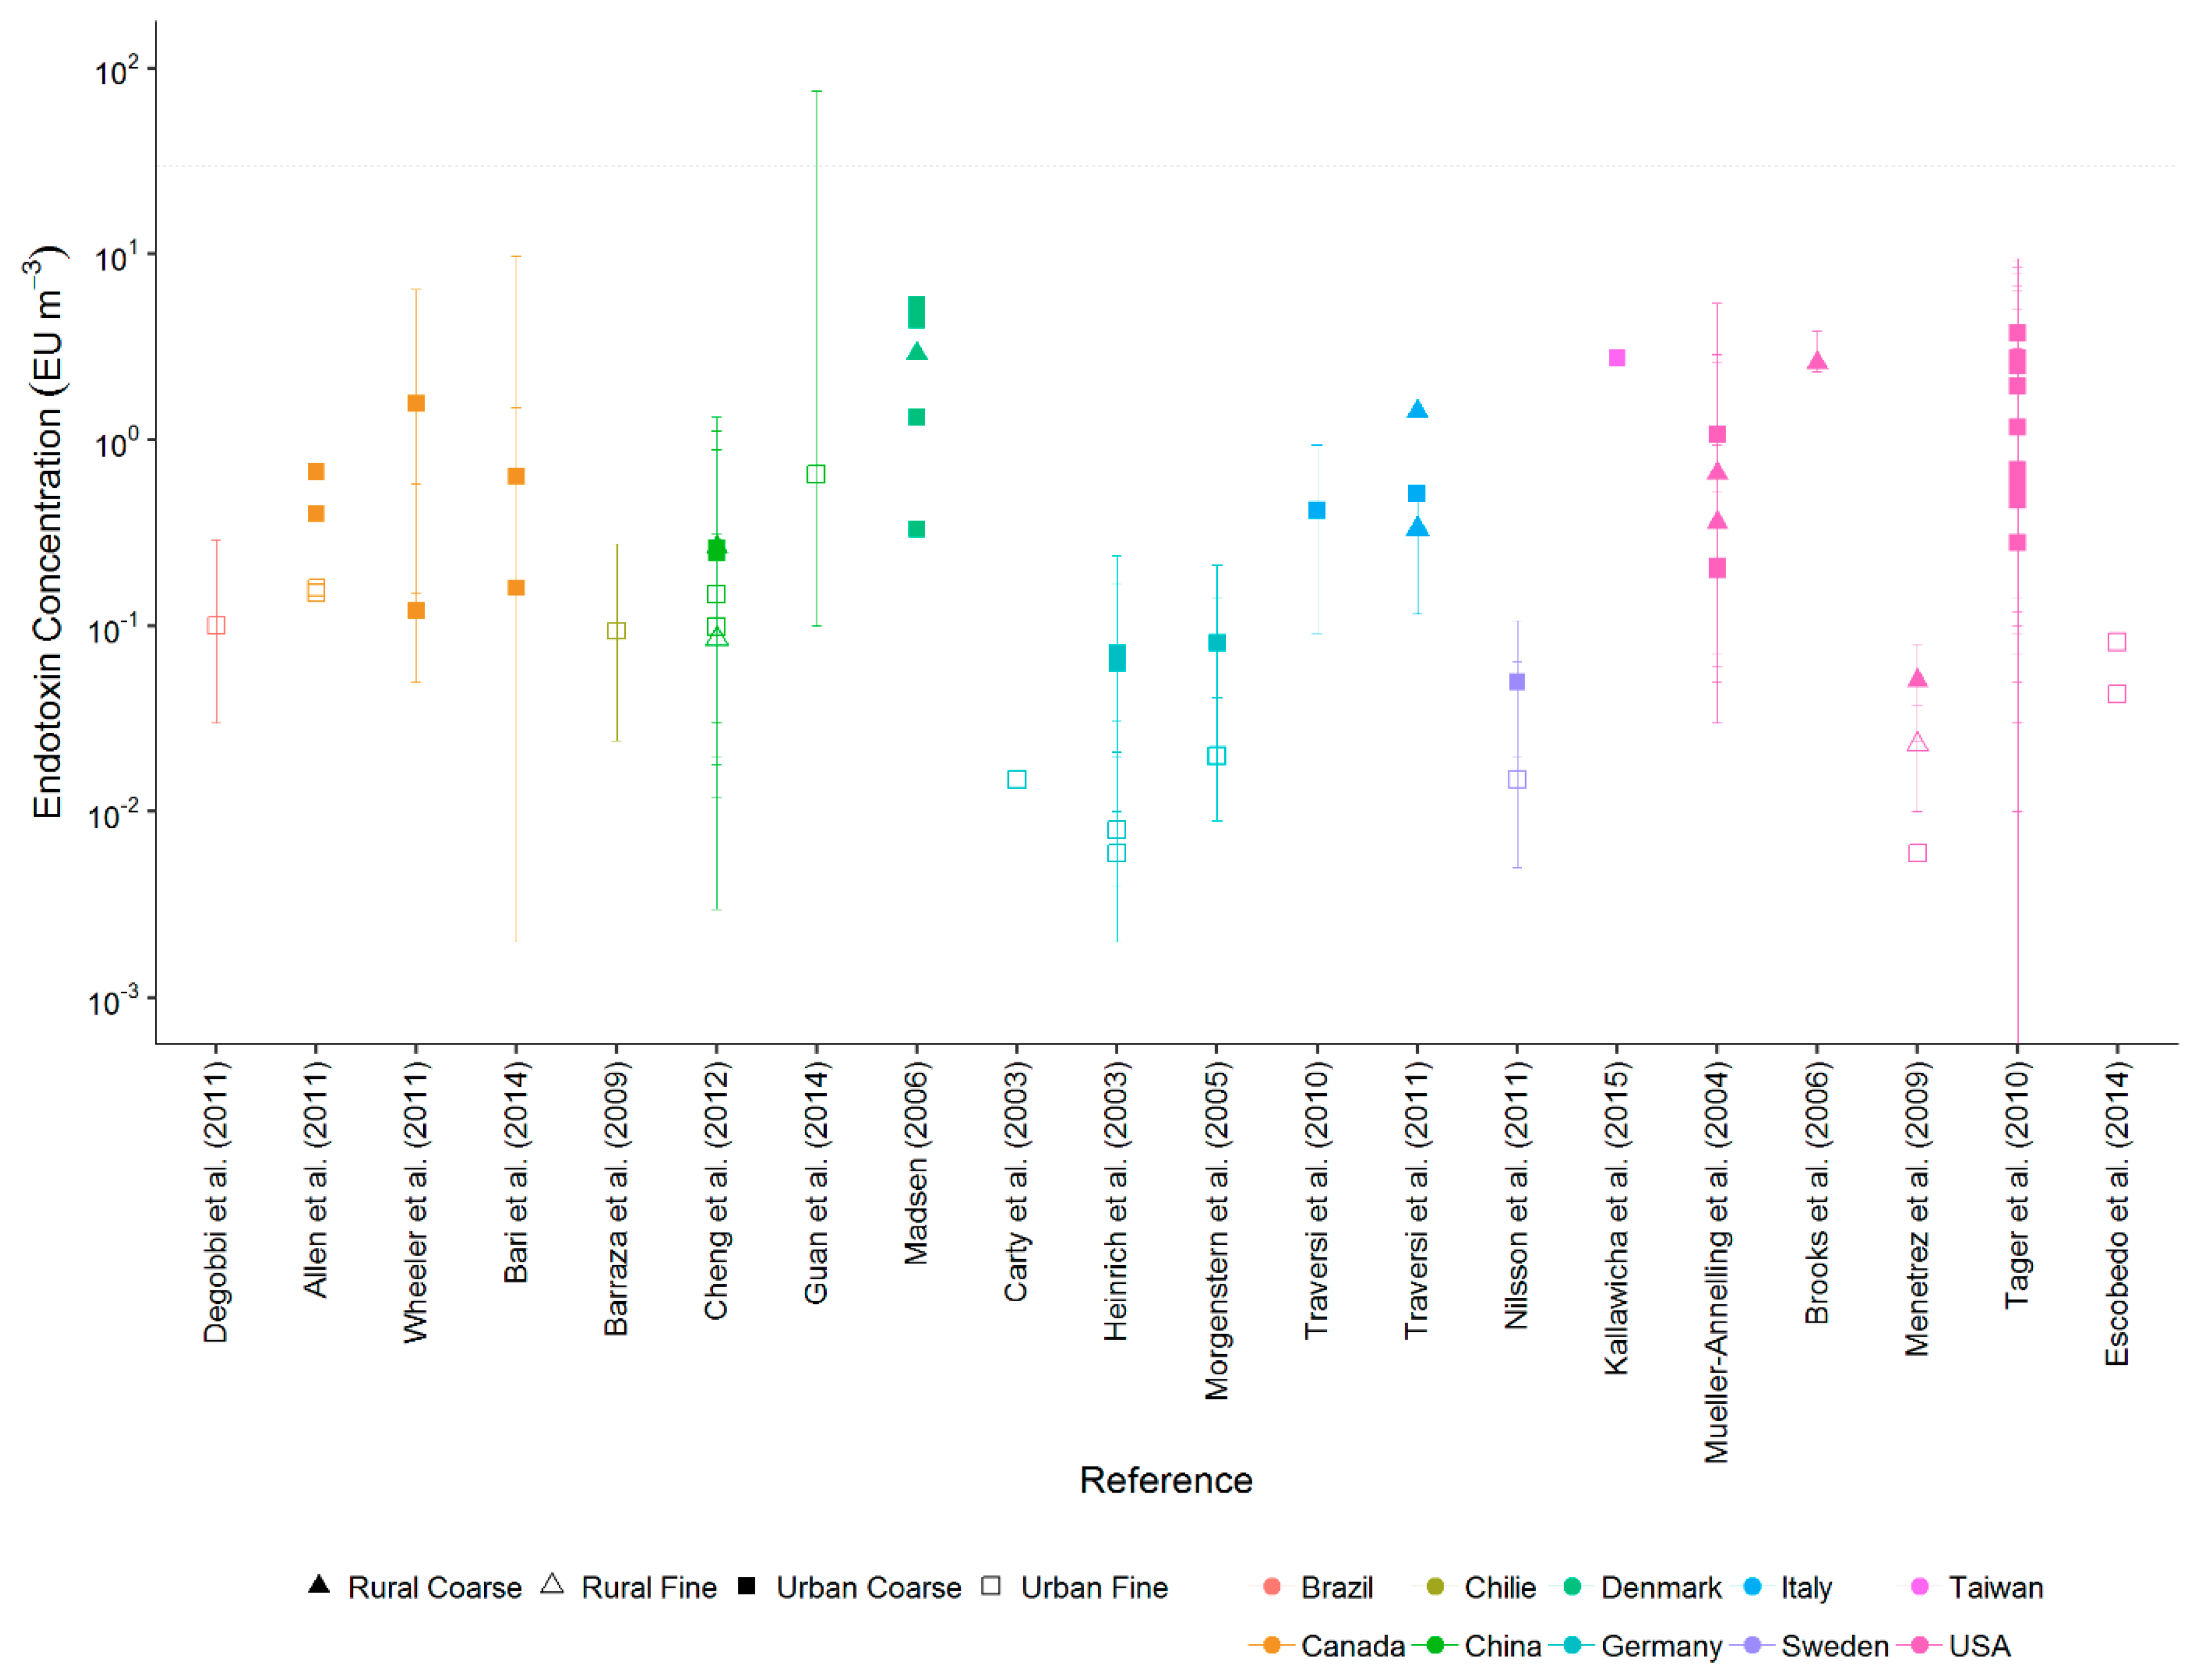
3.1. Endotoxin Concentrations in Urban and Rural Areas

Characterising ambient concentrations of endotoxins is vital for evaluating the impact of potential sources such as waste sites and intensive farms. Reported endotoxin concentrations in ambient air are generally below the proposed threshold of 30 EU m−3. Mean or median concentrations reported in the literature are in the range of 0.006–5.7 EU m−3 (Table 1). These results are in line with another study that reported ambient endotoxin concentrations generally below 10 EU m−3 [8].
The highest reported maximum ambient concentrations originated from polluted urban areas. Concentrations up to 75 EU m−3 were recorded in an urban environment in Beijing [12] where particulate matter concentrations are known to exceed the World Health Organisation air quality guidelines by more than 30 times [13]. There appears to be no significant difference between endotoxin concentrations in urban and rural areas. Menetrez et al. [14] reported higher endotoxin concentrations in rural areas compared to urban areas, but concentrations were very low (means of 0.0057 and 0.023 EU m−3 in the respirable particulate matter (PM2.5) fraction in urban and rural areas, respectively). Tager et al. [15] measured endotoxin concentrations in an urban area surrounded by agricultural land. Endotoxin concentrations decreased with distance from agricultural activities during the dry season (4.3–5.7 EU m−3). This is unsurprising as soil and vegetation were previously identified as potential sources of airborne endotoxin [16]. In contrast, Mueller-Anneling et al. [17] reported endotoxin concentrations at urban sites downwind of Los Angeles higher than at rural sites (geometric means of 1.07 and 0.36 EU m−3, respectively).
A more important determinant of endotoxin concentrations in urban and rural areas is likely to be activity that is occurring in the local area. For example, Schulze et al. [18] reported mean endotoxin concentrations of up to 23.2 EU m−3 in a rural area heavily impacted by intensive livestock production. This can also be seen indoors with much higher endotoxin levels reported in the floor dust of rural farmhouses compared to urban houses (6600 and 3800 ng·g−1, respectively) [19]. In contrast, Madsen [20] reported higher endotoxin concentrations from the air around a biofuel plant (median of 5.3 EU m−3) and heavily congested streets (median of 4.4 EU m−3) compared to residential areas (median of 0.33 EU m−3) and an agricultural field (median of 2.9 EU m−3), where there was little activity.
Another important consideration when determining endotoxin concentration is the sampling approach. A range of sampling methods were used in ambient endotoxin studies. Flow rates varied from 2 to 1270 L min−1 and sampling duration ranged from 0.17 to 193 h with the most common period being 24 h (Table 1). These factors could have a significant impact on reported concentrations; long sampling times or high flow rates could lead to the destruction of cells or potential release of bioactive endotoxins. Sampling height also varied from 0.5 m to the top of a 23-story building. Sampling several metres above the ground is unlikely to give an accurate indication of concentrations that could be used to assess potential exposure. These factors make direct comparisons between studies challenging, as comparisons between sites can only be accurately interpreted when the same sampling and analysis methods are used. Despite this, most studies report mean or median endotoxin concentrations within a similar range with none exceeding the proposed 30 EU m−3 endotoxin limit.

3.2. Temperature

Ambient endotoxin concentrations often vary seasonally with most studies reporting fewer airborne endotoxins during the winter than during the summer, when conditions may support the growth of Gram-negative bacteria [15,21,22,29,31,36]. Mueller-Annelling et al. [17] reported higher endotoxin concentrations in June–September, but no obvious seasonal patterns, whilst another study undertaken in Beijing reported the highest endotoxin concentrations during the spring when the weather is usually dry and windy (0.15–75.02 EU m−3) [12]. Several studies showed that temperature has an effect on endotoxin concentration [21,25,27]. Allen et al. [21] found endotoxin concentrations in PM10 to be related to temperature with low endotoxin concentrations independent of temperature below 5 °C. Endotoxin concentrations were found to be highest during warm periods and moderate humidity (35–75%) [21]. Several studies reported a negative association between endotoxin concentrations and increasing humidity, probably due to rapid aerosol sedimentation [23,25,34]. In contrast, Degobbi et al. [27] found endotoxin to be correlated with temperature, but not humidity. This may be due to other influences, such as temperature and wind being more important in determining concentrations than humidity [34].
In many environments, the relationship between endotoxins and temperature and humidity is likely to be complex. For example, in a year-long study, Cheng et al. [26] found different endotoxin concentration profiles in different cities despite them having similar climatic conditions. Whilst the impact of differences in vegetation was discounted, the authors suggested the differences could be explained by differences in bacterial fauna and growth rates [26]. Furthermore, the size fraction may impact how the particle behaves [33]. They reported a moderate negative correlation between PM2.5 and humidity, and a moderate positive correlation for PM10. The same study also reported a weakly negative correlation for PM10 and temperature, and a weakly positive correlation for PM2.5 [33]. It is likely that a range of factors including temperature, humidity, vegetation, wind speed, presence of gaseous pollutants, and specific meteorological conditions will impact endotoxin concentrations. To fully understand the seasonal profile of endotoxins in ambient air, it would need to be measured on a case-by-case basis, and may vary dependent on the exact conditions of the measuring location.

3.3. Size Fractionation

Studies reported endotoxins in PM10–2.5 or PM10 (coarse) or PM2.5 (fine) fractions. Most studies used the coarse fraction (PM10–2.5); however, two studies reported PM10, which would also include the fine fraction [14,21]. Higher concentrations of endotoxins are largely associated with coarser-size fractions in the literature (Figure 1). Reported endotoxin concentrations measured in the fine and coarse particulate range are significantly different (p < 0.05) with means and ranges of 0.11 (0.006–0.65) EU m−3 and 1.13 (0.05–5.7) EU m−3 respectively, however data reporting endotoxin concentration in the coarse fraction is more readily available (Figure 1). Two studies identified endotoxin levels in the coarse fraction to be 10 times higher than in the fine fraction [29,33]. Comparisons between the coarse and fine fraction of particles are only possible if the study was undertaken in the same area. Of the six studies that meet this criteria, endotoxin levels were consistently higher in the coarse fraction. There is moderate-to-good correlation between reported endotoxin and PM10 [17,32]. Other studies indicated that the relationship may be seasonal with high correlation in the summer (r = 0.72) and low correlation in the winter (r = 0.33) [17].
The reason for higher endotoxin concentrations in the coarse fraction remains unclear. Particle surface chemistry can influence the particle interaction with macrophage surface receptors, which may, in turn, also affect the inflammatory response [37]. An examination of particles collected from an urban area identified that the main difference between the coarse and fine fraction was the presence of more carbon-rich particles in the fine fraction and silicates in the coarse fraction [38]. Lipopolysaccharides (LPS) may preferentially associate with the silicates or heavy metals found in larger (coarse) particles in urban environments, leading to higher concentrations [33,38]. PM10 was shown to be important in generating an inflammatory response in humans [39,40]; it was suggested that the contaminants adsorbed onto the particles, such as endotoxins, may be responsible for the release of inflammatory mediators [38]. Soukup and Becker [41] identified that particle-bound endotoxins from an urban area are prominent pro-inflammatory components of inhalable particulate matter (PM10).

4. Anthropogenic Sources of Endotoxins

4.1. Endotoxins from Composting Facilities

Several studies measured endotoxin emissions and immissions from waste facilities such as compost sites (Table 2). Pankhurst et al. [42] identified that composting can impact ambient endotoxin concentrations, which has a similar dispersal pattern to viable bioaerosols. Endotoxin measurements at the source are highly variable ranging from 0.56 to greater than 18,000 EU m−3. This could be due to a range of reasons, but most likely varies with site activity during sampling (Table 2). Endotoxin concentrations are significantly higher during periods of activity when material is being agitated. For example, one study reported that the mean endotoxin concentration from samples taken 0–290 m from the site during compost turning was 10.73 EU m−3 compared to 2.04 EU·m−3 at the source when no activity was taking place [43]. Sykes et al. [44] identified that manual sorting of the waste resulted in the highest exposure for employees at compost facilities (86.11 EU m−3), and shredding resulted in the highest increase in endotoxin concentration measured from static samplers placed close to the different operational areas (23.48 EU m−3). However, there was no significant difference between employee exposure to endotoxin during sorting, shredding, turning, and screening of waste. Variability of endotoxin release has implications for its measurement. It is important that the impact of site activity is considered when assessing emissions to the environment and the subsequent exposure for nearby residents.
Different approaches to composting may result in variable bioaerosol concentrations, for example, whilst in-vessel composting allows for close control of temperature and pathogens, it does not necessarily result in a lower bioaerosol load [45]. Sykes et al. [44] reported that employees working outdoors at composting facilities were exposed to higher endotoxin concentrations compared to those working indoors, possibly due to higher indoor humidity (42.33 and 14.09 EU m−3, respectively). This highlights the potential for nearby communities to be affected by outdoor operations, especially as endotoxins may be easily dispersed and remain an issue regardless of whether the agents in the bioaerosol are viable or not. Similarly, different types of compost will produce different amounts of endotoxin with different peak periods. For example, in a pilot-scale experiment with household waste, 9–11-week-old compost had significantly more endotoxins (0.83–2.4 × 10⁶ EU g−1) than compost 0–5 weeks old (0.024–0.23 × 10⁶ EU g−1) [46]. In a lab-scale experiment composting swine manure, the airborne endotoxin concentration was 1820 EU m−3 during the thermophilic phase of the experiment, which then decreased exponentially before rising slightly during the mesophilic stage [47]. The variability in release is probably due to early cell destruction in the swine manure, which reached a temperature of nearly 60 °C within 30 h, releasing high quantities of endotoxin through cell destruction and potentially convection due to the temperature. Cell-bound endotoxins are not effectively measured through the chromogenic process [11], and it can be expected that green waste would be broken down over a longer period.
Measuring the environmental emissions around composting facilities is challenging and it is difficult to draw conclusions about environment effects without many repeat sampling trips across an extended time period. Many of the studies focused on occupational exposure, rather than emissions to the environment, and this is something that requires more exploration. In particular, it would be useful to have more source emission data in order to help inform accurate models about the potential spread of endotoxins in the environment. Ideally, further studies designed to incorporate health data would be of most interest.

4.2. Endotoxins from Intensive Farming

Mean onsite or downwind endotoxin concentrations from a range of farms including, swine, poultry, and cattle ranged from 1.6–2576 EU m−3 (Table 3), which is similar to the range of concentrations reported from composting facilities. The impact of livestock farming on nearby communities was previously explored by Schulze et al. [18], who identified that people in rural areas are likely to be exposed to higher endotoxin concentrations than those in urban areas, possibly due to intensive farming operations. Indeed, people living within 500 m of more than 12 animal houses had a 7% lower mean forced expiratory volume in one second (FEV1) value compared to a control population with fewer than five animal houses within 500 m [55].
A variety of different farming types were reported which will be affected by a range of factors, including the number and type of animals present in the facility, the age of the animals, and animal activity. Intensive feeding operations in the United States of America (USA) and other parts of the world are also very different from facilities in the European Union. In the USA, for example, a concentrated animal feeding operation (CAFO) crates large numbers of animals in a small space. In the European Union, veal crates, battery cages, and sow stalls were all banned [56]. To illustrate, a comparison between a swine confinement operation, with a slatted floor over a manure pit, and a hoop system, where animals have more freedom and composted bedding, found endotoxin concentrations of 59.5 and 194 EU m−3, respectively, 30 m downwind of the operations; this paper demonstrated that higher standards of welfare did not necessarily translate into improvements in environmental emissions [57].
Very high endotoxin concentrations at intensive farms were previously reported in occupational studies. For instance, in a study of nine different industries, animal handlers were found to be exposed to the highest levels of endotoxin (719,950 EU m−3) [63]. Similarly, high concentrations of endotoxins, 98,990 EU m−3 and 83,640 EU m−3, were measured inside swine and poultry buildings, respectively [2,61]. In contrast, a study of bioaerosol exposure of workers on different types of farms found that, in cattle barns, the endotoxin concentration was just 0.925 EU m−3, whilst the highest endotoxin exposure was recorded on a thyme herb farm (42,955 EU m−3) [64]. It is unclear if certain types of farm can result in the release of more endotoxins, and it is likely that other not yet investigated agricultural sources may be important contributors to the endotoxin load. Overall, endotoxin concentrations are likely to vary significantly dependent on a number of factors, including the type of farm, number of animals, associated activity, ventilation systems, and waste management, all of which require more investigation.

4.3. Other Endotoxin Sources

A range of other environments were identified as potential sources of endotoxins (Table 4). The most significant sources include the spreading of biosolids to land where mean 2-m and 10-m downwind concentrations of 469 and 36 EU m−3, respectively, were reported [24,65]. Wastewater treatment facilities also appear to be a significant endotoxin source, where an average concentration of 70 EU m−3 was reported from outside processes [66], whilst endotoxin concentrations as high as 1850 EU m−3 were measured at an indoor facility [3]. Water features were also associated with endotoxins where concentrations exceeding 60 EU m−3 were reported 15 m downwind of the installation [67]. High levels of endotoxin exposure were also reported during refuse collection. Waste type had a significant impact on exposure with domestic, residual, and organic waste leading to higher concentrations (1.2–82.1 EU m−3) than recyclable waste (0.4–11.1 EU m−3) [68]. Endotoxin concentrations after flooding and from marine environments were also reported, but were not found to be significantly elevated compared to the ambient studies [69,70].

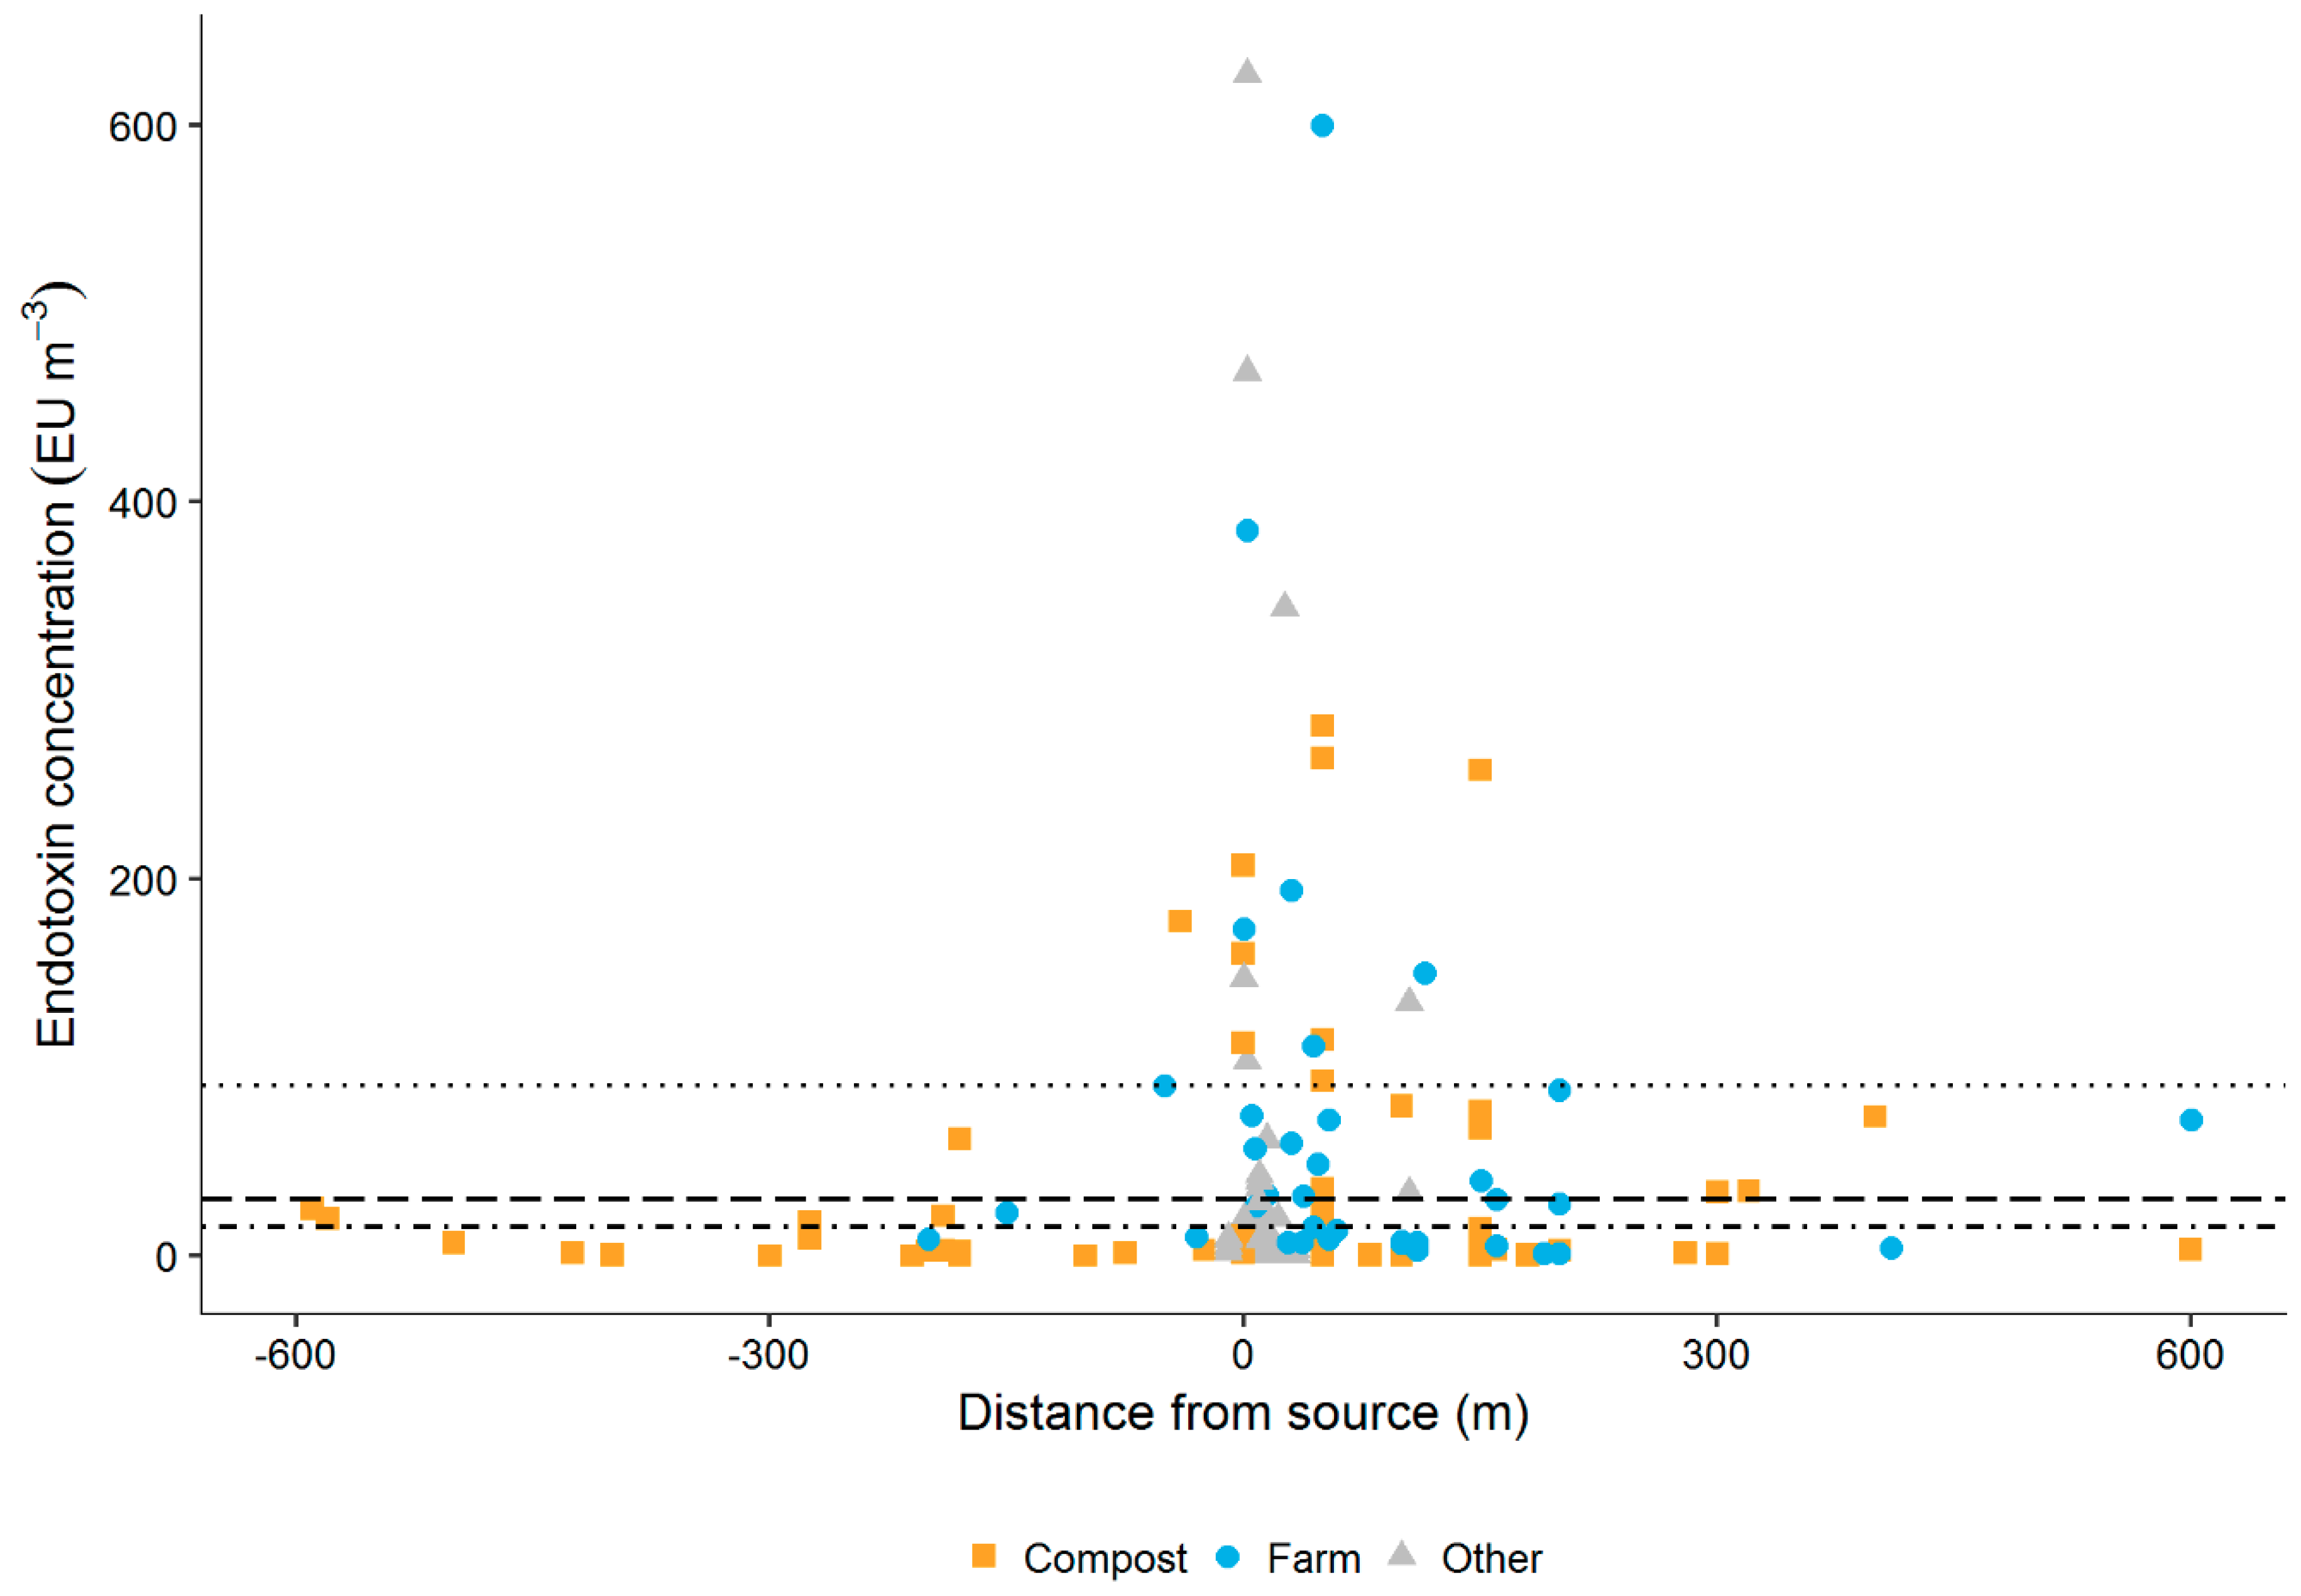
4.4. Distribution of Endotoxins from Anthropogenic Sources

Based on the data from Table 2, Table 3 and Table 4, it is possible to identify a number of studies that measured endotoxins at difference distances upwind and downwind of anthropogenic sources (Figure 2). Studies of endotoxins in ambient environments demonstrate that background endotoxin concentrations rarely exceed 10 EU m−3; however, the upwind concentrations reported in the distance studies often exceeded this value. One study reported 40-m upwind concentrations of 177.5 EU m−3 [52]. The authors proposed a number of reasons for the high concentration, including changes in wind direction or agricultural activity close to the sampling point [52]. Upon excluding three sample points with very high upwind concentrations [51,52,60], likely influenced by other sources, 46% of downwind samples exceeded the upwind 95th percentile, demonstrating that the source has a significant impact on local endotoxin concentrations.
The distance that endotoxins travel may vary due to a number of factors. Dungan and Leytem (2009) [58] reported that concentrations more than double the upwind values were measured more than a kilometre away from the source; although, at this distance, the influence of other endotoxin sources should be taken into consideration. Concentrations exceeding the occupational standard NOEL of 90 EU m−3 can occur up to 150 m away from the source, which could potentially impact nearby residents (Figure 2). Out of the 151 reported data points, 22 had levels exceeding 90 EU m−3, and an additional 25 data points exceeded the proposed limit of 30 EU m−3 for the general public (Figure 2). Of the samples taken 100 m or further away from the source, 38% of samples were above 30 EU m−3. Generally, intensive farming and composting emit a similar range of endotoxin concentrations; however, there is a lack of emission data beyond 300 m from the source, with just four studies reporting at this distance [51,53,58,61].
Most studies report decreasing endotoxin concentrations with distance from the source [61]. Heederik et al. [76] reported only a weak relationship between endotoxin concentration and wind direction; however, concentrations were higher close to the source. Meteorological and local conditions will have a large impact on measured concentrations, and it may be difficult to infer long-term averages from data collected at one time point or over a short period. Deacon et al. [50] and Pankhurst et al. [42] reported a secondary endotoxin peak at 100–150 m at two separate composting sites. This may indicate fine particles settling out at a distance from the site, or a different transport mechanism, or a secondary source of endotoxins, such as soil or vegetation. A better understanding of the physical nature of endotoxins and the mechanisms affecting their association with particles of different sizes and surface chemistries is needed before dispersion behaviour can be better characterised and simulated.

4.4.1. Temperature

Temperature and humidity is likely to have an impact on endotoxin concentrations, as shown by ambient endotoxin sampling. Few studies reported the conditions under which the sampling took place when reporting endotoxin concentrations from different studies. One composting study took samples at different sites throughout the year [51]. They reported no association between peak concentrations and temperature, with site activity being more important. However, the highest bioaerosol concentrations were associated with low wind speed and humidity. A study of two household waste collectors handling compostable waste by Thorn [77] found that endotoxin concentrations were not correlated with temperature, albeit with low concentrations (<10 EU m−3). In contrast, a study of waste collectors and sorters identified endotoxin concentrations to be higher when temperatures exceeded 20 °C and relative humidity was less than 50% [78].
Ko et al. [79] looked at endotoxin levels at swine farms, and reported that wind velocity was positively correlated with airborne endotoxin levels, whilst temperature and relative humidity were negatively correlated. Bønløkke et al. [80] reported that swine-farm workers were exposed to higher endotoxin concentrations in the winter than in the summer (25,690 and 6553 EU m−3, respectively), based on 24 workers sampled once during the summer and once during the winter. Ventilation rates from farm buildings are highest during the summer, which explains this finding. It may also be expected that more endotoxins are released to the environment during the summer from these facilities due to the high ventilation rates. In an area of intensive livestock production, Schulze et al. (2006) reported a small difference between summer and winter samples with geometric means of 2.95 and 1.98 EU m−3, respectively. Overall, season, weather, and proximity to a main road were found to account for 24% of the variability of ambient endotoxin concentrations in this area [18].

4.4.2. Sampling Approach

For most anthropogenic endotoxin sources, there is a lack of thorough, well-designed studies reporting endotoxin emissions. For example, some studies fail to report vital information, such as sampling durations, flow rates, and size fraction of particles collected. Replicates also seem to be lacking, and, in some cases, only a few samples are taken at each sampling point. There is also a lack of standardisation around filter material with different materials, including cellulose acetate, quartz, glass fibre, and polycarbonate, used in different studies. Mixed cellulose ester filters were previously associated with the irreversible binding of endotoxins, leading to an underreporting of concentrations [81], whilst glass fibre was recommend by Duquenne et al. and Spaan et al. [4,82]. A few studies used impingers rather than filters to collect endotoxins in a liquid medium. This was shown to be an acceptable collection method over short time periods, but unsuitable for extended sampling durations [83,84]. Several studies used personal, rather than stationary, samplers to measure onsite endotoxin concentrations. In a study of wastewater workers, Oppliger et al. [72] found that stationary samplers were not representative of personal endotoxin exposure with mean concentrations of 59.3 EU m−3 and 6 EU m−3, respectively; however, the equipment was not used in parallel, which may explain the differences. A study investigating three different samplers for endotoxin collection identified that impingers and a MOUDI impactor were more effective than filter cassettes at capturing endotoxin in a pilot field study [85], whilst another study found comparable endotoxin levels collected using filters and impingers, although impingers had lower variability [83]. In contrast, Stephenson et al. (2004) [86] found glass-fibre filters to have the lowest variability when endotoxin concentrations were high, although impingers again appeared to detect the highest amount of endotoxins.
One important factor in determining endotoxin emissions is the averaging time used in the studies. It is likely that very high emissions can occur periodically; however, over the course of a whole day, this effect is likely to be diluted. Nearly all anthropogenic sources of endotoxin will be time-varying as they fluctuate depending on the activity being undertaken. Few studies reported what onsite activity was occurring during downwind sampling. In contrast to ambient air sampling, sampling of pollutant sources tends to be a snapshot, typically lasting 0.5–4 h. If measurements are only taken during high activity or low activity, this may lead to uncertainty around how representative the measurements are of actual exposure. There are few mentions of averaging time, with two studies reporting time-weighted averages. In a study looking at occupational endotoxin exposure, results were extrapolated to an eight-hour time-weighted average based on four hours of sampling [44]. Hermann et al. [87] reported time-weighted averages in a study of different samplers measuring endotoxins from the application of biosolids to land. The study found HiVol and open-faced cassettes had higher time-weighted average measurements compared to closed-cassette and impinger samplers.

4.4.3. Size Fractions

Different samplers also have different efficiencies for collecting different size fractions; for example, 37-mm filter cassettes collect 70% of particles <10 µm, but <10% of particles greater than 25 µm [88]. In contrast, impingers collect almost 100% of particles greater than 1 µm, but are less efficient at collecting smaller particles [89].
Few studies of sources of endotoxins reported size fractions, and only one actively measured different size fractions around pollutant sources [35]. As with ambient sampling, it is likely that endotoxins are largely associated with the coarse fraction, particularly as large amounts of endotoxins may bind to the bigger particles. This can be overcome by reporting endotoxins per gram of particles, although few studies do this. Most studies at intensive farm sites measured endotoxins in the coarse fraction; how endotoxins concentrate in the different size fractions from such sources may not be straightforward. Kirychuk et al. (2010) [90] reported that caged hens had greater endotoxin concentrations in the fine fraction (340.4 EU m−3) compared to floor-housed hens (272.3 EU m−3), where endotoxin concentrations were higher in the coarse fraction (1121.6 and 2216.1 EU m−3, respectively). This has implications for policy makers, as different respiratory responses may be expected dependent on the size fraction; for instance, if most endotoxins reside in the coarse fraction, then upper respiratory issues such as mucous-membrane irritation are a more likely outcome, compared to lung impacts and issues, such as asthma, if they reside in the finer fractions.

5. Conclusions

This review demonstrates that a range of sources have the potential to elevate endotoxin concentrations in ambient air to levels that are above the current proposed guidelines. Activities that could be considered high risk for endotoxin emissions include composting, farming, spreading of biosolids to land, and wastewater treatment. However, the data so far are based on a limited number of studies with a limited number of repeated samples, which makes it difficult to draw conclusions about the impact of these activities. More work is also required to fully understand the impact of different parameters such as temperature and sampling approaches on endotoxin concentrations. Furthermore, this paper concentrates on endotoxins, and there are undoubtedly other parallel exposures that may impact health outcomes in an exposure situation. The paper did not comprehensively review health outcomes associated with endotoxins, although this is clearly an important area of work. This work highlighted endotoxin concentrations and spread, which have implications for policy makers who are faced with the difficulty of balancing potential health impacts with regulatory approaches to ensure developments close to potential endotoxin sources are not putting residents at unnecessary risk.

Supplementary Materials

The following are available online at https://www.mdpi.com/2073-4433/9/10/375/s1, Table S1: Search terms; Table S2: Sources for particle size graph; Table S3: Sources for endotoxin concentration and distance graph.

Author Contributions

Author Contributions: Conceptualization, C.R., T.L.G., E.H., B.W., S.K., S.J., A.B., Z.A.N. and S.T.; Data curation, C.R., T.L.G. and C.G.; Formal analysis, C.R.; Funding acquisition, T.G., E.H., S.J., A.B. and S.T.; Investigation, C.R., T.L.G. and C.G.; Methodology, C.R., T.L.G.; Project administration, S.T.; Resources, T.L.G., S.J., A.B. and S.T.; Supervision, T.L.G. and S.T.; Visualization, C.R.; Writing—Original draft, C.R.; and Writing—Review and editing, C.R., Z.A.N., S.C., E.H., B.W., S.J., A.B., R.P.K., G.D., K.W., C.G., S.T. and T.L.G.

Funding

This work was supported by the Natural Environment Research Council (NERC) and the Defence Science and Technology Laboratory (DSTL) (NE/M011763/1; NE/M011631/1; NE/M011747/1; NE/M011658/1). These awards were made under the auspices of the Environmental Microbiology and Human Health programme. This work represents the views of the results and the research, and not the view of the funders.

Conflicts of Interest

The authors declare no conflict of interest.

References

  1. Wouters, I.M.M.; Spaan, S.; Douwes, J.; Doekes, G.; Heederik, D. Overview of Personal Occupational Exposure Levels to Inhalable Dust, Endotoxin, β (1→3)-Glucan and Fungal Extracellular Polysaccharides in the Waste Management Chain. Ann. Occup. Hyg. 2005, 50, 39–53. [Google Scholar] [CrossRef] [PubMed]
  2. Lawniczek-Walczyk, A.; Gorny, R.L.; Golofit-Szymczak, M.; Niesler, A.; Wlazlo, A. Occupational exposure to airborne microorganisms, endotoxins and beta-glucans in poultry houses at different stages of the production cycle. Ann. Agric. Environ. Med. 2013, 20, 259–268. [Google Scholar] [PubMed]
  3. Thorn, J.; Beijer, L.; Jonsson, T.; Rylander, R. Measurement Strategies for the Determination of Airborne Bacterial Endotoxin in Sewage Treatment Plants. Ann. Occup. Hyg. 2002, 46, 549–554. [Google Scholar] [CrossRef] [PubMed] [Green Version]
  4. Duquenne, P.; Marchand, G.; Duchaine, C. Measurement of endotoxins in bioaerosols at workplace: A critical review of literature and a standardization issue. Ann. Occup. Hyg. 2013, 57, 137–172. [Google Scholar] [CrossRef] [PubMed]
  5. Basinas, I.; Sigsgaard, T.; Kromhout, H.; Heederik, D.; Wouters, I.M.; Schlünssen, V. A comprehensive review of levels and determinants of personal exposure to dust and endotoxin in livestock farming. J. Expo. Sci. Environ. Epidemiol. 2013, 1–15. [Google Scholar] [CrossRef]
  6. Loh, L.C.; Vyas, B.; Kanabar, V.; Kemeny, D.M.; O’Connor, B.J. Inhaled endotoxin in healthy human subjects: A dose-related study on systemic effects and peripheral CD4+ and CD8+ T cells. Respir. Med. 2006, 100, 519–528. [Google Scholar] [CrossRef] [PubMed]
  7. Liebers, V.; Brüning, T.; Raulf-Heimsoth, M. Occupational endotoxin-exposure and possible health effects on humans. Am. J. Ind. Med. 2006, 49, 474–491. [Google Scholar] [CrossRef] [PubMed]
  8. Liebers, V.; Raulf-Heimsoth, M.; Brüning, T. Health effects due to endotoxin inhalation (review). Arch. Toxicol. 2008, 82, 203–210. [Google Scholar] [CrossRef] [PubMed]
  9. Celedón, J.C.; Milton, D.K.; Ramsey, C.D.; Litonjua, A.A.; Ryan, L.; Platts-Mills, T.A.E.; Gold, D.R. Exposure to dust mite allergen and endotoxin in early life and asthma and atopy in childhood. J. Allergy Clin. Immunol. 2012, 76, 211–220. [Google Scholar] [CrossRef]
  10. Health Council of The Netherlands. Health Risks Associated with Livestock Farms; 2012/27E; Health Council of The Netherlands: The Hague, The Netherlands, 2012. [Google Scholar]
  11. Reynolds, S.J.; Milton, D.K.; Heederik, D.; Thorne, P.S.; Donham, K.J.; Croteau, E.A.; Kelly, K.M.; Douwes, J.; Lewis, D.; Whitmer, M.; et al. Interlaboratory evaluation of endotoxin analyses in agricultural dusts—Comparison of LAL assay and mass spectrometry. J. Environ. Monit. 2005, 7, 1371–1377. [Google Scholar] [CrossRef] [PubMed]
  12. Guan, T.; Yao, M.; Wang, J.; Fang, Y.; Hu, S.; Wang, Y.; Dutta, A.; Yang, J.; Wu, Y.; Hu, M.; et al. Airborne endotoxin in fine particulate matter in Beijing. Atmos. Environ. 2014, 97, 35–42. [Google Scholar] [CrossRef]
  13. Liu, Q.; Baumgartner, J.; Zhang, Y.; Schauer, J.J. Source apportionment of Beijing air pollution during a severe winter haze event and associated pro-inflammatory responses in lung epithelial cells. Atmos. Environ. 2016, 126, 28–35. [Google Scholar] [CrossRef]
  14. Menetrez, M.Y.; Foarde, K.K.; Esch, R.K.; Schwartz, T.D.; Dean, T.R.; Hays, M.D.; Cho, S.H.; Betancourt, D.A.; Moore, S.A. An evaluation of indoor and outdoor biological particulate matter. Atmos. Environ. 2009, 43, 5476–5483. [Google Scholar] [CrossRef]
  15. Tager, I.B.; Lurmann, F.W.; Haight, T.; Alcorn, S.; Penfold, B.; Hammond, K.S. Temporal and spatial patterns of ambient endotoxin concentrations in Fresno, California. Environ. Health Perspect. 2010, 118, 1490–1496. [Google Scholar] [CrossRef] [PubMed]
  16. Zucker, B.-A.; Müller, W. Airborne Endotoxins and Airborne Gram-Negative Bacteria in a Residential Neighborhood. Water Air Soil Pollut. 2004, 158, 67–75. [Google Scholar] [CrossRef]
  17. Mueller-Annelling, L.; Avol, E.; Peters, J.M.; Thorne, P.S. Ambient endotoxin concentrations in PM10 from Southern California. Environ. Health Perspect. 2004, 112, 583–588. [Google Scholar] [CrossRef] [PubMed]
  18. Schulze, A.; Van Strien, R.; Ehrenstein, V.; Schierl, R.; Küchenhoff, H.; Radon, K. Ambient endotoxin level in an area with intensive livestock production. Ann. Agric. Environ. Med. 2006, 13, 87–91. [Google Scholar] [PubMed]
  19. Barnig, C.; Reboux, G.; Roussel, S.; Casset, A.; Sohy, C.; Dalphin, J.C.; de Blay, F. Indoor dust and air concentrations of endotoxin in urban and rural environments. Lett. Appl. Microbiol. 2013, 56, 161–167. [Google Scholar] [CrossRef] [PubMed] [Green Version]
  20. Madsen, A.M. Exposure to Airborne Microbial Components in Autumn and Spring during Work at Danish Biofuel Plants. Ann. Occup. Hyg. 2006, 50, 821–831. [Google Scholar] [CrossRef] [PubMed]
  21. Allen, J.; Bartlett, K.; Graham, M.; Jackson, P. Ambient concentrations of airborne endotoxin in two cities in the interior of British Columbia, Canada. J. Environ. Monit. 2011, 13, 631–640. [Google Scholar] [CrossRef] [PubMed]
  22. Bari, M.A.; MacNeill, M.; Kindzierski, W.B.; Wallace, L.; Héroux, M.-È.; Wheeler, A.J. Predictors of coarse particulate matter and associated endotoxin concentrations in residential environments. Atmos. Environ. 2014, 92, 221–230. [Google Scholar] [CrossRef]
  23. Barraza, F.; Jorquera, H.; Heyer, J.; Palma, W.; Edwards, A.M.; Muñoz, M.; Valdivia, G.; Montoya, L.D. Short-term dynamics of indoor and outdoor endotoxin exposure: Case of Santiago, Chile, 2012. Environ. Int. 2016, 92–93, 97–105. [Google Scholar] [CrossRef] [PubMed]
  24. Brooks, J.P.; Tanner, B.D.; Gerba, C.P.; Pepper, I.L. The measurement of aerosolized endotoxin from land application of Class B biosolids in Southeast Arizona. Can. J. Microbiol. 2006, 52, 150–156. [Google Scholar] [CrossRef] [PubMed]
  25. Carty, C.L.; Gehring, U.; Cyrys, J.; Bischof, W.; Heinrich, J. Seasonal variability of endotoxin in ambient fine particulate matter. J. Environ. Monit. 2003, 5, 953–958. [Google Scholar] [CrossRef] [PubMed]
  26. Cheng, J.Y.W.; Hui, E.L.C.; Lau, A.P.S. Bioactive and total endotoxins in atmospheric aerosols in the Pearl River Delta region, China. Atmos. Environ. 2012, 47, 3–11. [Google Scholar] [CrossRef]
  27. Degobbi, C.; Lopes, F.D.T.Q.S.; Carvalho-Oliveira, R.; Muñoz, J.E.; Saldiva, P.H.N. Correlation of fungi and endotoxin with PM2.5 and meteorological parameters in atmosphere of Sao Paulo, Brazil. Atmos. Environ. 2011, 45, 2277–2283. [Google Scholar] [CrossRef]
  28. Escobedo, L.E.; Champion, W.M.; Li, N.; Montoya, L.D. Indoor air quality in Latino homes in Boulder, Colorado. Atmos. Environ. 2014, 92, 69–75. [Google Scholar] [CrossRef]
  29. Heinrich, J.; Pitza, M.; Bischofb, W.; Krugc, N.; Borm, P. Endotoxin in fine (PM2.5) and coarse (PM2.5–10) particle mass of ambient aerosols. A temporo-spatial analysis. Atmos. Environ. 2003, 37, 3659–3667. [Google Scholar] [CrossRef]
  30. Kallawicha, K.; Lung, S.C.C.; Chuang, Y.C.; Wu, C.D.; Chen, T.H.; Tsai, Y.J.; Chao, H.J. Spatiotemporal distributions and land-use regression models of ambient bacteria and endotoxins in the greater Taipei area. Aerosol Air Qual. Res. 2015, 15, 1448–1459. [Google Scholar] [CrossRef]
  31. Madsen, A.M. Airborne endotoxin in different background environments and seasons. Ann. Agric. Environ. Med. 2006, 13, 81–86. [Google Scholar] [PubMed]
  32. Morgenstern, V.; Carty, C.L.; Gehring, U.; Cyrys, J.; Bischof, W.; Heinrich, J. Lack of spatial variation of endotoxin in ambient particulate matter across a German metropolitan area. Atmos. Environ. 2005, 39, 6931–6941. [Google Scholar] [CrossRef]
  33. Nilsson, S.; Merritt, A.S.; Bellander, T. Endotoxins in urban air in Stockholm, Sweden. Atmos. Environ. 2011, 45, 266–270. [Google Scholar] [CrossRef]
  34. Traversi, D.; Alessandria, L.; Schilirò, T.; Chiadò Piat, S.; Gilli, G. Meteo-climatic conditions influence the contribution of endotoxins to PM10 in an urban polluted environment. J. Environ. Monit. 2010, 12, 484–490. [Google Scholar] [CrossRef] [PubMed]
  35. Traversi, D.; Alessandria, L.; Schilirò, T.; Gilli, G. Size-fractionated PM10 monitoring in relation to the contribution of endotoxins in different polluted areas. Atmos. Environ. 2011, 45, 3515–3521. [Google Scholar] [CrossRef]
  36. Wheeler, A.J.; Dobbin, N.A.; Lyrette, N.; Wallace, L.; Foto, M.; Mallick, R.; Kearney, J.; Van Ryswyk, K.; Gilbert, N.L.; Harrison, I.; et al. Residential indoor and outdoor coarse particles and associated endotoxin exposures. Atmos. Environ. 2011, 45, 7064–7071. [Google Scholar] [CrossRef]
  37. Daniels, A.U.; Barnes, F.H.; Charlebois, S.J.; Smith, R.A. Macrophage cytokine response to particles and lipopolysaccharide in vitro. J. Biomed. Mater. Res. 2000, 49, 469–478. [Google Scholar] [CrossRef]
  38. Pozzi, R.; De Berardis, B.; Paoletti, L.; Guastadisegni, C. Inflammatory mediators induced by coarse (PM2.5–10) and fine (PM2.5) urban air particles in RAW 264.7 cells. Toxicology 2003, 183, 243–254. [Google Scholar] [CrossRef]
  39. Monn, C.; Becker, S. Cytotoxicity and induction of proinflammatory cytokines from human monocytes exposed to fine (PM2.5) and coarse particles (PM10–2.5) in outdoor and indoor air. Toxicol. Appl. Pharmacol. 1999, 155, 245–252. [Google Scholar] [CrossRef] [PubMed]
  40. Schins, R.P.F.; Lightbody, J.H.; Borm, P.J.A.; Shi, T.; Donaldson, K.; Stone, V. Inflammatory effects of coarse and fine particulate matter in relation to chemical and biological constituents. Toxicol. Appl. Pharmacol. 2004, 195, 1–11. [Google Scholar] [CrossRef] [PubMed]
  41. Soukup, J.M.; Becker, S. Human alveolar macrophage responses to air pollution particulates are associated with insoluble components of coarse material, including particulate endotoxin. Toxicol. Appl. Pharmacol. 2001, 171, 20–26. [Google Scholar] [CrossRef] [PubMed]
  42. Pankhurst, L.J.; Deacon, L.J.; Liu, J.; Drew, G.H.; Hayes, E.T.; Jackson, S.; Longhurst, P.J.; Longhurst, J.W.S.; Pollard, S.J.T.; Tyrrel, S.F. Spatial variations in airborne microorganism and endotoxin concentrations at green waste composting facilities. Int. J. Hyg. Environ. Health 2011, 214, 376–383. [Google Scholar] [CrossRef] [PubMed]
  43. Hryhorczuk, D.; Curtis, L.; Scheff, P.; Chung, J.; Rizzo, M.; Lewis, C.; Keys, N.; Moomey, M. Bioaerosol emissions from a suburban yard waste composting facility. Annu. Agric. Environ. Med. 2001, 8, 177–185. [Google Scholar]
  44. Sykes, P.; Morris, R.H.K.; Allen, J.A.; Wildsmith, J.D.; Jones, K.P. Workers’ exposure to dust, endotoxin and β-(1–3) glucan at four large-scale composting facilities. Waste Manag. 2011, 31, 423–430. [Google Scholar] [CrossRef] [PubMed]
  45. Stephen, S.; Alison, B.; Adrian, K.; Brian, C. Bioaerosol Emissions from Waste Composting and the Potential for Workers’ Exposure; Health and Safety Executive: Crown Copyright, UK, 2010. [Google Scholar]
  46. Nielsen, B.H.; Würtz, H.; Breum, N.O.; Poulsen, O.M. Microorganisms and endotoxin in experimentally generated bioaerosols from composting household waste. Ann. Agric. Environ. Med. 1997, 4, 159–168. [Google Scholar]
  47. Kang, W.; Kim, I.; Lee, T.; Kim, K.; Kim, D. Effect of temperature on bacterial emissions in composting of swine manure. Waste Manag. 2014, 34, 1006–1011. [Google Scholar] [CrossRef] [PubMed]
  48. Clark, C.S.; Rylander, R.; Larsson, L. Levels of Gram-negative bacteria, Aspergillus fumigatus, dust, and endotoxin at compost plants. Appl. Environ. Microbiol. 1983, 45, 1501–1505. [Google Scholar] [PubMed]
  49. Danneberg, G.; Grüneklee, E.; Seitz, M.; Hartung, J.; Driesel, A.J. Microbial and Endotoxin Immissions in the Neighborhood of a Composting Plant. Ann. Agric. Environ. Med. 1997, 4, 169–173. [Google Scholar]
  50. Deacon, L.; Pankhurst, L.; Liu, J.; Drew, G.H.; Hayes, E.T.; Jackson, S.; Longhurst, J.; Longhurst, P.; Pollard, S.; Tyrrel, S. Endotoxin emissions from commercial composting activities. Environ. Health 2009, 8, S9. [Google Scholar] [CrossRef] [PubMed] [Green Version]
  51. Williams, M.; Lamarre, B.; Butterfield, D.; Tyrrel, S.; Longhurst, P.; Drew, G.; Al-Ashaab, R.; Nelson, A.; Gladding, T.; Simpson, A.; et al. Monitoring Bioaerosol and Odour Emissions from Composting Facilities-WR1121; DEFRA: London, UK, 2013. [Google Scholar]
  52. Duquenne, P.; Simon, X.; Koehler, V.; Goncalves-Machado, S.; Greff, G.; Nicot, T.; Poirot, P. Documentation of bioaerosol concentrations in an indoor composting facility in France. J. Environ. Monit. 2012, 14, 409. [Google Scholar] [CrossRef] [PubMed]
  53. Liu, J.; Pankhurst, L.J.; Deacon, L.J.; Abate, W.; Hayes, E.T.; Drew, G.H.; Longhurst, P.J.; Pollard, S.; Longhurst, J.; Tyrrel, S.F.; et al. Evaluation of inflammatory effects of airborne endotoxin emitted from composting sources. Environ. Toxicol. Chem. 2011, 30, 602–606. [Google Scholar] [CrossRef] [PubMed]
  54. Tolvanen, O.; Nykänen, J.; Nivukoski, U.; Himanen, M.; Veijanen, A.; Hänninen, K. Occupational hygiene in a Finnish drum composting plant. Waste Manag. 2005, 25, 427–433. [Google Scholar] [CrossRef] [PubMed]
  55. Radon, K.; Schulze, A.; Ehrenstein, V.; van Strien, R.T.; Praml, G.; Nowak, D. Environmental exposure to confined animal feeding operations and respiratory health of neighboring residents. Epidemiology 2007, 18, 300–308. [Google Scholar] [CrossRef] [PubMed]
  56. Grethe, H. High animal welfare standards in the EU and international trade-How to prevent potential “low animal welfare havens”? Food Policy 2007, 32, 315–333. [Google Scholar] [CrossRef]
  57. Thorne, P.S.; Ansley, A.C.; Perry, S.S. Concentrations of bioaerosols, odors, and hydrogen sulfide inside and downwind from two types of swine livestock operations. J. Occup. Environ. Hyg. 2009, 6, 211–220. [Google Scholar] [CrossRef] [PubMed]
  58. Dungan, R.S.; Leytem, A.B. Airborne endotoxin concentrations at a large open-lot dairy in southern Idaho. J. Environ. Qual. 2009, 38, 1919–1923. [Google Scholar] [CrossRef] [PubMed]
  59. Dungan, R.S.; Leytem, A.B.; Bjorneberg, D.L. Assessment of bioaerosols at a concentrated dairy operation. Aerobiologia 2010, 26, 171–184. [Google Scholar] [CrossRef] [Green Version]
  60. Hartung, J.; Seedorf, J.; Trickl, T.; Gronauer, H. Emission and distribution of airborne particulates from a piggery. In Proceedings of the 9th ISAH International Congress Animal Hygiene, Helsinki, Finland, 17–21 August 1997; pp. 176–179. [Google Scholar]
  61. Jonges, M.; van Leuken, J.; Wouters, I.; Koch, G.; Meijer, A.; Koopmans, M. Wind-Mediated Spread of Low-Pathogenic Avian Influenza Virus into the Environment during Outbreaks at Commercial Poultry Farms. PLoS ONE 2015, 10, e0125401. [Google Scholar] [CrossRef] [PubMed] [Green Version]
  62. Radon, K.; Danuser, B.; Iversen, M.; Monso, E.; Weber, C.; Hartung, J.; Donham, K.J.; Palmgren, U.; Nowak, D. Air contaminants in different european farming environments. Ann. Agric. Environ. Med. 2002, 9, 41–48. [Google Scholar] [PubMed]
  63. Simpson, J.C.; Niven, R.M.; Pickering, C.A.; Oldham, L.A.; Fletcher, A.M.; Francis, H.C. Comparative personal exposures to organic dusts and endotoxin. Ann. Occup. Hyg. 1999, 43, 107–115. [Google Scholar] [CrossRef]
  64. Mackiewicz, B.; Skórska, C.; Dutkiewicz, J. Relationship between concentrations of microbiological agents in the air of agricultural settings and occurrence of work-related symptoms in exposed persons. Ann. Agric. Environ. Med. 2015, 22, 473–477. [Google Scholar] [CrossRef] [PubMed]
  65. Barth, E.; Herrmann, R.; Dahling, T.; Brenner, R.; Wright, S.; Clark, P. Evaluation of Airborne Endotoxin Concentrations Associated with Management of a Crop Grown on Applied Biosolids. J. Residuals Sci. Technol. 2009, 6, 61–65. [Google Scholar]
  66. Lee, J.A.; Johnson, J.C.; Reynolds, S.J.; Thorne, P.S.; O’Shaughnessy, P.T. Indoor and outdoor air quality assessment of four wastewater treatment plants. J. Occup. Environ. Hyg. 2006, 3, 36–43. [Google Scholar] [CrossRef] [PubMed]
  67. De Man, H.; Heederik, D.D.J.; Leenen, E.J.T.M.; de Roda Husman, A.M.; Spithoven, J.J.G.; van Knapen, F. Human exposure to endotoxins and fecal indicators originating from water features. Water Res. 2014, 51, 198–205. [Google Scholar] [CrossRef] [PubMed]
  68. Neumann, H.D.; Balfanz, J.; Becker, G.; Lohmeyer, M.; Mathys, W.; Raulf-Heimsoth, M. Bioaerosol exposure during refuse collection: Results of field studies in the real-life situation. Sci. Total Environ. 2002, 293, 219–231. [Google Scholar] [CrossRef]
  69. Solomon, G.M.; Hjelmroos-Koski, M.; Rotkin-Ellman, M.; Hammond, S.K. Airborne mold and endotoxin concentrations in New Orleans, Louisiana, after flooding, October through November 2005. Environ. Health Perspect. 2006, 114, 1381–1386. [Google Scholar] [CrossRef] [PubMed]
  70. Lang-Yona, N.; Lehahn, Y.; Herut, B.; Burshtein, N.; Rudich, Y. Marine aerosol as a possible source for endotoxins in coastal areas. Sci. Total Environ. 2014, 499, 311–318. [Google Scholar] [CrossRef] [PubMed]
  71. Gangamma, S.; Patil, R.S.; Mukherji, S. Characterization and proinflammatory response of airborne biological particles from wastewater treatment plants. Environ. Sci. Technol. 2011, 45, 3282–3287. [Google Scholar] [CrossRef] [PubMed]
  72. Oppliger, A.; Hilfiker, S.; Duc, T.V. Influence of seasons and sampling strategy on assessment of bioaerosols in sewage treatment plants in Switzerland. Ann. Occup. Hyg. 2005, 49, 393–400. [Google Scholar] [CrossRef] [PubMed]
  73. Paez-Rubio, T.; Ramarui, A.; Sommer, J.; Xin, H.; Anderson, J.; Peccia, J. Emission rates and characterization of aerosols produced during the spreading of dewatered class B biosolids. Environ. Sci. Technol. 2007, 41, 3537–3544. [Google Scholar] [CrossRef] [PubMed]
  74. Tendal, K.; Madsen, A. Exposure to airborne microorganisms, hyphal fragments, and pollen in a field of organically grown strawberries. Aerobiologia 2011, 27, 13–23. [Google Scholar] [CrossRef]
  75. Traversi, D.; Gorrasi, I.; Bonetta, S.; Leinardi, R.; Pietrangeli, B.; Carraro, E.; Gilli, G. Green job bio-aerosol exposure during anaerobic digestion for biomass energetic valorisation. Environ. Res. 2015, 138, 425–431. [Google Scholar] [CrossRef] [PubMed]
  76. Heederik, D.; Doekes, G.; van Strien, R.; Brunekreef, B. Daily changes of peak expiratory flow and respiratory symptom occurrence around a soy processing factory. Ann. Agric. Environ. Med. 2014, 21, 5–10. [Google Scholar] [CrossRef] [PubMed] [Green Version]
  77. Thorn, J. Seasonal variations in exposure to microbial cell wall components among household waste collectors. Ann. Occup. Hyg. 2001, 45, 153–156. [Google Scholar] [CrossRef]
  78. Park, D.-U.; Ryu, S.-H.; Kim, S.-B.; Yoon, C.-S. An assessment of dust, endotoxin, and microorganism exposure during waste collection and sorting. J. Air Waste Manag. Assoc. 2011, 61, 461–468. [Google Scholar] [CrossRef] [PubMed]
  79. Ko, G.; Simmons, O.D.; Likirdopulos, C.A.; Worley-Davis, L.; Williams, C.M.; Sobsey, M.D. Endotoxin levels at swine farms using different waste treatment and management technologies. Environ. Sci. Technol. 2010, 44, 3442–3448. [Google Scholar] [CrossRef] [PubMed]
  80. Hjort Bønløkke, J.; Mériaux, A.; Duchaine, C.; Godbout, S.; Cormier, Y. Seasonal variations in work-related health effects in swine farm workers. Annu. Agric. Environ. Med. 2009, 16, 43–52. [Google Scholar]
  81. Douwes, J.; Versloot, P.; Hollander, A.; Heederik, D.; Doekes, G.; Douwes, J.; Versloot, P.; Hollander, A.; Heederik, D.; Doekes, G. Influence of various dust sampling and extraction methods on the measurement of airborne endotoxin. Appl. Environ. Microbiol. 1995, 61, 1763–1769. [Google Scholar] [PubMed]
  82. Spaan, S.; Heederik, D.J.J.; Thorne, P.S.; Wouters, I.M. Optimization of airborne endotoxin exposure assessment: Effects of filter type, transport conditions, extraction solutions, and storage of samples and extracts. Appl. Environ. Microbiol. 2007, 73, 6134–6143. [Google Scholar] [CrossRef] [PubMed]
  83. Duchaine, C.; Thorne, P.S.; Mériaux, A.; Grimard, Y.; Whitten, P.; Cormier, Y. Comparison of Endotoxin Exposure Assessment by Bioaerosol Impinger and Filter-Sampling Methods. Appl. Environ. Microbiol. 2001, 67, 2775–2780. [Google Scholar] [CrossRef] [PubMed] [Green Version]
  84. Zucker, B.A.; Draz, A.M.; Müller, W. Comparison of filtration and impingement for sampling airborne endotoxin. J. Aerosol Sci. 2000, 31, 751–755. [Google Scholar] [CrossRef]
  85. Kujundzic, E.; Hernandez, M.; Miller, S.L. Particle size distributions and concentrations of airborne endotoxin using novel collection methods in homes during the winter and summer seasons. Indoor Air 2006, 16, 216–226. [Google Scholar] [CrossRef] [PubMed]
  86. Stephenson, D.J.; Lillquist, D.R.; DeRosso, F.D.; Greene, D.D.; White, G. Side-by-side comparison of three sampling methods for aerosolized endotoxin in a wastewater treatment facility. J. Environ. Health 2004, 67, 16–19. [Google Scholar] [PubMed]
  87. Herrmann, R.F.; Grosser, R.J.; Farrar, D.; Brobst, R.B. Field studies measuring the aerosolization of endotoxin during the land application of Class B biosolids. Aerobiologia 2017. [Google Scholar] [CrossRef] [PubMed]
  88. Buchan, R.M.; Soderholm, S.C.; Tillery, M.I. Aerosol sampling efficiency of 37 mm filter cassettes. Am. Ind. Hyg. Assoc. J. 1986, 47, 825–831. [Google Scholar] [CrossRef] [PubMed]
  89. Willeke, K.; Lin, X.; Grinshpun, S.A. Improved Aerosol Collection by Combined Impaction and Centrifugal Motion. Aerosol Sci. Technol. 1998, 28, 439–456. [Google Scholar] [CrossRef] [Green Version]
  90. Kirychuk, S.P.; Reynolds, S.J.; Koehncke, N.K.; Lawson, J.; Willson, P.; Senthilselvan, A.; Marciniuk, D.; Classen, H.L.; Crowe, T.; Just, N.; et al. Endotoxin and dust at respirable and nonrespirable particle sizes are not consistent between cage- and floor-housed poultry operations. Ann. Occup. Hyg. 2010, 54, 824–832. [Google Scholar] [CrossRef] [PubMed]
Figure 1. Endotoxin concentrations as reported in the literature at different size fractions in urban or rural environments (means or medians). Error bars indicate the range of concentrations reported. The dotted line indicates the proposed exposure limit of 30 EU m−3. Coarse indicates inhalable particulate matter (PM10–2.5) with the exception of Allen et al. (2011) [21] and Menetrez et al. (2009) [14], who reported PM10; fine indicates PM2.5.
Atmosphere 09 00375 g001
Figure 2. Mean concentrations of endotoxins as a function of distance from the source as reported in the literature. A negative value indicates samples taken downwind of the source (0 m), whilst positive values indicate upwind samples. The dashed and dotted lines represent the proposed 30 EU m−3 limit and a no-observed-effect level (NOEL) of 90 EU m−3, respectively. The dot-dashed line indicates the 95th percentile of mean upwind concentrations, excluding three points with very high concentrations likely influenced by other endotoxin sources (full dataset available in the Supplementary Materials).
Atmosphere 09 00375 g002
Table 1. Reported endotoxin concentrations in urban and rural air. EU—endotoxin units; USA—United States of America; N/A—not applicable.
CountryEnvironmentSampling ApproachSeason or Months of MeasurementNumber of SamplesFlow Rate (L min−1)Sampling Duration (h)Mean Endotoxin Concentration (EU m−3)Reference
CanadaUrbanPartisol sampler with glass-fibre filtersAll year46016.7240.15–0.67Allen et al., 2011 [21]
CanadaUrbanHarvard coarse impactor with polyurethane foamJanuary–August2425240.16–0.64Bari et al., 2014 [22]
ChileUrbanPartisol sampler with quartz filtersNovember–December4116.67240.094Barraza et al., 2016 [23]
USARuralImpingerNovember–December4112.50.172.6Brooks et al., 2006 [24]
GermanyUrbanHarvard impactor with 37-mm Teflon filterAll year15810420.015Carty et al., 2003 [25]
ChinaUrban and ruralHigh-volume sampler with quartz filtersAll year120113024Urban 0.099–0.248
Rural 0.085–0.266
Cheng et al., 2012 [26]
BrazilUrbanFilter heads with 37-mm polycarbonate filtersApril–July1210240.1Degobbi et al., 2011 [27]
USAUrbanTactical air samplers with 47-mm Teflon filtersN/A145240.04–0.08Escobedo et al., 2014 [28]
ChinaUrbanAutomatic four-channel sampler with quartz filtersAll year32116.723.50.65Guan et al., 2014 [12]
GermanyUrbanGraseby Anderson dichotomous samplers with 37-mm Teflon filtersJanuary–June841.671–16.671123–1930.006–0.07Heinrich et al., 2003 [29]
TaiwanUrbanFilter heads with 37-mm polycarbonate filtersNovember–August445242.75Kallawicha et al., 2015 [30]
DenmarkUrban and ruralFilter heads with Teflon filtersAll year1683.54–6Urban 0.33–5.3
Rural 2.9
Madsen, 2006 [31]
USAUrban and ruralFilter heads or impactors with polytetrafluoroethylene (PTFE) filtersJanuary–May332–16.710–24Urban 0.006
Rural 0.023–0.051
Menetrez et al., 2009 [14]
GermanyUrbanHarvard impactor with 37-mm Teflon filtersAll year20610420.02–0.08Morgenstern et al., 2005 [32]
USAUrban and ruralHigh-volume sampler with quartz filtersAll year99113224Urban 0.2–1.07
Rural 0.36–0.66
Mueller-Annelling et al., 2004 [17]
SwedenUrbanHarvard impactors with 37-mm Teflon filtersMay–September4010420.015–0.05Nilsson et al., 2011 [33]
USAUrbanPartisol sampler with 47-mm Teflon filtersAll yearN/A8.3240.28–5.7Tager et al., 2010 [15]
ItalyUrbanHigh-volume sampler with glass-fibre filtersAll year1161160240.42Traversi et al., 2010 [34]
ItalyUrban and ruralHigh-volume cascade impactor with glass-fibre filtersSummerN/A12704Urban 0.512
Rural 0.33–1.424
Traversi et al., 2011 [35]
CanadaUrbanHarvard coarse impactor with polyurethane foamJanuary–MarchN/A5-0.12–1.57Wheeler et al., 2011 [36]
Table 2. Endotoxin emissions from composting facilities as reported in the literature. UK—United Kingdom.
CountryType of FacilitySampling ApproachMonths of MeasurementNumber of SamplesFlow Rate (L·min−1)Sampling Duration (h)Distance from Site (m)Endotoxin Concentration (EU m−3)
Mean or Median (min–max)
Reference
SwedenIn vessel and open windrow; open windrow composting wastewater sludge, household waste and green wasteFilter heads fitted with 2-mm grid and 37-mm cellulose acetate filters-14121-Onsite 112.6 (10–420)Clark et al., 1983 [48]
GermanyOpen windrow and in vessel composting green waste and bio-wasteStroehlein VC 25 dust sampler with 150-mm quartz filters-5--75–150Onsite 207.0 a
Upwind 1.6 a
Downwind 2.4 a
Danneberg et al., 1997 [49]
UKOpen windrow composting green wasteFilter heads with polycarbonate filtersAll year-20.50–280Onsite 1.5–2.3 b
Upwind <0.15 b
Downwind 0.1–1.2 b
Deacon et al., 2009 [50]
UKWindrow; in vessel; indoor composting biodegradable household waste, food waste, and green wasteFilter heads with polycarbonate filtersAll year35210–525Upwind 10.7 (0–62)
Downwind 52.7 (0–281)
DEFRA, 2013 [51]
FranceIndoor composting fermentable household waste and green wasteFilter heads with 37-mm glass-fibre filtersMay–June321.4–340Upwind 105–250 aDuquenne et al., 2012 [52]
USAOpen windrow composting green wasteHigh-volume particulate sampler with 20 × 25 cm quartz fibre filters September–November1836–8100–290Upwind 1.4 (0.1–3.6)
Downwind 1.6 (0.6–4.1)
Hryhorczuk et al., 2001 [43]
UKOpen windrow composting green wasteFilter heads with polycarbonate filtersMarch–December1152.20.5–2100–600Onsite (no activity) 4.1 (<0.01–32.0)
Upwind 0.15 (<0.01–1.7)
Downwind 3.1–116.2
(<0.01–359)
Liu et al., 2011 [53]
UKIn vessel; open windrow and in vessel; open windrow; enclosed bays composting food waste and green wasteFilter heads with glass-fibre filtersAll year1172425Onsite 7.1–121.7 (0.8–4667)
Upwind 2.9 (0.6–107)
Sykes et al., 2011 [44]
FinlandIndoor in vessel composting biodegradable household wasteFilter heads with glass-fibre filtersAll year2721.6–2-Onsite (composting hall) 2340 (0.2–18,000)
Onsite (receiving hall) 1900 (60–8200)
Onsite (control room) 100 (90.8–870)
Tolvanen et al., 2005 [54]
The NetherlandsIndoor composting domestic and green wastePersonal sampling with glass-fibre filtersAll year2052–3.57.5–8.3-Onsite 6–1038 (<3–37,043)Wouters et al., 2006 [1]
a Single samples; b Estimated from graph.
Table 3. Endotoxin emissions from intensive farming as reported in the literature.
CountryType of Farm
(Average Number of Animals)
Sampling ApproachSeason or Months of MeasurementNumber of SamplesFlow Rate (L min−1)Sampling Duration (h)Distance from Farm (m)Endotoxin Concentration (EU m−3)
Mean (min–max)
Reference
USACattle farm (10,000)Filter heads with 25-mm polycarbonate filtersJune–July16221.25200–1390Onsite 19.8–895
Upwind 0.1–144
Downwind 15.8–358
Dungan et al., 2009 [58]
USACattle farm (10,000)Filter heads with 25-mm polycarbonate filtersAll year72225–200Upwind 0.8–140
Downwind 1.6–849
Dungan et al., 2010 [59]
GermanySwine (1000)High-volume impactor-36802450–115Upwind 90
Downwind 150–600
Hartung et al., 1997 [60]
The NetherlandsPoultry (4000–18,000)Filter head with conical inlet and 37-mm Teflon filter-243.5–500.3–67–410Downwind 23 (<2–111)Jonges et al., 2015 [61]
Denmark/Germany/
Switzerland
Poultry (2100); pig (~1200)Personal sampling with 37-mm glass-fibre filters-1763.5--Poultry 2575.8 (189.9–16,348)
Pig 671.6 (0.1–20,901)
Radon et al., 2002 [62]
GermanyCattle; swine; poultryFilter heads with 37-mm glass-fibre filtersWinter and Summer643.524-Winter 3.6 (0.66–19.98)
Summer 4.4 (0.66–23.22)
Schulze et al., 2006 [18]
USASwineFilter heads with glass-fibre filtersMarch–November-2430–160Upwind <10
Downwind 30–194
Thorne et al., 2009 [57]
Table 4. Endotoxin emissions from other sources as reported in the literature.
CountrySourceSampling ApproachMonths of MeasurementNumber of SamplesFlow Rate (L·min−1)Sampling Duration (h)Distance from Site (m)Endotoxin Concentration (EU·m−3)
Mean (min–max)
Reference
USAApplication of biosolids to landFilter heads with 37-mm polycarbonate filters-804-10Upwind control 7.8 (3.1–11.3)
Downwind control 14.5 (6.3–38.1)
Upwind application 2.1 (0–7.7)
Downwind application 36.0 (24.3–44.8)
Barth et al., 2009 [65]
USAApplication of biosolids to landImpingerApril–June12512.50.2–0.32–200Upwind 2.6
Downwind 33.5–627.3
Brooks et al., 2006 [24]
The NetherlandsEndotoxin from water featuresFilter heads with 37-mm glass-fibre filtersJune–November733.53.1–81–332.6–61.8De Man et al., 2014 [67]
IndiaWastewater treatmentImpingerMay–June-12.51–1.5-Onsite 0.8–741Gangamma et al., 2011 [71]
USAWastewater treatmentFilter heads with 37-mm glass-fibre filtersAll year4024–5-Onsite 70.9 (35.6–147.8)Lee et al., 2006 [66]
SwitzerlandWastewater treatmentFilter heads with 37-mm polycarbonate filtersAll year221.54-Onsite 8.8–29.8
(1.4–103)
Oppliger et al., 2005 [72]
USAApplication of biosolids to landImpingersAll year1212.50.025–0.75-Onsite 2300
Upwind 3.3
Paez-Rubio et al., 2007 [73]
USABioaerosol exposure after floodingFilter heads with 37-mm Teflon filtersOctober–November-106-0.6–8.3Solomon et al., 2006 [69]
DenmarkStrawberry farmFilter heads with polycarbonate filtersJune–August123.51.3–4.8-8.9 (2.5–27.8)Tendal et al., 2011 [74]
ItalyAnaerobic digestion of biomassMultistage impactor with glass-fibre filtersMay–June1212704-12.57–18.9Traversi et al., 2015 [75]

