Article

A Controlled Study on the Characterisation of Bioaerosols Emissions from Compost

1
School of Water, Energy and Environment, Cranfield University, Cranfield MK43 0AL, UK
2
STEM Faculty, Open University, Walton Hall MK6 7AA, UK
3
Public Health England, Chemical and Environmental Effects Department, Centre for Radiation, Chemical and Environmental Hazards, Oxfordshire OX11 0RQ, UK
4
Biosafety, Air and Water Microbiology Group, National Infection Service, Public Health England, Salisbury SP4 0JG, UK
5
Air Quality Management Resource Centre, Faculty of Environment and Technology, University of the West of England, Bristol BS16 1QY, UK
6
School of Biomedical and Healthcare Sciences, Plymouth University, Drake Circus, Plymouth PL4 8AA, UK
7
Environment Agency, Research, Assessment and Evaluation, Deanery Road, Bristol BS1 5AH, UK
*
Author to whom correspondence should be addressed.
Atmosphere 2018, 9(10), 379; https://doi.org/10.3390/atmos9100379
Submission received: 22 July 2018 / Revised: 22 September 2018 / Accepted: 24 September 2018 / Published: 28 September 2018
(This article belongs to the Special Issue Impacts of Air Pollution on Human Health)

Abstract

:
Bioaerosol emissions arising from biowaste treatment are an issue of public concern. To better characterise the bioaerosols, and to assess a range of measurement methods, we aerosolised green waste compost under controlled conditions. Viable and non-viable Andersen samplers, cyclone samplers and a real time bioaerosol detection system (Spectral Intensity Bioaerosol Sensor (SIBS)) were deployed simultaneously. The number-weighted fraction of fluorescent particles was in the range 22–26% of all particles for low and high emission scenarios. Overall fluorescence spectral profiles seen by the SIBS exhibited several peaks across the 16 wavelength bands from 298 to 735 nm. The size-fractionated endotoxin profile showed most endotoxin resided in the 2.1–9 μm aerodynamic diameter fraction, though up to 27% was found in a finer size fraction. A range of microorganisms were detected through culture, Matrix Assisted Laser Desorption and Ionisation Time of Flight Mass Spectrometry (MALDI-TOF) and quantitative polymerase chain reaction (qPCR), including Legionella pneumophila serogroup 1. These findings contribute to our knowledge of the physico-chemical and biological characteristics of bioaerosols from composting sites, as well as informing future monitoring approaches and data interpretation for bioaerosol measurement.

1. Introduction

There is public concern as to whether bioaerosol emissions above ambient background levels, which may arise from such sources as waste treatment and agricultural activities, have any health implications for nearby communities [1,2]. There is evidence that occupational exposures to high concentrations of bioaerosols can be harmful. The potential health risks from exposure to bioaerosols include infection, toxicity and allergenicity, depending on the bioaerosol composition and on receptor characteristics [3,4]. It is less clear what impacts might arise in nearby populations who may be exposed to lower, but still above-background, concentrations. Some evidence is available, for example for composting [3,5], wastewater treatment plants [6,7,8], and intensive agriculture facilities [9,10]. However, such evidence is difficult to gather directly using current methods: results are variable, can be statistically uncertain and tend to rely on proxies for exposure and self-reported impacts. Advancement of bioaerosol risk assessment for industrial processes is limited by uncertainties in hazard characterisation, due to limited health impact data and limitations of current methods for the measurements of bioaerosols [11].
Most available evidence on bioaerosol emissions from regulated processes comes from short duration sampling and culture-based analysis, and may not reflect the complete emissions profile due to time varying site specific factors. The current state of knowledge on emission characteristics is therefore limited, and data on distances at which process-derived bioaerosols remain detectable above ambient background are inconsistent. For example, Pearson et al. [3] identified six studies where Aspergillus fumigatus or total bacteria levels were above the UK Environment Agency’s recommended threshold levels more than 250 m from the site. There are significant knowledge gaps with respect to the composition, magnitude and continuous spatiotemporal characterisation of bioaerosol emissions. Another area of uncertainty is the relationship between particle size and bioaerosol components from an industrial process, and hence their dispersion characteristics, and their association with operations and emission controls. As a result, policies and practices that are based on risk and enable a proportionate response to managing industrial bioaerosol emissions must be made on the basis of incomplete information. Regulators of bioaerosol sources have therefore tended to take a precautionary approach, attempting to ensure that individuals are not exposed to bioaerosol levels higher than those they would typically encounter in the environment.
Improving on the current situation will require better techniques for the rapid detection and characterisation of bioaerosol emissions. Current advancement in bioaerosol detection and characterisation technologies can significantly advance our knowledge on the physical, chemical and biological characteristics of emissions from potential sources. For example, endotoxin is a known pro-inflammatory agent; information on the size distribution of endotoxin-containing aerosols will inform our understanding of endotoxin exposure and inhalation. Improved molecular methods are enabling the identification of pathogenic/allergenic microorganisms in bioaerosols and address the limitations of culture methods, including the detection of viable but non-culturable (VBNC) organisms. Such methods are providing information on bioaerosol characteristics, abundance and diversity but cannot yet provide continuous information to determine temporal variability [12]. In contrast, single particle fluorescence spectroscopy has shown potential to detect and quantify (though not comprehensively speciate) bioaerosol in real-time, and sensors based on this technology are now being deployed in a range of environments including composting facilities. For example O’Connor et al. [13] were able to show that using a WIBS-4 (Waveband Integrated Bioaerosol Sensor model 4, University of Hertfordshire, Hatfield, UK) at a green waste composting site can provide real-time data on bioaerosol release profiles.
Field measurements of bioaerosols are dependent on site activity, meteorology and can be limited by issues of access and confounded by other nearby bioaerosol sources and variations in ambient background bioaerosol levels. Studies under controlled conditions can help characterise the critical characteristics of bioaerosol emissions from a given source. For example the dustiness of organic waste, focusing on endotoxin and culturable microbial components, has been investigated using a rotating drum in the laboratory [14,15,16]. However, there are very limited data giving detailed characterisation of complex sources of bioaerosols. This study aimed to test a suite of methods to better elucidate physico-chemical and biological characteristics of bioaerosols emissions by using them concurrently under controlled conditions, using compost as an example of a bioaerosol emission source.

2. Materials and Methods
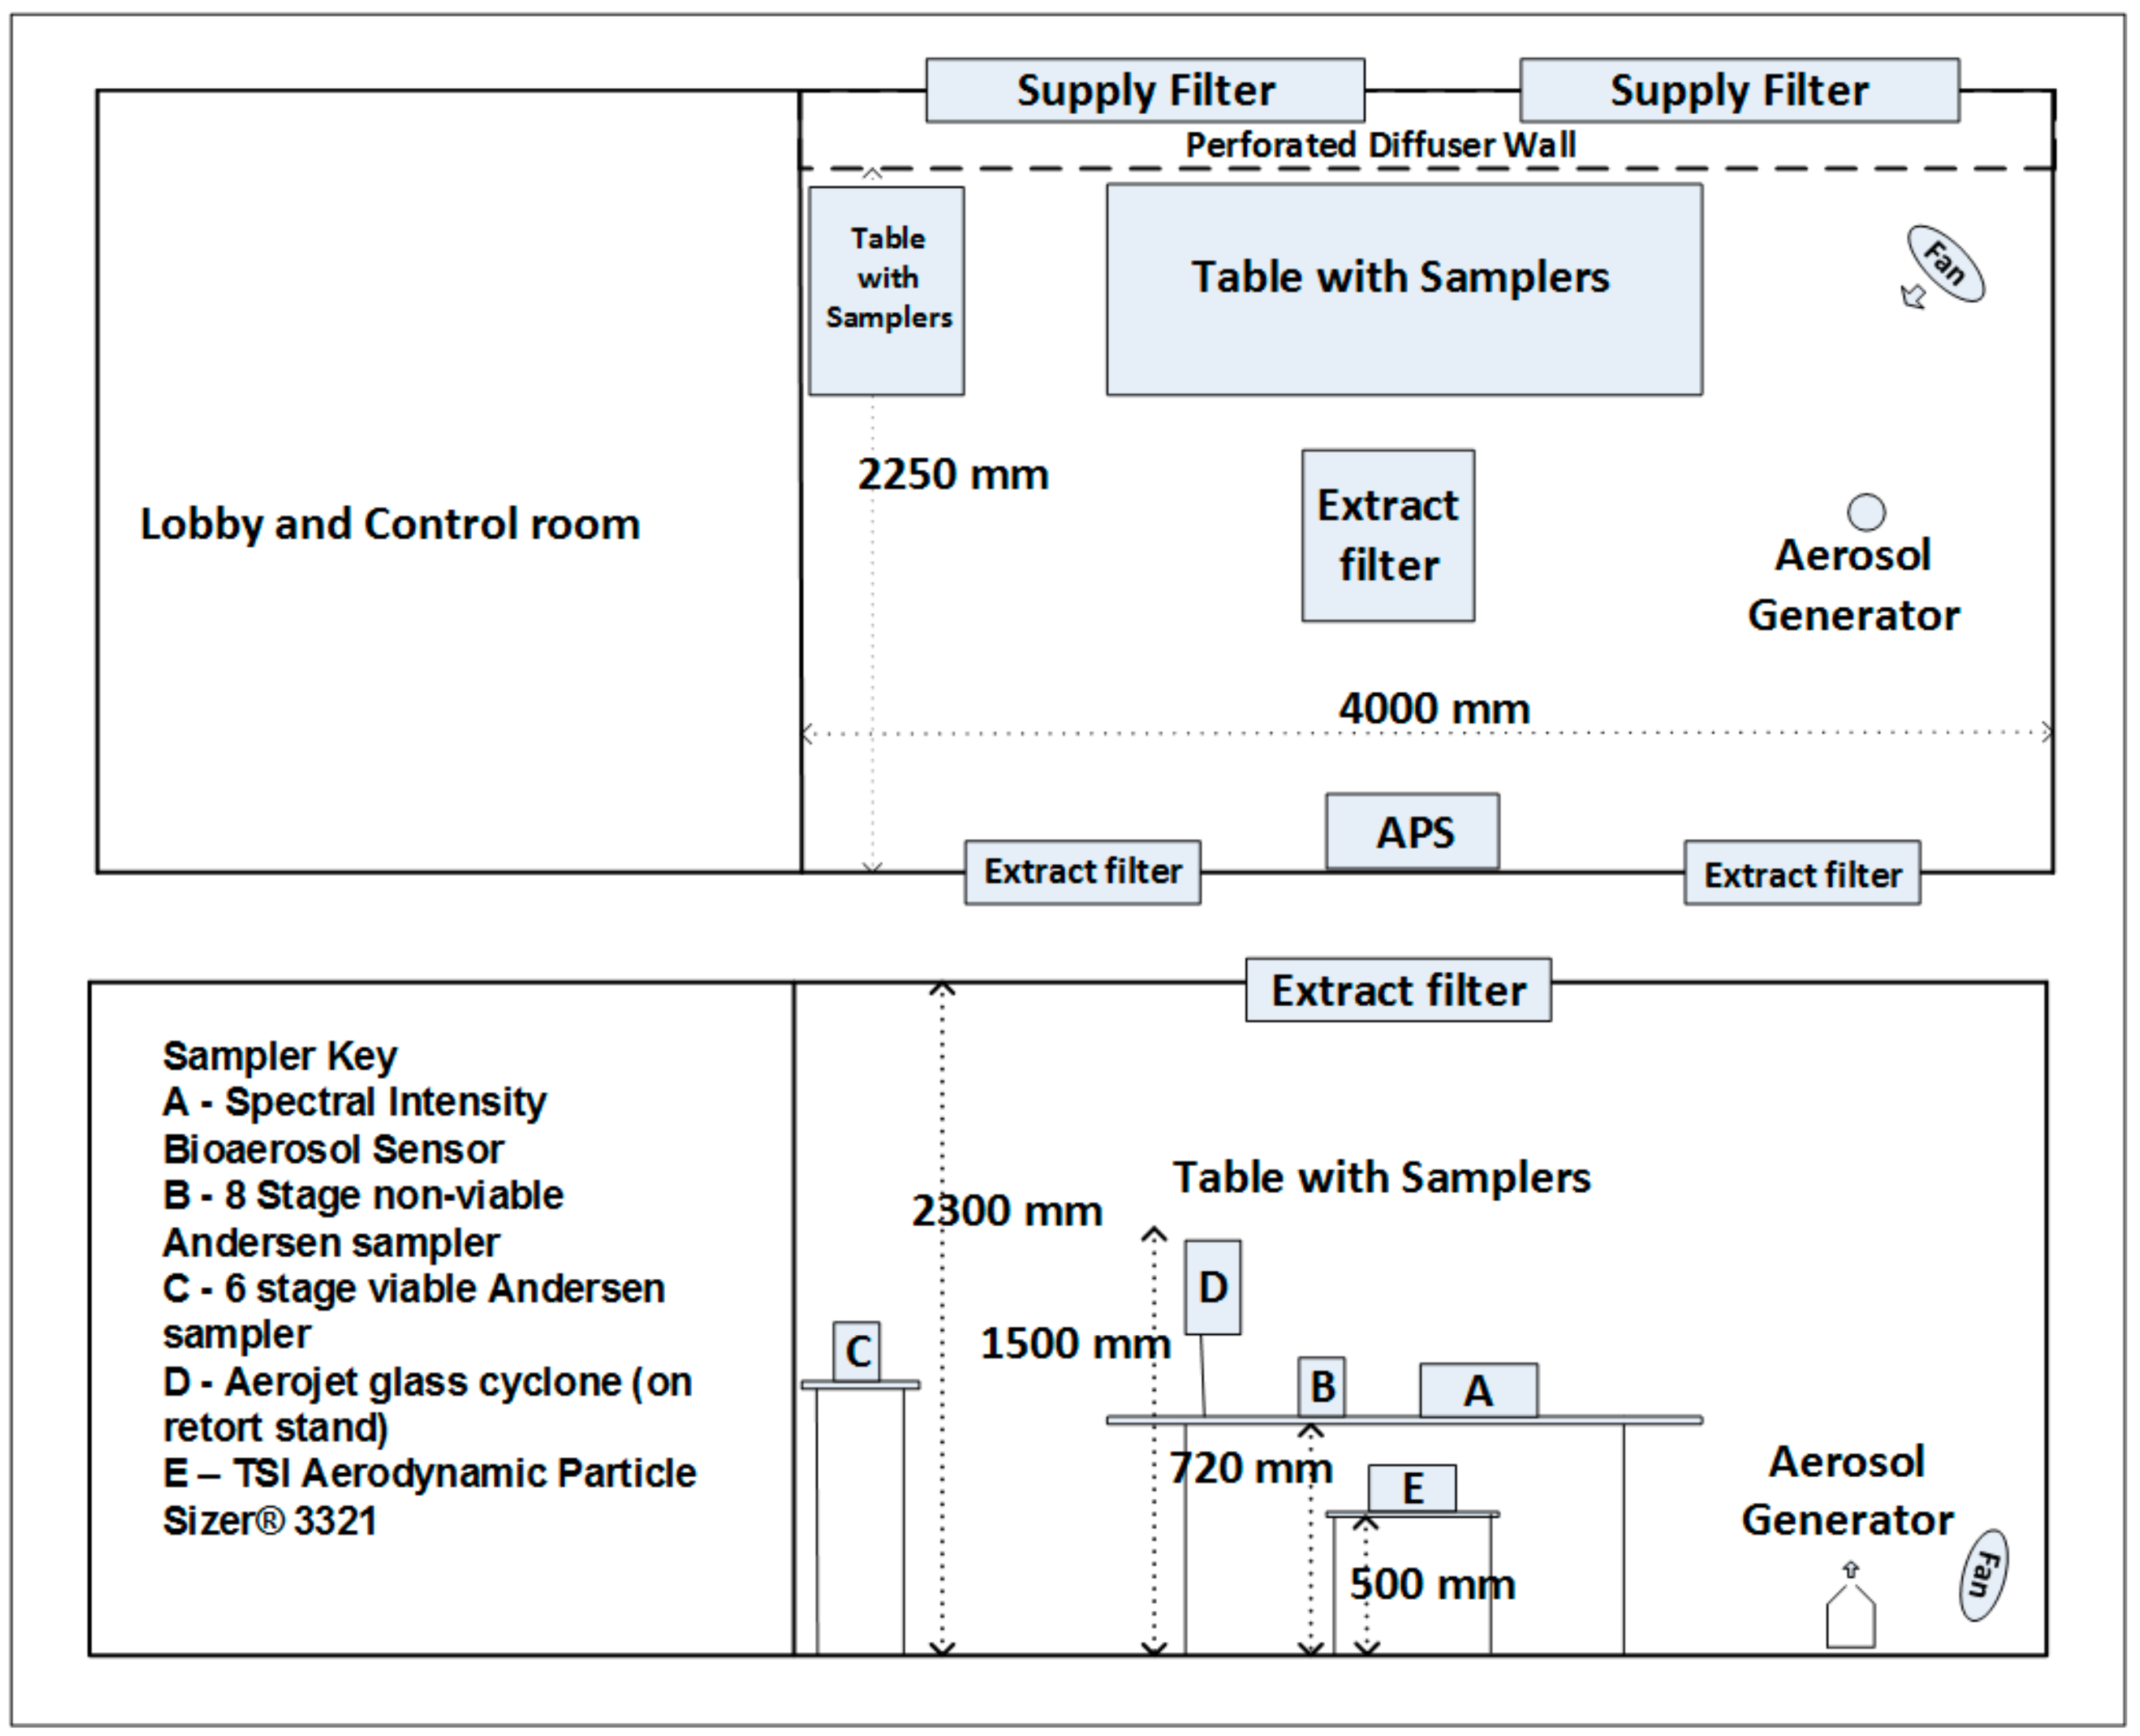
2.1. Test Chamber

The characterisation of bioaerosol emissions from commercial compost was carried out in a controlled test chamber (Figure 1). The walls and ceiling are constructed from panels, faced with white, food-safe, unplasticised Polyvinyl Chloride (UPVC) laminated, zinc coated sheet steel. The test chamber had a volume of 20 m3 and was supplied with a horizontal flow of clean air from a bank of high efficiency particulate air (HEPA) filters, positioned behind a diffuser wall. These filters fed a combination of fresh air and recirculated HEPA filtered air from the chamber. A separate extract filter mounted centrally within the ceiling, drew a small fraction of air to maintain negative pressure and allow for the introduction of fresh air. The chamber is designed to allow the operation of equipment and services remotely from an anteroom, allowing for procedures to be undertaken without staff being present in the test space. The chamber is designed to achieve up to 250 air changes per hour, providing very high levels of air cleanliness and rapid removal of test aerosols.

2.2. Experimental Design and Instrumentation

Final grade compost was collected from a green waste compost site (processing organic waste products such as green garden waste, fruit, vegetable waste, straw, stable waste paper and card) and transported to the laboratory in sealed plastic bags and stored at 4 °C. For each experimental run, 25 g of compost was aerosolised using a purpose-built aerosol generator. The purpose was to design and assemble a dry aerosol generation device capable of generating polydisperse aerosol from compost. Figure 2 shows a schematic of the aerosolisation method.
Compressed air was delivered in to a 5 L Duran bottle via two lengths of 8 mm steel pipe introduced into the vessel centrally through the open top. The primary pipe (main air supply) was angled and bent, with a partially closed end, giving a ca. 3 mm diameter outlet. This delivered air towards the lower edge of the side wall of the bottle, producing a cyclonic effect within the vessel. The second pipe (pulsed air supply) was left straight and positioned with its outlet a few cm above the centre of the vessel floor. HEPA filtered compressed air was delivered to the vessel via the primary pipe at 20 PSI at a rate of 90 L/min and run continuously throughout a sampling period. Due to the nature of the inflowing air, some of the compost collected in the central part of the flask floor. The second pipe (pulsed air supply) was used to deliver short jets of HEPA filtered compressed air to the base of the bottle in order to redistribute the compost as required. The frequency of this operation allowed for increased aerosolisation when required (high aerosolisation). The aerosol concentration inside the chamber was monitored by the direct, live readout of an Aerodynamic Particle Sizer (TSI Incorporated). Several repeat sampling experiments were carried out during periods of no aerosolisation (control) and aerosolisation and each run lasted for 30 min. The aerosolisation runs were performed under two emission scenarios: low and high aerosolisation. A fan was used to aid with the even distribution of aerosols throughout the chamber. A suite of instruments, specific to the detection and quantification of different physico-chemical and biological characteristics of bioaerosol emissions, were deployed inside the chamber at the height of 1–1.5 m (Figure 1 and Table 1).
The chamber was fully ventilated before and after each sampling experiment. The temperature and relative humidity were monitored and were in the ranges of 22–24 °C and 46–60%, respectively, during various sampling periods.

2.2.1. Spectral Intensity Bioaerosol Sensor (SIBS)

The SIBS (Droplet Measurement Technologies, Longmont, CO, USA) is an expansion of the Wideband Integrated Bioaerosol Sensor (WIBS, Droplet Measurement Technologies, Longmont, CO, USA) and differs from the WIBS in recording highly resolved fluorescence intensity measurements across 16 wavelength bands from 298 to 735 nm for two excitation wavelength (λex 285 nm and λex 370 nm) compared with three emissions (λem) bands (FL1: λex = 280 nm, λem ~310–400 nm, FL2: λex = 280 nm, λem ~420–650 nm, and FL3: λex = 370 nm, λem ~420–650 nm) for the WIBS. Table 2 lists lower and upper wavelength ranges for each channel.
The SIBS used in this study derived the equivalent optical diameter (EOD) for particles in the size range 0.4–7 µm and had sample flow rate of 0.3 L/min. Particle size calibration was carried out by Droplet Measurement Technologies, Longmont, CO, USA, using standard monodisperse polystyrene latex microspheres (refractive index: 1.58).

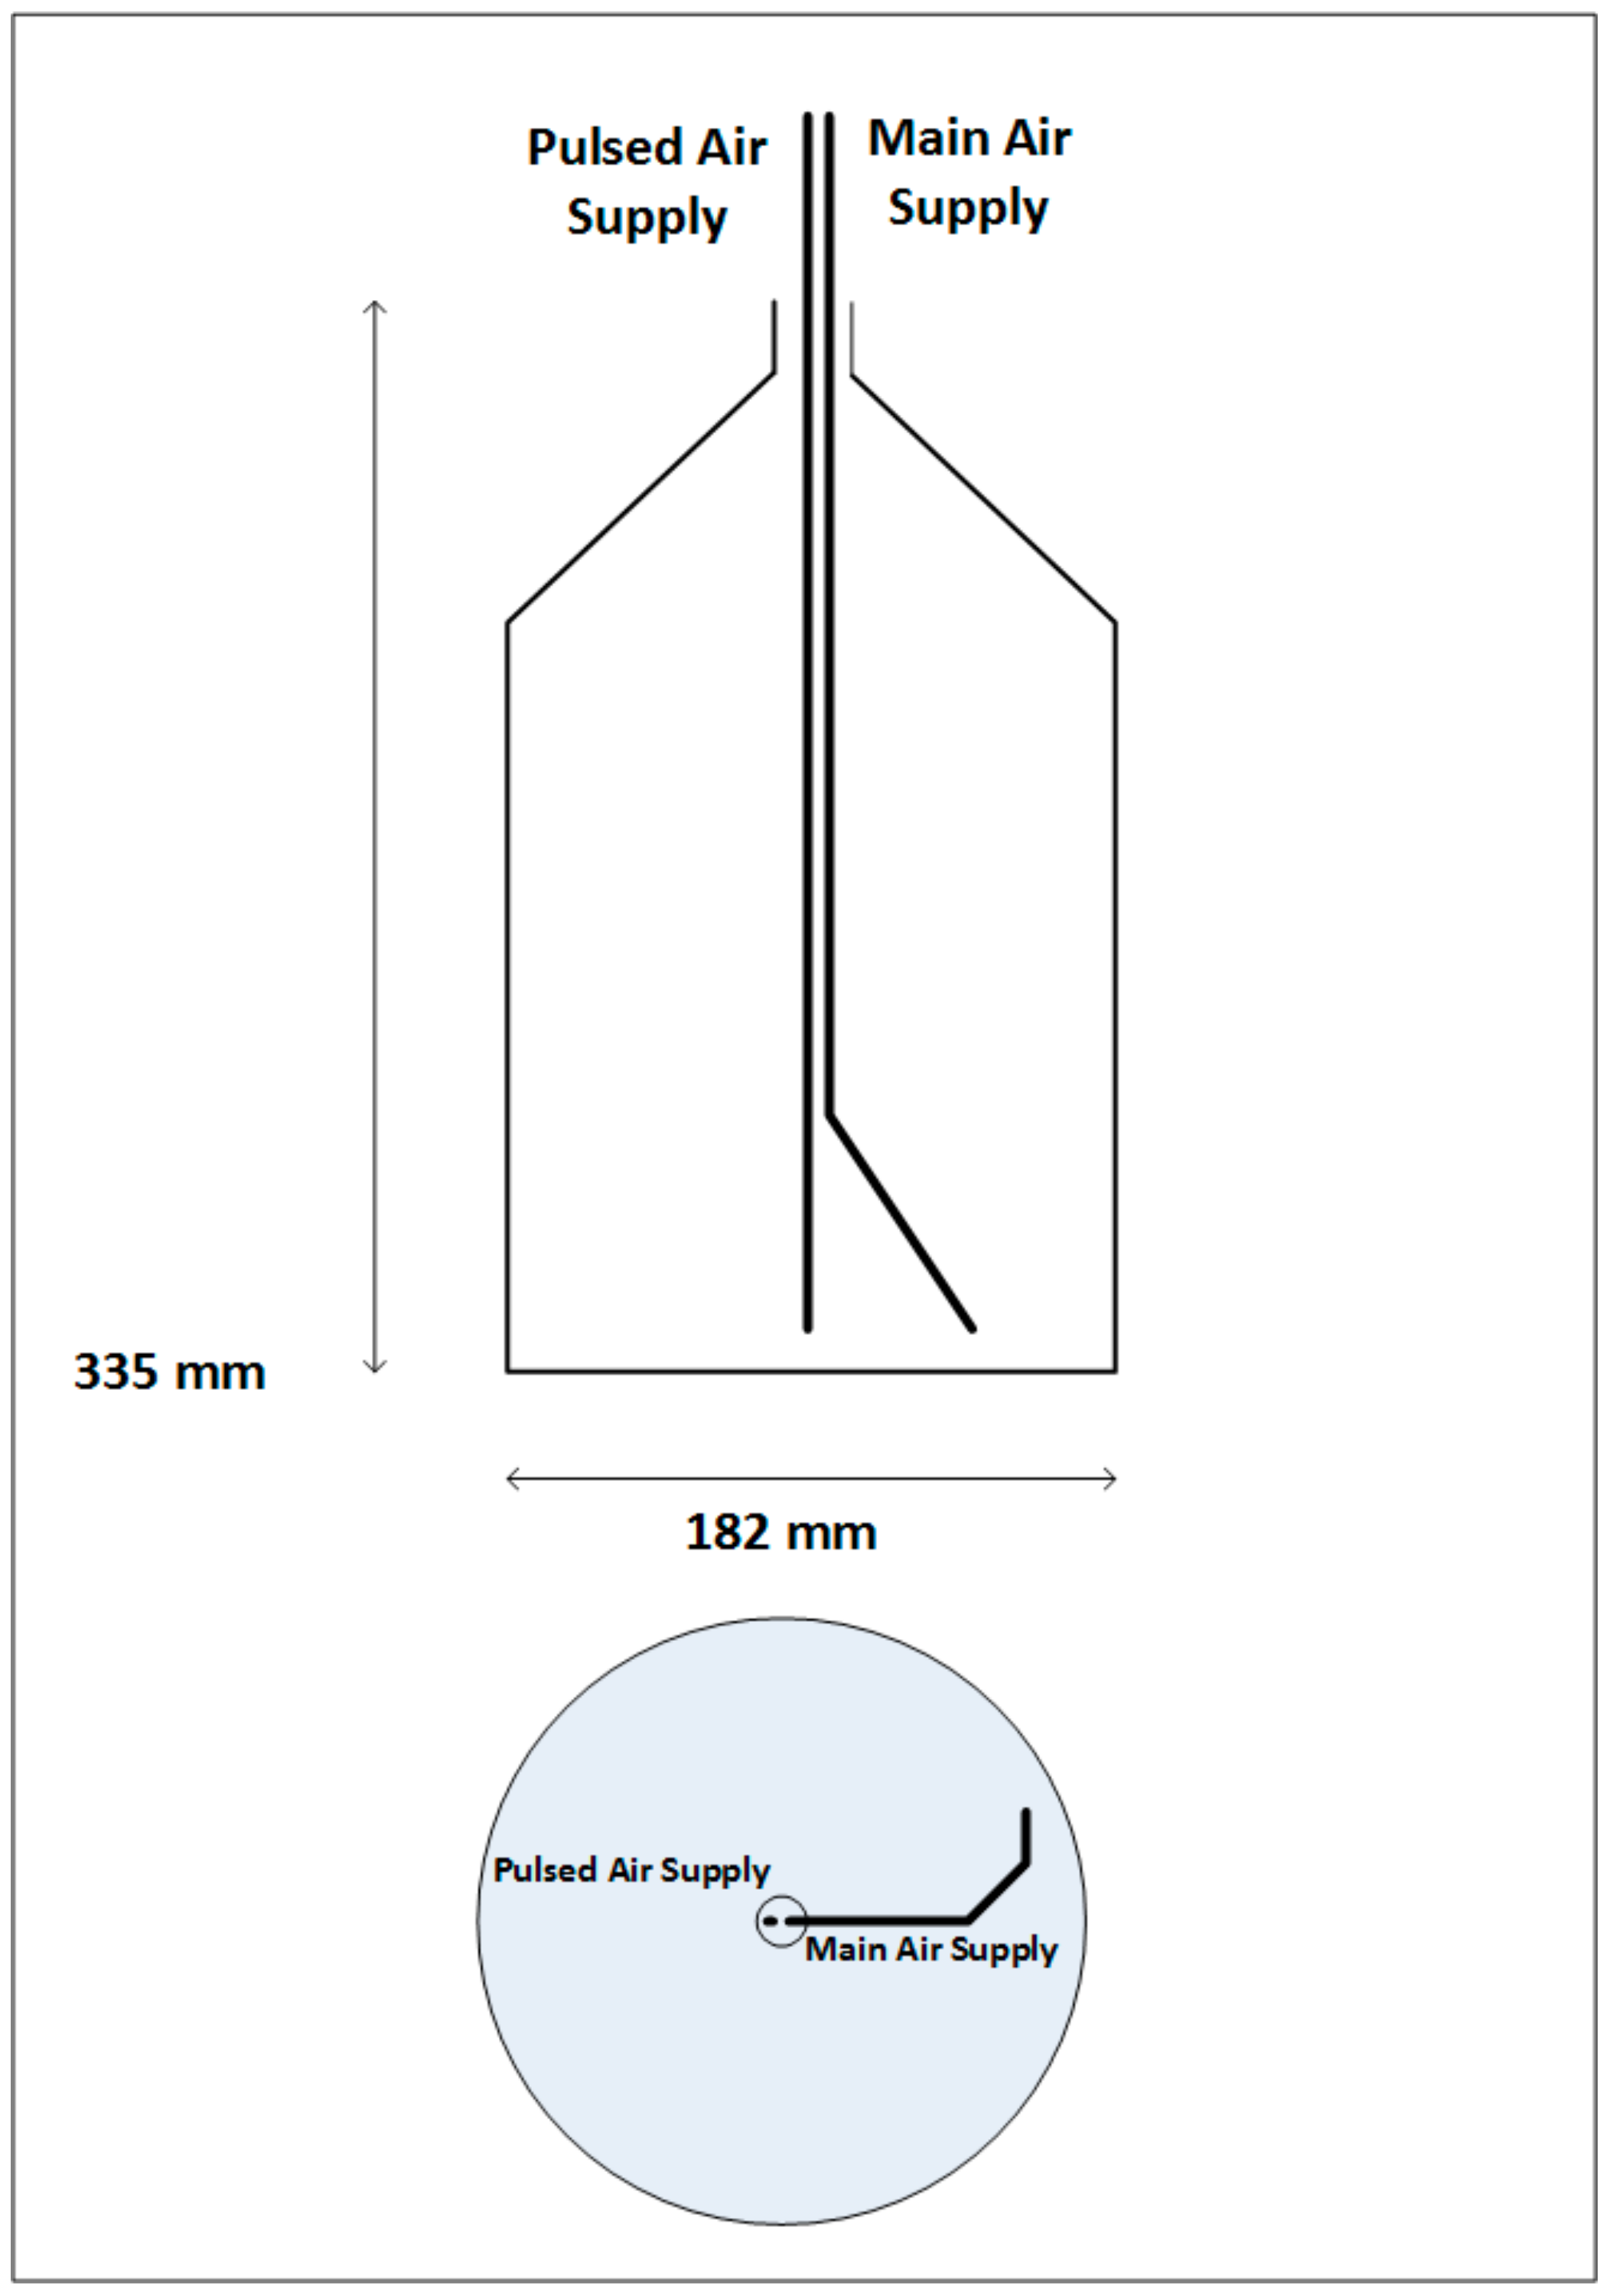
2.2.2. Aerojet Glass Cyclone

The glass cyclone sampler is equipped with a liquid injection nozzle at the cyclone entry, allowing for the continuous injection of a collection fluid (Phosphate-buffered mannitol, PBMA), wetting and washing the internal surfaces, where captured particles are deposited [17]. The collection fluid was delivered via a peristaltic pump and collected in the base of the sampler during use. It was drawn off using a sterile syringe at the end of the sampling period. Air was drawn through the sampler using a vacuum pump at an approximate sampling rate of 600 L/min.

2.2.3. Eight-Stage Non-Viable Andersen Sampler

The eight-stage non-viable Andersen sampler (Westech, Upper Stondon, UK) is a multi-orifice cascade impactor which allows the collection of aerodynamically size segregated particles at different stages from 0.4 to >10 µm. The sampler was loaded with GF/A 81 mm glass fibre filters (Fisher Scientific, Loughborough, UK) to collect aerosolised compost and operated at 28.3 L/min via a calibrated vacuum pump (JS Holdings, Stevenage, UK).

2.2.4. Six-Stage Viable Andersen Sampler

The Andersen six-stage viable particle sampler is a multi-orifice cascade impactor offering the collection of aerodynamically sized particles on agar plates [18]. Two samplers were loaded with Legionella and Mycobacteria selective agar plates, Glycine Vancomycin Polymyxin Cycloheximide (GVPC, Oxoid, Basingstoke, UK) and Middlebrooks 7H10 (PHE, Salisbury, UK), respectively, and operated at 28.3 L/min via a calibrated vacuum pump (JS Holdings, Stevenage, UK).

2.3. Sampling and Downstream Bioaerosol Analysis

Six compost aerosolisation runs of 30 min each were performed under two emission scenarios: low and high. Additionally, control runs (no aerosolisation) were carried out to ensure QA/QC. During the control runs mean number concentration ranged between 0.50–1.14 cm−3 and endotoxin, microbiological culture and qPCR results were negative. Non-tuberculous mycobacteria and Legionella analysis by Anderson six stage viable sampler were conducted for three runs only (one in a low emission scenario and two in high emission scenarios).

2.3.1. Spectral Intensity Bioaerosol Sensor (SIBS)

Continuous real-time measurements were made with the SIBS (Droplet Measurement Technologies, Longmont, CO, USA). The SIBS stores single particle data and these were processed in an off line analysis tool kit by choosing an averaging interval of 60 s and particle size limit of 0.5–7 µm. Prior to each measurement the SIBS was run in forced trigger mode for five minutes to determine background fluorescence. To set up a fluorescence threshold to calculate fluorescent particle concentration, firstly mean forced trigger values were subtracted from each particle across the channels followed by a single threshold value calculated from mean forced trigger values of all the channels + 3 × mean SD values of all the channels. Furthermore, some particles may not be flashed (excited) during recharge of flash lamps leading to three categories of particles: Total particles, excited particles and fluorescent particles. Therefore, the concentration of fluorescent particles was corrected by Equation (1).
Fluorescent concentration (cm−3) = (F/E) × T
where T is total particles (cm−3), E is excited particles (cm−3) and F is fluorescent particles (cm−3) (based on the fluorescence threshold).
For the analysis of fluorescent emission intensity across different bands, a five-minute single particle data sample from each aerosolisation run during low and high emission scenario was selected. The sample size for fluorescence emission intensity analysis for different samples is shown in Table 3.
For each sample, firstly, mean forced intensity values were subtracted from individual particles in corresponding channels and the particles with emission intensity values less than forced intensity values in all channels were excluded. Then, mean fluorescence intensity of fluorescent particles was computed across the emission wavelength bands on a channel-by-channel basis. Thus, three fluorescence spectra were obtained for each scenario. Lastly, mean emission intensities along with standard deviation were computed for low and high emission scenarios.

2.3.2. Endotoxin

Before sampling filters, tweezers and glassware were depyrogenated by heating to 250 °C for at least 4 h. After sampling, each filter was removed and stored in 15 mL of LAL water for single filters or 40 mL of LAL water for multiple filters. In total nine size fractions were obtained with some filters extracted together to reduce the fractionation profile to 10.0–9.0 µm, 9.0–2.1 µm, 2.1–0.43 µm and <0.43 µm. To extract the endotoxin, filters were shaken for 1 h at room temperature. The supernatant was transferred to a clean tube and centrifuged at 1000× g for 15 min to remove any glass fibre. The clear supernatant was assayed for endotoxin using a kinetic chromogenic Limulus Amoebocyte Lysate (LAL) assay kit (Associates of Cape Cod, Inc., East Falmouth, MA, USA). Briefly, 50 µL of sample was added to a 96 well microplate with 50 µL of lysate reconstituted with Glucashield to prevent glucan interference in the test. A standard curve was obtained using control standard endotoxin ranging 5–0.005 EU/mL. Endotoxin concentrations were calculated by incubating the plate at 37 °C in a microplate reader with a 405 nm filter for 90 min. Each sample was assayed in duplicate.

2.3.3. Microbial Culture and Identification

Raw Compost

To characterise the microbial composition of the raw compost material, five grams of compost was re-suspended in 30 mL sterile distilled water by shaking at 100 rpm for 10 min. After 15 min of settling 100 µL aliquots (and 10-fold serial dilutions) in duplicate were plated on Legionella selective GVPC (Glycine, Vancomycin hydrochloride, Polymyxin B sulphate, Cycloheximide; ThermoFisher, Loughborough, UK) following acid and heat treatment according to ISO 11731 [19]. Plates were incubated at 30 °C ± 1 °C and 37 °C ± 1 °C for 10 days. To enumerate total viable count (TVC), Gram negative organisms, total coliforms and E. coli, 100 µL (and serial dilutions) were plated on Trypticase Soya agar (TSA), MacConkey and Brilliance™ E. coli/coliform Selective Agar (COLIC; ThermoFisher, Loughborough, UK). Plates were incubated at 37 °C ± 1 °C for three days. For the isolation of Mycobacteria, 100 µL of sample was decontaminated using 2% NaOH (Mycoprep, BD, Franklin Lakes, NJ, USA) for 15 min prior to plating on Middlebrooks 7H11 agar and incubating for up to 42 days in duplicate at 30 °C ± 1 °C and 37 °C ± 1 °C.

Microbiological Analysis of Air Samples by Culture and MALDI-TOF

Legionella and Mycobacteria selective agar plates from the six-stage viable Andersen samplers were incubated at 37 °C ± 1 °C for 10 and 42 days, respectively. Liquid concentrates (100 µL) from the cyclone samplers were cultured for Legionella, Mycobacteria, TVC, Gram negative bacteria and total coliforms/E. coli as described for raw compost samples. Representative examples of all colony types on TSA, MacConkey and COLIC agar as well as colonies with morphologies consistent with Legionella and Mycobacteria were identified by Matrix Assisted Laser Desorption and Ionisation Time of Flight Mass Spectrometry (MALDI-TOF) using the Bruker Biotyper (Bruker, Coventry, UK). Presumptive Mycobacteria isolates were subject to a full bead-extraction protocol prior to MALDI-TOF according to the manufacturer’s instructions [20]. The degree of similarity between an unknown isolate and a reference sample is determined by the MALDI Biotyper 2.0 software by comparing peak profiles and calculating a logarithmic score between 0 and 3. These log scores were used as cut-offs for bacterial identification. Log scores, as recommended by the manufacturer, were used as cut-offs for bacterial identification. Scores ≥ 2.000 indicated reliable species-level identification, while scores between 1.700 and 1.999 indicated genus-level identification.

Quantitative Polymerase Chain Reaction

Due to the expected abundance of microorganisms in compost and previous inhibition of Legionella culture [21] qPCR was employed to facilitate detection of Legionella from raw compost and air samples. For cyclone concentrates, a minimum of 1 mL was concentrated by membrane filtration using 0.2 µm polycarbonate filters (Pall, Portsmouth, UK) prior to DNA extraction using the DNeasy PowerWater DNA isolation kit (Qiagen, Manchester, UK) according to the manufacturer’s instructions. For raw compost samples, DNA was extracted from triplicate samples of 0.25 g using the DNeasy PowerSoil DNA isolation kit (Qiagen) according to the manufacturer’s instructions. DNA was eluted in a final volume of 100 µL. Quantitative PCR (qPCR) was performed for Legionella spp., Legionella pneumophila and L. pneumophila sg-1 as previously described [22] with the following modifications: TaqMan environmental mastermix beads incorporating a 3′ VIC labelled internal control (Thermofisher) to monitor for inhibition were used for all reactions. The final reaction volume was 30 µL. Reaction conditions were 95 °C for 15 min followed by 40 cycles of 95 °C for 10 s and 60 °C for 1 min. Legionella lognbeachae qPCR was conducted using the Genesig® Legionella longbeachae standard kit (Primerdesign, Southampton, UK) according to the manufacturer’s instructions. All reactions were performed in an ABI 7500 FAST thermocycler (Thermofisher, UK). Filter blanks, no template controls (PCR grade water) and positive controls (either L. pneumophila sg-1 NCTC 12821 or L. longbeachae NCTC 11477) were run with each set of samples. Data were analysed using the ABI 7500 v2.3 Software. The limits of detection and quantification were 4.0 × 10² genome units (GU)/g and 8.0 × 10² GU/g, respectively, for raw compost and 4.6 × 101 (GU)/m3 and 9.2 × 101 GU/m3, respectively, for air samples.

3. Results and Discussion

3.1. SIBS

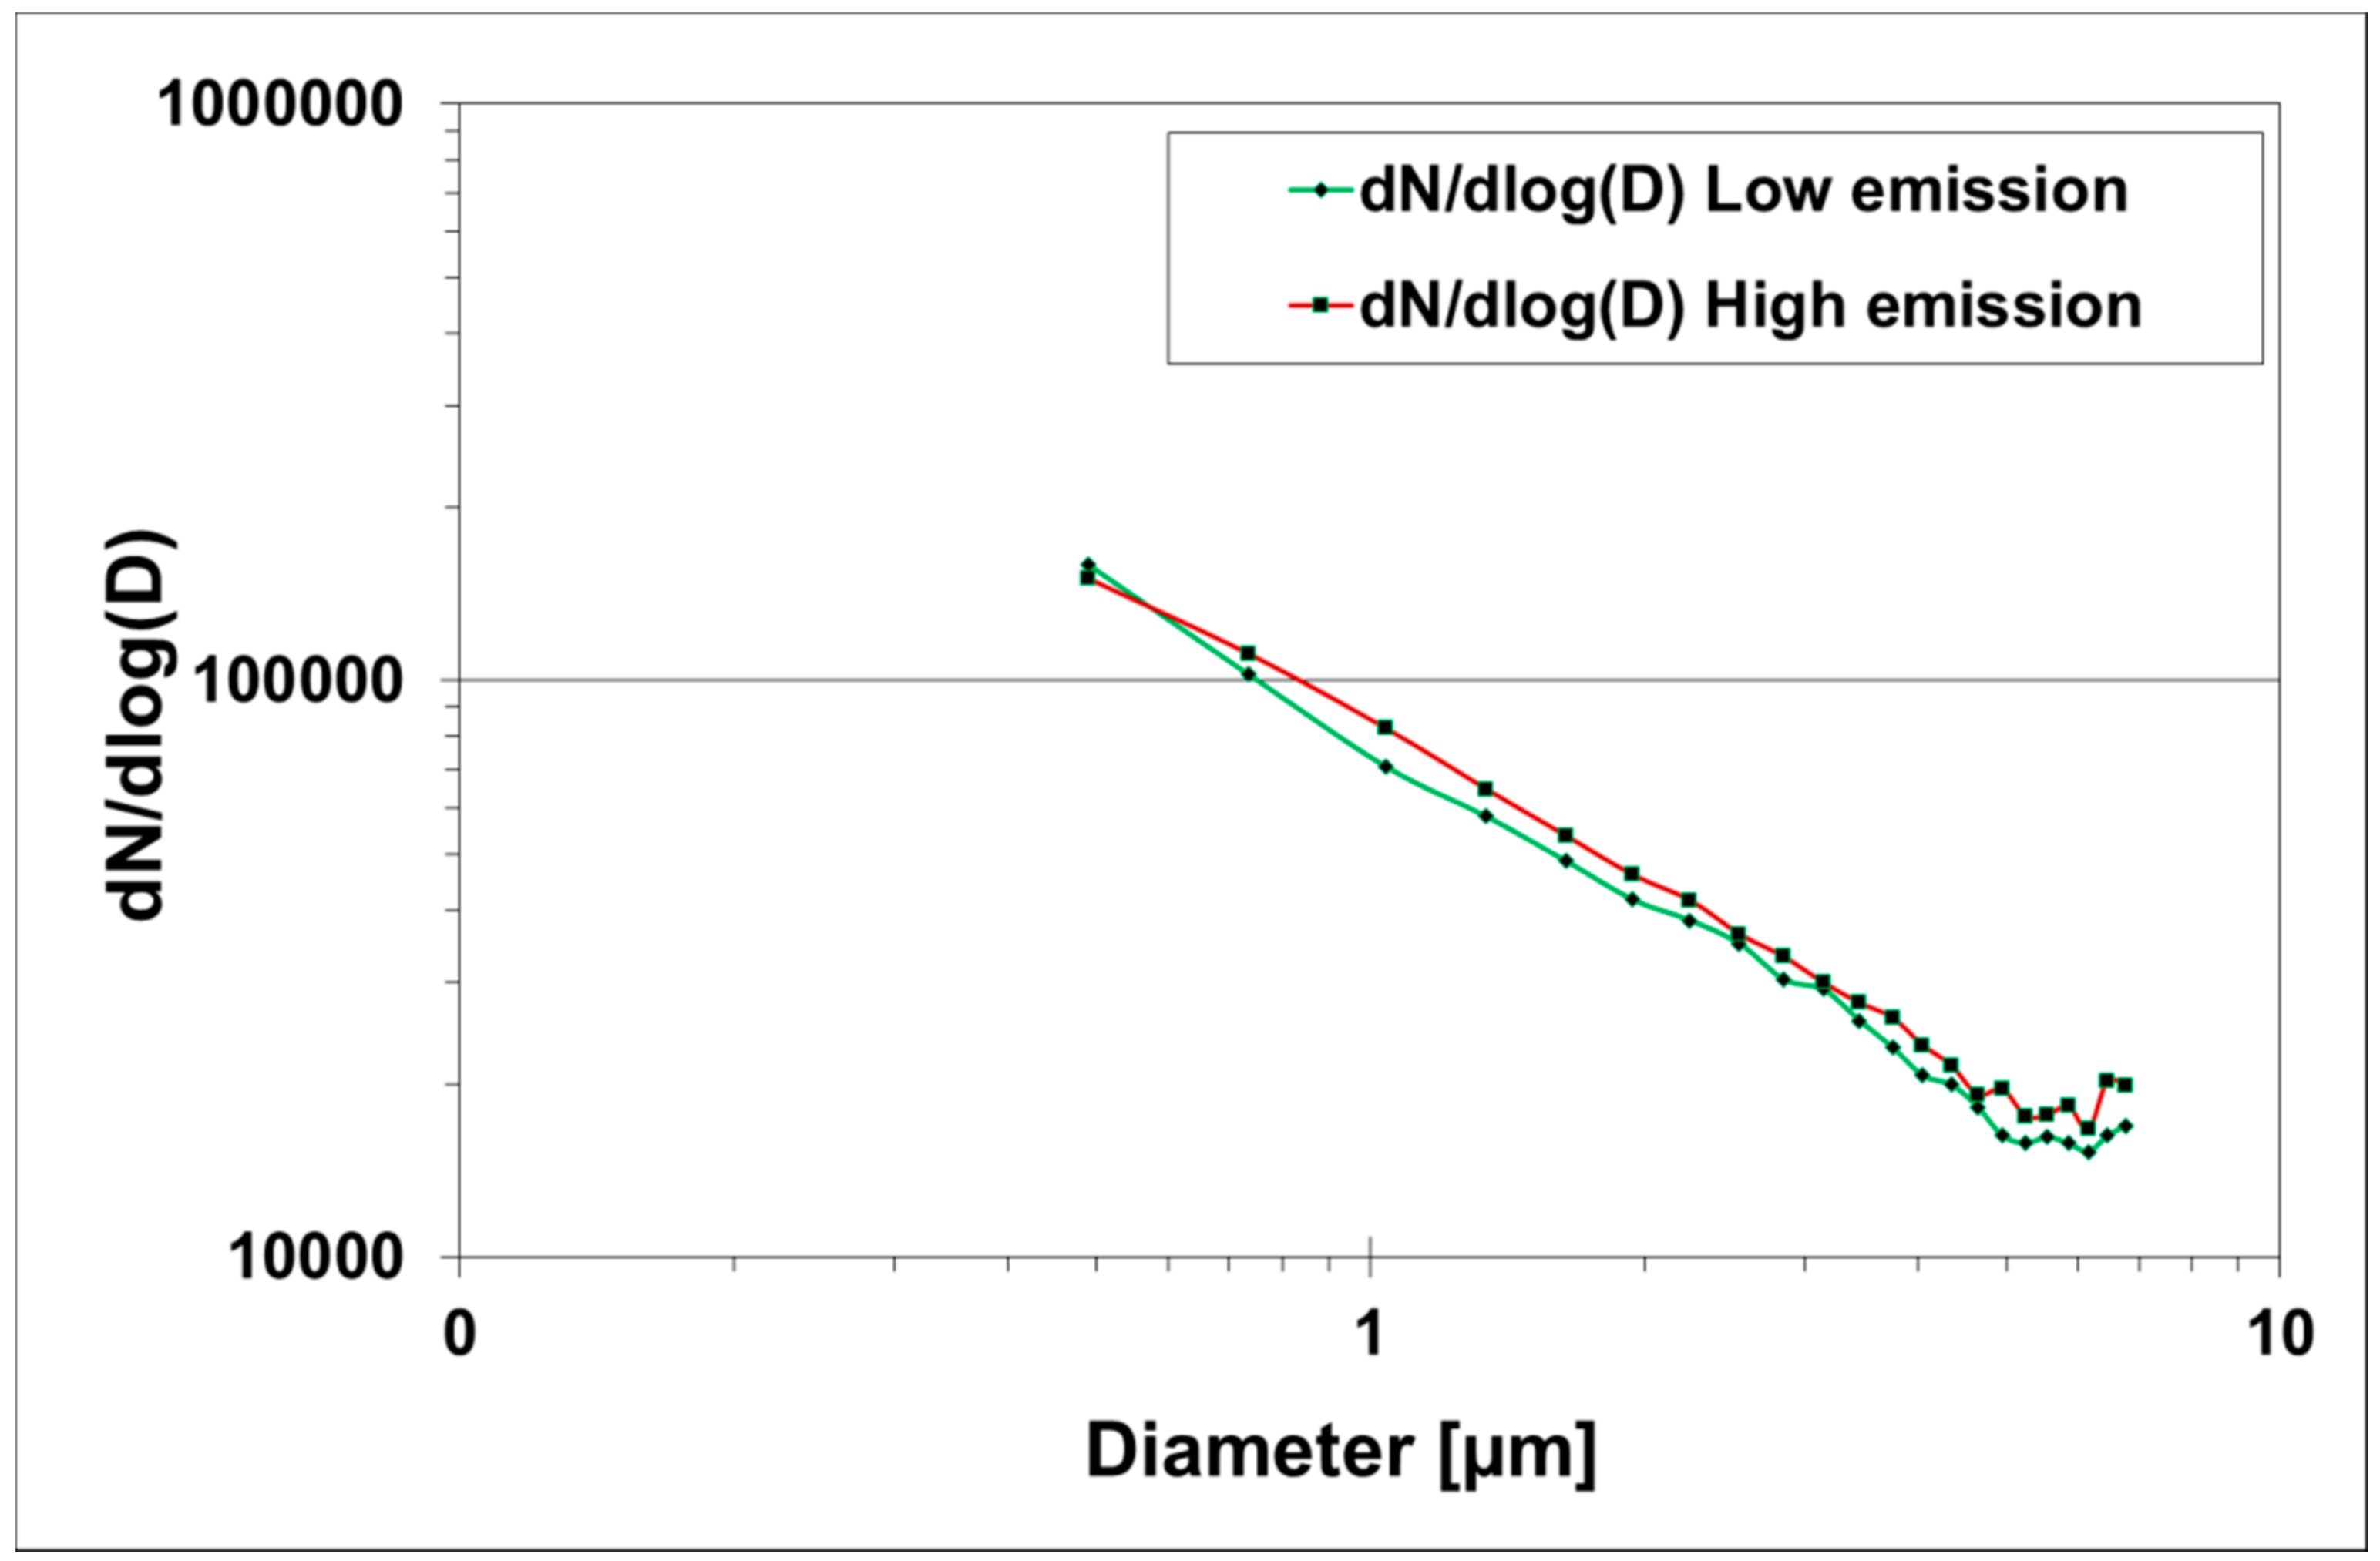
3.1.1. Number Concentration

The concentration of total and fluorescent particles was highest during the high emission scenario although the number weighted fractions of fluorescent particles were comparable between the two emission scenarios (Table 4).

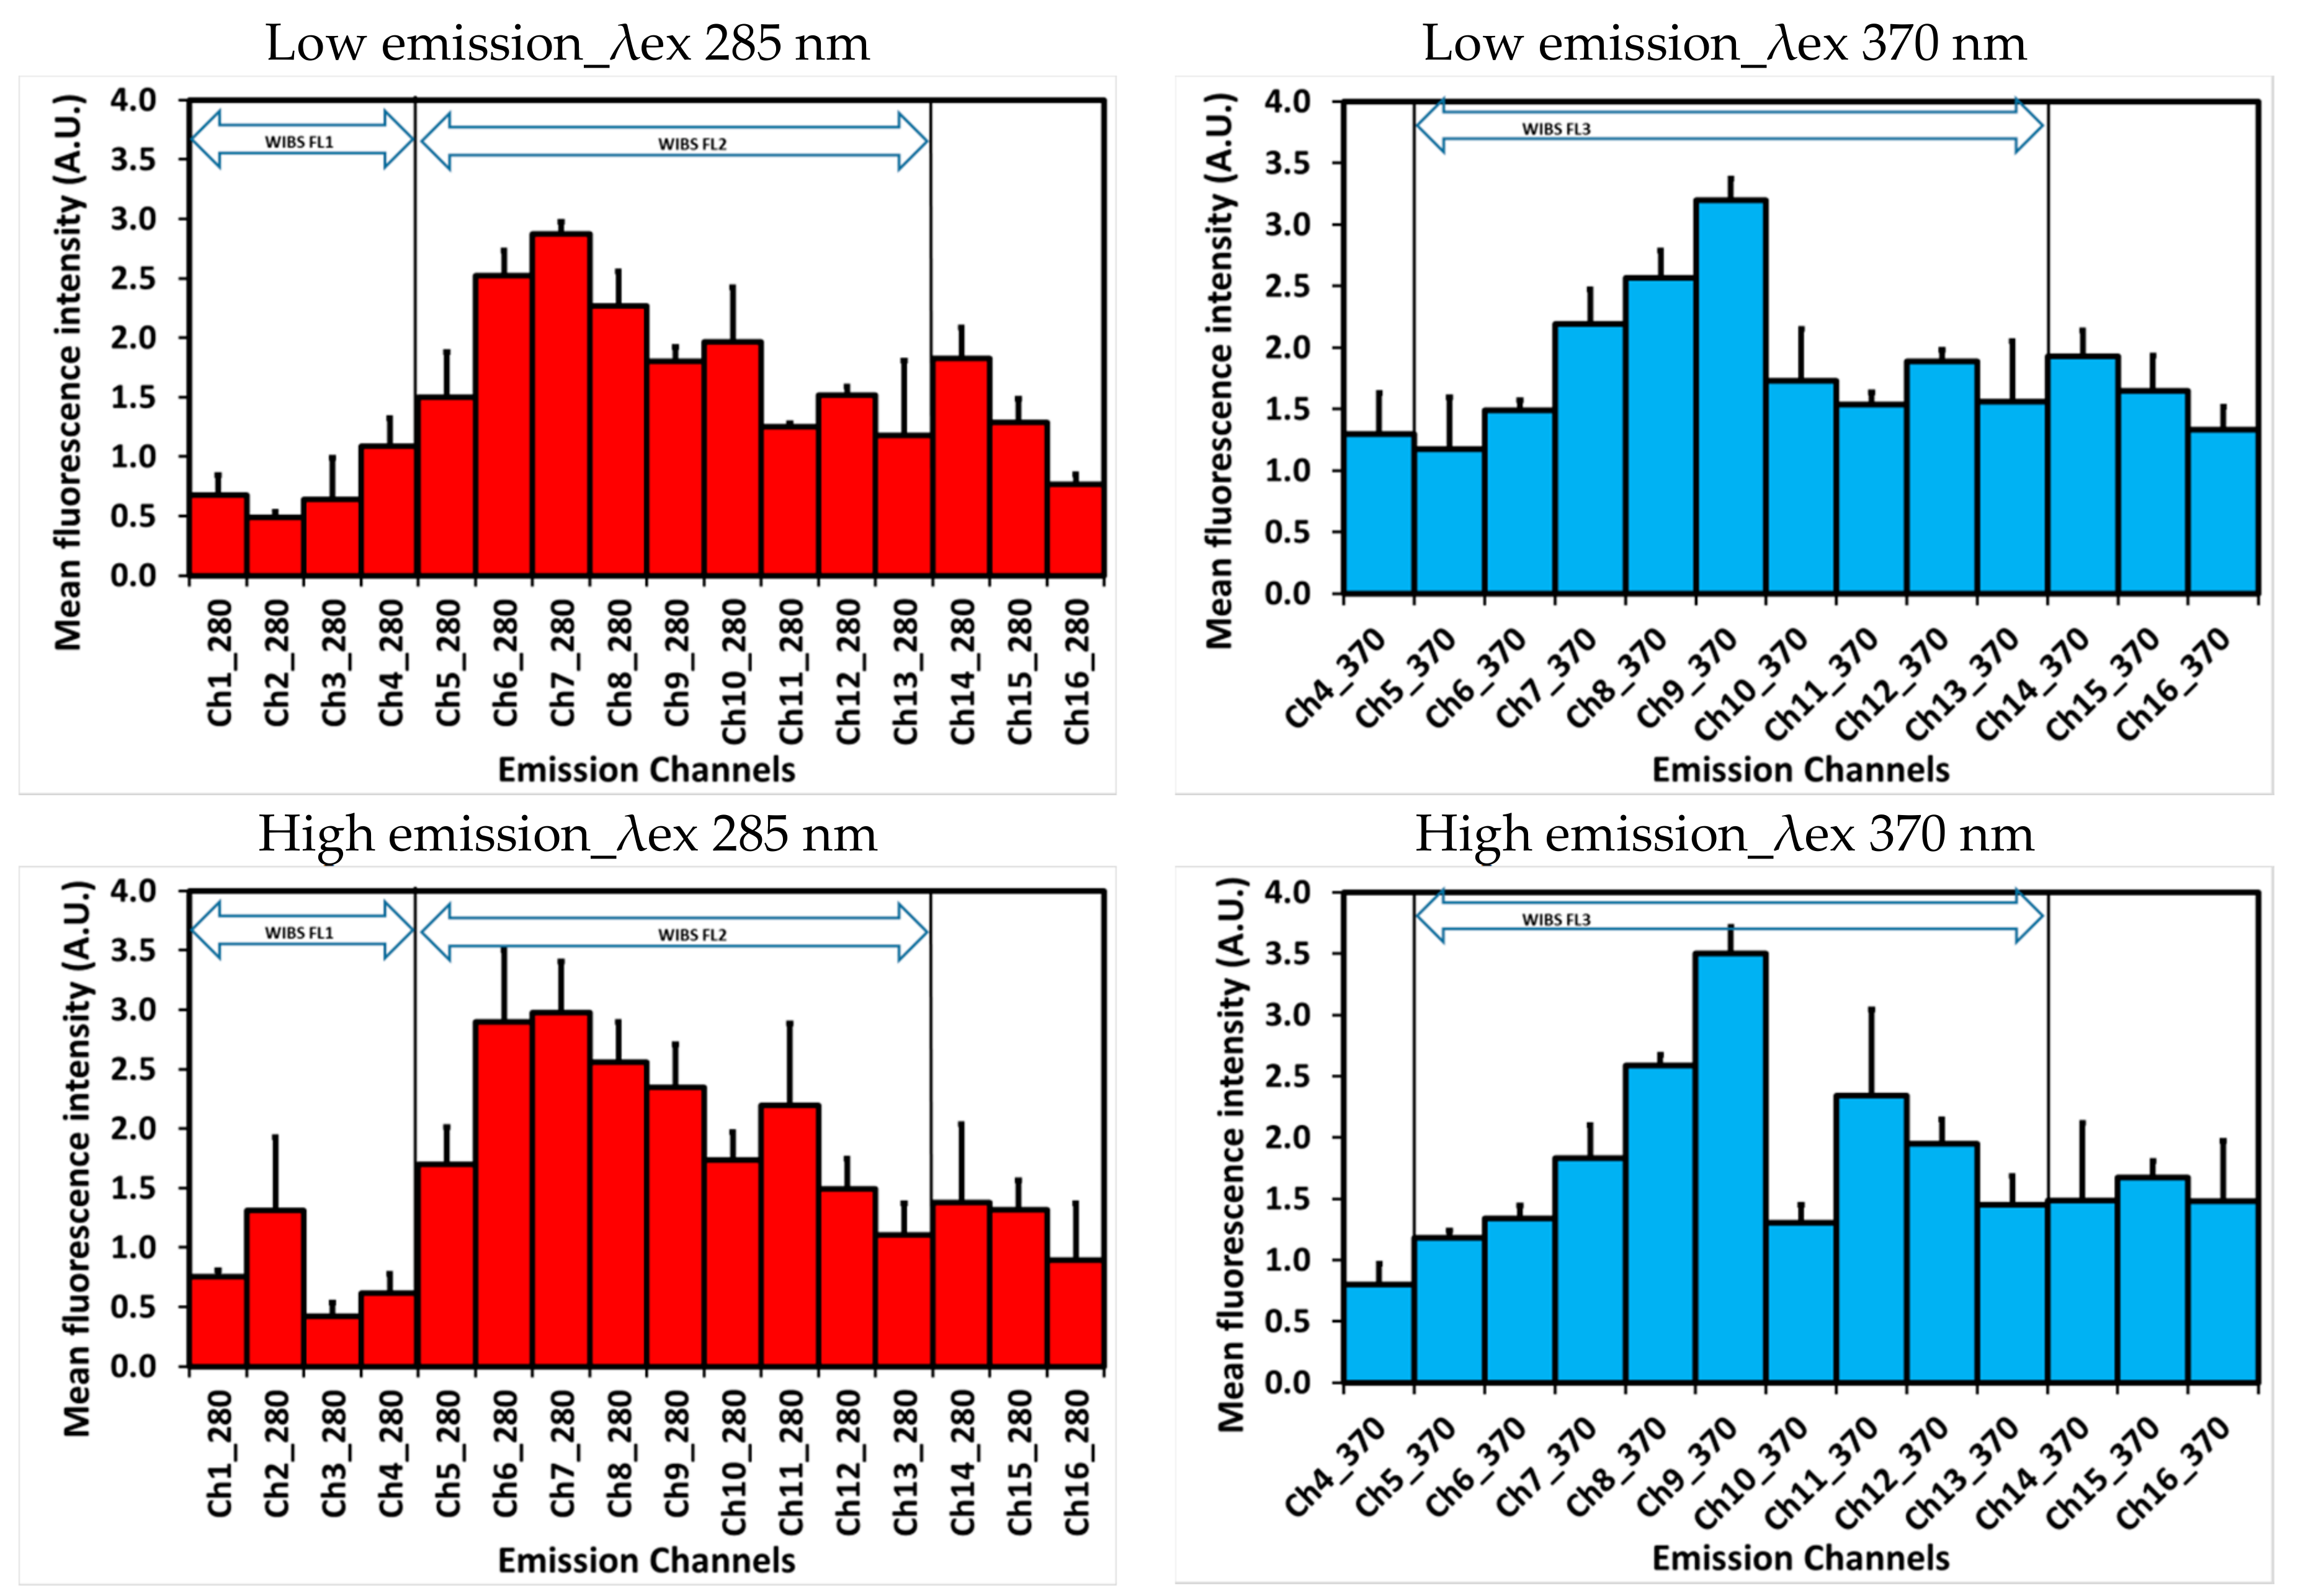
3.1.2. Fluorescence Spectra
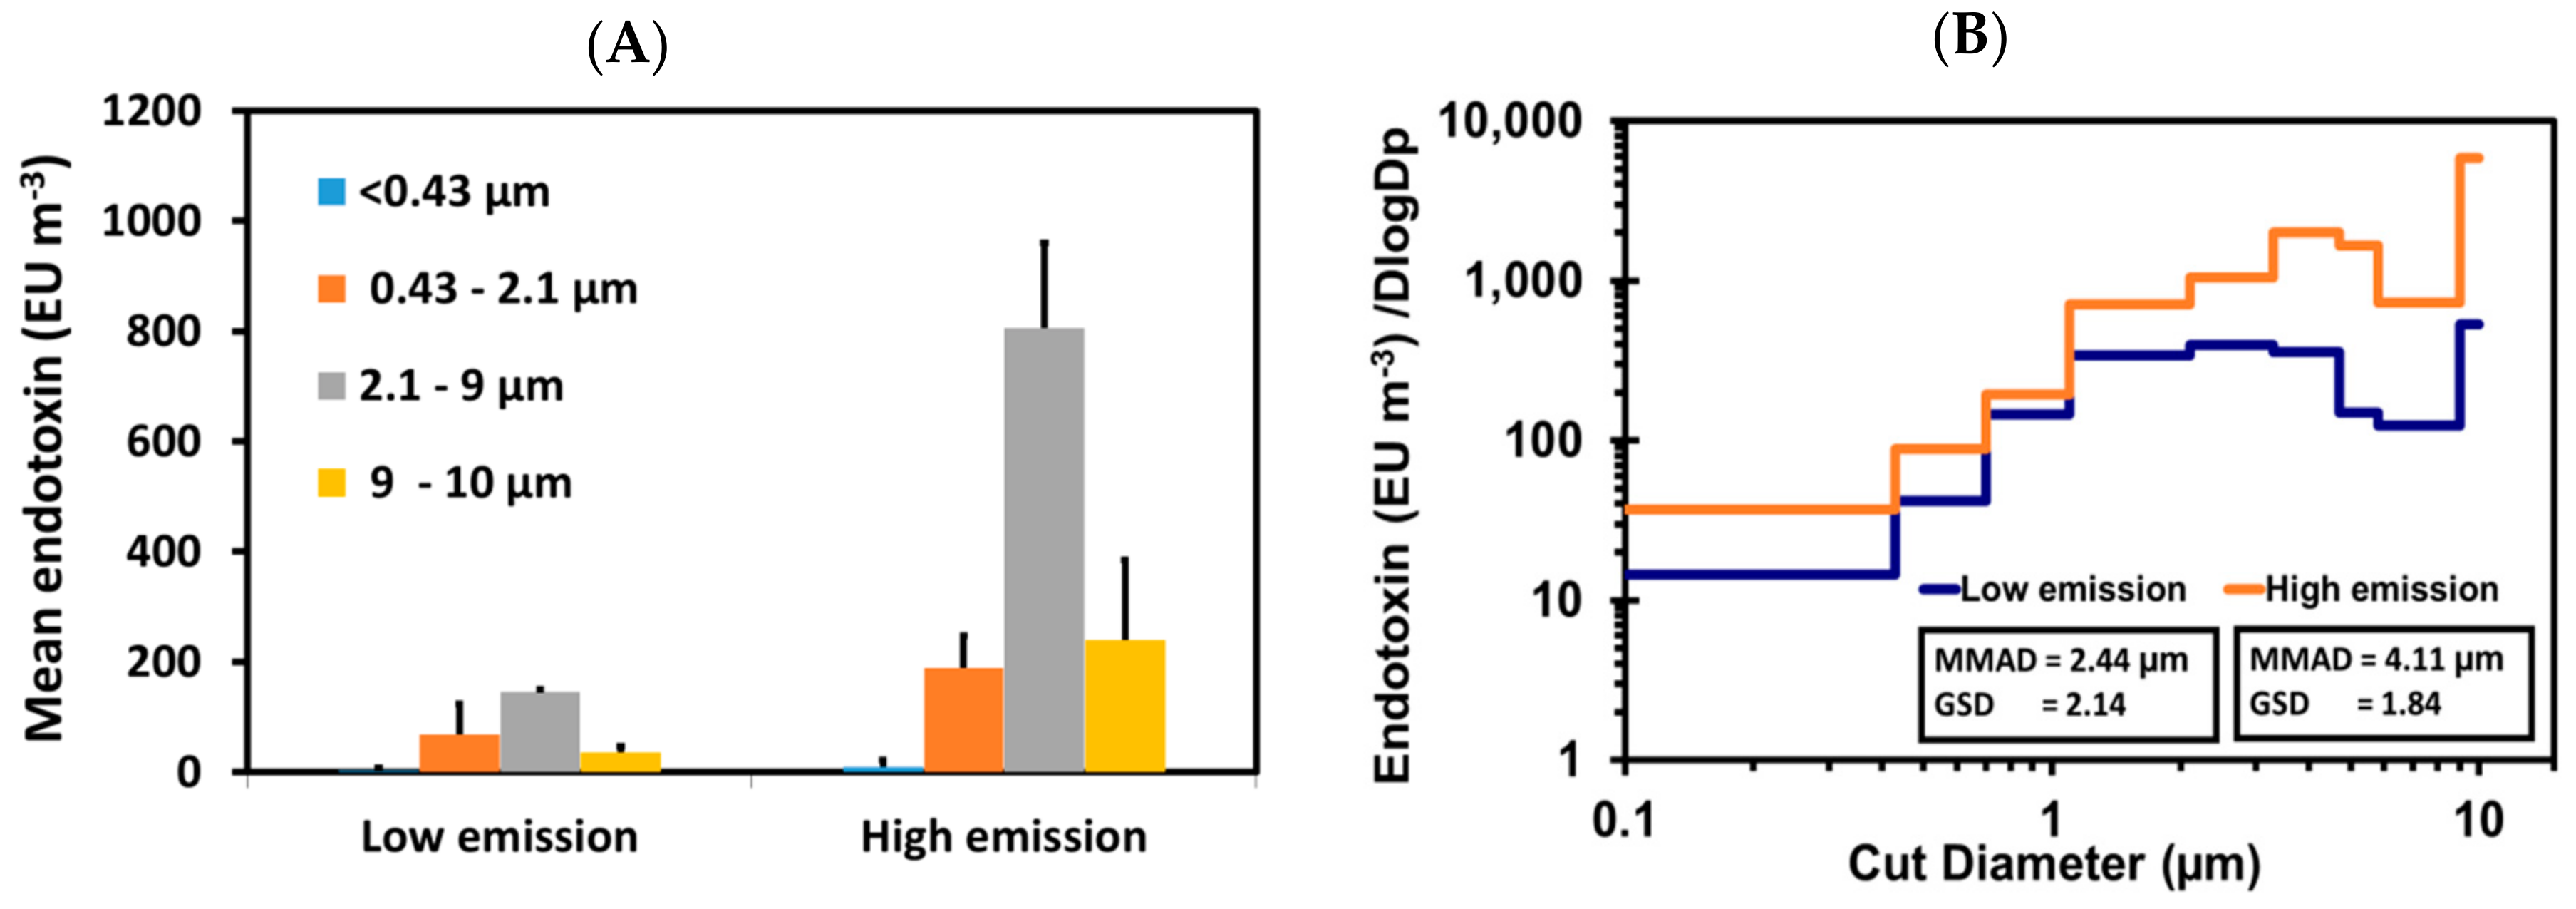
Figure 3 presents fluorescence intensity spectra for two excitation wavelengths under low and high emission scenarios. The samples from low emission scenarios showed four fluorescence modes for excitation wavelength (λex) 285 nm in increasing order of emission wavelengths (λem) 456.7–485.6 nm (Ch 7), 542–569.8 nm (Ch 10), 597.6–625.2 nm (Ch 12) and 652.8–680.2 nm (Ch 14), while, for excitation wavelength (λex) 370 nm, the main mode was at 514–542 nm (Ch 9) along with minor modes at 597.6–625.2 nm (Ch 12) and 652.8–680.2 nm (Ch 14). In contrast, during high emission scenarios the dominant peaks for both λex 285 and 370 nm were comparable to low emission scenarios but slights shifts were observed in secondary modes (Figure 3). For example, during high emission scenarios, there was a distinct shift from 298.2–316.4 nm (Ch 1) to 316.4–344.8 nm (Ch 2), 542–569.8 nm (Ch 10) to 569.9–597.6 nm (Ch 11) for λex 285 nm and 597.6–625.2 nm (Ch 12) to 569.9–597.6 nm (Ch 11) and 652.8–680.3 nm (Ch 14) to 680.3–707.5 nm (Ch 15) for λex 370 nm in comparison to low emission scenarios.
The potential presence of a host of bio-fluorophores in the compost sample and their overlapping λex/λem hinder the exact assignment of fluorescence to a specific bio-fluorophore. Nevertheless, the existing information on excitation and emission spectra of several types of fluorescent molecules [23,24,25,26] can help elucidate the molecular composition of distinct spectral features from biological materials. Different fluorescence peaks during low and high emissions scenarios of aerosolized compost could be assigned to amino acids, structural compounds, coenzymes, pigments and secondary metabolites, for instance amino acids in Ch 1–3; cellulose, chitin, lignin and pyridoxamine in Ch 4, Ch 5 and Ch7; flavins in Ch 9 and Ch10; age-related pigments in Ch 11; and terpenoids in Ch 14 for λex 285. The similar assignment could be informed for different fluorescence peaks for λex 370. Furthermore, improved spectral resolution by SIBS reveals additional information in comparison to the WIBS with the three emission bands FL1 (λex = 280 nm, λem ~310–400 nm), FL2 (λex = 280 nm, λem ~420–650 nm) and FL3 (λex = 370 nm, λem ~420–650 nm) (Figure 3).
These spectra with multiple fluorescence peaks can help to elucidate spectrally integrated signals of biological materials and improve selectivity in LIF based detection systems. For example, improved selectivity in fluorophores assignment to peak emissions in a spectrum can advance discrimination algorithms by using ratios between different fluorescence modes. However, there is a need to improve particle classification certainty and to develop numerical methods to exploit emission spectra data to enhance the selectivity of LIF based detection systems. The particle classification and data analysis methodologies proposed and used for WIBS data [27,28] can be extended to SIBS data but are yet to be tested. With reference to the size of particles in the samples analysed for fluorescence spectra, the majority of particles were in the fine size fraction (Figure 4). A slight increase in mean particle size during high emission (1.31 ±1.23 µm) in comparison to low emission (1.27 ±1.21 µm) was observed. A considerable fraction of fluorescent particles was submicron (below 1 µm) and fluorescence in these particles from compost aerosolisation under controlled conditions raises questions, such as: What is the molecular origin of observed fluorescence in submicron particle size range? This may reflect the fluorescing contribution from cellular fragments or molecular decomposition products of biological material in the compost or instrument artifact. Viruses and protein toxins have been reported to have one or more fluorescing amino acids [29]. Similarly, humic-like substances have also been reported as potential interfering non-biological compounds exhibiting a range of spectral modes [24]. However, the exact origin of fluorescence in submicron particles needs further investigation.

3.2. Endotoxin

Total endotoxin concentrations averaged 253 EU m−3 (±72) and 1245 EU m−3 (±127) under low and high emission scenarios, respectively. Size fractionation showed endotoxin concentrations were highest in the 2.1–9 µm size range for both scenarios (58% and 65% for low and high scenarios) (Figure 5A). However, a considerable amount was also associated with 0.43–2.1 µm (27% and 15% for low and high scenarios). Further analysis of size distribution showed that mass median aerodynamic diameter (MMAD) shifted from 2.44 µm (GSD 2.14) during low emission to 4.11 µm (GSD 1.84) in high emission scenarios (Figure 5B). This shows that the distribution of endotoxin was shifted towards higher size particles during high emission scenarios probably due to an increase in coarse size particles aerosolised.
Endotoxin is a significant component of bioaerosols from composting facilities as it is known to trigger an immune response in humans [30]. Limited work has been undertaken on the size fractionation of endotoxin and to our knowledge none under controlled conditions. Previous studies have shown that endotoxin is associated with the coarse particle fraction [31], to some extent, this is likely due to larger particles being able to retain a larger amount of endotoxin. However, size distribution analysis has shown that a significant concentration of endotoxin is associated with the fine fraction (<2.1 µm) as well which could have implications for how far it may be able to travel in the environment and how deep into the lung it can penetrate.

3.3. Microbial Culture and qPCR

A range of microorganisms were identified in this study at high concentrations in the raw compost and under both low and high emission scenarios (Table 5). High concentrations of microorganisms, including Gram negatives, were detected in the air for both low and high emission runs (1.91 × 10⁵ CFU m−3 and 3.84 × 10⁵ total viable counts and 1.88 × 10⁴ CFU m−3 and 1.79 × 10⁵ Gram negative bacteria, respectively). The most commonly isolated organism (104 CFUm−3) as identified by MALDI-TOF was Staphylococcus sciuri (Table 6). This is a reflection of the raw material where S. sciuri was also the predominant organism (6.0 × 10⁷ CFU g−1). Other organisms detected in the air at significant concentrations include Acinetobacter spp. (102 CFU m−3) and Bacillus spp. (103 CFU m−3) (Table 6). High concentrations of coliforms were detected in raw compost (1.68 × 10⁷ CFU g−1) and air during low (2.27 × 10² CFU m−3) and high (2.59 × 10³ CFU m−3) emission conditions (Table 5). In the air samples, the following coliforms were detected: Enterobacter cloacae, Enterobacter aerogenes and Enterococcus casseliflavus (Table 6). All are clinically significant human pathogens and indicate potential contamination of the compost with faecal material.
All cyclone samples (including those that were pre-treated with NaOH-NALC as per standard decontamination protocols) were overgrown with fungi within 72 h precluding the growth and isolation of NTM. However, NTM were detected in both raw compost and Andersen air samples total concentrations between 9.5 × 10² CFU m−3 and 2.5 × 10⁴ CFU m−3 (mean 1.3 × 10⁴ CFU m−3). Mycobacterium smegmatis, M. hassiacum and M. phlei (maximum concentrations of 8.5 × 10² CFU m3, 1.7 × 10³ CFU m−3, and 2.1 × 10² CFU m−3 respectively) were identified by MALDI-TOF. None are of significant public health concern and not generally considered pathogenic to humans. NTM predominated in the 3.3–4.7 µm fraction of the Andersen sampler with 41% of the total CFU. However, 40% of the total CFU was associated with 3.3–0.65 µm fraction and the count median aerodynamic diameter was 1.67 µm which has the potential to be respirable in the lung. The results demonstrate that significant concentrations of respirable NTM can be aerosolised and this may pose a public health risk should NTM organisms of concern be present. However, the true public health significance of this is unknown and remains to be elucidated.
Legionella was not detected by culture using either cyclone or Andersen sampling probably due to gross contamination of the selective media with other non-Legionella organisms. Legionella species were detected in the cyclone concentrates using qPCR at concentrations between 6.91 × 10² and 1.11 × 10³ GU m−3 (mean 1.26 × 10³ GU m−3) during low emission scenarios and from 6.21 × 10² to 1.17 × 10³ (mean 9.55 × 10²) in high emissions scenarios. The mean concentration of Legionella pneumophila was 1.34 × 10³ and 5.43 × 10² GU m−3 for low and high emissions. While the mean concentration of L. pneumophila serogroup (sg) 1 (the causative agent of >80% of Legionnaires’ disease cases [32] was 1.36 × 10⁴ and 2.4 × 10² GU m−3 for low and high emission scenarios. Importantly, the data show that the majority of the Legionella spp. in the air was Legionella pneumophila and the majority of the L. pneumophila was L. pneumophila sg-1. This is a reflection of the concentrations detected in the raw compost (Table 5). It is unclear why the Legionella recoveries were generally higher in the low emission scenario. It may be partially due to Legionella being more associated with the lower size fractions of the aerosol which were more common in the low emissions scenario. Whilst Legionella has previously been detected in compost samples [33], to our knowledge, this is the first time that aerosolisation of Legionella pneumophila from green waste compost has been demonstrated. Legionella longbeachae, the agent commonly associated with Legionnaires’ disease, from compost/soil was not detected in either the raw compost or the air by culture or qPCR. This is surprising as previous studies have shown a high prevalence of L. longbeachae in compost.
Table 6 lists the representative organisms in aerosolised air samples identified by MALDI-TOF. All organisms were also detected in the raw compost. Staphylococcus sciuri dominated in both the raw material and the air samples. CFU m−3 values are given as approximations only as not every colony was confirmed by MALDI-TOF. During low emission scenarios, one of the samples had the predominance of Bacillus species that was not seen in other samples. Escherichia coli which has potential public health implications and is a marker of faecal contamination was detected in the raw material at a concentration of 3.42 × 10⁴ CFU g−1. However, it was only detected in one air sample suggesting it does not readily survive aerosolisation under these controlled conditions.

4. Conclusions

Aerosolised green waste compost, as test material, was comprehensively analysed using different traditional and enhanced methods for a range of bioaerosols and their components with the aim of advancing bioaerosol hazard characterisation of complex industrial sources. A real time bioaerosol sensor (Spectral Intensity Bioaerosol Sensor) was deployed for the first time in combination with other samplers. The emission spectra were multimodal and a slight shift in emission wavelengths was observed in secondary modes during high emission scenario. It has demonstrated the potential to provide rapid, instantaneous, total and fluorescent particle monitoring which could help to streamline future monitoring regimes. However, improved data analysis techniques as well as laboratory studies with relevant biological fluorophore/materials are required for the elucidation of spectrally integrated signals and thus improving emission characterisation. Real time monitoring of bioaerosol could inform development and validation of proxies for bioaerosol emission such as particulate monitoring with low cost sensors. Size fractionation of endotoxin-associated particles showed that, whilst a dominant proportion of endotoxin was associated with coarse size fractions, 17–27% was found in fine size fraction. Significant concentrations of microorganisms were detected in both raw compost and air samples including coliforms and Legionella species. Aerosolisation of Legionella pneumophila from green waste compost has been demonstrated for the first time. The study provides information on comparisons of physico-chemical and biological characteristics of bioaerosols emissions measured by diverse means and provide baseline training data with respect to various enhanced methods/techniques to characterise bioaerosol emissions from industrial sources. It will therefore inform the design of monitoring approaches to be used under real-world scenarios.
This study has limitations. Only one compost sample was examined as a complex source material and the data cannot be taken as representative of all compost-derived bioaerosols. Future researchers should avoid using our data in an indiscriminate way as source-term data for models of composting emission and dispersion. A discrete but suitable range of microbiological analysis was conducted. There are other organisms of public health significance that could vary with the relevant emission sources. Finally, qPCR does not differentiate between viable and non-viable cells and, in the absence of successful culture evidence, careful interpretation of the Legionella data is therefore required. Next generation sequencing could be used in the future to study the microbial composition at higher resolution.

Author Contributions

Conceptualization, Z.A.N., C.R., T.L.G., E.H., B.W., S.K., S.J., A.B. and S.T.; Data curation, Z.A.N., C.R., S.C. and D.S.; Formal analysis, Z.A.N.; Funding acquisition, T.G., E.H., S.J., A.B. and S.T.; Investigation, Z.A.N., C.R., S.C., S.K. and S.P.; Methodology, Z.A.N., C.R., S.C. and S.P.; Project administration, S.T.; Resources, T.L.G., S.J., A.B. and S.T.; Supervision, S.T.; Visualization, Z.A.N. and C.R.; Writing—original draft, Z.A.N., C.R. and S.C.; and Writing—review and editing, Z.A.N., S.C., T.L.G., E.H., B.W., S.J., A.B., R.P.K., K.W., S.J.T.P., G.D., S.G.A., F.C. and S.T.

Funding

This research was funded by the Natural Environment Research Council (NE/M01163/1, NE/M011747/1, NE/M011763/1, NE/M011658/1 and NE/M010961/10). The APC was funded by (NE/M01163/1).

Acknowledgments

This award is made under the auspices of the Environmental Microbiology and Human Health programme. This work represents the views of the authors, and not necessarily those of the funders and authors’ associated institutions or organisations. The data will be available on 1 July 2020 via the Environmental Information Data Centre, the Natural Environment Research Council’s long-term data repository for terrestrial and freshwater sciences https://catalogue.ceh.ac.uk/eidc/documents.

Conflicts of Interest

The authors declare no conflicts of interest.

References

  1. Douglas, P.; Bakolis, I.; Fecht, D.; Pearson, C.; Sanchez, M.L.; Kinnersley, R.; de Hoogh, K.; Hansell, A.L. Respiratory hospital admission risk near large composting facilities. Int. J. Hyg. Environ. Health 2016, 219, 372–379. [Google Scholar] [CrossRef] [PubMed] [Green Version]
  2. Borlee, F.; Yzermans, C.J.; van Dijk, C.E.; Heederik, D.; Smit, L.A.M. Increased respiratory symptoms in COPD patients living in the vicinity of livestock farms. Eur. Respir. J. 2015, 46, 1605–1614. [Google Scholar] [CrossRef] [PubMed] [Green Version]
  3. Pearson, C.; Littlewood, E.; Douglas, P.; Robertson, S.; Gant, T.W.; Hansell, A.L. Exposures and Health Outcomes in Relation to Bioaerosol Emissions From Composting Facilities: A Systematic Review of Occupational and Community Studies. J. Toxicol. Environ. Health Part B 2015, 18, 43–69. [Google Scholar] [CrossRef] [PubMed] [Green Version]
  4. Douwes, J.; Thorne, P.; Pearce, N.; Heederik, D. Bioaerosol health effects and exposure assessment: Progress and prospects. Ann. Occup. Hyg. 2003, 47, 187–200. [Google Scholar] [PubMed]
  5. Persoons, R.; Parat, S.; Stoklov, M.; Perdrix, A.; Maitre, A. Critical working tasks and determinants of exposure to bioaerosols and MVOC at composting facilities. Int. J. Hyg. Environ. Health 2010, 213, 338–347. [Google Scholar] [CrossRef] [PubMed]
  6. Fathi, S.; Hajizadeh, Y.; Nikaeen, M.; Gorbani, M. Assessment of microbial aerosol emissions in an urban wastewater treatment plant operated with activated sludge process. Aerobiologia 2017, 33, 507–515. [Google Scholar] [CrossRef]
  7. Jaremków, A.; Szałata, Ł.; Kołwzan, B.; Sówka, I.; Zwoździak, J.; Pawlas, K. Impact of a Sewage Treatment Plant on Health of Local Residents: Gastrointestinal System Symptoms. Pol. J. Environ. Stud. 2017, 26, 127–136. [Google Scholar] [CrossRef] [Green Version]
  8. Uhrbrand, K.; Schultz, A.C.; Madsen, A.M. Exposure to airborne noroviruses and other bioaerosol components at a wastewater treatment plant in Denmark. Food Environ. Virol. 2011, 3, 130–137. [Google Scholar] [CrossRef]
  9. Douglas, P.; Robertson, S.; Gay, R.; Hansell, A.L.; Gant, T.W. A systematic review of the public health risks of bioaerosols from intensive farming. Int. J. Hyg. Environ. Health 2018, 221, 134–173. [Google Scholar] [CrossRef] [PubMed] [Green Version]
  10. Hu, Y.; Cheng, H.; Tao, S. Environmental and human health challenges of industrial livestock and poultry farming in China and their mitigation. Environ. Int. 2017, 107, 111–130. [Google Scholar] [CrossRef] [PubMed]
  11. Garcia-Alcega, S.; Nasir, Z.A.; Ferguson, R.; Whitby, C.; Dumbrell, A.J.; Colbeck, I.; Gomes, D.; Tyrrel, S.; Coulon, F. Fingerprinting outdoor air environment using microbial volatile organic compounds (MVOCs)–A review. TrAC Trends Anal. Chem. 2017, 86, 75–83. [Google Scholar] [CrossRef]
  12. Yoo, K.; Lee, T.K.; Choi, E.J.; Yang, J.; Shukla, S.K.; Hwang, S.; Park, J. Molecular approaches for the detection and monitoring of microbial communities in bioaerosols: A review. J. Environ. Sci. 2017, 51, 234–247. [Google Scholar] [CrossRef] [PubMed]
  13. O’Connor, D.J.; Daly, S.M.; Sodeau, J.R. On-line monitoring of airborne bioaerosols released from a composting/green waste site. Waste Manag. 2015, 42, 23–30. [Google Scholar] [CrossRef] [PubMed]
  14. Stagg, S.; Bowry, A.; Kelsey, A.; Crook, B. Bioaerosol Emissions from Waste Composting and the Potential for Workers’ Exposure. Health and Safety Laboratory; Research Report RR786; Health Safety Executive: Buxton, UK, 2010. [Google Scholar]
  15. Breum, N.O.; Nielsen, B.H.; Nielsen, E.M.; Midtgaard, U.; Poulsen, O.M. Dustiness of compostable waste: A methodological approach to quantify the potential of waste to generate airborne micro-organisms and endotoxin. Waste Manag. Res. 1997, 15, 169–187. [Google Scholar] [CrossRef]
  16. Heldal, K.K.; Breum, N.O.; Nielsen, B.H.; Wilkins, K. Experimental generation of organic dust from compostable household waste. Waste Manag. Res. 2001, 19, 98–107. [Google Scholar] [CrossRef] [PubMed]
  17. Upton, S.L.; Mark, D.; Douglass, E.J.; Hall, D.J.; Griffiths, W.D. A wind tunnel evaluation of the physical sampling efficiencies of three bioaerosol samplers. J. Aerosol Sci. 1994, 25, 1493–1501. [Google Scholar] [CrossRef]
  18. Andersen, A.A. New sampler for the collection, sizing, and enumeration of viable airborne particles. J. Bacteriol. 1958, 76, 471–484. [Google Scholar] [PubMed]
  19. Anonymus. Water Quality-Detection and Enumeration of Legionella; ISO 11731; International Organisation for Standardisation: Geneva, Switzerland, 1998. [Google Scholar]
  20. Bruker Daltonics. Inactivated Mycobacteria Bead Preparation Method (in Mbpm); Bruker Daltonics: Billerica, MA, USA, 2012. [Google Scholar]
  21. Currie, S.L.; Beattie, T.K.; Knapp, C.W.; Lindsay, D.S.J. Legionella spp. in UK composts—A potential public health issue? Clin. Microbiol. Infect. 2014, 20, O224–O229. [Google Scholar] [CrossRef] [PubMed]
  22. Collins, S.; Jorgensen, F.; Willis, C.; Walker, J. Real-time PCR to supplement gold-standard culture-based detection of Legionella in environmental samples. J. Appl. Microbiol. 2015, 119, 1158–1169. [Google Scholar] [CrossRef] [PubMed]
  23. Hernandez, M.; Perring, A.E.; McCabe, K.; Kok, G.; Granger, G.; Baumgardner, D. Chamber catalogues of optical and fluorescent signatures distinguish bioaerosol classes. Atmos. Meas. Tech. 2016, 9, 3283–3292. [Google Scholar] [CrossRef] [Green Version]
  24. Pöhlker, C.; Huffman, J.A.; Pöschl, U. Autofluorescence of atmospheric bioaerosols–fluorescent biomolecules and potential interferences. Atmos. Meas. Tech. 2012, 5, 37–71. [Google Scholar] [CrossRef] [Green Version]
  25. Pan, Y.-L.; Hill, S.C.; Pinnick, R.G.; Huang, H.; Bottiger, J.R.; Chang, R.K. Fluorescence spectra of atmospheric aerosol particles measured using one or two excitation wavelengths: Comparison of classification schemes employing different emission and scattering results. Opt. Express 2010, 18, 12436–12457. [Google Scholar] [CrossRef] [PubMed]
  26. Hill, S.C.; Mayo, M.W.; Chang, R.K. Fluorescence of Bacteria, Pollens, and Naturally Occurring Airborne Particles: Excitation/Emission Spectra; Army Research Laboratory Computational and Information Sciences Directorate: Adelphi, MD, USA, 2009. [Google Scholar]
  27. Savage, N.J.; Krentz, C.E.; Könemann, T.; Han, T.T.; Mainelis, G.; Pöhlker, C.; Huffman, J.A. Systematic characterization and fluorescence threshold strategies for the wideband integrated bioaerosol sensor (WIBS) using size-resolved biological and interfering particles. Atmos. Meas. Tech. 2017, 10, 4279–4302. [Google Scholar] [CrossRef] [Green Version]
  28. Savage, N.; Huffman, J.A. Evaluation of a Hierarchical Agglomerative Clustering Method Applied to WIBS Laboratory Data for Improved Discrimination of Biological Particles by Comparing Data Preparation Techniques. Atmos. Meas. Tech. 2018, 11, 4929–4942. [Google Scholar] [CrossRef]
  29. Pan, Y.-L. Detection and characterization of biological and other organic-carbon aerosol particles in atmosphere using fluorescence. J. Quant. Spectrosc. Radiat. Transf. 2015, 150, 12–35. [Google Scholar] [CrossRef]
  30. Liebers, V.; Brüning, T.; Raulf-Heimsoth, M. Occupational endotoxin-exposure and possible health effects on humans. Am. J. Ind. Med. 2006, 49, 474–491. [Google Scholar] [CrossRef] [PubMed]
  31. Traversi, D.; Alessandria, L.; Schiliro, T.; Gilli, G. Size-fractionated PM10 monitoring in relation to the contribution of endotoxins in different polluted areas. Atmos. Environ. 2011, 45, 3515–3521. [Google Scholar] [CrossRef]
  32. Bartram, J.; Chartier, Y.; Lee, J.V.; Pond, K.; Surman-Lee, S. Legionella and the Prevention of Legionellosis; World Health Organization: Geneva, Switzerland, 2007. [Google Scholar]
  33. Casati, S.; Conza, L.; Bruin, J.; Gaia, V. Compost facilities as a reservoir of Legionella pneumophila and other Legionella species. Clin. Microbiol. Infect. 2010, 16, 945–947. [Google Scholar] [CrossRef] [PubMed]
Figure 1. Schematic of test chamber and experimental design.
Atmosphere 09 00379 g001
Figure 2. Schematic of aerosol generator.
Atmosphere 09 00379 g002
Figure 3. Representative fluorescence intensity across different emission channels for two excitation wavelengths during low and high emission scenarios. Bars = standard deviation.
Atmosphere 09 00379 g003
Figure 4. Size distribution of fluorescent particles in the samples analysed for fluorescence spectra under low and high emission scenarios.
Atmosphere 09 00379 g004
Figure 5. (A) Size fractionated endotoxin concentration under different emission scenarios (n = 3 measurements each; Bars = Standard deviation); and (B) size distribution of endotoxin during low and high emission (n = 1 measurement each).
Atmosphere 09 00379 g005
Table 1. Instrumentation used in the chamber.
EquipmentAnalyteSample Duration (min)Flow Rate (L/min)
Spectral Intensity Bioaerosol SensorTotal and fluorescent particles300.3
8 Stage non-viable Andersen SamplerEndotoxin3028.3
6 stage viable Andersen samplerNon-Tuberculous Mycobacteria (NTM)
Legionella
20 s28.3
Aerojet glass cycloneTotal Viable Counts5.5600
Gram negative bacteria
Coliforms
Legionella spp
Non-Tuberculous Mycobacteria (NTM)
Table 2. Fluorescence measurement channels (Ch) and wavelength ranges.
ChannelLower Wavelength (nm)Upper Wavelength (nm)
1298.2316.4
2316.4344.8
3344.9362.5
4377.5401.5
5401.5429.7
6430.2457.5
7456.7485.6
8486.0514.0
9514.1542.0
10542.0569.8
11569.9597.6
12597.6625.2
13625.3652.8
14652.8680.2
15680.3707.5
16707.5734.7
Table 3. Sample size of different samples for fluorescence intensity data from the aerosolisation experiments.
Emission ScenariosSampling 1Sampling 2Sampling 3
Number of Excited ParticlesNumber of Excited ParticlesNumber of Excited Particles
Low emission28,00426,78225,297
High emission22,09630,37431,633
Table 4. Summary of particle concentrations measured by the SIBS (n, number of measurements; NT, Number of total Particles; NF, Number of fluorescent particles; SD, Standard deviation).
Low Emission (n = 3)High Emission (n = 3)
MeanSDMeanSD
NT (cm−3)511512925
NF (cm−3)113338
NF/NT0.220.010.260.02
Table 5. Summary of microbiological findings.
Raw CompostLow Emission
(n = 3)
High Emission
(n = 3)
Mean
(g−1)
Mean
(m−3)
SDMean
(m−3)
SD
Total viable count (CFU)9.66 × 1081.91 × 1055.10 × 1043.84 × 1052.11 × 105
Gram negative bacteria (CFU)6.00 × 1071.88 × 1043.06 × 1041.79 × 1052.42 × 105
Coliforms (CFU)1.68 × 1072.27 × 1021.52 × 1022.59 × 1031.93 × 103
Legionella spp. (GU)3.28 × 1041.26 × 1036.50 × 1029.55 × 1022.92 × 102
L. pneumophila (GU)2.93 × 1041.34 × 1037.76 × 1025.43 × 1021.66 × 102
L. pneumophila sg-1 (GU)1.46 × 1041.36 × 1031.00 × 1032.44 × 1024.36 × 101
Table 6. Predominant organisms detected by MALDI-TOF in air samples during low and high emission scenarios (approximate concentration CFU m−3).
High EmissionLow Emission
Microbial sp.CFU m−3Microbial sp.CFU m−3
Staphylococcus sciuri104Staphylococcus sciuri104
Serratia rubidaea103Bacillus firmus103
Sphingobacterium mizutaii103Bacillus pumilus103
Bordetella petrii103Bacillis clausii103
Nocardia paucivorans102Bacillus niacin103
Escherichia coli102Enterobacter cloacae102
Acinetobacter spp. 102Nocardia paucivorans102
Enterobacter cloacae102Bordetella petrii102
Staphylococcus hominis102Sphingobacterium mizutaii102
Paenicacillus residui102Brevundimonas diminuta102
Enterobacter casseliflavus102Ochrobactrum intermedium102
Enterobacter aerogenes102
Pseudomonas putida102

