Article

Evaluation of Temperature and Humidity Profiles of Unified Model and ECMWF Analyses Using GRUAN Radiosonde Observations

1
School of Earth and Environmental Sciences, Seoul National University, Seoul 08826, Korea
2
Numiercal Modeling Bureau, National Insititute of Meteorological Sciences, Seoul 07062, Korea
3
Satellite Application, Met Office, Exeter EX1 3PB, UK
*
Author to whom correspondence should be addressed.
Atmosphere 2016, 7(7), 94; https://doi.org/10.3390/atmos7070094
Submission received: 30 March 2016 / Revised: 12 July 2016 / Accepted: 14 July 2016 / Published: 18 July 2016

Abstract

:
Temperature and water vapor profiles from the Korea Meteorological Administration (KMA) and the United Kingdom Met Office (UKMO) Unified Model (UM) data assimilation systems and from reanalysis fields from the European Centre for Medium-Range Weather Forecasts (ECMWF) were assessed using collocated radiosonde observations from the Global Climate Observing System (GCOS) Reference Upper-Air Network (GRUAN) for January–December 2012. The motivation was to examine the overall performance of data assimilation outputs. The difference statistics of the collocated model outputs versus the radiosonde observations indicated a good agreement for the temperature, amongst datasets, while less agreement was found for the relative humidity. A comparison of the UM outputs from the UKMO and KMA revealed that they are similar to each other. The introduction of the new version of UM into the KMA in May 2012 resulted in an improved analysis performance, particularly for the moisture field. On the other hand, ECMWF reanalysis data showed slightly reduced performance for relative humidity compared with the UM, with a significant humid bias in the upper troposphere. ECMWF reanalysis temperature fields showed nearly the same performance as the two UM analyses. The root mean square differences (RMSDs) of the relative humidity for the three models were larger for more humid conditions, suggesting that humidity forecasts are less reliable under these conditions.

1. Introduction

Numerical weather prediction (NWP) models are extensively used for predicting the future state of the atmosphere, given initial conditions determined from observations. A range of atmospheric phenomena, such as flooding events and tropical cyclones which result in large impacts on society, are possible to predict [1]. Particularly, in recent years, the improved weather forecasting skills of NWP models have been partly due to a realistic representation of the atmosphere at the initial state of forecasting. In fact, accurate initial conditions are one of the most important factors for prediction improvement, since the time integration in NWP models fundamentally is an initial-value problem [2,3,4]. Hence, many operational weather forecasting centers, such as the United Kingdom Met Office (UKMO), have focused on improving the initial atmospheric state using improved data assimilation schemes and better/more observations of various atmospheric parameters [5,6,7,8,9].
Although the analysis outputs are now routinely used for weather forecasting and diagnostic studies, they require validation by in situ measurements, such as radiosonde data, as doing so will lead to a better understanding of the analysis performance and associated error characteristics. Such efforts are particularly important when new NWP models are introduced or when model systems including physical schemes and/or data assimilation systems are upgraded.
For the validation of the analysis/forecast performance, reference data are required. Radiosonde observations are often used for validating the vertical structure of atmospheric variables. In the past, the use of radiosonde data for validation has been hampered because of sensor uncertainties and poor documentation regarding the instrument changes, since measurement errors are significantly affected by the sensor design, calibration, and data processing. In addition, the uncertainty of humidity observations was especially large for the upper troposphere in dry and cold conditions [10,11]. However, as more accurate radiosonde sensors become available, such as in the Global Climate Observing System (GCOS) Reference Upper-Air Network (GRUAN) [12], the atmospheric profiles of model analysis can be assessed more confidently.
As radiosondes are one of the most important observations in data assimilation systems, some radiosonde measurements from GRUAN stations (prior to final GRUAN processing) are already used in assimilation at operational forecast centers, which implies that the analysis is not fully independent of the GRUAN data. However, considering that the radiosonde measurements are differently assimilated at each forecast center, their impact on the analysis may be different from model to model, although the same raw data are given. Furthermore, the analysis is produced by assimilating various other observations besides radiosonde data. Consequently, the main aim of this study is to examine the overall accuracy of the analysis produced through the data assimilation against GRUAN-measured temperature and humidity profiles as references.
In May 2010, the Korea Meteorological Administration (KMA) introduced the Unified Model (UM) and associated data assimilation systems developed by the UKMO [13]. However, to our knowledge, since the KMA UM has been operationally used, no validation regarding its accuracy was published. Thus, it is informative to assess the accuracy of KMA UM analysis compared with UKMO UM analysis, since the UKMO and KMA use the same NWP system but different versions of the model/assimilation system. Furthermore, the European Centre for Medium-Range Weather Forecasts (ECMWF) reanalysis data, which have been commonly used as “proxy” true values in weather forecasting and climate science, are also validated using the same GRUAN dataset.

2. Data Used and Processing

2.1. Construction of Collocated Data

Two UM analysis datasets (from the KMA and UKMO), ECMWF ERA-Interim reanalysis data (ERA-I), and GRUAN radiosonde observations from January–December 2012 are compared. The detailed data information and comparison procedures are given below.
The comparison data were produced by the data assimilation system of the UM-based global model (UM model). Model outputs were obtained from the KMA and UKMO (UM-KMA and UM-UKMO data, respectively). The spatial resolution of both UM models is N512L70 with 1024 × 769 × 70 grid points, approximately equivalent to 25 km grid spacing at mid-latitudes and 70 vertical levels from the surface to 80 km. The model used for data assimilation has a coarser spatial resolution of N216L70 (about 60 km) [14]. The UM-KMA and UM-UKMO used the same assimilation system during the validation period, i.e., a four-dimensional variational assimilation (4D-Var) scheme with 6 h update cycles within the assimilation time window from ‒3 to +3 h centered at the nominal T + 0 analysis time (i.e., 12 a.m., 6 a.m., 12 p.m. and 6 p.m. UTC) [7,8]. In this study, the T + 0 analysis data are considered as initial conditions and compared with the reference radiosonde data.
The temperature and relative humidity ERA-I data used in this study use a horizontal grid of 0.25° × 0.25° (about 18 km × 25 km at 45° mid-latitude) for 37 standard pressure levels between 1000 and 1 hPa, and are given four times a day (i.e., 12 a.m., 6 a.m., 12 p.m. and 6 p.m. UTC) [15]. It should be noted that ERA-I data are based on the use of the August 2006 operational NWP system at ECMWF, which is older than the two UM systems (around 2012). Since the radiosonde standard observation times are 12 a.m. and 12 p.m. UTC, the reanalysis data for the same UTC hours are used for collocation.
As a reference, we use radiosonde data from the GRUAN archives. The GRUAN project was designed to provide high-quality upper atmosphere observations to validate various remote sensing products using the Vaisala RS92 sensors [12,16,17]. Although products from other GRUAN radiosondes are under development, we only use GRUAN Vaisala RS92 data in this study. The GRUAN applies its own processing scheme (version 2) for the data processing, rather than applying the scheme normally used for the real-time processing such as the Vaisala processing. In addition to the data processing at the operational centers whose qualities are not greatly discernible from the those of GRUAN [12], the GRUAN processing carefully derives uncertainties of observations; uncertainties of RS92 radiosonde observations made by the GRUAN are 0.6 K (0.15 K) for daytime (nighttime) temperature measurements at 25 km and maximum of about 3%–5% for relative humidity [12]. The geographical locations of the used GRUAN sites are given in Table 1. Observations made at some GRUAN stations (here LIN, NAU, PAY, SOD, and TAT stations of Table 1) directly go to weather centers through the Global Telecommunication System GTS for the real-time data processing for the weather forecasts.
The UM and radiosonde data are mapped for the same 37 pressure levels of the ERA-I data and co-locations are made by selecting the grid point values of the NWP outputs closest to the GRUAN observation sites. Since both the UM model and ERA-I outputs have about 25 km spacing at the equator, typically the maximum distance between the radiosonde site and the co-located model data is 12.5 km, resulting in standard deviation increases of a maximum amplitude of 0.05 K for temperature and 0.4% for relative humidity [18]. This representativeness uncertainty and the influence of the ERA-I coarser model grid (0.75°) need to be considered along with measurement uncertainty when comparing observed and model values.
Although the GRUAN data are well calibrated and carefully maintained, technical and/or artificial errors may be present. To remove possible erroneous data, we applied a simple quality control scheme to exclude extreme outliers from the statistical mean. If the temperature or moisture for a given level is above or below ±3 σ from the January–December 2012 mean, that level of data would be removed from each profile. Thus, the total number of samples used for the statistical analysis varies with the level. However, there is little variation, except near the surface and above 250 hPa (Figure 1a). Slightly decreasing sample numbers are noted for 250–50 hPa, while a rapid decrease is found above 50 hPa. The smaller number of samples near the surface is mainly due to the varying altitudes of the observation sites.
Vertical mean profiles of temperature and relative humidity obtained from GRUAN radiosonde observations and associated uncertainties for the January–December 2012 period are given in Figure 1b. Also given in Figure 1b are uncertainties of temperature and moisture profiles. The level of temperature uncertainty gradually increases with height and approaches 0.2 K at around the 50 hPa level and 0.3 K at around the 10 hPa level. At the same time, the mean relative humidity approaches zero above the 100 hPa level. Because of these points, the statistical comparison is made for all available data between the surface and 100 hPa.

2.2. Conversion of the Relative Humidity

The Vaisala RS92 sensor uses a thin-film capacitor as a relative humidity sensor, in which the measured capacitance is a function of the ambient water vapor concentration [19,20]. The relative humidity varies with how saturation vapor pressure is defined. Here and in the GRUAN, the saturation vapor pressure is defined against water even for the condition where ice particles coexist above the freezing level.
The GRUAN algorithm calculates the saturation vapor pressure in relation to the liquid water using the equation of Hyland and Wexler [21]. To compare the relative humidity, we take temperature and the mixing ratio profiles from the analysis data produced by three centers and calculate the relative humidity against water using the same Hyland and Wexler [21] equation, consistent with GRUAN data processing.

3. Results

We first compare the mean statistics of the UM and ERA-I data with the GRUAN radiosonde data, and then compare variations in the NWP model outputs classified by atmospheric moistness. The biases of the NWP model outputs in relation to the radiosonde measurements and their associated root mean square differences (RMSDs) are calculated for each pressure level.

3.1. Mean Statistics

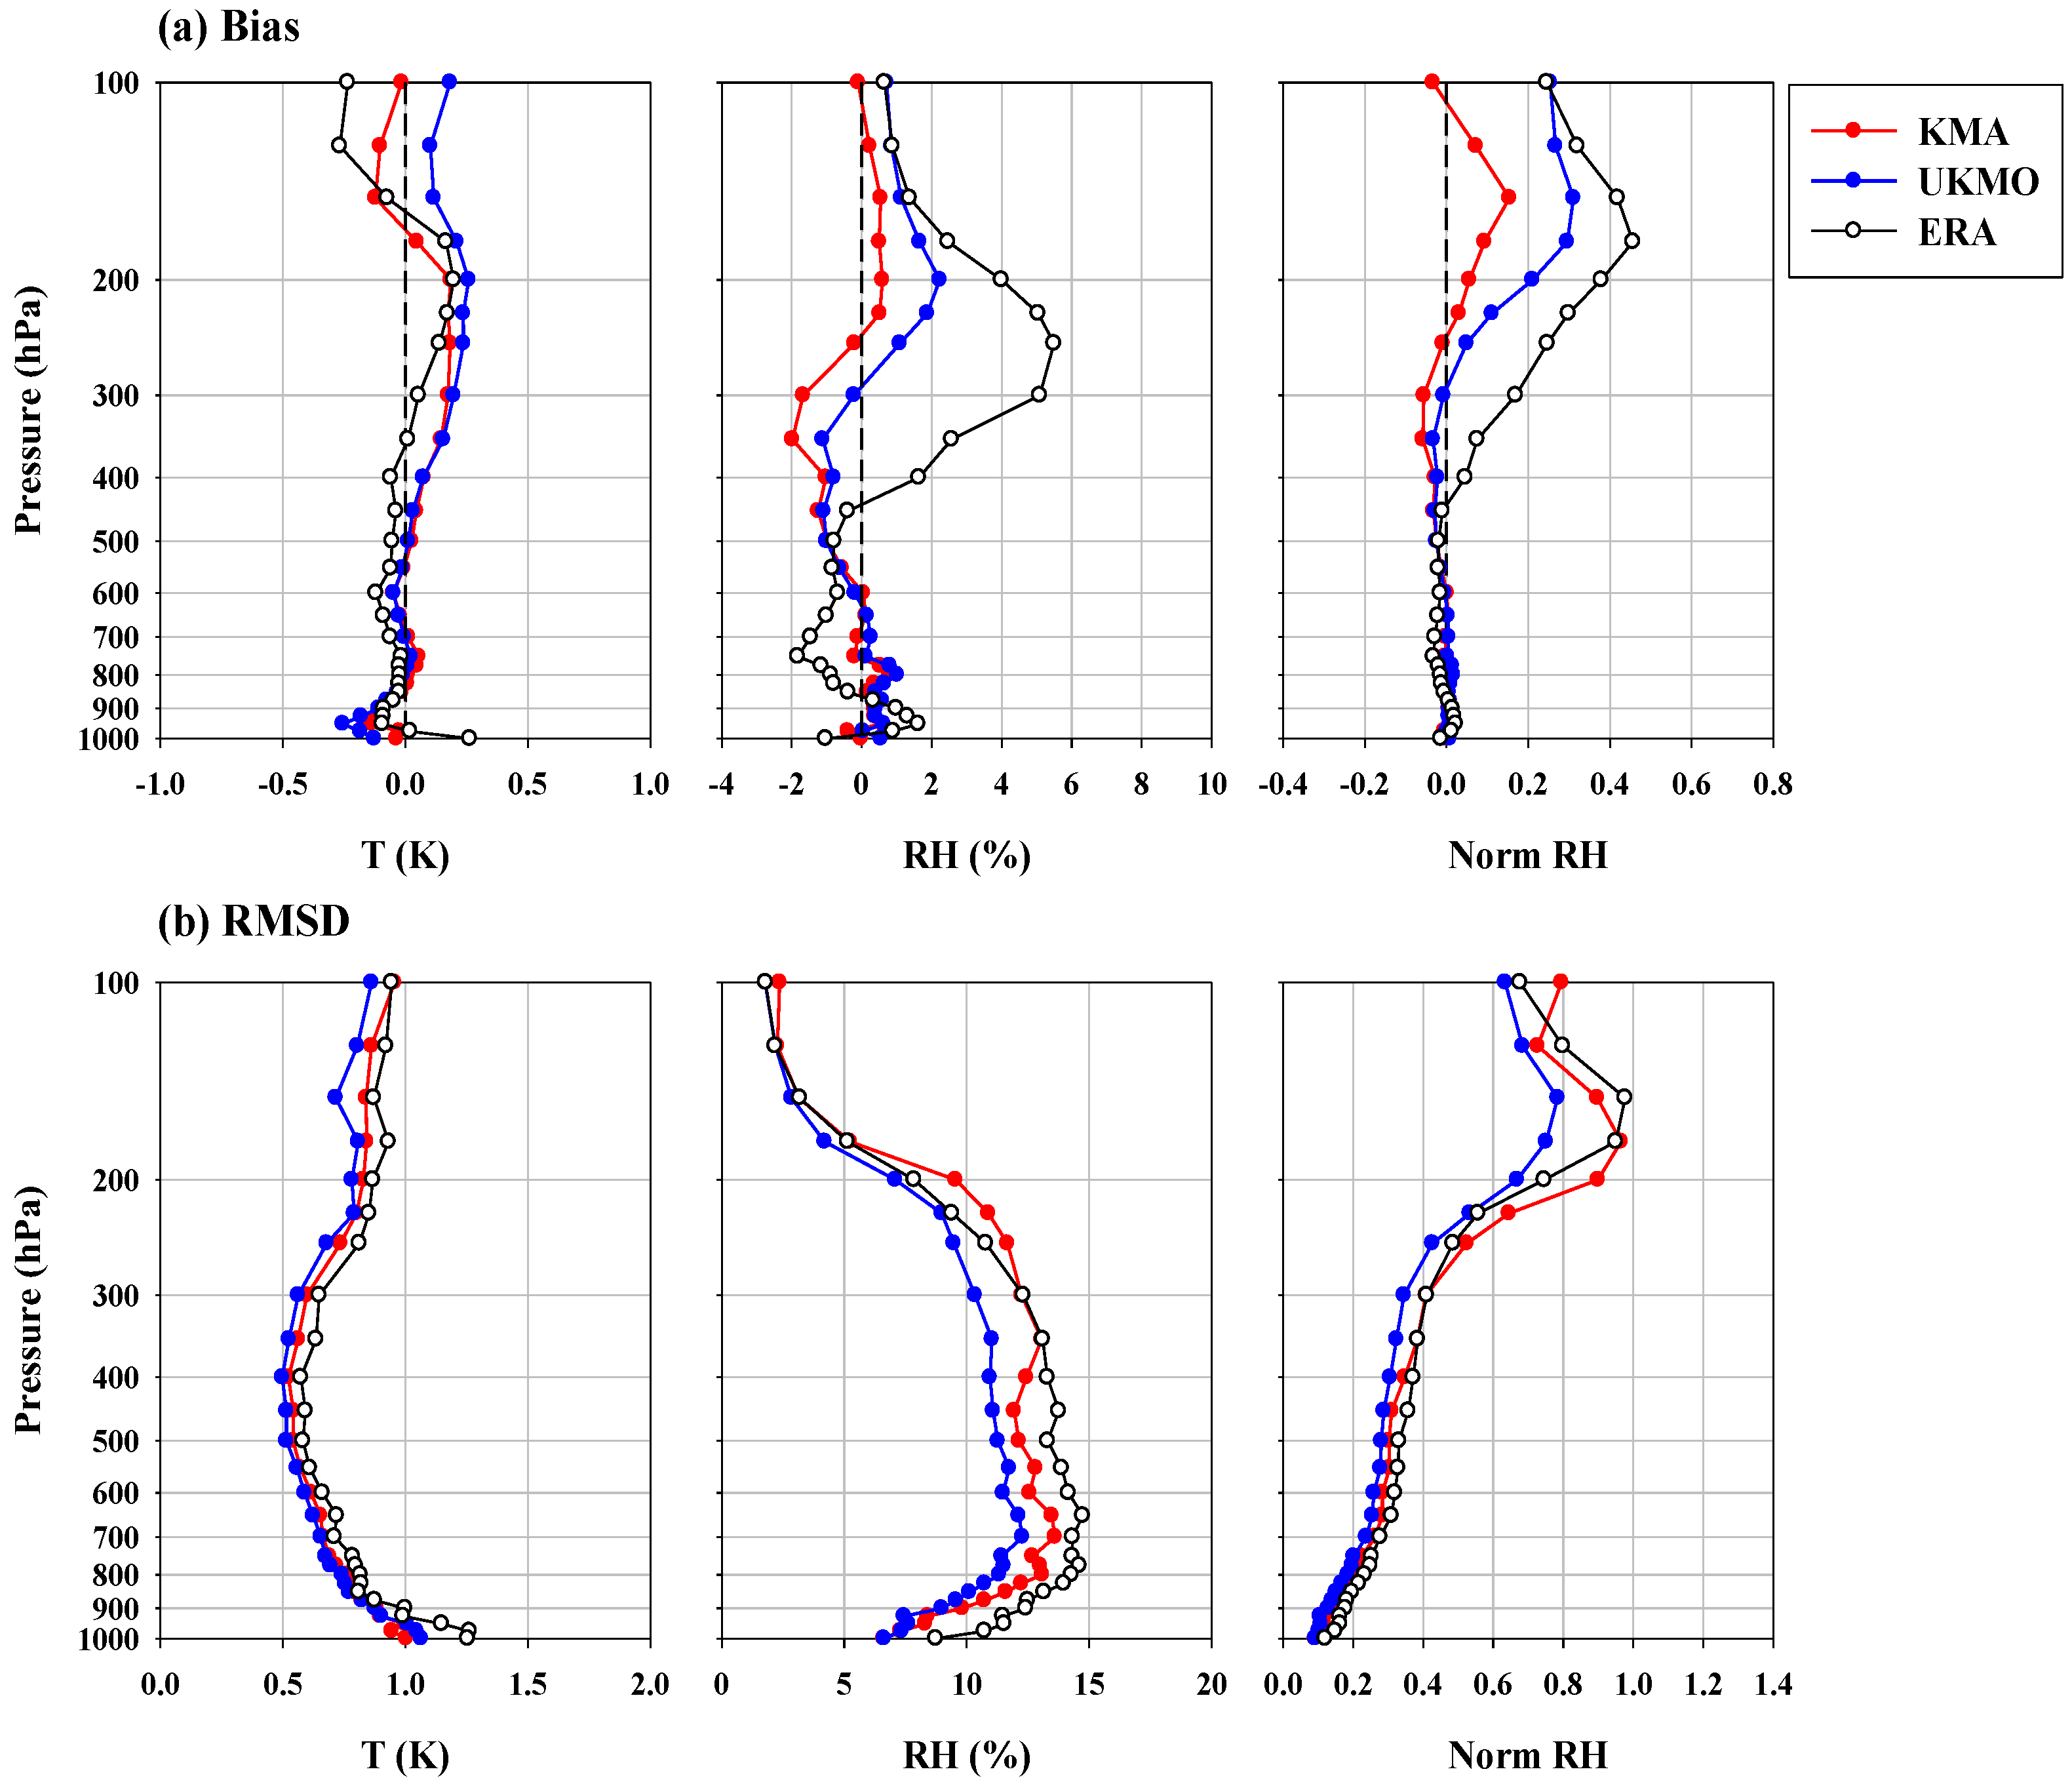
The mean biases and RMSDs of the two UM (i.e., KMA and UKMO) and ERA-I data against GRUAN radiosonde observations are shown in Figure 2. For the relative humidity, the normalized biases and associated RMSDs are also plotted, after normalizing the profiles of the error statistics against the radiosonde mean profile given in Figure 1b.
The statistical results for temperature from the three NWP models are similar, with a bias less than 0.5 K in magnitude. Less agreement is found for the mean bias above 200 hPa. The mean biases and RMSDs are nearly identical for KMA and UKMO, with only slight differences above 300 hPa. The RMSDs of ERA-I are slightly larger than for the two UM models (1.0 K vs. 1.3 K at 1000 hPa).
Compared with the temperature, the statistical results for the relative humidity significantly differ between NWP models, especially for the upper troposphere (200–400 hPa), where the ERA-I exhibits the largest wet bias (up to 6%), with a substantial difference between the two UM models. For both UM models and the ECMWF reanalysis data, the RMSD distribution increases with height below the 700 hPa level, but decreases gradually above the 700 hPa level. However, considering the decrease in relative humidity with altitude (Figure 1), it is also relevant to compare the mean bias and RMSD with the mean profile (i.e., normalized profile). The normalized RMSDs of the relative humidity gradually increase with height from the surface and sharply increase above 300 hPa for the three NWP models. In addition, the normalized biases are close to zero below 400 hPa and increase with height above 350 hPa, where the ERA-I shows the largest wet bias (up to 0.4). However, results in the upper layers should be less reliable because measurements are more uncertain due to the small amount of water vapor and calibration uncertainty of the RS92 [12]. This increase with height appears to be related with the general tendency toward a lower relative humidity in the upper layers, causing relatively larger errors. The general features of the normalized bias also indicate humid biases in the upper layers for all three NWP models, even though the relative humidity is smaller than in the lower layers.
Unlike the larger mean relative humidity bias in the upper troposphere, the RMSDs tend to be larger in the lower troposphere than for the other two. Interestingly, the RMSDs of the ERA-I are slightly larger than for the other two. This may be partly due to the larger time window of ERA-I for the data assimilation compared to the two models. The ERA-I assimilation system uses 4D-Var as does the UM system, but it includes more observation data, due to the larger assimilation time window of ERA-I compared to UM—longer windows/more data are likely to give slightly worse analysis fits to data. On the other hand, considering that the ERA-I data at 0.25° spatial resolution are interpolated from the original ERA-I data for a reduced Gaussian grid with a horizontal resolution of 0.75°, the slightly worse ERA-I fits may also be caused by the residual mismatch caused by the coarse horizontal resolution of the ERA-I (~79 km) compared to the UM (~25 km). Another reason might be that ERA-I is a somewhat older (August 2006) version of the ECMWF system.
The slight difference between the UM-KMA and UM-UKMO, in spite of the same NWP model, is also interesting—slightly larger RMSDs for the UM-KMA, especially for the relative humidity, are noted. This difference is likely due to the fact that the UKMO, as the agency that developed the UM, was using an updated version, unlike the KMA [14,22]. Moreover, the mean biases of the relative humidity in the upper troposphere are slightly larger for the UM-UKMO than that for the UM-KMA, even though the UKMO used an updated version including more observation data in the assimilation process. This may be due to the introduction of the new UM system at the KMA between late May and early June 2012. Strong dry biases are found in the old UM-KMA during spring (March–May), while humid biases abruptly appear in summer (June–July) in the new UM-KMA outputs. Thus, we suspect that these clear differences, especially for the humidity profile, are the result of the new version.
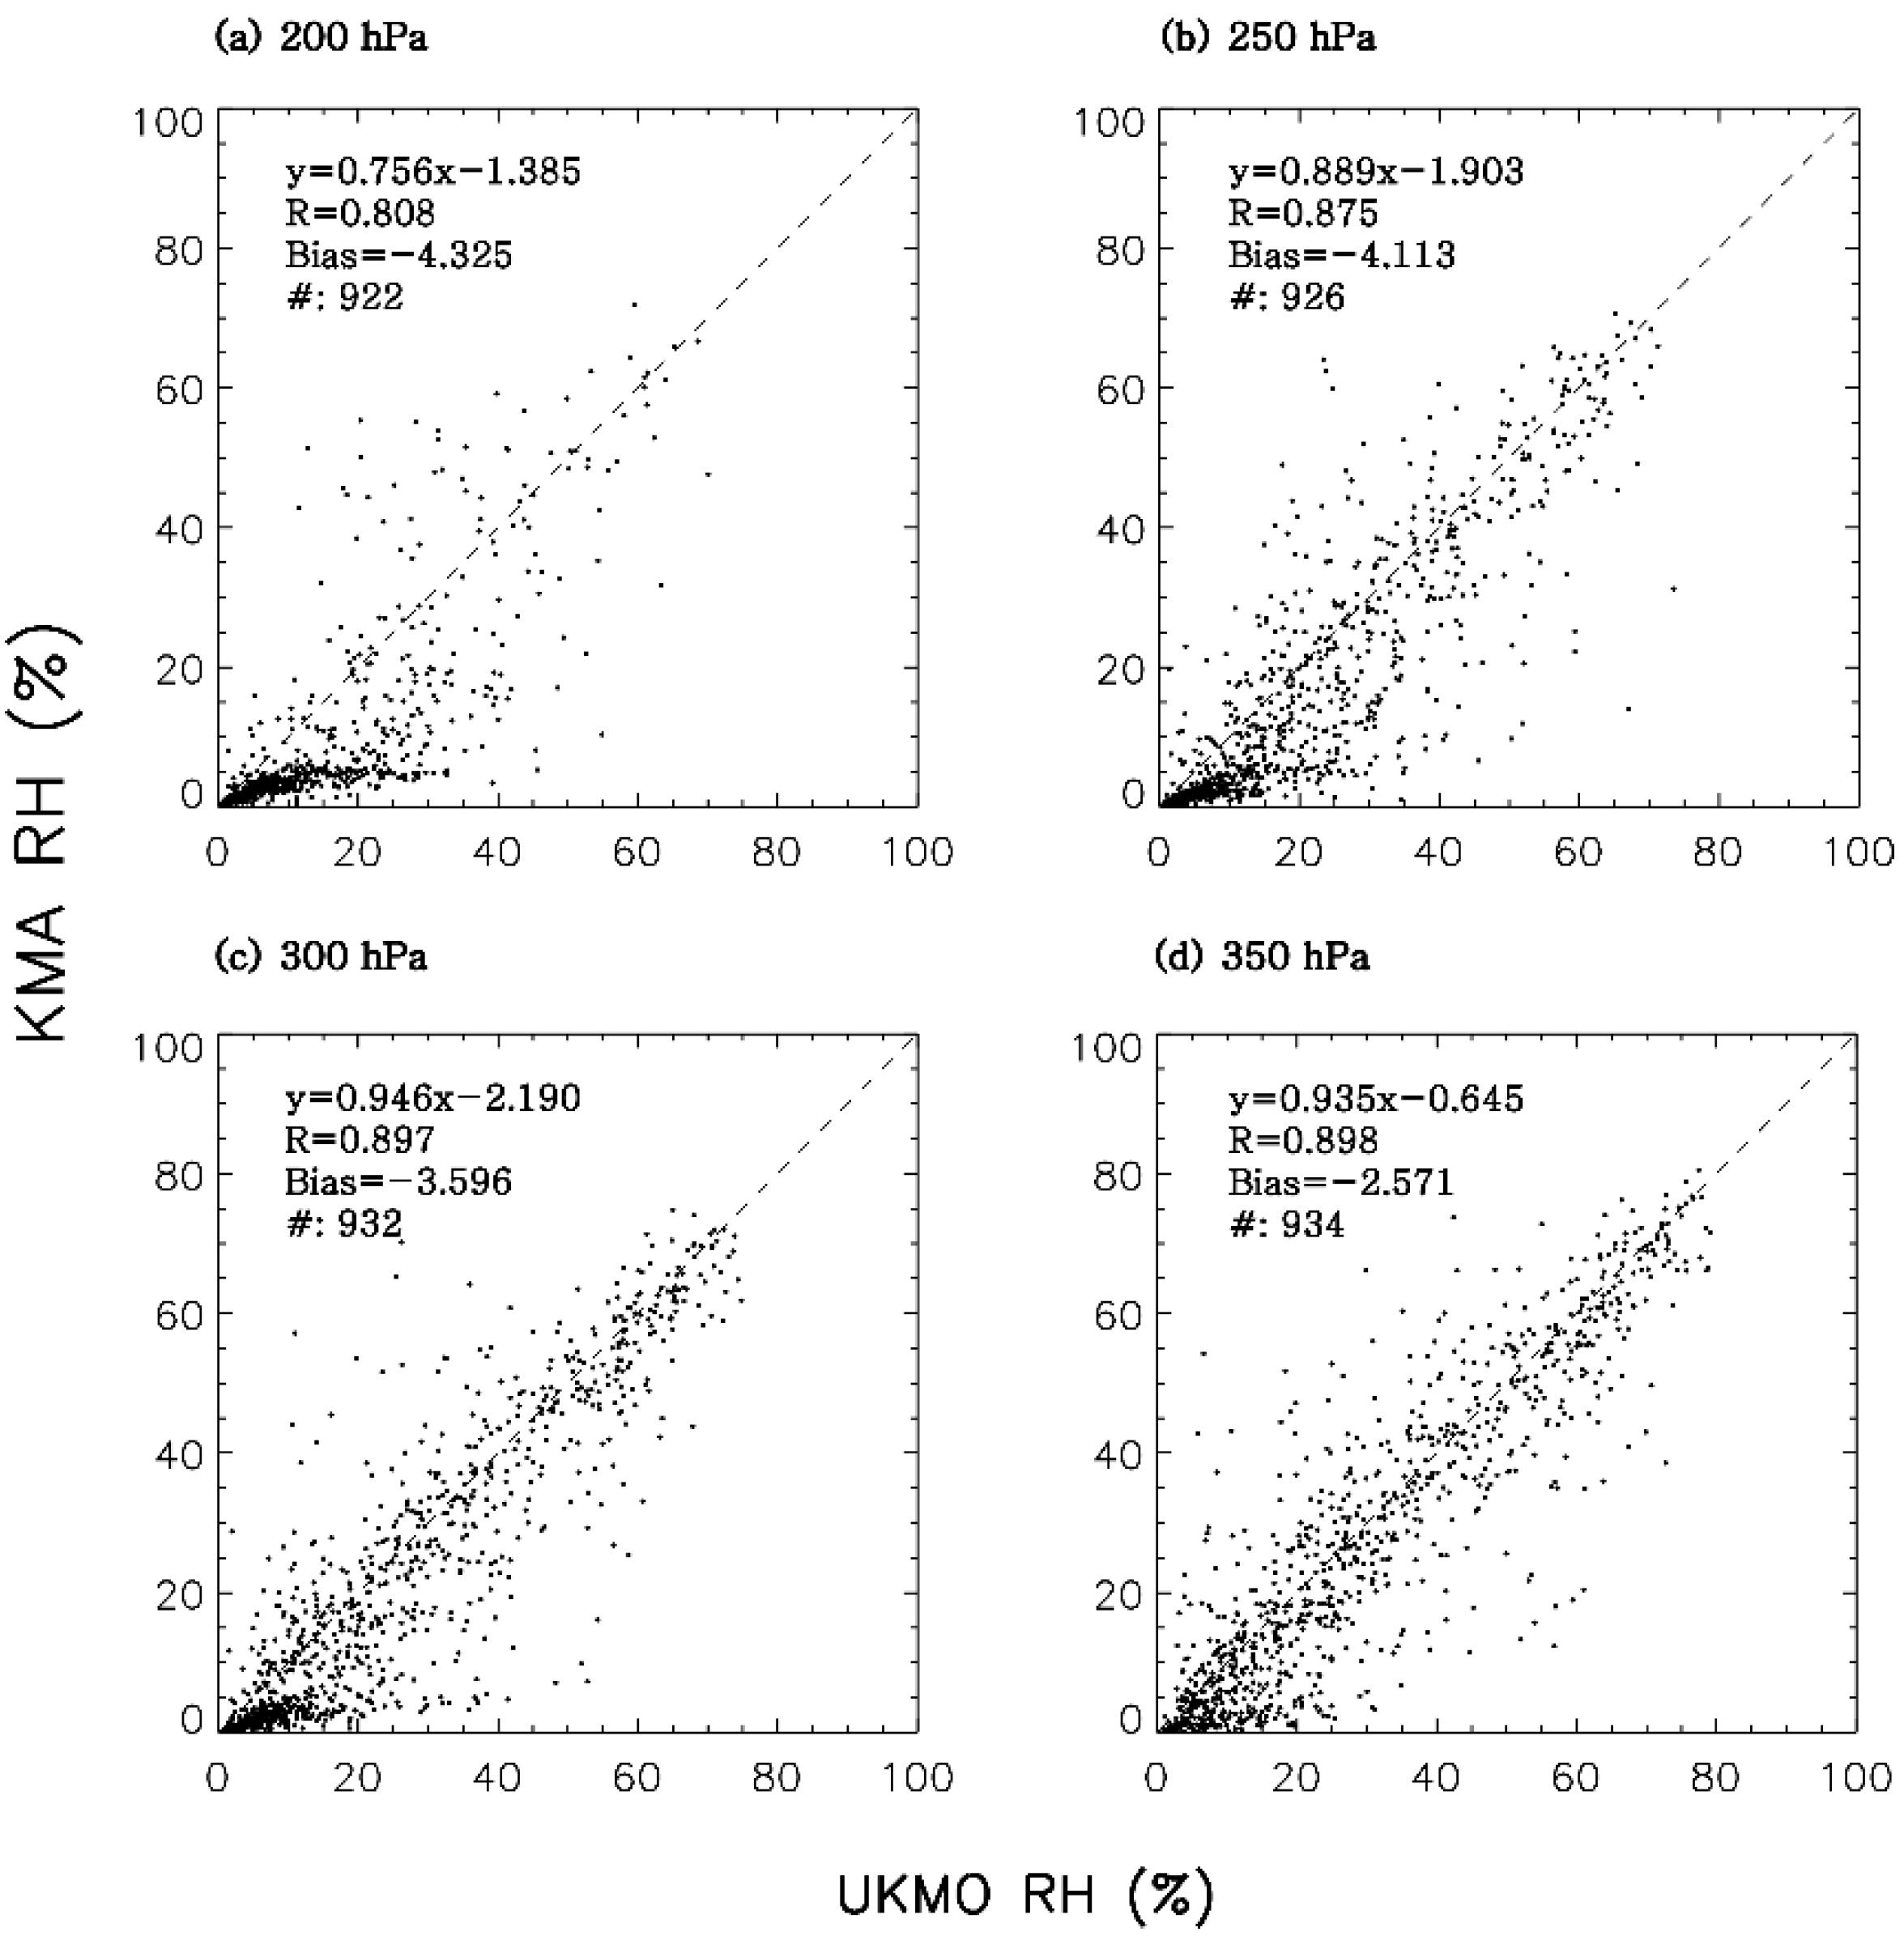
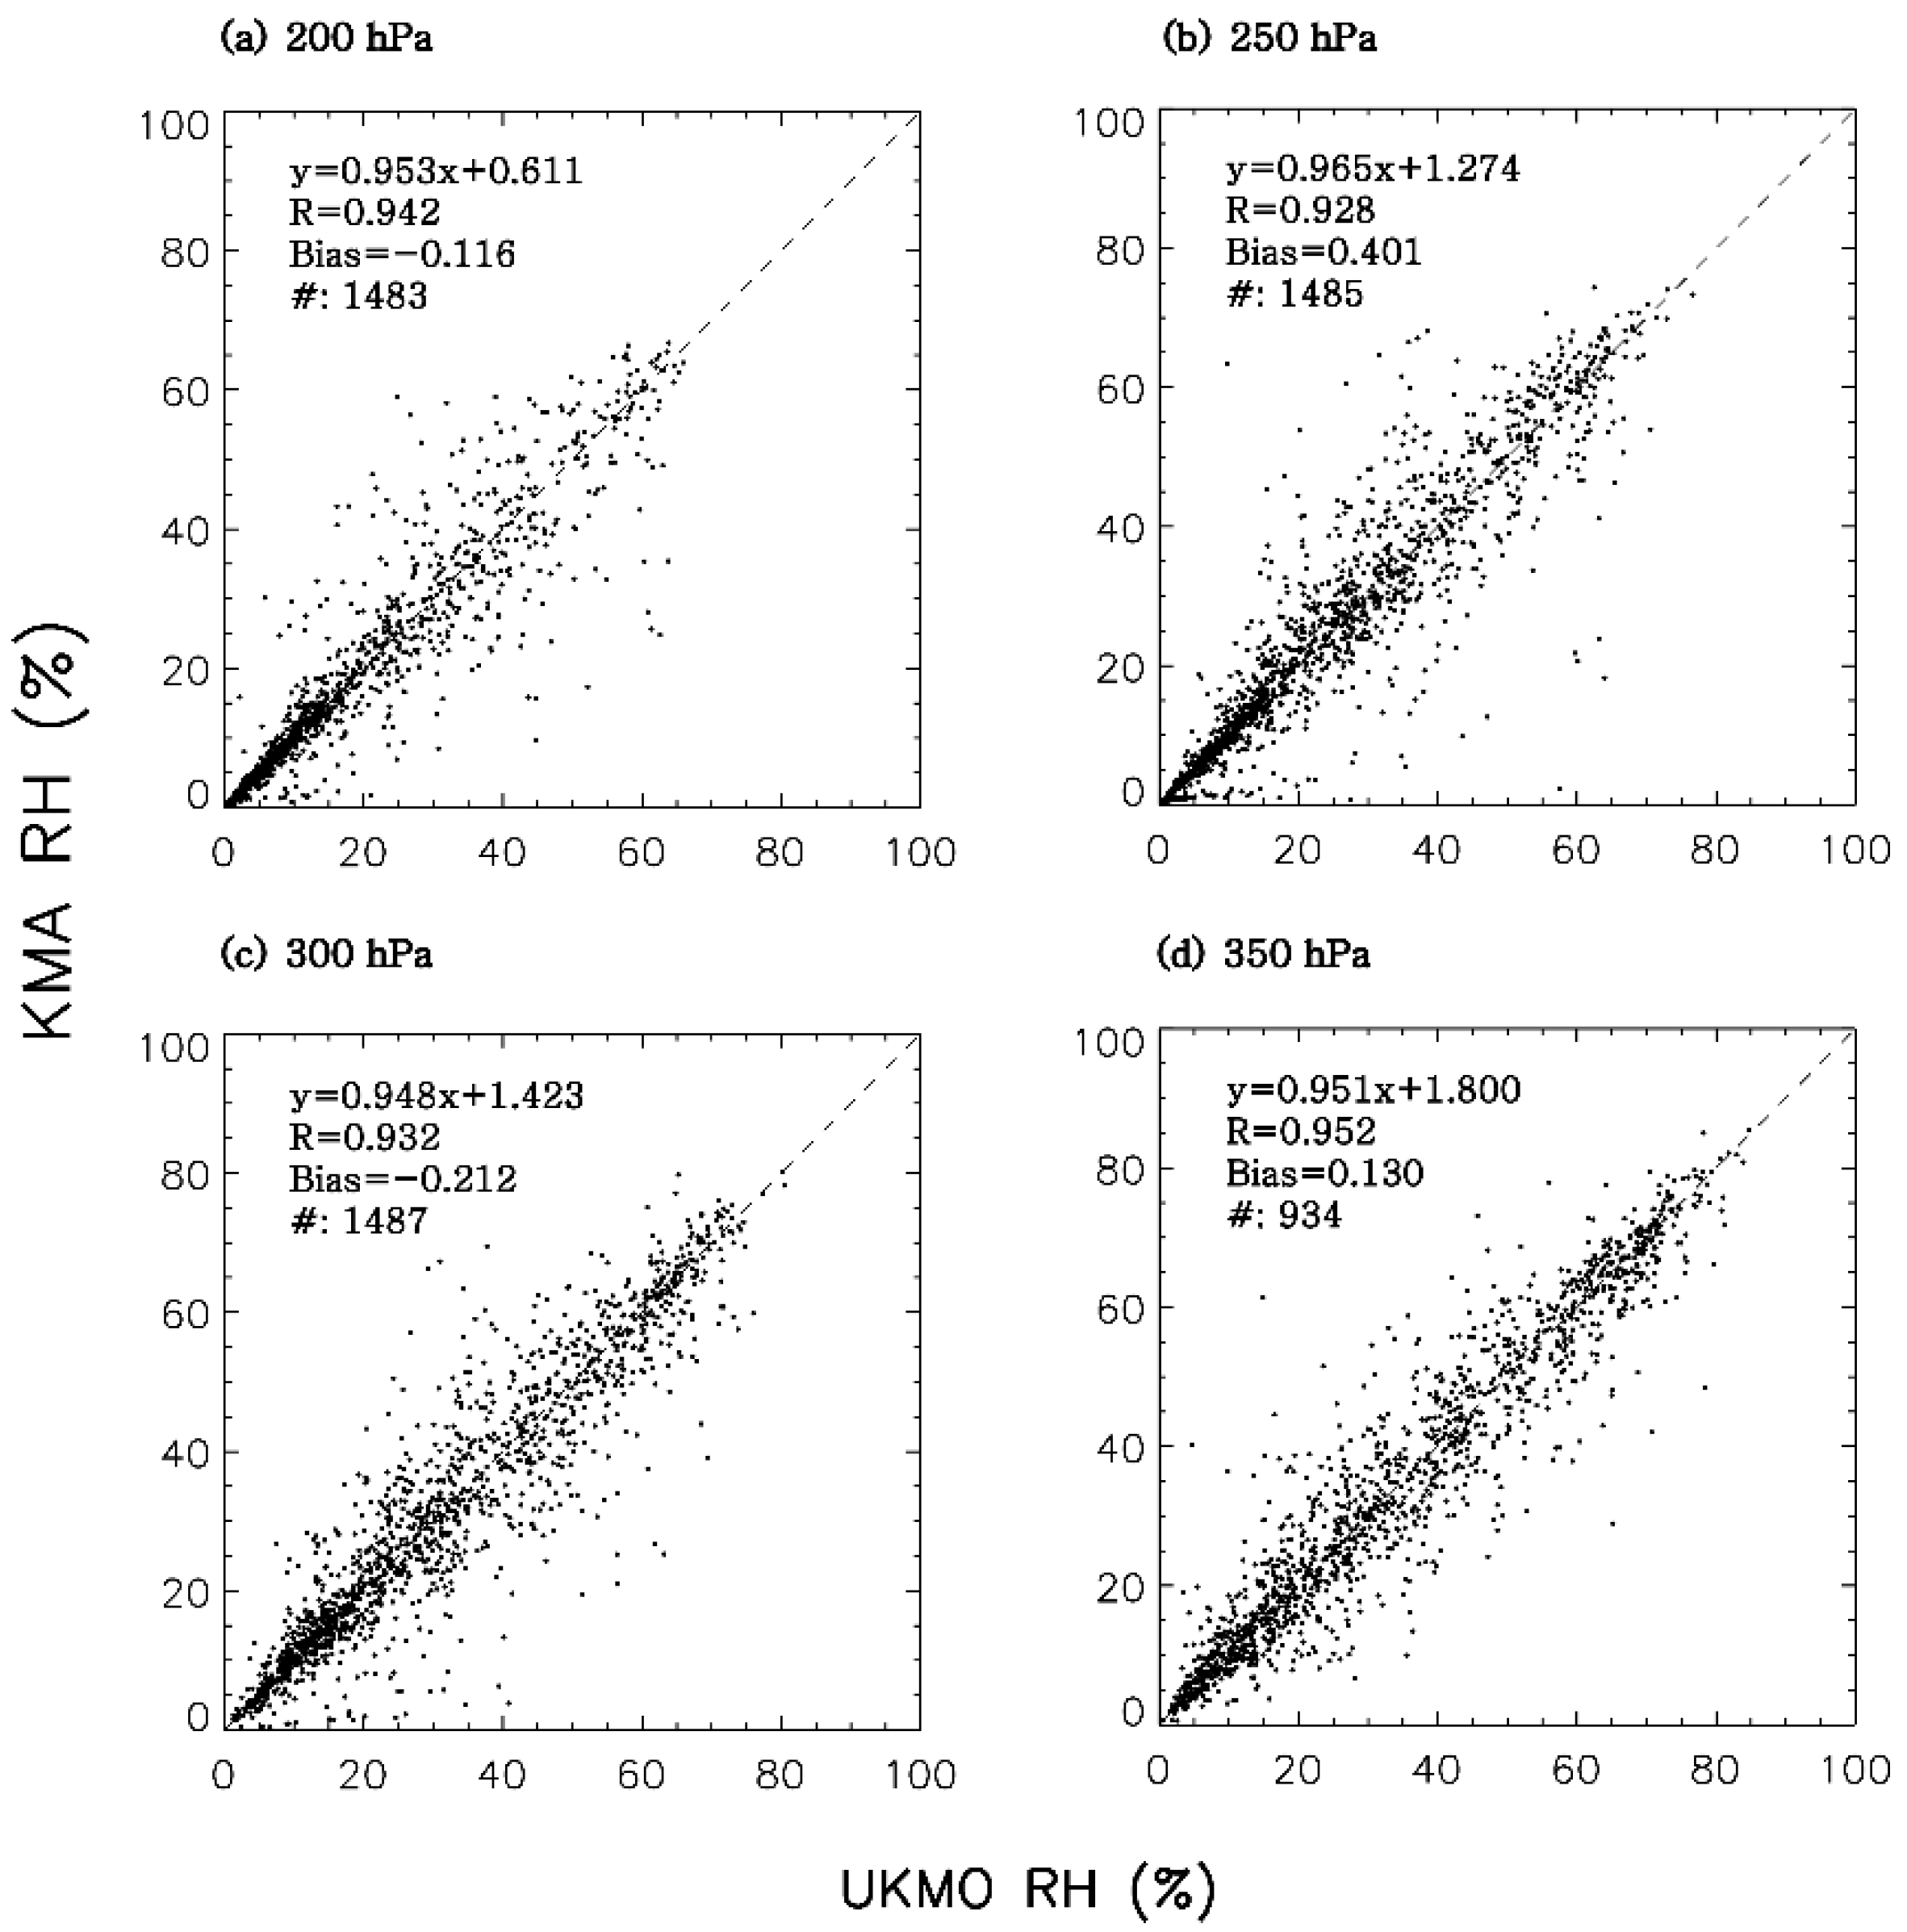
To examine this interpretation, we analyze the relative humidity at 200, 250, 300, and 350 hPa, where the differences are substantial. We plot scatter diagrams of the UM-UKMO and UM-KMA relative humidity for 2012 (January–May, Figure 3) and for the period after the introduction of the new version (June–December, Figure 4). In January–May 2012, the UM-UKMO is more humid than the UM-KMA. Such biases between two models appear to be removed in the June–December 2012 period (Figure 2), in which the new version was being used at the KMA. Interestingly, the bundles of the points showing extremely dry conditions (<10% of relative humidity) are hardly seen in the new UM-KMA version. Thus, the differences in the two UM outputs should be attributed to different versions of the global model. The reduced dry biases from the new UM-KMA mainly resulted from the use of a more reasonable humidity control variable and the improvement of the inner loop resolution of the 4D-Var from N144 (90 km) to N216 (60 km) in the assimilation process [14]. However, even though a new UM system was introduced at the KMA, the RMSDs for the temperature and relative humidity remained larger than for the UM-UKMO (Figure 2), as the UKMO used a more improved UM version, even after introducing the new version at the KMA.

3.2. Moistness-Depending Statistics

Regarding the statistical analysis of the mean bias and RMSDs of the three NWP models compared to the radiosonde observations, larger errors are observed during summer compared to winter (not shown), which might result from the degree of atmospheric moistness. To examine the moistness dependency, the error statistics of the UM analysis and ERA-I reanalysis are examined as a function of the total precipitable water (TPW) between the surface and 100 hPa. Similar analyses were taken for the temperature and moisture retrievals from satellite-based hyperspectral sounder measurements [23,24].
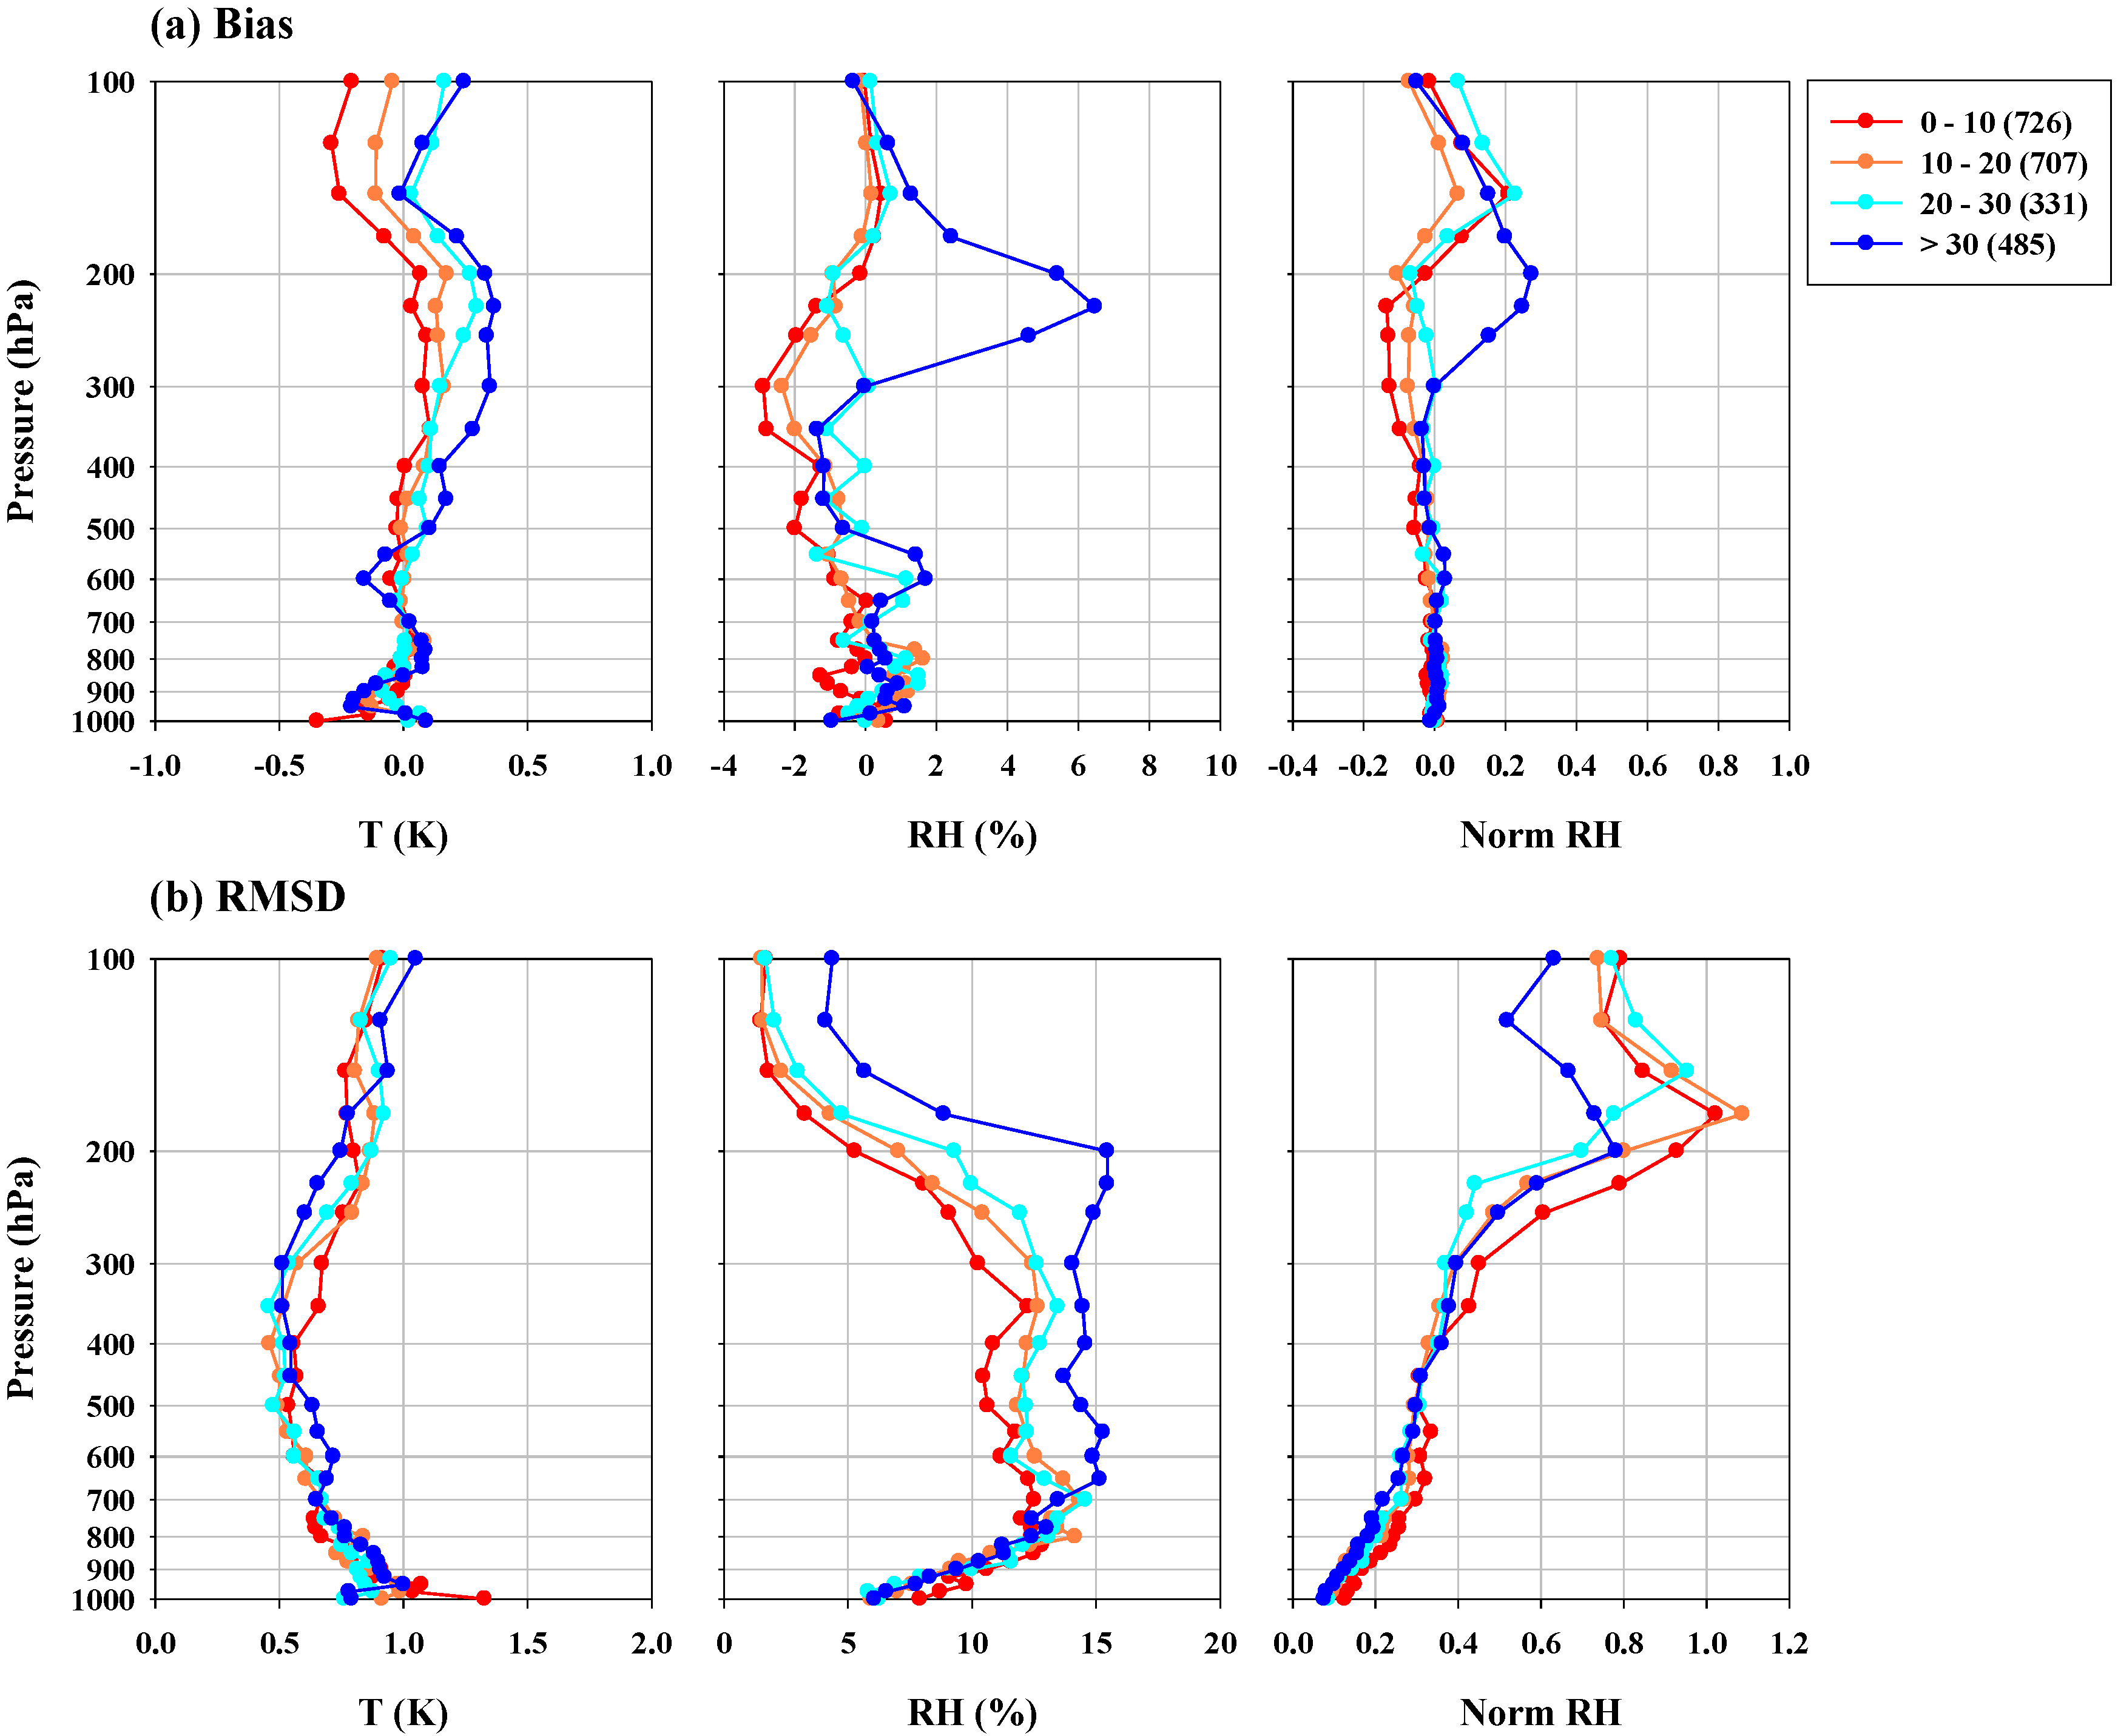
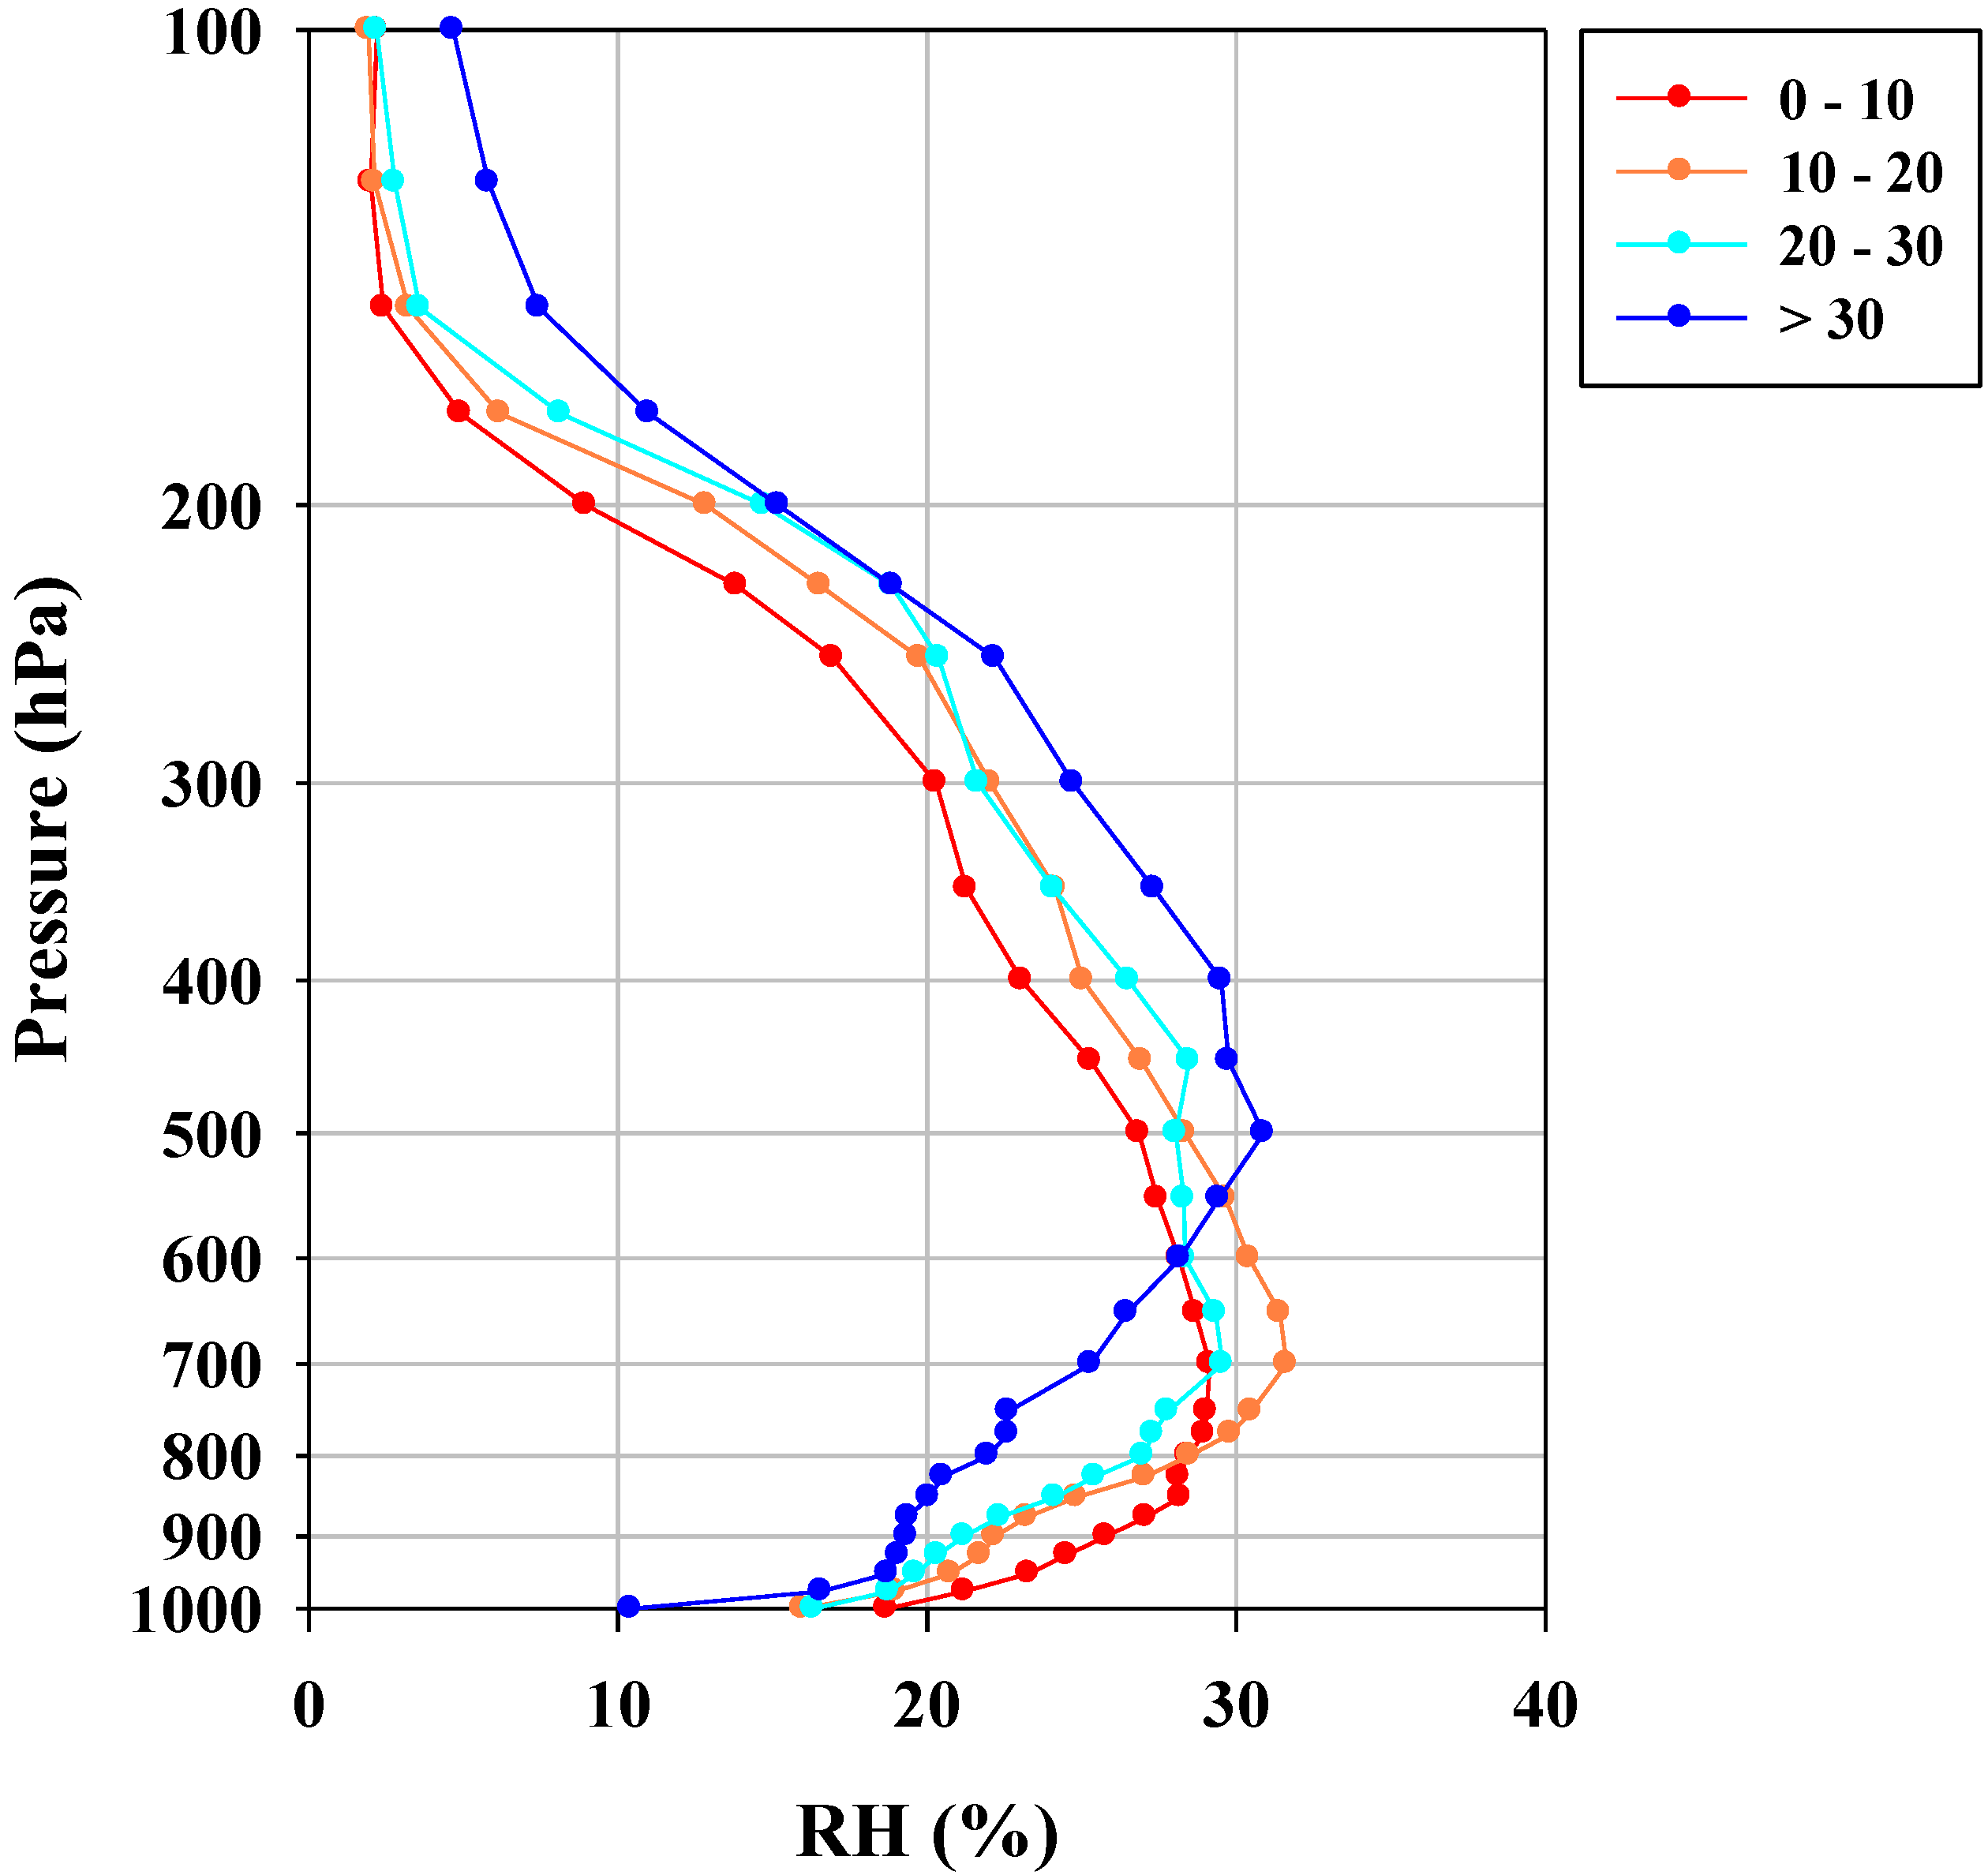
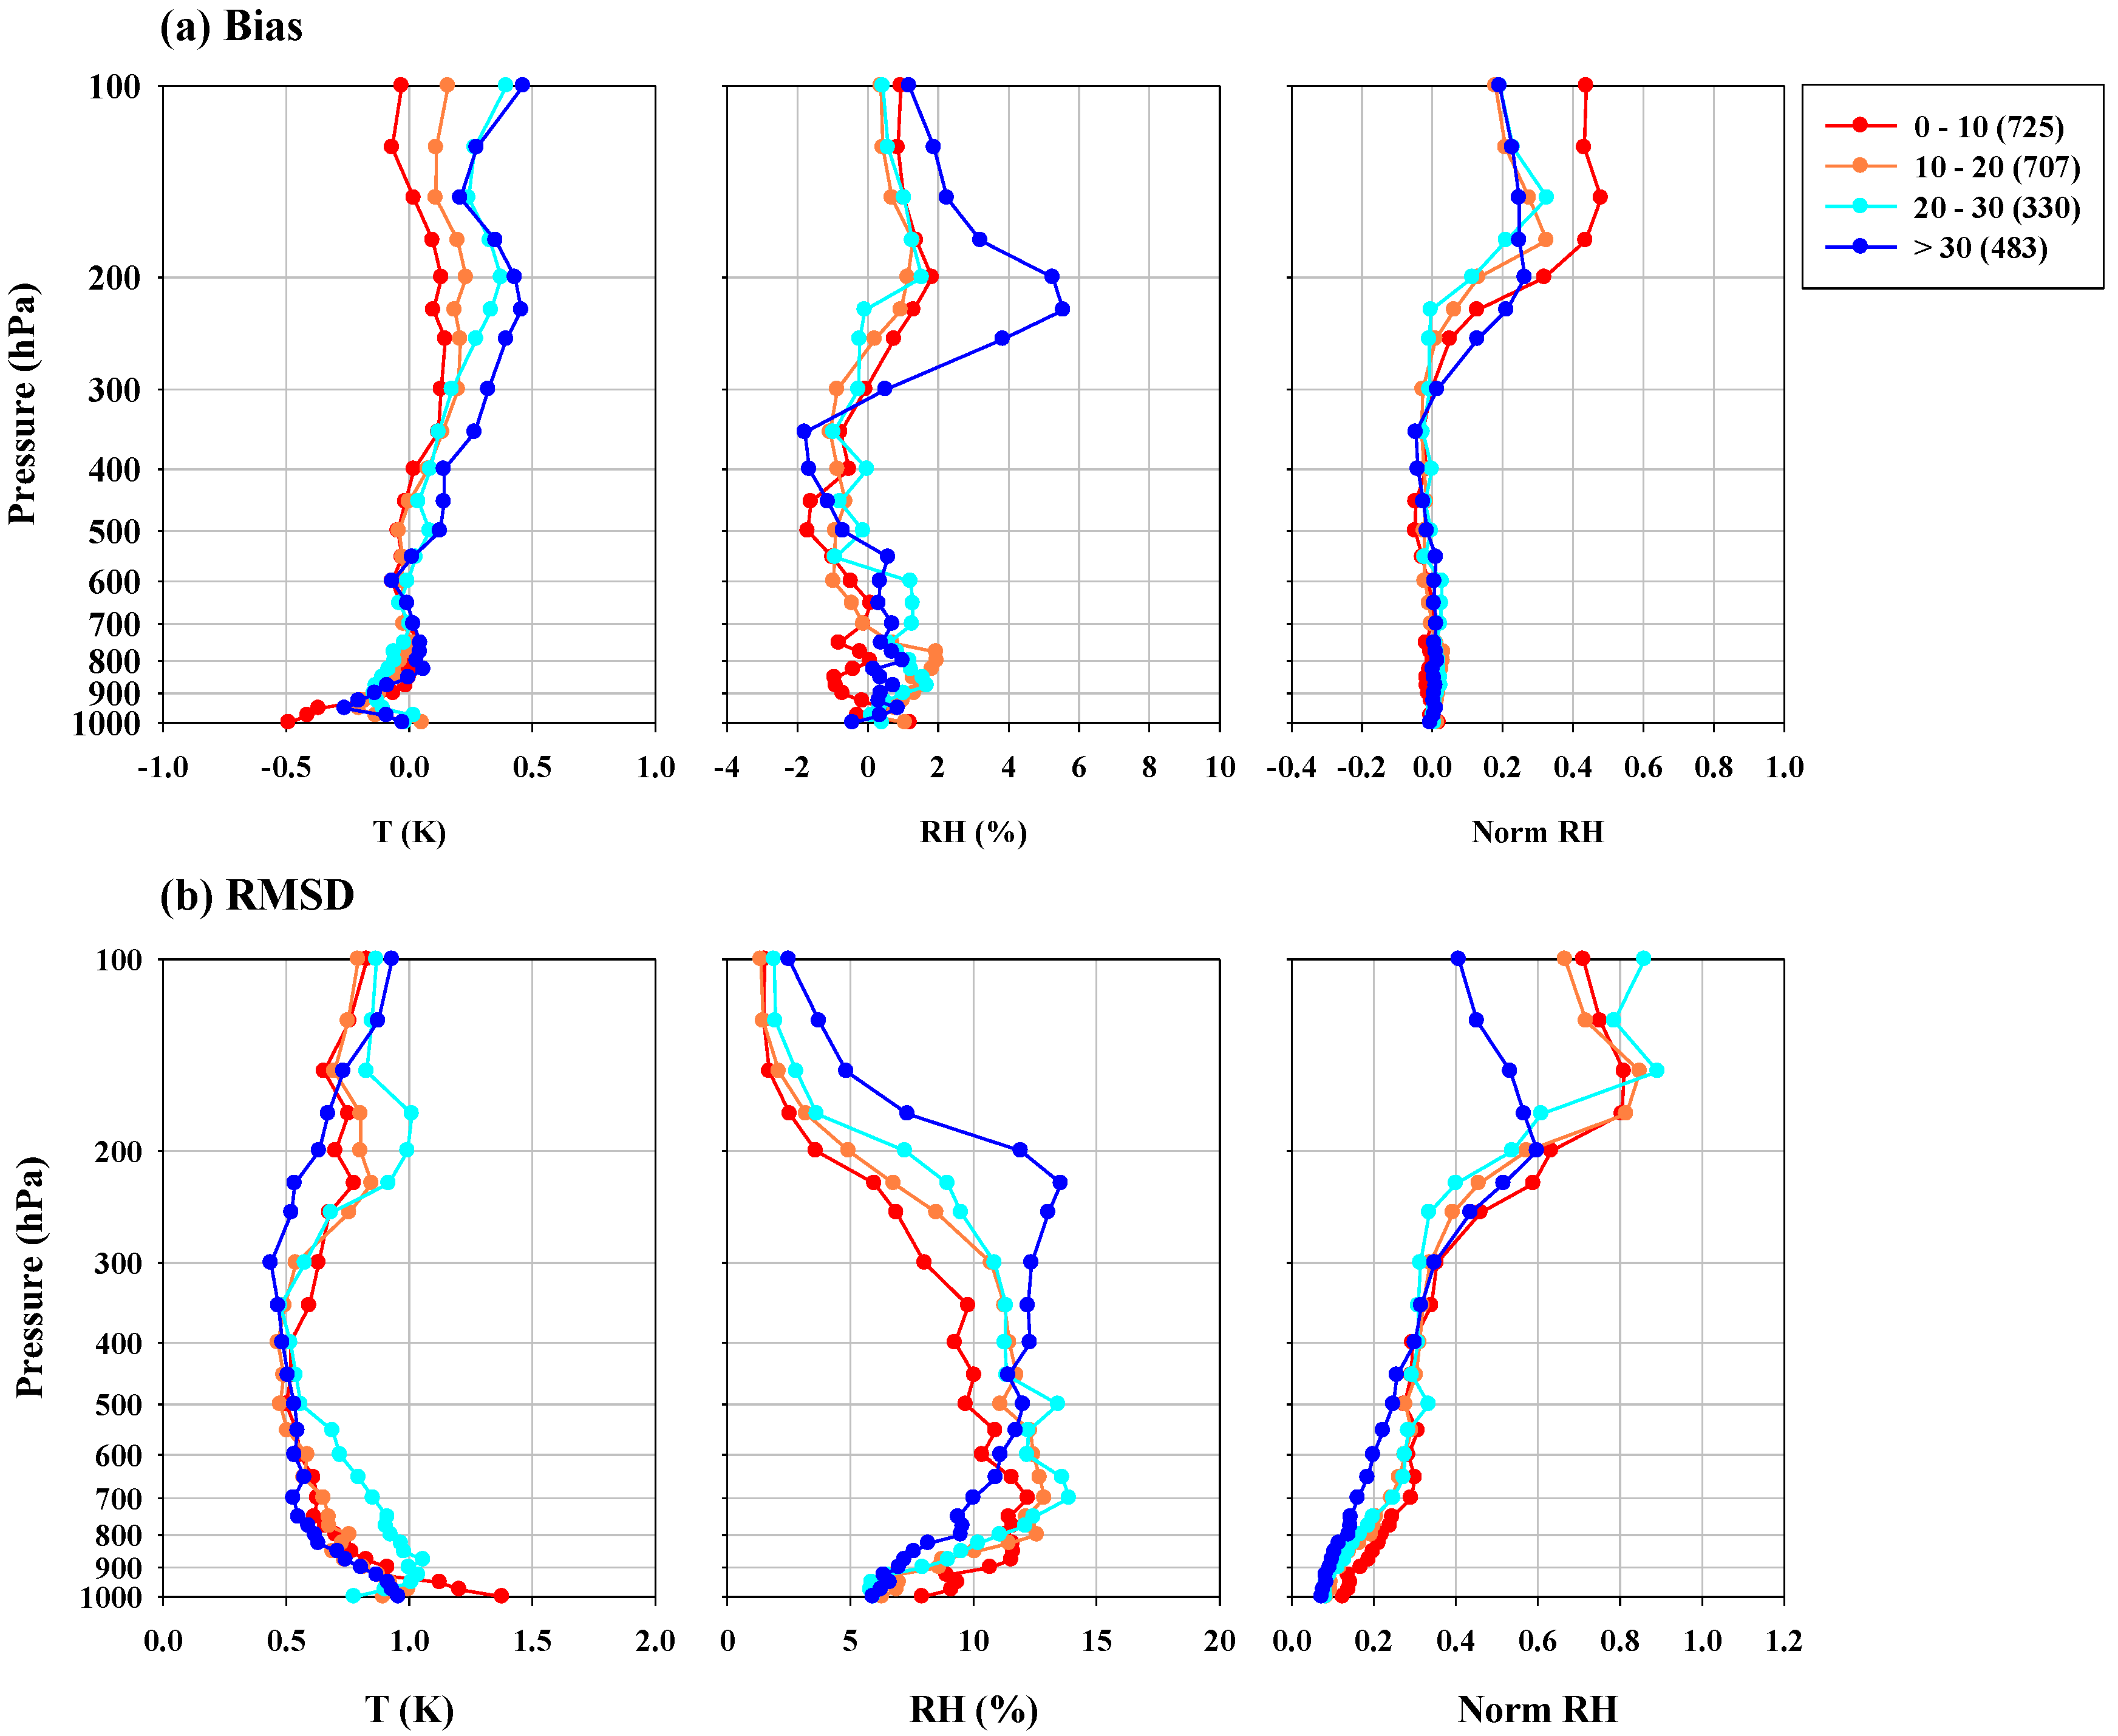
The error statistics for the UM-KMA are given for four GRUAN-based TPW ranges, i.e., <10, 10–20, 20–30 and >30 kg·m−2 (Figure 5)—the lowest and highest TPW classes in essence represent polar and tropical regions. The temperature bias tends to increase with increasing moistness, especially for the upper troposphere above 500 hPa. On the other hand, the relative humidity changes from a negative bias for TPW < 30 kg·m−2 to a positive bias for TPW > 30 kg·m−2. Such a bias trend is also found for the normalized relative humidity. The temperature RMSDs show less significant variation with the atmospheric moistness. However, a strong variation with altitude and moistness is evident for the relative humidity RMSDs, which decrease (increase) with an increasing TPW below (above) 700 hPa. The case of TPW > 30 kg·m−2 shows 15% between 700 and 200 hPa. For the RMSDs of the normalized relative humidity, the magnitudes tend to decrease with increasing humidity, although such an interpretation is not clear above 400 hPa, suggesting that the moisture fluctuation is larger for a higher humidity in an absolute sense but smaller in a relative sense.
Figure 6 shows the vertical distribution of the relative humidity standard deviation calculated from the radiosonde observations. The standard deviation tends to increase with height until 700 hPa for TPW < 30 kg·m−2 and until 500 hPa for TPW > 30 kg·m−2. Thus, in the lower layers below the 700 hPa level, standard deviations tend to decrease with the increasing TPW. The opposite trend is found above about the 500 hPa level. Those features are similar to the RMSD distribution of the relative humidity (Figure 5), indicating that the humidity analysis errors are similar to the natural variability.
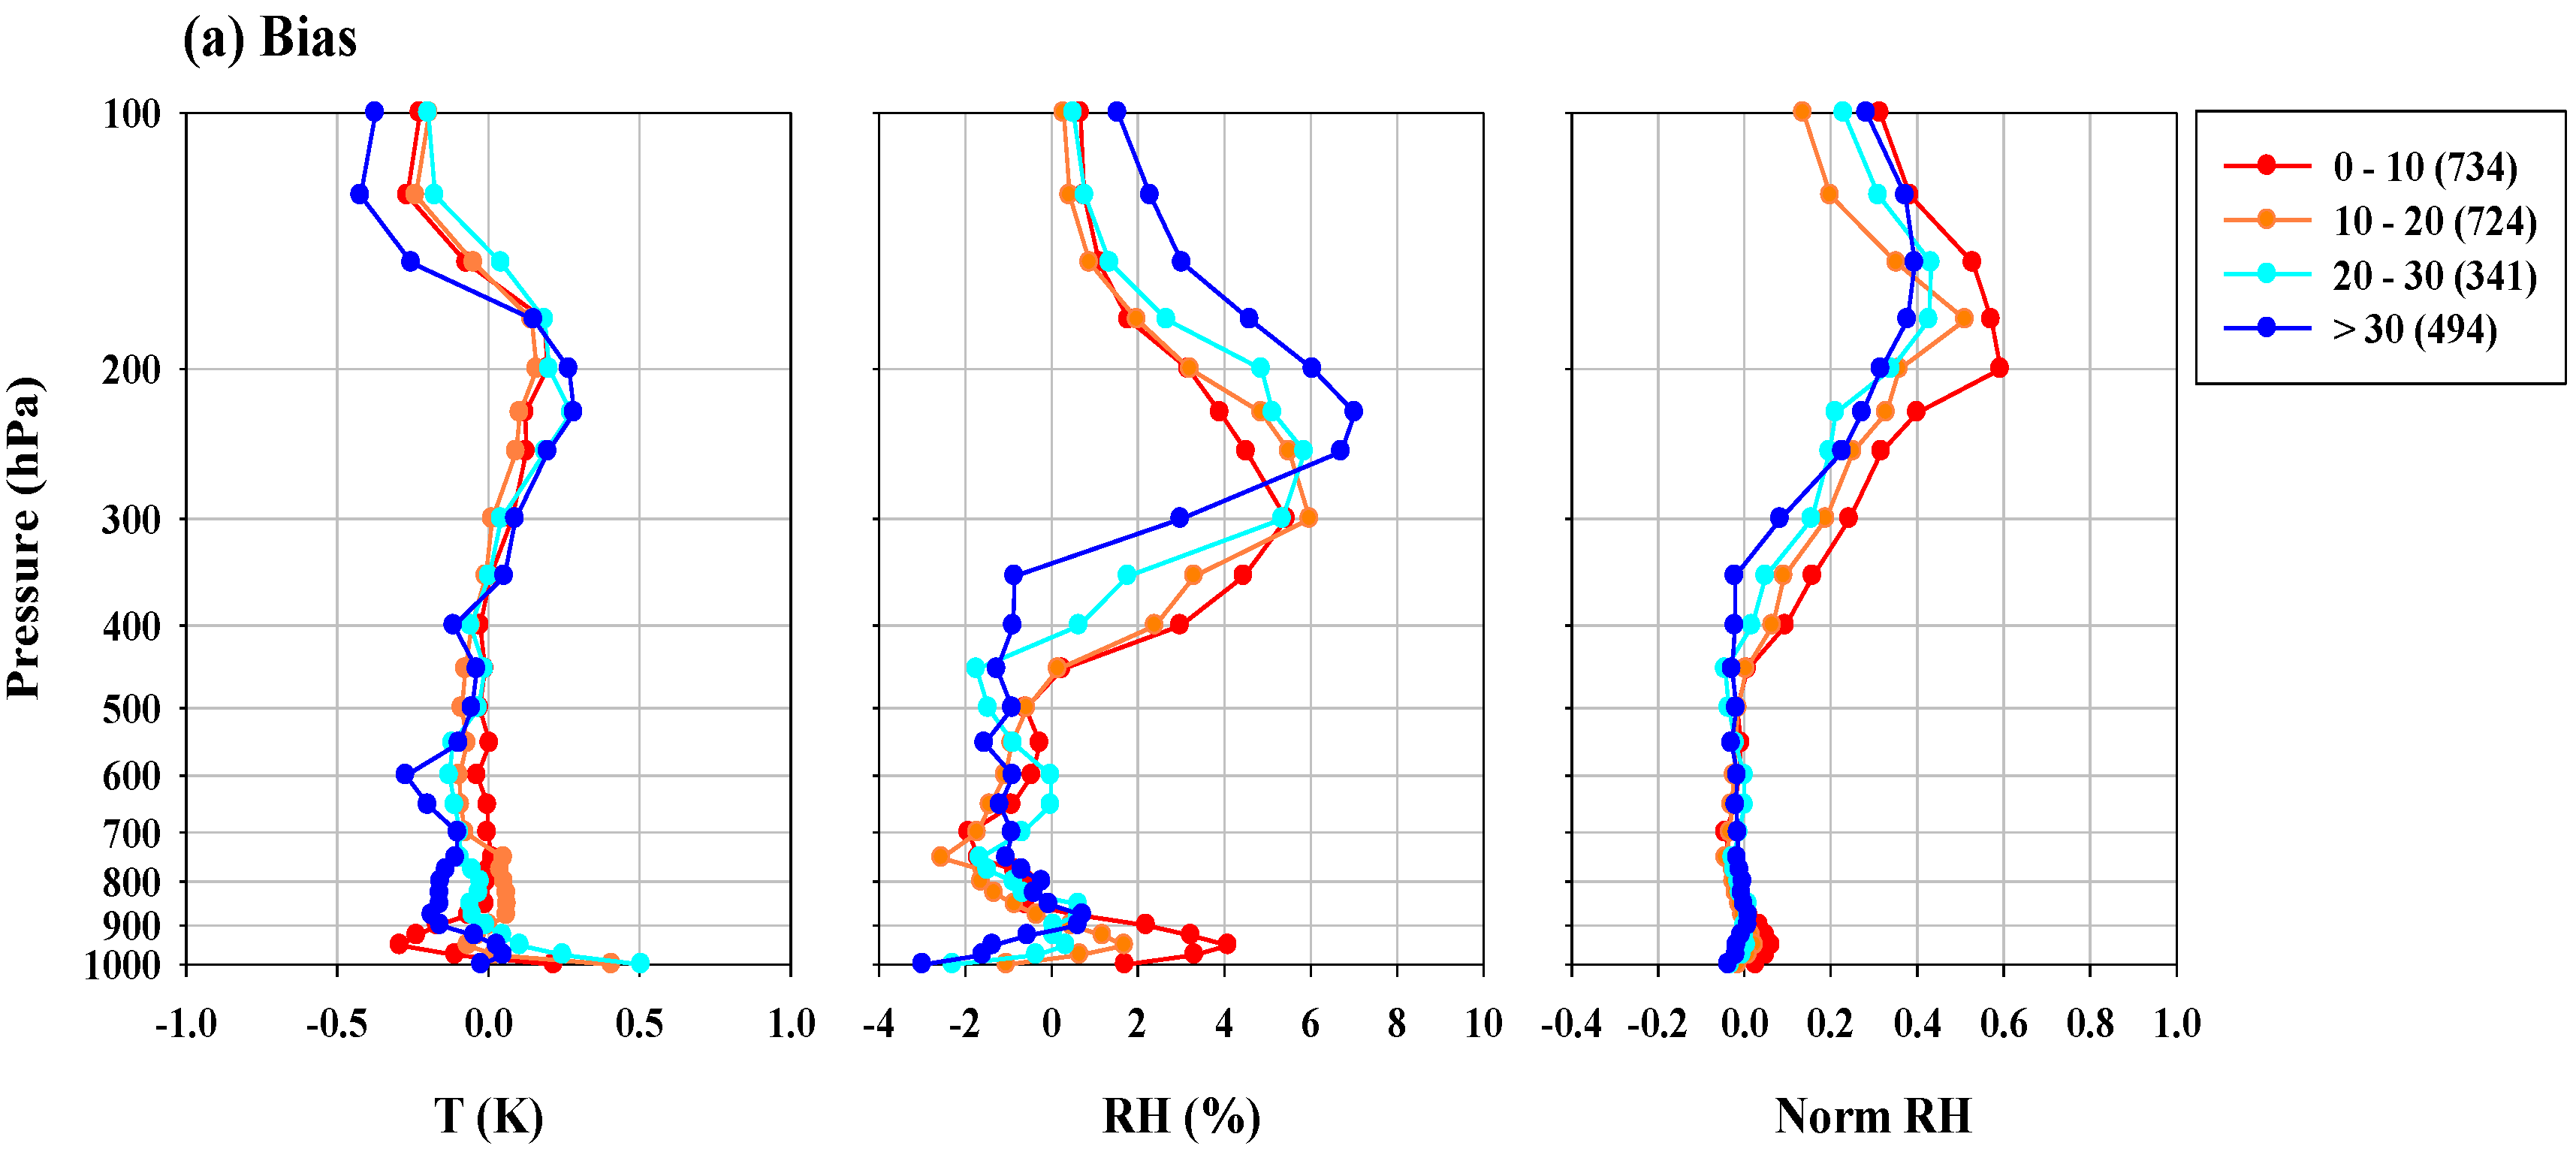
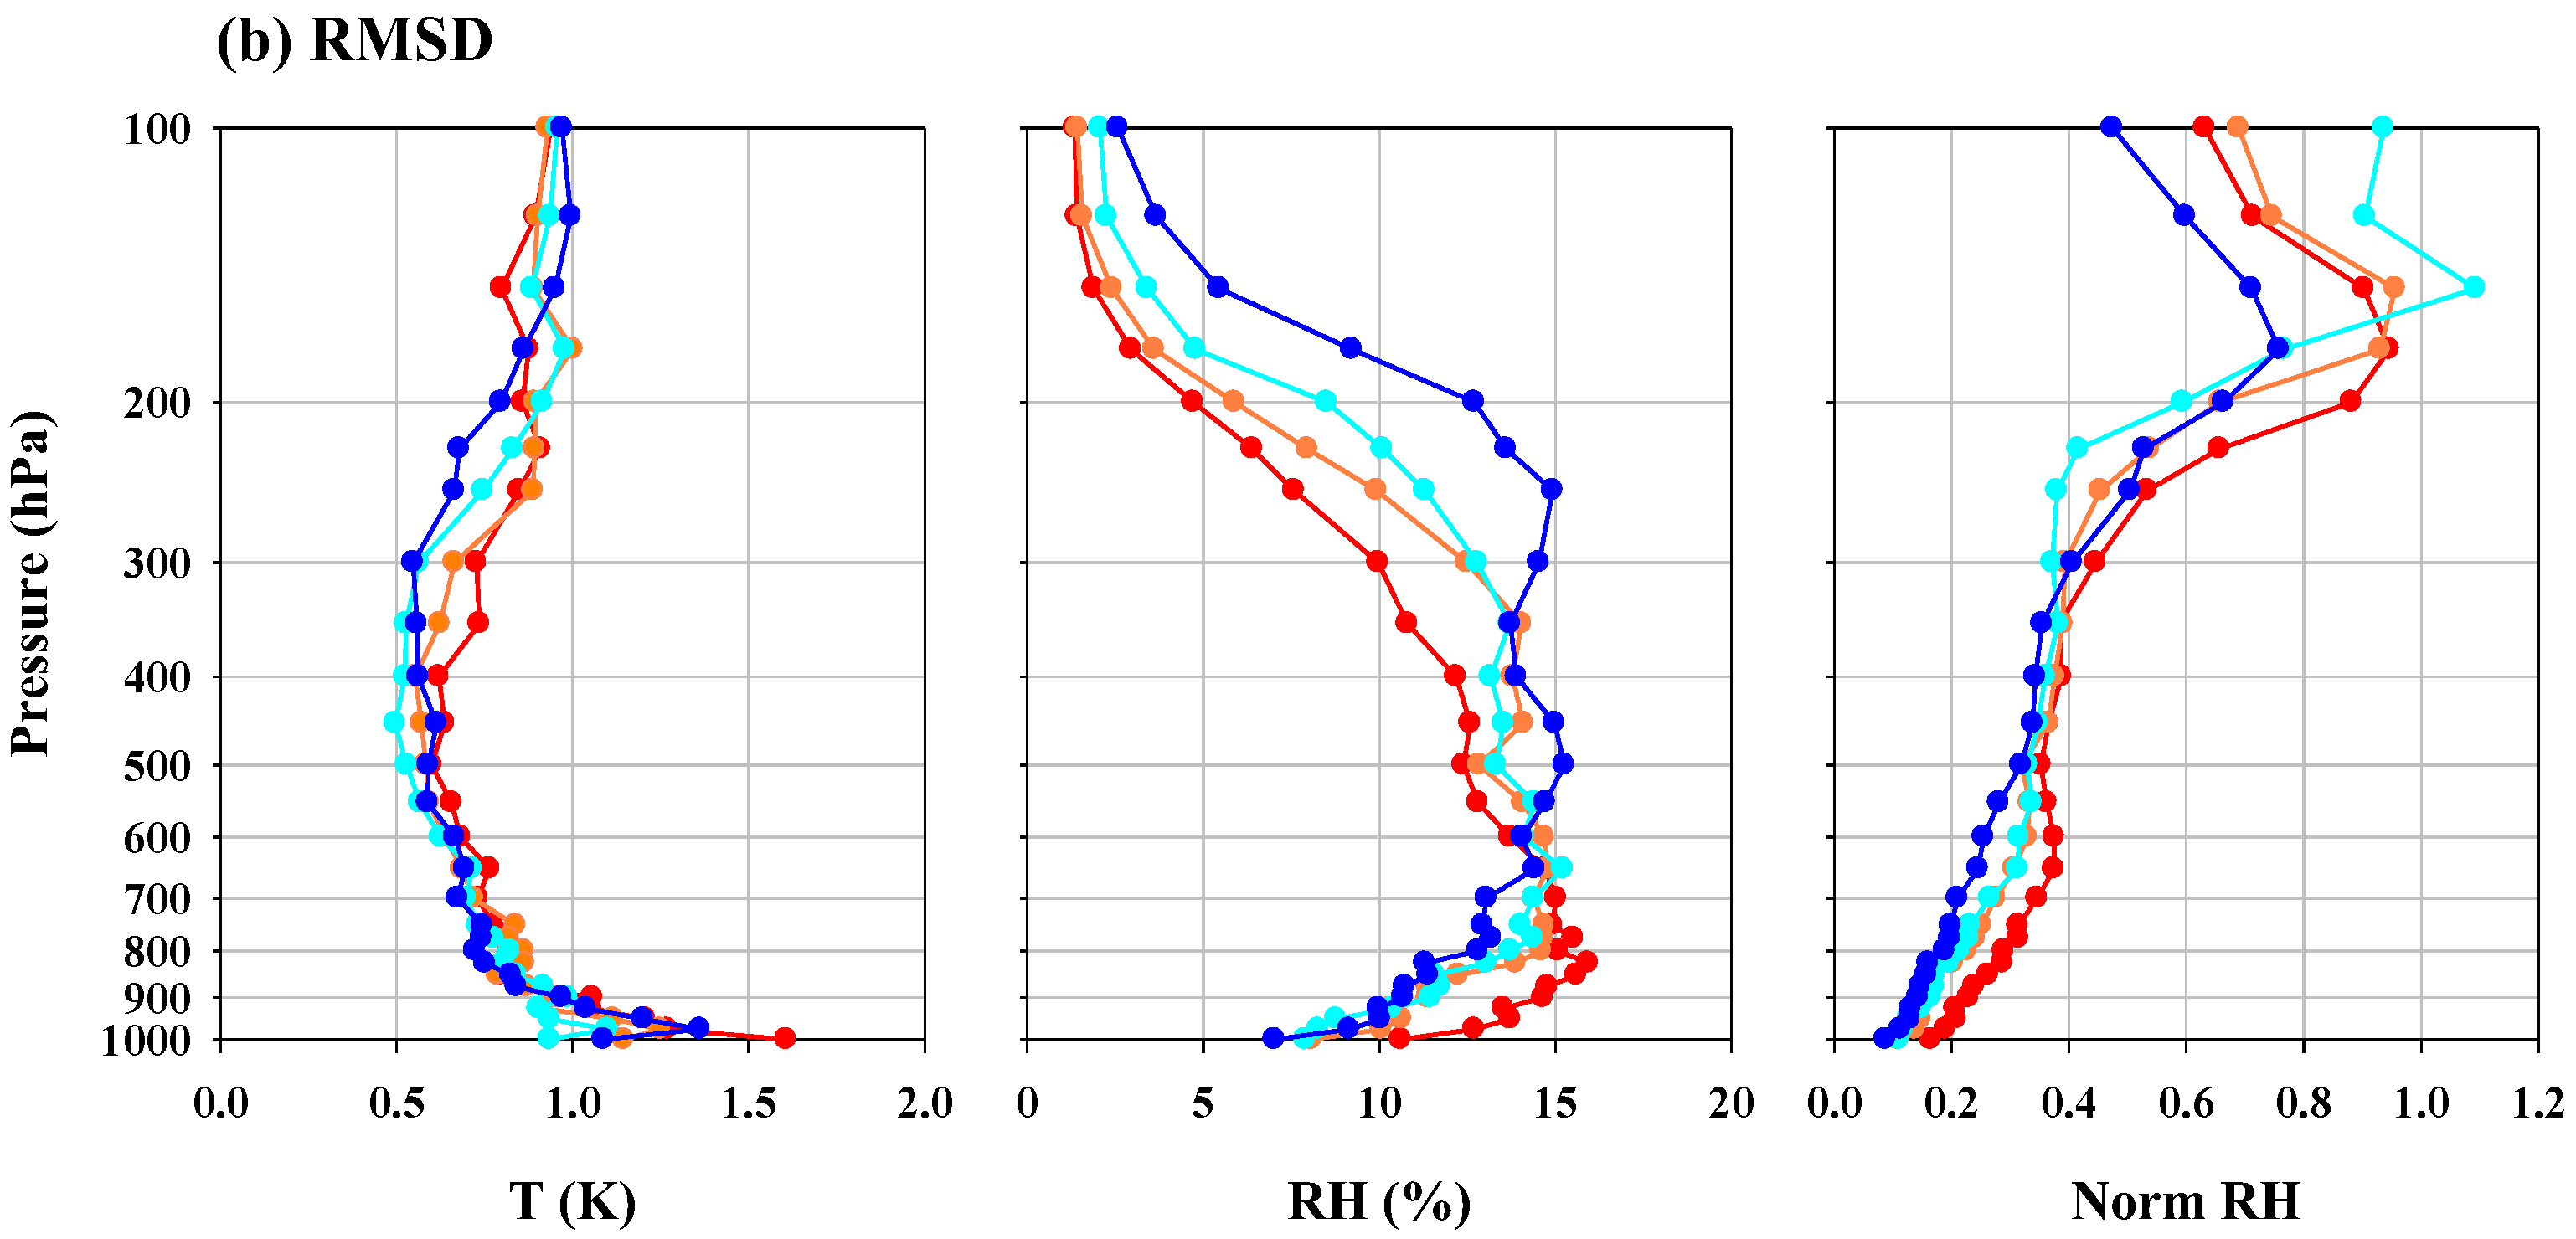
Figure 7 and Figure 8 show the difference statistics depending on the TPW for the UM-UKMO and ERA-I, respectively. The UM-UKMO results are similar to the UM-KMA (Figure 5). However, the much larger positive bias in the mean relative humidity of the ERA-I (Figure 2) is mainly attributed to the humidity biases for TPW < 30 kg·m−2, since the biases for TPW > 30 kg·m−2 are similar to the UM model. Accordingly, clear pattern changes for TPW < 30 kg·m−2 are visible in the normalized relative humidity bias.
The positive humidity bias of ERA-I around 300 hPa (Figure 2 and Figure 8) may be attributed either to the lower saturation vapor pressure from lower temperature or to larger vapor pressure, or to both. Considering that the temperature biases around 300 hPa in the ERA-I are warm (resulting in higher saturation vapor pressure), the moist biases in the upper layer seem to be associated with wetter conditions in the ECMWF analysis in the upper layer. However, caution should be taken because the humidity measurements by radiosonde in the upper tropospheric atmosphere are highly uncertain because of a very small amount of water vapor there, as shown in Figure 1b. Nevertheless, humid bias results are consistent with Hilton et al. [25], who showed a small wet bias of ECMWF forecasts against IASI brightness temperature measurements.

4. Summary and Conclusions

At operational weather centers, data assimilation systems, using a diverse range of observations, are an integral part of the state-of-the-art forecasting system. It is, however, important to examine and validate the analysis outputs against in situ measurements for better understanding of the model or assimilation scheme. Here we examine analysis data produced at three operational centers (UKMO, KMA, and ECMWF) where different models and different quality controls for the assimilations are employed. We aimed at examining the overall accuracy of the analysis produced at three centers using common GRUAN-measured temperature and humidity profiles for a one-year period of 2012. Also examined was the impact of the UM version change at the KMA in May 2012 on the performance change in the analysis at the KMA, using the same GRUAN data.
From the comparison of the temperature and water vapor profiles produced by the UM-KMA, UM-UKMO, and ERA-I against collocated GRUAN radiosonde observations, it was revealed that the temperature seemed to agree better between the radiosonde observations and the model outputs at all three centers than the humidity, especially for the upper troposphere.
In the mean error statistical analysis, the UM-KMA and UM-UKMO are found to be comparable, although the RMSDs of the relative humidity were larger for the UM-KMA. In addition, the UM-KMA showed a dry bias for upper levels in early 2012 (before June), which was significantly reduced after introducing the new UM version in May–June. In contrast, the ERA-I showed the largest positive mean bias for the relative humidity, in particular for the upper layer, while the RMSDs of both temperature and relative humidity were larger than for the UM models throughout the troposphere. The larger RMSDs of the ERA-I were likely due to the larger assimilation time window, the older version of the ECMWF model by the time the ERA-I data were produced, and the residual scale mismatch caused by its coarser spatial resolution in ERA-I relative to the operational NWP models.
The humidity errors seemed to be related to the overall humidity, since the RMSDs were proportional to the TPW, being larger for more humid conditions. The similarity between the RMSDs of the analyses and the natural variability of the moisture profile suggested that the NWP systems studied here were less skillful in accurately analyzing humidity for more humid and variable conditions.

Acknowledgments

The authors would like to thank two anonymous reviewers for providing constructive and valuable comments on how this paper can be improved. The reviewers questioned various aspects including data samplings and result interpretation, and suggested how these can be improved, which all are indispensable to shaping the current paper. This study was carried out through a collaboration between KMA and UKMO, and supported by the Korea Meteorological Research and Development Program under Grant KMIPA 2015-1060. William Bell was supported by the GAIA-CLIM project of the European Union’s Horizon-2020 program.

Author Contributions

Byung-Ju Sohn conceived the research. Young-Chan Noh analyzed the data and contributed to the graphics. After extensive feedback and comments by Yoonjae Kim, Sangwon Joo, and William Bell as KMA and UKMO researchers, Byung-Ju Sohn and Young-Chan Noh wrote the original manuscript text.

Conflicts of Interest

The authors declare no conflict of interest.

References

  1. Warner, T.T. Numerical Weather and Climate Prediction; Cambridge University Press: New York, NY, USA, 2011. [Google Scholar]
  2. Lorenc, A.C. Analysis methods for numerical weather prediction. Q. J. R. Meteorol. Soc. 1986, 112, 1177–1194. [Google Scholar] [CrossRef]
  3. Kalnay, E. Atmospheric Modeling, Data Assimilation, and Predictability; Cambridge University Press: New York, NY, USA, 2003. [Google Scholar]
  4. Brown, A.; Milton, S.; Cullen, M.; Golding, B.; Mitchell, J.; Shelly, A. Unified modeling and prediction of weather and climate: A 25-year journey. Bull. Am. Meteorol. Soc. 2012, 93, 1865–1877. [Google Scholar] [CrossRef]
  5. Lorenc, A.C.; Ballard, S.P.; Bell, R.S.; Ingleby, N.B.; Andrews, P.L.F.; Barker, D.M.; Bray, J.R.; Clayton, A.M.; Dalby, T.; Li, D.; et al. The Met. Office global three-dimensional variational data assimilation scheme. Q. J. R. Meteorol. Soc. 2000, 126, 2991–3012. [Google Scholar] [CrossRef]
  6. Andersson, E.; Hólm, E.; Bauer, P.; Beljaars, A.; Kelly, G.A.; McNally, A.P.; Simmons, A.J.; Thépaut, J.-N.; Tompkins, A.M. Analysis and forecast impact of the main humidity observing systems. Q. J. R. Meteorol. Soc. 2007, 133, 1473–1485. [Google Scholar] [CrossRef]
  7. Rawlins, F.; Ballard, S.P.; Bovis, K.J.; Clayton, A.M.; Li, D.; Inverarity, G.W.; Lorenc, A.C.; Payne, T.J. The Met Office global four-dimensional variational data assimilation scheme. Q. J. R. Meteorol. Soc. 2007, 133, 347–362. [Google Scholar] [CrossRef]
  8. Clayton, A.M.; Lorenc, A.C.; Barker, D.M. Operational implementation of a hybrid ensemble/4D-Var global data assimilation system at the Met Office. Q. J. R. Meteorol. Soc. 2013, 139. [Google Scholar] [CrossRef]
  9. Ingleby, N.B.; Lorenc, A.C.; Ngan, F.; Rawlins, F.; Jackson, D.R. Improved variational analyses using a nonlinear humidity control variable. Q. J. R. Meteorol. Soc. 2013, 139. [Google Scholar] [CrossRef]
  10. Nash, J.; Oakley, T.; Vömel, H.; Li, W. WMO Intercomparisons of High Quality Radiosonde Systems. Available online: https://www.wmo.int/pages/prog/www/IMOP/publications/IOM-107_Yangjiang.pdf (accessed on 15 July 2016).
  11. Moradi, I.; Soden, B.; Ferraro, R.; Arkin, P.; Vömel, H. Assessing the quality of humidity measurements from global operational radiosonde sensors. J. Geophys. Res. Atmos. 2013, 118, 8040–8053. [Google Scholar] [CrossRef]
  12. Dirksen, R.J.; Sommer, M.; Immler, F.J.; Hurst, D.F.; Kivi, R.; Vömel, H. Reference quality upper-air measurements: GRUAN data processing for the Vaisala RS92 radiosonde. Atmos. Meas. Tech. 2014, 7, 4463–4490. [Google Scholar] [CrossRef]
  13. Lee, J.-W.; Han, S.-O.; Chung, K.-Y. The Improvement of forecast accuracy of the unified model at KMA by using an optimized set of physical options (in Korean with English abstract). J. Korean Meteorol. Soc. 2012, 22, 345–356. [Google Scholar]
  14. Korea Meteorological Administration Joint WMO Technical Progress Report on the Global Data Processing and Forecasting System and Numerical Weather Prediction Research Activities for 2012. Available online: https://www.wmo.int/pages/prog/www/DPFS/ProgressReports/2012/GDPFS-NWP-2012.html (accessed on 15 July 2016).
  15. Dee, D.P.; Uppala, S.M.; Simmons, A.J.; Berrisford, P.; Poli, P.; Kobayashi, S.; Andrae, U.; Balmaseda, M.A.; Balsamo, G.; Bauer, P.; et al. The ERA-Interim reanalysis: Configuration and performance of the data assimilation system. Q. J. R. Meteorol. Soc. 2011, 137. [Google Scholar] [CrossRef]
  16. Sommer, M.; Dirksen, R.; Rohden, C. Brief Description of the RS92 GRUAN Data Product (RS92-GDP); Technical Document 4; GRUAN Lead Centre: Geneva, Switzerland, 2006. [Google Scholar]
  17. Wang, J.; Zhang, L.; Dai, A.; Immler, F.; Sommer, M.; Vömel, H. Radiation dry bias correction of Vaisala RS92 humidity data and its impact on historical radiosonde data. J. Atmos. Ocean. Technol. 2013, 30, 197–214. [Google Scholar] [CrossRef]
  18. Sun, B.; Reale, A.; Seidel, D.J.; Hunt, D.C. Comparing radiosonde and COSMIC atmospheric profile data to quantify differences among radiosonde types and the effects of imperfect collocation on comparison statistics. J. Geophys. Res. 2010, 115. [Google Scholar] [CrossRef]
  19. Miloshevich, L.M.; Vömel, H.; Whiteman, D.; Lesht, B.; Schmidlin, F.J.; Russo, F. Absolute accuracy of water vapor measurements from six operational radiosonde types launched during AWEX-G and implications for AIRS validation. J. Geophys. Res. 2006, 111. [Google Scholar] [CrossRef]
  20. Anderson, P.S. Mechanism for the behavior of hydroactive materials used in humidity sensors. J. Atmos. Ocean. Technol. 1995, 12, 662–667. [Google Scholar] [CrossRef]
  21. Hyland, R.W.; Wexler, A. Formulations for the thermodynamic properties of the saturated phases of H2O from 173.15 K to 473.15 K. ASHRAE Trans. 1983, 89, 500–519. [Google Scholar]
  22. Met Office Joint WMO Technical Progress Report on the Global Data Processing and Forecasting System and Numerical Weather Prediction Research Activities for 2011. Available online: http://www.wmo.int/pages/prog/www/Documents/PublicWeb/www/gdpfs/GDPFS-NWP_Annualreports11/2011_UK.pdf (accessed on 15 July 2016).
  23. Kwon, E.-H.; Li, J.; Li, J.; Sohn, B.J.; Weisz, E. Use of total precipitable water classification of a priori error and quality control in atmospheric temperature and water vapor sounding retrieval. Adv. Atmos. Sci. 2012, 29, 263–273. [Google Scholar] [CrossRef]
  24. Kwon, E.-H.; Sohn, B.J.; Smith, W.L.; Li, J. Validating IASI temperature and moisture sounding retrievals over East Asia using radiosonde observations. J. Atmos. Ocean. Technol. 2012, 29, 1250–1262. [Google Scholar] [CrossRef]
  25. Hilton, F.I.; Newman, S.M.; Collard, A.D. Identification of NWP humidity biases using high-peaking water vapour channels from IASI. Atmos. Sci. Let. 2012, 13, 73–78. [Google Scholar] [CrossRef]
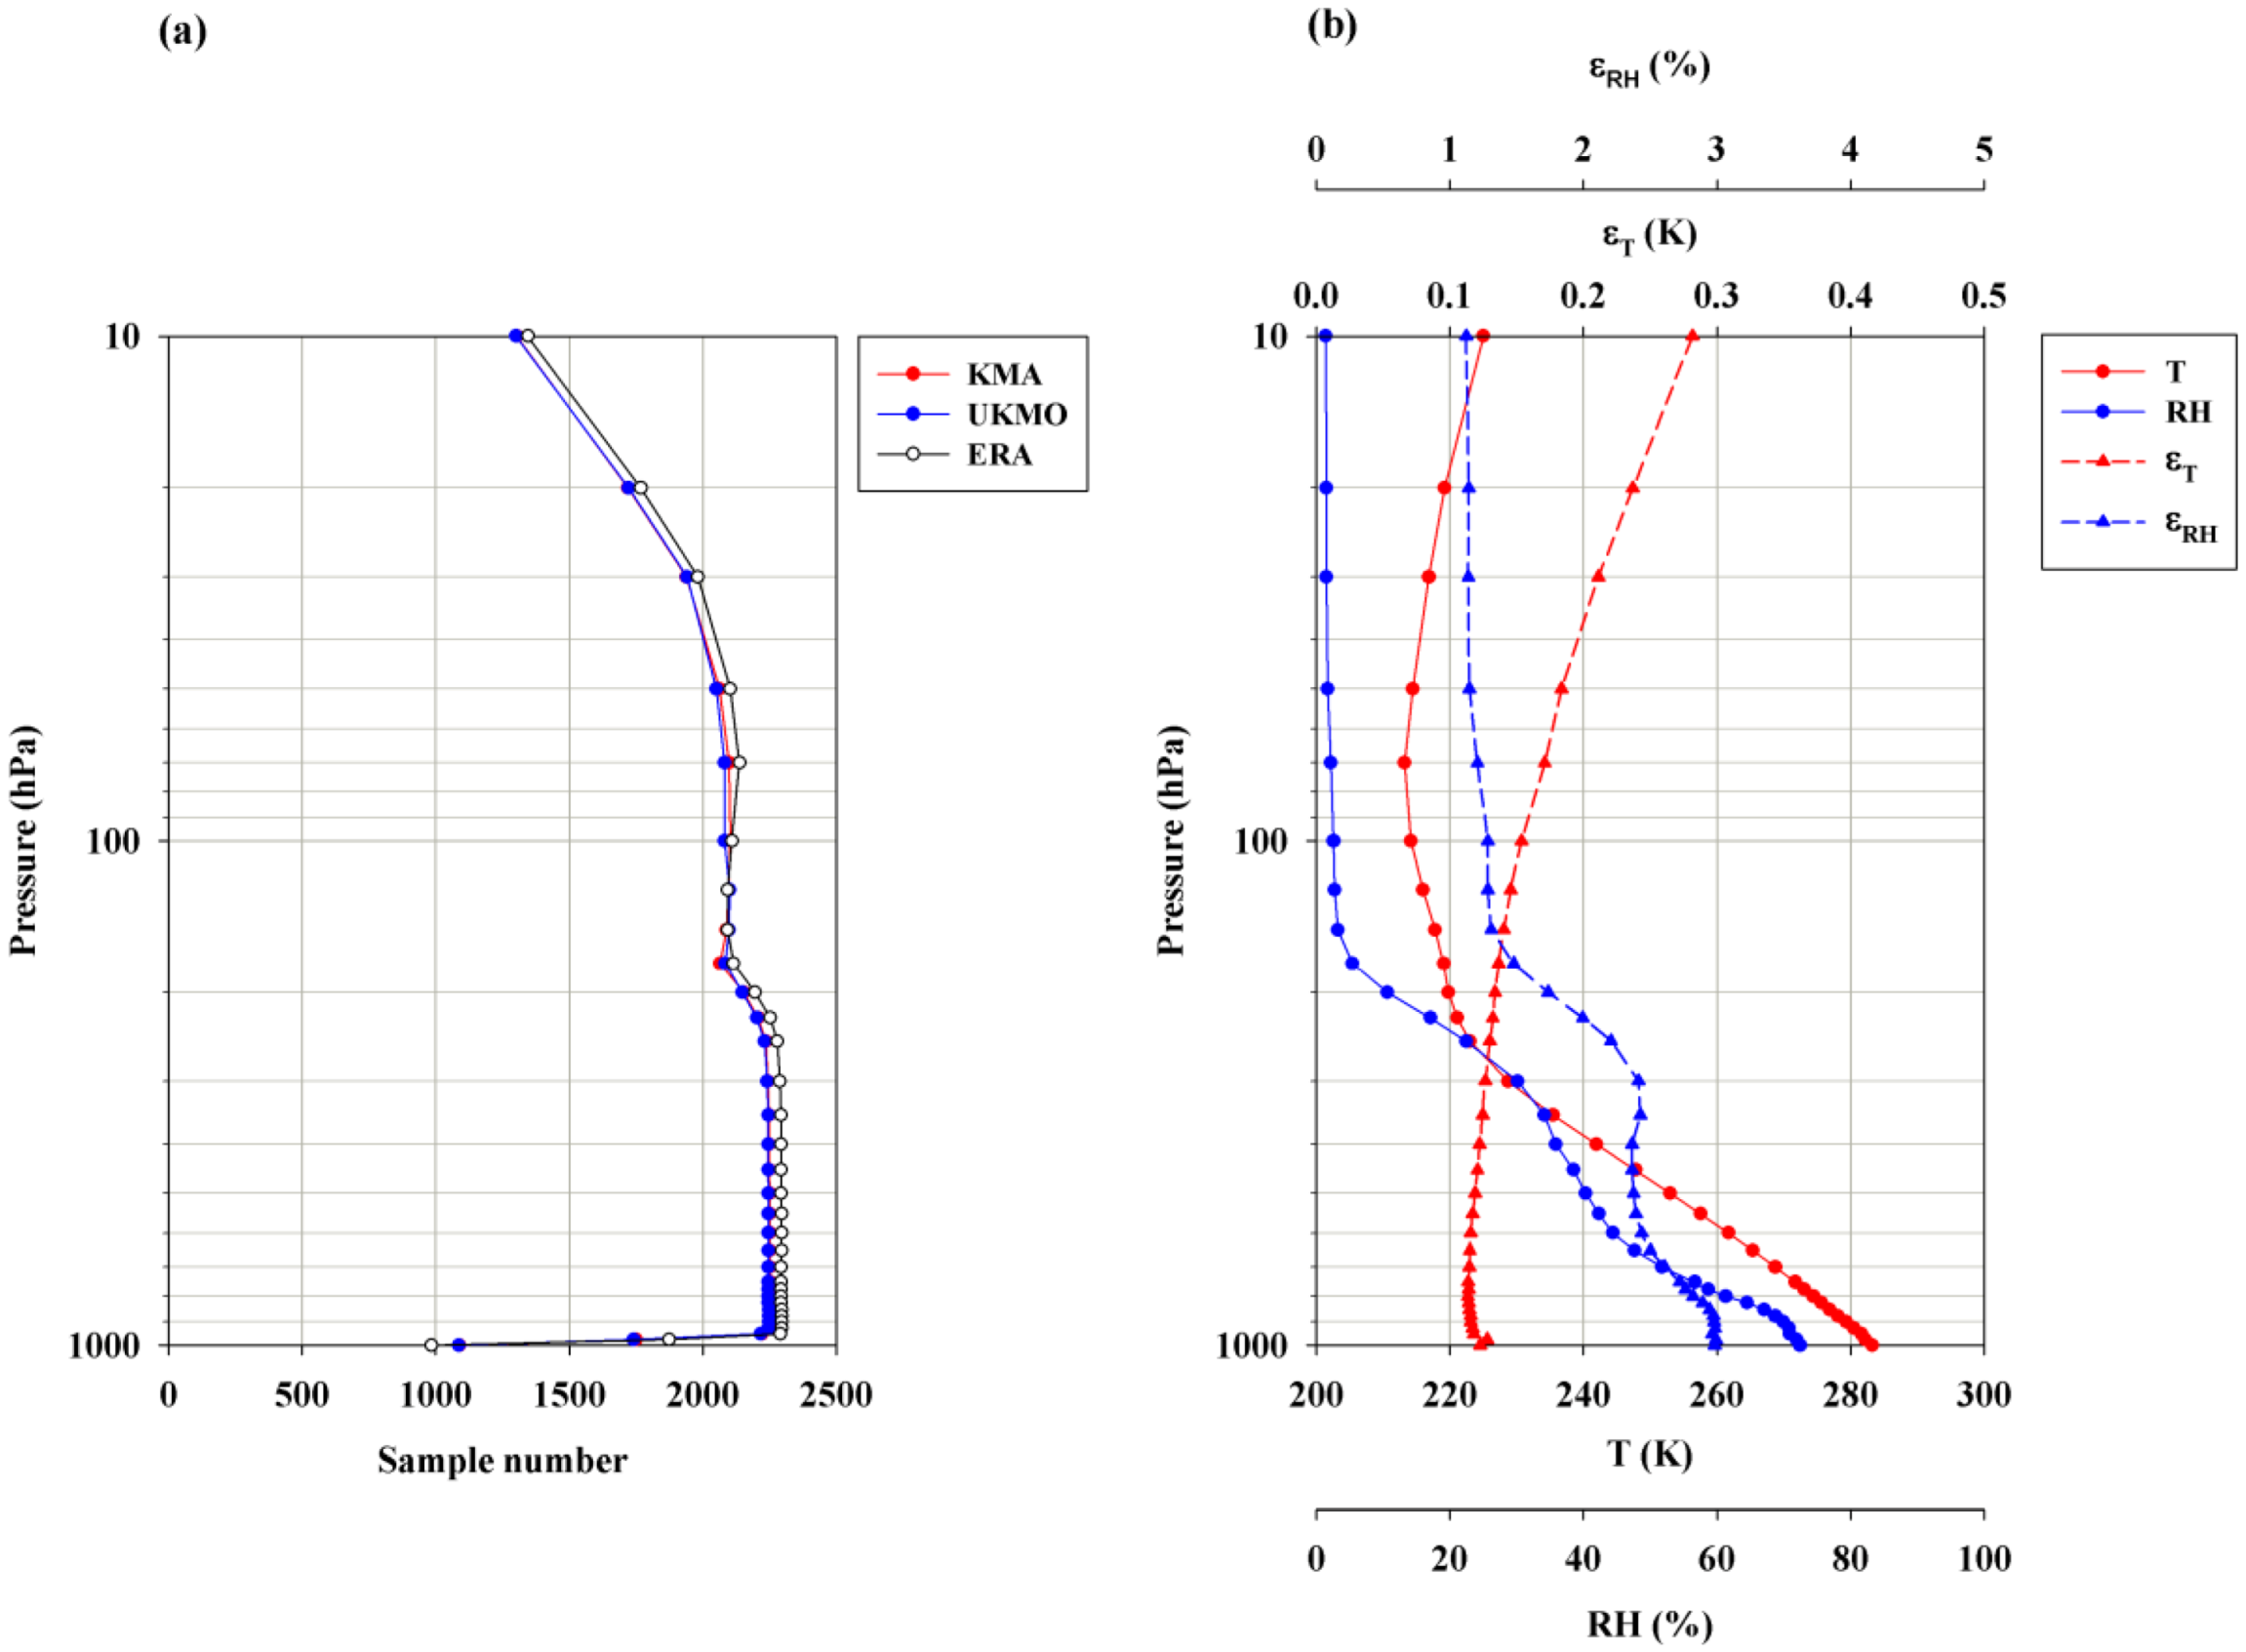
Figure 1. (a) Number of collocated data from the radiosonde observations and numerical weather prediction (NWP) model outputs from the Korea Meteorological Administration (UM-KMA), United Kingdom Met Office (UM-UKMO), and European Centre for Medium-Range Weather Forecasts Interim reanalysis data (ERA-I), and (b) mean temperature (T) and relative humidity (RH) (solid lines with dots) and associated mean uncertainties (εT for temperature and εRH for relative humidity; dashed lines with triangles) profiles from GRUAN observations.
Atmosphere 07 00094 g001
Figure 2. Vertical distributions of the mean biases (a) of the temperature, relative humidity, and normalized relative humidity for UM-KMA, UM-UKMO, and ERA-I. Their related root mean square differences (RMSDs) (b) are shown in the three panels.
Atmosphere 07 00094 g002
Figure 3. Scatter plots of the relative humidity from the Korea Meteorological Administration model (UM-KMA) versus the United Kingdom Met Office model (UM-UKMO) for (a) 200, (b) 250, (c) 300, and (d) 350 hPa in January–May. The dashed lines represent the perfect matches.
Atmosphere 07 00094 g003
Figure 4. Scatter plots of the relative humidity from the Korea Meteorological Administration model (UM-KMA) versus the United Kingdom Met Office model (UM-UKMO) for (a) 200, (b) 250, (c) 300, and (d) 350 hPa in June–December 2012. The dashed lines represent the perfect matches.
Atmosphere 07 00094 g004
Figure 5. Error statistics of the Korea Meteorological Administration model (UM-KMA) temperature and relative humidity profiles classified according to the total precipitable water between the surface and 100 hPa (TPW, in kg·m−2). (a) Bias and (b) RMSD.
Atmosphere 07 00094 g005
Figure 6. Vertical distribution of the standard deviation of the radiosonde relative humidity profiles classified according to the total precipitable water (TPW in kg·m−2) between the surface and 100 hPa.
Atmosphere 07 00094 g006
Figure 7. Error statistics of the United Kingdom Met Office model (UM-UKMO) temperature and relative humidity profiles classified according to the total precipitable water between the surface and 100 hPa (TPW, in kg·m−2). (a) Bias and (b) RMSD.
Atmosphere 07 00094 g007
Figure 8. Error statistics of the European Centre for Medium-Range Weather Forecasts Interim reanalysis (ERA-Interim) temperature and relative humidity profiles classified according to the total precipitable water between the surface and 100 hPa (TPW, in kg·m−2). (a) Bias and (b) RMSD.
Atmosphere 07 00094 g008aAtmosphere 07 00094 g008b
Table 1. Information on the Global Climate Observing System Reference Upper-Air Network (GRUAN) radiosonde sites used in this study. Numbers given with names are WMO station numbers used for the GTS.
CodeNameCountryLocationInternational Name
LatitudeLongitudeAltitude
CABCabauw (06260)Netherlands51.97°4.92°1 mCabauw (De Bilt) Experimental Site for Atmospheric Research (CESAR)
LINLindenberg (10393)Germany52.21°14.12°110 mLindenberg Meteorological Observatory
MANManusPapua New Guinea−2.06°147.42°6 mTropical Western Pacific (TWP) Manus Site
NAUNauru (91532)Nauru−0.52°166.92°7 mTropical Western Pacific (TWP) Nauru Site
NYANy-Ålesund (01004)Norway78.92°11.92°5 mAWIPEV Research Base
PAYPayerne (06610)Switzerland46.81°6.95°491 mMeteoSwiss Aerological station Payerne
SGPLamont (74646)USA36.6°−97.49°320 mSouthern Great Plains (SGP) Central Facility
SODSodankyla (20386)Finland67.37°26.63°179 mFinnish Meteorological Institute Arctic Research Centre
TATTateno (47646)Japan36.06°140.13°31 mTateno Aerological Observatory