
The Role of Aerosol-Cloud-Radiation Interactions in Regional Air Quality—A NU-WRF Study over the United States

Abstract
:1. Introduction
2. NU-WRF Modeling System, Set-up, and Experiment Design

| Experiment | Feedbacks Included | Simulation Results |
|---|---|---|
| NoACR | No aerosol-cloud-radiation interactions | f0 |
| AC | Aerosol-cloud interaction only | fAC |
| AR | Aerosol-radiation interaction only | fAR |
| ACR | Aerosol-cloud-radiation interactions | fACR |
3. Results and Discussions
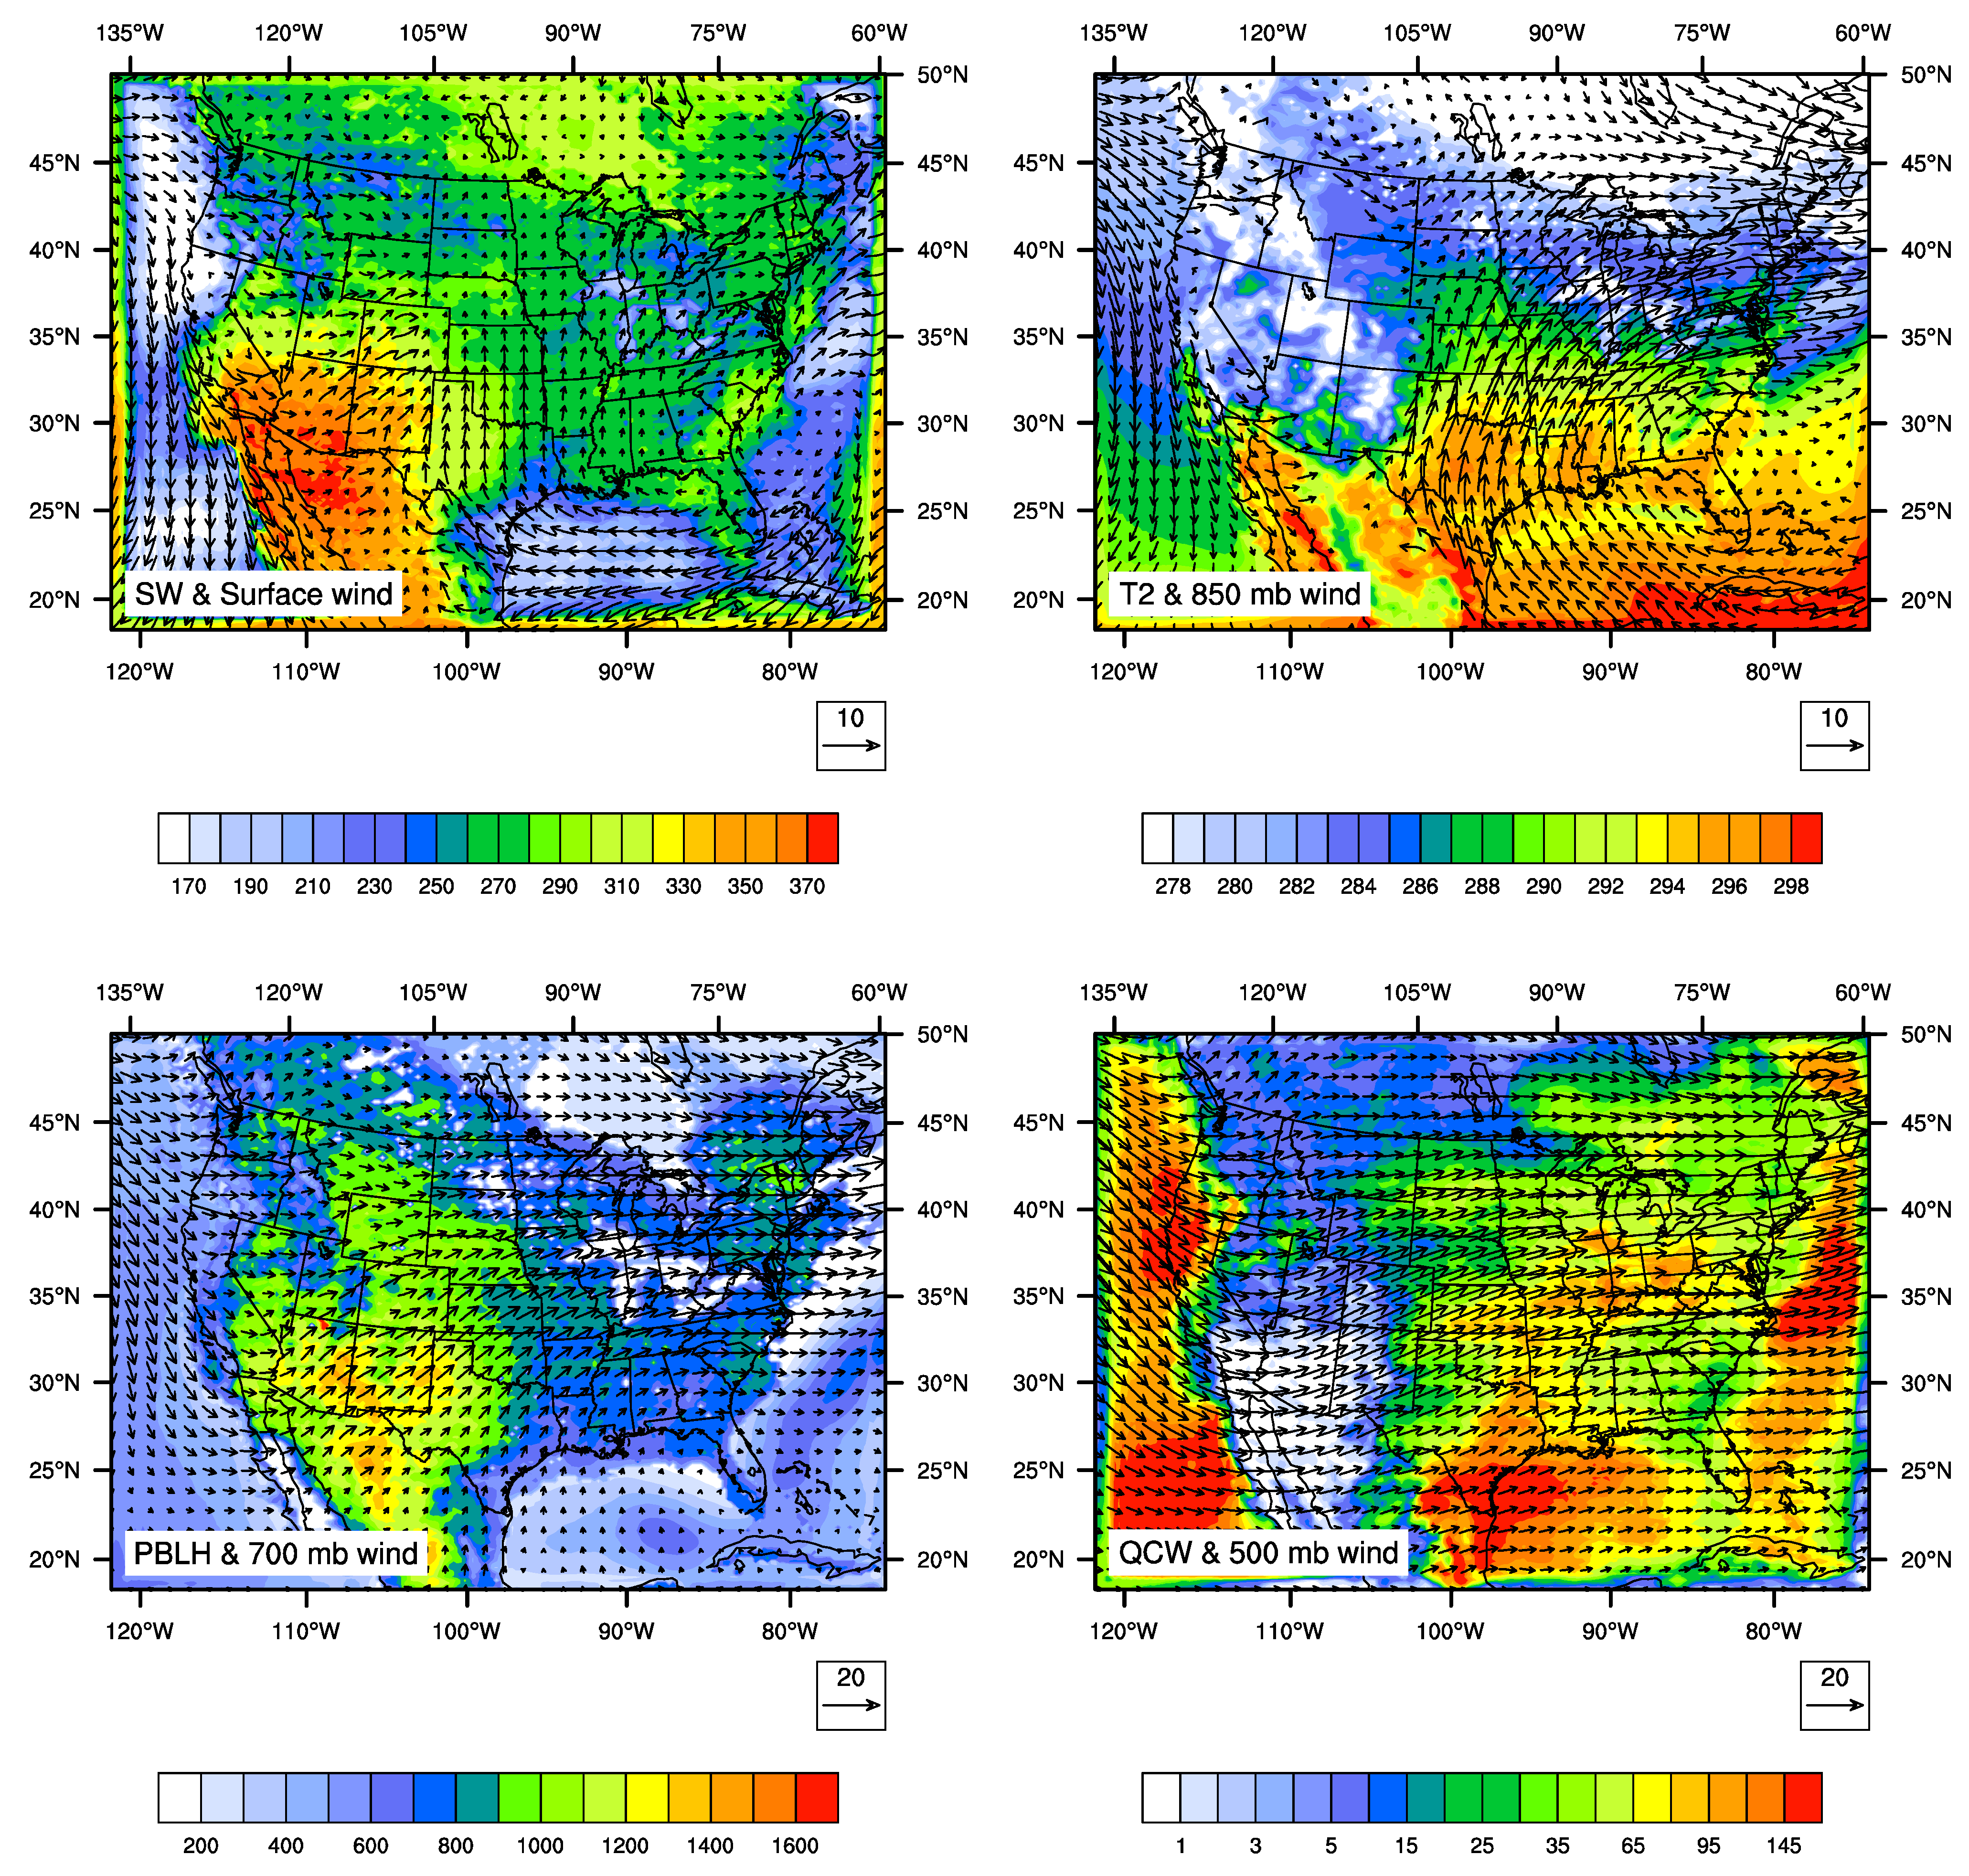
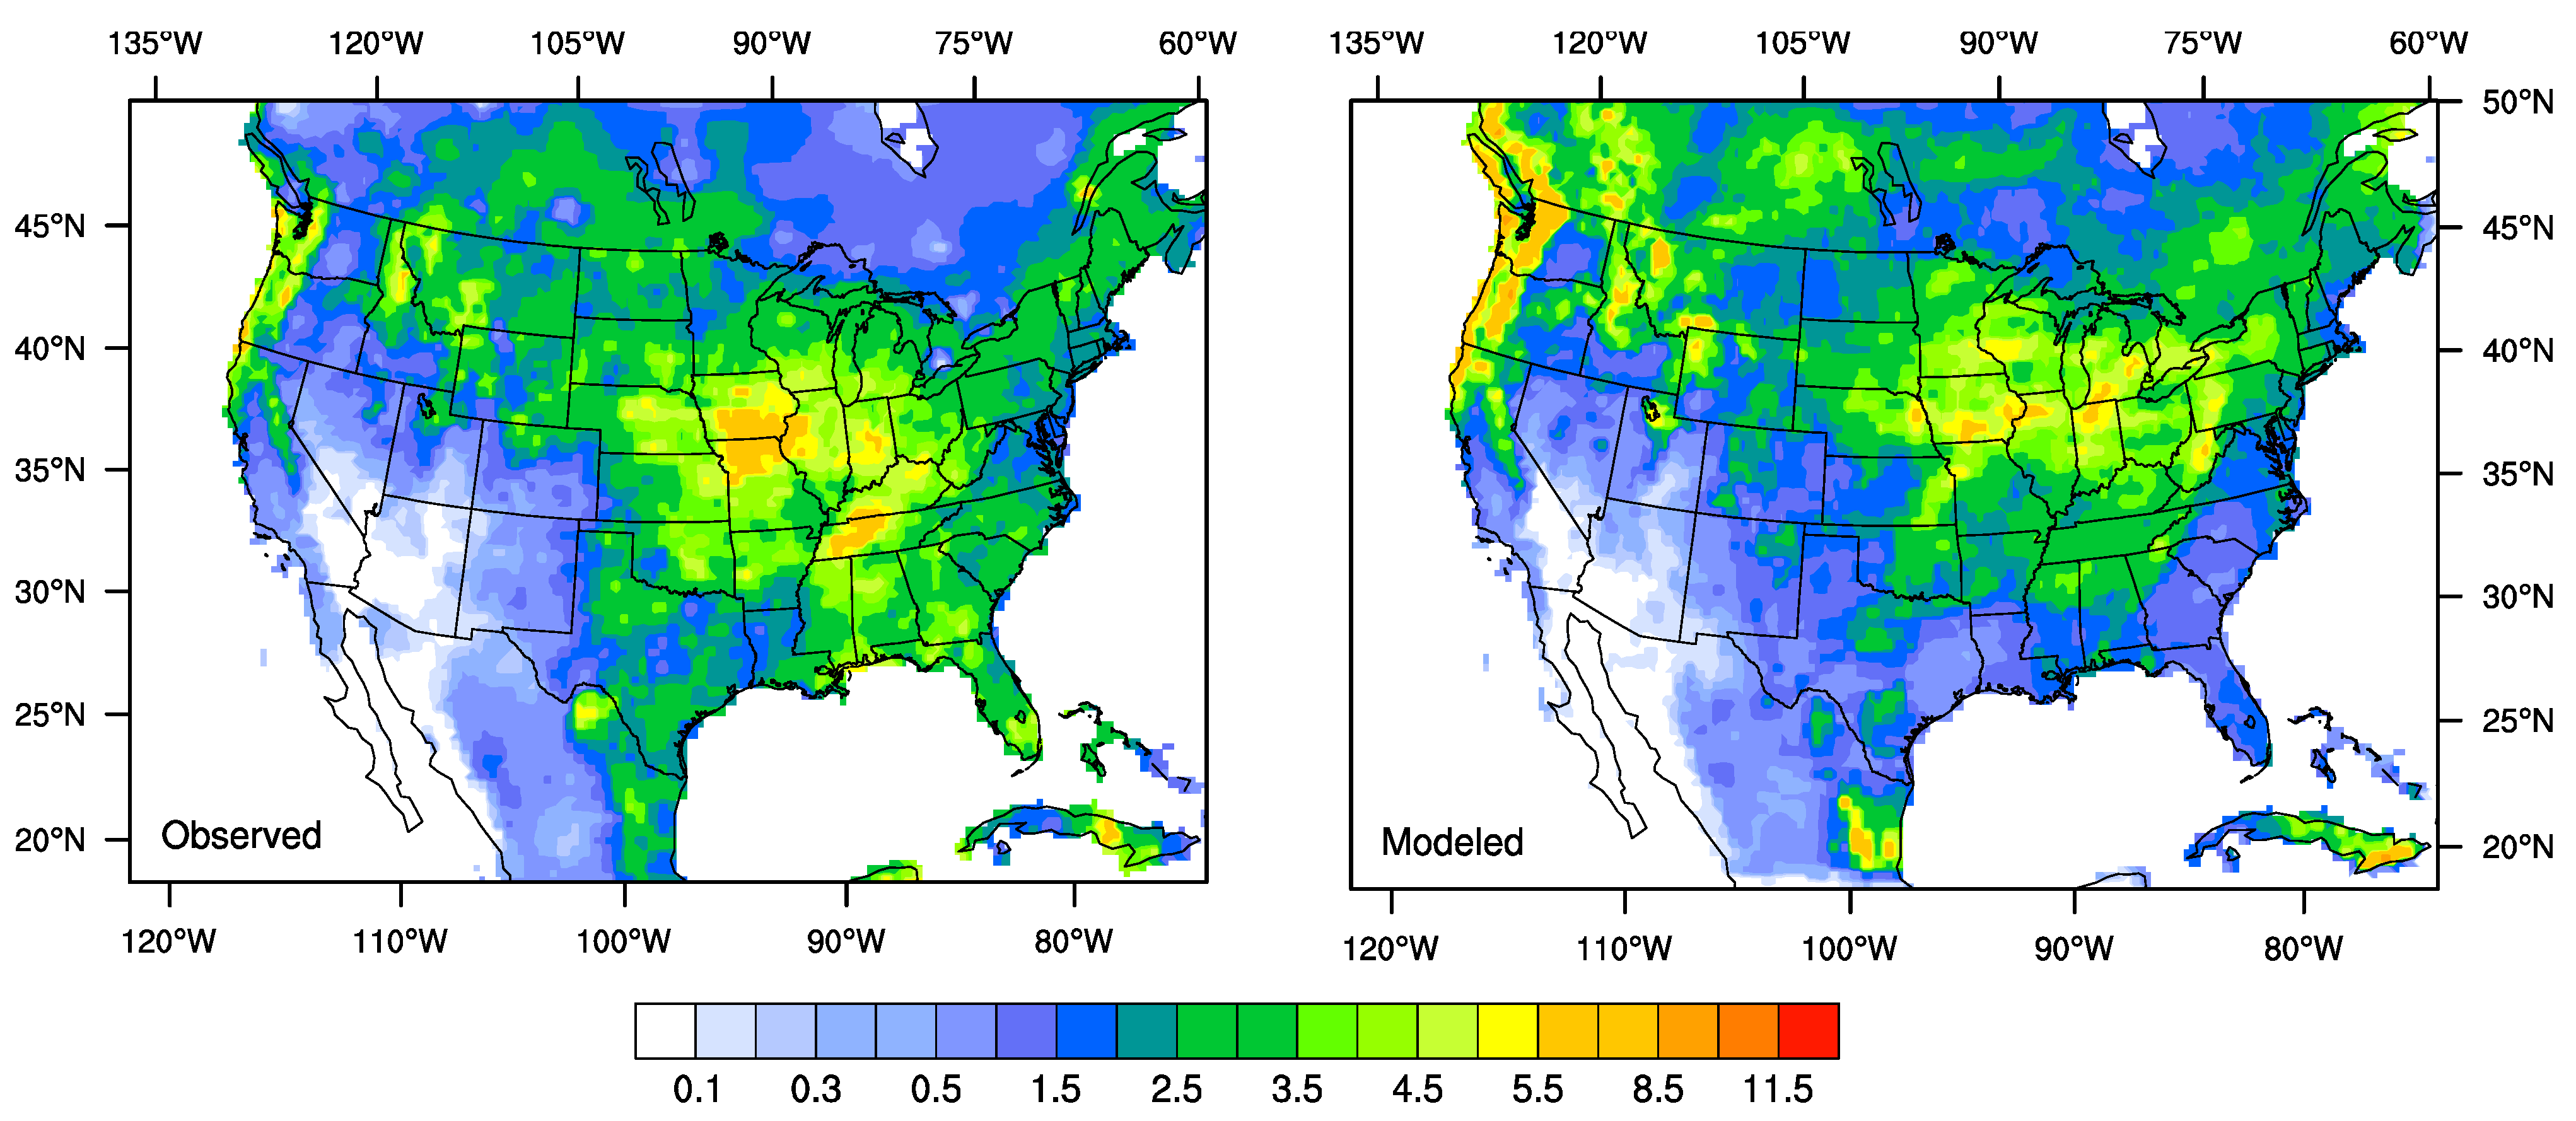
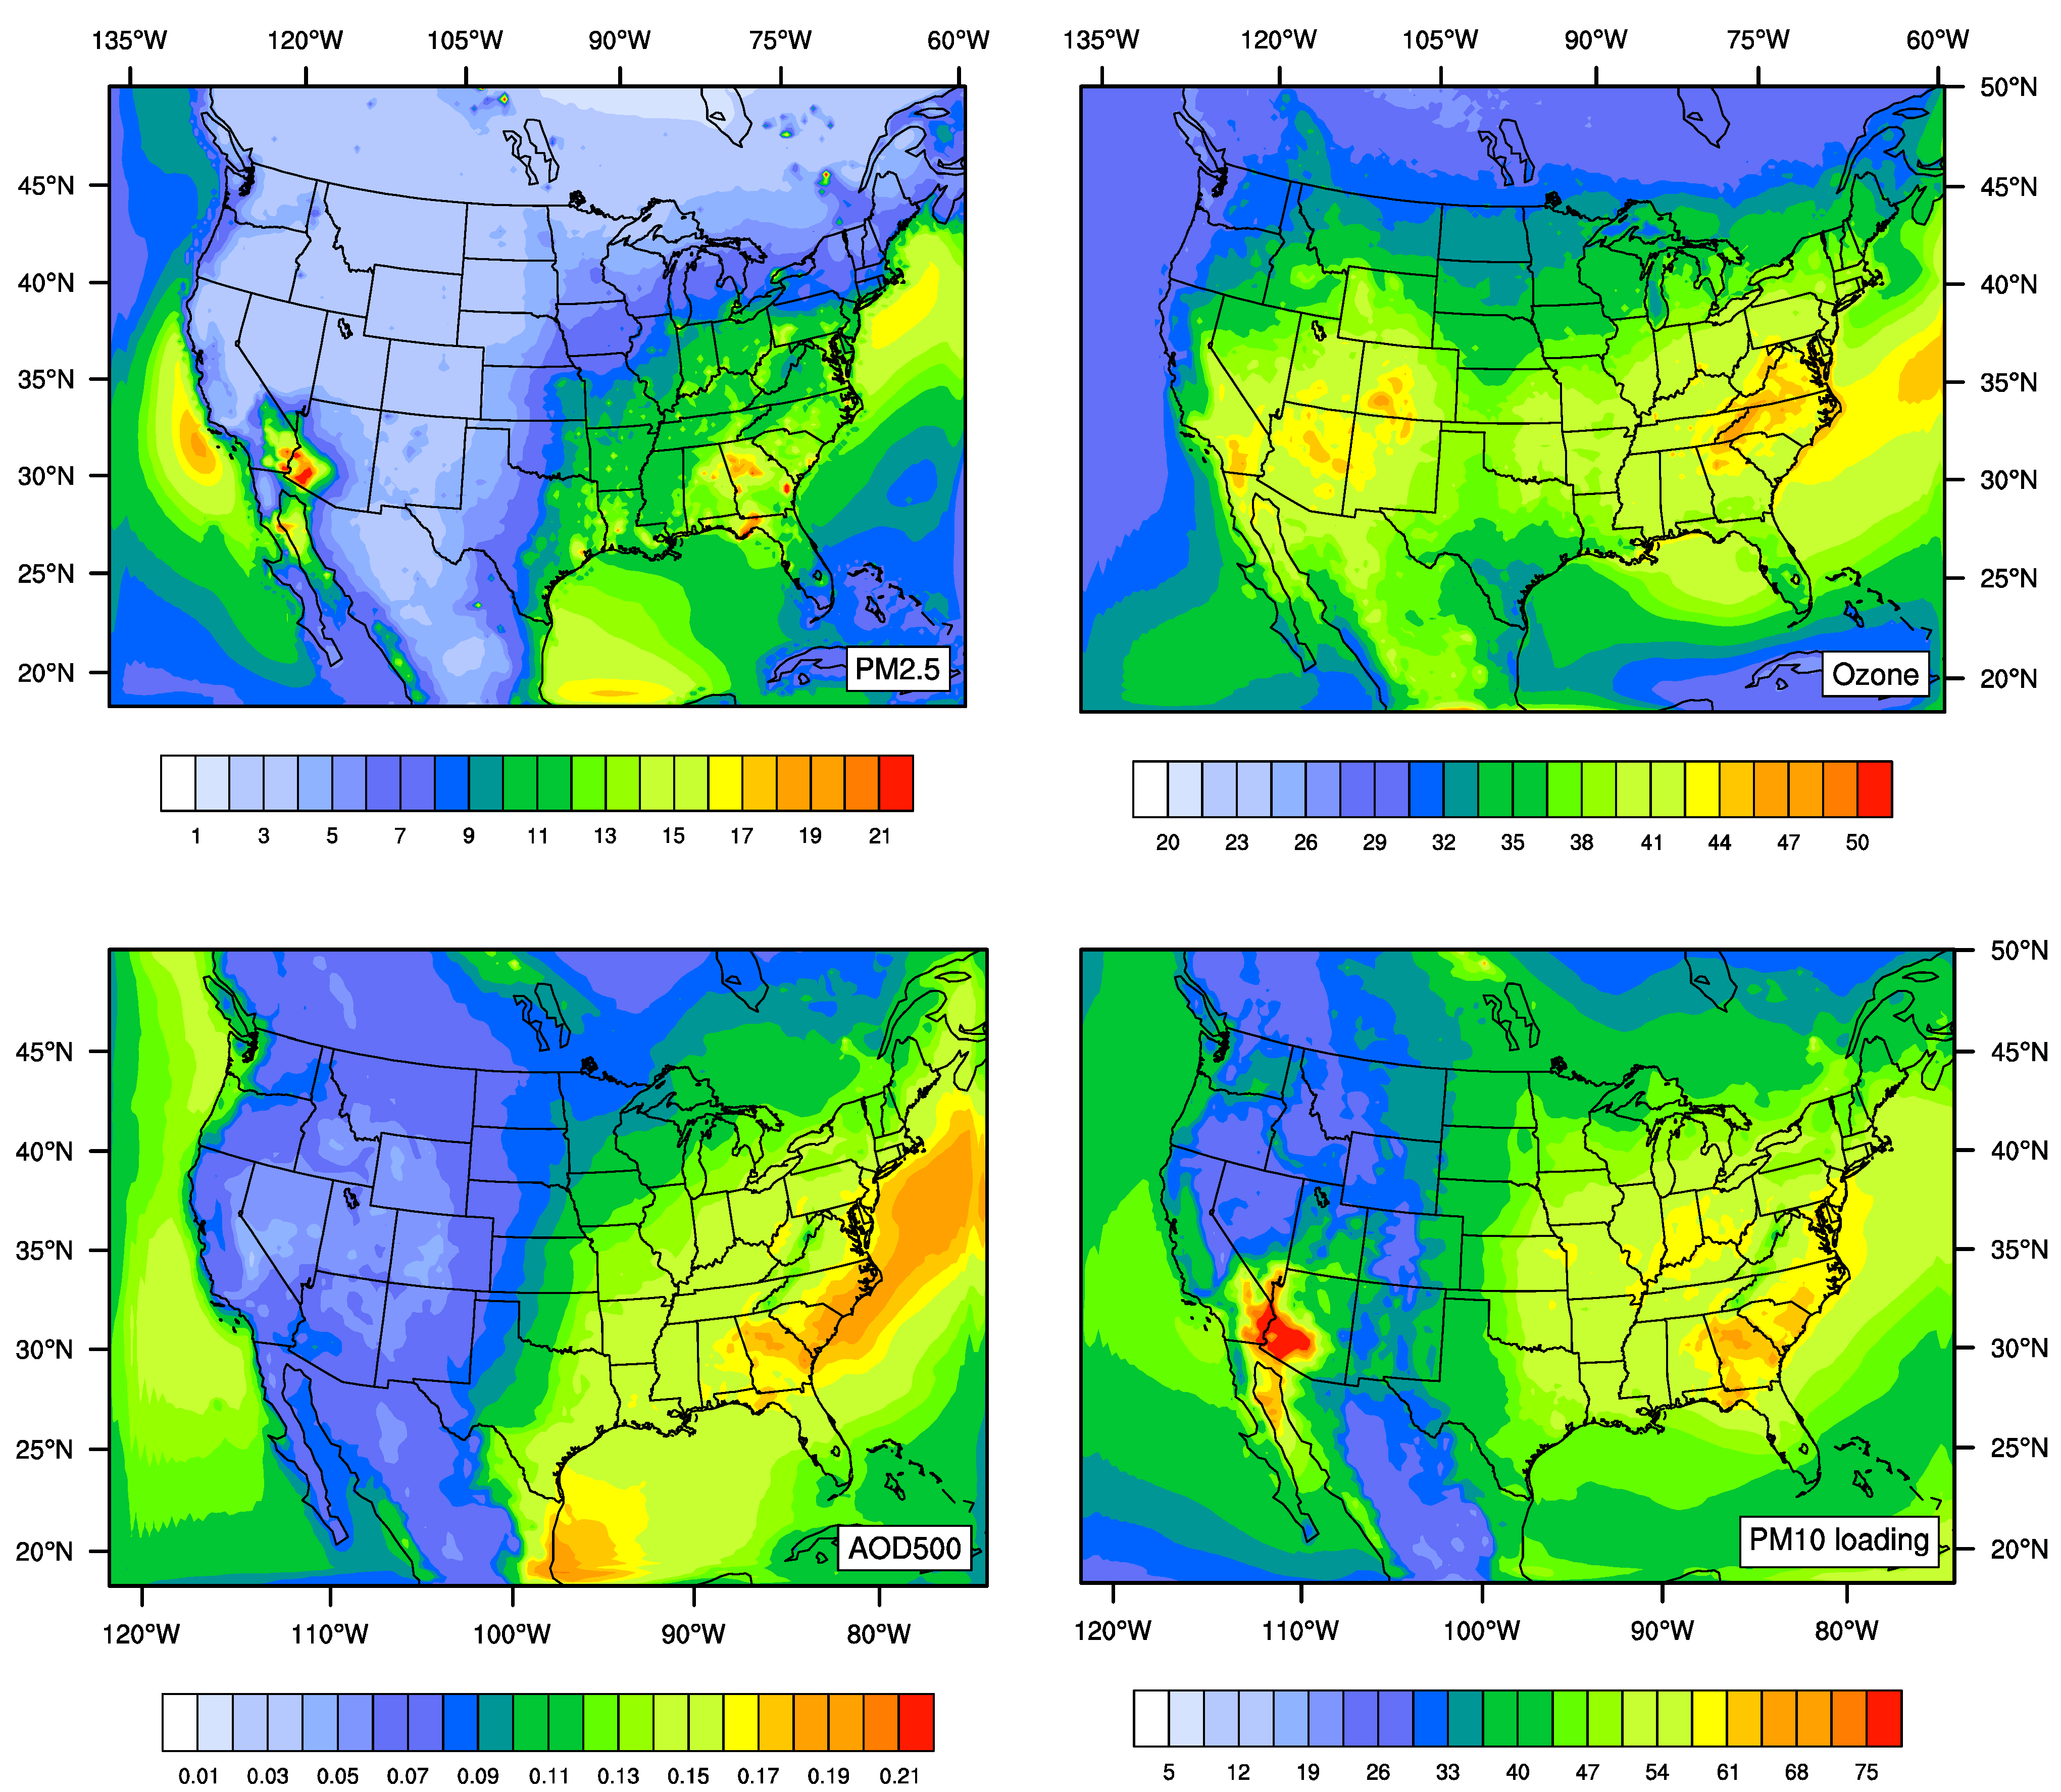
3.1 Control Experiment (NoACR or f0) and Model Evaluation


| Species | Number of Grid Cells | Normalized Bias (%) | Normalized Gross Error (%) | ||
|---|---|---|---|---|---|
| Range | Domain | Range | Domain | ||
| Control (Exp. NoACR) | |||||
| Ozone | 883 | −28.2~31.6 | −3.3 | 11.8~31.6 | 18.2 |
| PM2.5 | 458 | −68.7~174.4 | 21.6 | 33.1~176.6 | 60.1 |
| AOD | 45 | −65.6~20.8 | −20.7 | 19.4~65.6 | 43.1 |
| Exp. ACR | |||||
| Ozone | 883 | −28.2~28.0 | −2.8 | 11.9~29.7 | 18.8 |
| PM2.5 | 458 | −68.3~176.6 | 23.4 | 35.0~178.8 | 61.3 |
| AOD | 45 | −65.6~19.7 | −19.6 | 19.3~65.6 | 43.1 |
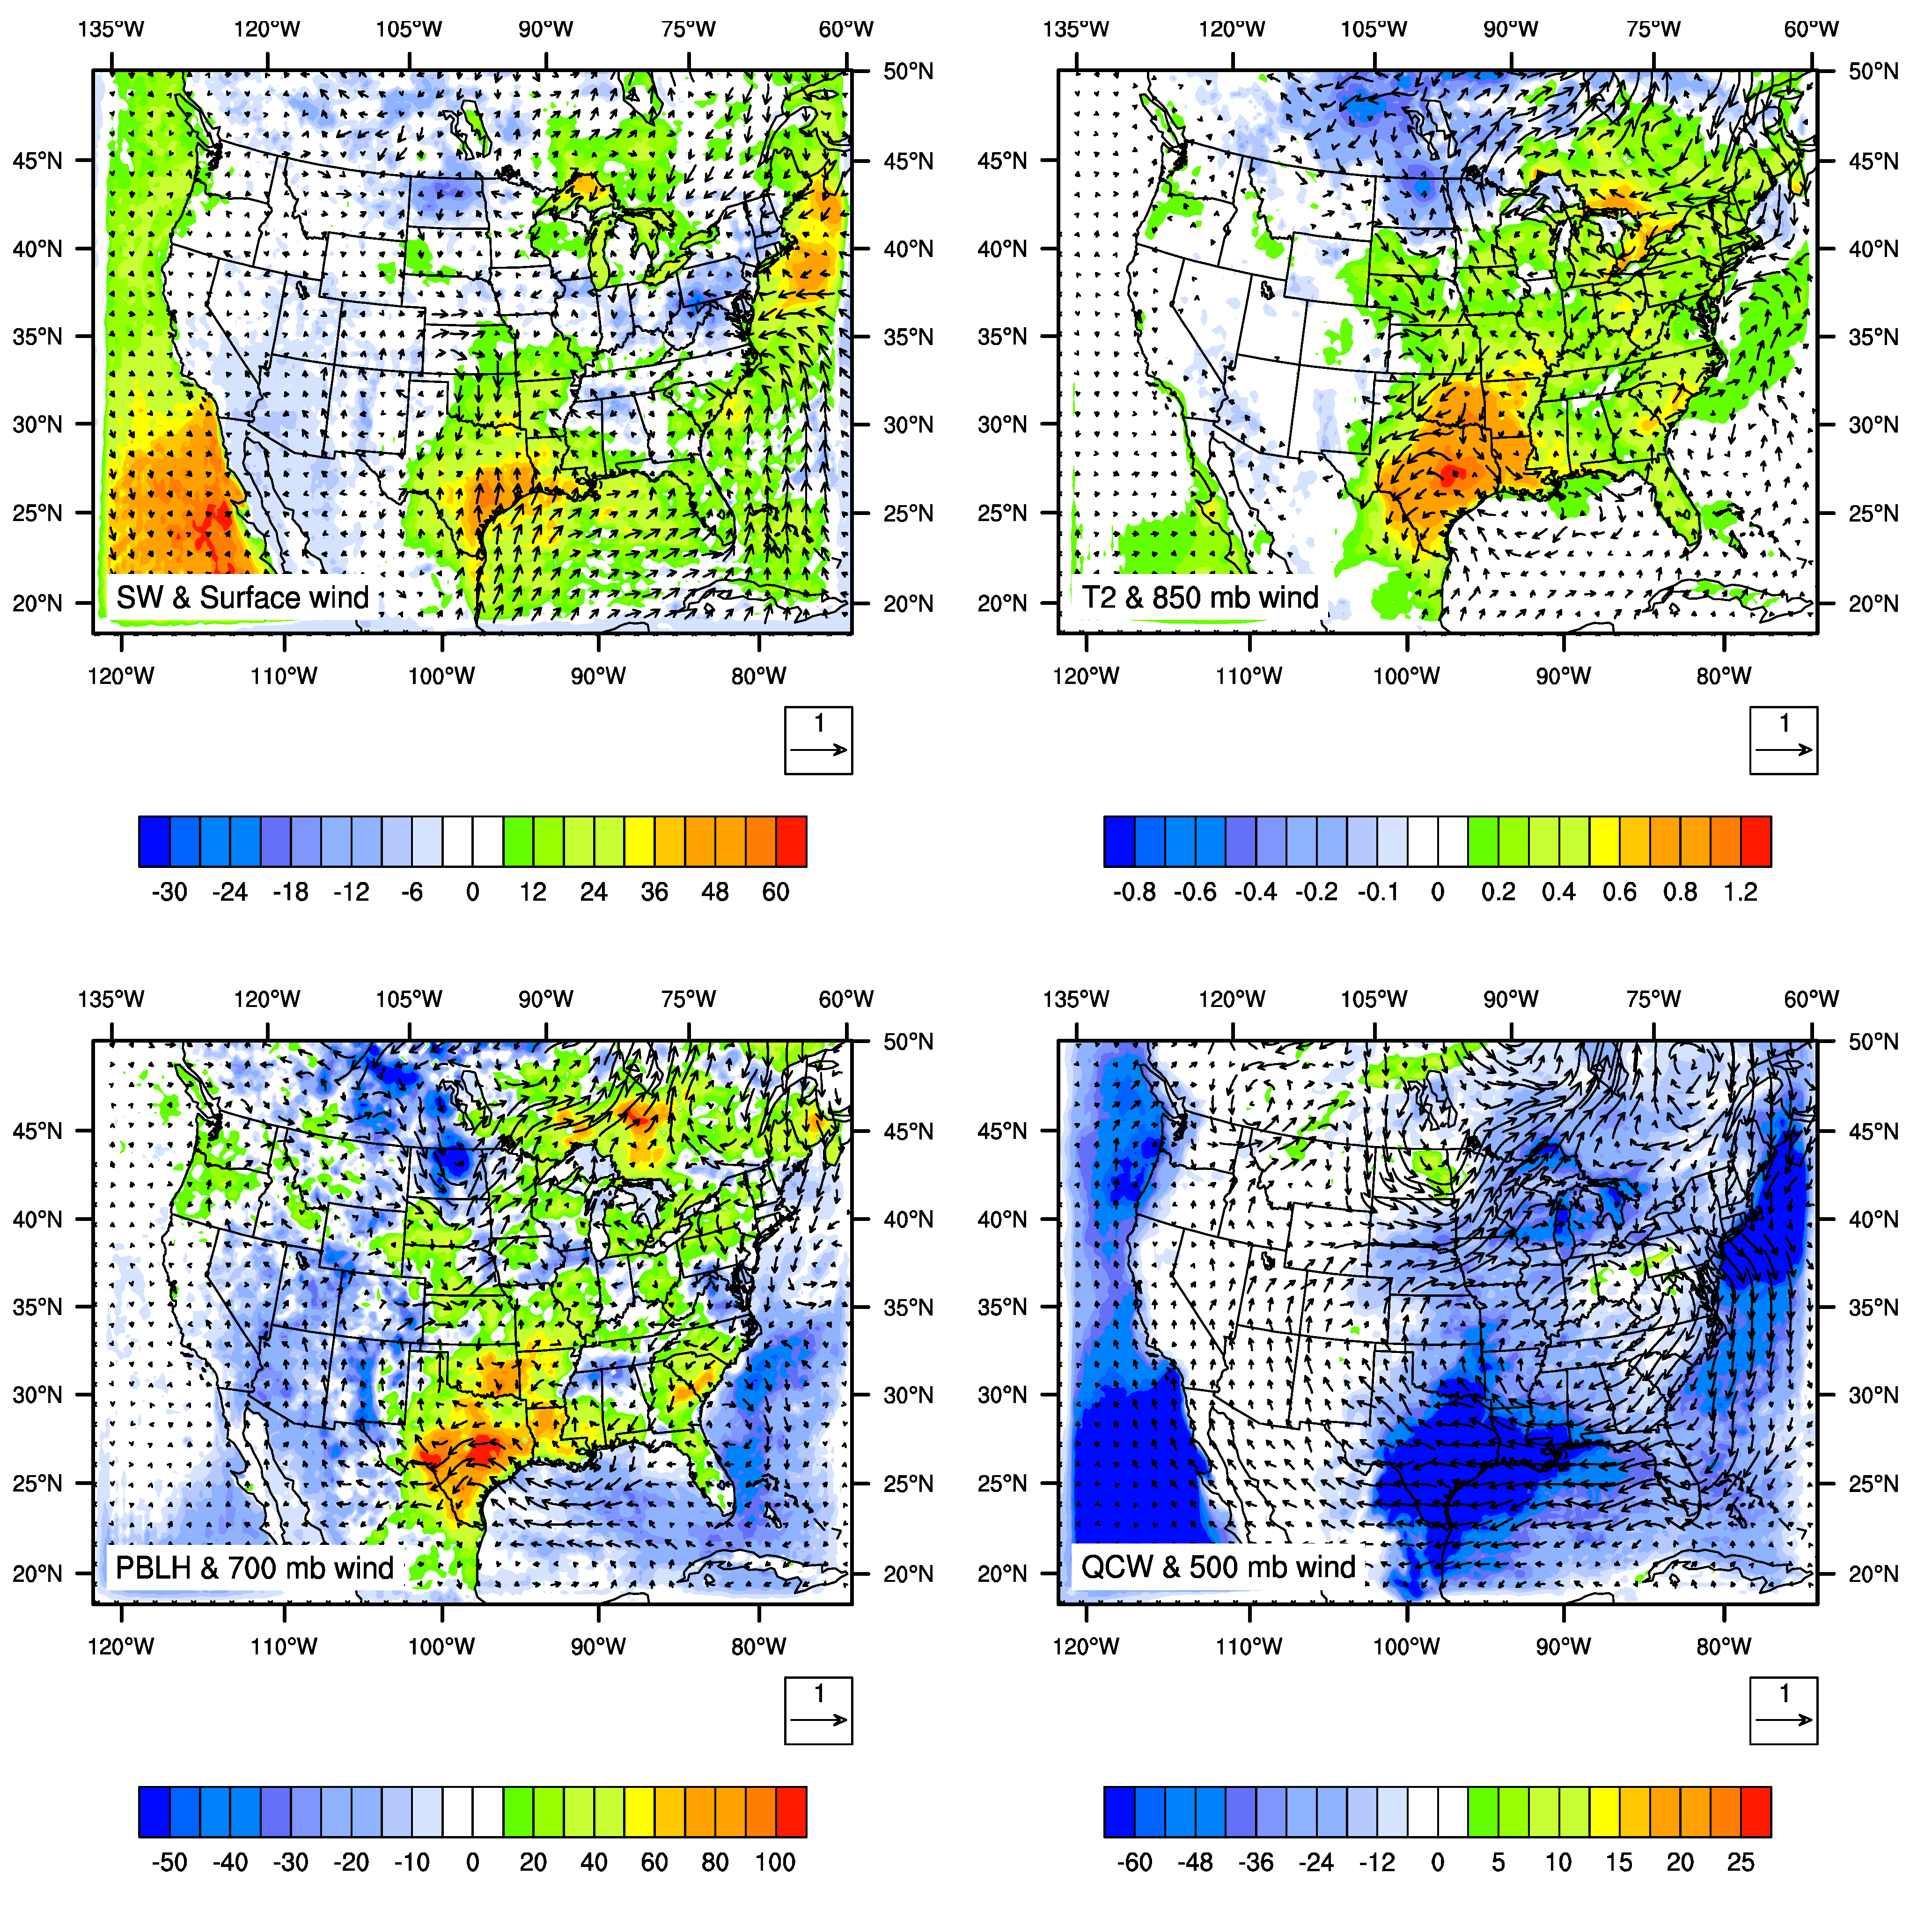
3.2. Impact on Meteorology
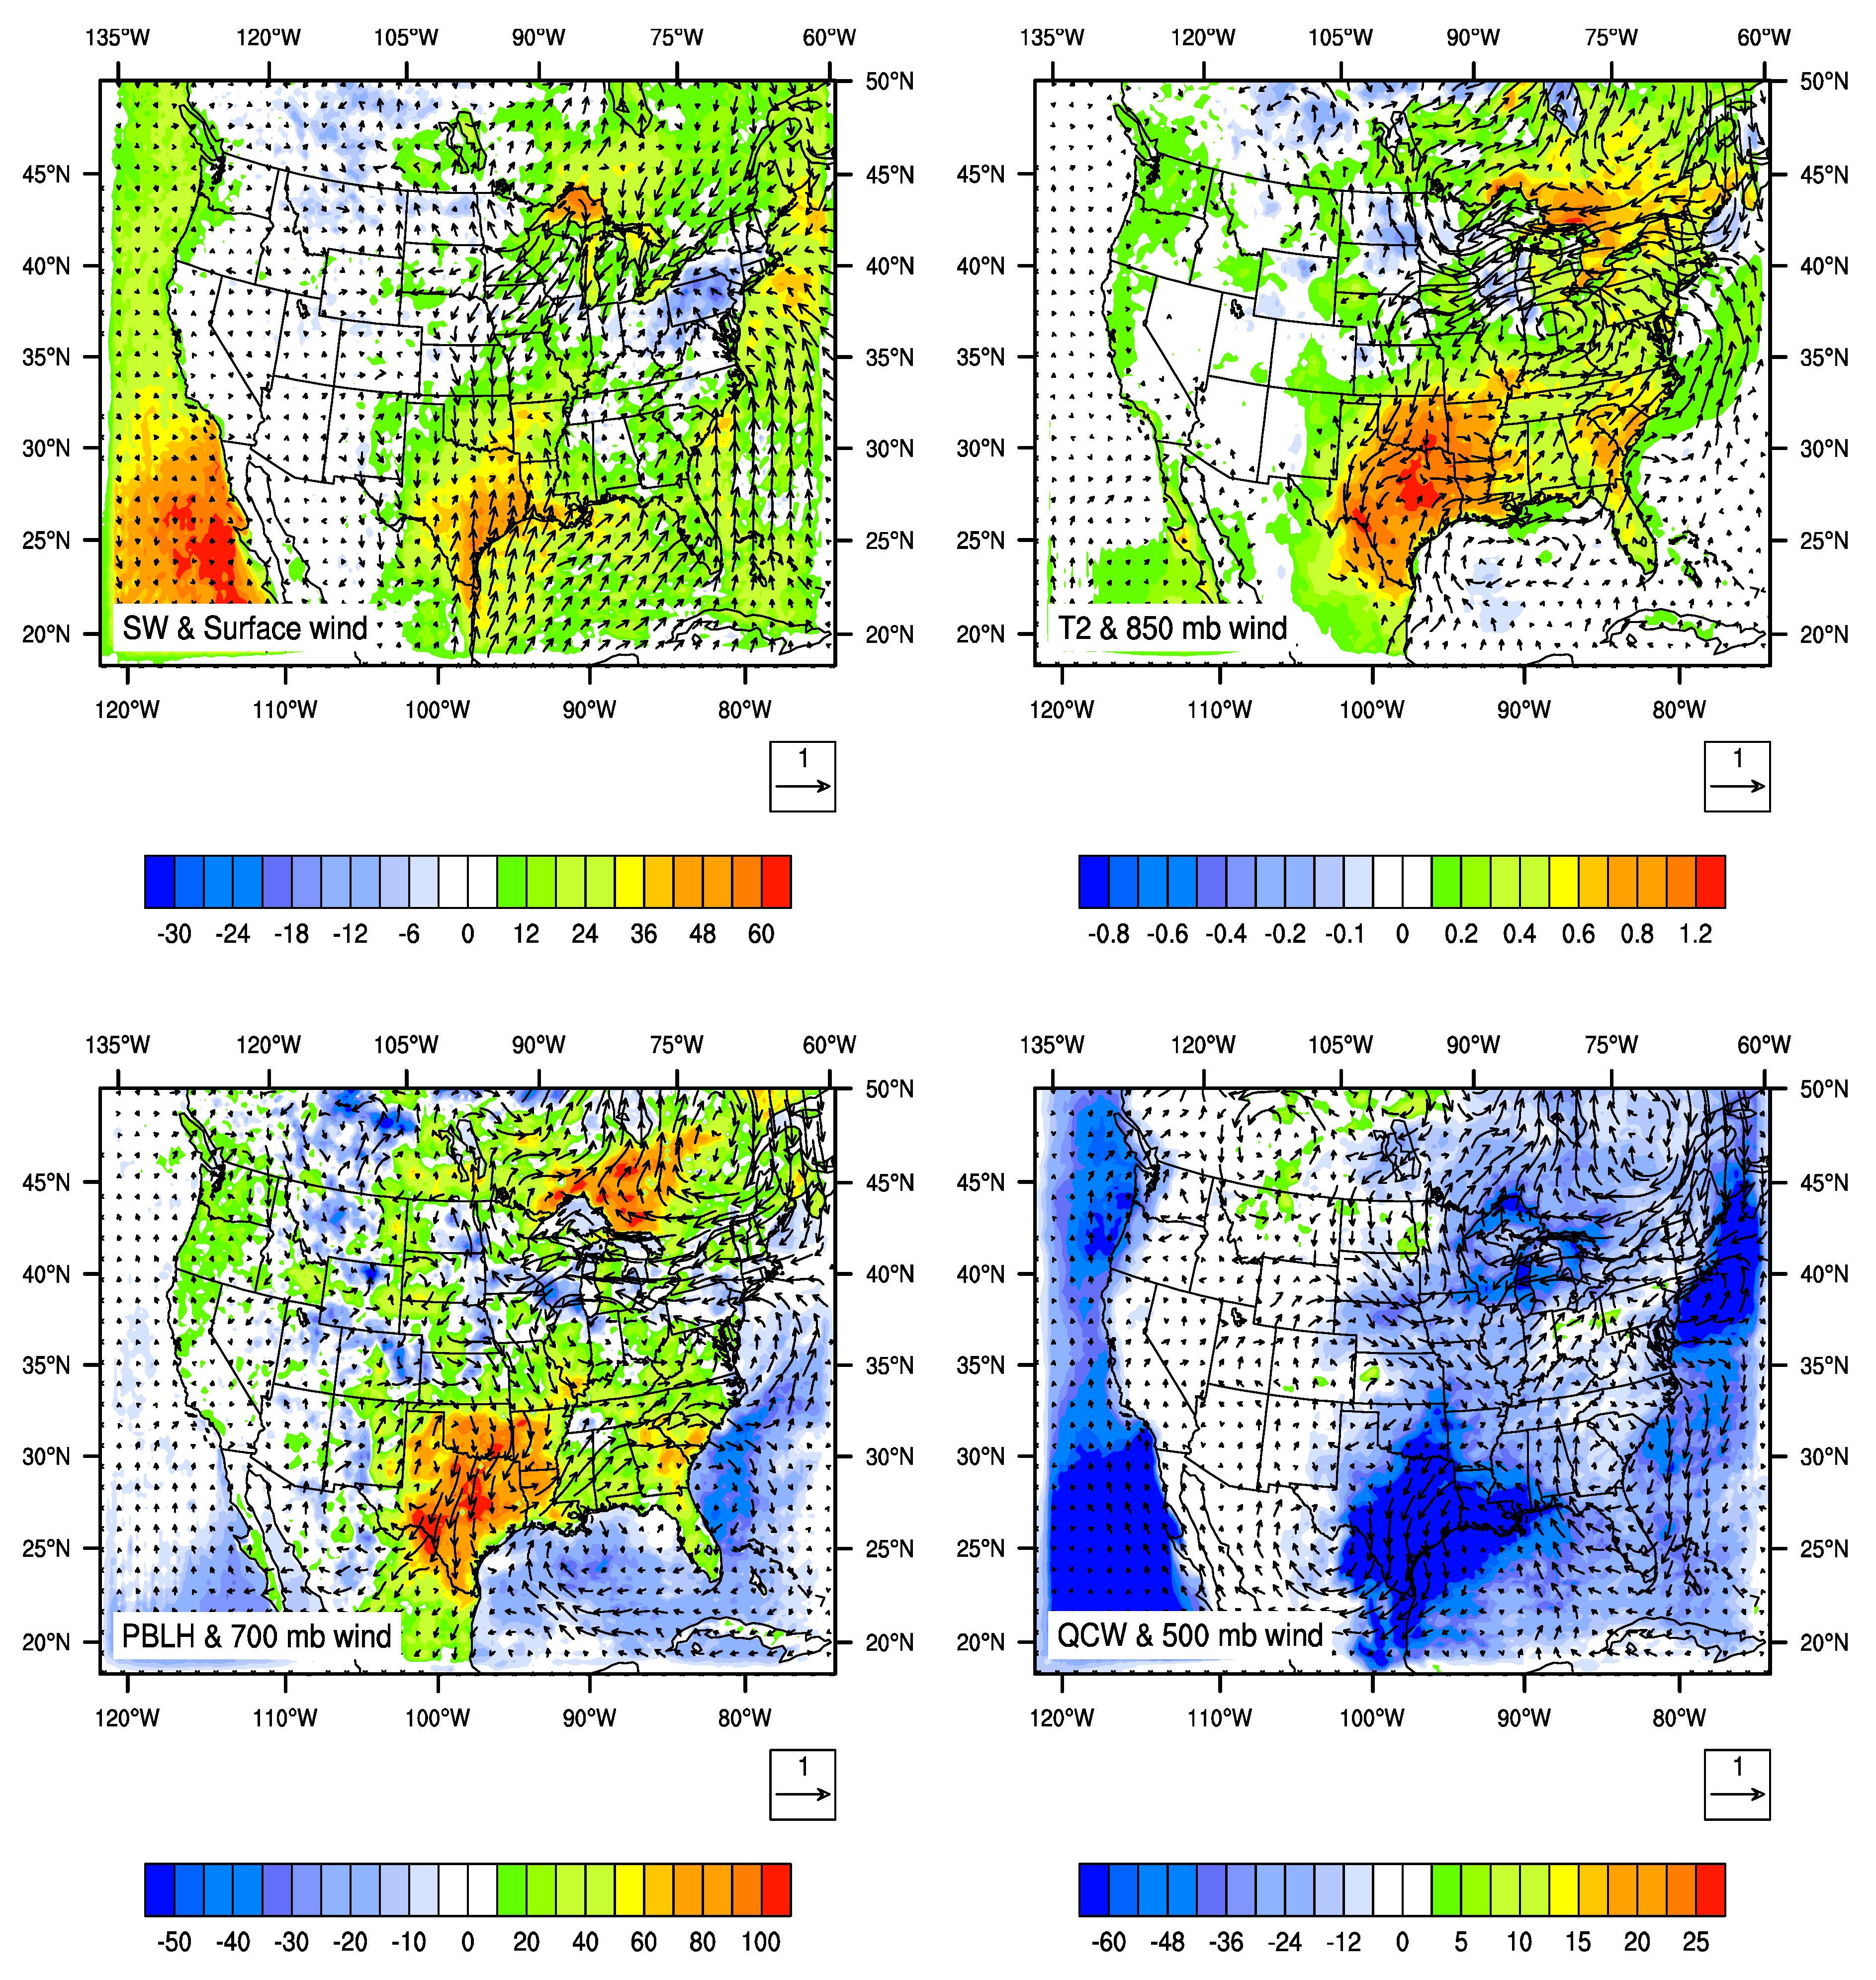
3.2.1. Overall Effect of Aerosol-Cloud-Radiation Interactions (ACR)

| SW | QCW | T2 | PBLH | Wind at 850 mb | Wind at 500 mb | |
|---|---|---|---|---|---|---|
| ACR | 8.16 (W·m−2) | −25.3 (g·m−2) | 0.10 (K) | 0.39 (m) | −0.054 (m·s−1) | −0.052 (m·s−1) |
| AC (%) | 73.4 | −95.6 | 69.2 | 51.2 | −57.9 | −57.7 |
| AR (%) | −25.5 | 2.6 | −26.9 | −48.7 | −17.3 | −17.7 |
| SYN (%) | 1.1 | −1.8 | −3.9 | 0.1 | 24.8 | 24.6 |
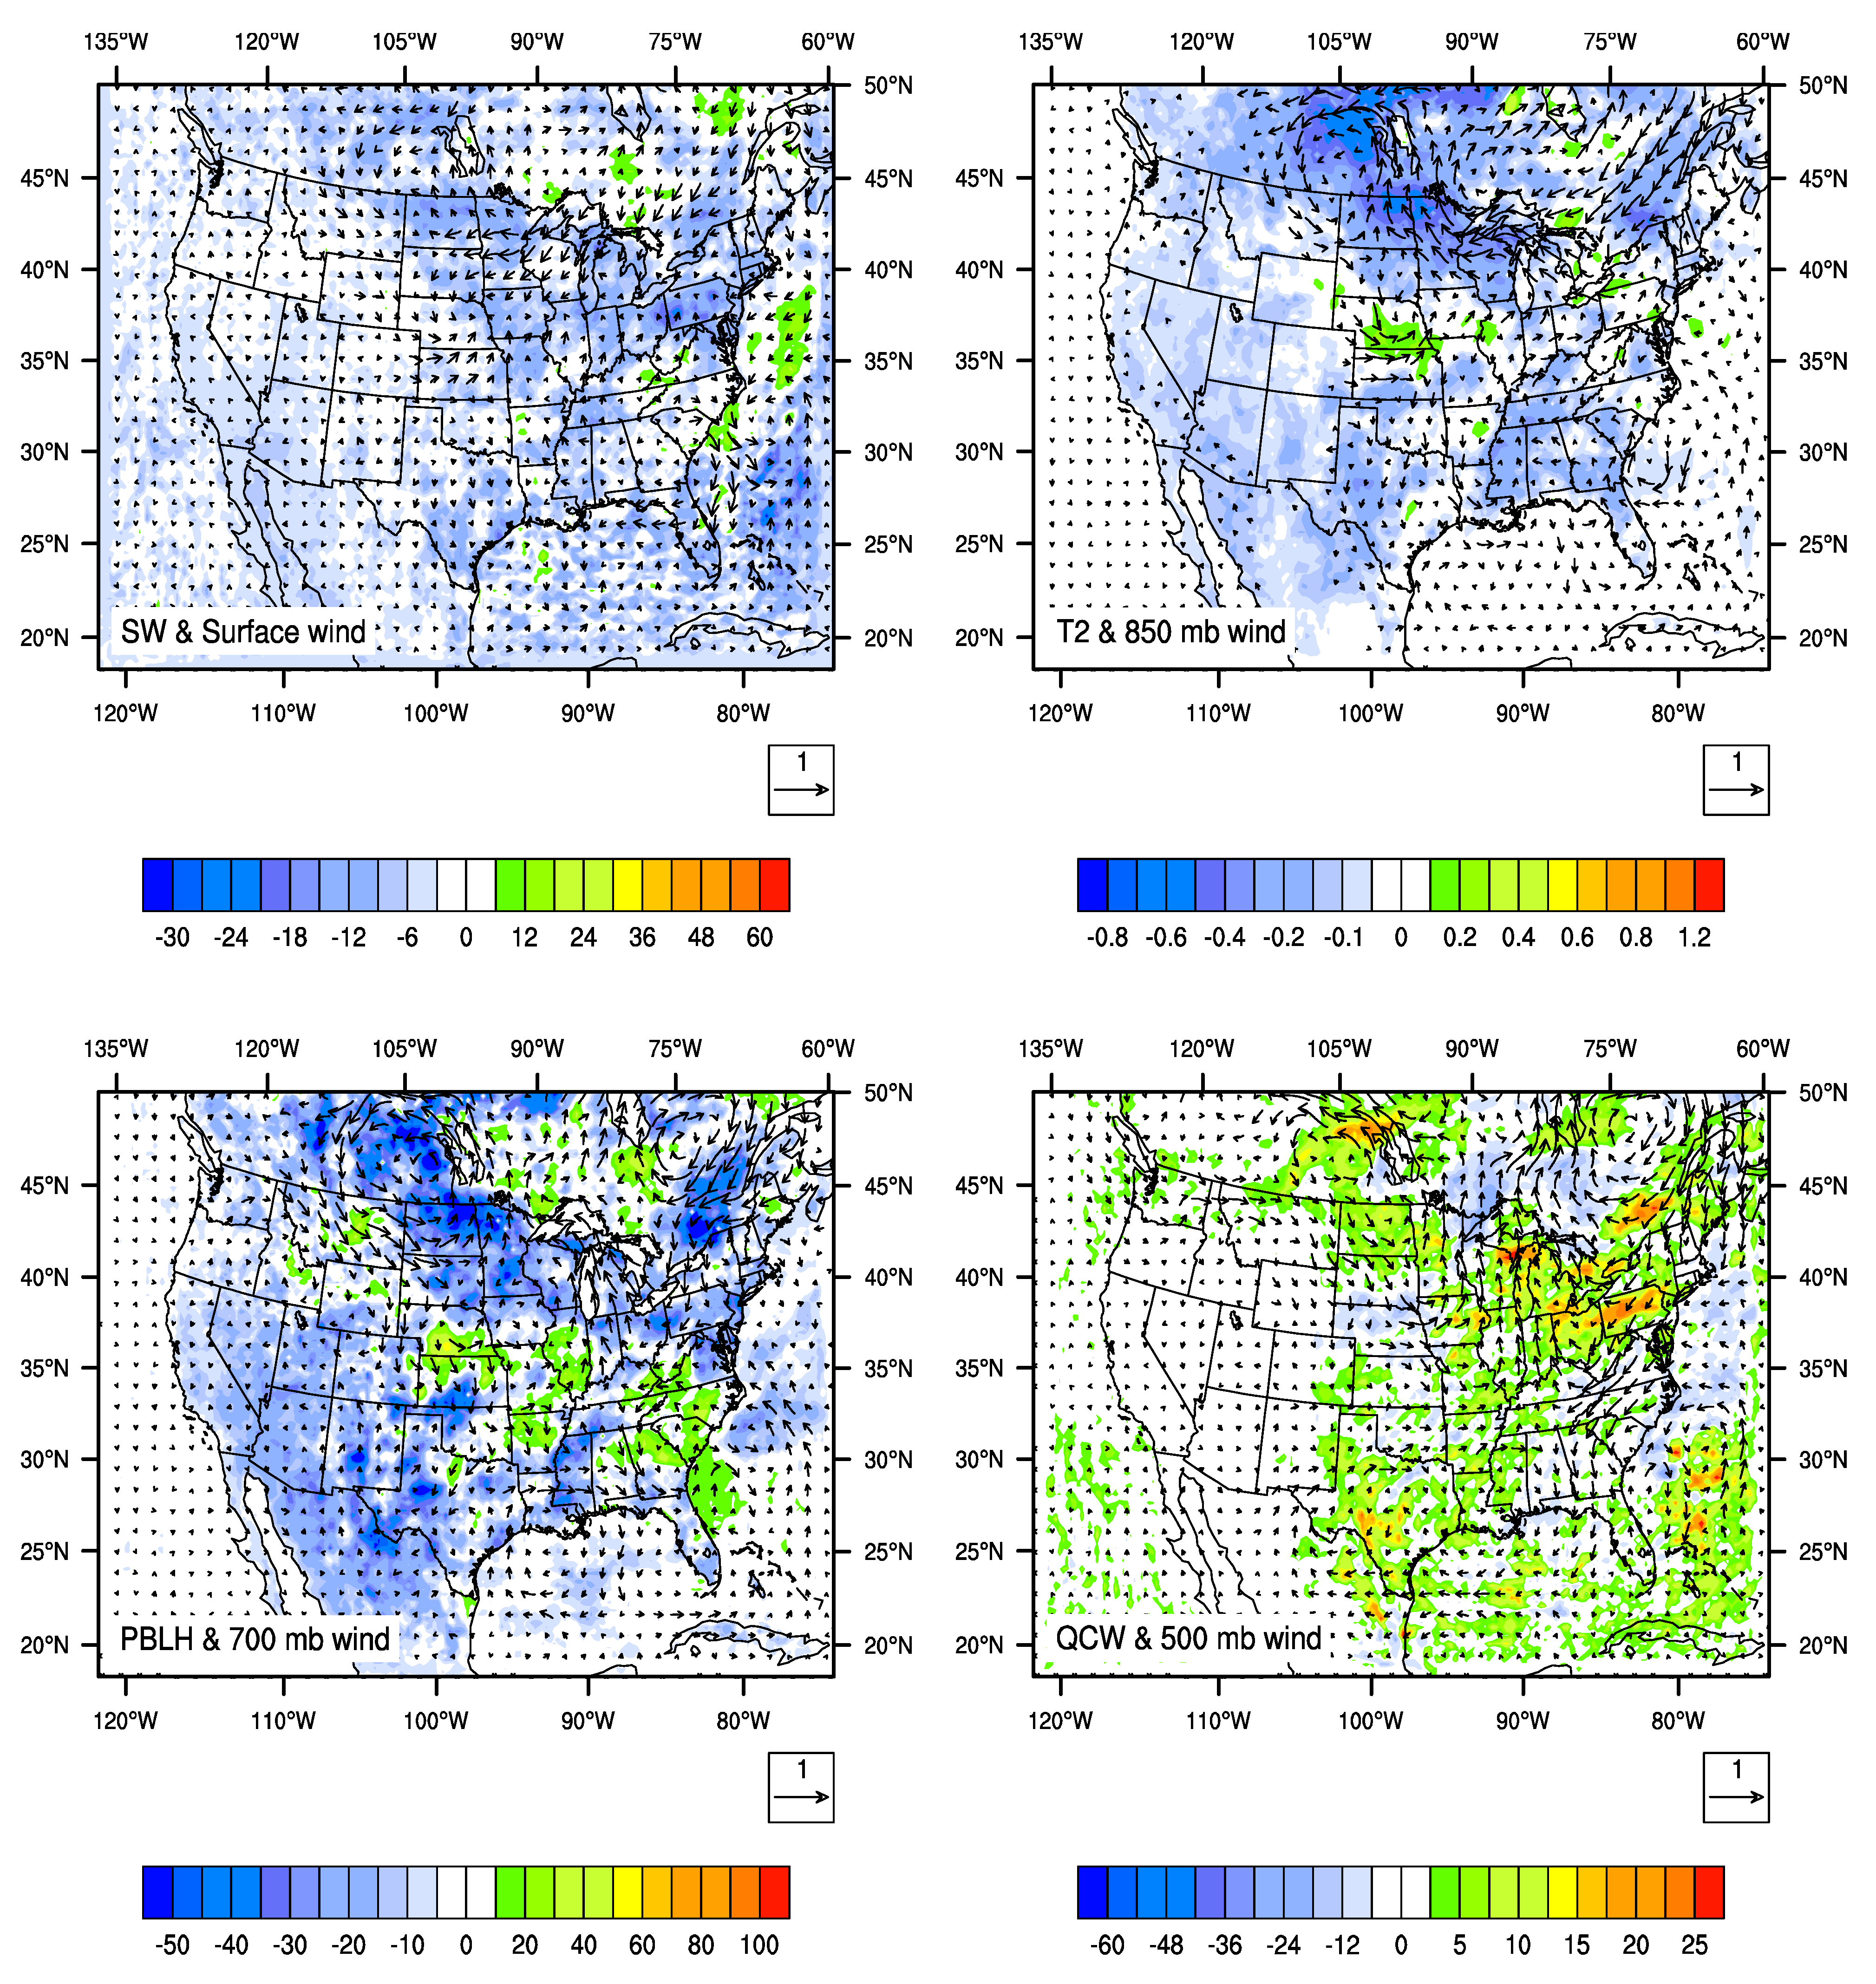
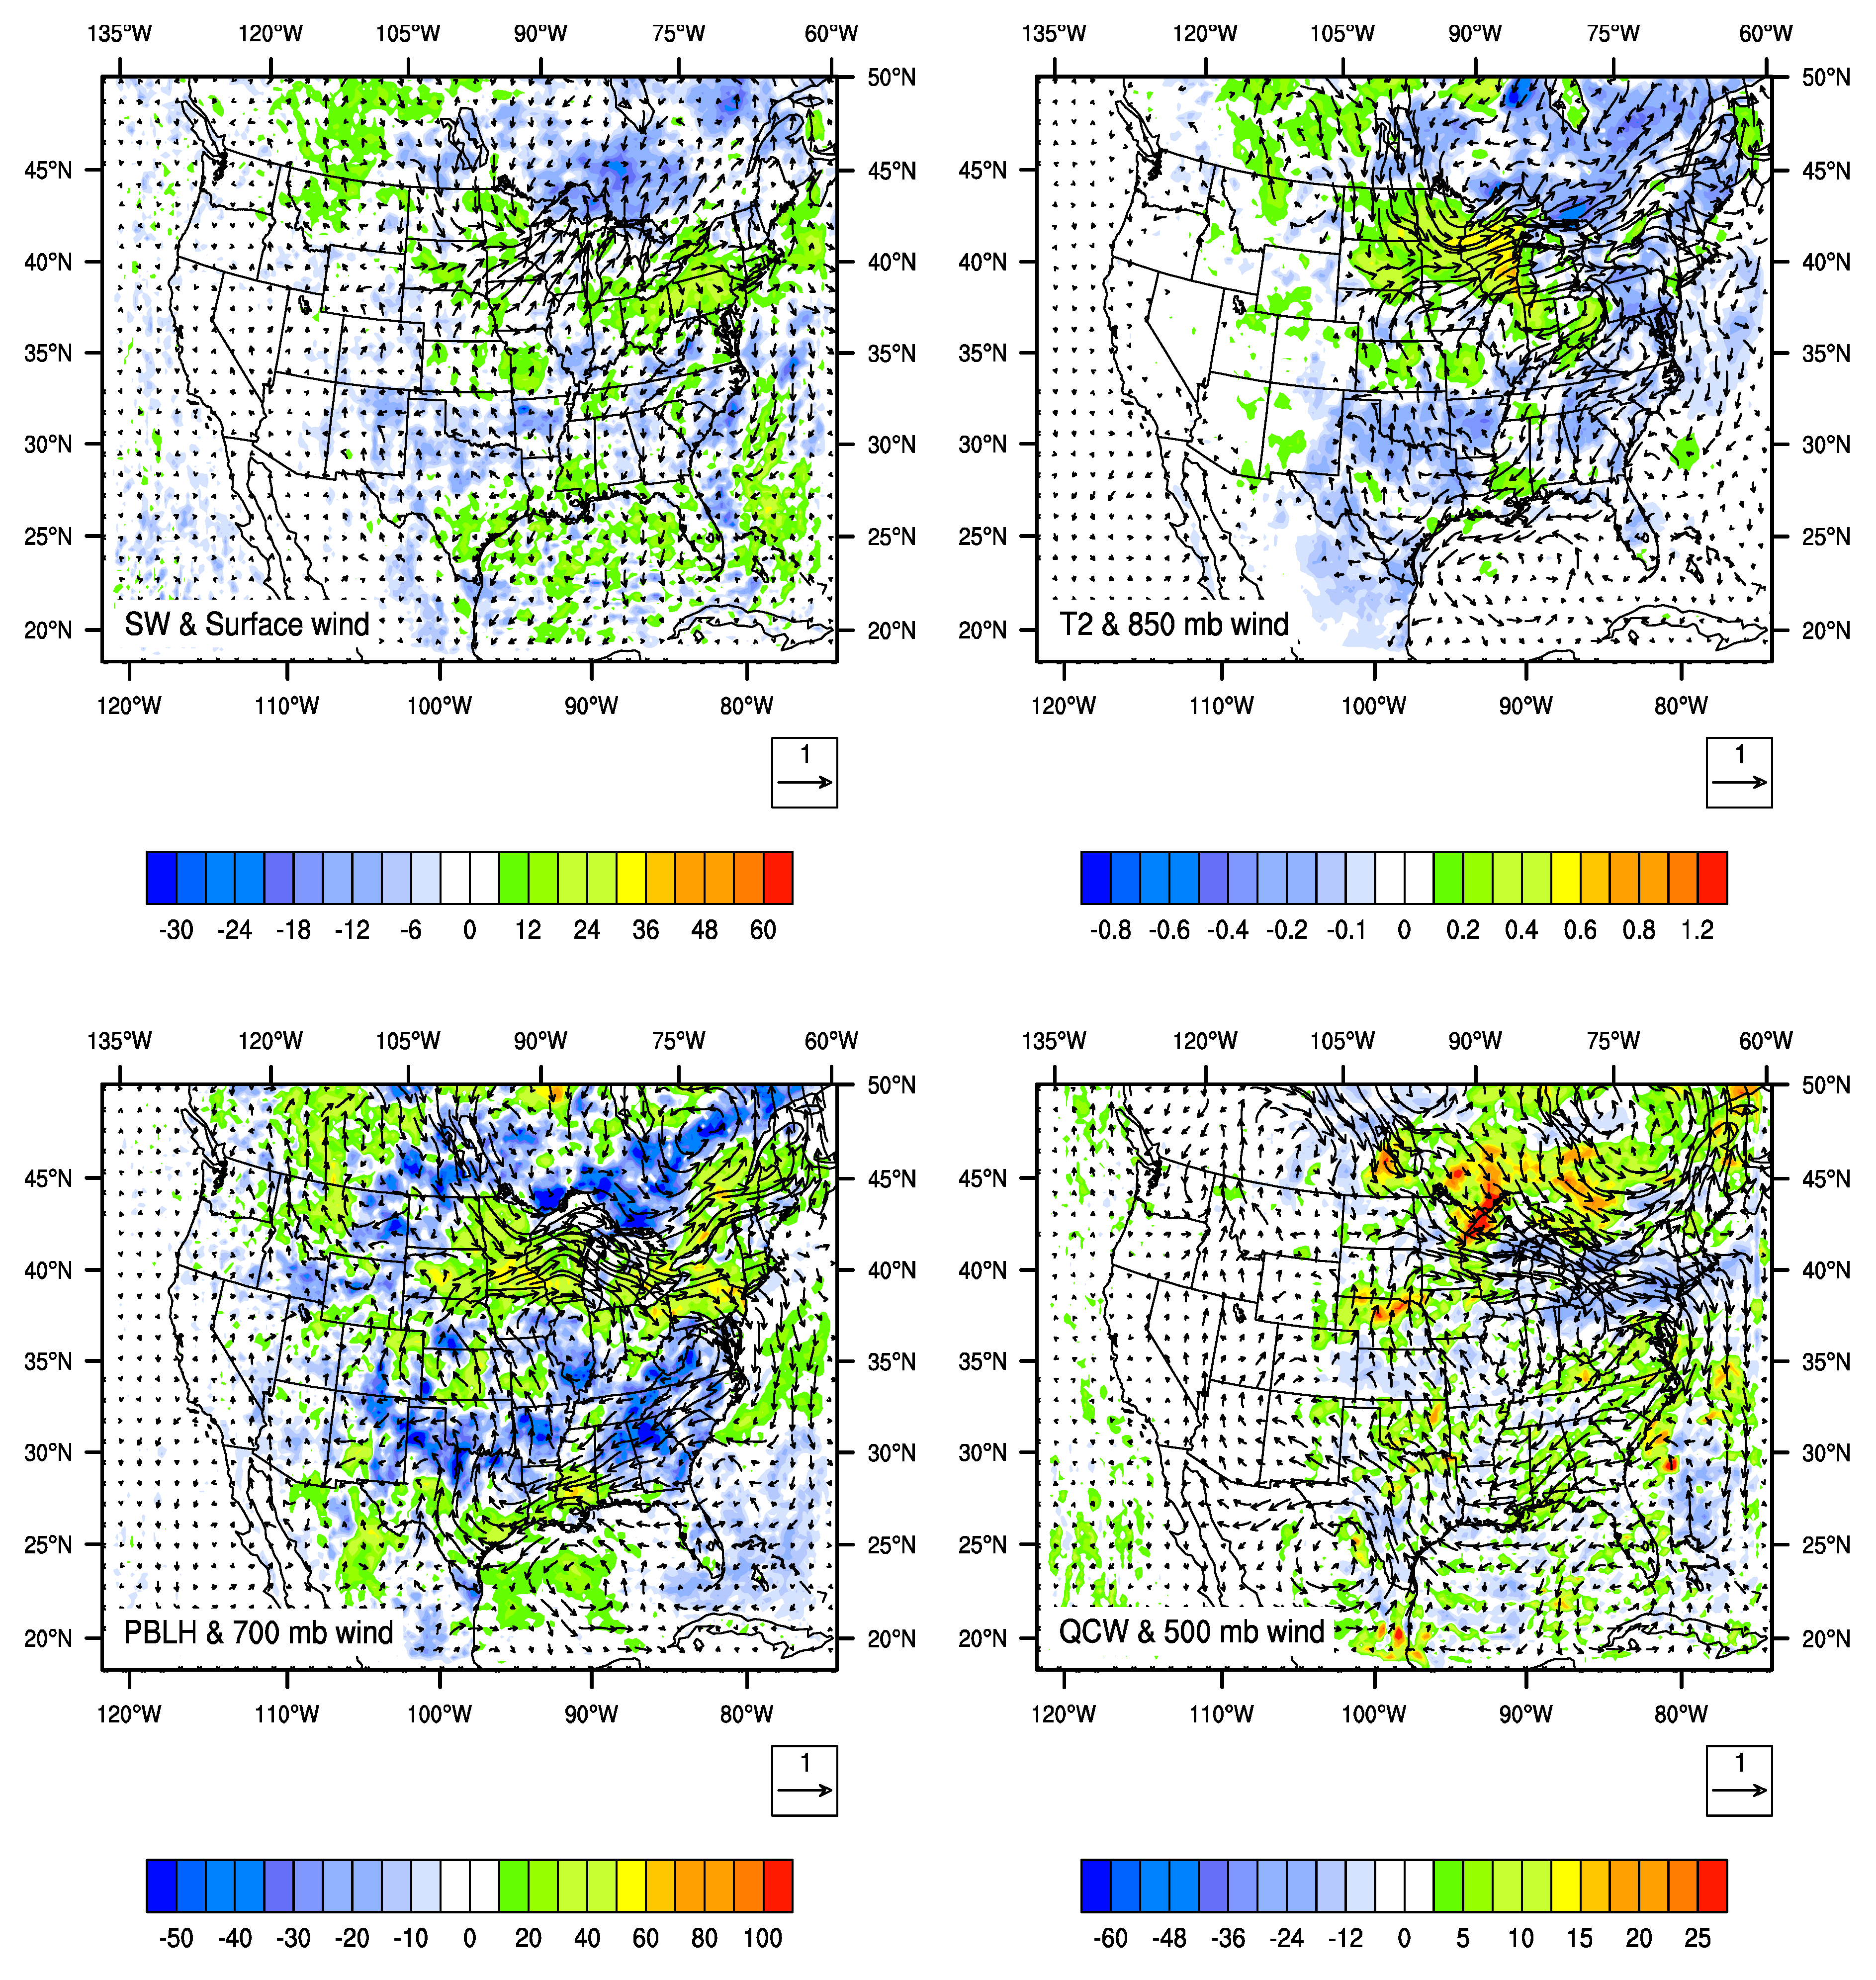
3.2.2. Effect of Aerosol-Radiation Interaction (AR)

3.2.3. Effect of Aerosol-Cloud Interaction (AC)

3.2.4. Synergistic Effect between AR and AC (SYN)

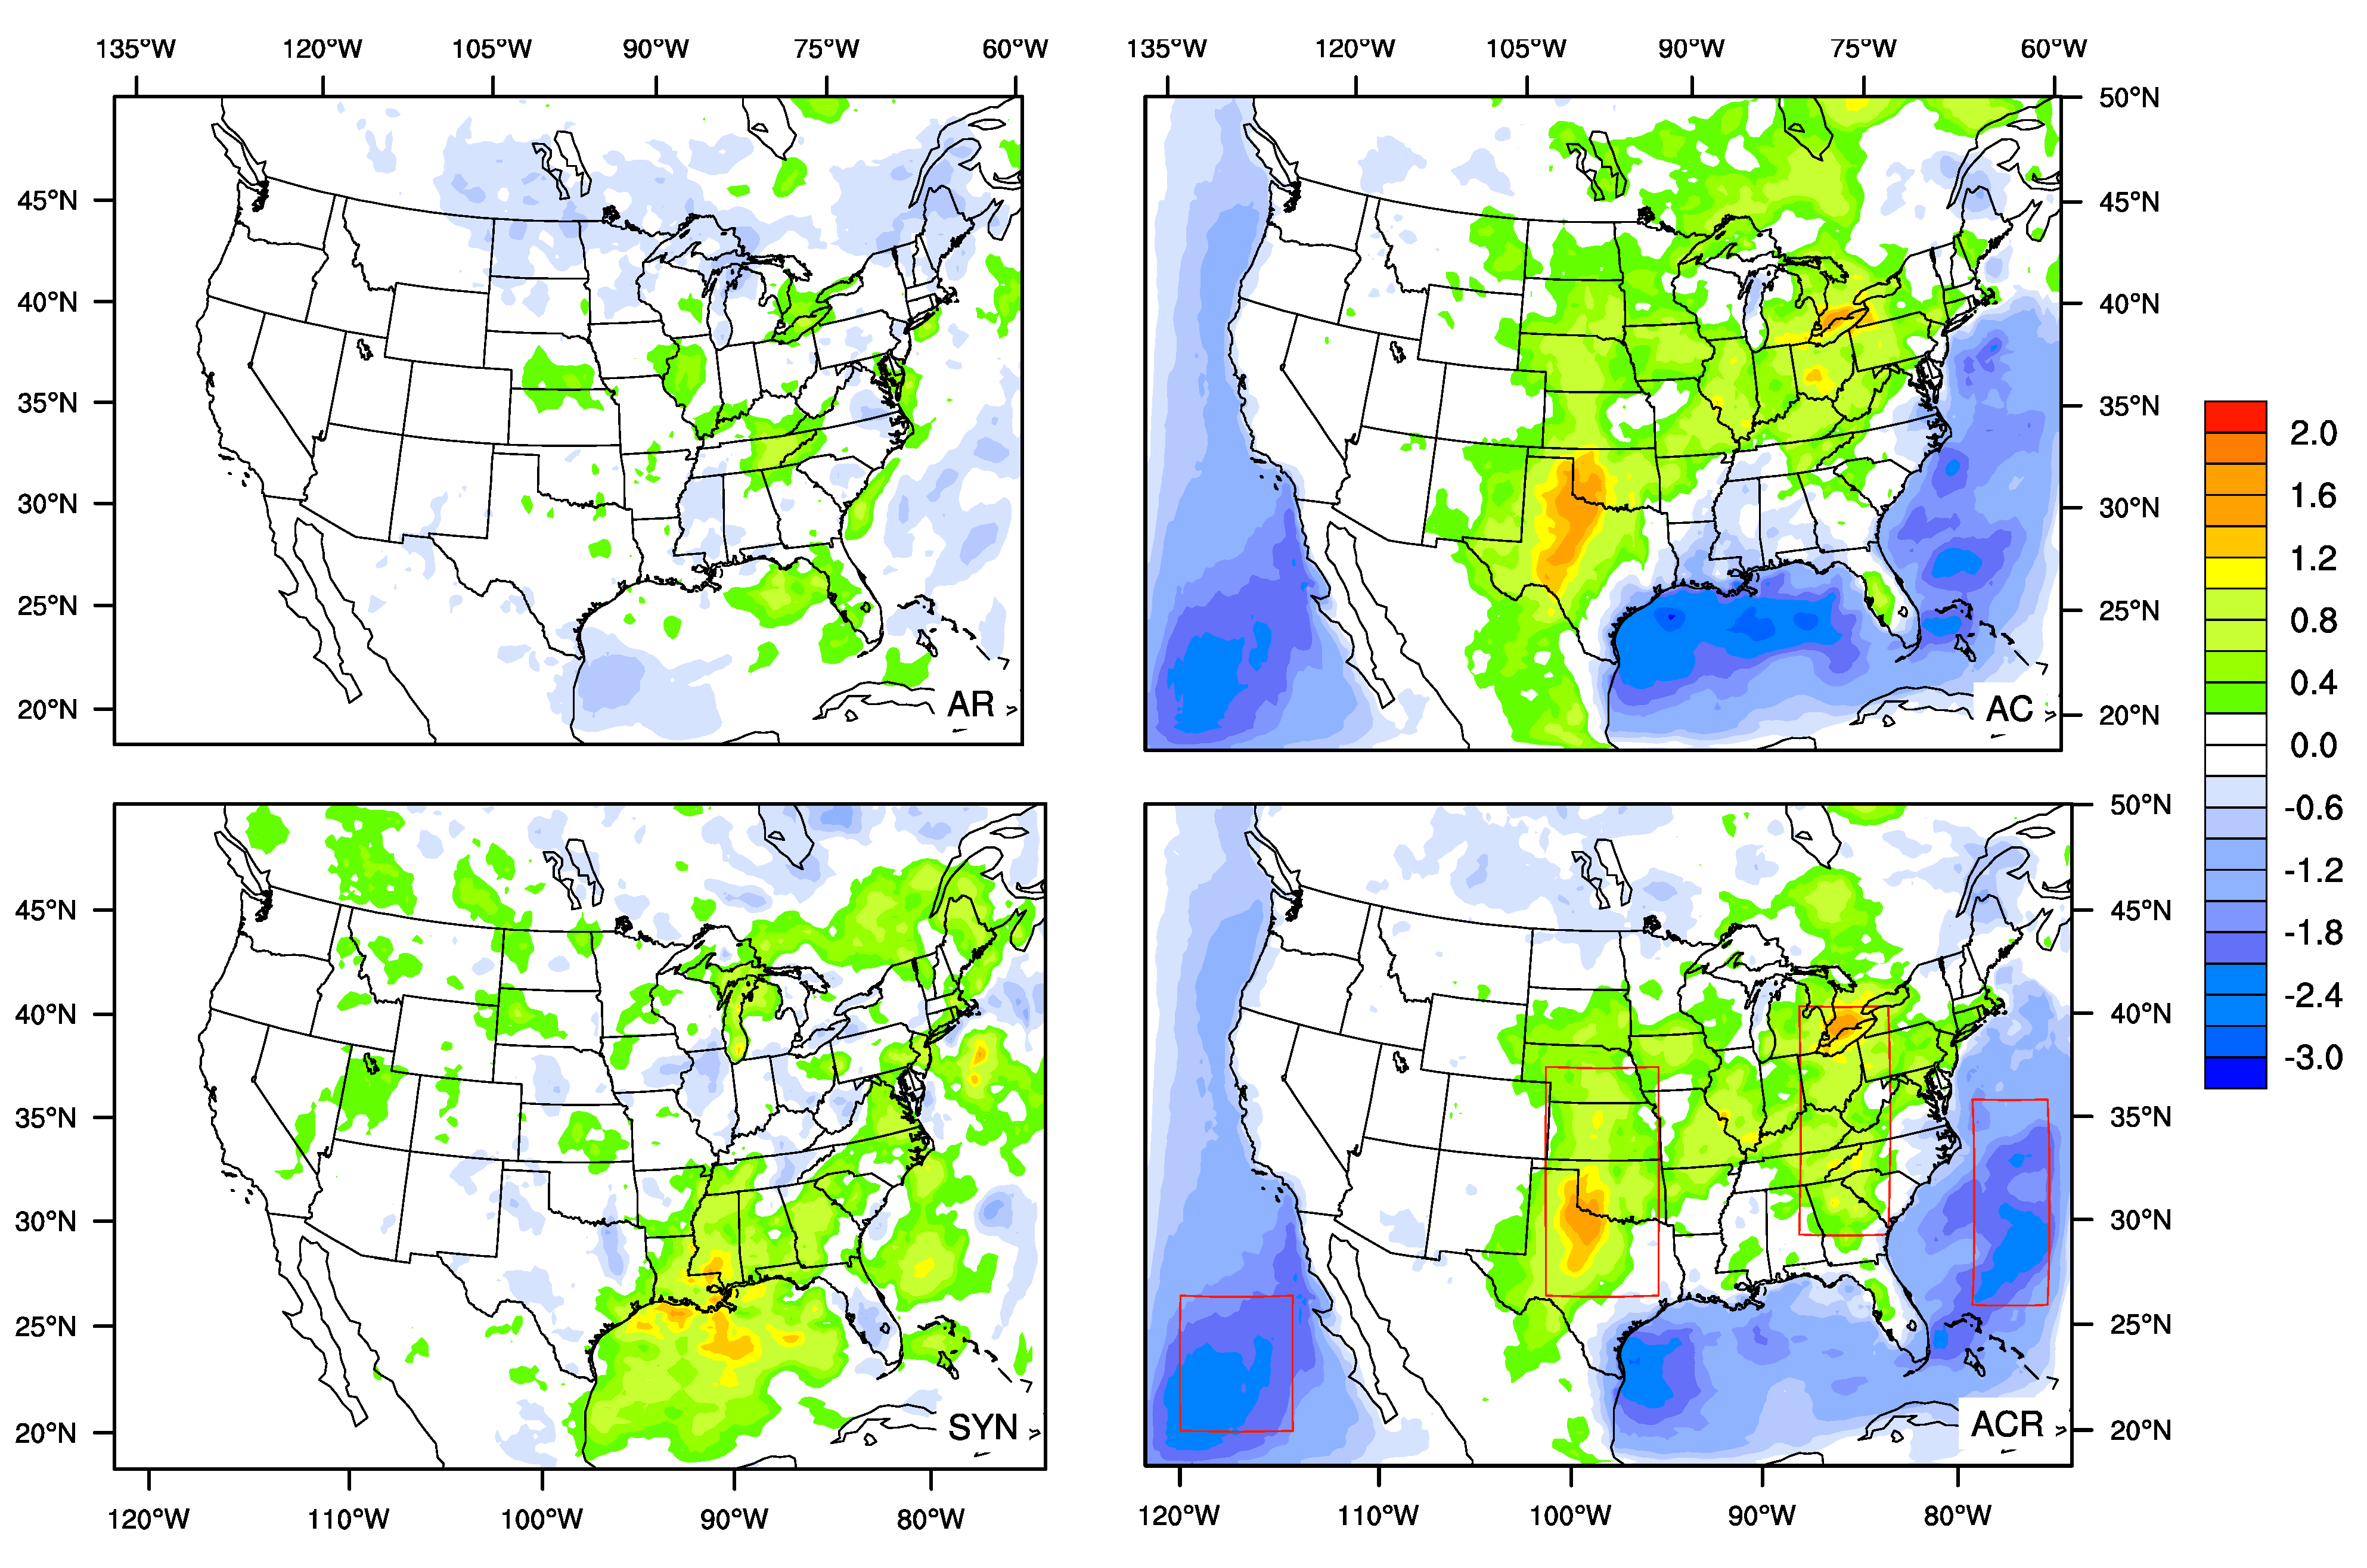
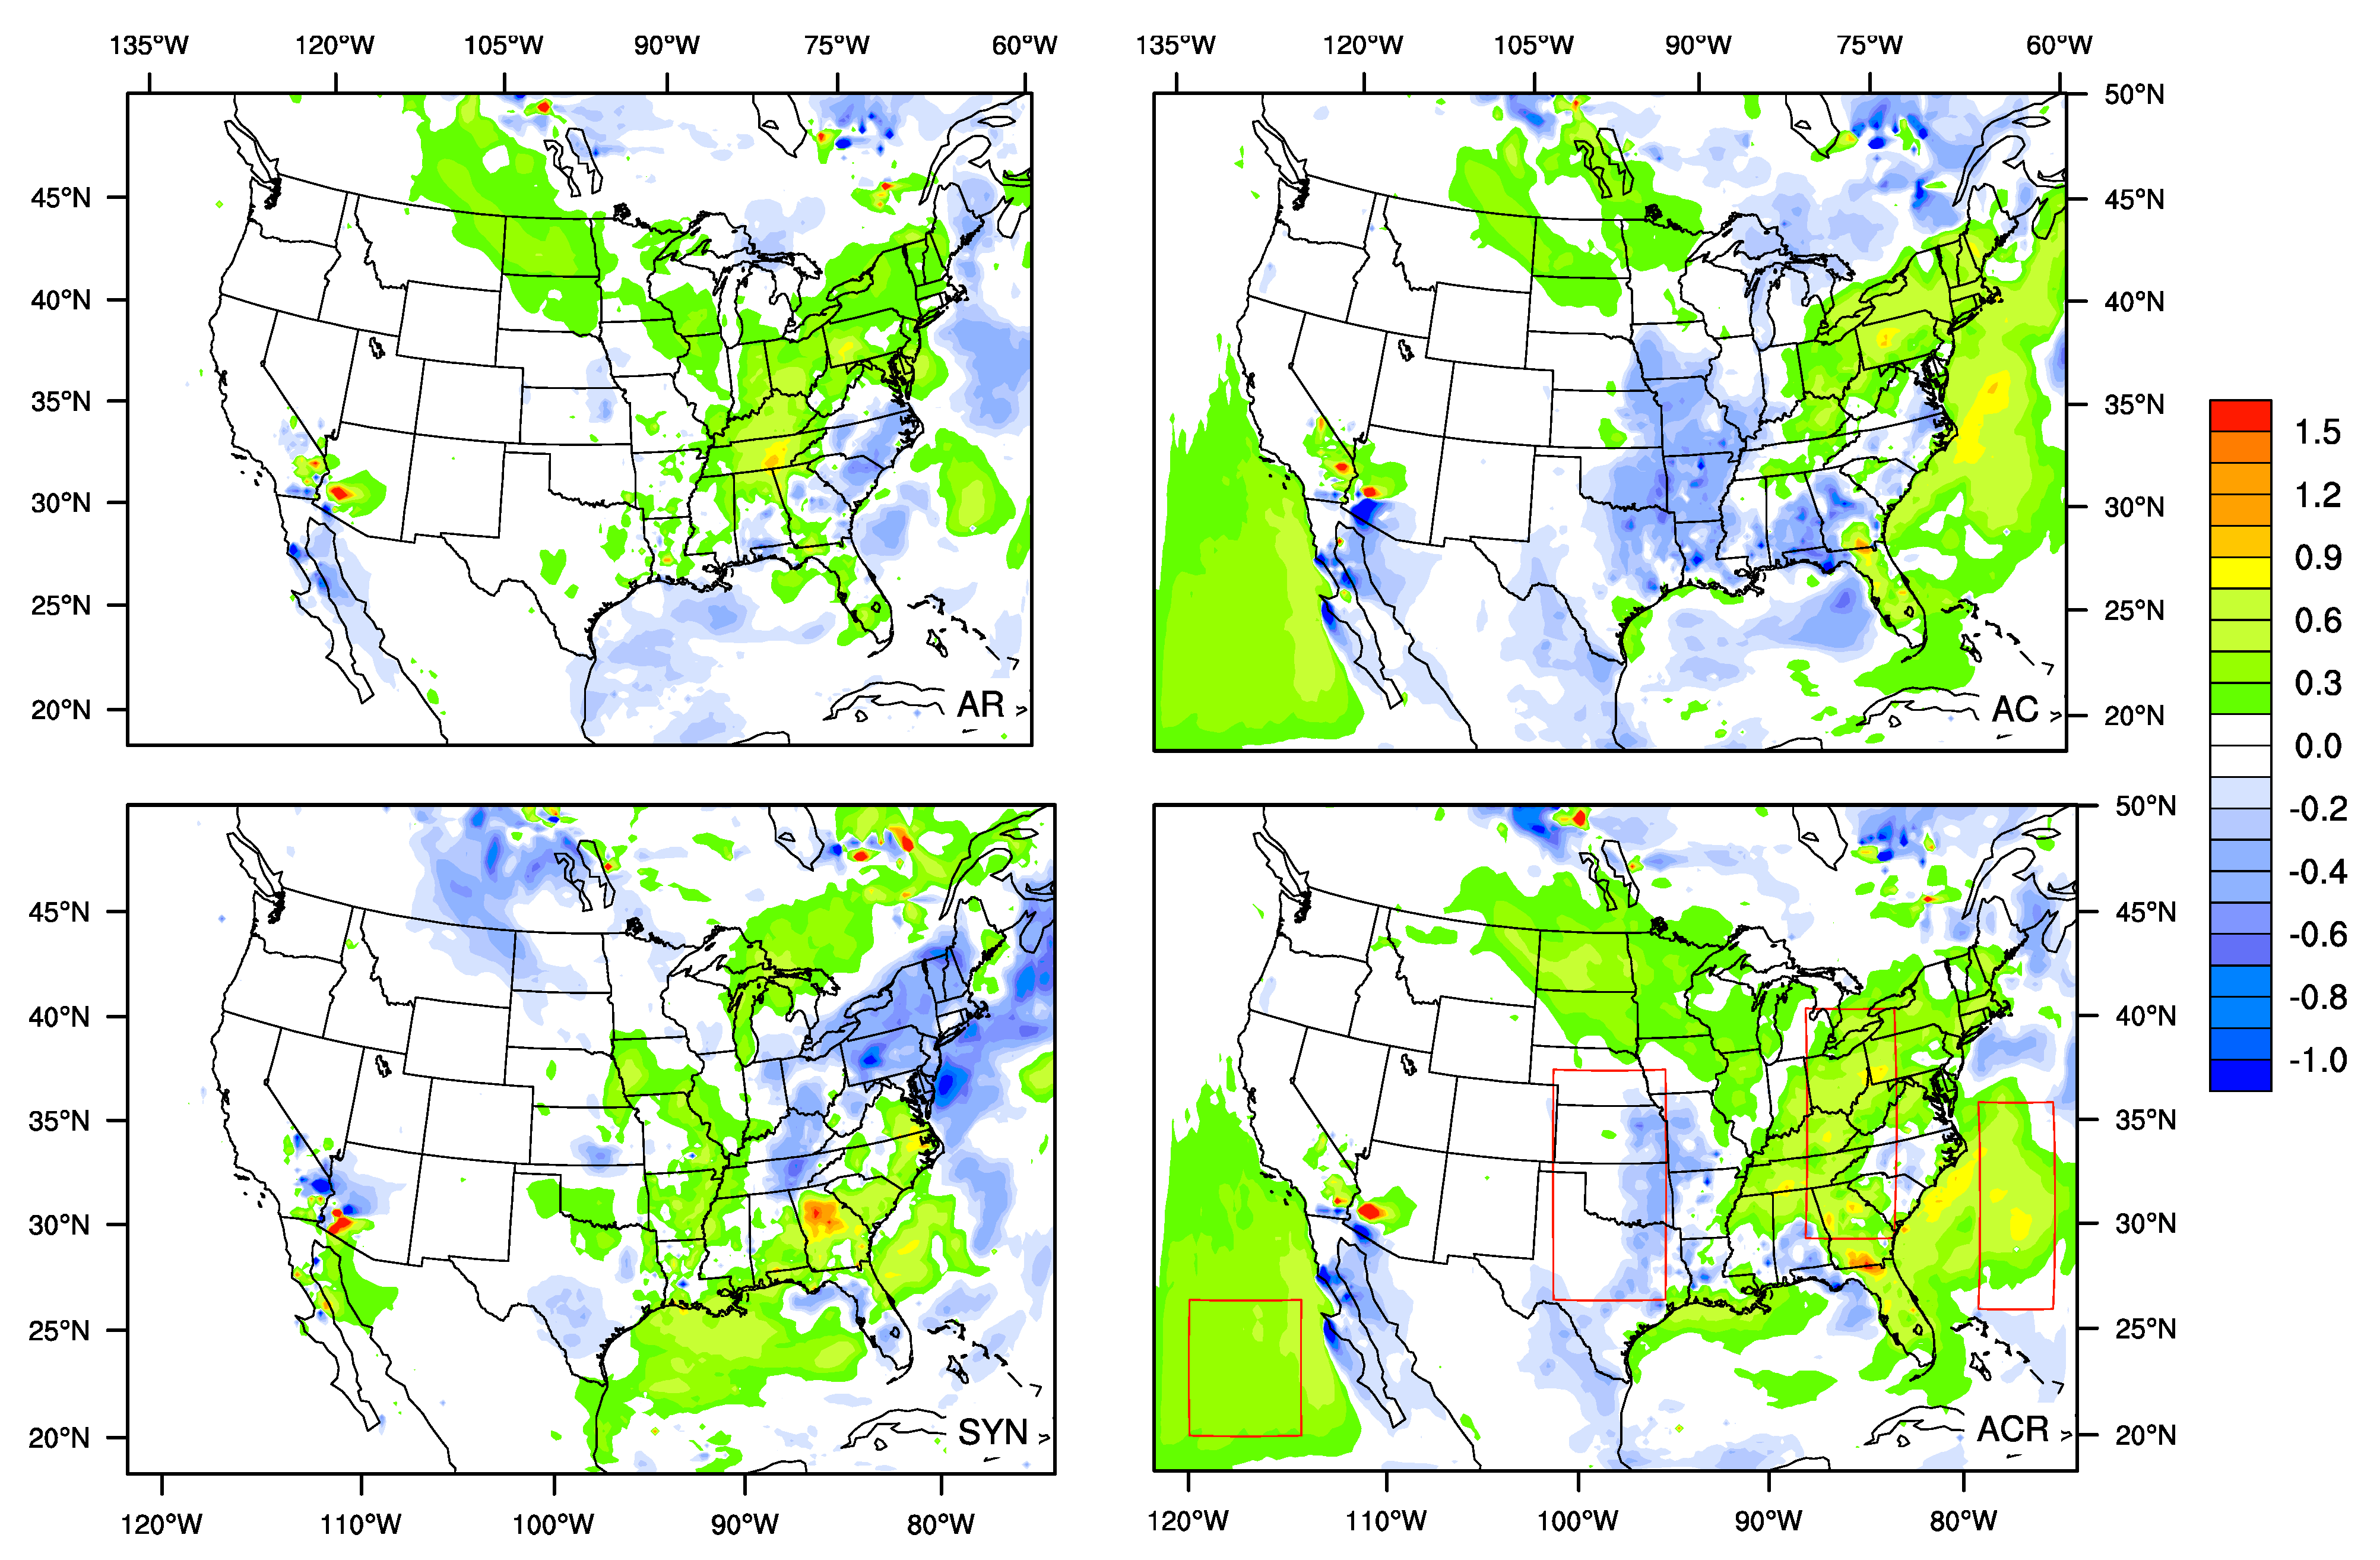
3.2.5. Relative Contribution of AR, AC, and SYN
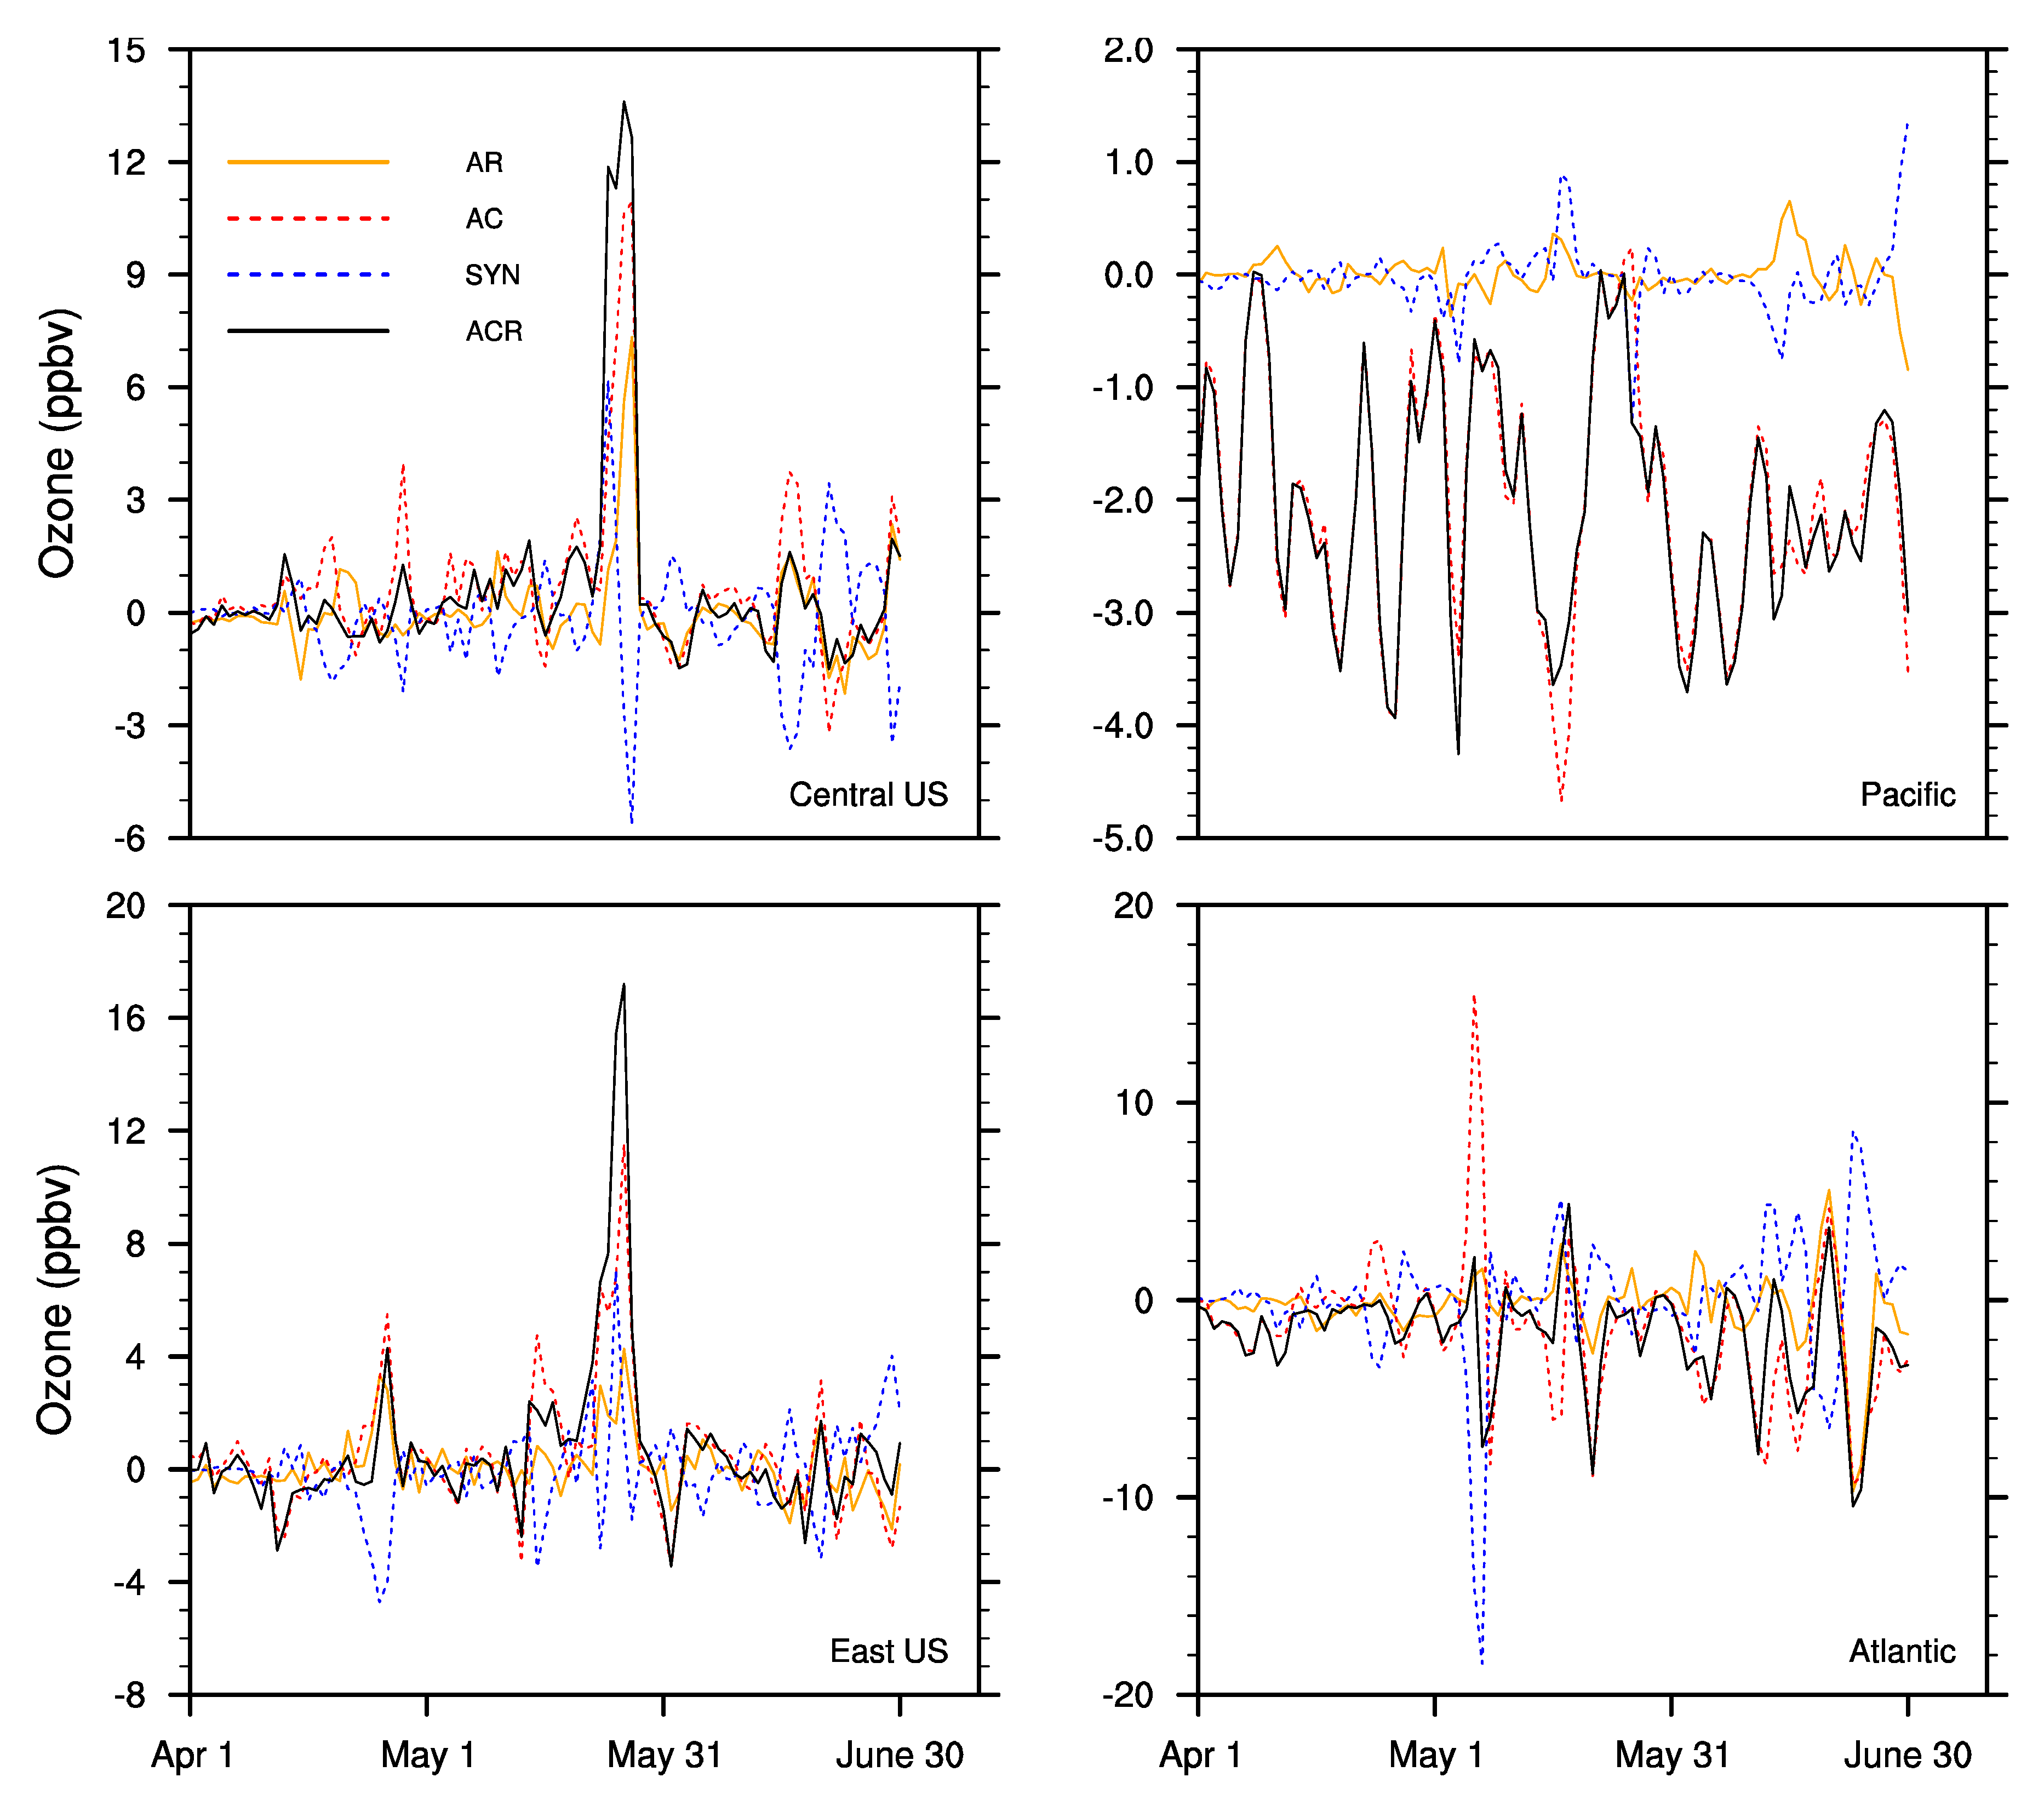
3.3. Impact on Air Quality
| SW (W·m−2) | QCW (g·m−2) | Wind@surface (m·s−1) | T (K) | PBLH (m) | Ozone (ppbv) | PM2.5 (μg·m−3) | |
|---|---|---|---|---|---|---|---|
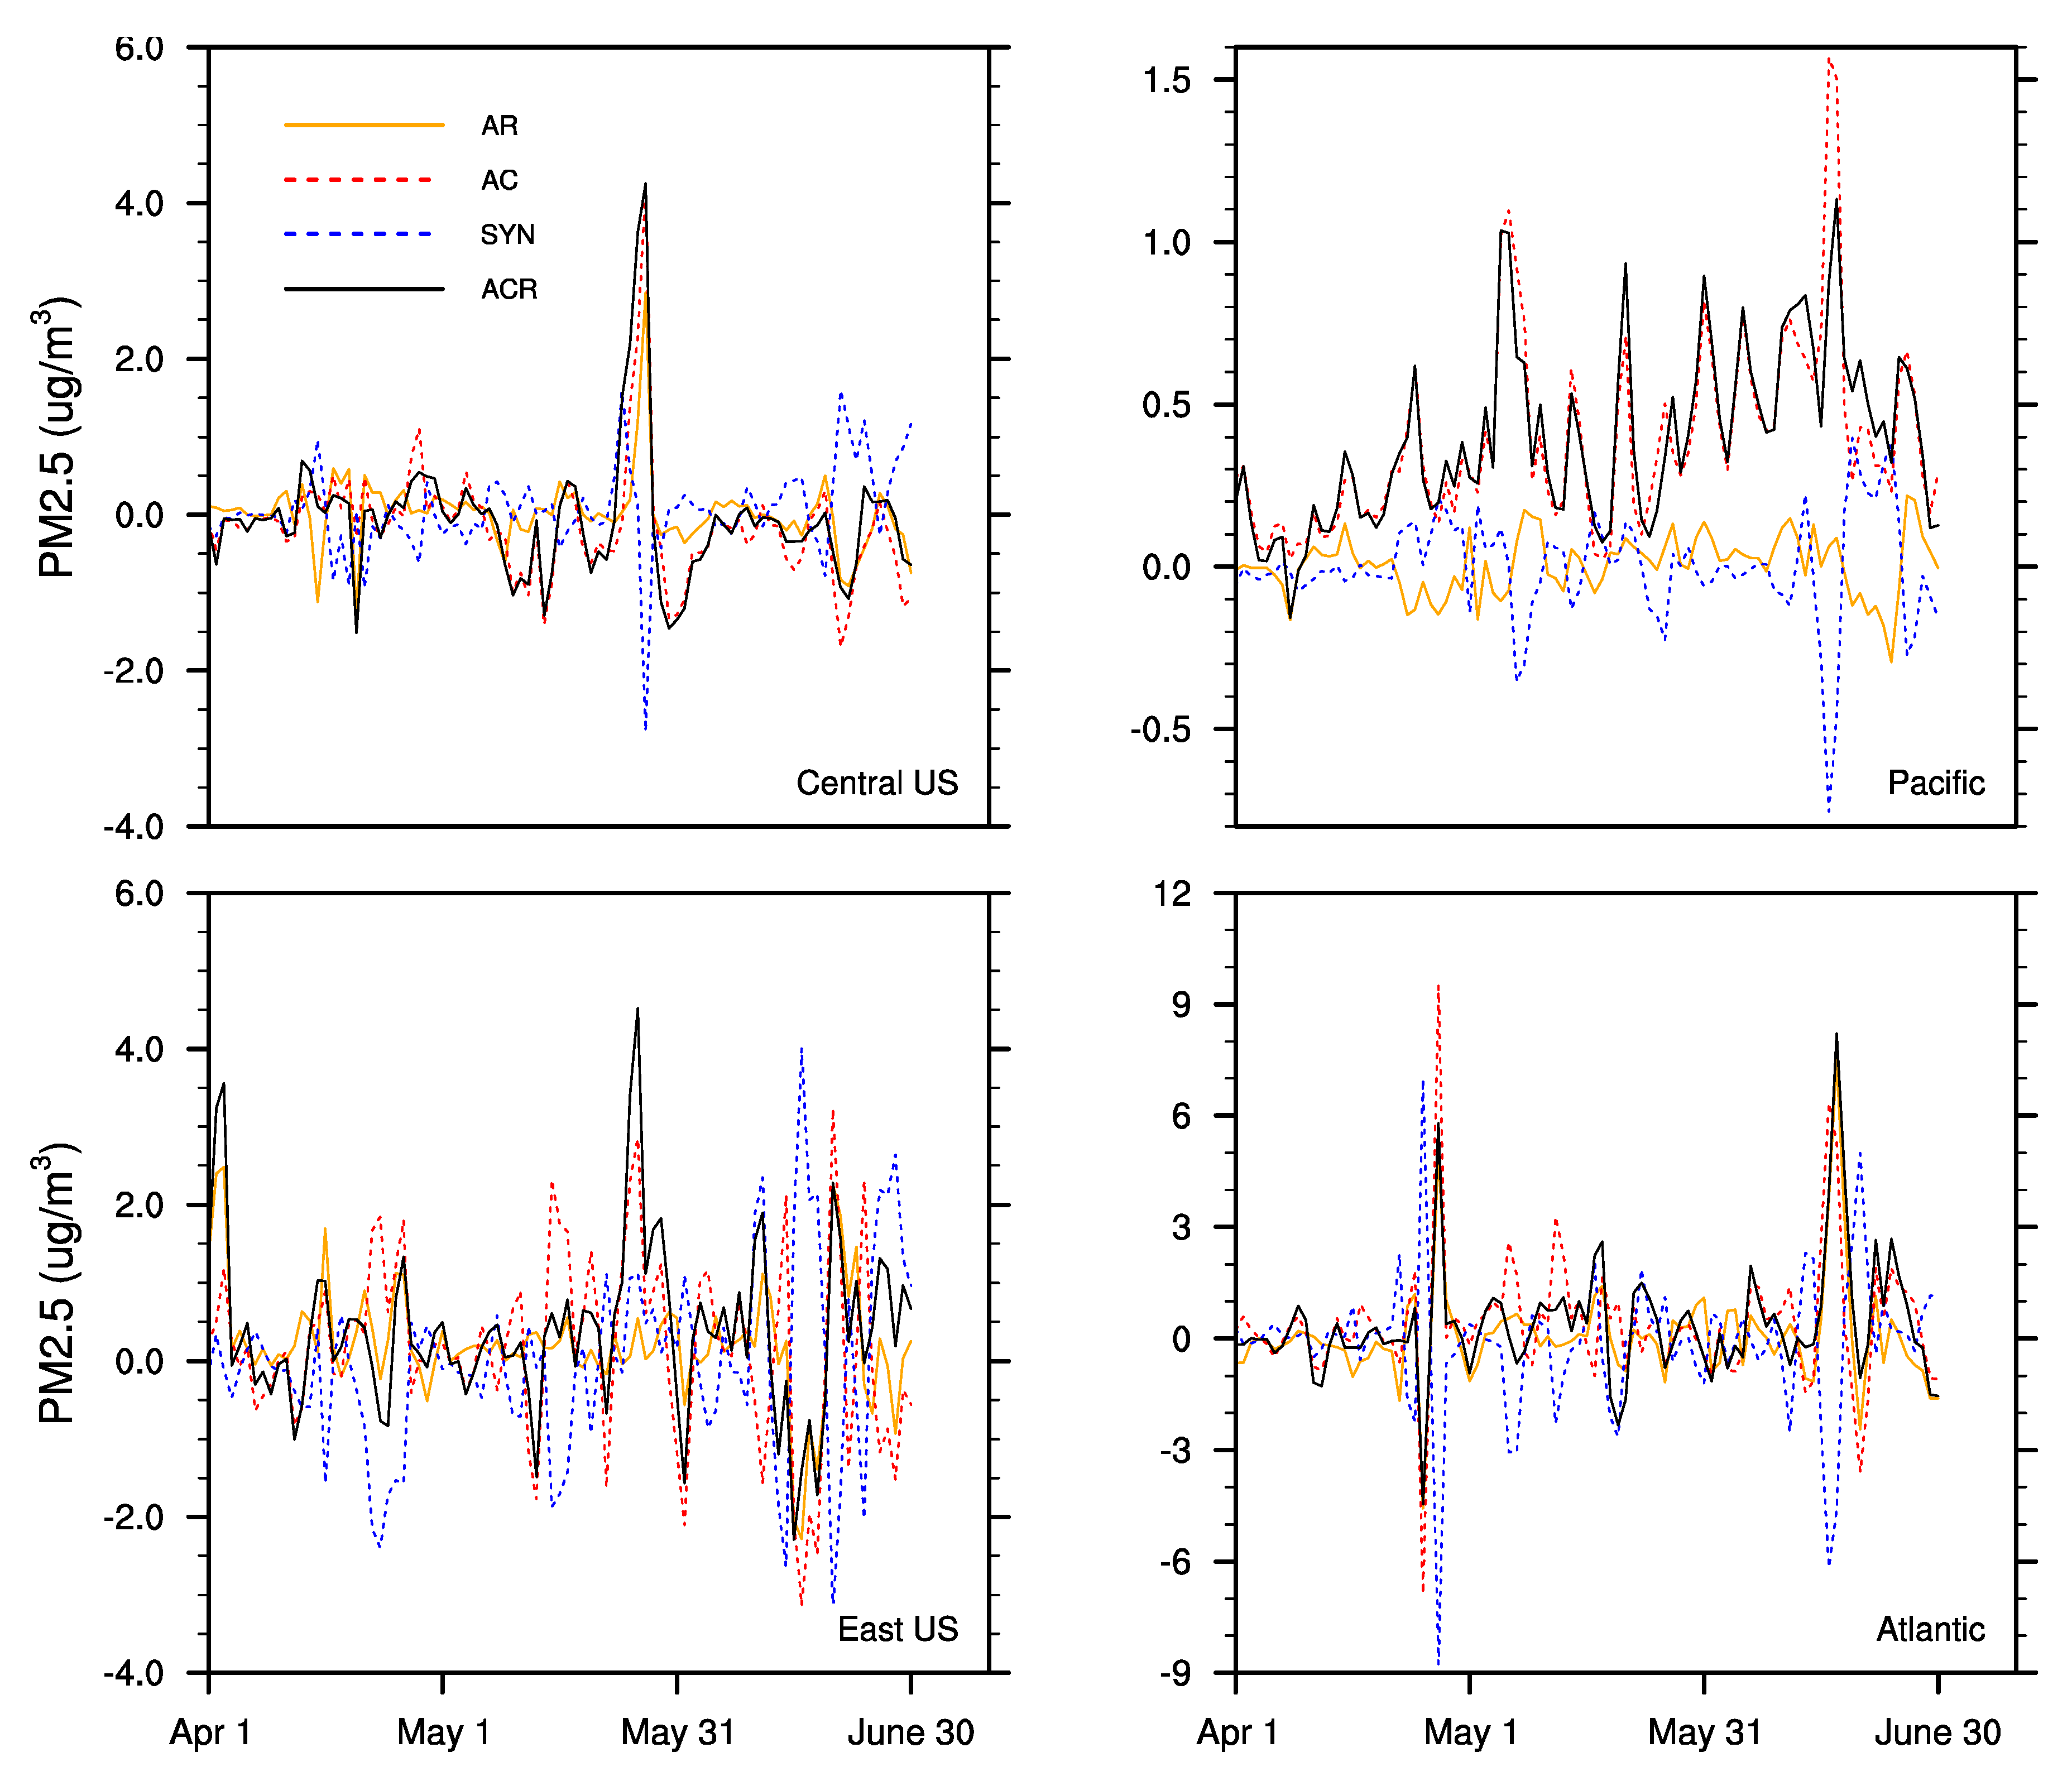
| Pacific | 48.03 | −87.03 | 0.03 | 0.11 | −10.74 | −2.03 | 0.39 |
| Central_US | 11.94 | −40.66 | 0.05 | 0.50 | 37.24 | 0.63 | −0.07 |
| East_US | 1.18 | −12.89 | 0.10 | 0.34 | 14.25 | 0.62 | 0.39 |
| Atlantic | 7.40 | −31.48 | −0.03 | 0.07 | −20.12 | −1.81 | 0.38 |

4. Summary and Conclusions
- The domain-average downward shortwave radiation reduced by 4.2 W·m−2 due to AR. The aerosol effect, through directly absorbing and scattering solar radiation, can only explain part of the changes. The cloud change due to AR can explain the downward shortwave radiation changes in the eastern Texas and the mid-Atlantic Ocean for this case study.
- In comparison with AR, AC had more influence on the atmospheric energy balance. It generally caused more precipitation (0.1 mm·day−1 averaged over the domain) and less cloud formation, which allowed a domain-average 12.2 W·m−2 more downward shortwave radiation.
- SYN, representing the nonlinear interaction between AC and AR, could either enhance or counteract them depending on location. SYN decreased the cloud formation and increased the downward shortwave radiation by 0.2 W·m−2 averaged over the entire domain.
- Overall, AC dominated the effect of ACR interactions, especially for surface radiation energy and clouds, suggesting it plays a larger role in the weather system than AR. The domain-average overall ACR effect would reduce cloud coverage and wind speed while increasing downward shortwave radiation, surface temperature, and PBLH, as shown in Table 3. The spatial-temporal variations in the ACR effects were large.
- The ACR interaction-induced meteorology change would impose noticeable effects on surface ozone and PM2.5, especially over oceans and the eastern U.S. Domain-wide, ACR interactions caused an approximately 0.4 ppbv reduction and 0.1 μg·m−3 increase in three-month average surface ozone and PM2.5 concentrations, respectively. However, the spatial-temporal variations were large and a more than 10 ppbv surface ozone and a 5 μg·m−3 PM2.5 difference induced by the ACR interactions occurred frequently in the eastern U.S. and the Atlantic Ocean. The mechanism that led to surface PM2.5 and ozone change varied from region to region, dependent upon the local chemical background (e.g., NOx- vs. VOC-sensitive regime), emissions, and meteorological conditions.
Acknowledgments
Author Contributions
Conflicts of Interest
References
- Charlson, R.J.; Schwartz, S.E.; Hales, J.M.; Cess, R.D.; Coakley, J.A., Jr.; Hansen, J.E.; Hofmann, D.J. Climate forcing by anthropogenic aerosols. Science 1992, 255, 423–430. [Google Scholar] [CrossRef] [PubMed]
- Ackerman, A.S.; Toon, O.B.; Stevens, D.E.; Heymsfield, A.J.; Ramanathan, V.; Welton, E.J. Reduction of tropical cloudiness by soot. Science 2000, 288, 1042–1047. [Google Scholar] [CrossRef] [PubMed]
- Twomey, S. The influence of pollution on the shortwave albedo of clouds. J. Atmos. Sci. 1977, 34, 1149–1152. [Google Scholar] [CrossRef]
- Yu, H.; Liu, S.C.; Dickinson, R.E. Radiative effects of aerosols on the evolution of the atmospheric boundary layer. J. Geophys. Res. 2002, 107. [Google Scholar] [CrossRef]
- Zhang, Y.; Fu, R.; Yu, H.; Dickinson, R.E.; Juarez, R.N.; Chin, M.; Wang, H. A regional climate model study of how biomass burning aerosol impacts land-atmosphere interactions over the Amazon. J. Geophys. Res. 2008, 113. [Google Scholar] [CrossRef]
- Barbaro, E.; Vilà-Guerau de Arellano, J.; Ouwersloot, H.G.; Schröter, J.S.; Donovan, D.P.; Krol, M.C. Aerosols in the convective boundary layer: Shortwave radiation effects on the coupled land-atmosphere system. J. Geophys. Res. Atmos. 2014, 119, 5845–5863. [Google Scholar] [CrossRef]
- Zhang, Y.; Fu, R.; Yu, H.; Qian, Y.; Dickinson, R.E.; SilvaDias, M.A.F.; daSilvaDias, P.L.; Fernandes, K. Impact of biomass burning aerosol on the monsoon circulation transition over Amazonia. Geophys. Res. Lett. 2009, 36. [Google Scholar] [CrossRef]
- Zhao, C.; Liu, X.; Leung, L.R. Impact of the Desert dust on the summer monsoon system over Southwestern North America. Atmos. Chem. Phys. 2012, 12, 3717–3731. [Google Scholar] [CrossRef]
- Ge, C.; Wang, J.; Reid, J.S. Mesoscale modeling of smoke transport over the Southeast Asian Maritime Continent: Coupling of smoke direct radiative effect below and above the low-level clouds. Atmos. Chem. Phys. 2014, 14, 159–174. [Google Scholar] [CrossRef]
- Grell, G.A.; Baklanov, A. Integrated modeling for forecasting weather and air quality: A call for fully coupled approaches. Atmos. Environ. 2011, 45, 6845–6851. [Google Scholar] [CrossRef]
- Grell, G.A.; Emeis, S.; Stockwell, W.R.; Schoenemeyer, T.; Forkel, R.; Michalakes, J.; Knoche, R.; Seidl, W. Application of a multiscale, coupled MM5/chemistry model to the complex terrain of the VOTALP valley campaign. Atmos. Environ. 2000, 34, 1435–1453. [Google Scholar] [CrossRef]
- Grell, G.A.; Peckham, S.E.; Schmitz, R.; McKeen, S.A.; Frost, G.; Skamarock, W.C.; Eder, B. Fully coupled “online” chemistry within the WRF model. Atmos. Environ. 2005, 39, 6957–6975. [Google Scholar] [CrossRef]
- Vogel, B.; Vogel, H.; Bäumer, D.; Bangert, M.; Lundgren, K.; Rinke, R.; Stanelle, T. The comprehensive model system COSMO-ART—Radiative impact of aerosol on the state of the atmosphere on the regional scale. Atmos. Chem. Phys. 2009, 9, 8661–8680. [Google Scholar] [CrossRef]
- Baklanov, A.; Schlünzen, K.; Suppan, P.; Baldasano, J.; Brunner, D.; Aksoyoglu, S.; Carmichael, G.; Douros, J.; Flemming, J.; Forkel, R.; et al. Online coupled regional meteorology chemistry models in Europe: Current status and prospects. Atmos. Chem. Phys. 2014, 14, 317–398. [Google Scholar] [CrossRef] [Green Version]
- Jacobson, M.Z. Development and application of a new air pollution modeling system. Part III: Aerosol-phase simulation. Atmos. Environ. 1997, 31, 587–608. [Google Scholar] [CrossRef]
- Zhang, Y.; Wen, X.-Y.; Jang, C.J. Simulating chemistry-aerosol-cloud-radiation-climate feedbacks over the continental U.S. using the online-coupled Weather Research Forecasting Model with chemistry (WRF/Chem). Atmos. Environ. 2010, 44, 3568–3582. [Google Scholar] [CrossRef]
- Forkel, R.; Werhahn, J.; Hansen, A.B.; McKeen, S.; Peckham, S.; Grell, G.; Suppan, P. Effect of aerosol-radiation feedback on regional air quality—A case study with WRF/Chem. Atmos. Environ. 2012, 53, 202–211. [Google Scholar] [CrossRef]
- Boucher, O.; Randall, D.; Artaxo, P.; Bretherton, C.; Feingold, G.; Forster, P.; Kerminen, V.-M.; Kondo, Y.; Liao, H.; Lohmann, U.; et al. Clouds and Aerosols. In Climate Change 2013: The Physical Science Basis. Contribution of Working Group I to the Fifth Assessment Report of the Intergovernmental Panel on Climate Change; Stocker, T.F., Qin, D., Plattner, G.-K., Tignor, M., Allen, S.K., Boschung, J., Nauels, A., Xia, Y., Bex, V., Midgley, P.M., Eds.; Cambridge University Press: Cambridge, UK; New York, NY, USA, 2013; pp. 571–657. [Google Scholar]
- Stein, U.; Alpert, P. Factor separation in numerical simulations. J. Atmos. Sci. 1993, 50, 2107–2115. [Google Scholar] [CrossRef]
- Michalakes, J.; Chen, S.; Dudhia, J.; Hart, L.; Klemp, J.; Middlecoff, J.; Skamarock, W. Development of a next generation regional weather research and forecast model. In Proceedings of the Ninth ECMWF Workshop on the Use of High Performance Computing in Meteorology, Reading, UK, 13–17 November 2000; pp. 269–276.
- Santanello, J.A.; Peters-Lidard, C.D.; Kennedy, A.; Kumar, S.V. Diagnosing the nature of land-atmosphere coupling: A case study of dry/wet extremes in the U.S. Southern Great Plains. J. Hydrometeorol. 2013, 14, 3–24. [Google Scholar] [CrossRef]
- Tao, Z.; Santanello, J.A.; Chin, M.; Zhou, S.; Tan, Q.; Kemp, E.M.; Peters-Lidard, C.D. Effect of land cover on atmospheric processes and air quality over the continental United States—A NASA Unified WRF (NU-WRF) model study. Atmos. Chem. Phys. 2013, 13, 6207–6226. [Google Scholar] [CrossRef]
- Peters-Lidard, C.D.; Kemp, E.M.; Matsui, T.; Santanello, J.A., Jr.; Kumar, S.V.; Jacob, J.P.; Clune, T.; Tao, W.-K.; Chin, M.; Hou, A.; et al. Integrated modeling of aerosol, cloud, precipitation and land processes at satellite-resolved scales. Environ. Model. Softw. 2015, 67, 149–159. [Google Scholar] [CrossRef]
- Chin, M.; Ginoux, P.; Kinne, S.; Torres, O.; Holben, B.N.; Duncan, B.N.; Martin, R.V.; Logan, J.A.; Higurashi, A.; Nakajima, T. Tropospheric aerosol optical thickness from the GOCART model and comparisons with satellite and Sun photometer measurements. J. Atmos. Sci. 2002, 59, 461–483. [Google Scholar] [CrossRef]
- Koehler, K.A.; Kreidenweis, S.M.; DeMott, P.J.; Prenni, A.J.; Carrico, C.M.; Ervens, B.; Feingold, G. Water activity and activation diameters from hygroscopicity data—Part II: Application to organic species. Atmos. Chem. Phys. 2006, 6, 795–809. [Google Scholar] [CrossRef]
- Andreae, M.O.; Rosenfeld, D. Aerosol–cloud–precipitation interactions. Part 1. The nature and sources of cloud-active aerosols. Earth-Sci. Rev. 2008, 89, 13–41. [Google Scholar] [CrossRef]
- DeMott, P.J.; Prenni, A.J.; Liu, X.; Kreidenweis, S.M.; Petters, M.D.; Twohy, C.H.; Richardson, M.S.; Eidhammer, T.; Rogers, D.C. Predicting global atmospheric ice nuclei distributions and their impacts on climate. Proc. Natl. Acad. Sci. USA 2010, 107, 11217–11222. [Google Scholar] [CrossRef] [PubMed]
- Shi, J.J.; Matsui, T.; Tao, W.-K.; Tan, Q.; Peters-Lidard, C.; Chin, M.; Pickering, K.; Guy, N.; Lang, S.; Kemp, E.M. Implementation of an aerosol-cloud microphysics-radiation coupling into the NASA Unified WRF: Simulation results for the 6–7 August 2006 AMMA Special Observing Period. Q. J. R. Meteorol. Soc. 2014. [Google Scholar] [CrossRef]
- Tao, W.-K.; Shi, J.J.; Chen, S.S.; Lang, S.; Lin, P.-L.; Hong, S.-Y.; Peters-Lidard, C.; Hou, A. The impact of microphysical schemes on hurricane intensity and track. Asia-Pac. J. Atmos. Sci. 2011, 47, 1–16. [Google Scholar] [CrossRef]
- Chou, M.-D.; Suarez, M.J. A Solar Radiation Parameterization (CLIRAD-SW) for Atmospheric Studies; NASA Tech. Rep. NASA/TM-1999-10460; Washington, DC, USA, 1999; Volume 15, pp. 1–38. [Google Scholar]
- Ek, M.B.; Mitchell, K.E.; Lin, Y.; Rogers, E.; Grunmann, P.; Koren, V.; Gayno, G.; Tarpley, J.D. Implementation of Noah land surface model advances in the National Centers for Environmental Prediction operational mesoscale Eta Model. J. Geophys. Res. 2003, 108, 8851. [Google Scholar] [CrossRef]
- Hong, S.Y.; Noh, Y.; Dudhia, J. A new vertical diffusion package with an explicit treatment of entrainment processes. Mon. Weather Rev. 2006, 134, 2318–2341. [Google Scholar] [CrossRef]
- Grell, G.A.; Devenyi, D. A generalized approach to parameterizing convection combining ensemble and data assimilation techniques. Geophys. Res. Lett. 2002, 29, 1693. [Google Scholar] [CrossRef]
- Lin, M.; Holloway, T.; Carmichael, G.R.; Fiore, A.M. Quantifying pollution inflow and outflow over East Asia in spring with regional and global models. Atmos. Chem. Phys. 2010, 10, 4221–4239. [Google Scholar] [CrossRef]
- Stockwell, W.R.; Middleton, P.; Chang, J.S.; Tang, X. The Second Generation Regional Acid Deposition Model Chemical Mechanism for Regional Air Quality Modeling. J. Geophys. Res. 1990, 95, 16343–16367. [Google Scholar] [CrossRef]
- Gross, A.; Stockwell, W. RComparison of the EMEP, RADM2 and RACM Mechanisms. J. Atmos. Chem. 2003, 44, 151–170. [Google Scholar] [CrossRef]
- Emmons, L.K.; Walters, S.; Hess, P.G.; Lamarque, J.-F.; Pfister, G.G.; Fillmore, D.; Granier, C.; Guenther, A.; Kinnison, D.; Laepple, T.; et al. Description and evaluation of the Model for Ozone and Related chemical Tracers, version 4 (MOZART-4). Geosci. Model Dev. 2010, 3, 43–67. [Google Scholar] [CrossRef] [Green Version]
- Wiedinmyer, C.; Akagi, S.K.; Yokelson, R.J.; Emmons, L.K.; Al-Saadi, J.A.; Orlando, J.J.; Soja, A.J. The Fire INventory from NCAR (FINN): A high resolution global model to estimate the emissions from open burning. Geosci. Model Dev. 2011, 4, 625–641. [Google Scholar] [CrossRef]
- Guenther, A.; Karl, T.; Harley, P.; Wiedinmyer, C.; Palmer, P.I.; Geron, C. Estimates of global terrestrial isoprene emissions using MEGAN (Model of Emissions of Gases and Aerosols from Nature). Atmos. Chem. Phys. 2006, 6, 3181–3210. [Google Scholar] [CrossRef]
- Ginoux, P.; Chin, M.; Tegen, I.; Prospero, J.; Holben, B.; Dubovik, O.; Lin, S.-J. Sources and global distributions of dust aerosols simulated with the GOCART model. J. Geophys. Res. 2001, 106, 20255–20273. [Google Scholar] [CrossRef]
- Gong, S.L. A parameterization of sea-salt aerosol source function for sub- and super-micron particles. Glob. Biogeochem. Cycles 2003, 17, 1097. [Google Scholar] [CrossRef]
- Thunis, P.; Cuvelier, C. Impact of biogenic emissions on ozone formation in the Mediterranean area—A BEMA modeling study. Atmos. Environ. 2000, 34, 467–481. [Google Scholar] [CrossRef]
- Tao, Z.; Larson, S.M.; Wuebbles, D.J.; Williams, A.; Caughey, M. A summer simulation of biogenic contributions to ground-level ozone over the continental United States. J. Geophys. Res. 2003, 108, 4404. [Google Scholar] [CrossRef]
- Tao, Z.; Larson, S.; Williams, A.; Caughey, M.; Wuebbles, D.J. Sensitivity of regional ozone concentrations to temporal distribution of emissions. Atmos. Environ. 2004, 38, 6279–6285. [Google Scholar] [CrossRef]
- Xie, P.; Yatagai, A.; Chen, M.; Hayasaka, T.; Fukushima, Y.; Liu, C.; Yang, S. A gauge-based analysis of daily precipitation over East Asia. J. Hydrometeorol. 2007, 8, 607–626. [Google Scholar] [CrossRef]
- Chen, M.; Shi, W.; Xie, P.; Silva, V.B.S.; Kousky, V.E.; Higgins, R.W.; Janowiak, J.E. Assessing objective techniques for gauge-based analyses of global daily precipitation. J. Geophys. Res. 2008, 113. [Google Scholar] [CrossRef]
- Tao, W.-K.; Li, X. Physical processes determining precipitation enhancement induced by CCN concentrations. J. Geophys. Res. 2015. submitted. [Google Scholar]
- Yang, Q.; Gustafson, W.I., Jr.; Fast, J.D.; Wang, H.; Easter, R.C.; Morrison, H.; Lee, Y.-N.; Chapman, E.G.; Spak, S.N.; Mena-Carrasco, M.A. Assessing regional scale predictions of aerosols, marine stratocumulus, and their interactions during VOCALS-Rex using WRF-Chem. Atmos. Chem. Phys. 2011, 11, 11951–11975. [Google Scholar] [CrossRef]
- Seinfeld, J.H.; Pandis, S.N. Atmospheric Chemistry and Physics—From Air Pollution to Climate Change, 2nd ed.; John Wiley & Sons: New York, NY, USA, 2006; p. 1326. [Google Scholar]
- Murazaki, K.; Hess, P. How does climate change contribute to surface ozone change over the United States? J. Geophys. Res. 2006, 111. [Google Scholar] [CrossRef]
© 2015 by the authors; licensee MDPI, Basel, Switzerland. This article is an open access article distributed under the terms and conditions of the Creative Commons Attribution license (http://creativecommons.org/licenses/by/4.0/).
Share and Cite
Tao, Z.; Yu, H.; Chin, M. The Role of Aerosol-Cloud-Radiation Interactions in Regional Air Quality—A NU-WRF Study over the United States. Atmosphere 2015, 6, 1045-1068. https://doi.org/10.3390/atmos6081045
Tao Z, Yu H, Chin M. The Role of Aerosol-Cloud-Radiation Interactions in Regional Air Quality—A NU-WRF Study over the United States. Atmosphere. 2015; 6(8):1045-1068. https://doi.org/10.3390/atmos6081045
Chicago/Turabian StyleTao, Zhining, Hongbin Yu, and Mian Chin. 2015. "The Role of Aerosol-Cloud-Radiation Interactions in Regional Air Quality—A NU-WRF Study over the United States" Atmosphere 6, no. 8: 1045-1068. https://doi.org/10.3390/atmos6081045