A Multi-Year Aerosol Characterization for the Greater Tehran Area Using Satellite, Surface, and Modeling Data

 ,
,
Abstract
:1. Introduction
2. Data and Methods
2.1. Remotely-Sensed Aerosol Data
2.2. Meteorology

| Data Source | Data Type | Latitude (°) | Longitude (°) | Altitude (m AMSL) | Date Range |
|---|---|---|---|---|---|
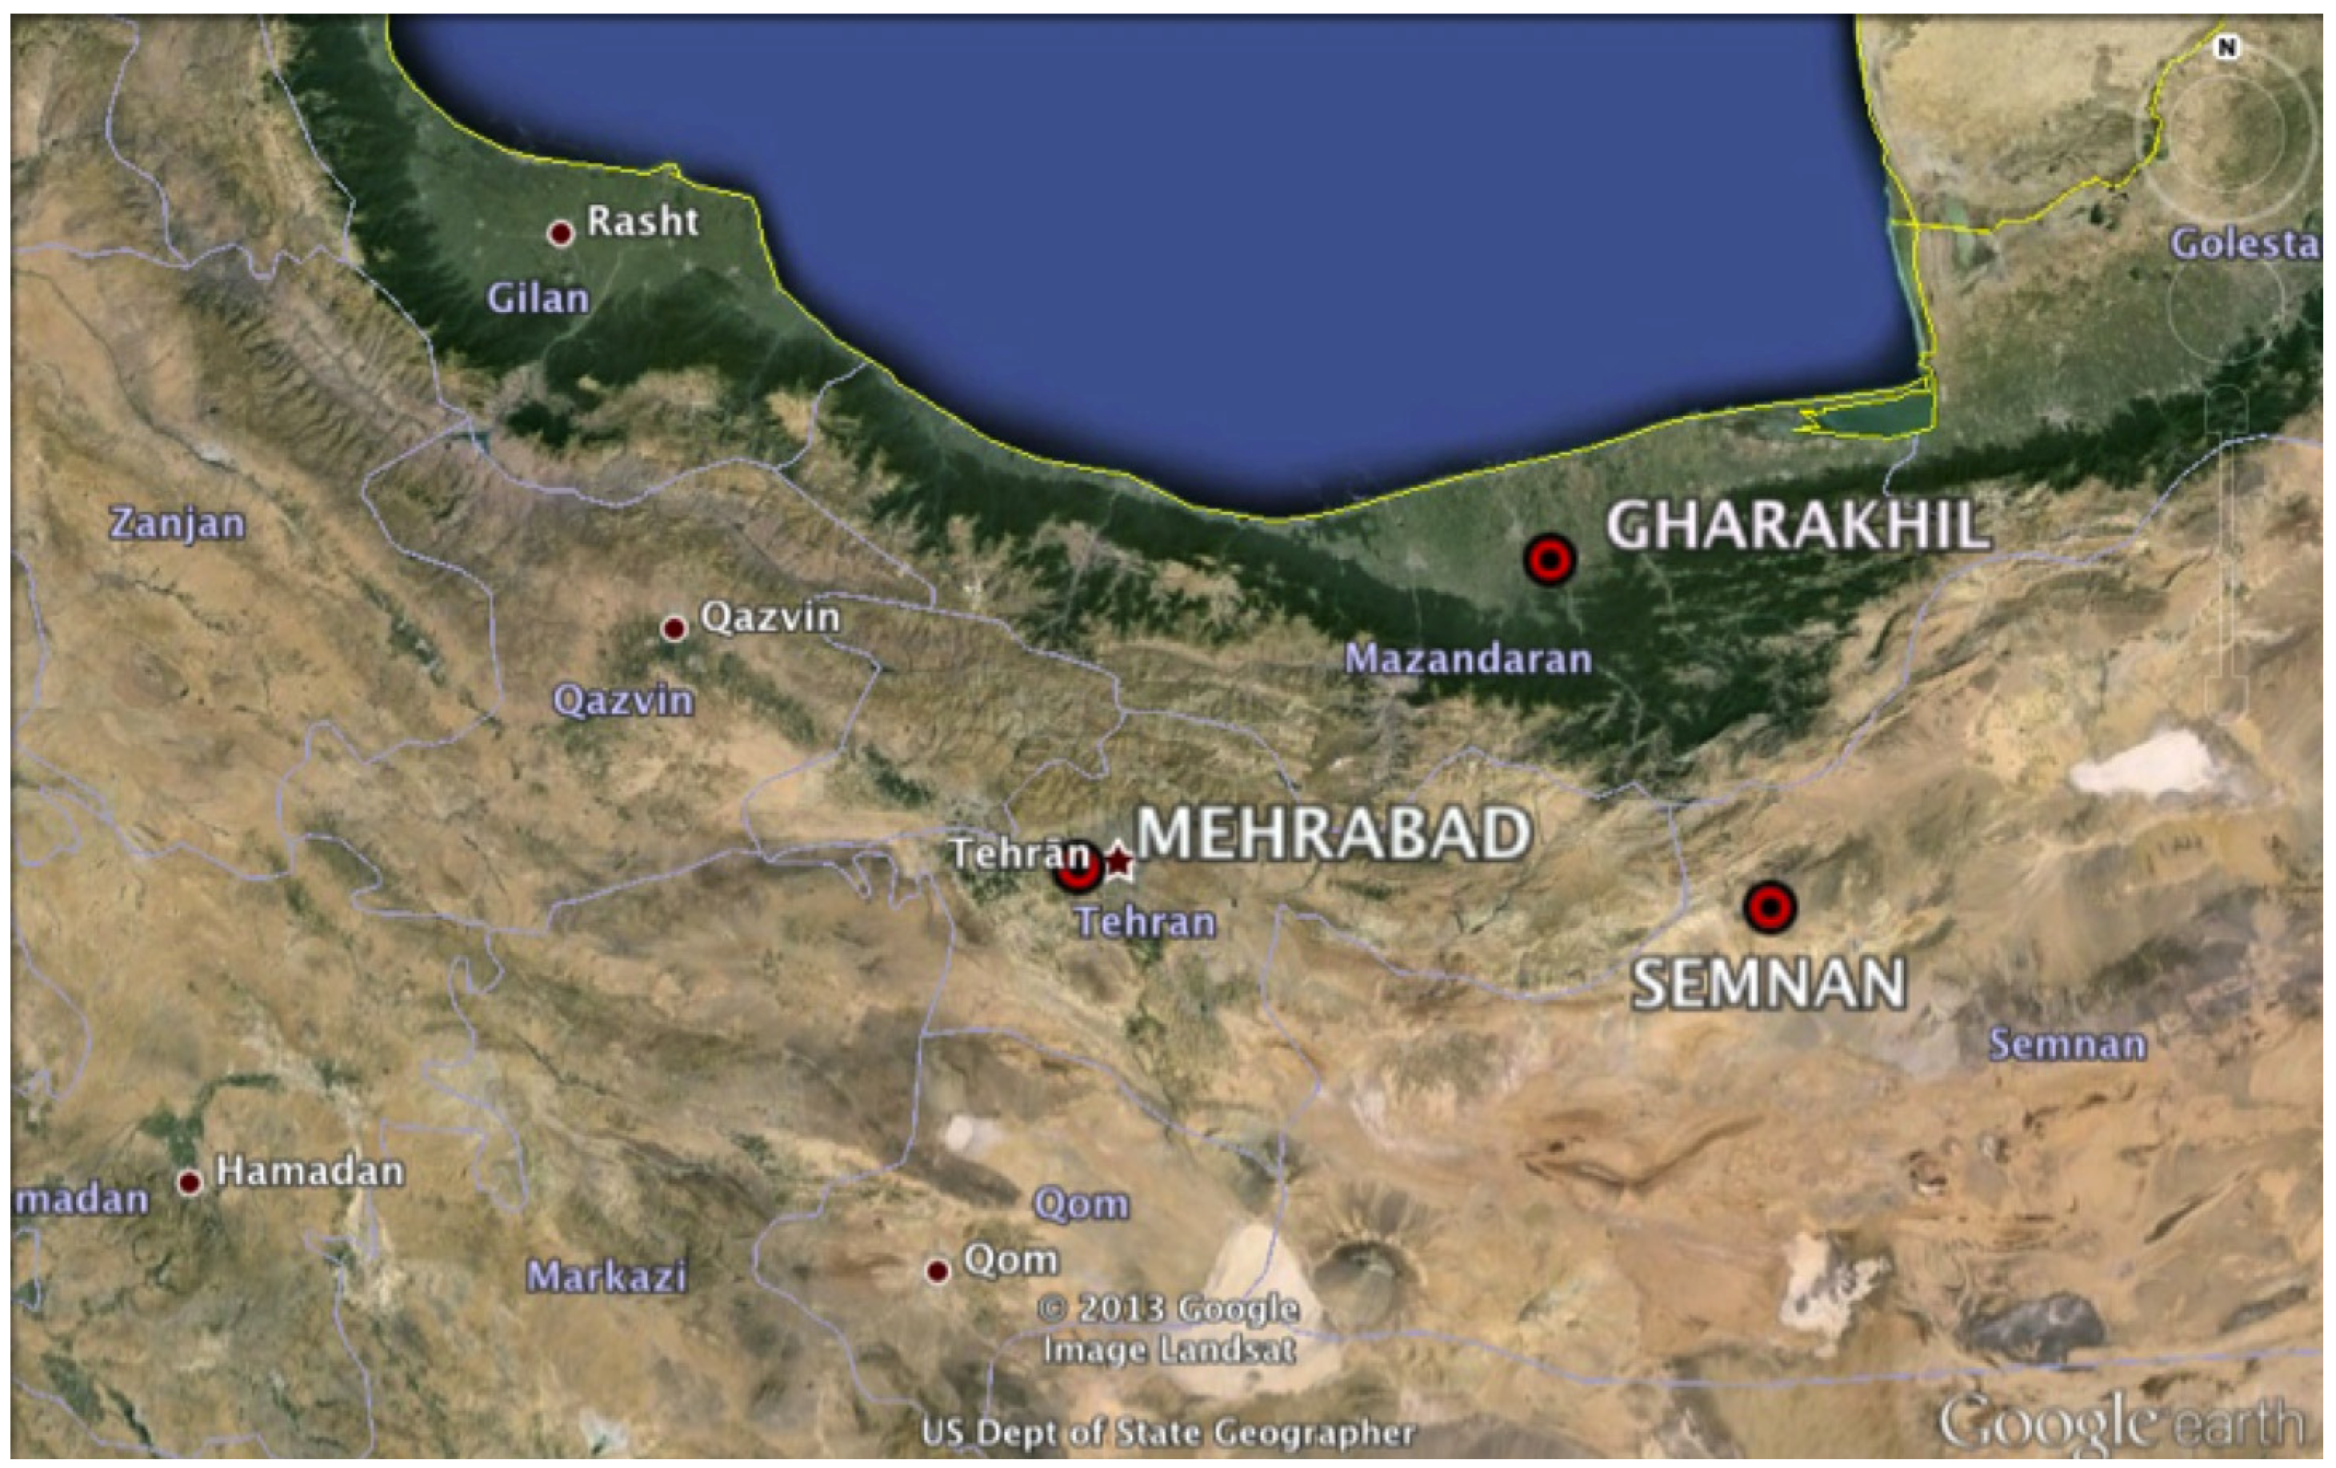
| NCDC: Tehran Mehrabad | Met/Visibility | 35.68 | 51.32 | 1191 | 1/1/2000–12/31/2009 |
| NCDC: Semnan | Met/Visibility | 35.55 | 53.38 | 1131 | 1/4/2000–12/31/2009 |
| NCDC: Gharakhil | Met/Visibility | 36.45 | 52.82 | 14 | 1/25/2000–12/31/2009 |
| NCDC: Mehrabad | Radiosonde | 35.68 | 51.32 | 1191 | 1/1/1980–12/31/2012 |
| MODIS TERRA | Deep Blue AOD, Cloud Fraction | 35–36 | 51–52 | N/A | 3/1/2000–12/31/2009 |
| MODIS AQUA | Deep Blue AOD, Cloud Fraction | 35–36 | 51–52 | N/A | 7/4/2002–12/31/2009 |
| MODIS | FIRMS | 20–55 | 20–70 | N/A | 3/1/2000–12/31/2009 |
| MISR | AOD | 35–36 | 51–52 | N/A | 2/25/2000–12/31/2009 |
| TOMS | UV Aerosol Index | 35–36 | 51.25–52.5 | N/A | 2/24/2000–12/14/2005 |
| OMI | UV Aerosol Index | 35–36 | 51–52 | N/A | 2/24/2000–12/14/2005 |
| GOCART | Speciated AOD | 34–36 | 50–52.5 | N/A | 2/24/2000–12/31/2007 |
| HYSPLIT | Back-trajectories | 35.7 | 51.42 | 500, 1000, 3000 | 1/1/2000–12/31/2009 |
| MERRA | Gridded Reanalysis | 35.5–36.5 | 51.33–52.67 | N/A | 1/1/2001–12/31/2009 |
2.3. Air Mass Back-Trajectory Data
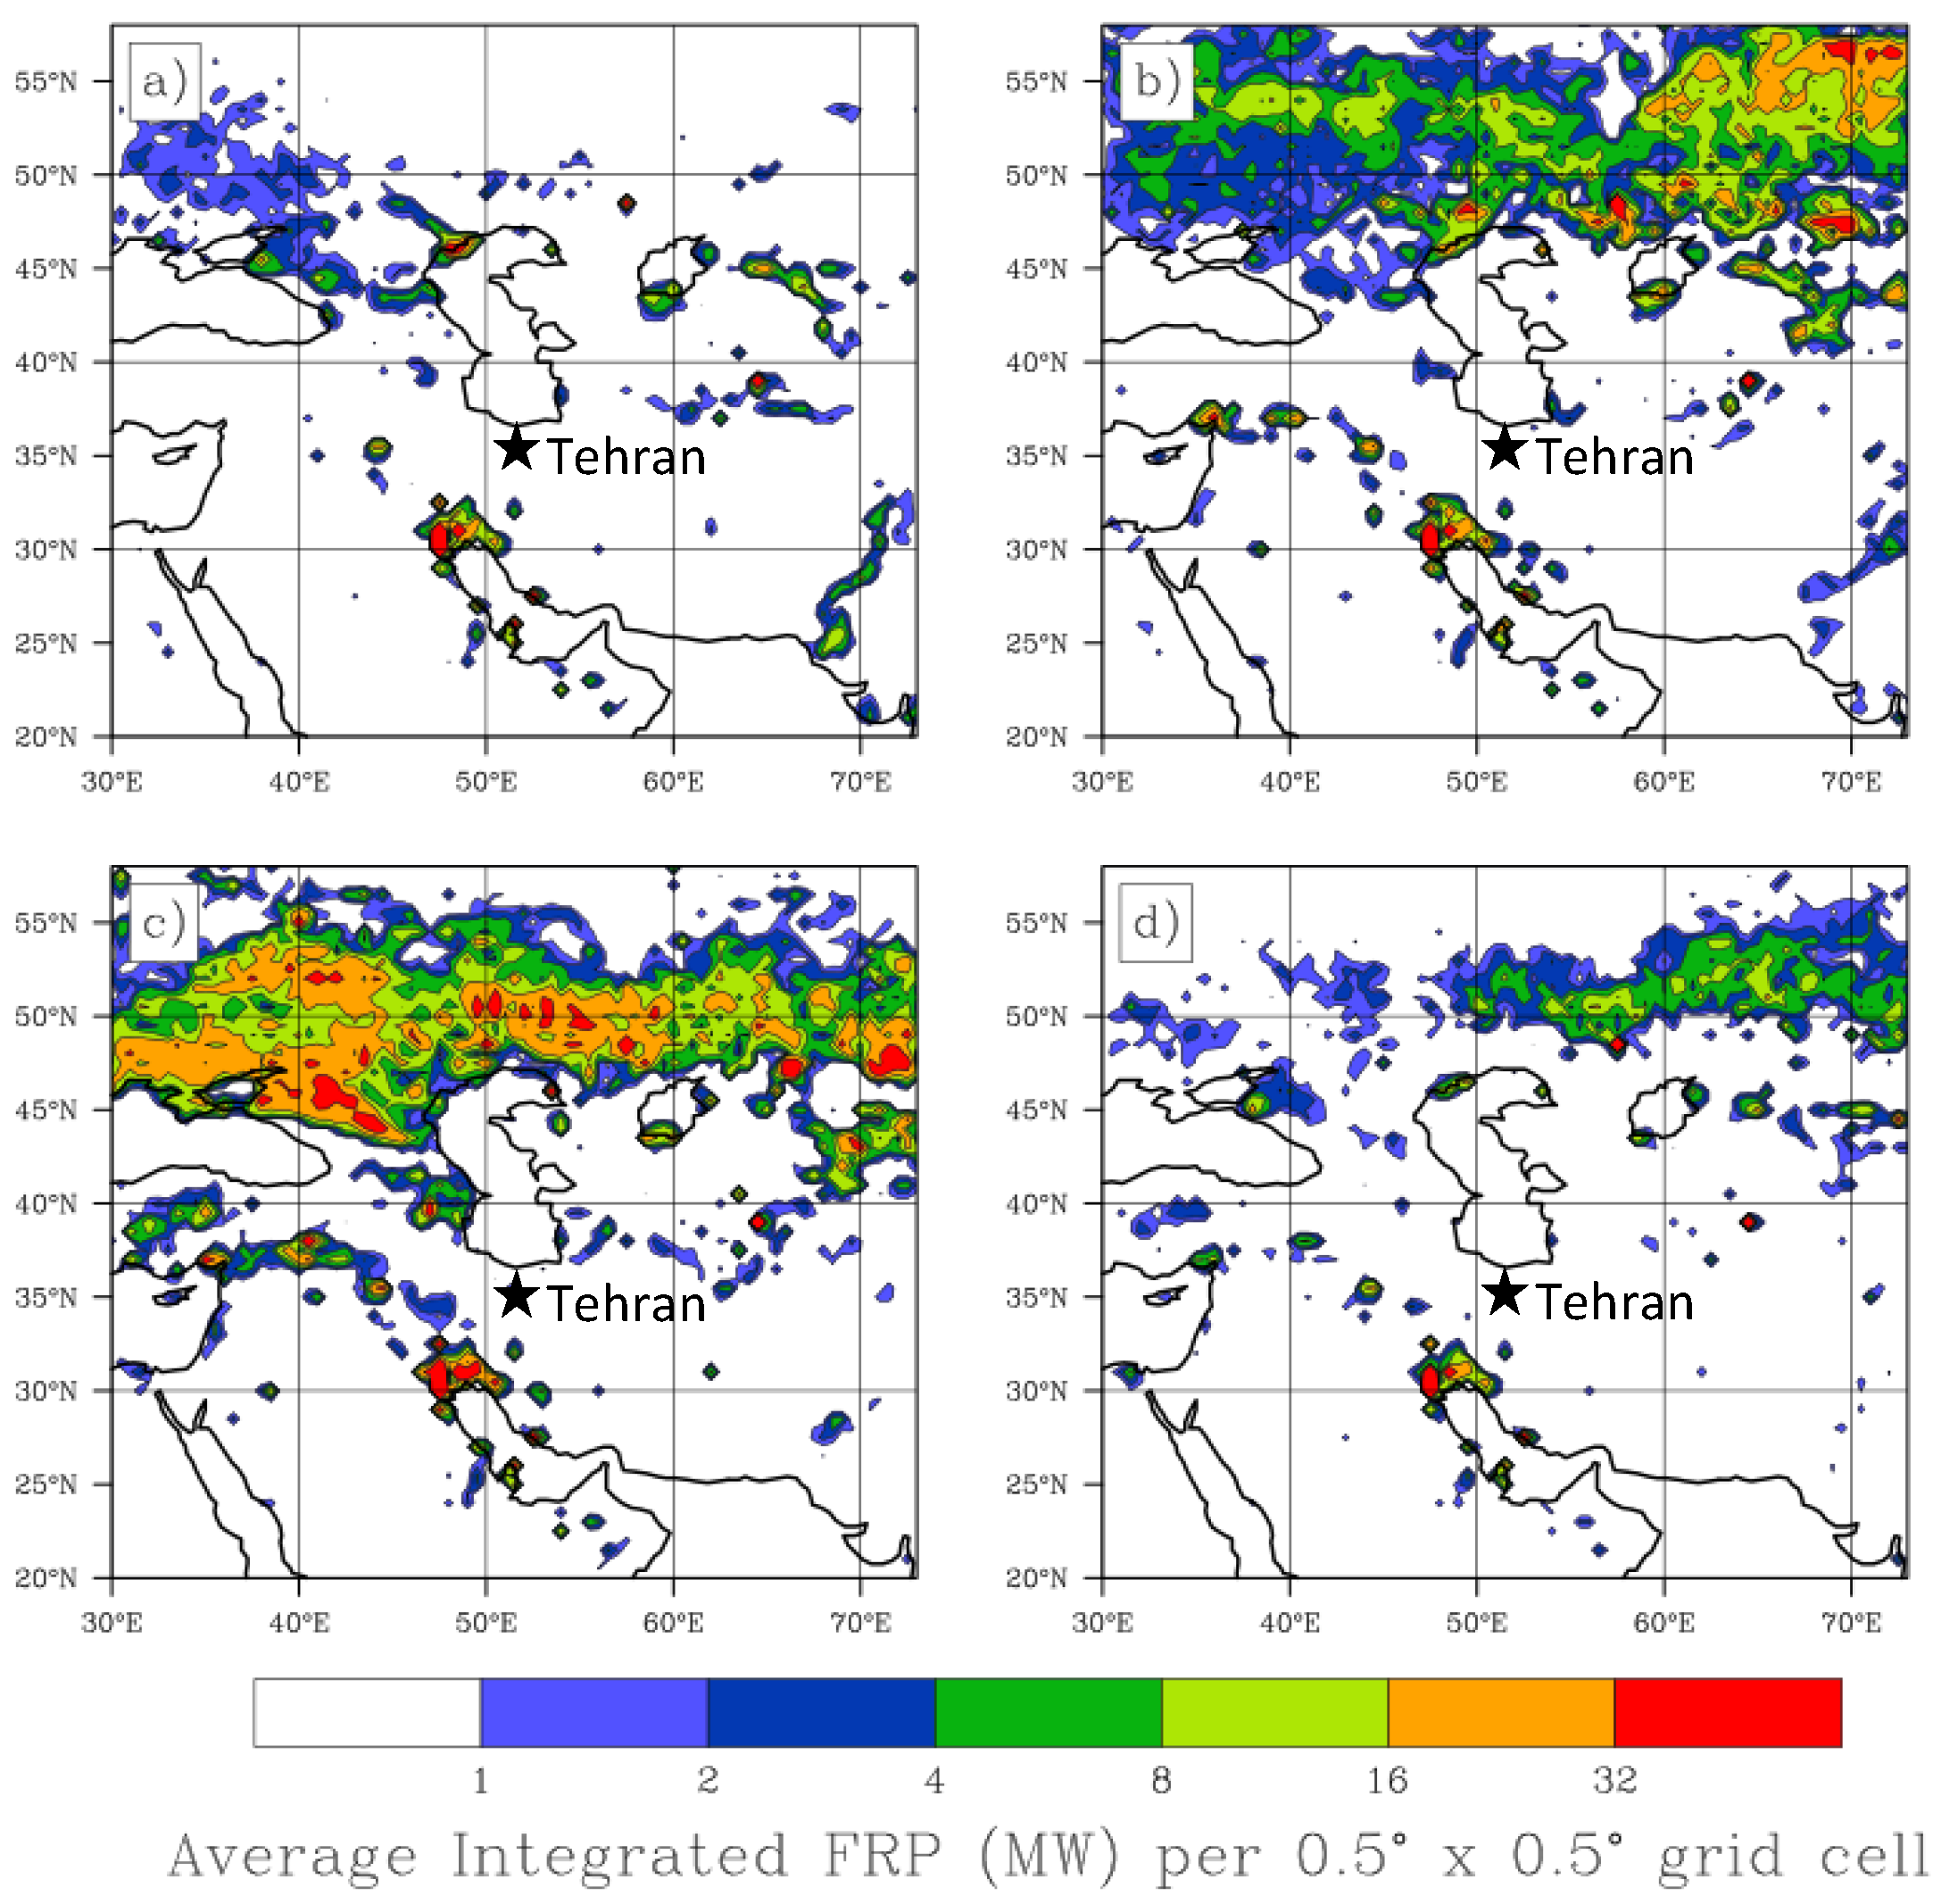
2.4. Satellite Fire Data
2.5. Goddard Ozone Chemistry Aerosol Radiation and Transport (GOCART) model
3. Results
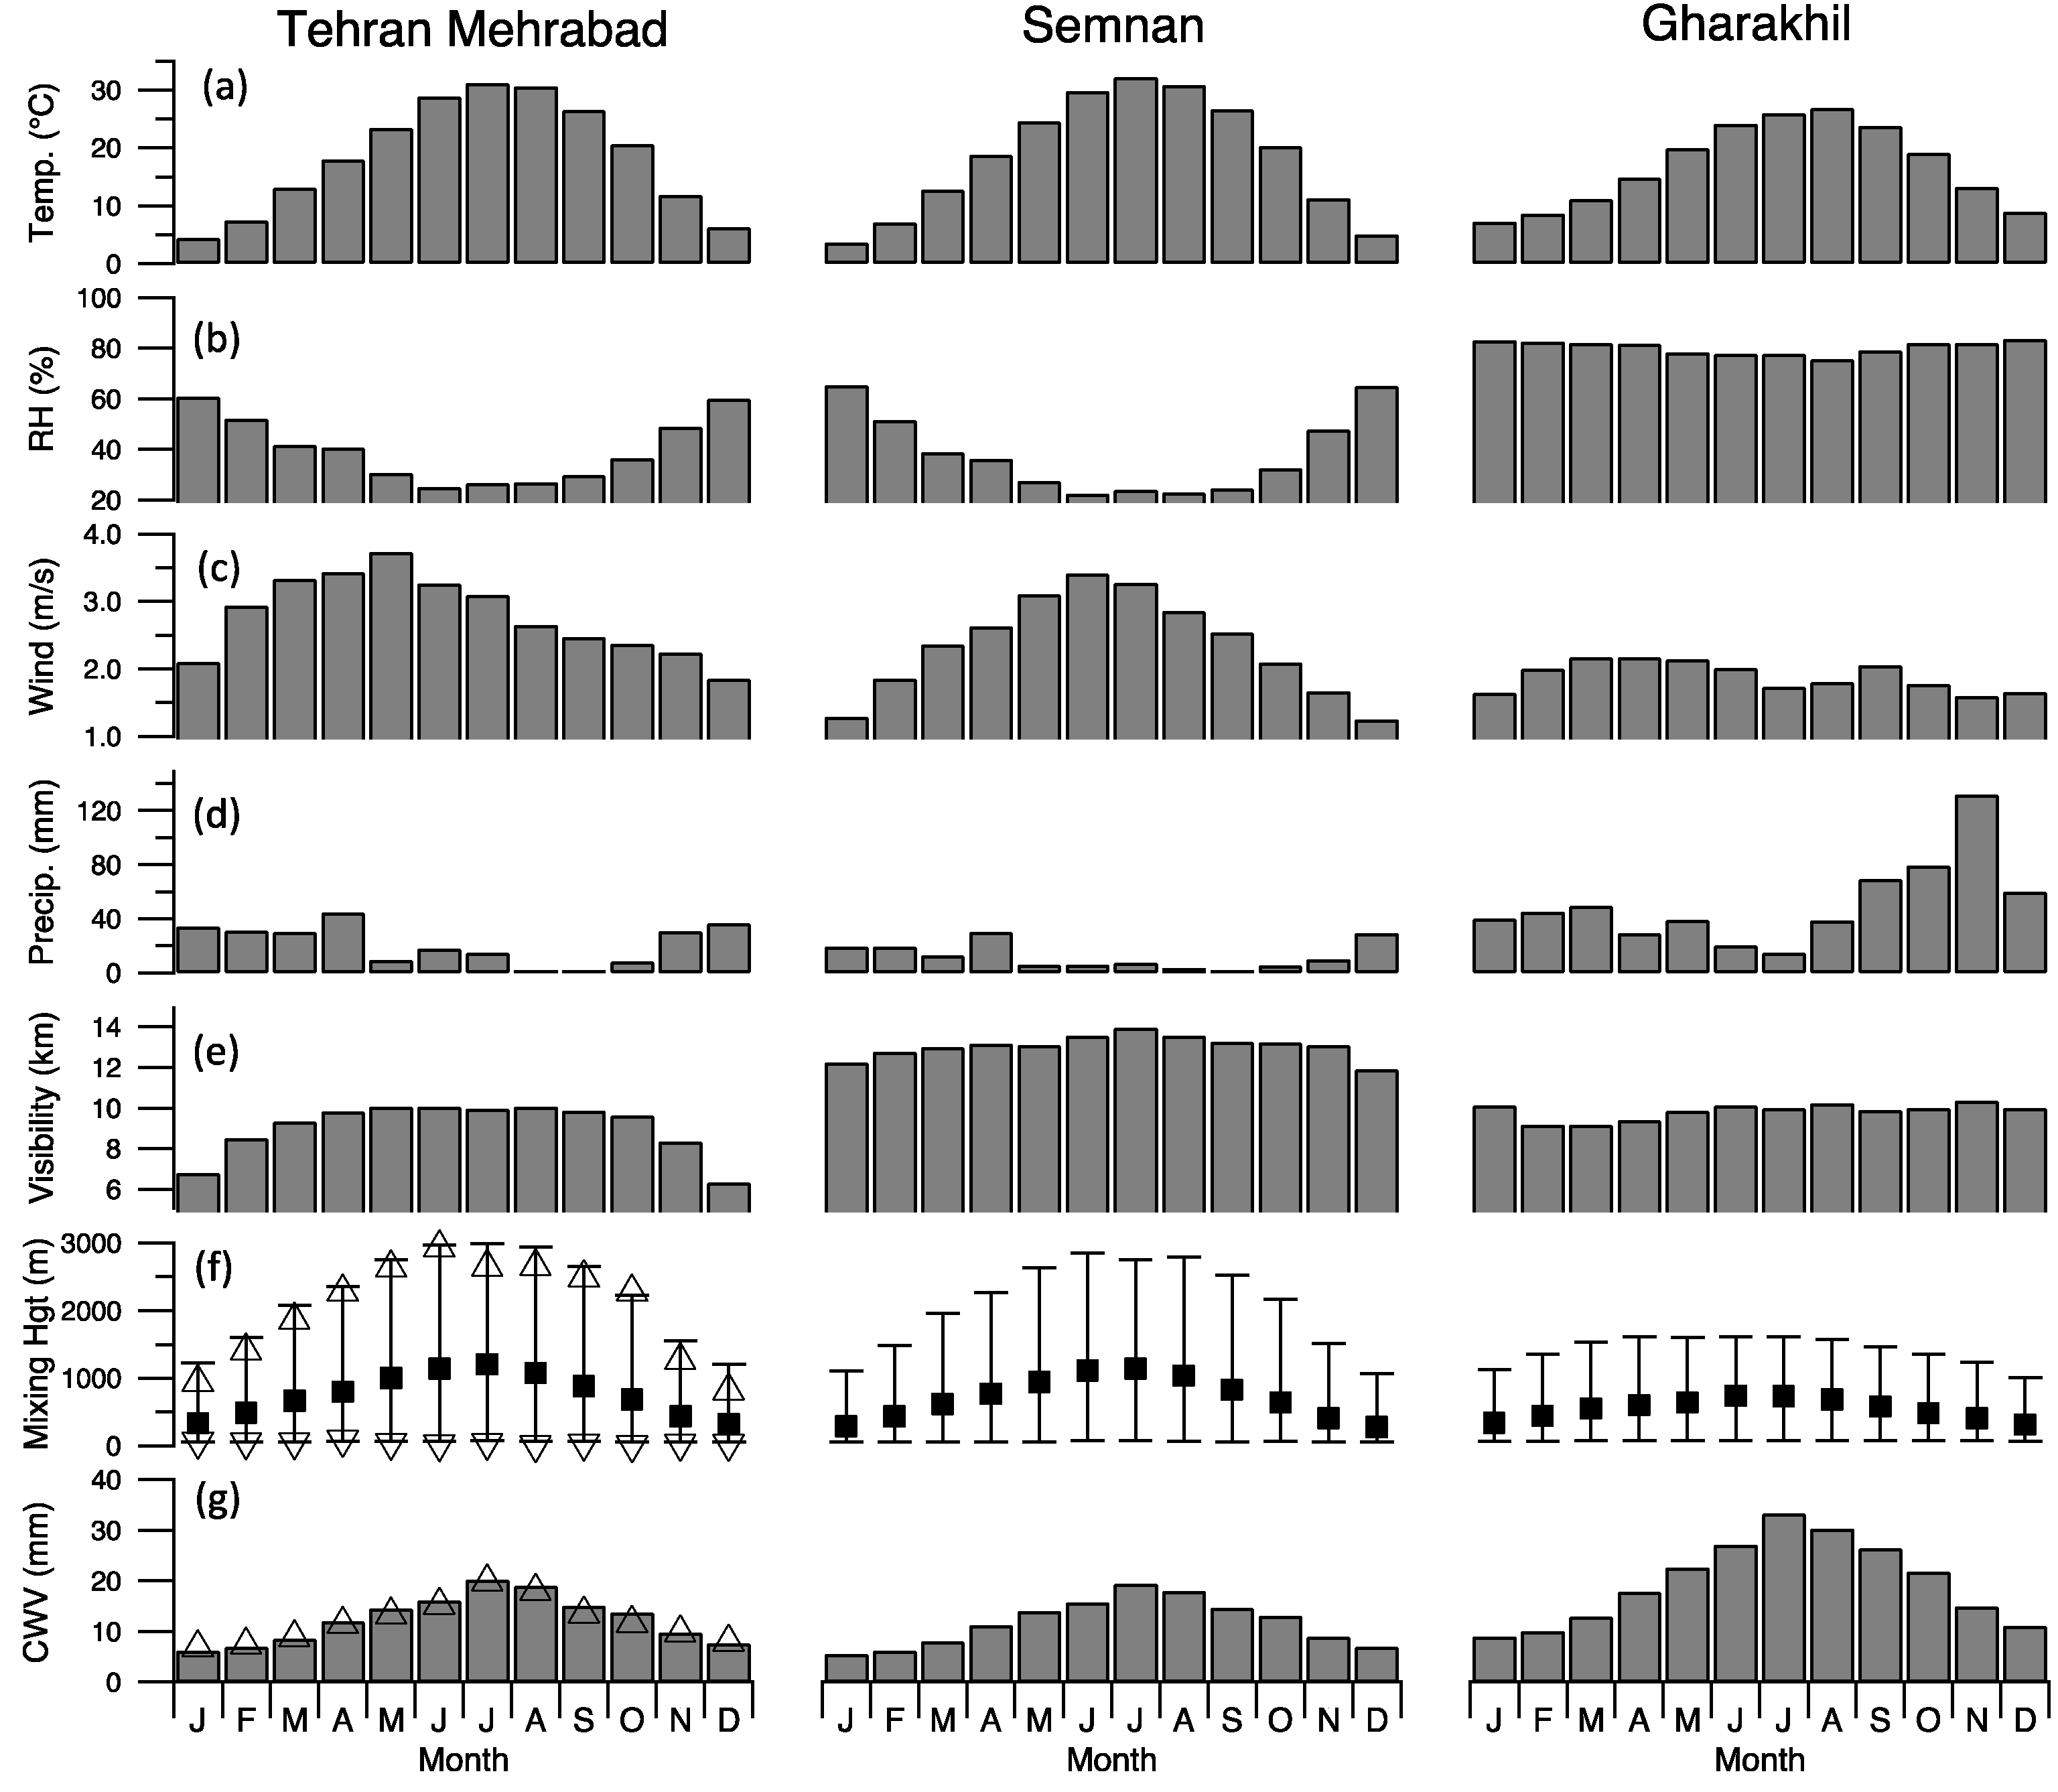
3.1. Local Meteorology

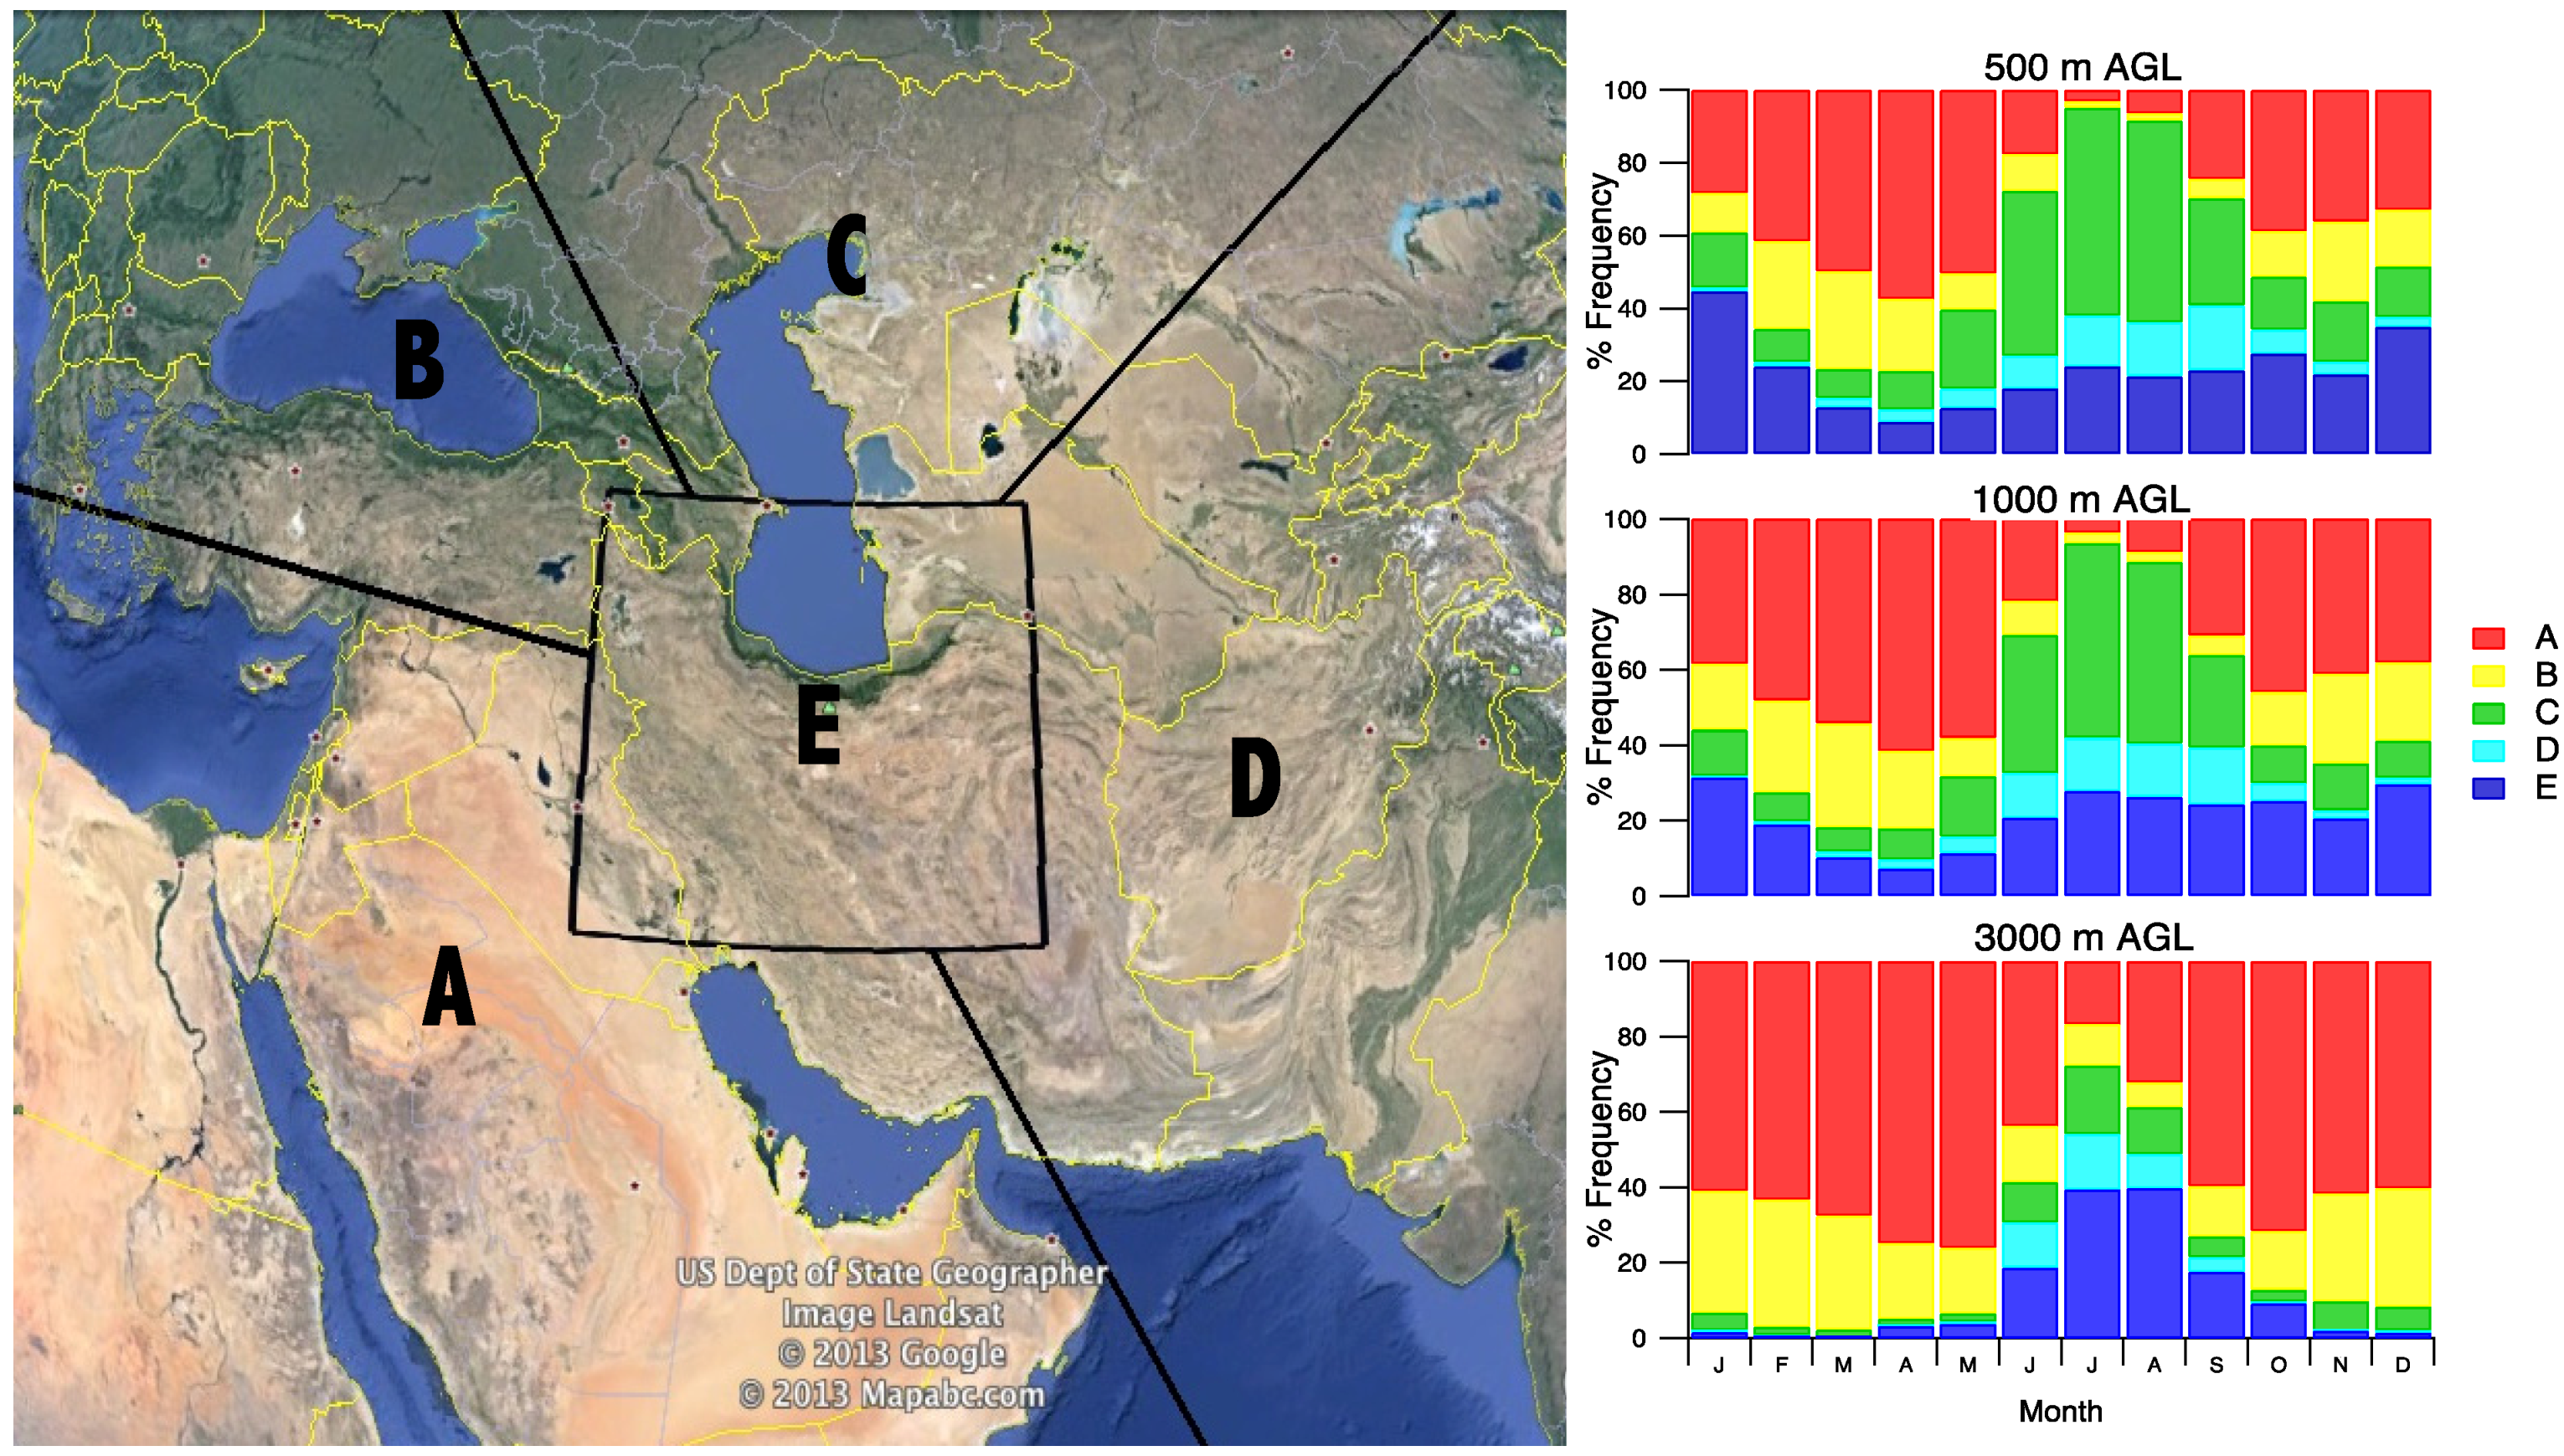
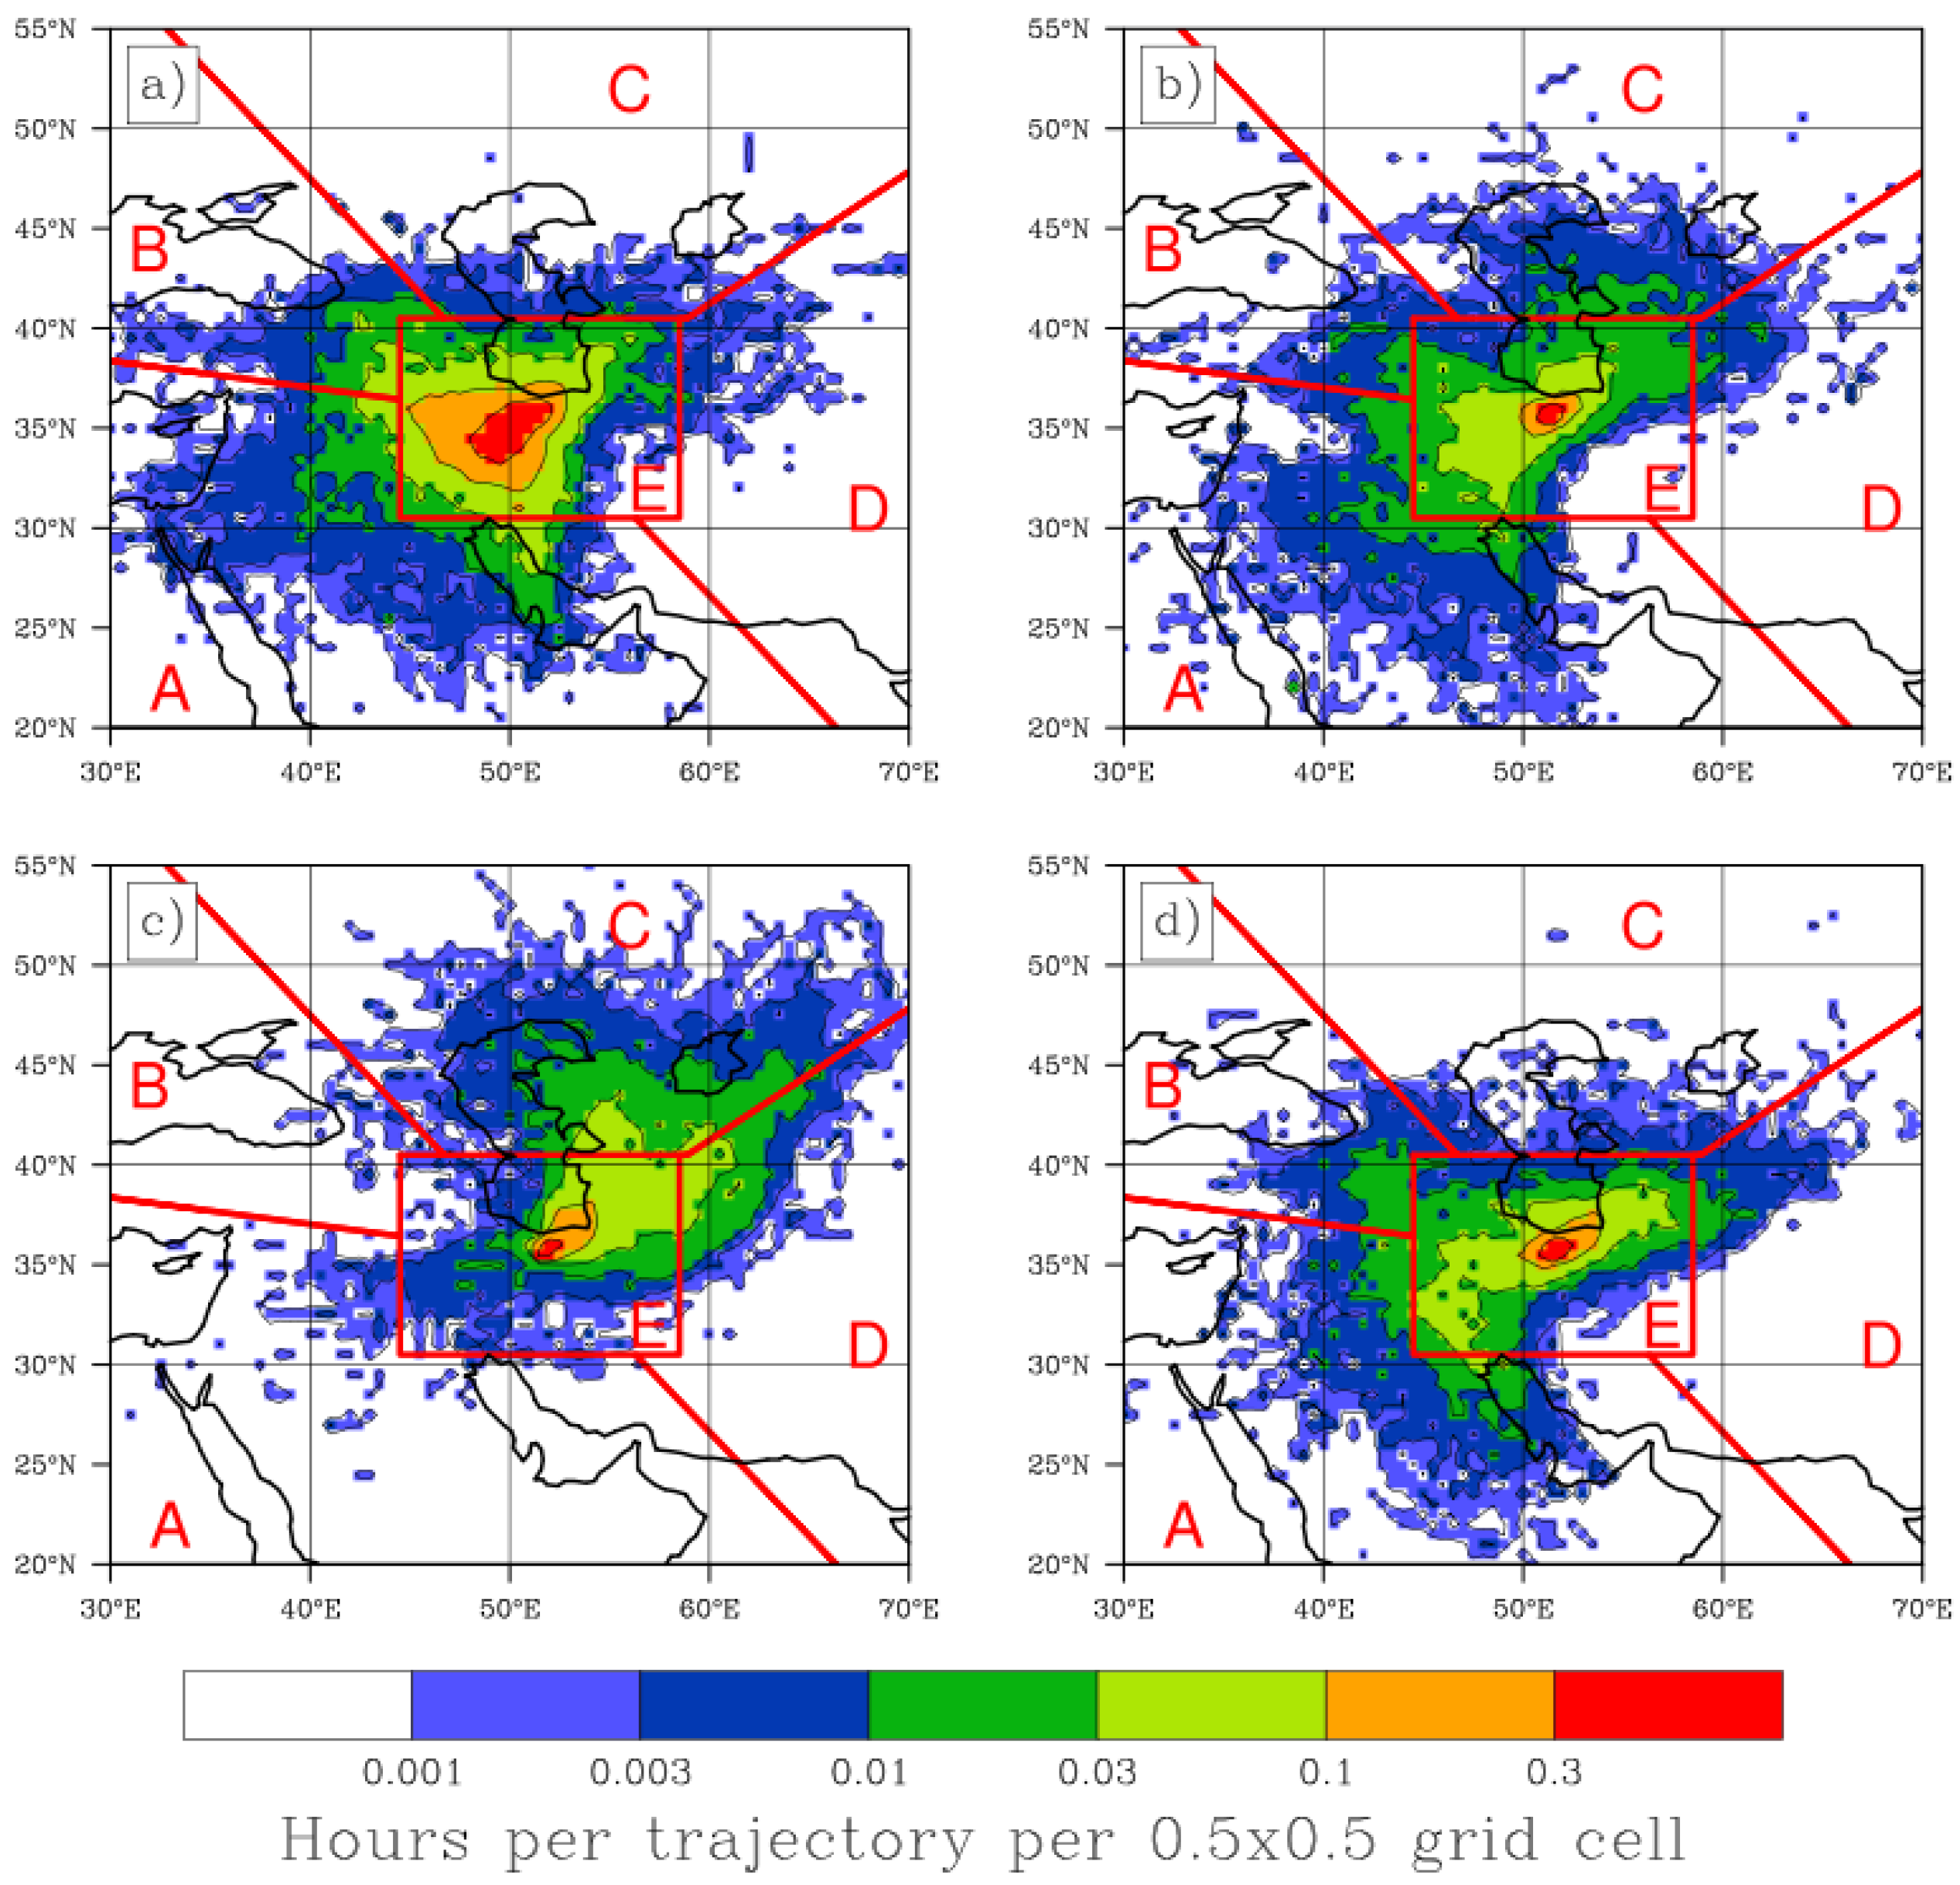
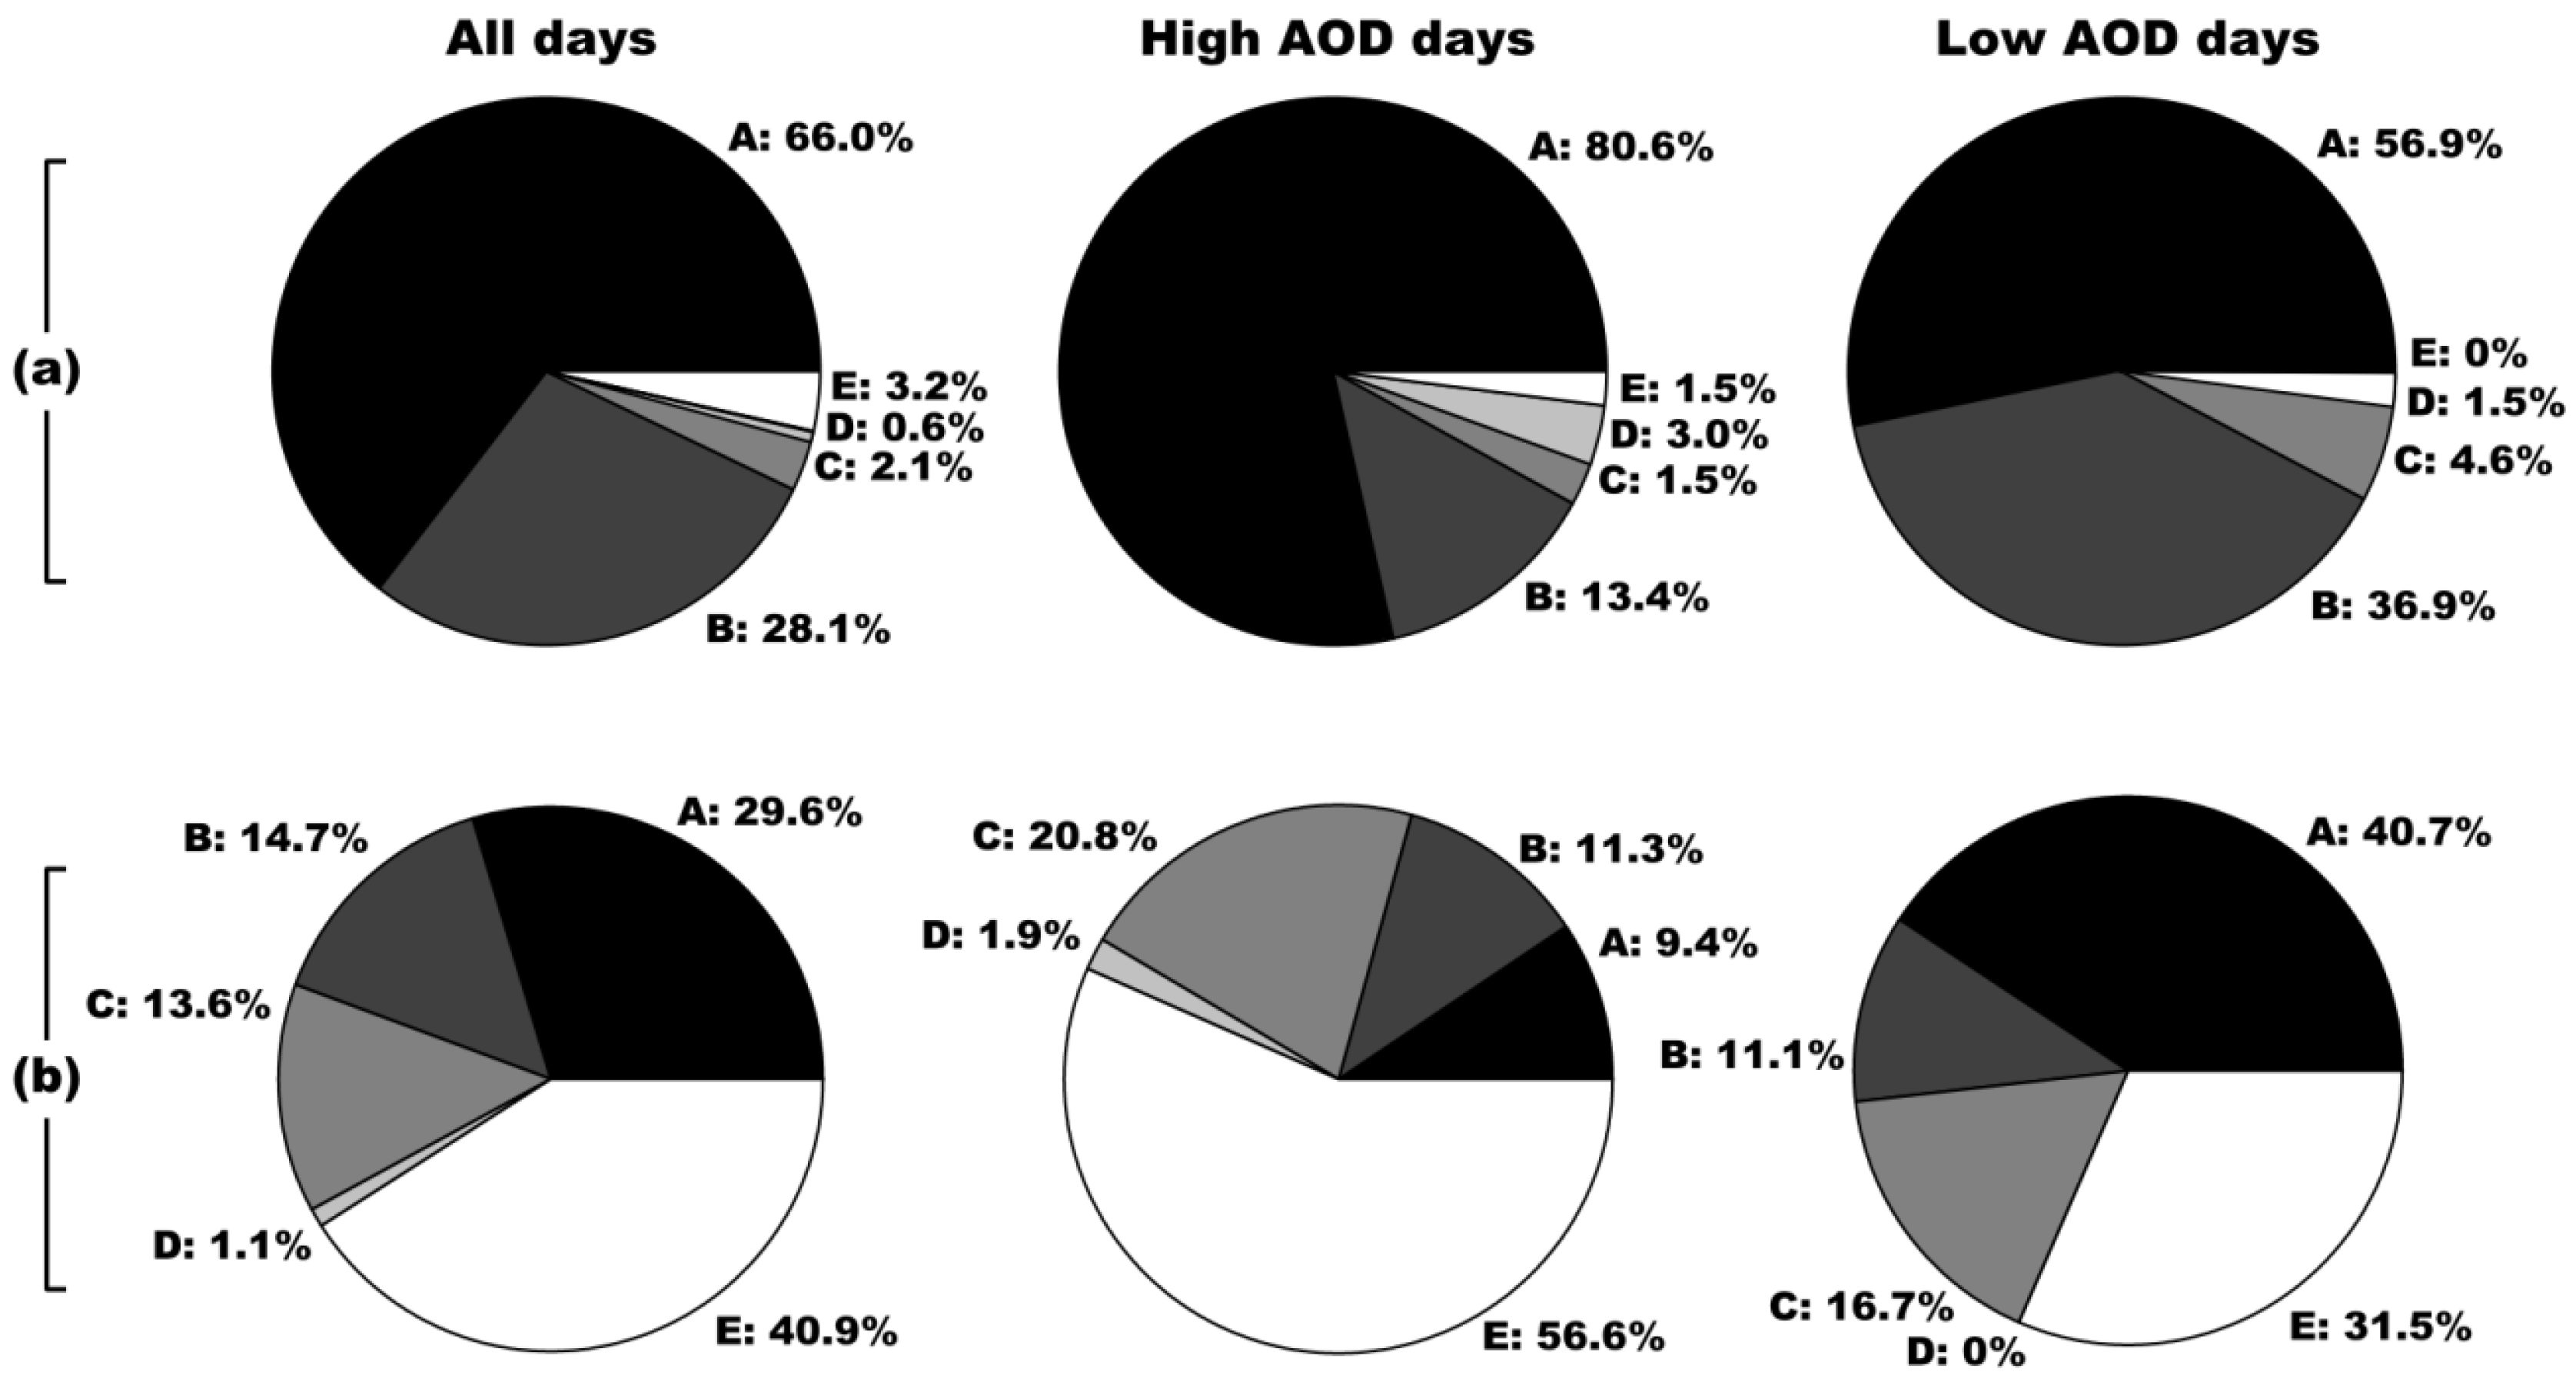
3.2. Air Mass Source Origin

3.3. Regional Fire Patterns

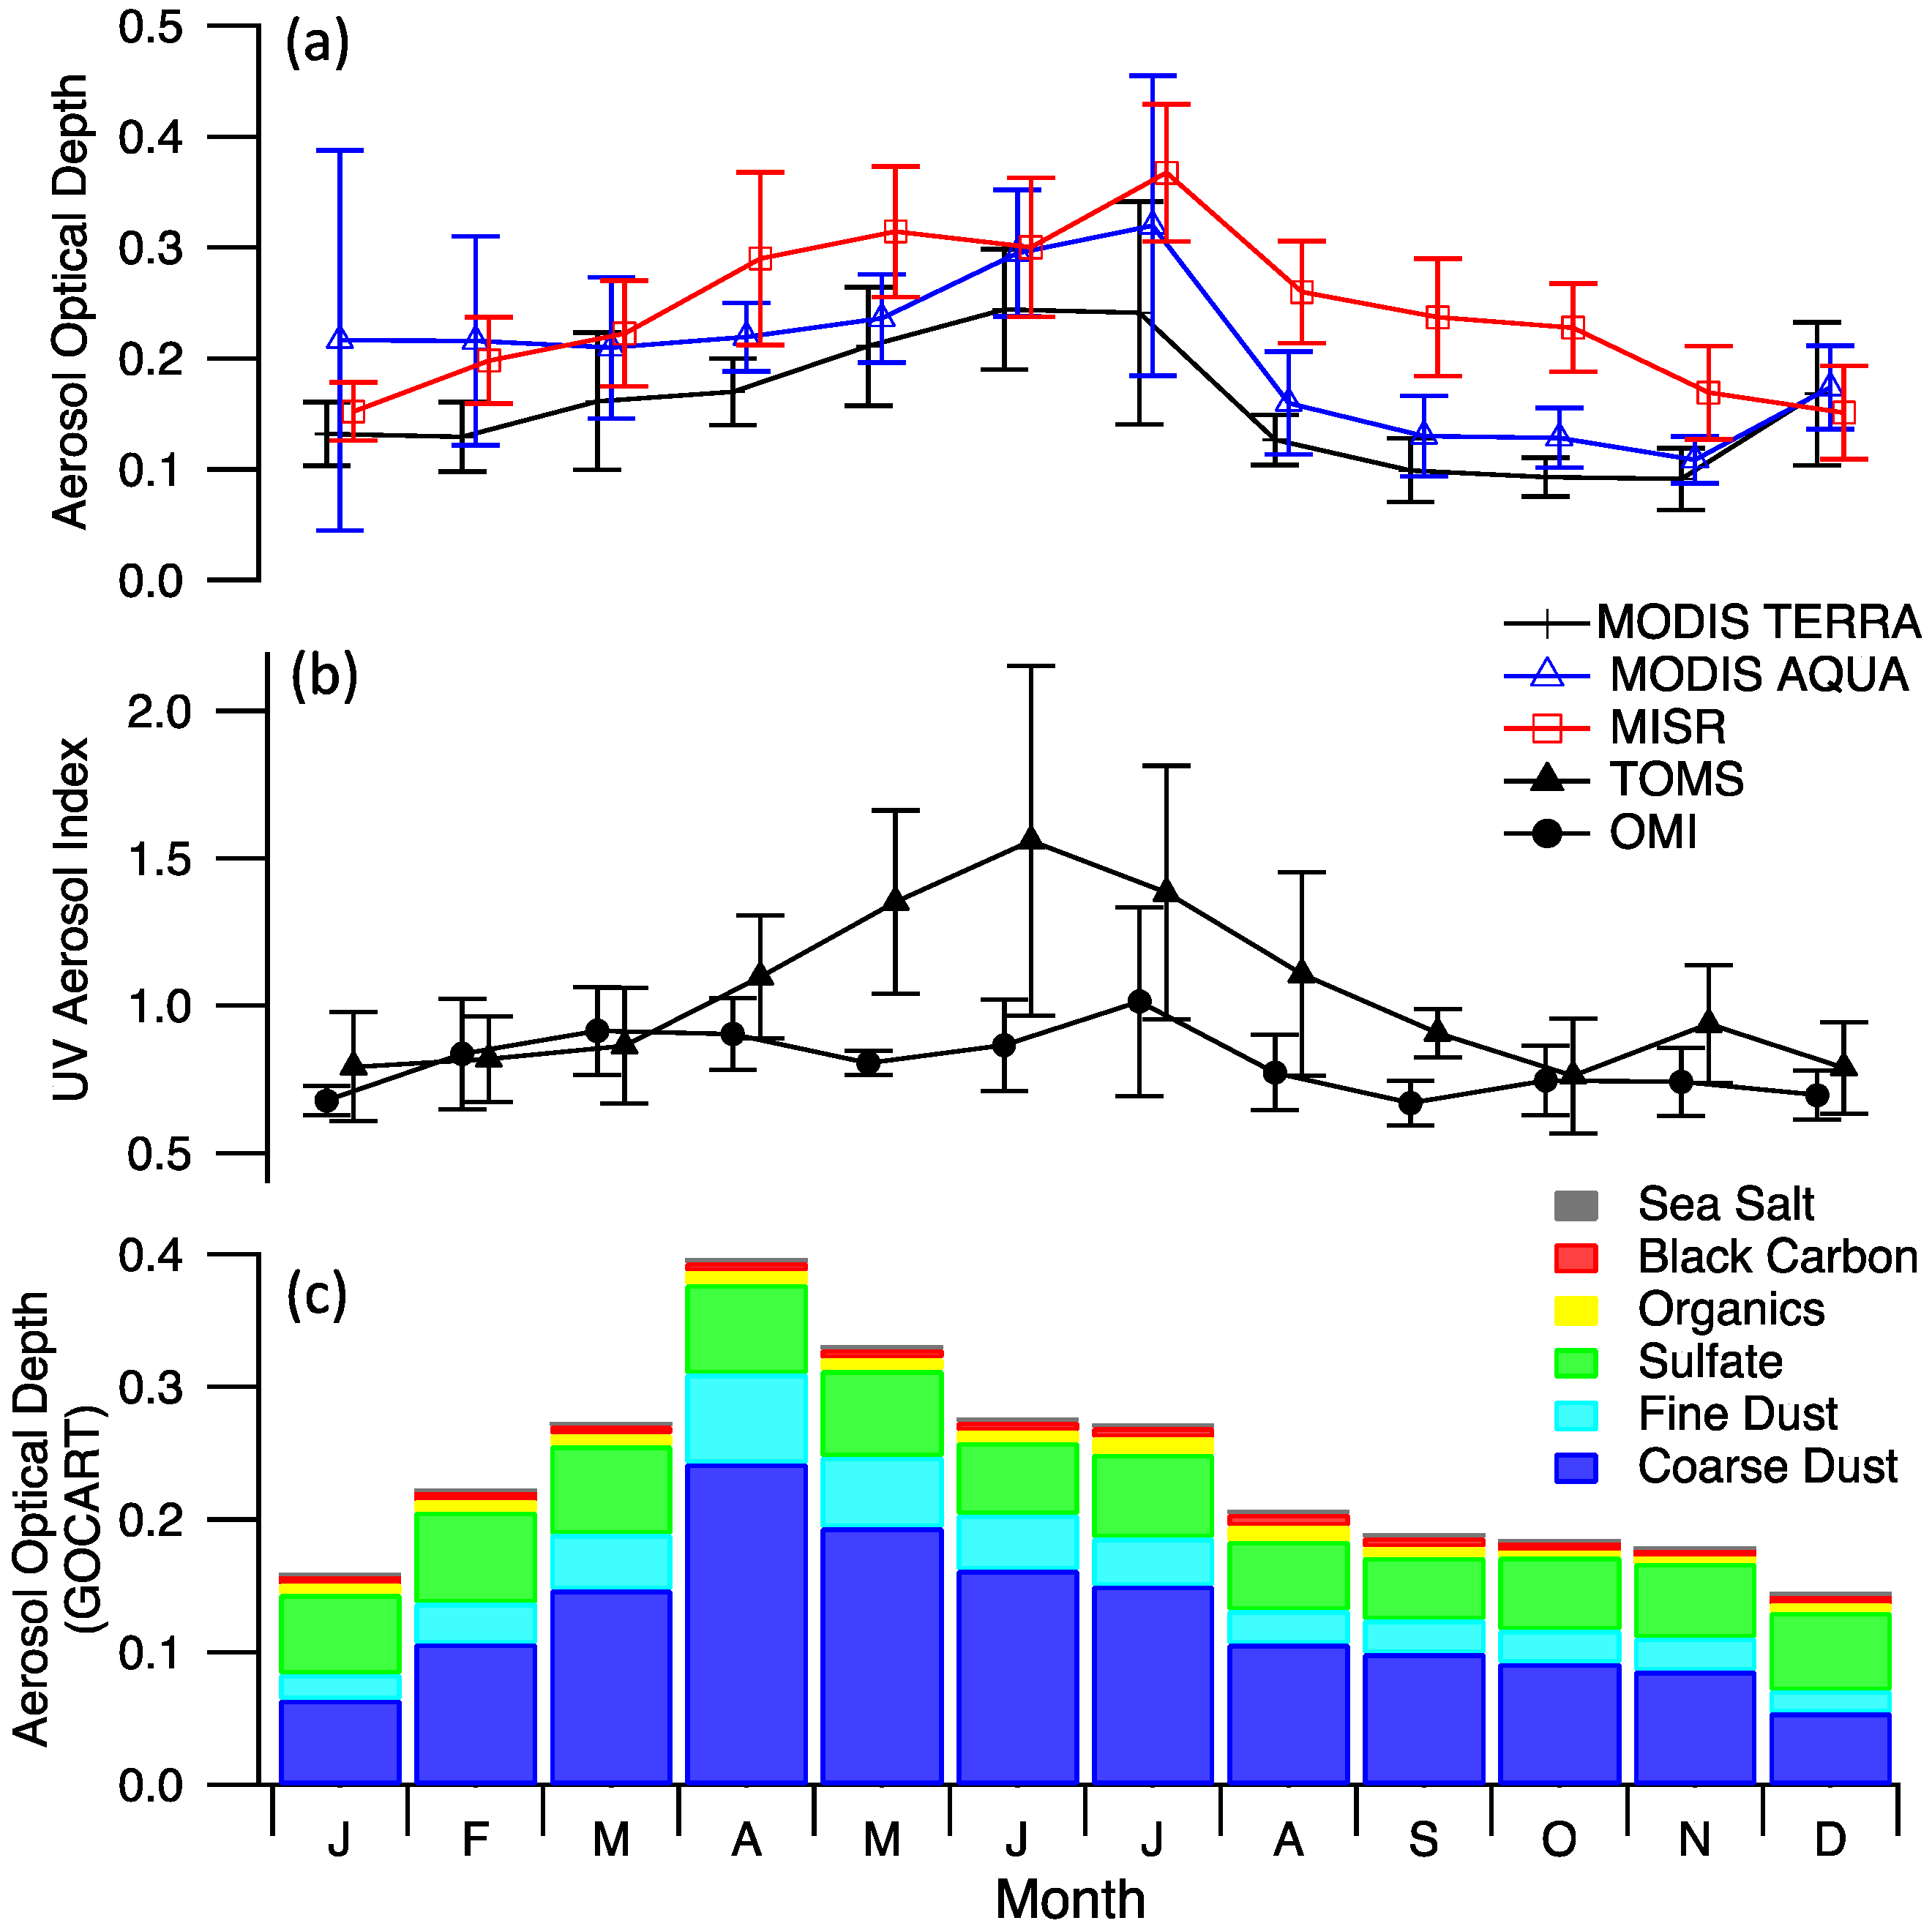
3.4. Remotely-Sensed Aerosol Data
3.5. GOCART
4. Discussion
4.1. Seasonal Climatology
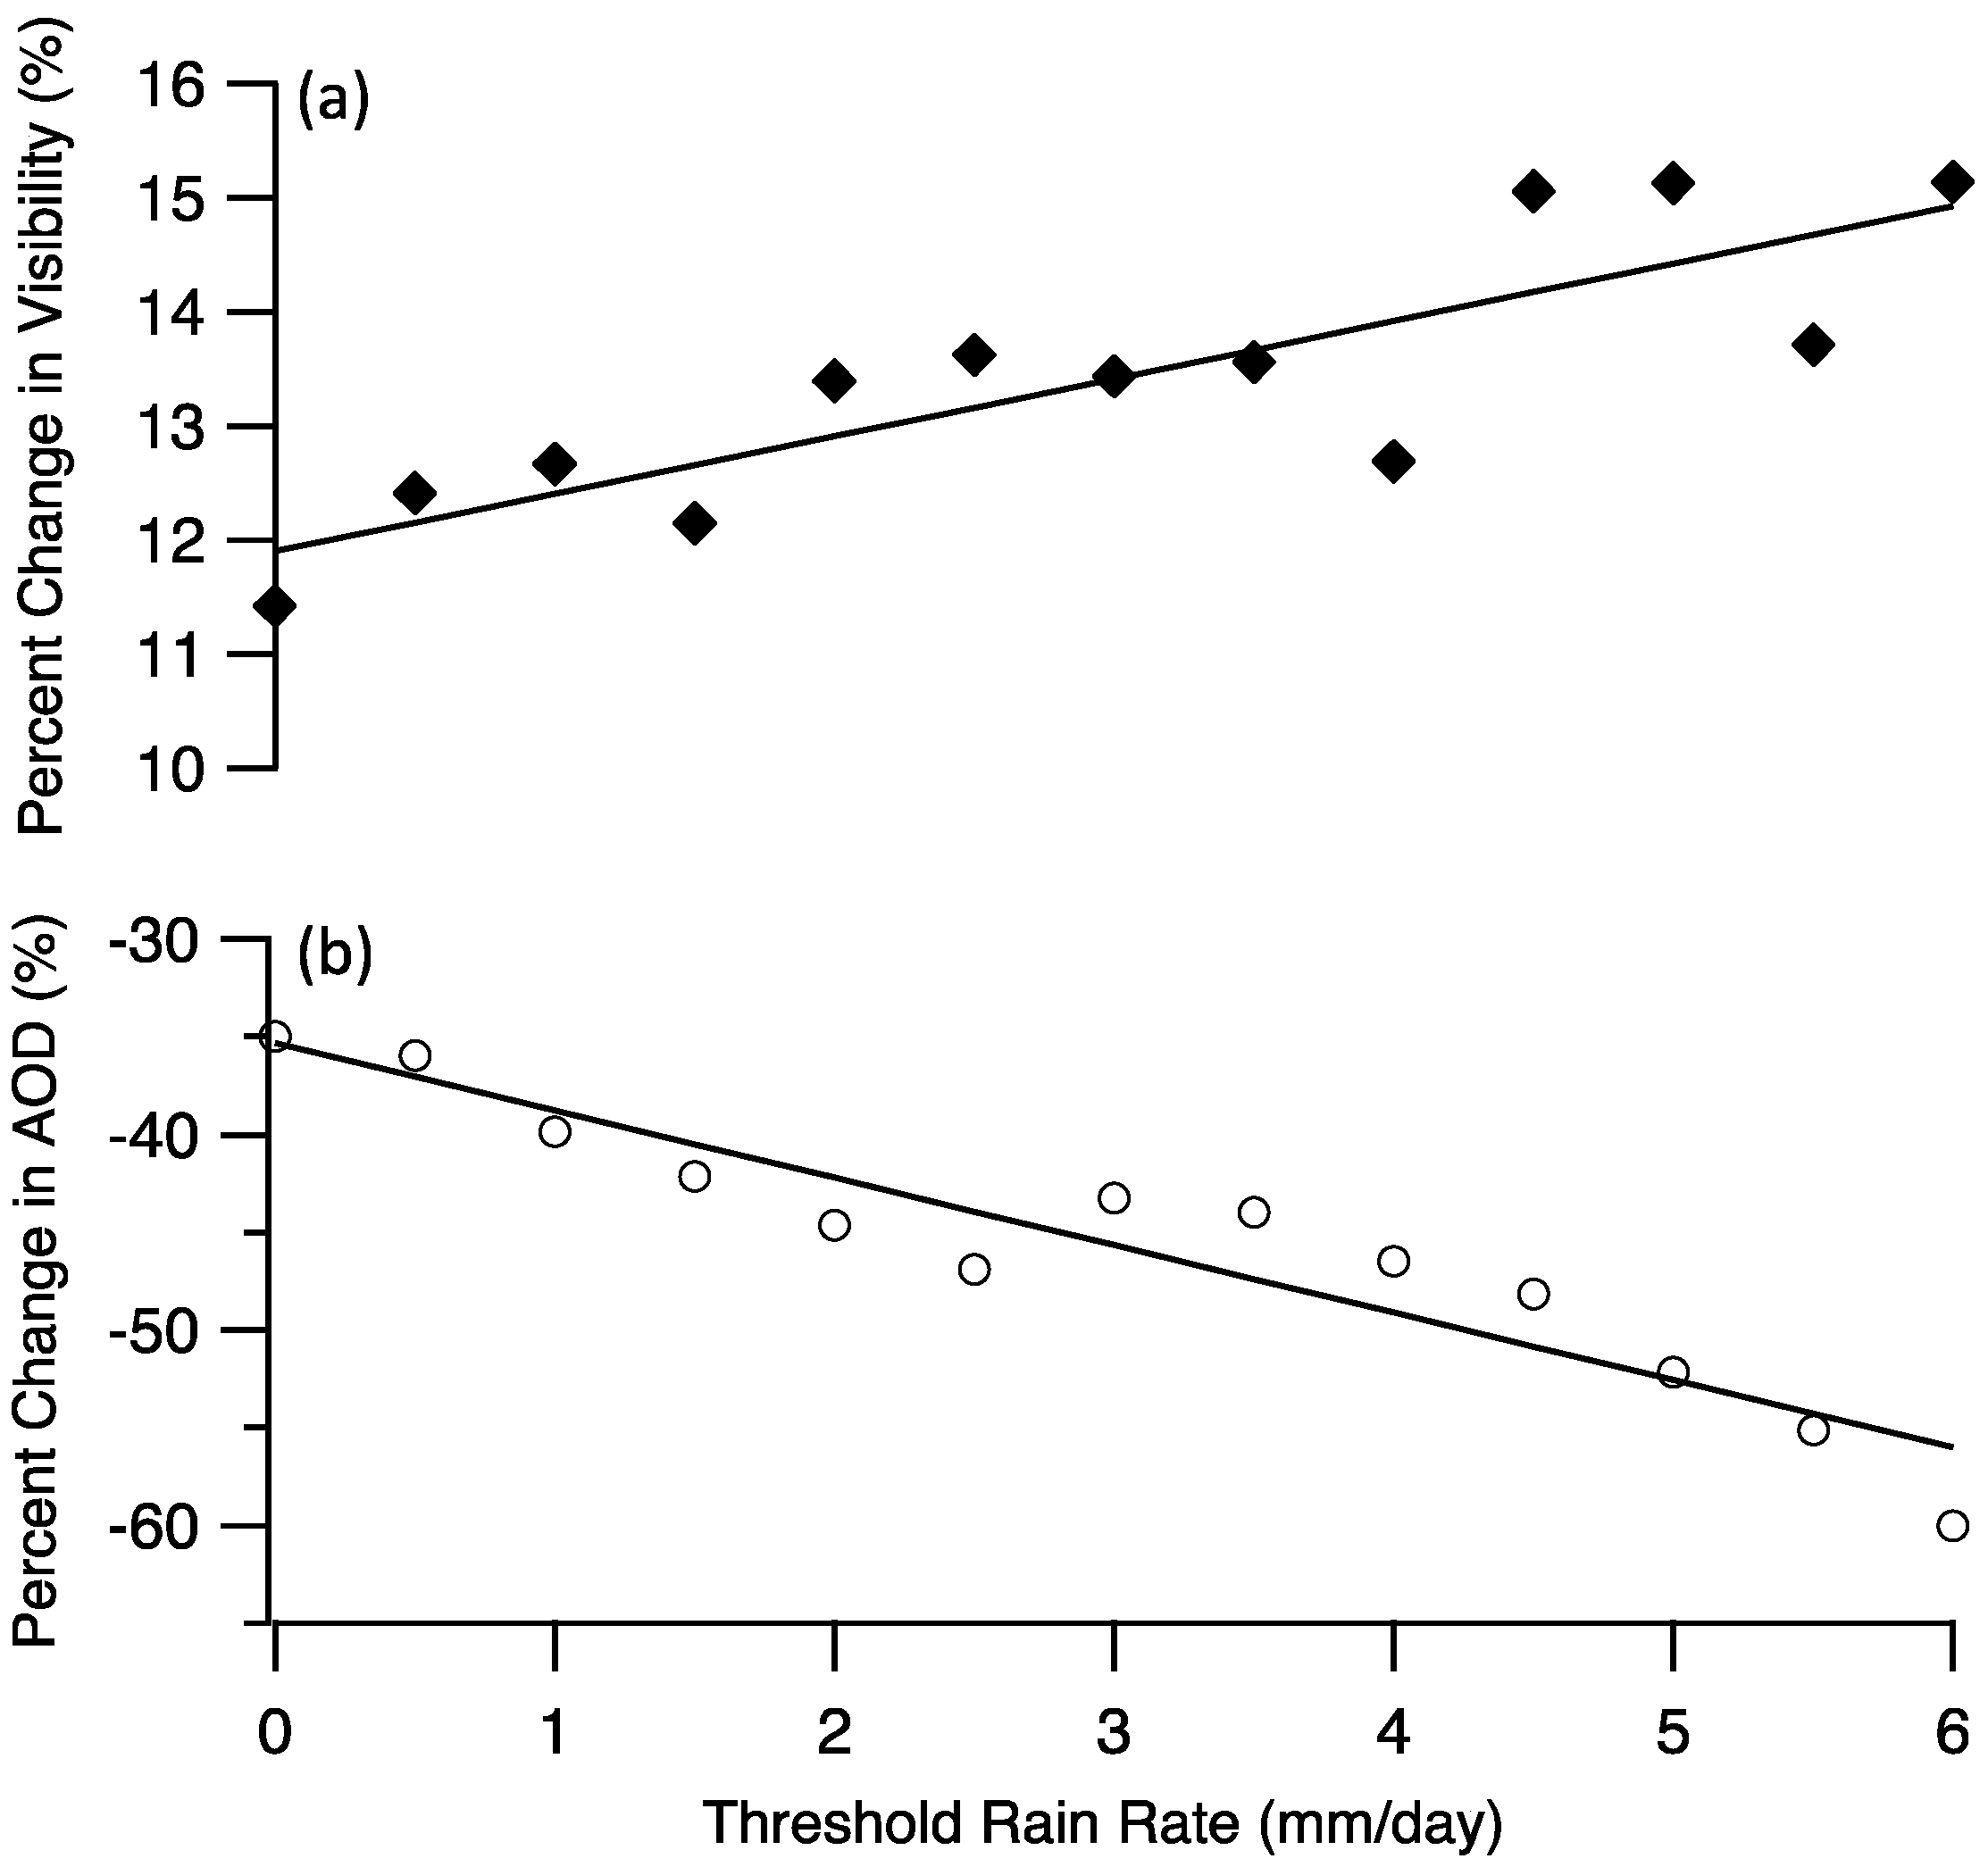
4.2. Precipitation
4.3. Trajectory Analysis of Extremes

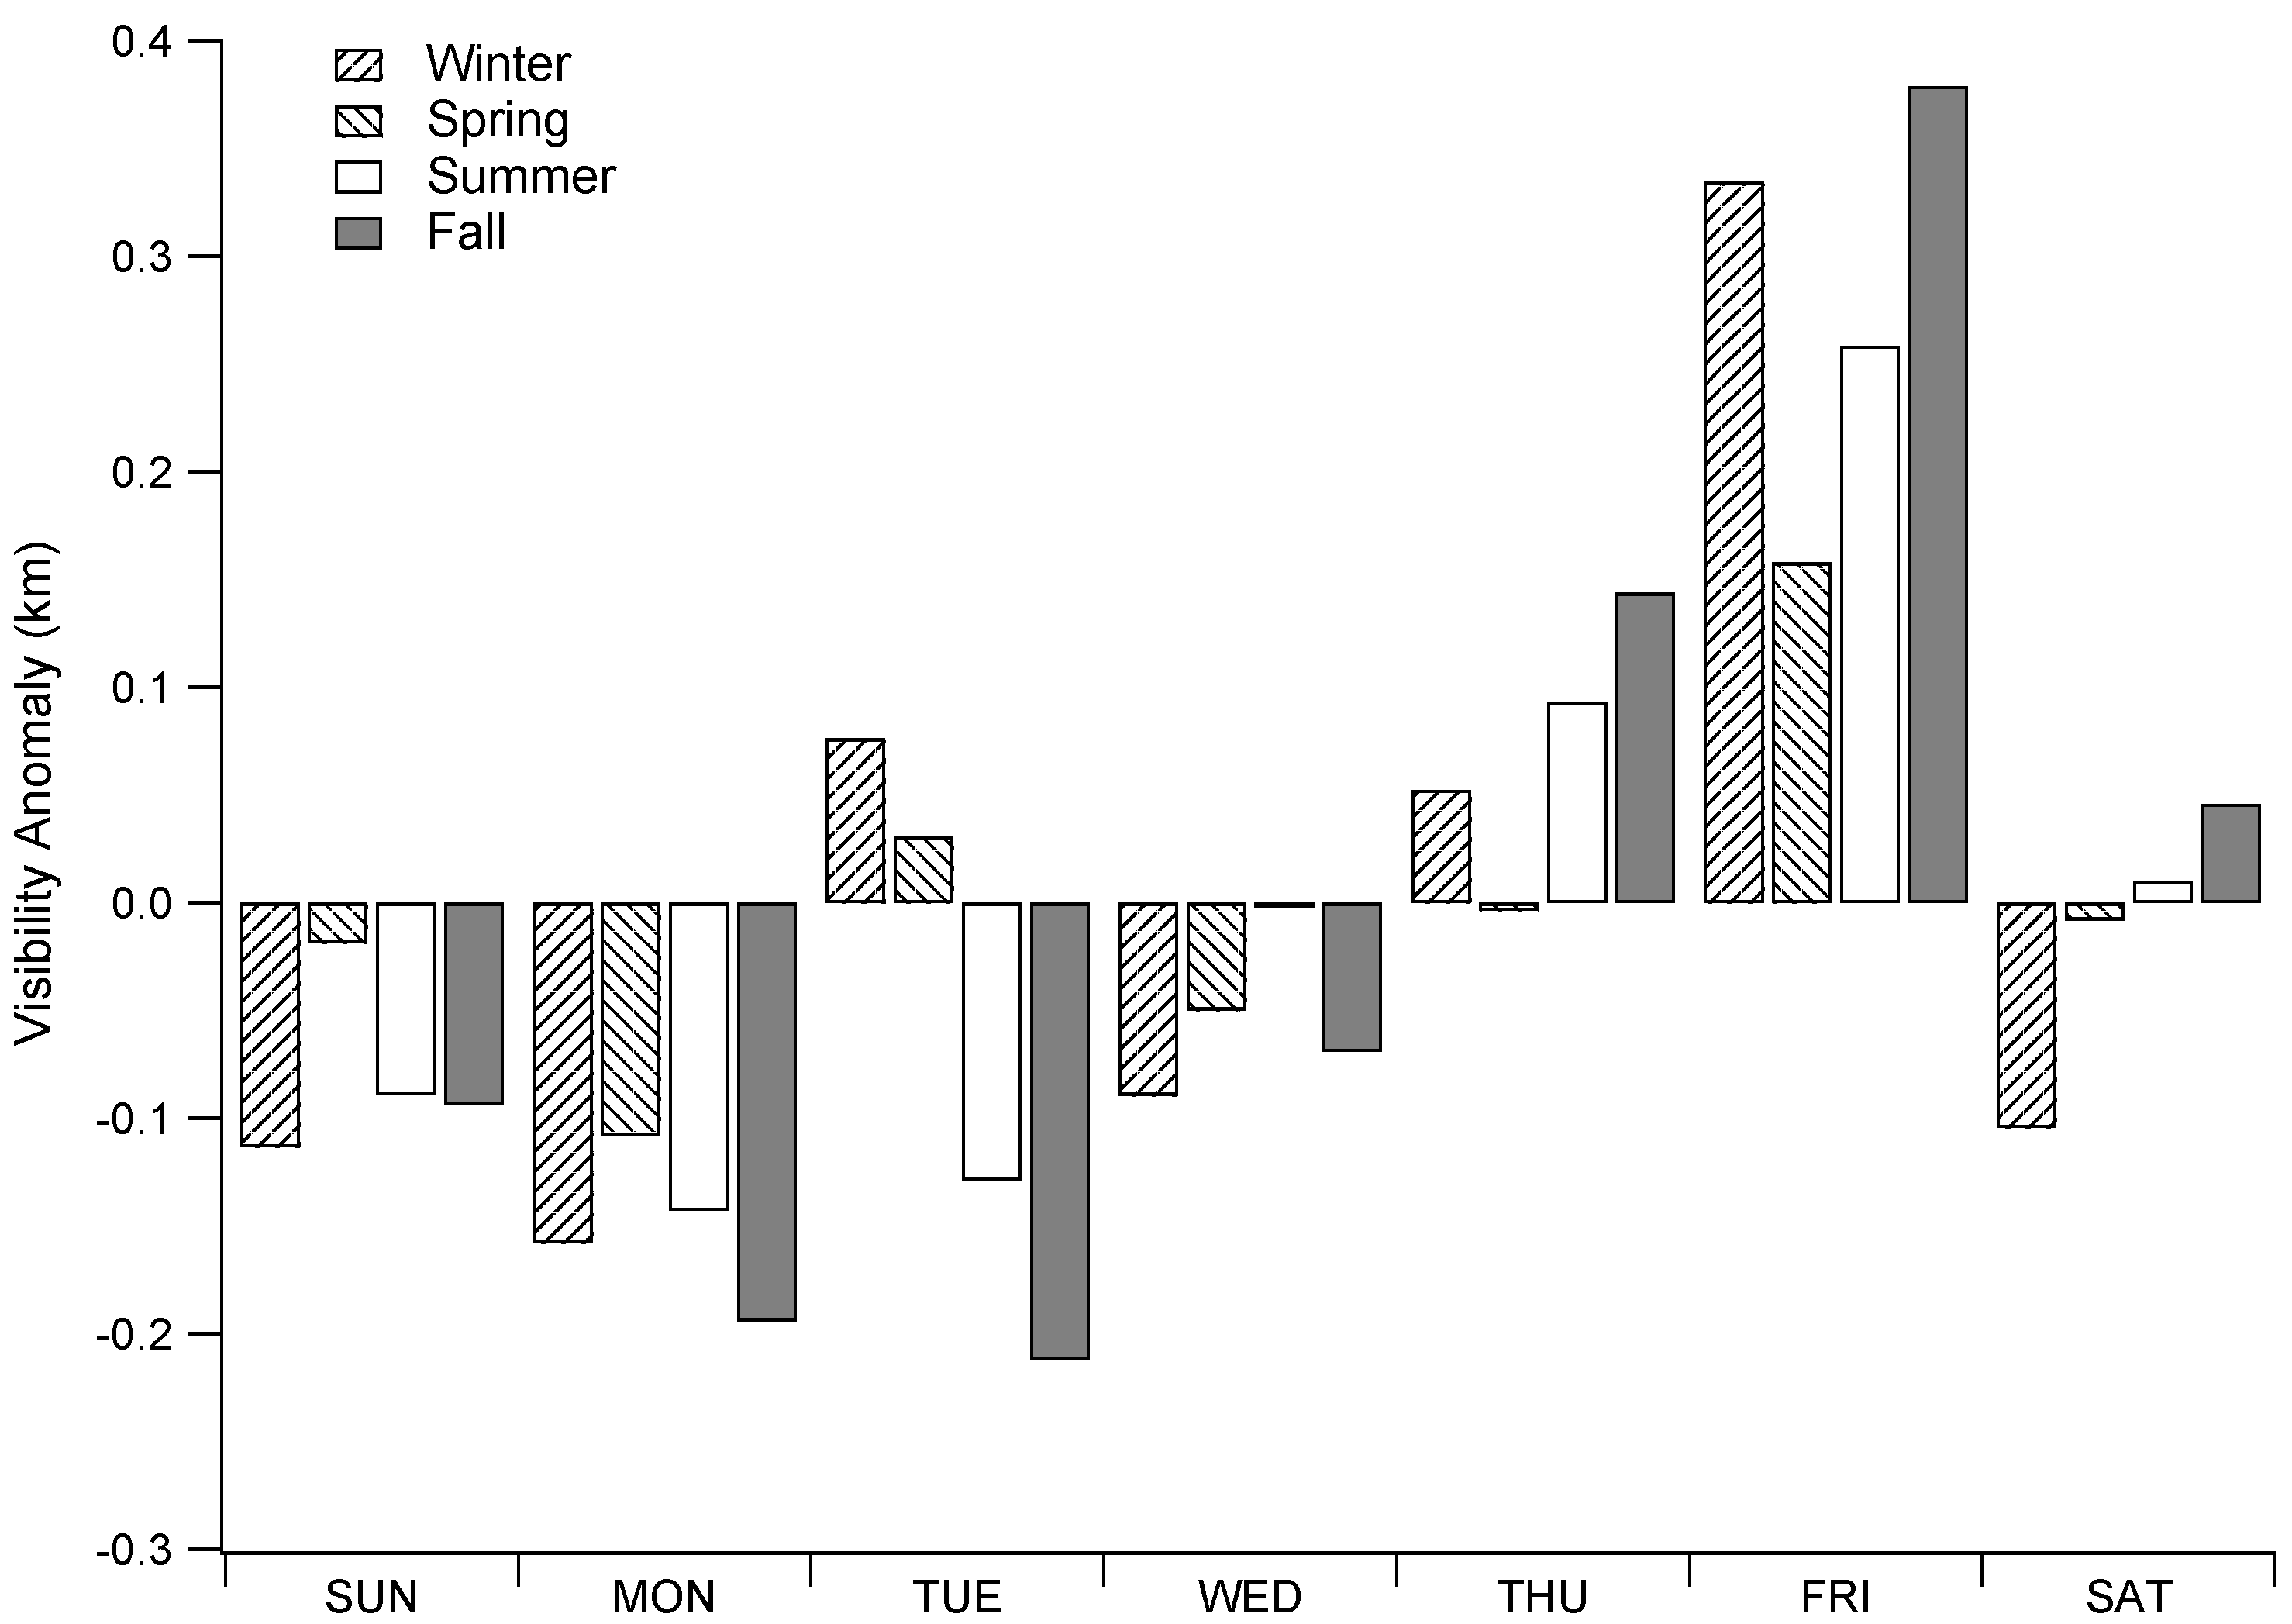
4.4. Weekly Cycle of Visibility

5. Conclusions
Acknowledgments
Author Contribution
Conflicts of Interest
References and Notes
- Middleton, N.J. A geography of dust storms in southwest Asia. J. Climatol. 1986, 6, 183–196. [Google Scholar] [CrossRef]
- Alam, K.; Qureshi, S.; Blaschke, T. Monitoring spatio-temporal aerosol patterns over Pakistan based on MODIS, TOMS and MISR satellite data and a HYSPLIT model. Atmos. Environ. 2011, 45, 4641–4651. [Google Scholar] [CrossRef]
- Lodhi, N.K.; Beegum, S.N.; Singh, S.; Kumar, K. Aerosol climatology at Delhi in the western Indo-Gangetic Plain: Microphysics, long-term trends, and source strengths. J. Geophys. Res.: Atmos. 2013, 118, 1361–1375. [Google Scholar] [CrossRef]
- Sabetghadam, S.; Ahmadi-Givi, F.; Golestani, Y. Visibility trends in Tehran during 1958–2008. Atmos. Environ. 2012. [Google Scholar] [CrossRef]
- Halek, F.; Kavouci, A.; Montehaie, H. Role of motor-vehicles and trend of air borne particulate in the Great Tehran area, Iran. Int. J. Environ. Health Res. 2004, 14, 307–313. [Google Scholar] [CrossRef]
- Léon, J.-F.; Legrand, M. Mineral dust sources in the surroundings of the north Indian Ocean. Geophys. Res. Lett. 2003. [Google Scholar] [CrossRef]
- Zarasvandi, A.; Carranza, E.J.M.; Moore, F.; Rastmanesh, F. Spatio-temporal occurrences and mineralogical-geochemical characteristics of airborne dusts in Khuzestan Province (southwestern Iran). J. Geochem. Explor. 2011, 111, 138–151. [Google Scholar] [CrossRef]
- Rashki, A.; Kaskaoutis, D.G.; Eriksson, P.G.; de W. Rautenbach, C.J.; Flamant, C.; Abdi Vishkaee, F. Spatio-temporal variability of dust aerosols over the Sistan region in Iran based on satellite observations. Natural Hazards 2014. [Google Scholar] [CrossRef]
- Prospero, J.M.; Ginoux, P.; Torres, O.; Nicholson, S.E.; Gill, T.E. Environmental characterization of global sources of atmospheric soil dust identified with the NIMBUS 7 Total Ozone Mapping Spectrometer (TOMS) absorbing aerosol product. Rev. Geophys. 2002, 40, 1002–1029. [Google Scholar]
- Shahsavani, A.; Naddafi, K.; Haghighifard, N.J.; Mesdaghinia, A.; Yunesian, M.; Nabizadeh, R.; Arahami, M.; Sowlat, M.H.; Yarahmadi, M.; Saki, H.; et al. The evaluation of PM10, PM2.5, and PM1 concentrations during the Middle Eastern Dust (MED) events in Ahvaz, Iran, from April through September 2010. J. Arid Environ. 2012, 77, 72–83. [Google Scholar] [CrossRef]
- Vishkaee, F.A.; Flamant, C.; Cuesta, J.; Oolman, L.; Flamant, P.; Khalesifard, H.R. Dust transport over Iraq and northwest Iran associated with winter shamal: A case study. J. Geophys. Res.: Atmos. 2012. [Google Scholar] [CrossRef]
- Bayat, A.; Masoumi, A.; Khalesifard, H.R. Retrieval of atmospheric optical parameters from ground-based sun-photometer measurements for Zanjan, Iran. Atmos. Meas. Tech. 2011, 4, 857–863. [Google Scholar] [CrossRef]
- Sowlat, M.H.; Naddafi, N.; Yunesian, M.; Jackson, P.L.; Shahsavani, A. Source apportionment of total suspended particulates in an arid area in southwestern Iran using positive matrix factorization. Bull. Environ. Contam. Toxicol. 2012, 88, 735–740. [Google Scholar] [CrossRef]
- Sohrabinia, M.; Khorshiddoust, A.M. Application of satellite data and GIS in studying air pollutants in Tehran. Habitat Int. 2007, 31, 268–275. [Google Scholar] [CrossRef]
- Kaskaoutis, D.G.; Kosmopoulos, P.; Kambezidis, H.D.; Nastos, P.T. Aerosol climatology and discrimination of different types over Athens, Greece, based on MODIS data. Atmos. Environ. 2007, 41, 7315–7329. [Google Scholar] [CrossRef]
- Kosmopoulos, P.G.; Kaskaoutis, D.G.; Nastos, P.T.; Kambezidis, H.D. Seasonal variation of columnar aerosol optical properties over Athens, Greece, based on MODIS data. Remote Sens. Environ. 2008, 112, 2354–2366. [Google Scholar] [CrossRef]
- Carmona, I.; Alpert, P. Synoptic classification of Moderate Resolution Imaging Spectroradiometer aerosols over Israel. J. Geophys. Res. 2009. [Google Scholar] [CrossRef]
- Guo, J.P.; Zhang, X.Y.; Wu, Y.R.; Zhaxi, Y.Z.; Che, H.Z.; La, B.; Wang, W.; Li, X.W. Spatio-temporal variation trends of satellite-based aerosol optical depth in China during 1980–2008. Atmos. Environ. 2011, 45, 6802–6811. [Google Scholar] [CrossRef]
- Marey, H.S.; Gille, J.C.; El-Askary, H.M.; Shalaby, E.A.; El-Raey, M.E. Aerosol climatology over Nile Delta based on MODIS, MISR and OMI satellite data. Atmos. Chem. Phys. 2011, 11, 10637–10648. [Google Scholar] [CrossRef]
- Sorooshian, A.; Wonaschutz, A.; Jarjour, E.G.; Hashimoto, B.I.; Schichtel, B.A.; Betterton, E.A. An aerosol climatology for a rapidly growing arid region (southern Arizona): Major aerosol species and remotely sensed aerosol properties. J. Geophys. Res.: Atmos. 2011. [Google Scholar] [CrossRef]
- Tesfaye, M.; Sivakumar, V.; Botai, J.; Mengistu-Tsidu, G. Aerosol climatology over South Africa based on 10 years of Multiangle Imaging Spectroradiometer (MISR) data. J. Geophys. Res. 2011. [Google Scholar] [CrossRef]
- Balakrishnaiah, G.; Kumar, K.R.; Reddy, B.S.K.; Gopal, K.R.; Reddy, R.R.; Reddy, L.S.S.; Swamulu, C.; Ahammed, Y.N.; Narasimhulu, K.; KrishnaMoorthy, K.; et al. Spatio-temporal variations in aerosol optical and cloud parameters over Southern India retrieved from MODIS satellite data. Atmos. Environ. 2012, 47, 435–445. [Google Scholar] [CrossRef]
- Sreekanth, V.; Kulkarni, P. Spatio-temporal variations in columnar aerosol optical properties over Bay of Bengal: Signatures of elevated dust. Atmos. Environ. 2013, 69, 249–257. [Google Scholar] [CrossRef]
- Singh, R.P.; Dey, S.; Tripathi, S.N.; Tare, V.; Holben, B. Variability of aerosol parameters over Kanpur, northern India. J. Geophys. Res. 2004. [Google Scholar] [CrossRef]
- Dey, S.; Tripathi, S.N.; Singh, R.P.; Holben, B. Seasonal variability of the aerosol parameters over Kanpur, an urban site in Indo-Gangetic basin. Adv. Space Res. 2005, 36, 778–782. [Google Scholar] [CrossRef]
- Remer, L.A.; Kaufman, Y.J.; Tanre, D.; Mattoo, S.; Chu, D.A.; Martins, J.V.; Li, R.R.; Ichoku, C.; Levy, R.C.; Kleidman, R.G.; et al. The MODIS aerosol algorithm, products, and validation. J. Atmos. Sci. 2005, 62, 947–973. [Google Scholar] [CrossRef]
- Herman, J.R.; Bhartia, P.K.; Torres, O.; Hsu, C.; Seftor, C.; Celarier, E. Global distribution of UV-absorbing aerosols from Nimbus 7/TOMS data. J. Geophys. Res.: Atmos. 1997, 102, 16911–16922. [Google Scholar]
- Stammes, P.; Noordhoek, R. OMI Algorithm Theoretical Basis Document Volume III: Clouds, Aerosols, and Surface UV Irradiance; Tech. Rep. ATBD-OMI-03, Version 2.0; KNMI: De Bilt, The Netherlands, 2002. [Google Scholar]
- Torres, O.; Tanskanen, A.; Veihelmann, B.; Ahn, C.; Braak, R.; Bhartia, P.K.; Veefkind, P.; Levelt, P. Aerosols and surface UV products from Ozone Monitoring Instrument observations: An overview. J. Geophys. Res. 2007. [Google Scholar] [CrossRef]
- Diner, D.J.; Abdou, W.A.; Bruegge, C.J.; Conel, J.E.; Crean, K.A.; Gaitley, B.J.; Helmlinger, M.C.; Kahn, R.A.; Martonchik, J.V.; Pilorz, S.H.; et al. MISR aerosol optical depth retrievals over southern Africa during the SAFARI-2000 dry season campaign. Geophys. Res. Lett. 2001, 28, 3127–3130. [Google Scholar] [CrossRef]
- Diner, D.J.; Abdou, W.; Ackerman, T.; Crean, K.; Gordon, H.; Kahn, R.; Martonchik, J.; McMuldroch, S.; Paradise, S.; Pinty, B.; et al. MISR Level 2 Aerosol Retrieval Algorithm Theoretical Basis; NASA: Greenbelt, MD, USA, 2008. Available online: http://eospso.gsfc.nasa.gov/eoshomepage/forscientists/atbd/docs/MISR/atbd-misr-09.pdf (accessed on 15 June 2013).
- Hsu, N.C.; Tsay, S.C.; King, M.D.; Herman, J.R. Aerosol properties over bright-reflecting source regions. IEEE Trans. Geosci. Remote Sens. 2004, 42, 557–569. [Google Scholar] [CrossRef]
- Hsu, N.C.; Tsay, S.C.; King, M.D.; Herman, J.R. Deep blue retrievals of Asian aerosol properties during ACE-Asia. IEEE Trans. Geosci. Remote Sens. 2006, 44, 3180–3195. [Google Scholar] [CrossRef]
- Shi, Y.; Zhang, J.; Reid, J.S.; Hyer, E.J.; Hsu, N.C. Critical evaluation of the MODIS Deep Blue aerosol optical depth product for data assimilation over North Africa. Atmos. Meas. Tech. 2013, 6, 949–969. [Google Scholar]
- Diner, D.J.; Beckert, J.C.; Reilly, T.H.; Bruegge, C.J.; Conel, J.E.; Kahn, R.A.; Martonchik, J.V.; Ackerman, T.P.; Davies, R.; Gerstl, S.A.W.; et al. Multi-angle Imaging Spectro Radiometer (MISR) instrument description and experiment overview. IEEE Trans. Geosci. Remote Sens. 1998, 36, 1072–1087. [Google Scholar] [CrossRef]
- Torres, O.; Bhartia, P.K.; Herman, J.R.; Ahmad, Z.; Gleason, J. Derivation of aerosol properties from satellite measurements of backscattered ultraviolet radiation: Theoretical basis. J. Geophys. Res. 1998, 103, 17099–17110. [Google Scholar] [CrossRef]
- Hsu, N.C.; Herman, J.R.; Torres, O.; Holben, B.N.; Tanre, D.; Eck, T.F.; Smirnov, A.; Chatenet, B.; Lavenu, F. Comparisons of the TOMS aerosol index with sun-photometer aerosol optical thickness: results and applications. J. Geophys. Res. 1999, 104, 6269–6279. [Google Scholar] [CrossRef]
- Zhang, J.; Reid, J.S. MODIS aerosol product analysis for data assimilation: Assessment of over-ocean level 2 aerosol optical thickness retrievals. J. Geophys. Res. 2006. [Google Scholar] [CrossRef]
- Rienecker, M.M.; Suarez, M.J.; Gelaro, R.; Todling, R.; Bacmeister, J.; Liu, E.; Bosilovich, M.G.; Schubert, S.D.; Takacs, L.; Kim, G.-K.; et al. MERRA: NASA’s Modern-Era Retrospective Analysis for Research and Applications. J. Clim. 2011, 24, 3624–3648. [Google Scholar] [CrossRef]
- Draxler, R.R.; Rolph, G.D. HYSPLIT—Hybrid Single Particle Lagrangian Integrated Trajectory Model; NOAA Air Resources Laboratory: College Park, MD, USA, 2012. Available online: http://ready.arl.noaa.gov/HYSPLIT.php (accessed on 19 March 2014).
- Chin, M.; Ginoux, P.; Kimne, S.; Torres, O.; Holben, B.N.; Duncan, B.N.; Martin, R.V.; Logan, J.V.; Higurashi, A.; Nakajima, T. Tropospheric aerosol optical thickness from the GOCART model and comparisons with satellite and sun photometer measurements. J. Atmos. Sci. 2002, 59, 461–483. [Google Scholar] [CrossRef]
- Tong, D.Q.; Dan, M.; Wang, T.; Lee, P. Long-term dust climatology in the western United States reconstructed from routine aerosol ground monitoring. Atmos. Chem. Phys. 2012, 12, 5189–5205. [Google Scholar] [CrossRef]
© 2014 by the authors; licensee MDPI, Basel, Switzerland. This article is an open access article distributed under the terms and conditions of the Creative Commons Attribution license (http://creativecommons.org/licenses/by/3.0/).
Share and Cite
Crosbie, E.; Sorooshian, A.; Monfared, N.A.; Shingler, T.; Esmaili, O. A Multi-Year Aerosol Characterization for the Greater Tehran Area Using Satellite, Surface, and Modeling Data. Atmosphere 2014, 5, 178-197. https://doi.org/10.3390/atmos5020178
Crosbie E, Sorooshian A, Monfared NA, Shingler T, Esmaili O. A Multi-Year Aerosol Characterization for the Greater Tehran Area Using Satellite, Surface, and Modeling Data. Atmosphere. 2014; 5(2):178-197. https://doi.org/10.3390/atmos5020178
Chicago/Turabian StyleCrosbie, Ewan, Armin Sorooshian, Negar Abolhassani Monfared, Taylor Shingler, and Omid Esmaili. 2014. "A Multi-Year Aerosol Characterization for the Greater Tehran Area Using Satellite, Surface, and Modeling Data" Atmosphere 5, no. 2: 178-197. https://doi.org/10.3390/atmos5020178