3.1. PM10 and PM2.5 Concentrations
A summary of measured PM
10 and PM
2.5 concentrations is reported in
Table 1.
Table 1 includes the numbers of available data, the percentages of rainy days (
i.e., days with precipitations ≥ 0.4 mm), the average concentrations, the standard deviations, the minimum and maximum values of PM
10 and PM
2.5, and the ratio R = PM
2.5/PM
10 for the different sites analyzed. The statistics were also evaluated grouping together the sites with the same characteristics (background, industrial, and urban). Finally, the last row values refer to the whole area studied (average over all measurements). The average R (0.65 ± 0.11) is in agreement with the typical European average: 0.66 [
22]. In Putaud
et al. [
8] a range for R is reported in different European sites between 0.44 and 0.90 with a tendency to smaller values at low PM
10 concentrations in rural and background sites. The average value of R for the industrial sites (0.67 ± 0.10) is the same of the urban site (0.67 ± 0.12), while, the average R calculated for background sites is significantly lower (0.61 ± 0.10), according to the t-Student test at 5% probability. This could be explained as due to the larger anthropogenic emissions of fine particles (sub-micrometric range) of urban and industrial releases.
Table 1 indicates that that both PM
2.5 and PM
10 show an increase moving from background sites to industrial and to urban sites. The concentration levels and the trend observed are in agreement with the results obtained in other European areas [
23,
24]. These increases are statistically significant, with the exclusion of the difference between industrial and urban in PM
2.5, at 5% probability according to the t-Student test.
During the different measurements, 51 excesses of the threshold of PM
10 daily concentration (50 µg/m
3 fixed in European Air Quality Standards, AQS) were observed (
Table 2). This corresponds to 10.6% of the measured days as an average over the studied area. However, the occurrence of the excesses of AQS threshold is significantly lower in background sites typology (4.9%) with respect to industrial typology (12.9%) and urban typology (21.5%). The EU-Directive 2008/50/CE has not established a daily threshold for PM
2.5 concentration but only a yearly limit fixed at 1/2 of that relative to PM
10. However, given that most of the influence of SD is on short-term (daily) concentrations, it is useful to investigate the strength of the effect on daily PM
2.5 concentrations. For this reason it has been hypothesized an indicative daily threshold of 25 µg/m
3 for PM
2.5 for the analysis of the present data.
The statistics of the excesses of this hypothesized threshold is also reported in
Table 2. The behavior is similar to that observed in PM
10 with lower occurrence of excesses of the threshold in background sites. This means that local pollution sources have an important role in determining the overcome of AQS in terms of daily concentration peaks in urban and industrial sites. The excesses observed in background sites are likely associated with long-range transport of pollution.
For each measurement day the advection of African Dust (in the following SD cases) has been investigated, considering the concentration of typical crustal elements (Fe, Al, Ti), the dust transport predictions of the DREAM model [
25], the five-day back-trajectories calculated with HYSPLIT [
26], and the satellite images (MODIS).
A day has been classified as a SD case if there was evidence of a dust advection from DREAM model and/or satellite images concomitant with a transport from the Sahara-Sahel area observed with back-trajectories. These events had different strength and, in general terms, were visible as an increase in daily concentrations of crustal elements. In some periods additional measurements such as LIDAR dust load vertical profiles and PM
10 data from the fixed monitoring network were available and used for identification of SD events that generally provoke an increase of PM
10 concentration over a large spatial area and an increase of dust load at high elevation above the ground. The statistics of SD events and its association with the excesses of AQS-threshold is reported in
Table 2. Referring to PM
10 measurements, 59 SD cases, corresponding to 12.2% of measurement days, were observed. Fourteen of these cases were concomitant with excesses of the AQS threshold (corresponding to 27.5% of the excesses) as an average over the studied area. When considering the different typologies of sites, the percentages become: 66.7% for background, 22.2% for industrial and 9.5% for urban.
Table 1.
Average concentrations, standard deviations, ratios PM2.5/PM10, number of samples, and precipitations for PM10 and PM2.5 at the different sites (and also grouped by typology of sites) in the period 2003–2010. The last row is the combination of all data. (U = urban site; B = background site; I = industrial site).
| Site | | PM10 | PM2.5 | PM2.5/PM10 |
|---|
| | | n° | Rain (%) | Conc. (µg/m3) | Dev.st. (µg/m3) | n° | Rain (%) | Conc. (µg/m3) | Dev.st. (µg/m3) | R | Dev.st. |
|---|
| Lecce | B | 173 | 28.3 | 25.9 (5.9–74.6) | 12.9 | 24 | 25.0 | 16.8 (6.0–29.4) | 6.4 | 0.62 | 0.13 |
| Seclì | B | 14 | 21.4 | 27.8 (17.3–32.8) | 5.0 | 8 | 12.5 | 21.0 (12.4–28.1) | 5.4 | 0.74 | 0.08 |
| Galatone | B | 16 | 18.8 | 26.2 (12.3–57.4) | 11.6 | 4 | 0.0 | 13.4 (10.5–19.3) | 4.0 | 0.45 | 0.11 |
| Trepuzzi | B | 15 | 33.3 | 30.1 (12.8–56.2) | 12.5 | 7 | 57.1 | 20.4 (13.0–43.9) | 11.4 | 0.64 | 0.10 |
| Leverano | B | 18 | 16.7 | 26.8 (14.1–45.8) | 8.2 | 8 | 25.0 | 16.2 (10.7–22.4) | 3.8 | 0.62 | 0.09 |
| Nardò | B | 10 | 40.0 | 24.9 (14.4–78.9) | 19.4 | / | / | / | / | / | / |
| Maglie | I | 80 | 37.5 | 29.9 (5.6–100.3) | 17.3 | 35 | 45.7 | 23.1 (8.1–66.3) | 12.9 | 0.75 | 0.15 |
| Collemeto | I | 19 | 15.8 | 38.2 (18.9–52.3) | 8.8 | 7 | 14.3 | 21.4 (15.1–31.9) | 5.4 | 0.55 | 0.07 |
| Cutrofiano | I | 40 | 27.5 | 35.6 (15.3–77.2) | 15.0 | 14 | 28.6 | 27.8 (16.3–43.4) | 10.6 | 0.71 | 0.09 |
| Lecce | U | 33 | 18.2 | 27.8 (12.0–58.1) | 8.4 | 13 | 23.0 | 14.9 (8.2–22.7) | 4.3 | 0.54 | 0.13 |
| Tricase | U | 10 | 30.0 | 57.7 (22.0–127.8) | 32.2 | 5 | 40.0 | 40.1 (19.8–92.3) | 30.1 | 0.64 | 0.06 |
| Copertino | U | 14 | 57.1 | 41.5 (19.5–69.5) | 15.7 | 5 | 40.0 | 36.2 (14.7–61.7) | 16.7 | 0.77 | 0.12 |
| Nardò | U | 15 | 13.3 | 49.9 (24.3–90.6) | 19.3 | 7 | 0.0 | 36.8 (20.6–71.0) | 17.3 | 0.66 | 0.10 |
| Maglie | U | 12 | 25.0 | 41.9 (24.3–75.4) | 15.8 | 10 | 20.0 | 32.7 (13.4–67.0) | 17.3 | 0.72 | 0.12 |
| Lequile | U | 14 | 42.8 | 31.9 (17.8–64.2) | 11.8 | 7 | 42.8 | 24.9 (11.3–55.2) | 14.9 | 0.66 | 0.16 |
| Total Background | B | 246 | 27.2 | 26.3 (5.9–78.9) | 12.4 | 51 | 25.5 | 17.6 (6.0–43.9) | 6.8 | 0.61 | 0.10 |
| Total Industrial | I | 139 | 31.6 | 32.7 (5.6–100.3) | 16.0 | 56 | 37.5 | 24.1 (8.1–66.3) | 11.7 | 0.67 | 0.10 |
| Total Urban | U | 98 | 28.6 | 38.5 (12.0–127.8) | 18.9 | 47 | 25.0 | 28.4 (8.2–92.3) | 18.0 | 0.67 | 0.12 |
| Studied Area | / | 483 | 28.8 | 34.4 (5.6–127.8) | 14.3 | 154 | 29.9 | 24.7 (6.0–92.3) | 11.5 | 0.65 | 0.11 |
Table 2.
Analysis of the excesses of the daily concentration thresholds, of the cases of advection of Saharan Dust (SD) and their connection with observed excesses. The analysis is reported for the different typologies of sites and for the studied area considering all the sites together (studied area, last row).
| Typology of Site | PM10 |
|---|
| | n° samples | Samples > 50 µg/m3 | Samples with SD | Samples > 50 µg/m3 with SD | % of excesses associated with SD |
| Background | 246 | 12 (4.9%) | 41 (16.7%) | 8 | 66.7 |
| Industrial | 139 | 18 (12.9%) | 13 (8.6%) | 4 | 22.2 |
| Urban | 98 | 21 (21.5%) | 5 (5.1%) | 2 | 9.5 |
| Studied Area | 483 | 51 (10.6%) | 59 (12.2%) | 14 | 27.5 |
| Typology of Site | PM2.5 |
| | n° samples | Samples > 25 µg/m3 | Samples with SD | Samples > 25 µg/m3 with SD | % of excesses associated with SD |
| Background | 51 | 6 (11.8%) | 10 (19.6%) | 2 | 33.3 |
| Industrial | 56 | 19 (33.9%) | 3 (5.4%) | 2 | 10.5 |
| Urban | 47 | 21 (44.7%) | 3 (6.4%) | 3 | 14.3 |
| Studied Area | 154 | 46 (29.9%) | 16 (10.4%) | 7 | 15.2 |
This indicates that the advections of Saharan dust have an important role in determining a relevant part of the excesses of AQS threshold observed, especially in background sites in the area. The influence of SD events on industrial and urban sites is lower due to the importance of local sources with respect to long-range transport. In
Table 2 similar analysis is reported for PM
2.5. The percentages of the excesses of the hypothesized threshold associated with SD events were lower: 33.3% for background, 10.5% for industrial and 14.3% for urban. The results indicate that the background sites were more influenced than industrial/urban sites. The reduced effects of SD cases on PM
2.5, with respect to PM
10, can be explained considering that the SD contribution is mainly characterized by coarse particles and a significant decrease of the PM
2.5/PM
10 ratio is generally observed during these events [
27]. However, there is evidence that SD events in the area studied are characterized by aerosol with a number distribution peaked at about 2 μm being thereby able to influence PM
2.5 [
28].
An analysis of measured concentrations has been performed separating the hot weather (April to September) from cold weather (October to March). The results are reported in
Table 3 and
Table 4. For PM
2.5, only the average values over the studied area are reported due to the limited number of samples (with respect to PM
10), which did not allow the distinctions between the different typologies of site. Even if with some limitations due to the different number of samples available in hot and cold weather, the inter-comparison of results for PM
10 indicate that urban sites present a statistically significant increase of the average concentration during the cold weather that is likely associated with the anthropogenic emissions of traffic and domestic heating. Instead, the background sites show a decrease of the average concentration during the cold weather.
This could be due to the large frequency of advections of Saharan dust observed in the spring and summer periods (
Table 3). This is observed in all typology of sites, but, as already mentioned it has a larger effect on background sites. The seasonal difference on the average concentration for industrial sites is not statistically significant. Considering the average over the studied area, the PM
10 concentrations in the hot and cold weather are essentially the same (no statistical significant difference), instead, PM
2.5 concentrations show a significant increase in the cold season. The different behavior of PM
10 and PM
2.5 could be explained considering that the SD events have a lower importance on PM
2.5 because the dust is mainly in the coarse size-range. Thereby, the increase in the hot weather of this contribution is not able to compensate the decrease of anthropogenic emissions (traffic and domestic heating) in PM
2.5 concentrations as it does in PM
10 concentrations. The larger importance of SD events in the hot weather is in agreement with other observations reported in literature [
19,
28].
Table 3.
Analysis of seasonal trends of concentrations, of excesses of the daily concentration threshold, of the cases of advection of Saharan Dust (SD) and their connection with observed excesses for PM2.5 and PM10 as an average over the studied area.
Table 3.
Analysis of seasonal trends of concentrations, of excesses of the daily concentration threshold, of the cases of advection of Saharan Dust (SD) and their connection with observed excesses for PM2.5 and PM10 as an average over the studied area.
| | PM2.5 | PM10 |
|---|
| Studied Area | Studied Area |
|---|
| Hot Season | Cold Season | Hot Season | Cold Season |
|---|
| n° samples | 60 | 94 | 193 | 290 |
| Concentration (µg/m3) | 19.1 (6.0–66.3) | 25.8 (7.6–92.3) | 29.1 (5.6–80.0) | 31.6 (7.0–127.8) |
| St. Dev. | 10.3 | 14.5 | 13.7 | 16.9 |
| SD events (occurrence) | 9 (15.0%) | 7 (7.4%) | 38 (19.7%) | 21 (7.2%) |
| Samples > 50 µg/m3 (occurrence) | / | / | 13 (6.7%) | 38 (13.1%) |
| Samples > 25 µg/m3 (occurrence) | 12 (20.0%) | 34 (56.7%) | / | / |
| Samples > 50 µg/m3 with SD | / | / | 10 | 4 |
| Samples > 25 µg/m3 with SD | 4 | 3 | / | / |
| % of excesses associated with SD | 33.3 | 8.8 | 76.9 | 10.5 |
Table 4.
Analysis of seasonal trends of concentrations, of excesses of the daily concentration threshold, of the cases of advection of Saharan Dust (SD) and their connection with observed excesses for PM10 considering the different typologies of sites.
Table 4.
Analysis of seasonal trends of concentrations, of excesses of the daily concentration threshold, of the cases of advection of Saharan Dust (SD) and their connection with observed excesses for PM10 considering the different typologies of sites.
| | PM10 |
|---|
| Background | Industrial | Urban |
|---|
| Hot Season | Cold Season | Hot Season | Cold Season | Hot Season | Cold Season |
|---|
| n° samples | 141 | 105 | 37 | 102 | 15 | 83 |
| Concentration (µg/m3) | 28.1 (5.9–80.0) | 23.9 (7.0–78.9) | 33.7 (5.6–78.4) | 32.3 (9.00–100.3) | 27.2 (12.0–48.8) | 40.5 (16.8–127.8) |
| St. Dev. | 12.4 | 12.2 | 19.0 | 14.9 | 7.3 | 19.7 |
| SD events (occurrence) | 30 (21.3%) | 11 (10.5%) | 8 (21.6%) | 5 (4.9%) | 0 (0%) | 5 (6.0%) |
| Samples > 50 µg/m3 (occurrence) | 7 (4.9%) | 5 (4.7%) | 6 (16.2%) | 12 (11.7%) | 0 (0%) | 21 (25.3%) |
| Samples > 25 µg/m3 (occurrence) | / | / | / | / | / | / |
| Samples > 50 µg/m3 with SD | 6 | 2 | 4 | 0 | 0 | 2 |
| Samples > 25 µg/m3 with SD | / | / | / | / | / | / |
| % of excesses associated with SD | 85.7 | 40.0 | 66.7 | 0.0 | 0.0 | 9.5 |
Long-terms datasets of atmospheric concentrations are often described with lognormal distributions [
18,
29,
30]. This is confirmed by the chi-square test, applied to our PM
10 and PM
2.5 time series. Lognormal distribution fits have been used to evaluate the effect of the SD events on long-term concentrations and excesses of the daily thresholds. A fit with a lognormal distribution has been performed for the total dataset and for a dataset in which the SD events were removed. Results for the different typologies of sites and for the studied area are presented in
Table 5. Results in
Table 5 indicate that SD events have a limited effect on long-term average concentrations (3.4% increase of average PM
10 and 1.5% increase of average PM
2.5). This is in agreement with the observations made in Spain [
24]. There is an increase in the probability of overcome of the daily concentration threshold fixed in AQS for PM
10 and hypothesized in this work for PM
2.5. This is particularly evident for PM
10 in background sites, in which this probability is more than doubled.
Table 5.
Results of the fit with lognormal distributions in terms of average concentrations and probabilities to overcome the daily thresholds (fixed in AQS for PM10 and hypothesized in this work for PM2.5). Results are reported for the total dataset and also excluding the SD cases.
Table 5.
Results of the fit with lognormal distributions in terms of average concentrations and probabilities to overcome the daily thresholds (fixed in AQS for PM10 and hypothesized in this work for PM2.5). Results are reported for the total dataset and also excluding the SD cases.
| | Type Sites | | Average (µg/m3) | Probability (%) [PM10] > 50 µg/m3 | Probability (%) [PM2.5] > 25 µg/m3 |
|---|
| PM10 | Background | Total | 23.7 | 5.2 | / |
| No SD | 22.4 | 2.4 | / |
| Industrial | Total | 29.3 | 13.3 | / |
| No SD | 28.5 | 11.7 | / |
| Urban | Total | 35.0 | 19.9 | / |
| No SD | 34.4 | 18.7 | / |
| Studied Area | Total | 27.3 | 10.4 | / |
| No SD | 26.4 | 8.5 | / |
| PM2.5 | Background | Total | 16.4 | / | 13.6 |
| No SD | 16.1 | / | 13.3 |
| Industrial | Total | 21.7 | / | 37.8 |
| No SD | 21.2 | / | 35.8 |
| Urban | Total | 24.1 | / | 47.3 |
| No SD | 23.2 | / | 44.9 |
| Studied Area | Total | 20.4 | / | 34.1 |
| No SD | 20.1 | / | 33.1 |
3.2. Metal Content in PM10 and PM2.5
At all sites, metals concentrations in PM
10 and in PM
2.5 were determined in order to investigate the possible sources and the PM formation mechanisms [
31]. The concentrations and their variability are reported in
Table 6 (for PM
10) and in
Table 7 (for PM
2.5). The concentrations are reported in absolute values (ng/m
3) and in relative values (µg/g) and the sites are grouped by typology. In cases where the concentration of a specific metal was not quantified for more than 50% of the samples an average concentration was not reported and a threshold value was indicated in
Table 7. As and Sb levels were commonly not quantified in PM
10 and difficulties were also encountered for Cd in the PM
2.5 fraction. In average terms the trace metals analyzed represent 2.0% of PM
10 (average over the studied area) and 0.86% of PM
2.5.
Table 6.
Absolute and relative concentrations of metals contained in PM10 for the different typologies of sites and as average for the studied area. In parenthesis the observed ranges.
Table 6.
Absolute and relative concentrations of metals contained in PM10 for the different typologies of sites and as average for the studied area. In parenthesis the observed ranges.
| PM10 | | Background (Samples 185) | Industrial (Samples 137) | Urban (Samples 97) | Studied Area (Samples 419) |
|---|
| Cd | ng/m3 | 0.2 (0.01–0.8) | 0.3 (0.01–1.0) | <0.6 | 0.3 (0.01–7.7) |
| µg/g | 5.9 (0.2–53.8) | 8.1 (0.4–47.5) | <16.2 | 9.6 (0.2–344.5) |
| V | ng/m3 | 1.5 (0.1–6.3) | 1.8 (0.1–12.3) | <1.9 | 1.7 (0.1–12.3) |
| µg/g | 58.6 (1.8–280.0) | 58.8 (3.7–344.4) | <55.8 | 57.8 (1.4–344.4) |
| Fe | ng/m3 | 270.0 (7.8–2241.9) | 227.1 (10.9–1750.8) | 229.2 (21.4–649.4) | 246.7 (7.8–2241.9) |
| µg/g | 9362.2 (271.9–34135.0) | 7052.2 (267.2–58600.1) | 6474.1 (428.7–20561.6) | 7956.0 (267.2–58600.1) |
| Al | ng/m3 | 293.9 (9.1–3993.6) | 115.7 (3.5–521.1) | 391.1 (40.4–507.7) | 269.7 (3.5–3993.6) |
| µg/g | 9952.4 (669.9–51115.6) | 4236.6 (135.2–22851.3) | 14948.4 (949.7–29758.3) | 9502.2 (135.2–51115.6) |
| Cu | ng/m3 | 9.9 (0.4–114.2) | 8.5 (0.5–80.6) | 11.9 (1.0–40.9) | 9.8 (0.4–114.2) |
| µg/g | 373.9 (19.1–2967.4) | 280.4 (12.4–4114.0) | 312.7 (33.4–1567.3) | 330.0 (12.4–4114.0) |
| Ni | ng/m3 | 2.7 (0.2–46.7) | 5.2 (0.1–174.0) | 2.2 (0.3–17.8) | 3.5 (0.1–174.0) |
| µg/g | 107.9 (9.5–1674.7) | 152.6 (3.5–5822.9) | 62.2 (4.8–451.1) | 116.0 (3.5–5822.9) |
| Mn | ng/m3 | 6.8 (0.2–59.5) | 3.6 (0.04–32.6) | 4.2 (0.2–11.7) | 5.2 (0.04–59.5) |
| µg/g | 246.5 (7.0–1011.7) | 113.4 (1.5–1091.2) | 114.5 (1.4–297.8) | 176.0 (1.4–1091.2) |
| Zn | ng/m3 | 21.8 (2.2–215.2) | 33.6 (1.0–280.4) | 23.2 (2.4–78.0) | 26.0 (1.0–280.4) |
| µg/g | 930.4 (60.2–15072.6) | 1293.0 (31.2–17307.1) | 630.7 (118.6–2705.2) | 981.5 (31.3–17307.1) |
| Pb | ng/m3 | 7.3 (0.4–106.3) | 11.9 (0.7–92.4) | 10.0 (0.7–77.9) | 8.9 (0.4–106.3) |
| µg/g | 273.9 (25.5–2775.3) | 434.4 (29.7–5008.8) | 257.8 (15.9–2633.7) | 314.1 (15.9–5008.8) |
| As | ng/m3 | <0.9 | <0.9 | <0.8 | <0.9 |
| µg/g | <41.8 | <40.6 | <22.7 | <38.1 |
| Cr | ng/m3 | 2.5 (0.1–41.7) | 13.5 (0.1–406.7) | 2.5 (0.3–35.7) | 5.3 (0.1–406.7) |
| µg/g | 91.3 (6.8–1083.7) | 371.9 (5.7–13612.7) | 67.5 (5.4–906.0) | 157.3 (5.4–13612.7) |
| Sb | ng/m3 | <2.3 | <1.2 | <2.5 | <2.1 |
| µg/g | <95.3 | <50.8 | <89.8 | <86.0 |
| Ti | ng/m3 | 15.2 (0.1–229.7) | 5.5 (0.9–16.2) | 8.2 (0.3–96.3) | 11.3 (0.4–229.7) |
| µg/g | 499.8 (8.4–2911.8) | 232.9 (14.1–871.9) | 265.9 (10.9–2821.2) | 384.7 (8.4–2911.8) |
Table 7.
Absolute and relative concentrations of metals contained in PM2.5 for the different typologies of sites and as average for the studied area. In parenthesis the observed ranges.
Table 7.
Absolute and relative concentrations of metals contained in PM2.5 for the different typologies of sites and as average for the studied area. In parenthesis the observed ranges.
| PM2.5 | | Background (Samples 32) | Industrial (Samples 52) | Urban (Samples 29) | Studied Area (Samples 113) |
|---|
| Cd | ng/m3 | <0.4 | <0.2 | <0.4 | <0.3 |
| µg/g | <14.6 | <11.4 | <13.7 | <12.9 |
| V | ng/m3 | <1.4 | 1.5 (0.1–5.0) | <1.7 | 1.5 (0.1–5.0) |
| µg/g | <90.5 | 62.7 (4.6–192.5) | <65.5 | 75.5 (2.0–714.3) |
| Fe | ng/m3 | 86.8 (0.9–416.9) | 85.0 (10.9–333.8) | 78.8 (3.9–346.9) | 83.9 (0.9–416.9) |
| µg/g | 4621.4 (51.6–15285.7) | 3141.4 (666.7–10570.8) | 3004.2 (148.3–14304.3) | 3515.5 (51.6–15285.7) |
| Al | ng/m3 | 60.7 (15.0–144.9) | 66.7 (1.7–206.9) | 51.0 (4.5–157.3) | 62.7 (1.7–206.9) |
| µg/g | 3654.7 (341.3–7050.0) | 2291.4 (87.0–6742.2) | 2211.3 (167.9–6487.7) | 2677.3 (1.7–206.9) |
| Cu | ng/m3 | 3.1 (0.1–22.1) | 5.1 (0.9–31.3) | 5.7 (1.0–15.6) | 4.7 (0.1–31.3) |
| µg/g | 158.3 (6.8–1511.5) | 231.6 (19.4–1688.1) | 217.1 (44.4–616.3) | 207.1 (6.8–1688.1) |
| Ni | ng/m3 | 2.4 (0.3–30.4) | 1.9 (0.2–13.7) | 1.7 (0.4–3.4) | 2.0 (0.2–30.4) |
| µg/g | 150.0 (12.5–1628.1) | 73.8 (5.8–315.4) | 57.2 (13.3–143.2) | 90.9 (5.8–1628.1) |
| Mn | ng/m3 | 2.3 (0.2–4.5) | 1.7 (0.01–8.4) | 1.9 (0.2–5.4) | 1.9 (0.01–8.4) |
| µg/g | 117.7 (12.5–207.1) | 63.1 (0.7–265.6) | 63.0 (2.0–166.6) | 78.3 (0.7–265.6) |
| Zn | ng/m3 | 14.9 (2.4–76.4) | 30.8 (2.0–154.1) | 25.7 (7.3–131.6) | 24.7 (2.1–154.1) |
| µg/g | 1004.0 (90.9–7476.2) | 1527.9 (38.0–10615.0) | 896.3 (214.4–4750.2) | 1205.9 (38.0–10615.0) |
| Pb | ng/m3 | 9.5 (0.7–65.7) | 8.6 (1.3–39.8) | 8.5 (0.7–31.1) | 8.9 (0.7–65.7) |
| µg/g | 472.1 (29.1–4478.4) | 365.6 (24.1–2207.6) | 260.7 (44.0–1157.5) | 369.7 (24.1–4478.4) |
| As | ng/m3 | 1.0 (0.9–3.1) | 0.7 (0.01–1.0) | <0.8 | 0.8 (0.01–3.1) |
| µg/g | 76.8 (14.6–714.3) | 34.6 (0.4–113.5) | <31.0 | 46.1 (0.2–714.3) |
| Cr | ng/m3 | 1.9 (0.5–13.5) | 3.0 (0.1–13.3) | 1.4 (0.1–3.7) | 2.2 (0.1–13.5) |
| µg/g | 106.8 (8.4–921.8) | 102.7 (6.1–321.4) | 58.0 (2.9–139.7) | 90.9 (2.3–921.8) |
| Sb | ng/m3 | 1.6 (0.9–6.8) | 1.2 (0.4–3.0) | 1.0 (0.9–1.5) | 1.2 (0.4–6.8) |
| µg/g | 99.1 (20.8–497.9) | 53.3 (9.9–218.7) | 49.6 (16.3–80.2) | 66.1 (9.8–497.9) |
| Ti | ng/m3 | 4.9 (0.9–12.3) | 2.7 (0.9–6.4) | 0.9 (0.09–0.9) | 3.1 (0.09–12.3) |
| µg/g | 299.8 (20.8–737.2) | 105.4 (41.1–262.4) | 46.8 (16.3–80.2) | 159.1 (16.3–737.2) |
Table 8.
Correlation matrix for PM10 concentrations evaluated for the studied area. In bold values larger than 0.65.
Table 8.
Correlation matrix for PM10 concentrations evaluated for the studied area. In bold values larger than 0.65.
| PM10 | Fe | V | Ni | Cd | Cu | Zn | Mn | Pb | Cr | Al | Ti |
|---|
| Fe | 1.00 | 0.30 | 0.42 | 0.03 | 0.33 | 0.06 | 0.83 | 0.17 | 0.45 | 0.82 | 0.72 |
| V | | 1.00 | 0.10 | 0.09 | 0.09 | 0.04 | 0.27 | 0.06 | 0.09 | 0.27 | 0.24 |
| Ni | | | 1.00 | 0.04 | 0.08 | 0.14 | 0.40 | 0.20 | 0.96 | 0.08 | 0.07 |
| Cd | | | | 1.00 | 0.17 | 0.10 | 0.05 | 0.11 | 0.02 | −0.22 | −0.25 |
| Cu | | | | | 1.00 | 0.27 | 0.29 | 0.36 | 0.07 | 0.06 | −0.01 |
| Zn | | | | | | 1.00 | 0.03 | 0.40 | 0.21 | 0.03 | −0.05 |
| Mn | | | | | | | 1.00 | 0.13 | 0.36 | 0.82 | 0.68 |
| Pb | | | | | | | | 1.00 | 0.21 | −0.03 | −0.06 |
| Cr | | | | | | | | | 1.00 | 0.19 | 0.31 |
| Al | | | | | | | | | | 1.00 | 0.79 |
| Ti | | | | | | | | | | | 1.00 |
There is not a clear pattern in metals concentrations in PM2.5 comparing the three typologies of sites. However, in PM10 significantly larger concentrations of Cd, Pb, and Cr are observed in industrial sites with respect to background sites (according to the t-Student test at 5% probability); while crustal elements (Al, Mn, and Ti) have larger concentrations in background sites.
The comparison of metal concentrations in different typologies of sites has been performed, for example, in Spain [
23,
24] and in other locations in Central and Northern Europe [
32,
33]. However, detailed results for the area investigated are not available. In general terms, trace element concentrations do not show clear trends moving from one typology of site to the other. In [
32], two groups of metals have been identified one increasing in urban sites and the other being substantially similar at all typology of sites.
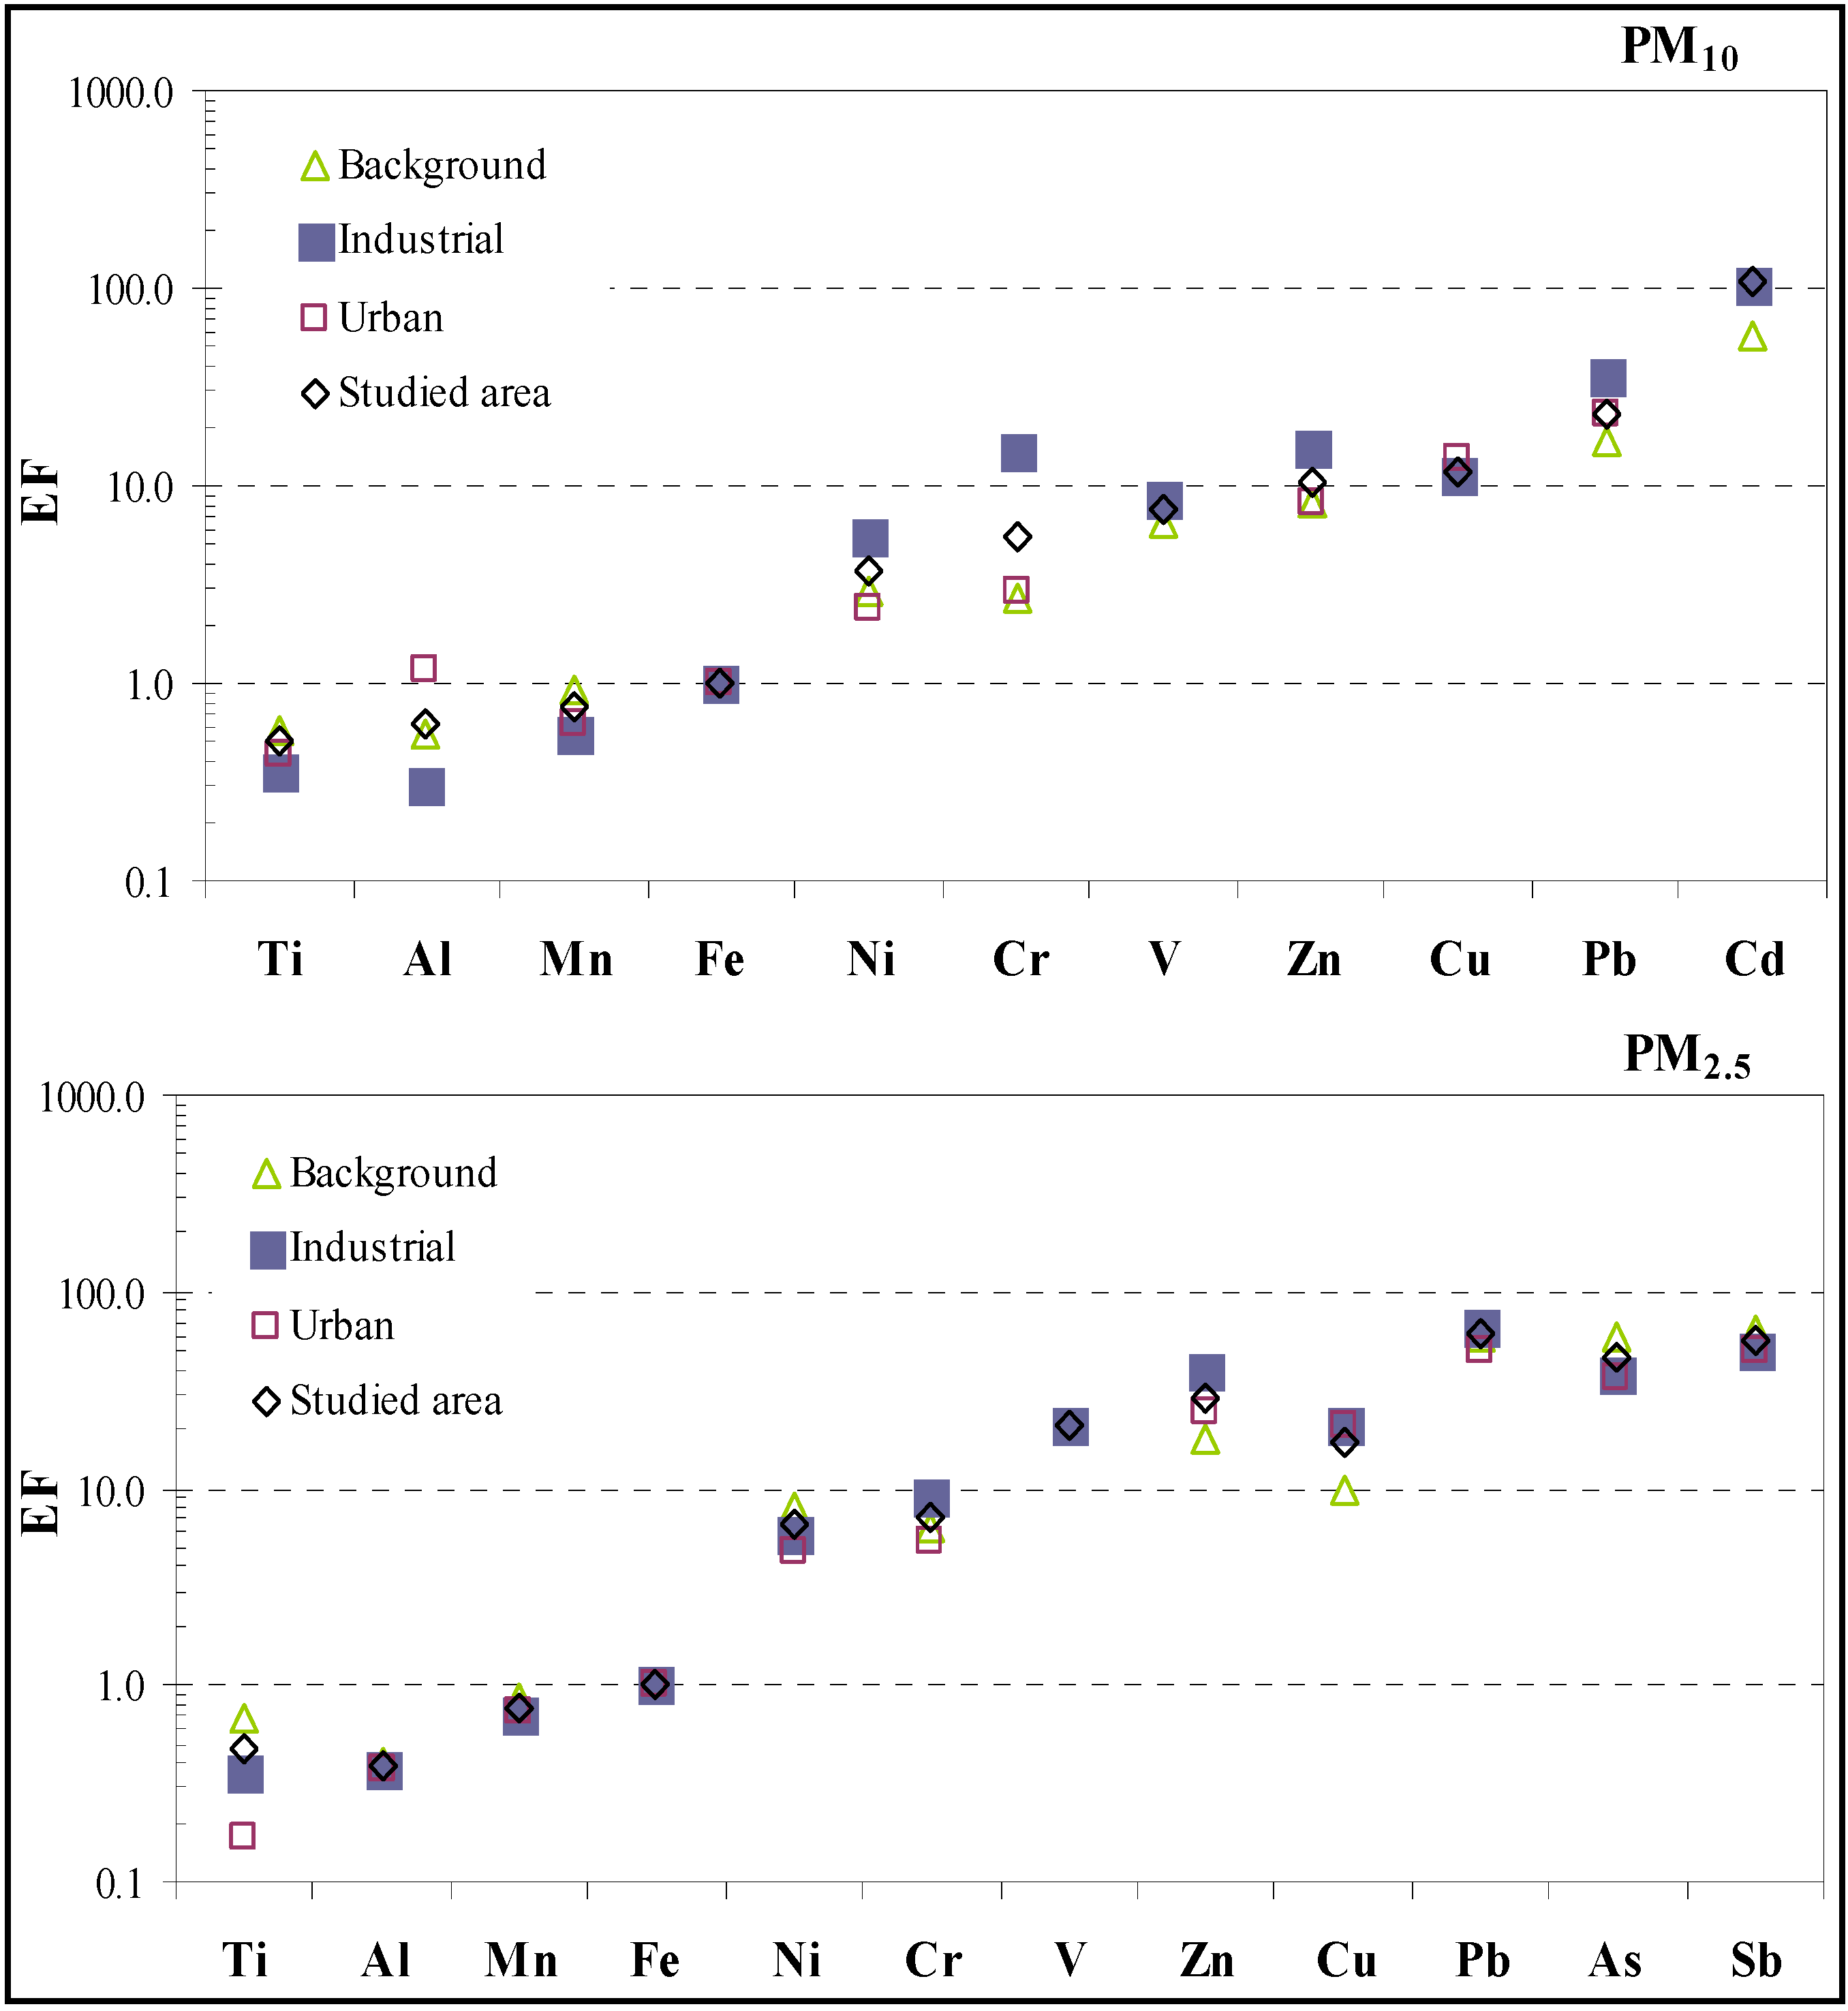
Figure 2.
Crustal enrichment factors calculated for PM10 and PM2.5 in the different typologies of sites including the average for the studied area.
Figure 2.
Crustal enrichment factors calculated for PM10 and PM2.5 in the different typologies of sites including the average for the studied area.
The crustal enrichment factors (EFs) were evaluated for the different elements in PM
10 and PM
2.5 fractions taking Fe as reference element and using, for comparison, the average re-suspended soil composition determined in the area studied [
34]. The EFs are reported in
Figure 2. Calculations were not performed for cases in which only a threshold value is given in
Table 6 and
Table 7 (
i.e., when more than 50% of the samples were not quantified). Fe is not the only possible choice for crustal reference, but it is one commonly used in calculation of EFs [
35,
36,
37,
38,
39,
40,
41]. The analysis of EFs furnishes only qualitative information, because the wide variation of the elemental concentration must also be considered. Here the two-threshold system developed by Cesari
et al. [
34] is used. EF larger than 4 can be considered mainly of anthropogenic origin (elements significantly enriched), while elements with EF smaller than 2 can be considered mainly of crustal origin. Between the two thresholds elements are likely influenced by both crustal and anthropogenic sources. The elements Ti, Al, and Mn are not enriched in both fractions (PM
10 and PM
2.5) for all typologies of sites. Ni and Cr appear to be enriched in PM
2.5 and in PM
10 for industrial sites but a significant crustal component could be present at background and urban sites for these elements in PM10. V, Cu, Pb, Zn, Cd, and Sb are significantly enriched at all typologies of sites; particularly, in literature, many of these highly enriched metals have been associated with traffic source [
42]. In general, the enrichment of a specific element is larger in the PM
2.5 fraction [
43]. In
Table 8, the correlation matrix for the metals in PM
10 calculated over all the studied area is presented. It is observed a correlation between the low-enrichment elements Fe, Al, Mn, and Ti, likely of crustal origin [
34]. A second correlation between Ni and Cr is observed, especially in industrial sites. This correlation is commonly associated with industrial emissions like pyrometallurgical processes such as those in steel plants and in non-ferrous metal industries [
42,
43]. In urban sites (not shown) a correlation between Cu and Sb is observed likely associated with the traffic contribution. These elements showed significant increase at traffic spot in Barcelona likely due to break abrasion [
24]. The correlation matrix for PM
2.5 (not shown) gave the same groups of elements correlated.


