Data Mining Methods to Generate Severe Wind Gust Models

Geoinformatics Research Centre (GRC), Auckland University of Technology (AUT), 2-14 Wakefield St, Auckland 1142, New Zealand
*
Author to whom correspondence should be addressed.
Atmosphere 2014, 5(1), 60-80; https://doi.org/10.3390/atmos5010060
Submission received: 10 November 2013
/
Revised: 12 December 2013
/
Accepted: 18 December 2013
/
Published: 13 January 2014
(This article belongs to the Special Issue Agrometeorology: From Scientific Analysis to Operational Application)
Abstract
:Gaining knowledge on weather patterns, trends and the influence of their extremes on various crop production yields and quality continues to be a quest by scientists, agriculturists, and managers. Precise and timely information aids decision-making, which is widely accepted as intrinsically necessary for increased production and improved quality. Studies in this research domain, especially those related to data mining and interpretation are being carried out by the authors and their colleagues. Some of this work that relates to data definition, description, analysis, and modelling is described in this paper. This includes studies that have evaluated extreme dry/wet weather events against reported yield at different scales in general. They indicate the effects of weather extremes such as prolonged high temperatures, heavy rainfall, and severe wind gusts. Occurrences of these events are among the main weather extremes that impact on many crops worldwide. Wind gusts are difficult to anticipate due to their rapid manifestation and yet can have catastrophic effects on crops and buildings. This paper examines the use of data mining methods to reveal patterns in the weather conditions, such as time of the day, month of the year, wind direction, speed, and severity using a data set from a single location. Case study data is used to provide examples of how the methods used can elicit meaningful information and depict it in a fashion usable for management decision making. Historical weather data acquired between 2008 and 2012 has been used for this study from telemetry devices installed in a vineyard in the north of New Zealand. The results show that using data mining techniques and the local weather conditions, such as relative pressure, temperature, wind direction and speed recorded at irregular intervals, can produce new knowledge relating to wind gust patterns for vineyard management decision making.
1. Introduction
Worldwide, the frequency and severity of weather extremes observed especially over the last few decades have increased significantly, leading to an overhaul in models and prediction/forecasting methods used for this purpose [1,2,3]. It is becoming increasingly vital for scientists, agriculturists, farmers, global food security, disaster management and related organizations to understand the natural phenomena to plan and be prepared for the future [4,5,6,7]. Currently used crop-climate models developed two decades ago underestimate the potential adverse effects of recent and projected climate extremes. More frequent and intense climate extremes (droughts, floods and gusts) characterized by stochastic variability in precipitation, wind (tornados), soil moisture, maximum and minimum ambient temperatures observed across the globe are not incorporated into the existing models [8]. Crop sensitivity to such drastic adverse weather conditions varies significantly depending mainly on the crop, plant phenology and other location specific environmental conditions [9]. For instance, severe frost events in the month of September in New Zealand could damage the grapevine shoots wiping out the year’s crop also affecting vine productivity for up to three following years [10]. In this context, the paper investigates the application of different data mining algorithms to wind gust modelling and prediction purposes. Kumeu meteorology data acquired over a four year period (2008–2012) using wireless telemetry devices for now casting and web display was used for this study. With this introduction to the recent weather extremes and the need to model and predict them in advance, in the next section literature reviewed on research that has led to the use of intelligent data processing approaches for this purpose is detailed. In Section 3, the methodology adopted in this research is elaborated, following which the results obtained are presented. At the end of this paper some conclusions arrived at from this research are summarized.
2. Literature
The section initially outlines a few data mining applications to real world problems that complement the conventional statistical methods as the latter are not designed for retrospective analysis of ad hoc and large volumes of data. Following this outline, a few recent approaches so far investigated on wind gust modelling and prediction by other researchers are presented before discussing those investigated by researchers at the Geoinformatics Research Centre (GRC), Auckland University of Technology (AUT) New Zealand.
2.1. Data Mining Techniques for Modelling Meteorological Data
The 21st century is more renowned for the introduction and refinement of data-driven science as a complementary approach to the traditional hypothesis-driven methods. This is even seen by some as a “paradigm shift” from the application of “reductionism” theory based to complex systems sciences and it has already transformed the natural sciences [11]. For instance, in [12] a time series forecasting approach of a neural network with the multi resolution learning paradigm (NNMLP) has been described as showing good skills for predicting long-term range stream flows. The time series forecasting approach of NNMLP was concluded to have shown great potential for use on its own in regions with limited available information, and for analysis combined with other approaches to improve long-term range stream flow forecasts.
A new technique based on an unsupervised algorithm proposed in [13] was aimed at identifying extreme values in climate time series and then correlating the climate and remote sensing data to improve agricultural monitoring. The software implementation of the algorithm called CLIPSMiner (CLImate PatternS Miner) was described to be able to handle multiple time series of continuous data, to identify relevant patterns or extreme events based on a relevance factor that can be chosen by the user. Results of the approach showed the CLIPSMiner ability to detect patterns that were described to be “known in climatology”, indicating the correctness and feasibility of the proposed algorithm. The patterns detected based on a “highest relevance” factor were stated to be in coincidence with the extreme events in the chosen phenomenon. Furthermore, the series correlations detected by the algorithm are said to be also showing a relation between agro climatic and vegetation indices, confirming the agro meteorologists’ expectations.
In [14] a theoretical framework was put forward for extracting spatio-temporal patterns (sequences representing evolution of locations and their neighborhood over time). To overcome the limitations with the classical frequency support, such as the exclusion of the pattern neighbor and its evolution over time, a new “interestingness measure” was proposed in the framework by taking into account both spatial and temporal aspects. The algorithm was based on a pattern-growth approach with efficient successive projections over the database.
In a more recent work presented in [15] different rainfall prediction models, such as Weather research and forecasting, Seasonal climate forecasting, Global data forecasting and General data mining rainfall prediction models were discussed in detail. The models were implemented by the Indian Meteorological Department to perform data mining tasks and were stated as providing a very useful and accurate knowledge base in the form of rules, models, and visual graphs for prediction and to support decision making in different sectors.
A data model developed for analyzing meteorological data in the Indian context discussed in [16] is more related to the work presented in this paper. The performances of the different algorithms initially investigated in that study were compared using standard performance metrics, and the algorithm that gave the best results was then used to generate classification rules for the mean weather variables. Furthermore, a predictive Neural Network model was developed for the weather prediction program and the results were then compared with actual weather data for the predicted periods. The results of the work were described to have given enough case data, to suggest that the data mining techniques could be used for weather forecasting and climate change studies.
As can be observed above, the success of different data mining approaches to modelling and forecasting natural phenomena vary significantly making one wonder which could be the best approach for the particular problem in hand [17]. On the other hand, every time a solution is found the volume of the data increases with time (based on Moore theory data increases exponentially at an increasingly shorter pace [18]) in turn creating new constraints with the model developed only a year or two ago [19]. Thus, this paper looks at the results obtained with five different data mining techniques in an initial investigation conducted into revealing the patterns in weather conditions for forecasting very high wind gust events using Kumeu meteorological data as an example study.
2.2. Wind Gust Prediction Methods
A wide range of wind hazard modelling methods has been developed since the 1950s however none of them has been able to represent the full complexity of the real world scenarios [20]. The popular models identified by the authors of that recent study were atmosphere—ocean circulation and regional climate modelling, Monte Carlo simulation, and statistical probabilistic modelling, all three stated to be suffering from some major constraints. The limitations identified with these methods were: intensive demand for computation, lack of surface measurements for calibration of wind-field models and unavailability of consistent data covering a long time period respectively. Even then in that work the statistical probabilistic modelling approaches were considered to be better for wind hazard modelling. These approaches use weather monitoring station data relating to fixed locations that represent the ideal characteristics of buildings and infrastructure exposed to wind actions in the wind load calculations. The recorded data at a site represents directly the time series of near-surface (typically at 10-m altitude) wind loads on a structure/plants at the meso scale.
Meanwhile in [21] the authors developed a model to predict 1 Hz wind series at below 2 m. The model uses the averaged wind velocity, the standard deviation (or turbulent intensity) at 2 m and the friction velocity acquired by multipoint measurement system equipped with high-sensitivity cup anemometers for field measurement. In another interesting paper by [22], the authors developed a hybrid approach comprising of Self-organising map (SOM) and back propagation neural networks to predict wind speed. In their results the hybrid approach outperformed the back propagation network alone method. The variables used as input to the hybrid were temperature, humidity, and wind gust.
2.2.1. Machine Learning Wind Gust Models
In [23], using 2,000 observations of gust events from contrasting locations namely, Kumeu in the North West of New Zealand’s North Island and the Maule Region, in the Central Valley of Chile, a mean interval of 3.2 min between the beginning and end of wind velocity change within a noticeable linear acceleration pattern was observed.
To overcome the challenge caused by sampling and interpretation of the complex data set, in that research, methods of wind gust measurement and prediction for making reliable predictions were investigated. From that investigation, a machine-learning approach was found to be a satisfactory analytical process with meaningful and useful results produced. The algorithm used for the analysis was designed to use terrestrial sensor telemetry weather data collected in real-time at near-ground level and recorded independent of geostrophic upper atmosphere conditions as input.
2.2.2. GRC’s Kalman Ensemble Wind Gust Model
Previously, in [24] Ensemble Kalman Filter (EnKF) method was used to deal with the spatio-temporal estimation problem when identifying and determining values for discrete data points across a three dimensional plane.
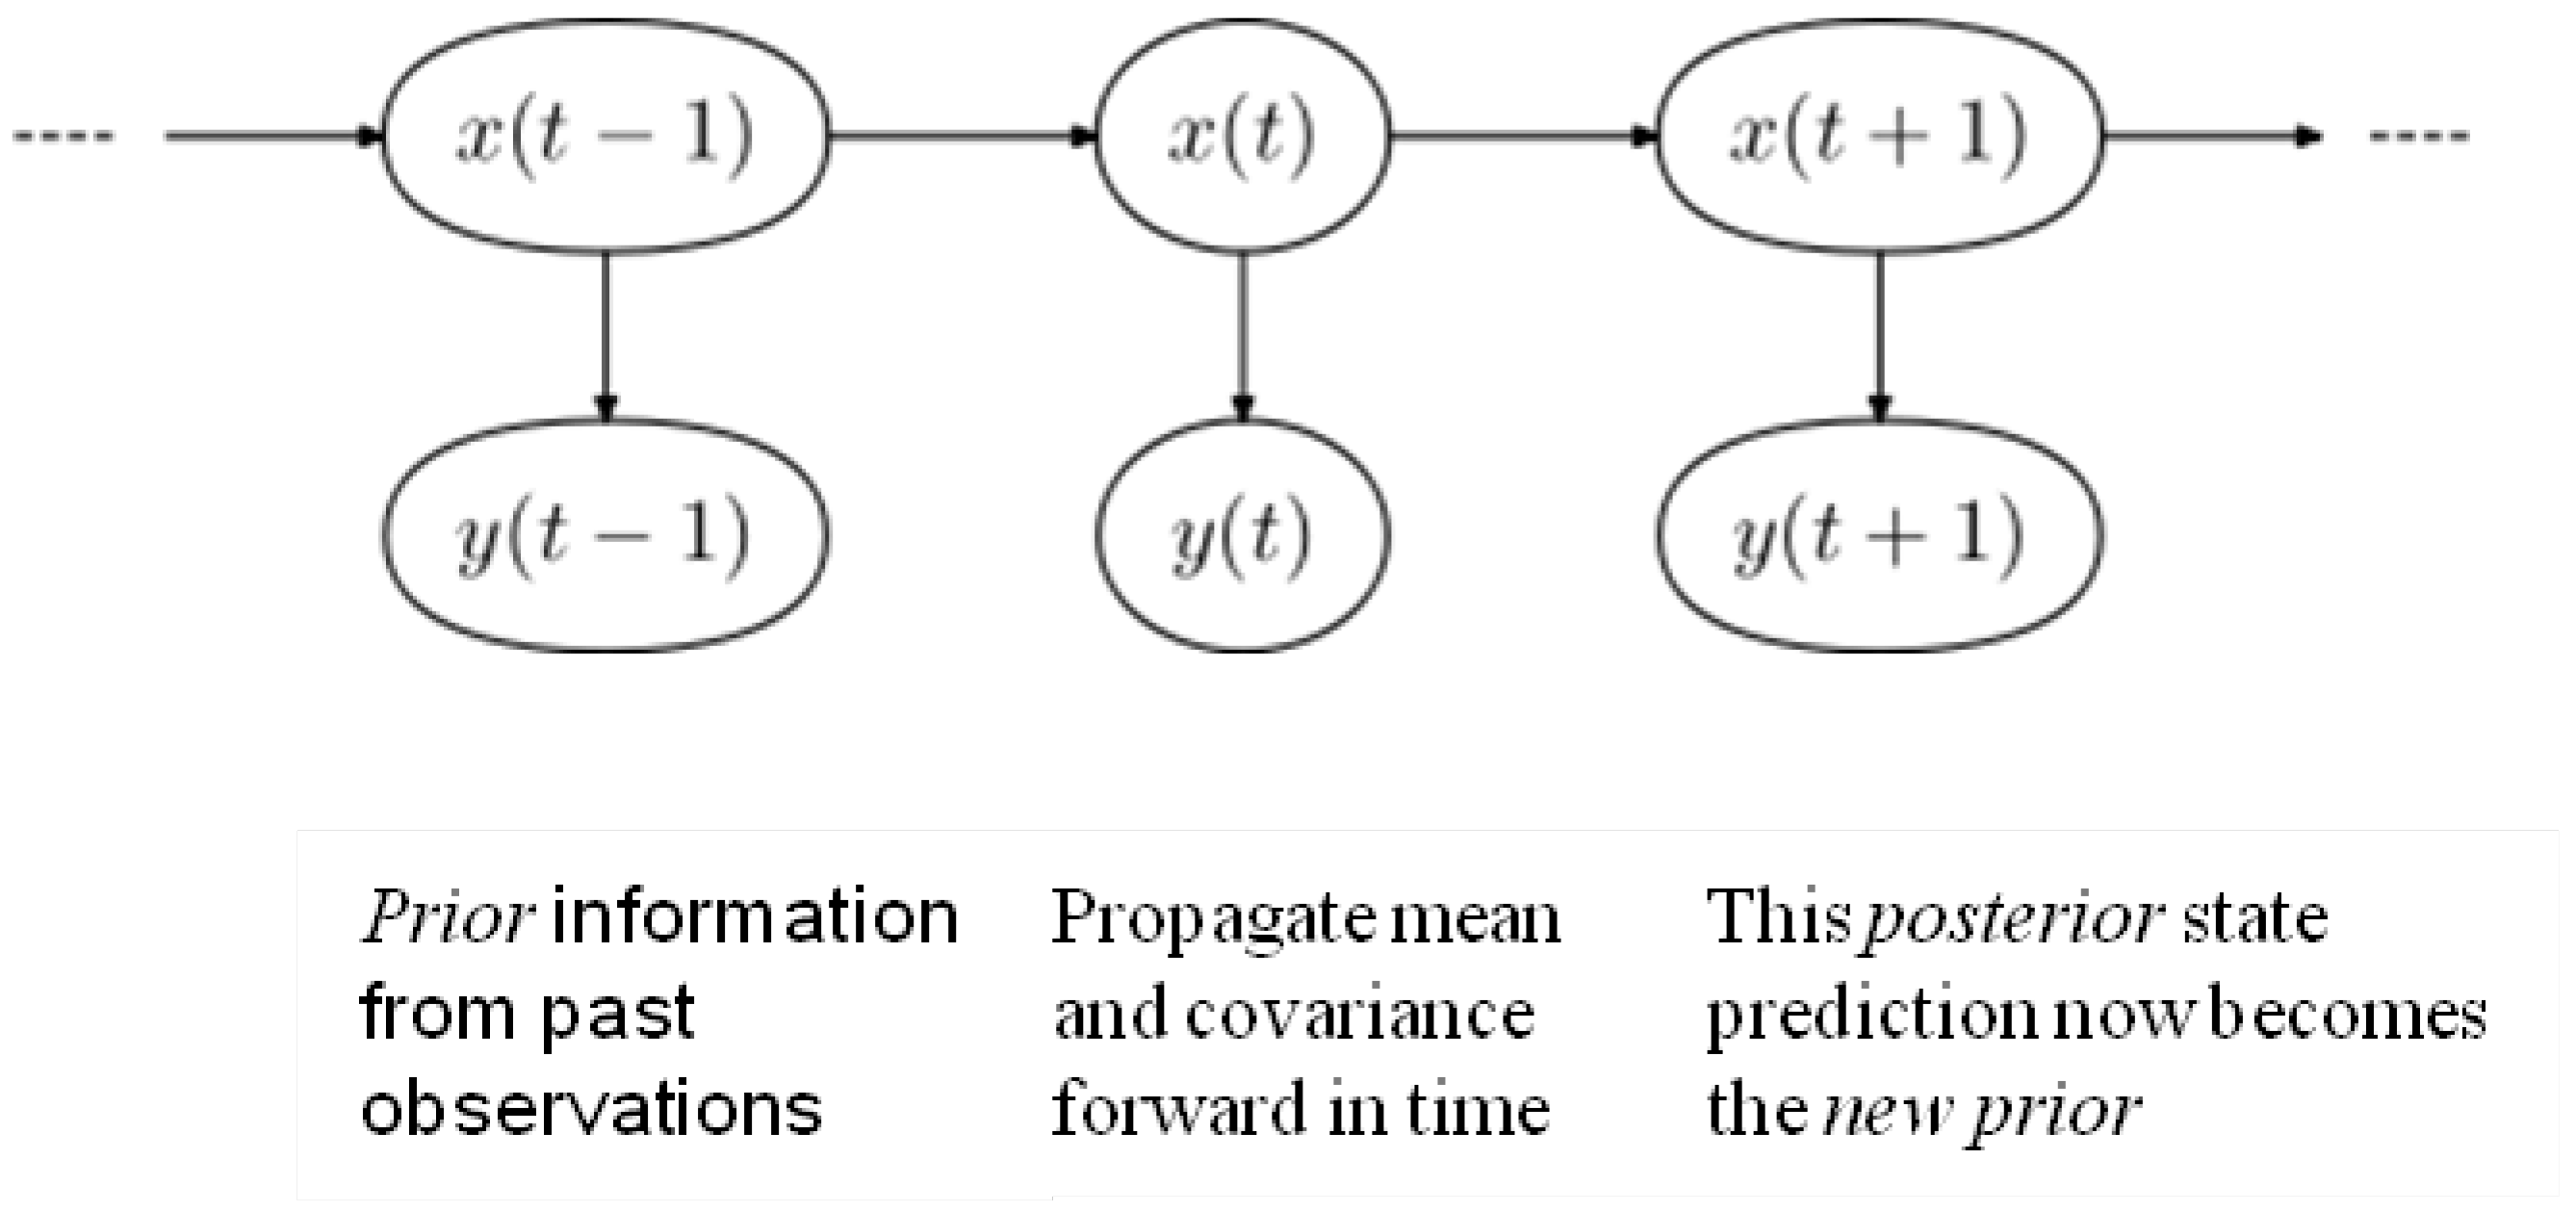
Modelling climate variations is a non-trivial challenge for any single interpolation method because the data is inherently continuous. Using methods derived from signal processing de-noising tool applications, the Ensemble Kalman filter (EnKF) has been proposed in data assimilation situations to model uncertain initial conditions in numerical weather prediction. The EnKF overrides the linearity assumption of the standard Kalman filter by using a Monte Carlo approximation of the optimal probability forecast. Because of the inherent so-called ‘curse of dimensionality problem’ of stochastic approximation methods such as with a sequential Monte Carlo, the EnKF uses a low-rank approximation to the covariance of the posterior density, which also introduces spurious correlations in the filter estimates. This is a three step recursive process such that T is modified iteratively by new information:
![Atmosphere 05 00060 i001]() where an a priori state T given T-1 is updated with a mean and covariance from new observations (realizations) at T+1 (given T), which then as T+1 becomes the forecast estimate (posterior prediction) and is returned as the prior for the next iteration of the model, when T+1 becomes T (as in Figure 1). The recursive sequencing nature of the method can be depicted using Markov notation thus:
where an a priori state T given T-1 is updated with a mean and covariance from new observations (realizations) at T+1 (given T), which then as T+1 becomes the forecast estimate (posterior prediction) and is returned as the prior for the next iteration of the model, when T+1 becomes T (as in Figure 1). The recursive sequencing nature of the method can be depicted using Markov notation thus:

Figure 1.
The recursive ensemble process
The authors argued that the outlying values that may not conform to the expected variations to a mean as “significant indicators” of a change point yet to be observed, stating that Kriging would prune such a value and complete the interpolation without including it in the cluster of predictors for new data point instances. Based on some previous work, it was then found ensemble methods to be a multi algorithmic approach with an ability to retain any outlier value until computations of all possible permutations of the data are exhausted. The methods were found to be also useful when incorporating a temporal variable into the model without distorting the intrinsic geospatial properties of the former interpolation methods. Finally, from that initial investigation the authors concluded that the EnKF approach was a potential and useful tool to predict accurately against a known truth while at the same time maintaining data integrity, reducing noise in the data set during computation, producing a clean and reliable model together with a result.
With this introduction to recent wind gust models investigated in general and by GRC researchers, from here onwards the paper elaborates on the data mining methods investigated for this research to further drilldown through the meteorological/weather and atmosphere data acquired by telemetry devices installed in Kumeu River Wines, Auckland, New Zealand.
3. The Data
Weather and atmosphere data acquired at different time intervals e.g., 5–30 min/s by multiple wireless sensors installed in Kumeu River Wines vineyard and other locations around the world are logged and transmitted to a local server in Auckland, New Zealand, and then to a database server for web display and future analysis. From this data repository, instances relating to the Kumeu River vineyard for a period of four years (2008–2012) were extracted for this study. The data consisted of correct and erroneous readings hence it was cleaned to remove all readings that were outside of Kumeu record readings based on [25]. The final 86,418 vectors and their distribution over the 12 months and within the years studied are presented in Table 1, Table 2 and Table 3. A new variable gust class (no, low, med, high and very high classes for 0, <1, <3, <10 and <20 km/h respectively) has been introduced to model the weather patterns using data mining algorithms that do not handle continuous output data such as C5, Quest and CHAID. The input variables used are: month (either as class or coded), outdoor temperature, outdoor humidity, pressure relative, wind speed (Wind is defined as “the rate at which air is moving horizontally past a given point. It may be a 2-minute average speed (reported as wind speed) or an instantaneous speed (reported as a peak wind speed, or gust)” both measured and used in this study in km per hour (km/h)). The former in the average wind speed of observed reading within every two minutes, whereas the latter is the instantaneous, wind direction (The wind direction is the direction from which the wind is blowing), wind chill (Wind chill is defined as “the additional cooling effect resulting from wind blowing on bare skin. The wind chill is based on the rate of heat loss from exposed skin caused by the combined effects of wind and cold. The (equivalent) wind chill temperature is the temperature the body “feels” for a certain combination of wind and air temperature”) and dew point (Dew point is “the temperature to which the air must be cooled for water vapor to condense and form fog or clouds”) based on [26].

Table 1.
Distribution of Kumeu meteorological data over different months (January–December) (top) and in years studied (2008, 2009, 2011 and 2012) (bottom).
| Month | Frequency Out of Total | Total (%) | Valid (%) | Cumulative (%) |
|---|---|---|---|---|
| April | 4,946 | 5.7 | 5.7 | 5.7 |
| August | 7,375 | 8.5 | 8.5 | 14.2 |
| December | 13,034 | 15.1 | 15.1 | 29.4 |
| February | 1,101 | 1.3 | 1.3 | 30.6 |
| January | 10,754 | 12.4 | 12.4 | 43 |
| July | 5.31 | 5.8 | 5.8 | 48.9 |
| June | 6,259 | 7.2 | 7.2 | 56.1 |
| March | 2,782 | 3.2 | 3.2 | 59.3 |
| May | 8,215 | 9.5 | 9.5 | 68.8 |
| November | 13,664 | 15.8 | 15.8 | 84.6 |
| October | 8,276 | 9.6 | 9.6 | 94.3 |
| September | 4,981 | 5.8 | 5.8 | 100 |
| Total | 86,418 | 100 | 100 | 100 |
| Year | Frequency out of Total | Total % | Valid (%) | Cumulative (%) |
| 2008 | 7,861 | 9.1 | 9.1 | 9.1 |
| 2009 | 20,479 | 23.7 | 23.7 | 32.8 |
| 2011 | 47,072 | 54.5 | 54.5 | 87.3 |
| 2012 | 11,006 | 12.7 | 12.7 | 100 |
| Total | 86,418 | 100 | 100 |
Table 2.
Meteorological variables and their profiles of cleaned data used to model and predict gusts.
| Month | Year (No. of Records) | Pressure Relative (hPA) | Out Temperature (°C) | Outdoor Humidify (%) | Dew Point (°C) | Wind Chill (°C) | Wind Speed (km/h) | Wind Direction (°) | Gust (km/h) | ||
|---|---|---|---|---|---|---|---|---|---|---|---|
| Total N | N (Valid) | 86,418 | 86,418 | 86,418 | 86,418 | 86,418 | 86,418 | 86,418 | 86,418 | 86,418 | 86,418 |
| N (Missing) | 0 | 0 | 0 | 0 | 0 | 0 | 0 | 0 | 0 | 0 | |
| Mean | 2010 | 1,009.91 | 14.75 | 79.38 | 11.01 | 14.22 | 4.08 | 136.92 | 4.95 | ||
| Std. Error of Mean | 0.004 | 0.028 | 0.019 | 0.046 | 0.013 | 0.02 | 0.02 | 0.443 | 0.028 | ||
| Median | 2011 | 1,009.60 | 14.90 | 84.00 | 11.20 | 14.30 | 1.40 | 100.00 | 0.60 | ||
| Mode | 2011 | 1,011.40 | 0.30 | 91 | 11.80 | 15.00 | 0.00 | 0 | 0.00 | ||
| Std. Deviation | 1.229 | 8.25 | 5.57 | 13.477 | 3.81 | 5.00 | 6.08 | 130.35 | 8.33 | ||
| Variance | 1.510 | 68.02 | 31.04 | 181.62 | 14.53 | 25.034 | 36.98 | 16,990.38 | 69.46 | ||
| Skewness | −0.636 | 0.14 | 0.003 | −0.900 | −0.398 | 0.027 | 3.2 | 0.232 | 2.47 | ||
| Std.Err of Skewness | 0.008 | 0.01 | 0.008 | 0.008 | 0.008 | 0.008 | 0.008 | 0.008 | 0.01 | ||
| Kurtosis | −0.922 | 0.097 | 0.827 | −0.205 | 0.732 | 0.526 | 29.80 | −1.610 | 10.65 | ||
| Std. Error of Kurtosis | 0.017 | 0.017 | 0.017 | 0.017 | 0.017 | 0.017 | 0.017 | 0.017 | 0.02 | ||
| Range | 4 | 57.10 | 41.80 | 57 | 31.30 | 51.10 | 173.00 | 360 | 173.00 | ||
| Minimum | 2008 | 977.90 | −8.90 | 39 | −3.70 | −11.20 | 0.00 | 0 | 0.00 | ||
| Maximum | 2012 | 1,035.00 | 32.90 | 96 | 27.60 | 39.90 | 173.00 | 360 | 173.00 | ||
| Percentiles | 10 | 2009 | 999.70 | 8.30 | 58.00 | 6.10 | 8.10 | 0.00 | 0.00 | 0.00 | |
| 20 | 2009 | 1,002.60 | 10.70 | 67.00 | 8.20 | 10.50 | 0.00 | 0.00 | 0.00 | ||
| 25 | 2009 | 1,003.70 | 11.40 | 70.00 | 8.80 | 11.20 | 0.00 | 0.00 | 0.00 | ||
| 30 | 2009 | 1,004.90 | 12.20 | 74.00 | 9.40 | 11.70 | 0.00 | 0.00 | 0.00 | ||
| 40 | 2011 | 1,007.50 | 13.60 | 79.00 | 10.30 | 13.00 | 0.10 | 45.00 | 0.00 | ||
| 50 | 2011 | 1,009.60 | 14.90 | 84.00 | 11.20 | 14.30 | 1.40 | 100.00 | 0.60 | ||
| 60 | 2011 | 1,012.10 | 15.90 | 87.00 | 12.20 | 15.30 | 3.20 | 220.00 | 2.20 | ||
| 70 | 2011 | 1,014.20 | 17.10 | 90.00 | 13.20 | 16.50 | 5.00 | 248.00 | 4.70 | ||
| 75 | 2011 | 1,015.30 | 17.90 | 91.00 | 13.70 | 17.10 | 6.10 | 265.00 | 6.10 | ||
| 80 | 2011 | 1,016.80 | 18.90 | 91.00 | 14.20 | 17.90 | 7.60 | 277.00 | 8.600 | ||
| 90 | 2012 | 1,020.30 | 21.40 | 93.00 | 15.50 | 20.60 | 11.90 | 311.00 | 16.90 | ||
Table 3.
Gust classes introduced in this study for use as output/target in C5, Quest and CAHID algorithms.
| Class | Frequency of Total | Valid (%) | Cumulative (%) |
|---|---|---|---|
| No | 45463 | 52.6 | 52.6 |
| Low | 15620 | 18.1 | 70.7 |
| Medium | 9855 | 11.4 | 82.1 |
| High | 8831 | 10.2 | 92.3 |
| Very High | 6649 | 7.7 | 100 |
| Total | 86418 | 100 |
4. The Methodology
The cleaned and coded (gust classes no-0, low-1, medium-2, high-3 and very high-4 and months from 1 January to 12 December) data is analyzed using the following data mining techniques and statistical methods to find the precise weather conditions/patterns relating to very high gust events in this location:
Methods 1(C5.0) and 2 (QUEST): using gust class as output and all seven variables listed in Table 2 leaving out the year as input, the two functions were run to create rules.
Methods 3 (CRT) and 4 (CHAID): using gust real values/classes (no, low, med, high and very high) as output and the eight variables as input, CRT and CAHID functions were run to create rules and predict real gust.
Method 5 Kohonen self-organising map (SOM) clustering: all input variables and real gust values were used in the clustering.
Method 6: Artificial neural network (ANN) prediction: using all input variables along with either gust class or real values the latter was predicted.
Method 7: Regression and Principal component analysis (PCA): using all input variables, regression and PCA tests were run against real gust value as output.
The algorithms of the above rule induction (association) or decision tree methods (1–4) are capable of culling through a set of predictors by successively splitting a data set into subgroups or grouping similar data points into subgroups on the basis of the relationships between predictors and the output field. These data mining algorithms vary in the way they group or split the data and depending on the data set, one particular method/algorithm could produce better rules describing the correlations between the predictors and the output as explained in Section 2.1. The above data mining techniques and statistical methods were run using SPSS clementine ver. 10.1. Rules (in the form of trees or if and then statements) obtained are analyzed to look at the weather conditions (wind speed, wind direction, wind chill, relative pressure, dew point, outdoor temperature and outdoor humidity) and patterns relating to very high gust events (>20 km/h) at the Kumeu River Wines.
5. Results and Discussion
The results obtained with each of the seven methods are discussed in this section.
5.1. C5.0 and QUEST Algorithm Results
The C5.0 algorithm ran using gust class as output produced 847 rules, 249 for no gust, 98 for low, 65 for medium, 218 for high and 217 for very high gust events. The top three highest instances relate to no gust (Table 4). Based on rule 1, wind speeds ≤ 1 km/h produced no gust with 23,699 instances at 0.999 confidence interval. Similarly, based on rules 2 and 3 wind speeds ≤ 0.1 or ≤ 0.7 km/h both with wind directions > 0 produced no gust events at 0.998 and 0.874 confidence intervals respectively.
The rules with 4 and 5th highest instances (Table 4), (over 2,000 instances at 0.998 and 1 confidence intervals respectively) relate to medium gust events. Based on rule 62 in November wind at speed between 4.9 and 9.9 km/h from south/north-west (> 90°) leads to medium gusts. Based on rule 63 in October, wind at speed >0° and as per rule 62 same wind speed but with direction > 90° leads to medium gusts.
Table 4.
Top 14 highest rules in terms of instances out of 847 rules produced by C5 algorithm for the 86,418 readings recorded at 5–30 min intervals. Gust values are converted into gust classes (no gust < 1, low < 3 medium < 10, high < 20 and very high > 20 km/h classes see Table 3 for details).
| Rule No. | Instance | Confidence | Rule |
|---|---|---|---|
| 1 for no | 23,699 | 0.999 | if Winds ≤ 4.9 and Winds ≤ 1 and Wind_Dir ≤ 1 then no |
| 2 for no | 11,886 | 0.998 | if Winds ≤ 4.9 and Winds ≤ 1 and Wind_Dir > 1 and Winds ≤ 0.1 then no |
| 3 for no | 3,459 | 0.874 | if Winds ≤ 4.9 and Winds ≤ 1 and Wind_Dir > 1 and Winds > 0.1 and Winds ≤ 0.7 then no |
| 62 for med | 2,491 | 0.998 | if Winds > 4.9 and Winds ≤ 9.9 and Wind_Dir > 0 and month = Nov and Wind_Dir > 90 then med |
| 63 for med | 2,169 | 1 | if Winds > 4.9 and Winds ≤ 9.9 and Wind_Dir > 0 and month = Oct then med |
| 217 for very_high | 2,154 | 1 | if Winds > 4.9 and Winds > 9.9 and Winds > 19.8 then very_high |
| 48 for low | 2,061 | 0.809 | if Winds <= 4.9 and Winds > 1 and Wind_Dir > 0 and Wind_Dir ≤ 359 and month = Jun and Wind_Dir ≤ 339 then low |
| 83 for low | 1,973 | 1 | if Winds ≤ 4.9 and Winds > 1 and Wind_Dir > 0 and Wind_Dir ≤ 359 and month = Oct then low |
| 216 for high | 1,827 | 0.999 | if Winds > 4.9 and Winds > 9.9 and Winds ≤ 19.8 and Wind_Dir > 0 and month = Nov and Wind_Dir > 90 then high |
| 82 for low | 1,686 | 1 | if Winds ≤ 4.9 and Winds > 1 and Wind_Dir > 0 and Wind_Dir ≤ 359 and month = Nov and Pressure_Rel > 1006.3 then low |
| 25 for no | 1,507 | 0.897 | if Winds ≤ 4.9 and Winds > 1 and Wind_Dir ≤ 0 and Winds ≤ 3.4 then no |
| 39 for low | 1,355 | 0.986 | if Winds ≤ 4.9 and Winds > 1 and Wind_Dir > 0 and Wind_Dir ≤ 359 and month = Dec and Pressure_Rel > 1002.6 then low |
| 44 for med | 1,137 | 0.994 | if Winds > 4.9 and Winds ≤ 9.9 and Wind_Dir > 0 and month = Dec and Pressure_Rel > 1002.6 and Pressure_Rel > 1008.8 then med |
| 217 for high | 1,070 | 1 | if Winds > 4.9 and Winds > 9.9 and Winds ≤ 19.8 and Wind_Dir > 0 and month = Oct then high |
Looking at the C5 rules generated for very high gust events, rule no. 217 with 2,154 instances and at 1 confidence interval with wind speeds > 19.8 have led to very high gust (Table 5). Based on rule 181, with 514 instances at 0.944 confidence interval wind speeds between 4.9 and 9.9 km/h from north-northeast (=0° and >14.8°) have led to very high gust. Based on rule 133, January wind speeds between 9.9 and 19.8 km/h and from directions between 0 and 14.8° have led to very high gusts, with 159 instances and at 0.91 confidence interval and this shows that very high winds in January coming from the northeast lead to very high gusts.
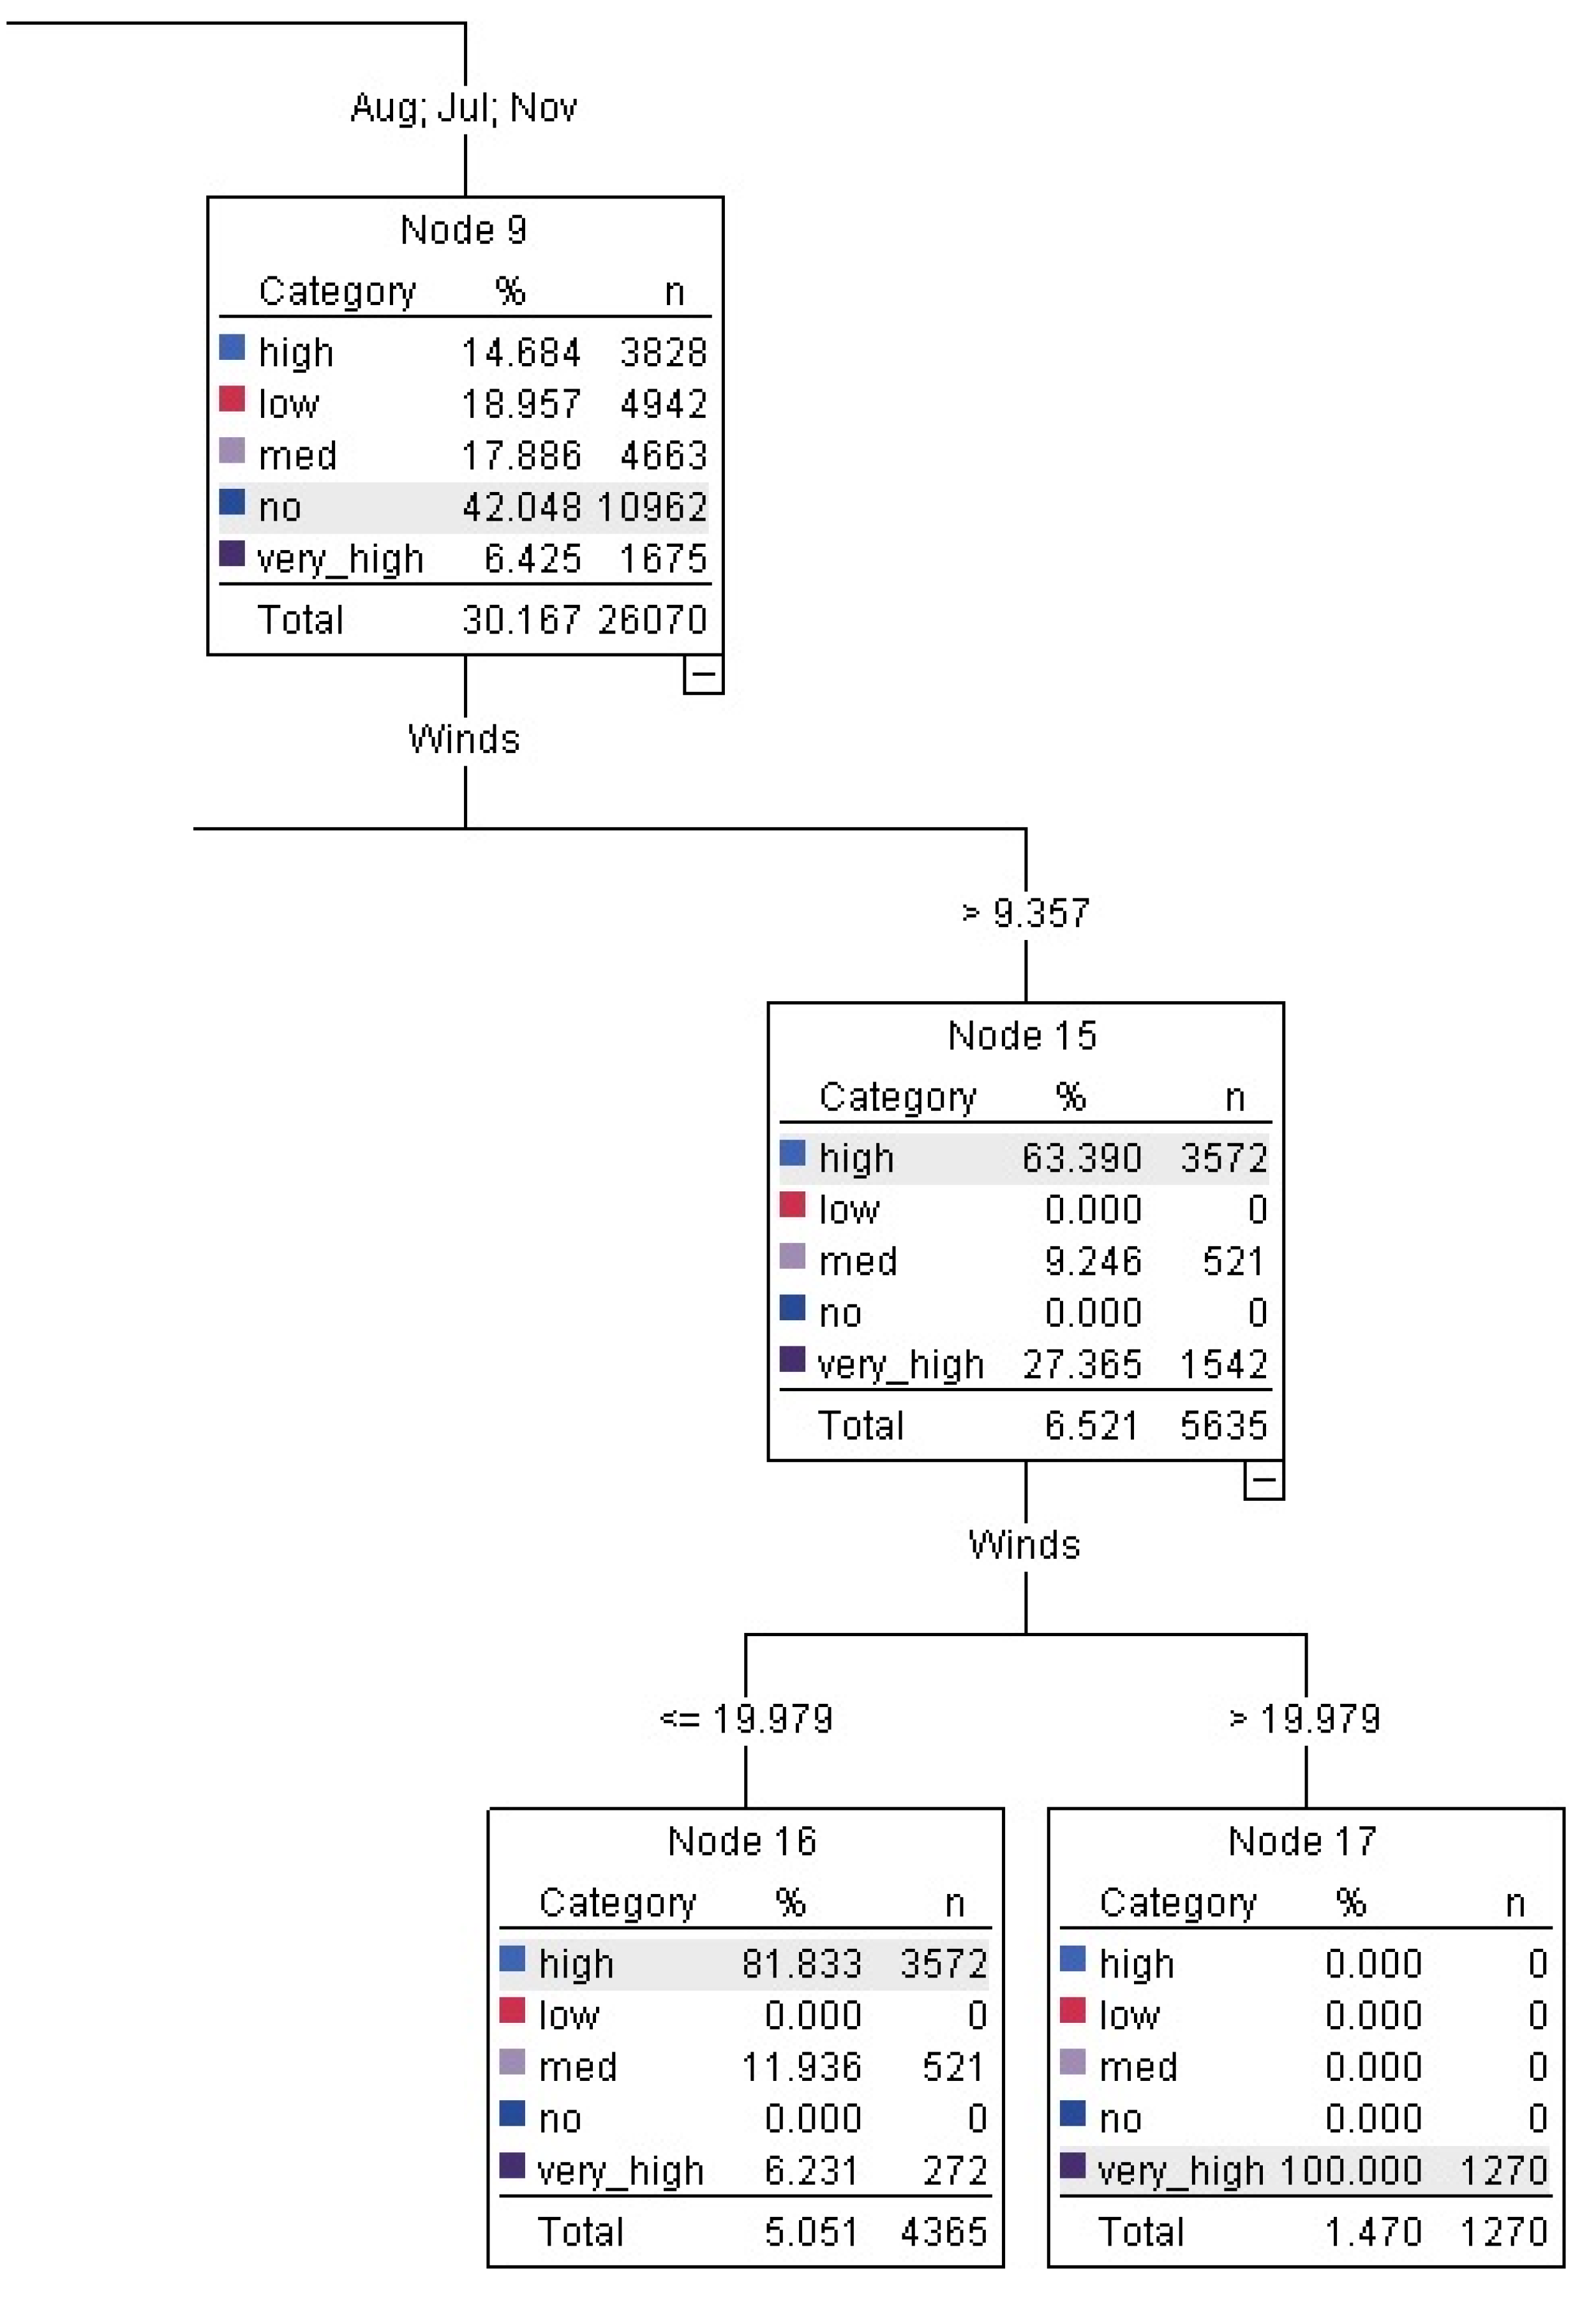
Of the QUEST rules (seen in nodes 17 and 18 in Figure 2), in months August, July and November high wind speeds > 19.98 km/h led to very high gust with 1,270 instances at 100% confidence interval. The other two rules relating to high gust were only at 50%–60% confidence interval hence not included.
Figure 2.
QUEST tree rules relating to very high gusts.
| Rule No. | Instances | Confidence | Rule |
|---|---|---|---|
| 217 | 2,154 | 1 | if Winds > 4.9 and Winds > 9.9 and Winds > 19.8 then very_high |
| 181 | 514 | 0.944 | if Winds > 4.9 and Winds > 9.9 and Winds ≤ 19.8 and Wind_Dir ≤ 0 and Winds > 14.8 then very_high |
| 205 | 238 | 0.958 | if Winds > 4.9 and Winds > 9.9 and Winds ≤ 19.8 and Wind_Dir > 0 and month = Jan and Winds > 14 then very_high |
| 193 | 232 | 0.763 | if Winds > 4.9 and Winds > 9.9 and Winds ≤ 19.8 and Wind_Dir > 0 and month = Dec and Pressure_Rel ≤ 1005.2 and Windc ≤ 19.1 and Wind_Dir ≤ 311 and Dewp ≤ 16.4 and Pressure_Rel ≤ 1002.6 and Out_Temp > 15.6 then very_high |
| 204 | 230 | 0.843 | if Winds > 4.9 and Winds > 9.9 and Winds ≤ 19.8 and Wind_Dir > 0 and month = Jan and Winds ≤ 14 and Winds > 10.1 and Wind_Dir > 200 then very_high |
| 154 | 229 | 0.795 | if Winds > 4.9 and Winds > 9.9 and Winds ≤ 19.8 and Wind_Dir ≤ 0 and Winds ≤ 14.8 and Pressure_Rel ≤ 1012.2 and Out_Hum ≤ 88 and month in [ "Dec" ] and Out_Hum > 57 and Pressure_Rel ≤ 1006.8 then very_high |
| 72 | 217 | 0.733 | if Winds > 4.9 and Winds ≤ 9.9 and Wind_Dir ≤ 0 and Winds > 8 and Pressure_Rel ≤ 1012.2 and Out_Hum ≤ 88 and Windc > 13 and Winds > 8.6 then very_high |
| 159 | 133 | 0.91 | if Winds > 4.9 and Winds > 9.9 and Winds ≤ 19.8 and Wind_Dir ≤ 0 and Winds ≤ 14.8 and Pressure_Rel ≤ 1012.2 and Out_Hum ≤ 88 and month in [ "Jan" ] and Out_Hum > 65 and Windc ≤ 18.9 and Out_Temp > 17.3 then very_high |
| 156 | 107 | 0.907 | if Winds > 4.9 and Winds > 9.9 and Winds ≤ 19.8 and Wind_Dir ≤ 0 and Winds ≤ 14.8 and Pressure_Rel ≤ 1012.2 and Out_Hum ≤ 88 and month in [ "Jan" ] and Out_Hum ≤ 65 then very_high |
Figure 3.
CRT tree rules for gust predictions show the rule sets relating to two major wind speeds.
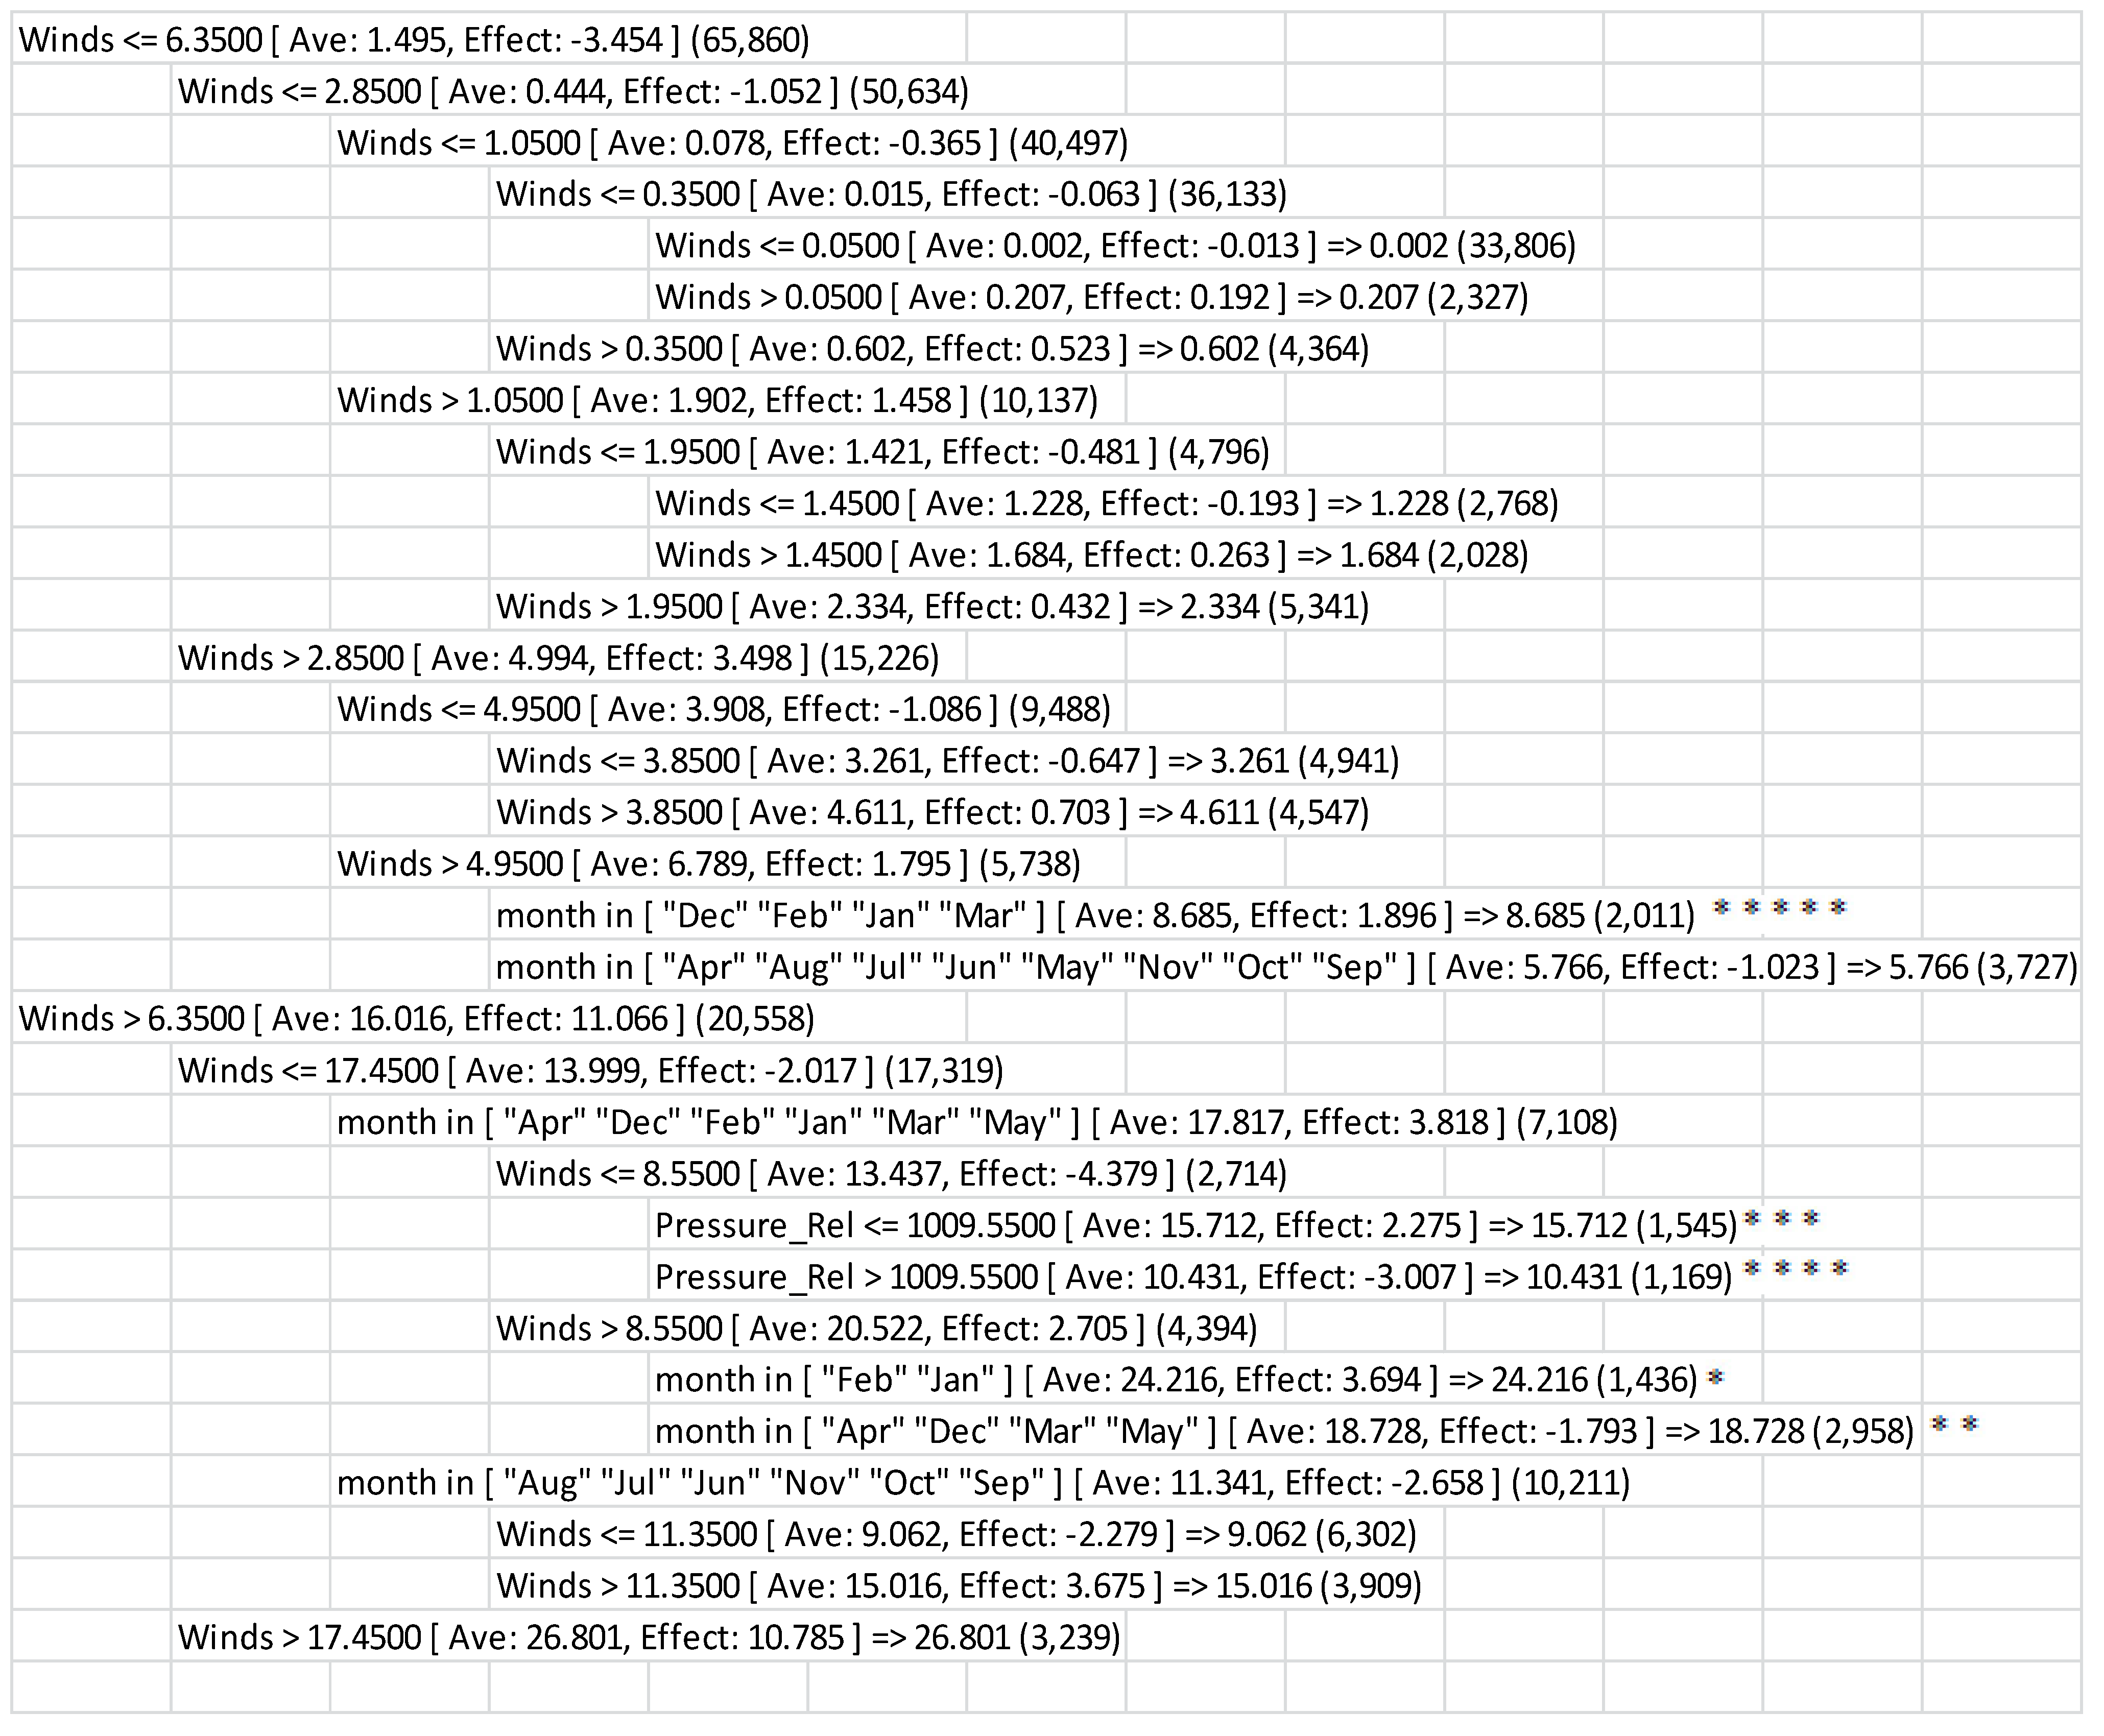
5.2. CRT Algorithm Prediction Rules
Based on CRT rules (Figure 3), wind speeds > 8.5 km/h in February and January have led to gusts 24.216 km/h (1,436 instances *) and in April, December, March and May have led to gusts 18.728 km/h (2,958 instances **). In April, December, February, January, March and May months, low wind speed (≤8.550 km/h) and low pressure (≤ 1,009.55 hPA) has led to gust measuring 15.712 km/h (1,545, instances ***) whereas with the same wind speed but with pressure measuring > 1,009.55 hPA has led to gust 10.43 km/h (1,169 instances ****). This shows that in throughout summer even < 8.5 km/h wind speed and low pressure can lead to high gusts.
Interestingly, in February and January months, wind speed 8.55km/h has led to very high gusts (24.21 km/h) with 1,436 instances whereas in April, December, March and May has led to not so high gust (18.72 km/h) with 2,958 instances (Figure 3 * and **).
There is another monthly variability in gust for the same wind speed range 2.85–6.35 km/h, in December, February, March and May this range has led to gust 8.685 km/h with 2,011 instances ***** whereas in the rest of the year it has led to lesser gust 5.766 km/h with 3,727 instances (Figure 3).
5.3. CHAID Algorithm Results
CHAID algorithm can be used for analyzing with both real values as well as class as output for modelling and prediction purposes. The CHAID results (Figure 4, Figure 5 and Figure 6) obtained for this research for analyzing patterns in meteorological data for predicting real gusts and relating to gust classes are discussed in this section.
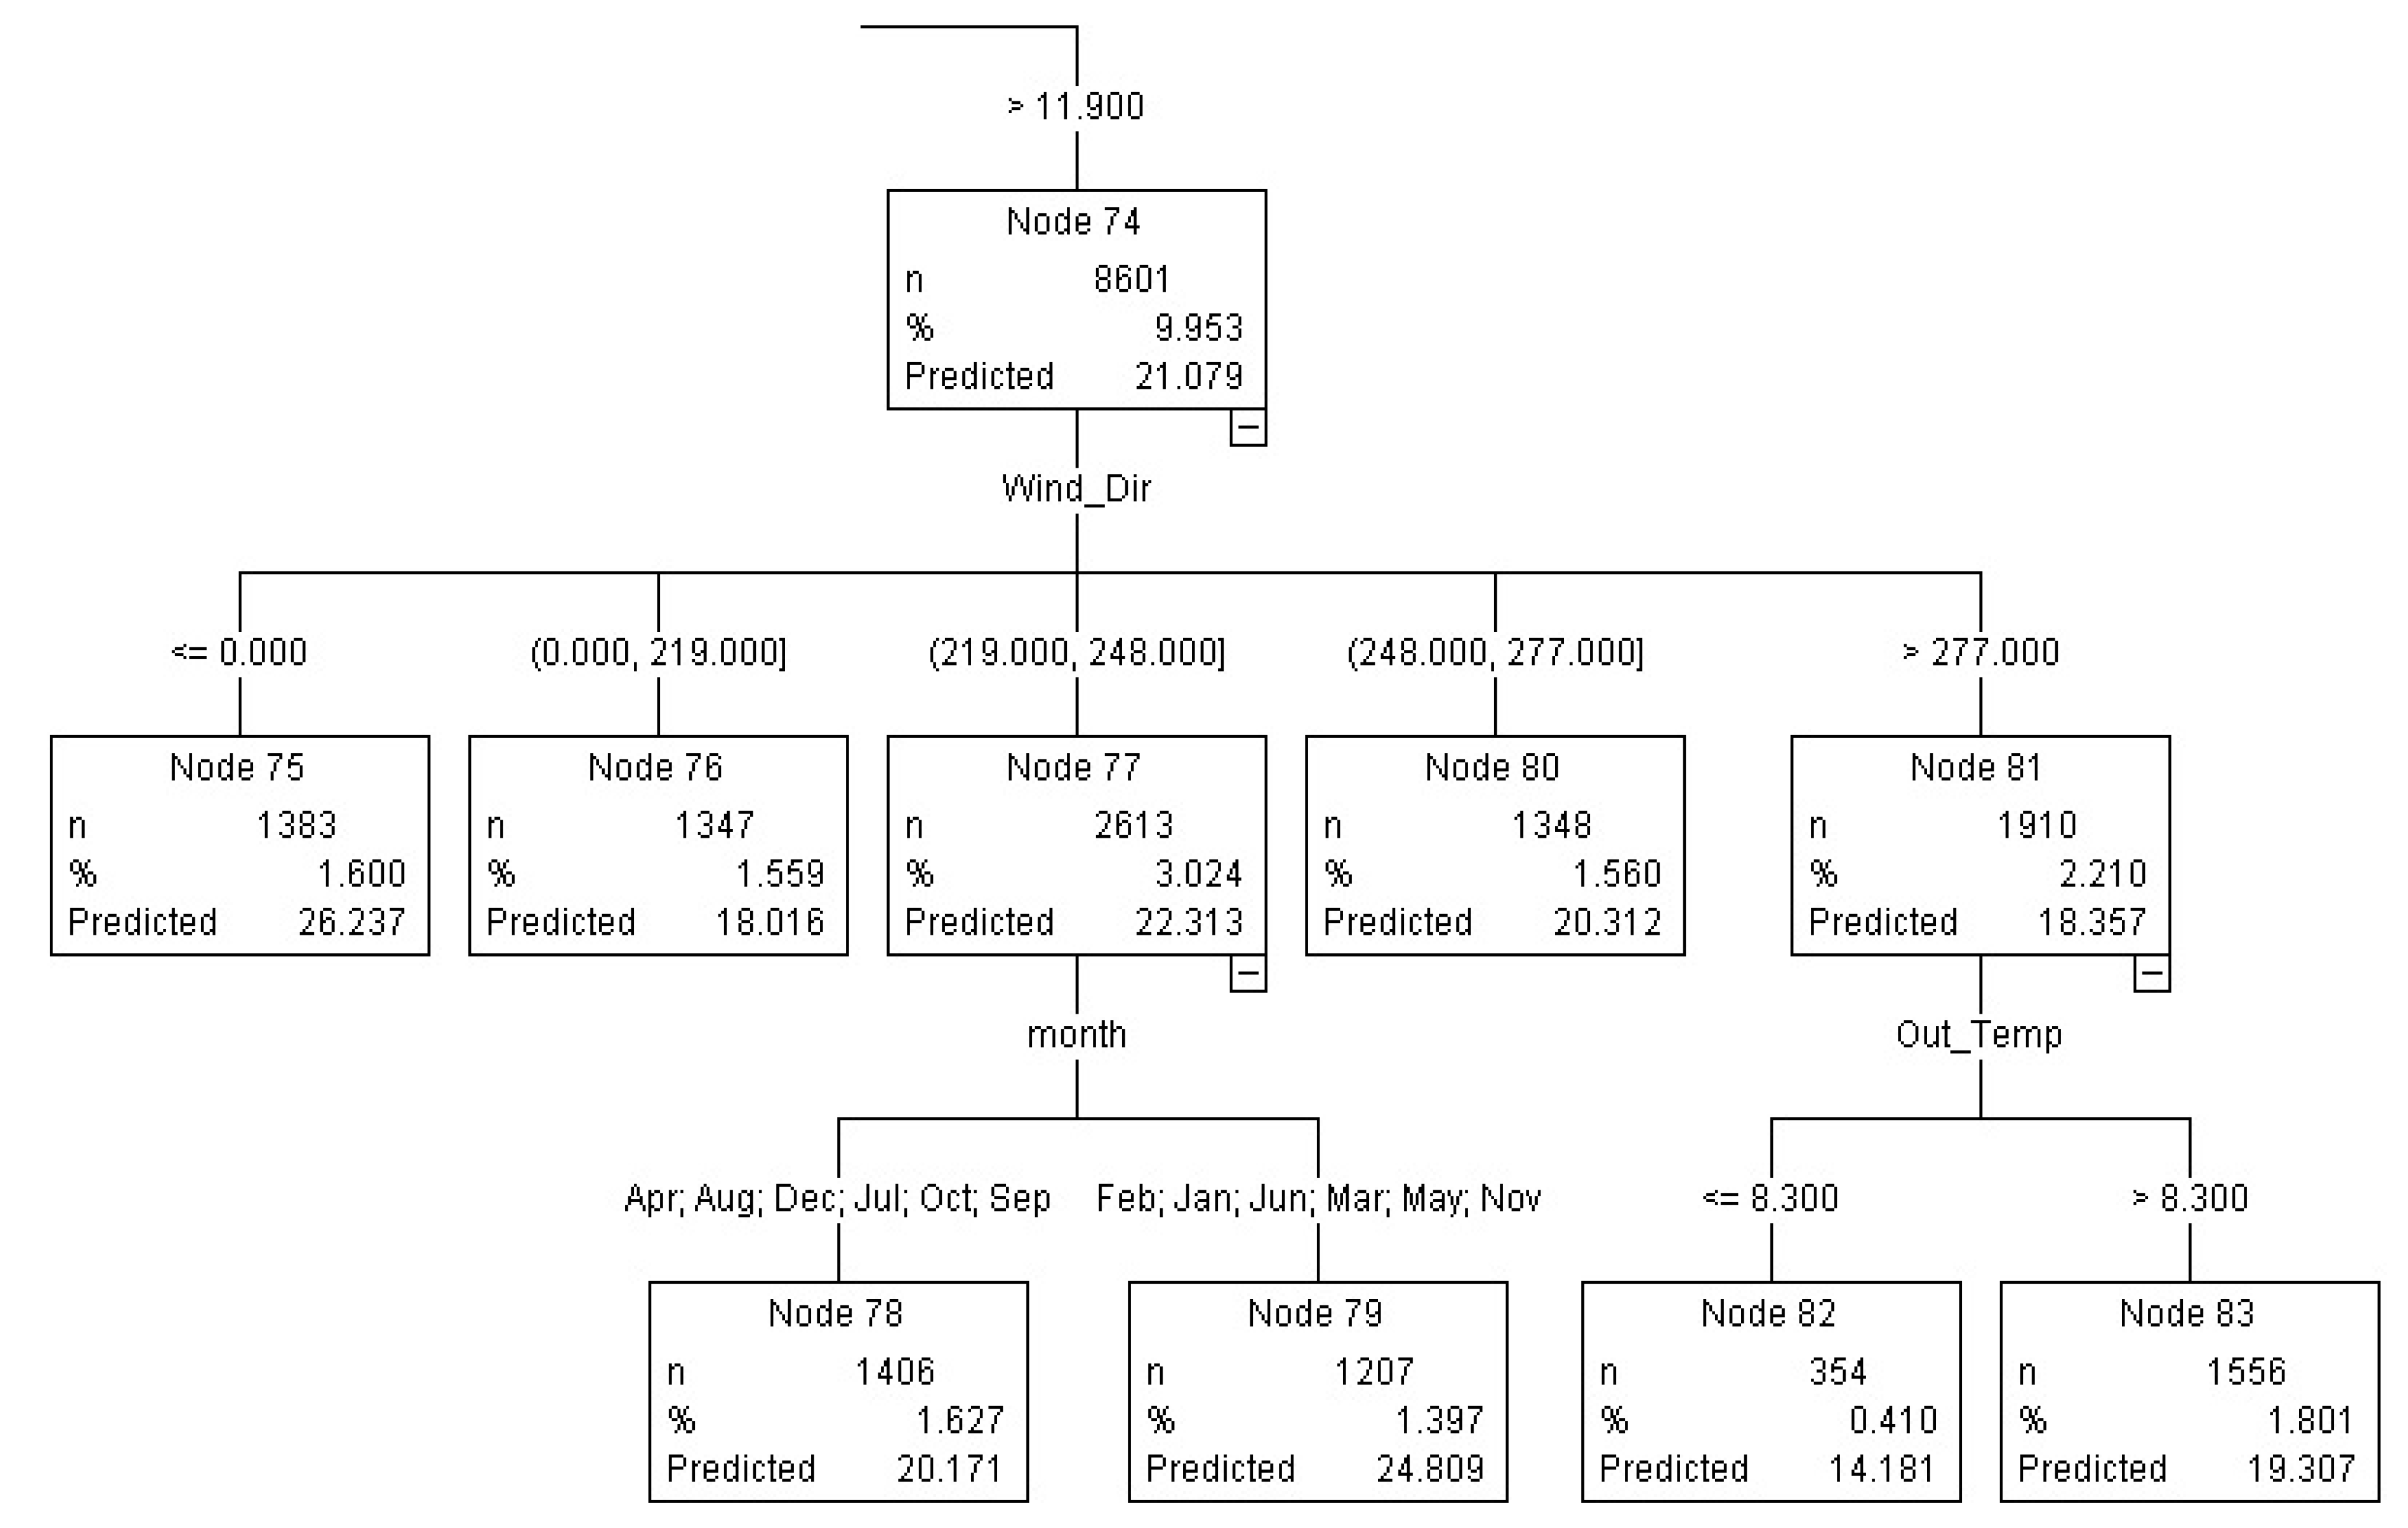
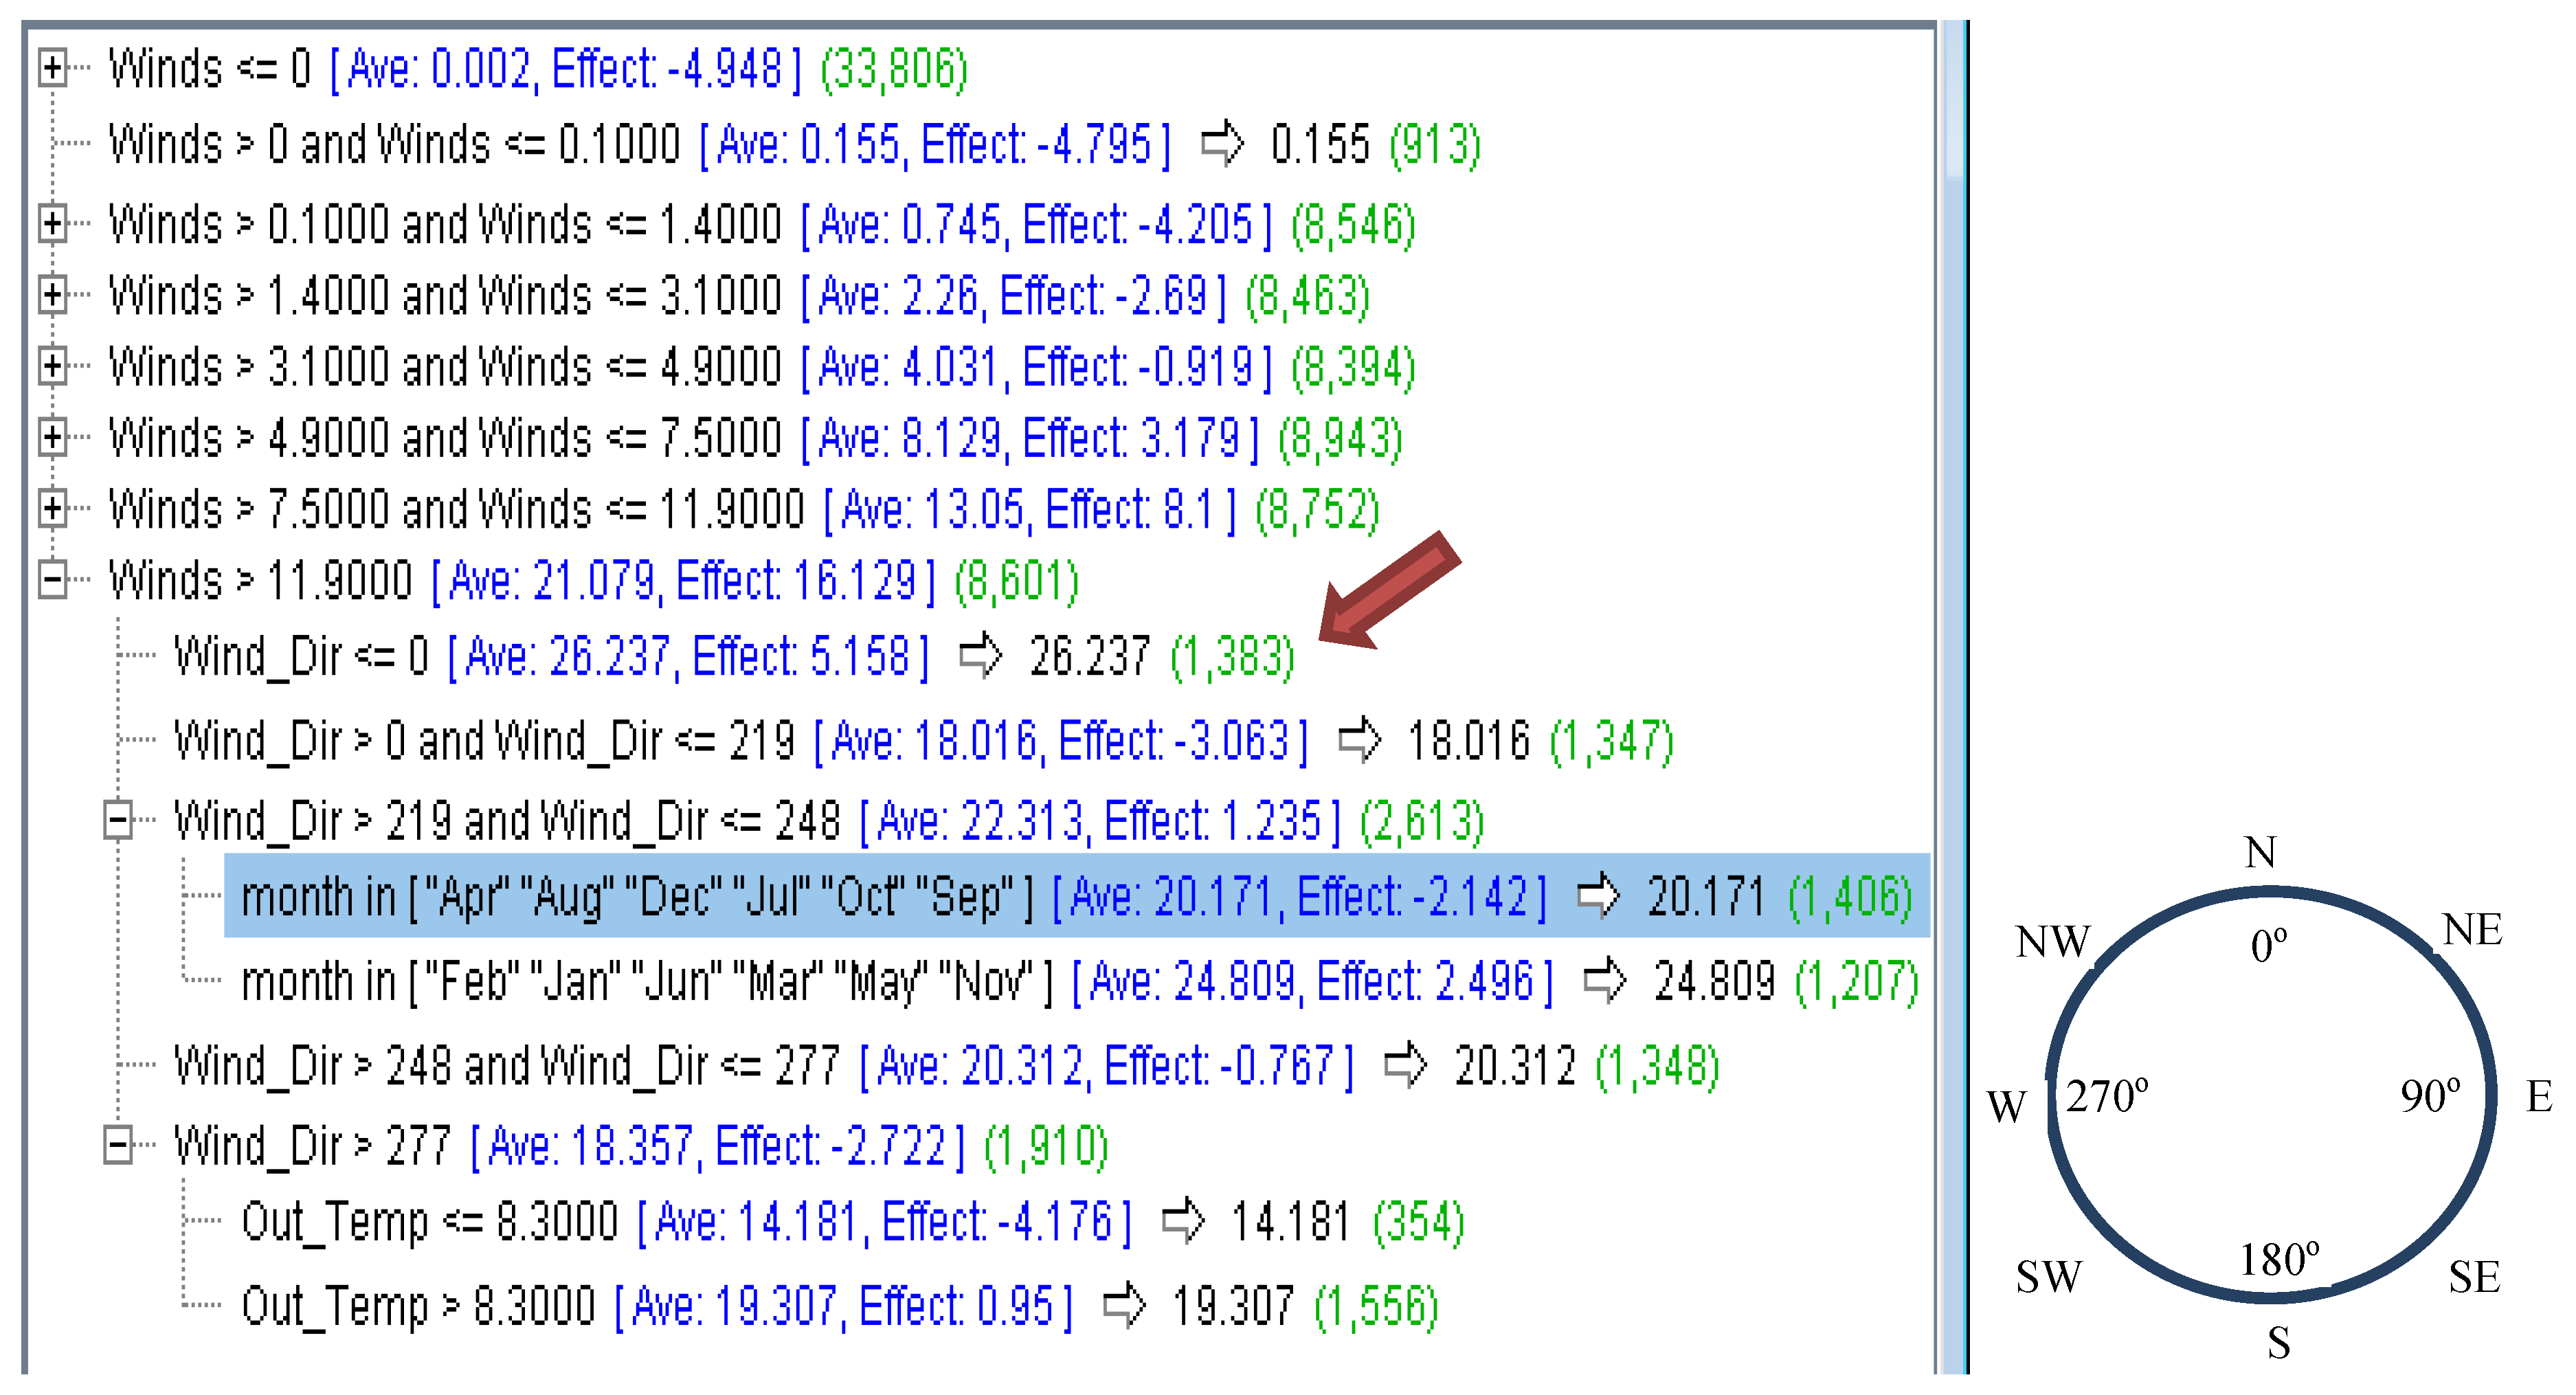
Figure 4.
CHAID nodes for predicting real values for high gusts > 11.9 km/h.

Figure 5.
Corresponding CHAID rules for nodes 74-83 of Figure 4 relating to high gusts > 11.9 km/h.
Figure 5.
Corresponding CHAID rules for nodes 74-83 of Figure 4 relating to high gusts > 11.9 km/h.

Figure 6.
CHAID tree node (>11.9 wind speed nodes 64–73) and rules relating to gust classes (no, low, med, high and very high).
Figure 6.
CHAID tree node (>11.9 wind speed nodes 64–73) and rules relating to gust classes (no, low, med, high and very high).
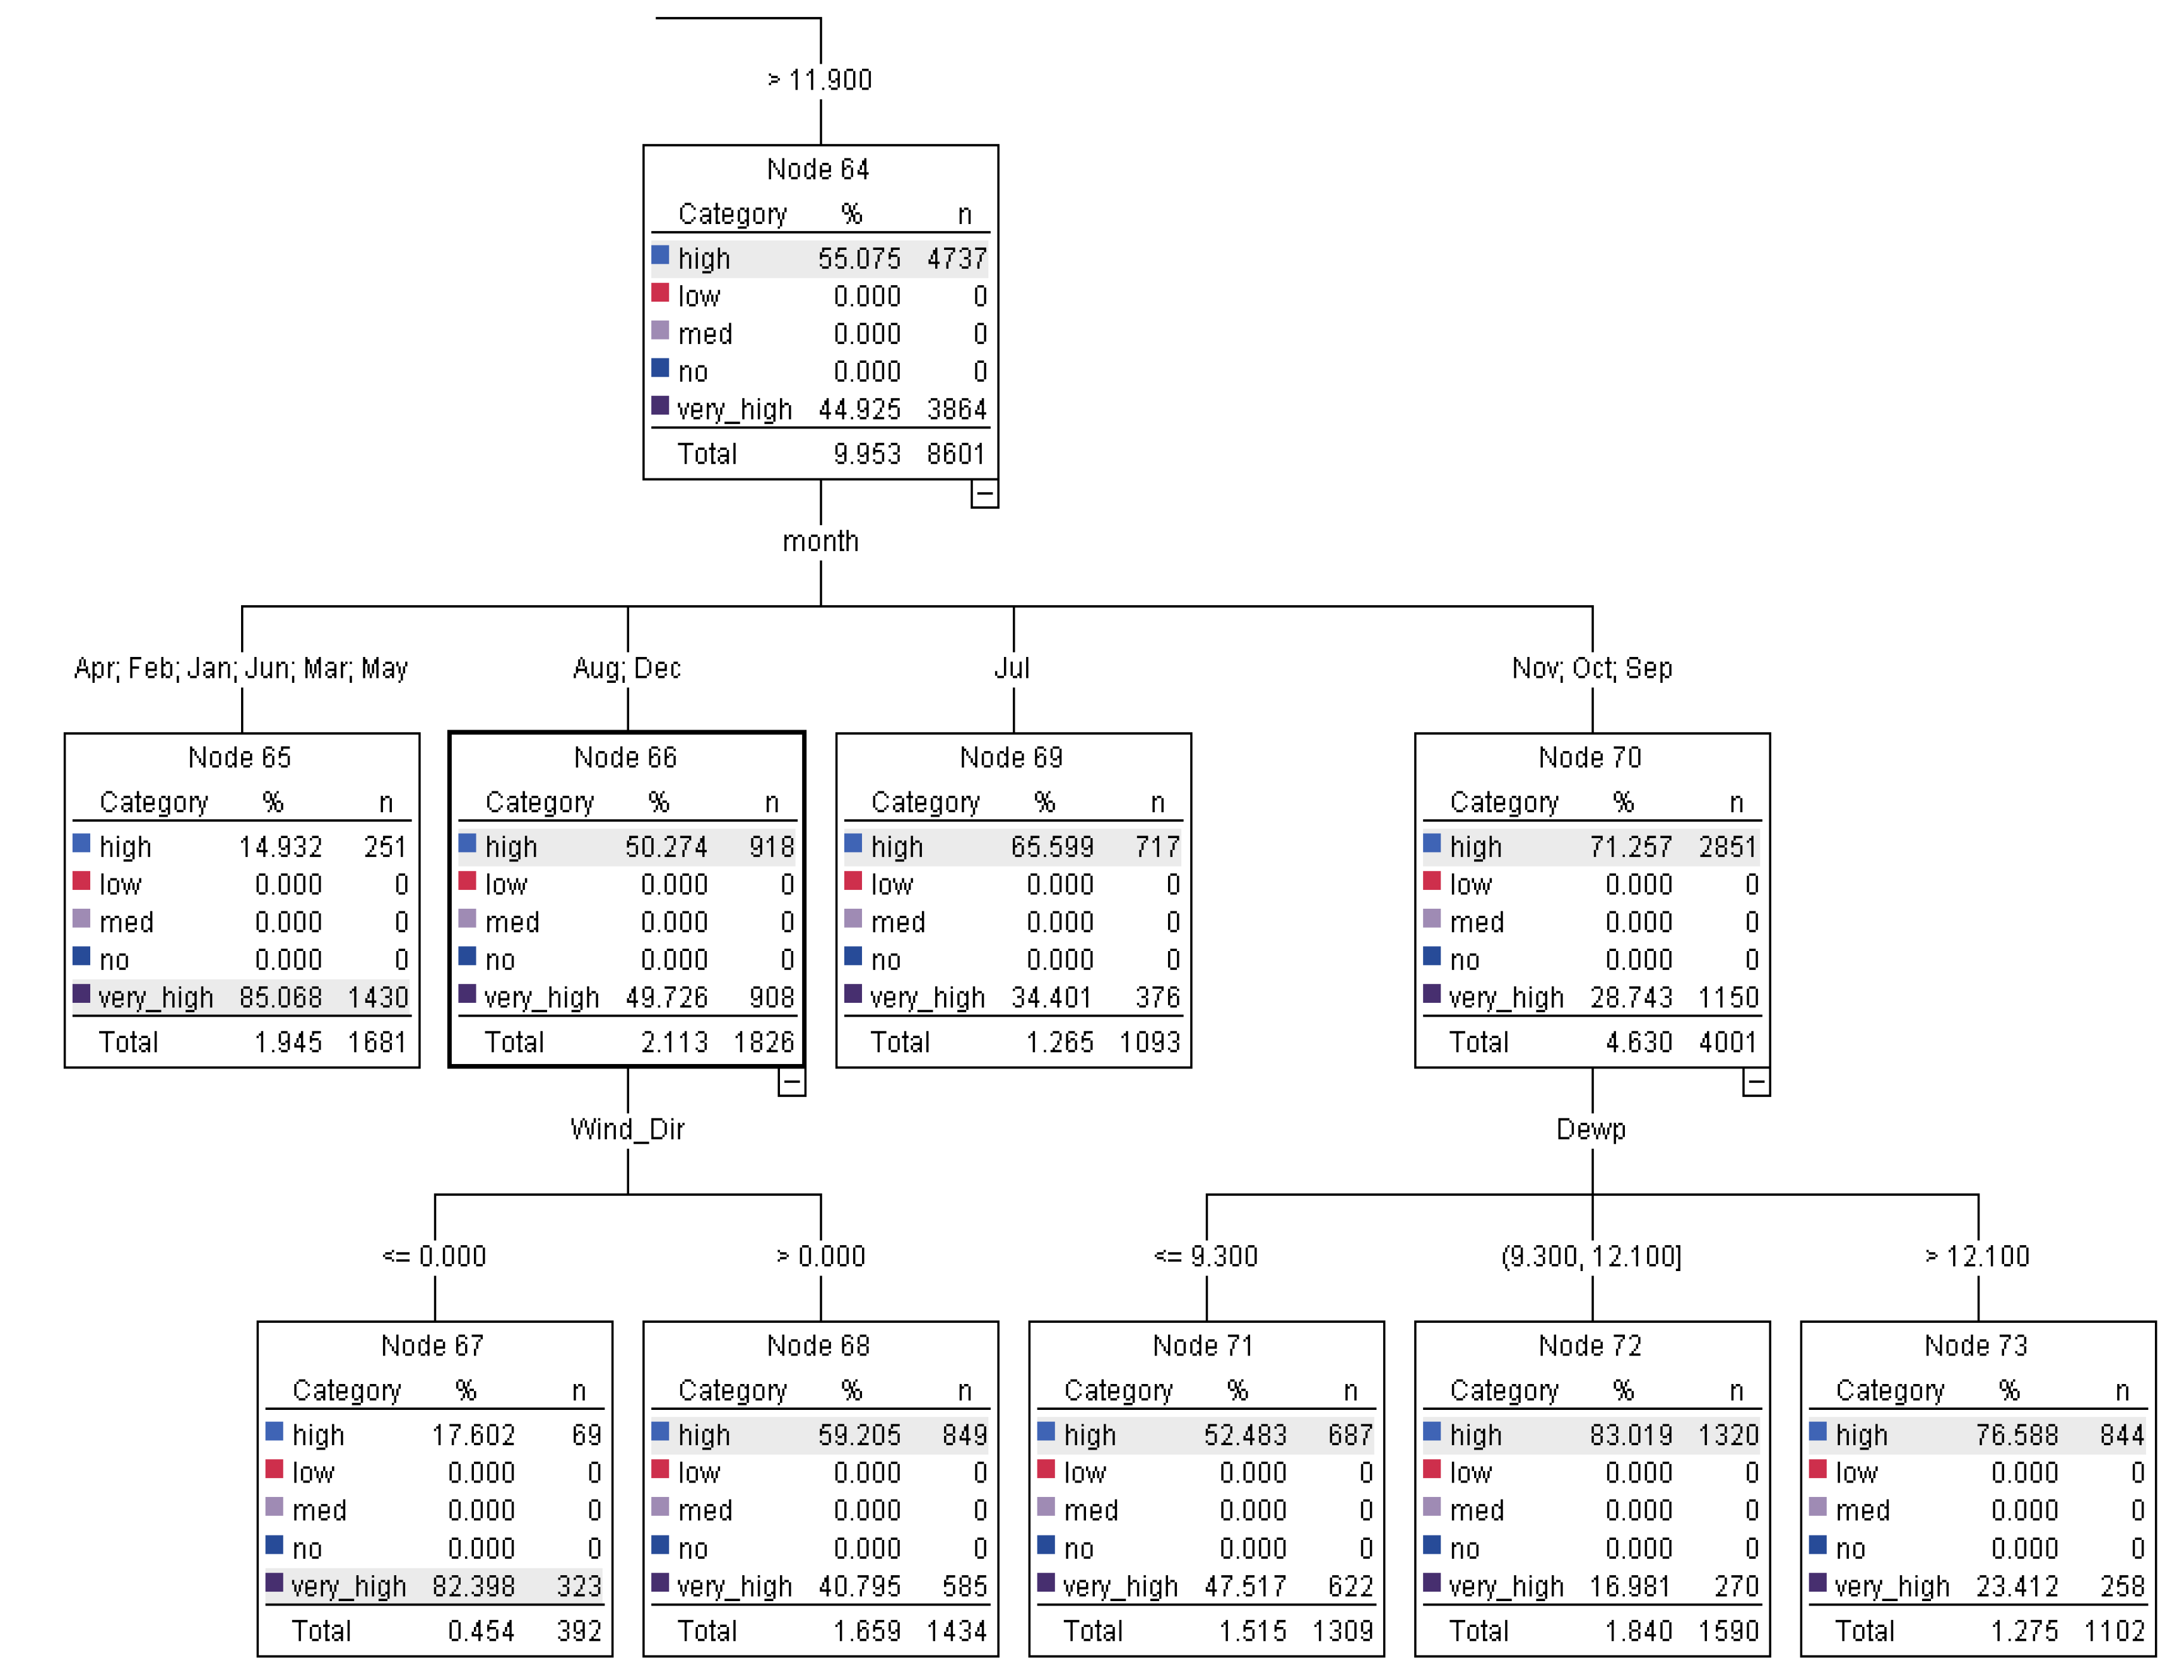
Rule 1 for high (1,434; 0.592) if Winds speed > 11.9 km/h and month in (“August” “December”) and Wind_Dir > 0o then high;
Rule 5 for very_high (392; 0.824) if Winds speed > 11.9 km/h and month in (“August” “December”) and Wind_Dir ≤ 0o then very_high;
CHAID algorithm produces a multi tree and in this case at the first level wind speed has been divided into eight nodes, i.e., wind speed ranges ≤0, (0–0.1), (0.1–1.4), (1.4–3.1), (3.1–4.9), (4.9–7.5), (7.5–11.9) and >11.9, unit: km/h, respectively as in Figure 5. At the next level, wind speed >11.9 km/h in node 74 (Figure 4) has been divided further into five nodes based purely on wind direction (nodes 75, 76, 77, 80 and 71). Based on node 75 (also in red arrow in Figure 5 tree rules), high wind speed from the north has led to the highest gust range 26.237 km/h with 1,383 instances and effect 5.158. Based on CHAID real gust value rules (Figure 5), in April, August, December, July, October and September mostly in winter, wind from south and southwest (>219 km/h and ≤248 km/h) has led to low gusts 20.171 km/h when compared with the same wind speed and directions during summery February, January, March, May and November months of 24.809 both with over 2,000 instances.
Based on CHAID tree (nodes 66–68) and rules for gust classes (Figure 6) in August and December months wind from the north at speeds >11.9 km/h have led to very high (>20 km/h) but from other directions to just high (<20 km/h).
In “August” “December” wind at speeds > 11.9 km/h from north lead to very high but from other direction lead to just high (Figure 6).
5.4. Kohonen SOM Clustering
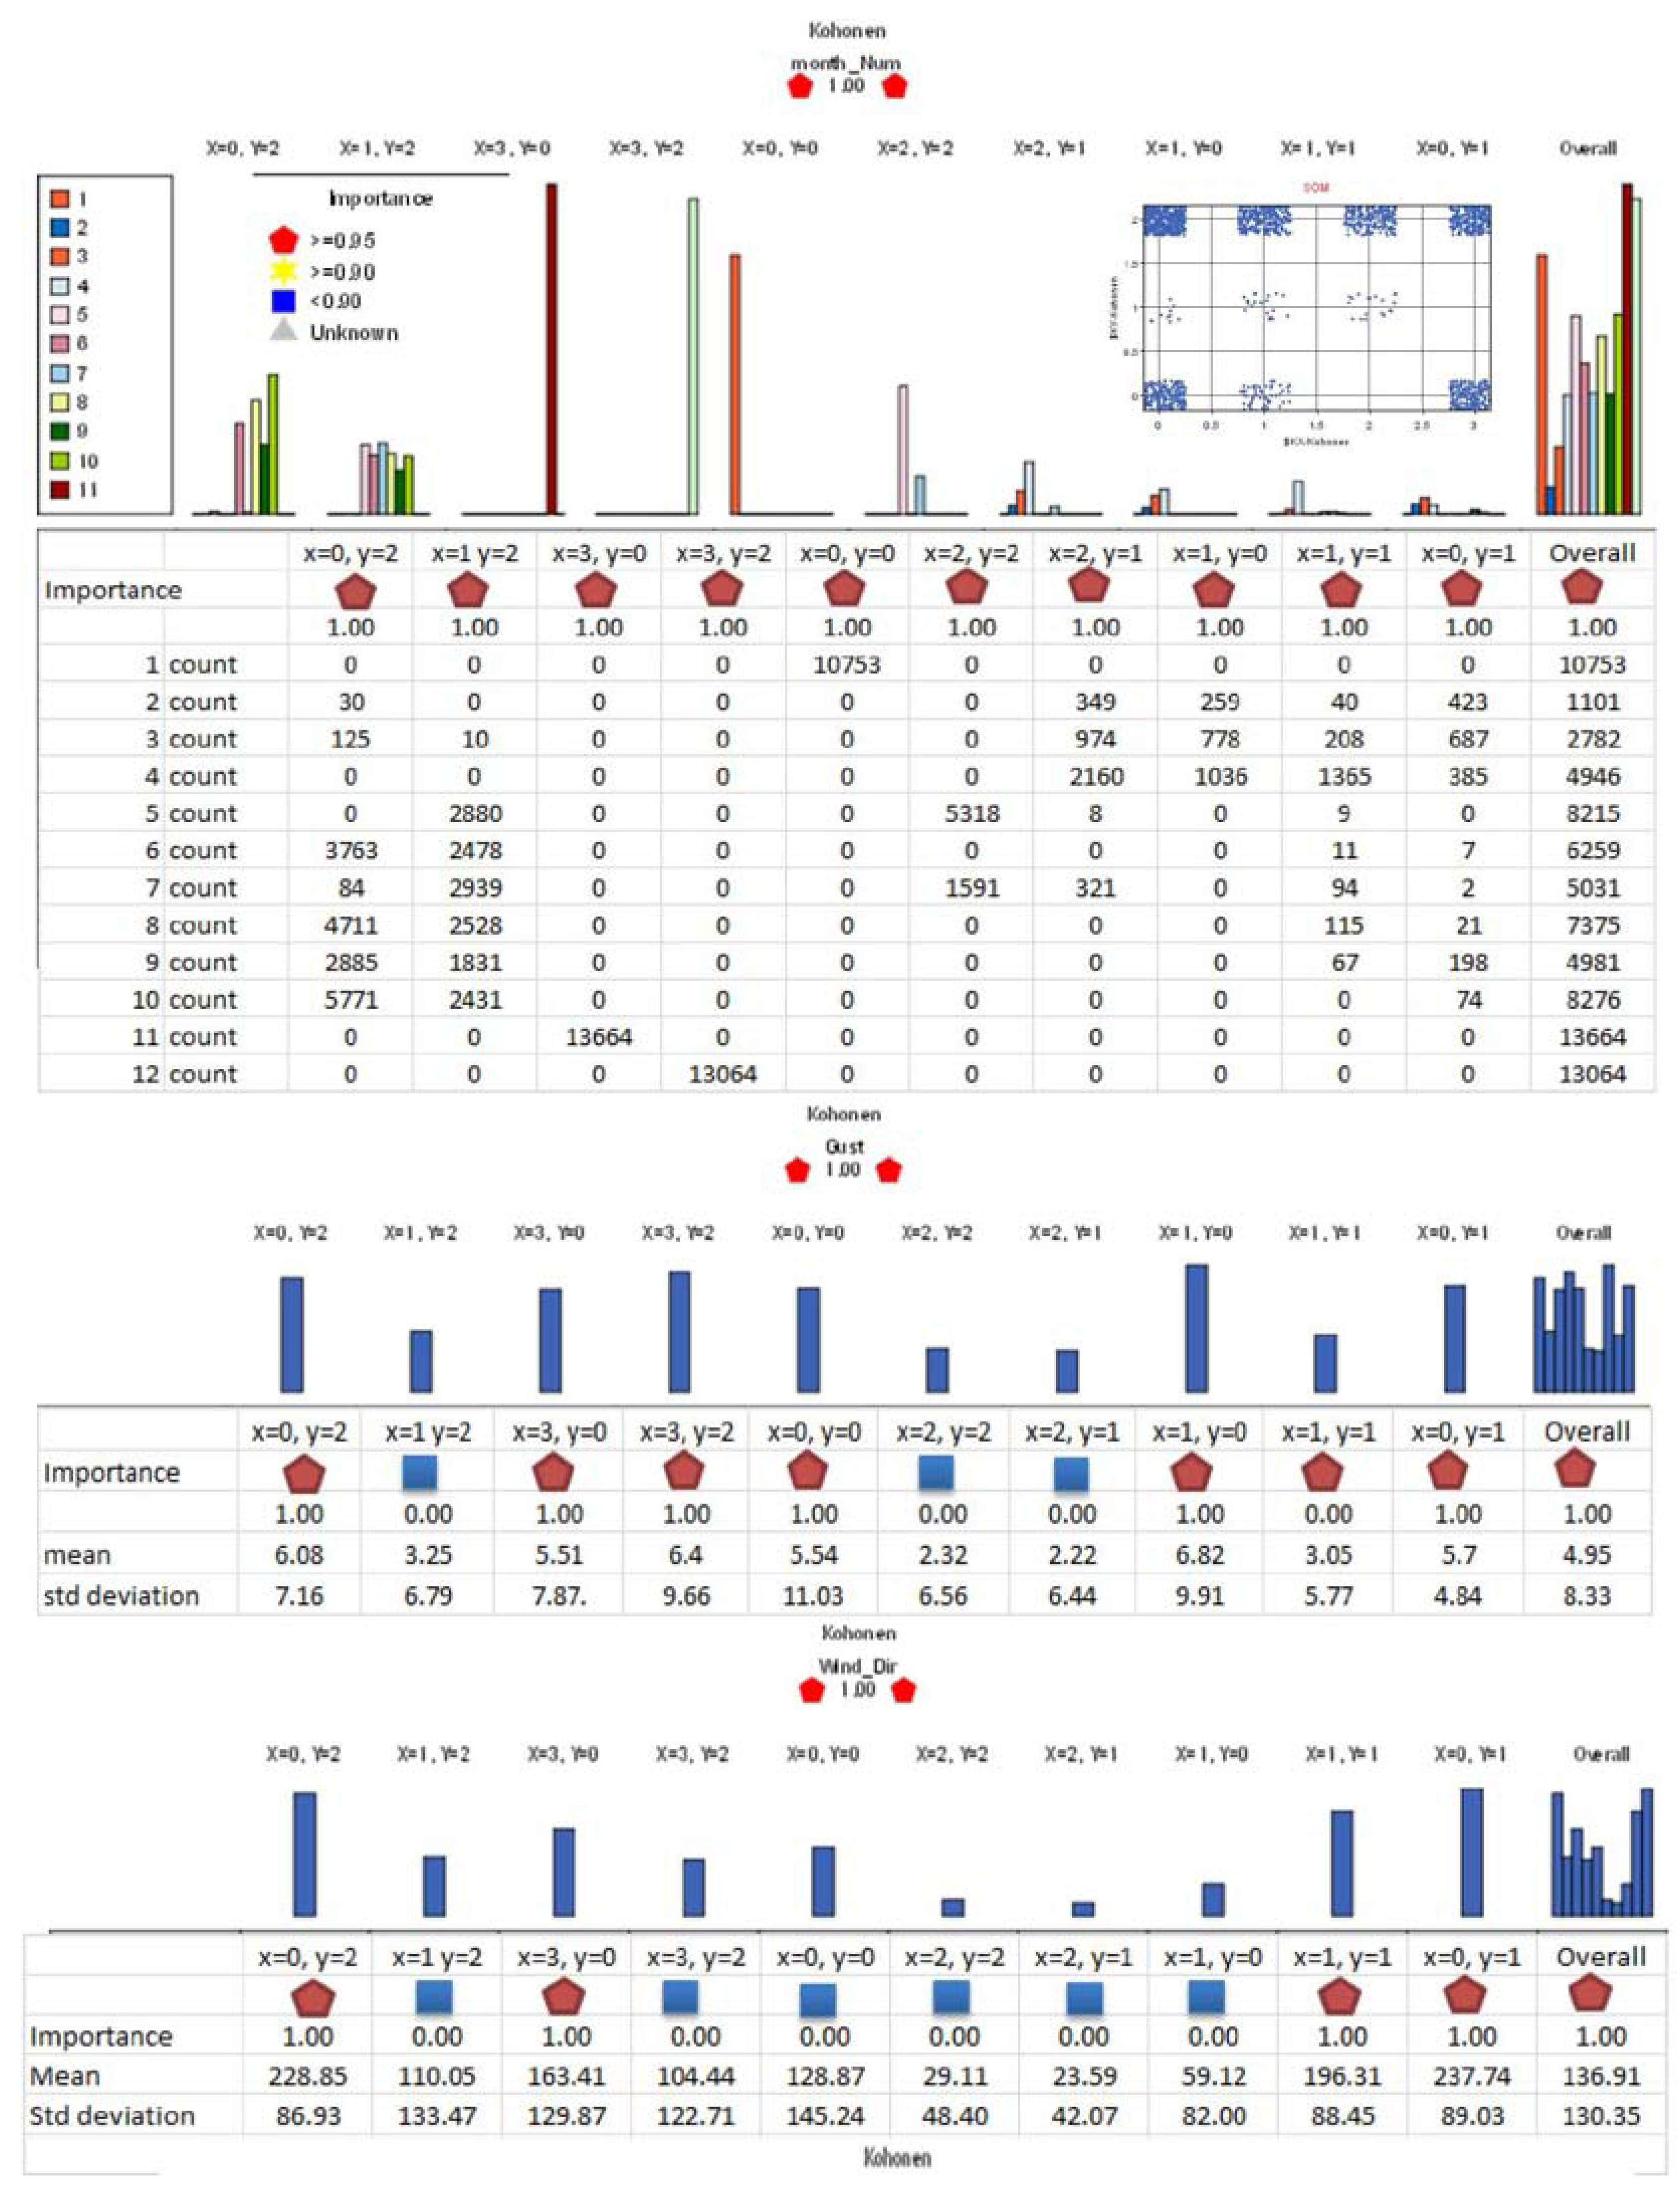
SOM cluster profiles (Figure 7 and Figure 8) show the individual SOM clustering of variables analyzed. Three SOM nodes, (x = 3 y = 0), (x = 3 y = 2) and (x = 0 y = 0) consist of all instances for individual months, i.e., November, December and January data respectively. SOM node (x = 1 y = 0) consists of the highest gust mean and the cluster vectors are from February-April months with all variables but wind direction as important.
Figure 7.
Plot of X-Kohonen and Y-Kohonen with agitation showing the SOM clusters (insert in top right).
Figure 7.
Plot of X-Kohonen and Y-Kohonen with agitation showing the SOM clusters (insert in top right).

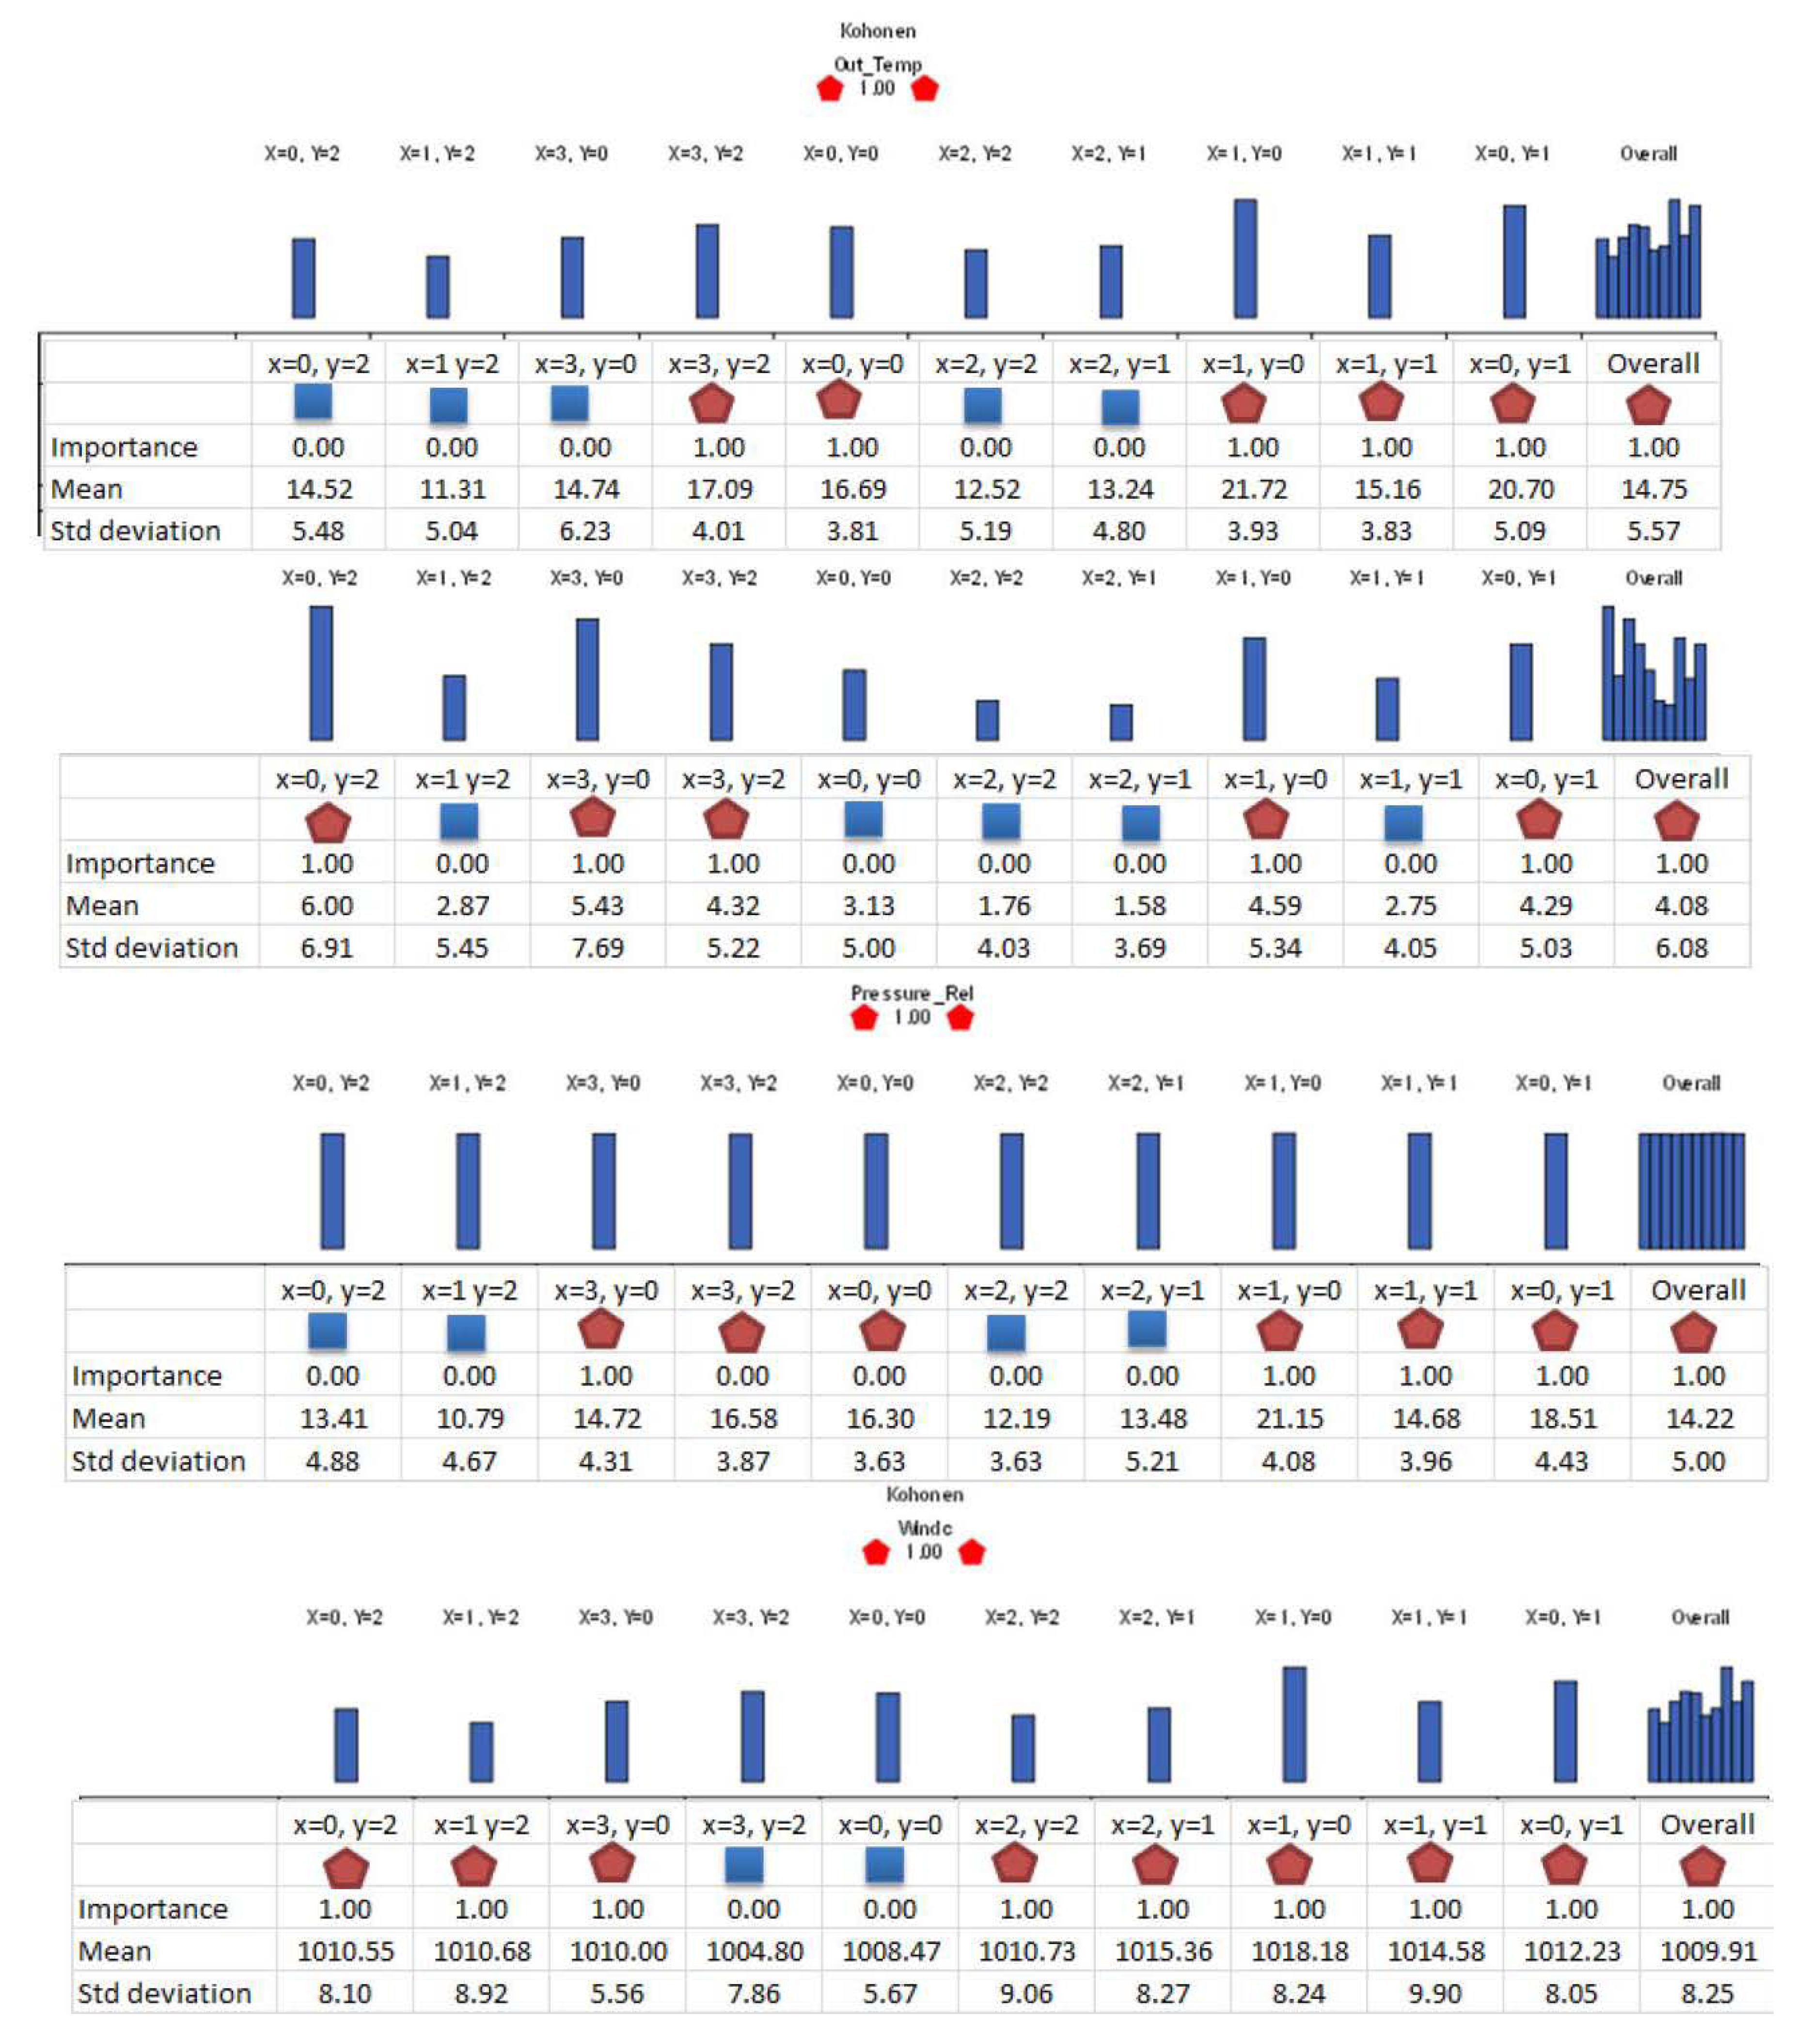
Figure 8.
Self-organising map (SOM) cluster profiles showing the input variables at different levels of “importance” in the clustering of the respective individual variable even though all the variables are shown as important in the overall SOM clustering (right side of the graphs).
Figure 8.
Self-organising map (SOM) cluster profiles showing the input variables at different levels of “importance” in the clustering of the respective individual variable even though all the variables are shown as important in the overall SOM clustering (right side of the graphs).

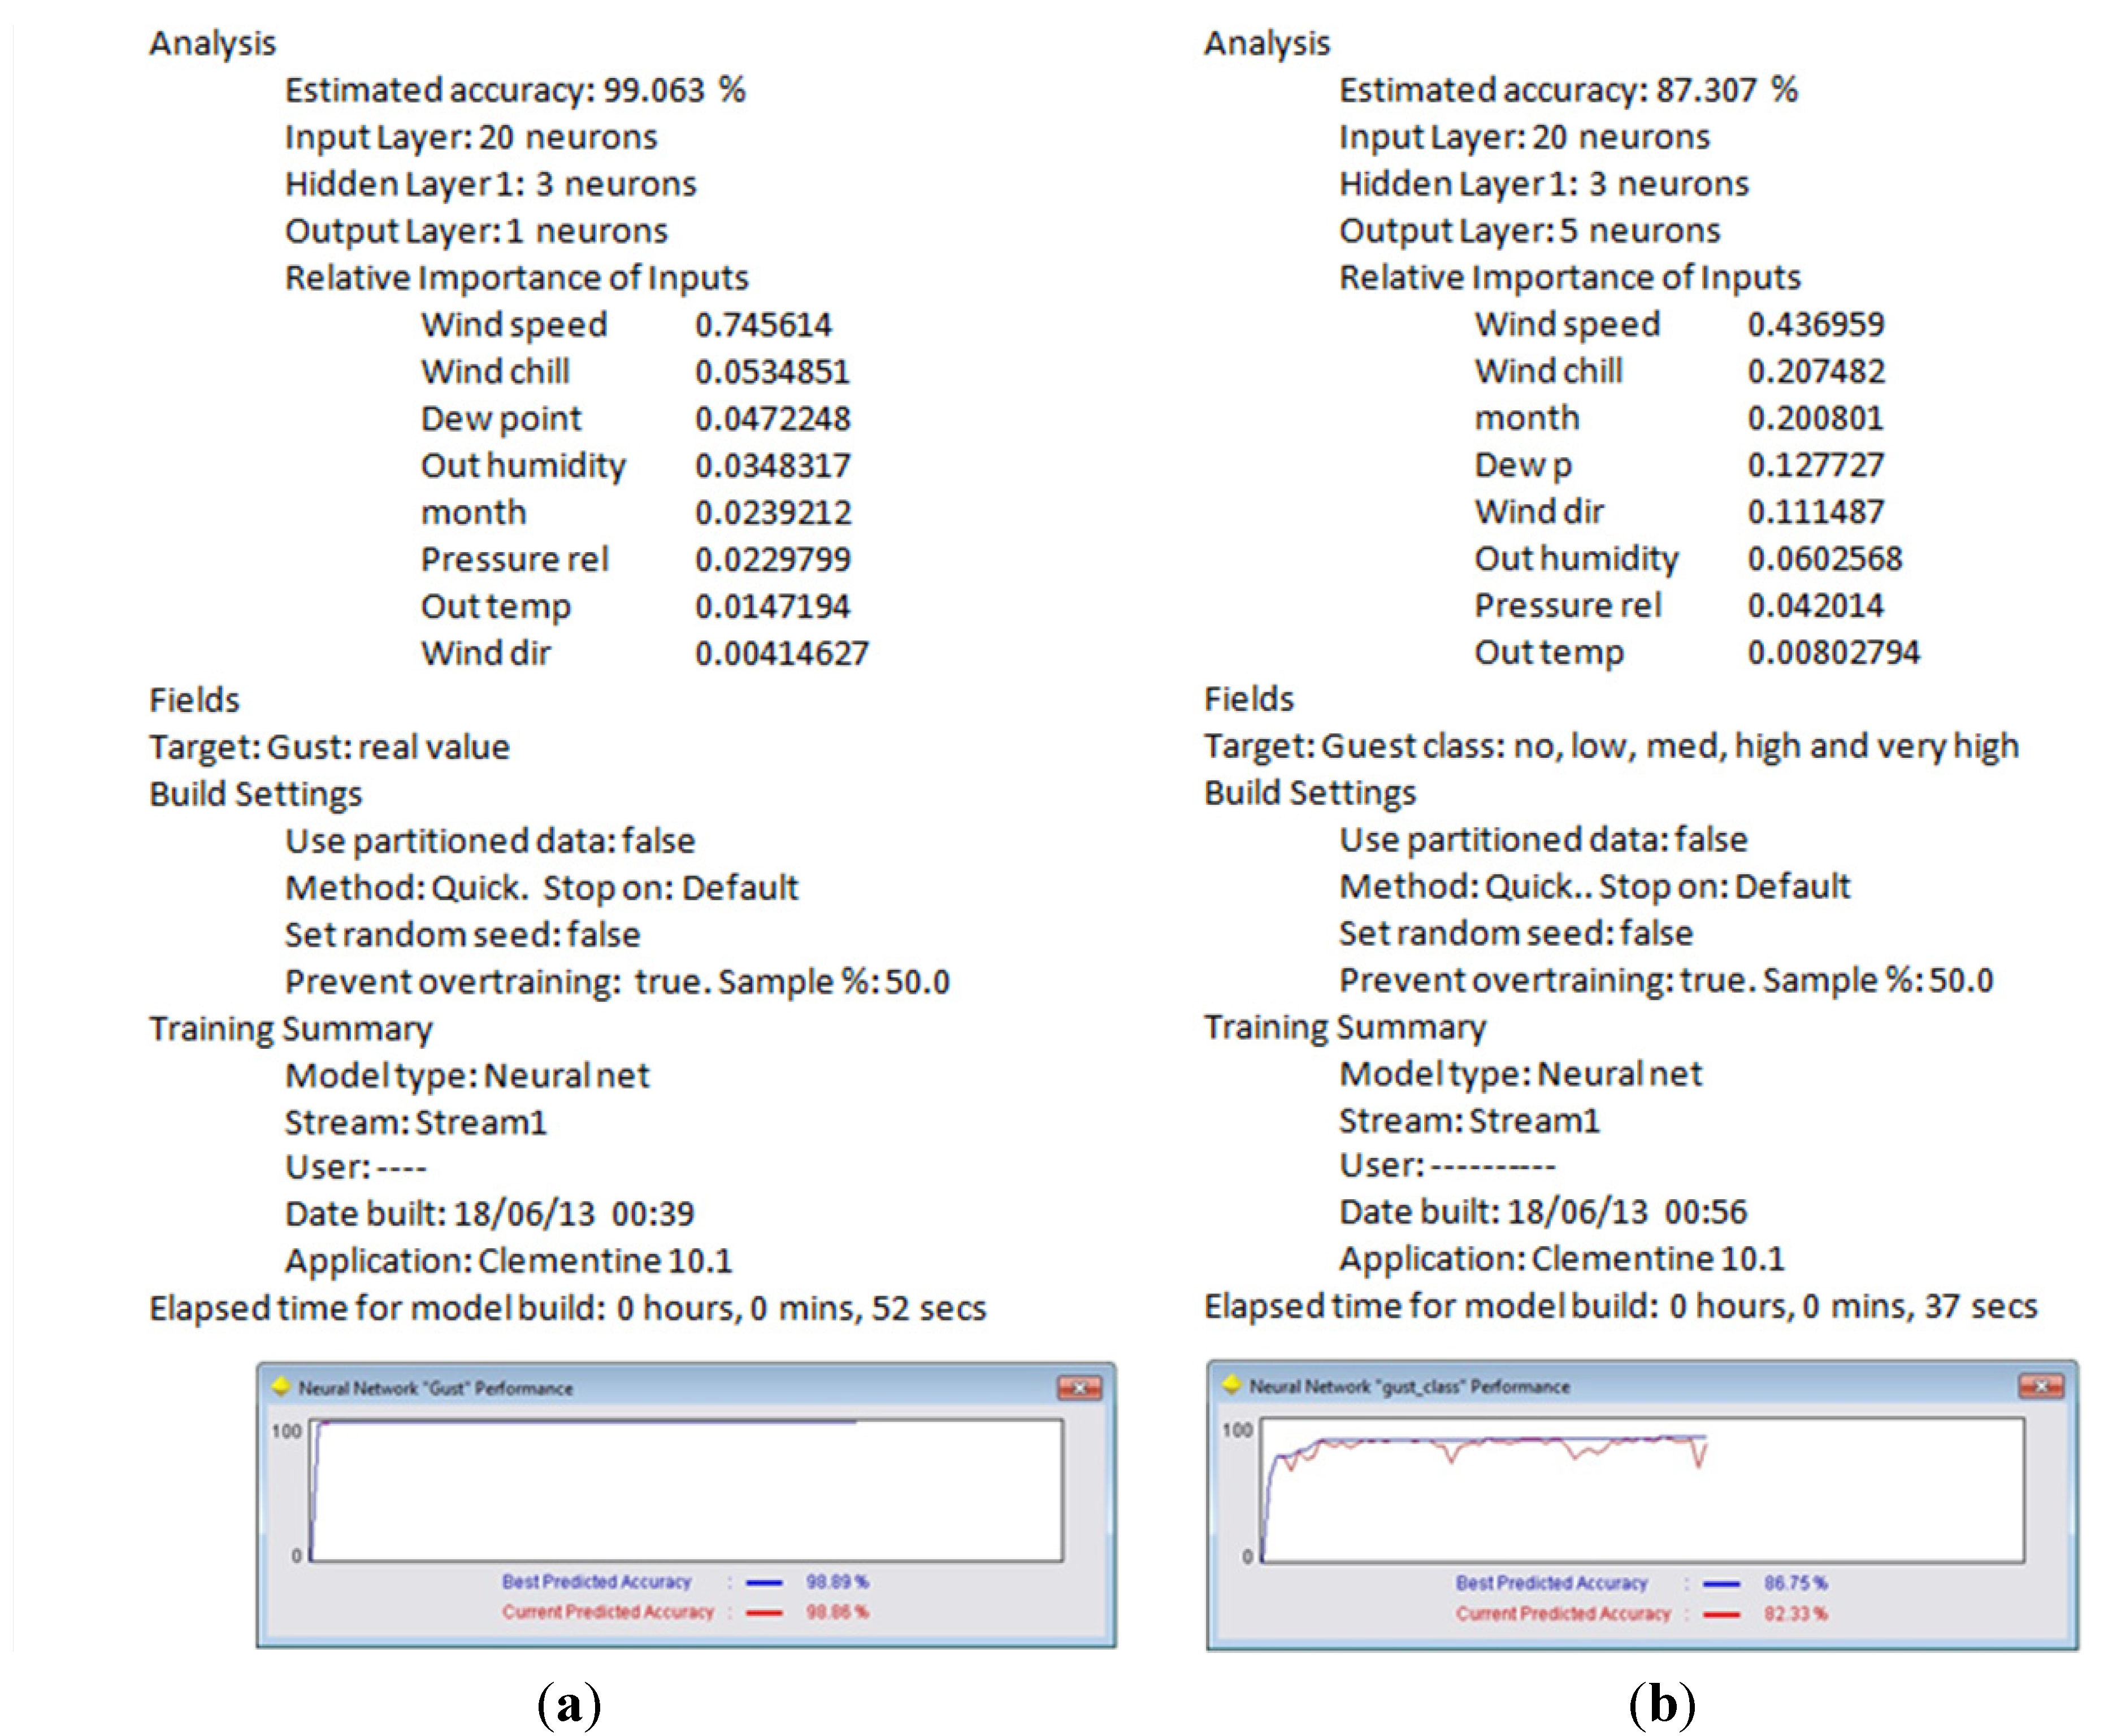
Figure 9.
(a) Artificial Neural Network (ANN) predictions for real gust (over 99% accuracy) and (b) for gust classes (over 85% accuracy). Based on the results, more accurate real gust predictions depend on wind speed 74% and for gust class predictions, it is around 44%.
Figure 9.
(a) Artificial Neural Network (ANN) predictions for real gust (over 99% accuracy) and (b) for gust classes (over 85% accuracy). Based on the results, more accurate real gust predictions depend on wind speed 74% and for gust class predictions, it is around 44%.
5.5. Artificial Neural Network (ANN) Predictions for Gust
ANNs with the following two configurations (Figure 9a,b) were tested for predicting “real gust values” and “gust classes” and the results show wind speed as the major predictor followed by wind chill and then by other variables.
The ANN node uses a simplified model of the way the human brain cells process information. The ANN node works by simulating a large number of interconnected simple processing units that resemble abstract versions of neurons. The ANNs are powerful general function estimators and they require minimal statistical or mathematical knowledge to train or apply [27]. The “Quick” method used with the Kumeu weather data is based on a feed-forward back-propagation network with the topology (number and configuration of nodes in the input, hidden and output layers) along with the input and output fields.
5.6. Regression and PCA Results
Regression test results (Table 6a) show wind speed with the highest standardized coefficient (0.843) out of all factors. Pressure relative, humidity, and wind chill were found to have negative impact in the model. From the PCA results of this data (Table 6b), the total variance table (middle) 40% is extracted from pressure relative and 20% from temperature. Very smaller percentages are extracted from wind speed and directions 2.8% and less than 1% respectively.
Table 6.
(a) Regression of the weather data studied using all seven input variables against real gust as output. Regression test results show all input variables except for dew point (p − value = 0.157) as predictors (at p − value < 0.05) and with 0.733 adjusted R square. (b) PCA results of the weather data studied using all seven input variables against real gust as output. Regression test results show all input variables except for dew point(p − value = 0.157) as predictors (at p − value < 0.05) and with 0.733 adjusted R square.
| Model | Unstandardized Coefficients | Standardized Coefficients | t | Sig. | ||
|---|---|---|---|---|---|---|
| B | Std. Error | Beta | ||||
| 1 | (Constant) | 50.825 | 2.020 | 25.163 | .000 | |
| Dew point | 1.58E−002 | 0.011 | 0.007 | 1.414 | .157 | |
| Out Humidity | −2.43E−002 | 0.003 | −0.039 | −9.237 | .000 | |
| Out Temp | 5.61E−002 | 0.005 | 0.038 | 10.958 | .000 | |
| Pressure Relative | −4.82E−002 | 0.002 | −0.048 | −24.796 | .000 | |
| Wind direction | −4.50E−003 | 0.000 | −0.070 | −38.674 | .000 | |
| Wind chill | −2.66E−002 | 0.009 | −0.016 | −2.827 | .005 | |
| Wind speed | 1.155 | 0.003 | 0.843 | 345.636 | .000 | |
a. Dependent Variable: Gust (a)
| Component | Initial Eigenvalues | Extraction Sums of Squared Loadings | ||||
|---|---|---|---|---|---|---|
| Total | % of Variance | Cumulative % | Total | % of Variance | Cumulative % | |
| 1 Pressure Relative | 2.802 | 40.032 | 40.032 | 2.802 | 40.032 | 40.032 |
| 2 Out Temp | 1.443 | 20.618 | 60.650 | 1.443 | 20.618 | 60.650 |
| 3 Out Humidity | 1.200 | 17.148 | 77.798 | 1.200 | 17.148 | 77.798 |
| 4 Dew point | .805 | 11.501 | 89.299 | 0.805 | 11.501 | 89.299 |
| 5 Wind chill | .508 | 7.258 | 96.557 | 0.508 | 7.258 | 96.557 |
| 6 Wind speed | .196 | 2.805 | 99.362 | |||
| 7 Wind direction | 4.46E−002 | 0.638 | 100.000 | |||
Extraction Method: Principal Component Analysis.(b)
5.7. Discussion
Interestingly, the PCA test results showed pressure, temperature, humidity, wind chill and lastly wind speed to be the main predictors/contributors. This is different to what has been established through other data mining algorithms. Data mining algorithms are data dependent and the different algorithm use different ways to optimize the splitting/grouping the data. As seen in the SOM the individual component and overall SOM clustering, based on the data mining algorithm, primary predictor and rules established could vary. The C5.0, CRT, Quest and CHAID results, ANN predictions and the regression test results indicated wind speed as the primary predictor. However, the SOM clustering visualizations and the induction rules of data mining methods investigated give some rationale and new information relating to these conflicting results.
In the SOM clustering, the contribution made by different input variables to the SOM clustering of the data is indicated with a factor called “importance”. In the SOM cluster profiles, the “importance” of each input in the respective individual cluster as well as that of overall SOM is shown and it enhances the analysts’ ability to visually analyze the clustering especially the role of each input variable in that particular input and overall SOM clustering. This is similar to a “coefficient”/“correlation” and thus can be used for measuring and explaining the wind gust dependencies seen in different data mining algorithms and the regression test. As stated by visualizing the data distribution in terms of month and other SOM components (the histograms/mean and std dev. or standard deviation in profiles) one can explain as to why different data mining algorithms show different coefficients for different variables. For example, SOM cluster node (x = 0 y = 1) consisting of high gusts observed throughout the year and with gust mean 5.7 km/h and std dev. 8.49 has all variables as important, whereas for the node (x = 0 y = 0) with gust mean 5.54 km/h and std dev. 11.03 km/h January alone data, temperature and wind chill (derived from temperature) are the important contributors. Node (x = 3 y = 2) December alone cluster, as well has the same but in addition wind speed included. Node (x = 1 y = 0) consisting of February, March and April high gusts with gust mean 6.82 km/h and std dev. 9.91 km/h has all variables as important except for wind direction. Finally, pressure is found to be important for all clusters except for January and December only clusters.
The results of this work show that using data mining algorithms, it is possible to establish some specific patterns relating to the location, for example, in this Kumeu location, in different seasons wind with the same speed (11.9 km/h) but coming from the same direction has caused some major differences in the gust events experienced. This has been reflected in CHAID nodes 77–79 and corresponding rules (Figure 4 and Figure 5), where in the wintry months of April, August, December, July, October and September (except for December so mostly in winter), wind from south and southwest (> 219o and ≤ 248o) has led to gusts 20.171 km/h but during summery February, January, March, May and November months higher gusts of 24.809 km/h both with over 1,000 instances and −2 and +2 Effect respectively.
On some occasions, wind with the same speed and in the same season but from different directions generated vastly different severity in gust strength. For example in the CHAID rules created for gust classes (Figure 6), Rule 1 for high (1,434 instances; 0.592 confidence) and Rule 5 for very high (392 instances; 0.824 confidence) wind at speeds > 11.9 km/h in August and December months from north (≤ 0°) caused very high but with same speeds in the same months from other than the north caused just high (<20 km/h).
6. Conclusions
In finding solutions for the increasing need to model and predict gust events more accurately especially using ad hoc/large volumes of weather and atmosphere data, for a wide range of purposes (as summarized in the introduction), many professionals are investigating new methods and approaches, as one method does not fit all data related issues. Some such major recent approaches investigated for this purpose, especially the data mining techniques used to handle the “short-term” and “shorter interval data” related issues in general and by GRC researchers, were elaborated initially. In view of this recent trend, the paper then looked at the use of C5.0, CRT, Quest and CHAID data mining algorithms along with Kohonen SOM and a multi-layer supervised ANN approach as well as two traditional methods, namely, regression and PCA, for analyzing an example of a weather data set (with 86,418 vectors) acquired over a period of four years between 2008 and 2012 by telemetry devices installed in a vineyard in Kumeu River Wines, Auckland, New Zealand.
In conclusion, it can be stated that data mining methods could provide a significantly useful tool for analyzing ad hoc data sets, especially to unravel location specific patterns using more recent weather conditions, as conventional methods on their own cause constraints with such short-term data sets.
Acknowledgments
The authors wish to thank GRC staff for providing the data for this research.
Conflicts of Interest
The authors declare no conflict of interest.
References
- Kaur, G. Meteorological data mining techniques: A survey. Int. J. Emerg. Technol. Adv. Eng. 2012, 2, 325–328. [Google Scholar]
- Rotter, R.P.; Carter, T.R.; Olesen, J.E.; Porter, J.R. Crop–climate models need an overhaul. Nat. Clim. Chang. 2011, 1, 175–177. [Google Scholar] [CrossRef]
- Moulds, J. Food Price Crisis Feared As Erratic Weather Wreaks Havoc On Crops. Available online: http://www.guardian.co.uk/environment/2012/jul/22/food-price-crisis-weather-crops (accessed on 10 October 2013).
- Willenbockel, D. Extreme Weather Events and Crop Price Spikes in a Changing Climate, Illustrative Global Simulation Scenarios; Oxfarm Reserach Reports ISBN 978-1-78077-168-7; Oxfam GB: Oxford, UK, 2012. [Google Scholar]
- Pascual, A.; Valero, F.; Martín, M.L.; Morata, A.; Luna, M.Y. Probabilistic and deterministic results of the ANPAF analog model for Spanish wind field estimations. Atmos. Res. 2012, 108, 39–56. [Google Scholar] [CrossRef]
- Kaya, E.; Barutçu, B.; Menteş, S. A method based on the van der Hoven spectrum for performance evaluation in prediction of wind speed. Turk. J. Earth Sci. 2013, 22, 1–9. [Google Scholar]
- Linnenluecke, M.K.; Griffiths, A.; Winn, M. Extreme weather events and the critical importance of anticipatory adaptation and organizational resilience in responding to impacts. Bus. Strateg. Environ. 2012, 21, 17–32. [Google Scholar] [CrossRef]
- Taylor, R.G.; Scanlon, B.; Döll, P.; Rodell, M.; R. Beek, V.; Wada, Y.; Longuevergne, L.; Leblanc, M.; Famiglietti, J.S.; Edmunds, M.; et al. Ground water and climate change. Nat. Clim. Chang. 2012, 3, 322–329. [Google Scholar] [CrossRef] [Green Version]
- Hlavinka, P.; Trnka, M.; Semer, D. Effect of drought on yield variability of key crops in Czech Republic. Agric. For. Meteorol. 2009, 149, 431–442. [Google Scholar] [CrossRef]
- Trought, M.; Howell, G.; Cherry, N. Practical Considerations for Reducing Frost Damage in Vineyards; New Zealand Winegrowers: Canterbury, UK, 1999. [Google Scholar]
- Schweitze, F. EPJ Data Science. Available online: http://www.epjdatascience.com/ (accessed on 10 October 2013).
- Liang, X.; Liang, Y. Applications of Data Mining in Hydrology. In Proceedings of the IEEE International Conference on Data Mining (ICDM), San Jose, CA, USA, 29 November 2001–2 December 2001; pp. 617–620.
- Romani, L.A.S.; de Ávila, A.M.H.; Zullo, J., Jr. Mining relevant and extreme patterns on climate time series with CLIPSMiner. J. Inf. Data Manag. 2010, 1, 245–260. [Google Scholar]
- Salas, H.A.; Bringay, S.; Flouvat, F.; Selmaoui-Folcher, N.; Teisseire, M. The Pattern Next Door: Towards Spatio-Sequential Pattern Discovery. In Advances in Knowledge Discovery and Data Mining; Springer: Berlin, Germany, 2012; pp. 157–168. [Google Scholar]
- Gaikwad, G.P.; Nikam, V.B. Different rainfall prediction models and general data mining rainfall prediction model. Int. J. Eng. Res. Technol. 2013, 2, 115–123. [Google Scholar]
- Olaiya, F. Application of data mining techniques in weather prediction and climate change studies. Int. J. Inf. Eng. Electron. Bus. 2012, 1, 51–59. [Google Scholar] [CrossRef]
- IBM SPSS. Modelling Techniques in Clementine. Available online: https://fhss.byu.edu/ SPSS%20Modeler/Chapter%2011.pdf (accessed on 10 October 2013).
- National Instruments. The Moore’s Law of Big Data. (In Chinese)Available online: http://zone.ni.com/devzone/cda/pub/p/id/1649 (accessed on 10 October 2013).
- Shanmuganathan, S.; Li, Y.; Cassim, M. Spatial Data Mining and Visualisation, Beppu 2000 Census Case Study. In Proceedings of “Advances in Natural Computation and Data mining” 2nd International Conference on Natural Computation (ICNC'06) and the 3rd International Conference on Fuzzy Systems and Knowledge Discovery (FSKD'06), Xi’an, China, 24–28 September 2006; pp. 438–449.
- Wang, C.-H.; Wang, X.; Khoo, Y.B. Extreme wind gust hazard in Australia and its sensitivity to climate change. Nat. Hazards 2013, 67, 549–567. [Google Scholar] [CrossRef]
- Zhang, J.; Wang, P.; Zheng, X. A prediction model for simulating near-surface wind gusts. Eur. Phys. J. E 2013, 36, 1–6. [Google Scholar] [CrossRef]
- Gnana Sheela, K.; Deepa, S.N. An Intelligent hybrid Neural Network Model in Renewable Energy Systems. In Proceedings of the International Conference on Computer Technology and Science (ICCTS 2012), New Delhi, India, 2012; Volume 47, pp. 181–184.
- Sallis, P.; Claster, W.; Hernández, S. A machine-learning algorithm for wind gust prediction. Comput. Geosci. 2011, 37, 1337–1344. [Google Scholar] [CrossRef]
- Sallis, P.; Hernández, S. A precision agronomic state-space estimation method for event anticipation using dynamic multivariate continuous data. J. Comput. Sci. Comput. Math 2013, in press. [Google Scholar]
- Auckland Kumeu weather data, record high data. Available online: www.binoscope.co.nz/ Kumeu.htm (accessed 14 June 2013).
- Terms Used by Meteorologists, Forecasters, Weather Observers, and in Weather Forecasts. Available online: http://www.erh.noaa.gov/box/glossary.htm (accessed 14 June 2013).
- Li, X.; Plale, B.; Vijayakumar, N.; Ramachandran, R.; Graves, S.; Conover, H. Real-time storm detection and weather forecast activation through data mining and events processing. Earth Sci. Inform. 2008, 1, 49–57. [Google Scholar] [CrossRef]
© 2014 by the authors; licensee MDPI, Basel, Switzerland. This article is an open access article distributed under the terms and conditions of the Creative Commons Attribution license (http://creativecommons.org/licenses/by/3.0/).
Share and Cite
MDPI and ACS Style
Shanmuganathan, S.; Sallis, P. Data Mining Methods to Generate Severe Wind Gust Models. Atmosphere 2014, 5, 60-80. https://doi.org/10.3390/atmos5010060
AMA Style
Shanmuganathan S, Sallis P. Data Mining Methods to Generate Severe Wind Gust Models. Atmosphere. 2014; 5(1):60-80. https://doi.org/10.3390/atmos5010060
Chicago/Turabian StyleShanmuganathan, Subana, and Philip Sallis. 2014. "Data Mining Methods to Generate Severe Wind Gust Models" Atmosphere 5, no. 1: 60-80. https://doi.org/10.3390/atmos5010060