
An Ensemble Forecast Wind Field Correction Model with Multiple Factors and Spatio-Temporal Features

1
Chengdu Institute of Computer Applications, Chinese Academy of Sciences, Chengdu 610041, China
2
Department of Computer Science, Chengdu University of Information Technology, Chengdu 610225, China
3
Sichuan Meteorological Observatory, Chengdu 610071, China
4
Heavy Rain and Drought-Flood Disaster in Plateau and Basin Key Laboratory of Sichuan Province, Institute of Plateau Meteorology, China Meteorological Administration (CMA), Chengdu 610072, China
*
Authors to whom correspondence should be addressed.
Atmosphere 2023, 14(11), 1650; https://doi.org/10.3390/atmos14111650
Submission received: 10 September 2023
/
Revised: 24 October 2023
/
Accepted: 31 October 2023
/
Published: 3 November 2023
(This article belongs to the Special Issue Advances in Wind and Wind Power Forecasting and Diagnostics)
Abstract
:Accurate wind speed prediction is significantly important for the full utilization of wind energy resources and the improvement in the economic benefits of wind farms. Because the ensemble forecast takes into account the uncertainty of information about the atmospheric motion, domestic and foreign weather service forecast centers often choose to use the ensemble numerical forecast to achieve the fine forecast of wind speed. However, due to the unavoidable systematic errors of the ensemble numerical forecast model, it is necessary to correct the deviation in the ensemble numerical forecast wind speed. Considering the typical spatio-temporal characteristics of the grid prediction data of the wind field, based on Convolutional Long–Short Term Memory (ConvLSTM) units and attention mechanism, this paper takes the complex and representative North China region as the research area, aiming to reveal the shortcomings of existing deep learning integrated prediction correction models in extracting temporal features of grid prediction data. We propose a new ensemble prediction wind field correction model integrating multi-factor and spatio-temporal characteristics. This model uses reanalyzed land data provided by the European Center for Medium-Range Weather Forecasts as the real data to correct the deviation in the near-surface 10 m wind field data predicted by the regional ensemble numerical prediction model of the China Meteorological Administration. We used the reanalyzed land data provided by the European Centre for Medium-Range Weather Forecasts (ECMWF) as the live data to correct the deviation in the near-surface 10 m wind field data predicted by the regional ensemble numerical forecast model of the China Meteorological Administration (CMA). At the same time, Root Mean Square Error (RMSE) and Mean Absolute Error (MAE) were used as the scoring indicators, and the results of the China Meteorological Administration–Regional Ensemble Prediction System (CMA–REPS) ensemble average, multiple linear regression method correction, Long–Short Term Memory (LSTM) method correction, and U-net (UNET) method correction were compared. Compared with the UNET model method, the experimental results show that when processing the 10 m zonal wind data, 10 m meridional wind data, and 10 m average wind speed data of CMA–REPS 24 h forecasts, the correction results of our model can reduce the RMSE score index by 9.15%, 4.83%, and 7.79%. At the same time, when processing the 48 h and 72 h near-surface 10 m wind field data of the CMA–REPS forecast, our model can improve the prediction accuracy of CMA–REPS near-surface wind forecast data. Therefore, the correction effect of the proposed model in a complex terrain area is evidently better compared to other methods.
1. Introduction
As an efficient and clean renewable energy source, wind energy has attracted wide attention around the world due to its various advantages, such as its abundant energy, wide distribution, and low carbon emissions, and it has become one of the sustainable energy and renewable energy technologies actively promoted by many countries. Additionally, compared to the burning of non-renewable energy, wind energy has a lesser impact on the environment, and wind energy is now one of the main sources of global electricity supply. However, the random and intermittent changes in wind speed mean that power generation cannot be increased or decreased according to electricity demand, which brings certain challenges to the economy of wind power generation. Accurate wind speed prediction can effectively improve the utilization rate of wind energy resources, reduce the impact of wind power fluctuations on the stability of the power grid, and thus enhance the economic benefits of wind farms [1].
At present, numerical weather forecasting methods [2] are widely used to achieve the fine-grained prediction of wind speed, that is, hydrodynamic and thermodynamic equations describing the evolution process of weather are established according to the principles of physics, with observation data as the input, and high-performance computers are used for the numerical solution to forecast wind fields. Numerical forecasting methods can be divided into two types: deterministic and ensemble. Compared with single deterministic numerical forecasting, ensemble methods usually obtain more accurate wind field prediction results because they take into account uncertain information about the weather forecast, and this has now been implemented in the routine operation of weather service prediction centers in many countries [3,4,5]. However, in practice, due to various imperfections at the beginning of the design of the ensemble forecast model and the uncertainty of the atmospheric system, the ensemble numerical forecast has always suffered systematic errors, resulting in systematic deviations in the wind field forecast results [6]. To meet the demand for an accurate and reliable wind speed forecast, it is necessary to correct the deviation in the results of the ensemble numerical forecast model to improve the ability of the numerical model to forecast the wind field. At present, the traditional statistical correction methods are still used in China for the forecast results of the wind field [7], such as the non-Gaussian distribution non-uniform regression method [8], Bayesian model averaging method, and aggregate model output statistical method [9,10,11,12,13], which are usually based on linear statistical models. For the random characteristics of wind field changes, traditional linear statistical models cannot capture the hidden nonlinear relationship in wind speed changes.
Continuous improvements in computer hardware equipment and the development of artificial intelligence technology enable researchers to combine machine learning to correct the deviation in numerical model forecast results. For example, Maxime Taillardat et al. [14] used quantile regression forest to post-process the ensemble forecast results, and improved forecast effects of wind speed significantly. Quande et al. [15] used several common machine learning algorithms (Lasso Regression Algorithm, random forest, etc.) to correct the near-surface 10 m wind speed predicted by the numerical weather forecast model ECMWFs in North China, and experimentally showed the superiority of machine learning methods over traditional ones, especially in sea areas and coastal areas. However, classical machine learning relies on complex feature engineering. When applying machine learning to the correction of deviation problems in digital patterns, researchers are required to have professional knowledge in the field of meteorology and spend a lot of their time on this process, which makes the training process costly and challenging.
As a specific form of machine learning, deep learning has a greater advantage in the non-linear modeling of large amounts of data and it does not require feature engineering, which is very applicable to the atmospheric systems with complex and highly non-linear dynamics. For example, Stephan Rasp et al. [16] took the lead in trying to use deep neural networks to correct the deviation of two-meter temperature predicted by ensemble prediction in the distributed regression framework. However, it only considers the correction of a single station location and a single weather variable, which is not applicable to the two-dimensional grid data generated by the numerical methods. To handle the two-dimensional grid data, Peter Gronquist et al. [17] proposed a set prediction bias correction model based on the U-net, which achieved a relative improvement of more than 14% in the continuous ranked probability score (CRPS) compared with traditional ones. Han, L. et al. [18] proposed a Correction U-net (CU-net) model based on U-net, which corrects the grid point prediction data of the ECMWF’s Integrated Forecast System (ECMWFs-IFS) model with a further better correction. Zhang Yanbiao et al. [19] proposed Dense Correction U-net (Dense-Cunet) by introducing Denseblock [20] to CU-net, to further strengthen the CU-net model’s bias correction ability for complex meteorological grid data. Fuse-Cunet, a numerical prediction error correction model integrating various meteorological elements and topographic features, was further developed, which also improves the correction of the wind field, but empirically, the improvements are not as significant for that of temperature and relative humidity. Although the above studies have achieved good results in correcting the deviation in the grid data predicted by the numerical model, there are still some shortcomings in considering the spatio-temporal characteristics of the grid prediction data, which are mainly reflected in the failure to consider the extraction and fusion of the time-dimensional features of the grid prediction data using deep learning models. Spatio-temporal neural networks [21] are used to capture the complex spatial and temporal characteristics.
ConvLSTM [22] as one of the representative spatio-temporal neural networks, was first proposed in the precipitation nowcasting tasks. It uses LSTM modules to capture long-range dynamics in time and Convolution Neural Networks (CNNs) to model spatial dependencies. Thanks to its modeling method of space–time decoupling, which is similar to numerical methods, it enables the space–time dependency learned by the network to be in line with real physical scenarios besides reduced complexity. Various works have confirmed its applicability for meteorological tasks. For example, C. Chou, J. Park et al. [23] developed a super-resolution-based ConvLSTM neural network that captures spatial and temporal changes to generate high-resolution climate change predictions with high accuracy. Yang Xin et al. [24] proposed a multi-source rainfall fusion method based on the ConvLSTM network, which improves the spatial resolution of rainstorm data while ensuring the accuracy of rainfall, and can simulate the spatial distribution of rainfall in the basin and display the central location of heavy rainfall. Additionally, Feiyue Deng et al. [25] proposed a new combined model of ConvLSTM and Transformer to extract spatio-temporal features and apply them to the prediction of the remaining usable life of equipment. The results show that the ConvLSTM network can directly extract low-dimensional spatio-temporal features from long-time degraded signals.
However, the spatial dependency is modeled with CNNs in ConvLSTM. As CNNs rely on the convolution kernel to extract the features, the convolution kernel is usually limited by the receptive field. For example, if the convolution kernel is set as 7 × 7, the center point can only receive the surrounding 49 messages during one-step convolution. However, when dealing with tasks that need to consider the global background, CNNs cannot qualify. Especially in the correction task of wind speed, the global and remote information usually reveals the complete change process of wind. Moreover, the stack of convolution layers can hardly give any interpretive insights of the mechanisms. In order to make up for the shortcomings of ConvLSTM, we built a set numerical wind field correction models based on a combination of attention [26] mechanisms and ConvLSTM, integrating spatio-temporal features and multiple factors. In the model, an attention mechanism captures global messages and remote dependencies of input sequences, while CNNs are still kept to extract local features. Moreover, a weight matrix calculated by an attention mechanism can also give further explanations on spatial dependencies. In the experiments, the correction of near-surface (10 m) wind speed grid data predicted by the CMA–REPS was carried out, and the revised forecast time was 24 h, 48 h, and 72 h. The revised results were compared with the wind field correction results obtained by the CMA–REPS ensemble average, traditional statistical methods multiple linear regression, and the deep learning methods LSTM [27] and UNET [28], respectively. The results show that the model can further improve the prediction accuracy of the ensemble numerical prediction model for wind field grid data.
2. Materials and Methods
2.1. Data Sources
In our study, we corrected the bias of the China Meteorological Administration–Regional Ensemble Prediction System (CMA–REPS) grid prediction data. CMA–REPS is a new generation of theregional aggregate forecast system independently developed by the China Meteorological Administration. Its predecessor is Global and Regional Assimilation and Prediction Enhanced System–Regional Ensemble Prediction System (GRAPES–REPS), developed based on the regional model of a multi-scale general data assimilation and numerical weather prediction system, a new system studied and built independently in our country [29,30]. The initial disturbance of CMA–REPS uses the GRAPES pattern surface set transform Kalman filter based on the 6 h cycle calculation scheme [31]. Stochastic Perturbed Parameterization Tendencies (SPPTs) [32] are used for model perturbation. Boundary perturbation by extracting the GRAPES–GEPS (Global and Regional Assimilation and Prediction Enhanced System–Global Ensemble Prediction System) global ensemble forecast system disturbance measurement boundary compared with its own control forecast is superimposed onto the control prediction measurement boundary of CMA–REPS [33]. The parameter configuration of CMA–REPS is shown in Table 1. The horizontal resolution of CMA–REPS is 0.1°, the vertical resolution is 50 layers, the number of ensembles forecast members is 15, the forecast area is China, and the forecast time is 0–84 h (00UTC (Coordinated Universal Time), 12UTC), 0–6 h (06UTC, 18UTC). The initial value and side boundary of CMA–REPS are derived from the forecast field of the National Centers for Environmental Prediction–Global Forecast System (NCEP–GFS). In addition, onto CMA–REPS we have added cloud analysis assimilation technology and conditional typhoon vortex relocation technology [34] in order to improve the shortcoming of its precipitation and typhoon forecast ability.
The European Centre for Medium-Range Weather Forecasts (ECMWFs) provides global numerical model forecast results that are currently recognized as the most accurate in the world [35]. In the experiment, ECMWF Reanalysis v5-Land (ERA5-Land) [36], the fifth-generation reanalysis product of ECMWFs, was used as the grid “Observation” data. Era5-land was generated by replaying the terrestrial portion of ECMWFs’ ERA5 Climate Reanalysis data, which use the laws of physics to combine model data with observations from around the world into a globally complete and consistent dataset, producing data that span across past decades and provide an accurate description of past weather. The description of ERA5-Land data is shown in Table 2. Its horizontal resolution is 0.1° × 0.1°, time resolution is hour by hour, and storage format is in General Regularly distributed Information in Binary form (GRIB) format [37].
2.2. Data Selection
The starting times of the CMA–REPS grid forecast data were 00UTC and 12UTC, and the meteorological elements included 2 m air temperature (2 t), 10m u_component wind (10 u), and 10m v_component wind (10 v). The forecast timeliness was 24 h, 48 h, and 72 h. The selected elements of the “real” data were consistent with the forecast data. The time range of the two sets of data was from 20 October 2019 to 1 May 2022, the spatial range was 32~42° N and 110~120° E (corresponding to North China, as indicated by the red rectangle in Figure 1), and the grid number was 101 × 101.
North China is an important geographical region in the north of China, including Beijing, Tianjin, central and southern Hebei Province, Shanxi Province, central Inner Mongolia, and other regions. It is a very difficult task to correct the wind speed in such a place with special terrain and variable wind field. If the wind speed correction in North China can be performed well, the adaptability of our model can be effectively enhanced.
In order to prevent the phenomenon of overfitting in model training and improve the generalization ability of the model, it is necessary to divide the selected data into the training set, validation set, and test set. Since the revised forecast time of the experiment is 24 h, 48 h, and 72 h, the forecast data and the “live” data are divided into three groups according to the forecast time, and the data corresponding to the forecast time between 20 October 2019 and 27 April 2021 are selected as the training set for each group. The data corresponding to the forecast timeliness between 28 April 2021 and 29 January 2022 are the validation set, and the data corresponding to the forecast timeliness between 30 January 2022 and 1 May 2022 are the test set. The ratio between the training set, verification set, and test set remains 6:3:1.
2.3. Data Preprocessing
First, the aggregate average of CMA–REPS prediction data for the selected factors is calculated, and this result is used as the prediction data for our subsequent experiments. Then, 10 m u_component wind (U) and 10 m v_component wind (V) are synthesized into 10 m total wind speed (W), and the synthesis formula is shown in Equation (1). Once the selected CMA–REPS forecast data and ERA5 data contain 2 t, 10 u, 10 v, and 10 w meteorological elements, then the two sets of data are quality controlled to detect whether there are missing values or abnormal values in the data. After detection, ERA5-Land data are missing in the offshore area of North China, and their missing value is set to −9999. In view of the spatial continuity of grid prediction data, the missing values are replaced by linear interpolation with adjacent non-missing values.
Since the selected forecast data and the “Observation” data often have different orders of magnitude and units between different meteorological elements, in order to eliminate the dimensional influence between indicators and improve the convergence speed and training accuracy of the model, it is necessary to standardize the grouped data, respectively. In this paper, the Min–Max normalization method is used to map the data uniformly to the interval [0, 1]. The conversion function is shown in Formula (2), where is the maximum value and is the minimum value of the sample data.
2.4. A Revised Model Integrating Multi-Factor and Spatio-Temporal Features
There is often a complex relationship between different meteorological elements, such as pressure, temperature, humidity, and other meteorological elements, which will affect the characteristics of the wind field distribution. The interaction between these elements affects the formation and change in wind speed together. Fusing the characteristics of multiple meteorological elements can provide more comprehensive and accurate information, thereby improving the quality of the wind field correction results of the model. Spatio-temporal features can describe the evolution trend of the data, and extracting the spatio-temporal features of the data can help the model better understand the dynamic changes in the wind field so as to predict future wind field changes more accurately. As a special structure in deep learning, an attention mechanism can help the model to selectively focus on a part of the information in the input data. This is of great help to the revised model when dealing with input data containing multiple meteorological elements. The grid data of numerical model prediction have complex spatial and temporal characteristics, which are typical spatio-temporal sequence data. As a neural network model that combines the characteristics of CNN and LSTM, ConvLSTM can also preserve the spatial characteristics of the input data well while processing sequence data. Based on this, this paper uses an attention mechanism and ConvLSTM unit to build an ensemble numerical prediction wind field correction model that integrates multiple elements and spatio-temporal features.
2.5. Introduction to Basic Methods
- Convolutional LSTM Cell
ConvLSTM unit not only has the ability of a convolutional neural network to extract and encode data spatial features, but it also has the sequence feature encoding characteristics of a long short-term memory network. The structure of the ConvLSTM cell is shown in Figure 2, from which we can see that the ConvLSTM is a variant of the LSTM structure, which controls the communication of data inside the cell through the forget gate (), input gate (), and output gate (). The individual gates control data to participate in cell state updates, selectively retaining or discarding information through the gates. If the input gate is activated, the input will be accumulated into the cell. If the forget gate is activated, then the previous cell state is forgotten. The output gate controls whether the cell output will be transmitted to the final hidden state. ConvLSTM differs from LSTM in that it employs convolution operations instead of matrix multiplication in both “input-to-state” and “state-to-state” parts, and all its inputs unit outputs , hidden state and forget gate (), and input gate () and output gate () are all 3D tensors. The advantage of this method is that it can remove a large number of spatial redundant features and solve the problem of the time dependence of data while extracting the spatial information of sequence data so as to realize the joint modeling of time and spatial information of the sequence data.
The transfer relationship between each ConvLSTM gate is shown in Equation (3), where is the input gate, is the forget gate, is the cell state, is the output gate, is the hidden layer output, “*” represents the convolution operator, “” represents the Hadamard product, σ is the sigmoid activation function, and is the input gate. The formula for this activation function is given in Equation (4). ConvLSTM uses the peephole LSTM structure with the addition of peep, which uses the cell for the computation of the forgotten door and the input door to grasp temporal and spatial information. The forgetting gate can control the forgetting of the information, discard the information that is considered redundant, retain the useful information, and then transmit it backwards. The continued information enters the input gate, the information to be updated is determined through the sigmoid layer, and the new cell information is obtained through the tanh layer to update the cell. Finally, the final output of the ConvLSTM unit is obtained by multiplying the information of the sigmoid in the output gate with the information of the memory cells through tanh.
- Attention mechanism
The attention mechanism in deep learning refers to the attention thinking mode of human beings, which is widely used in various types of deep learning tasks such as natural language processing [38] and image processing [39], and has achieved remarkable results. In this paper, the attention mechanism proposed by Zhang et al. [40] is used to process the multi-factor features in the ensemble numerical prediction data. This mechanism computes the attention weights between multi-feature data at each time step by referring to the previous hidden states of the encoder. Figure 3 shows how the mechanism works. For the spatial attention module, the standard convolution layer has a convolution kernel size of 7, a convolution stride of 1, and an input boundary padding size of 3. As shown in Figure 3, for each time step t, the attention mechanism first performs convolution and summation operations on the input sequence and the hidden layer state of the encoder at the previous time to obtain the feature matrix at each time step. Then, the softmax function is used to calculate the attention matrix (weights) in the feature dimension. Each cell in the attention matrix A represents the attention to each feature at the location corresponding to that cell. The key point of this mechanism is that the softmax function is a non-negative function. In addition, the convolution operation is used to replace the full connection operation, which not only retains the data space covariance but also improves the operation efficiency of the model.
For a certain point i, the attention module employs the kernel function to aggregate information from other points j, which is represented as:
represents the attention weight that forms the elements of the attention matrix A_t of time step t.
It computes the attention matrix through the convolutional layer and softmax. It is expressed as:
represents the intermediate representation of the attention matrix, which is computed by applying convolution operations to the previous state of the encoder and the input sequence . Finally, it is transformed into the attention matrix by the softmax operation.
Since is an n×n matrix, it encompasses information from every spatial point, giving it a global perspective. Furthermore, can be used to assess the extent to which each point is influenced by information from other points, making it an interpretive tool that aids in understanding the model’s information interaction and focus among different points.
In light of this, our model introduces a spatial attention module [41] to perform feature extraction on the final output of the decoder. The integration of the spatial attention module can help the model to better deal with the noise interference in the data so that the model can adaptively select the area that attention needs to be paid to in order to better adapt to the complex characteristic changes in the wind field forecast data and improve the correction effect of the model in complex terrain areas. Figure 4 shows the structure of the spatial attention module. Firstly, the spatial attention module performs MaxPooling and Average-Pooling (AvgPooling) operations on the input feature map (pooling in the channel dimension and compressing the channel size; it is easy to learn the characteristics of the space later). Then, the results of MaxPooling and AvgPooling are concatenated according to the channel. Finally, the stitched results are sent to a standard volume base, and the final spatial attention feature map is obtained after the sigmoid activation function, which is the final output of the ensemble numerical prediction wind field correction result.
2.6. Revise the Model
For the bias correction problem of ensemble numerical prediction wind field grid data in this paper, this paper builds our bias correction model by stacking multiple ConvLSTM network layers. As shown in Figure 5, the model consists of an encoder and a decoder built from stacked ConvLSTM cells. The input sequence is first passed through an attention mechanism, the structure of which is shown in Figure 3. For the revised model, the convolution kernel size of the ConvLSTM layer used is 3, the convolution stride is 1, and the input boundary padding is 1. In this mechanism, the model calculates the attention weights for the feature maps of multiple elements at the current time step by referring to the encoder hidden state at the last time step and finally obtains the attention matrix for the current time step. The input sequence at each time step is then multiplied by the attention matrix to obtain the weighted input at the corresponding time step and is passed into the encoder. The encoder block is composed of multiple ConvLSTM units, and the number of ConvLSTM units is the same as the time sliding window size of the data (the data sliding window in this experiment is 5, that is, the previous 5 forecast data are used to correct the result of the fifth forecast). The encoder will encode the weighted input of the attention mechanism output at each time step as hidden states. These hidden states are then passed to the context matcher, which then sums the hidden states from the encoder to match the hidden states from the decoder in the time dimension. The purpose of introducing the context matcher mechanism is to prevent performance loss in the time dimension of the input sequence. Next, these states are passed to the ConvLSTM unit of the decoder, and the ConvLSTM in the decoder decodes the past information from the encoder hidden layer. The decoded information is then passed through a spatial attention module to generate the final correction result of the model. Next, we will detail the encoder and decoder parts of this model, respectively.
- Encoder structure
The first is the encoder part, and Figure 6 shows the unfolding structure of the encoder in detail. In the encoder, we use ConvLSTM units as nonlinear functions to model the hidden features of spatio-temporal sequences. For a spatial–temporal input sequence with T time steps, the learning mapping method of the encoder is shown in Equation (9), where represents the hidden state of the encoder at time t, and represents the ConvLSTM cell. The input sequence is first fed into the spatio-temporal attention mechanism. For a single time step t, for the multi-feature input sequence , the attention mechanism will combine to the hidden state of the encoder at the last time to calculate the multi-factor attention matrix , which represents the attention weight of the model to different elements in the same spatial location. The input sequence is then Hadamard multiplied with the attention matrix to obtain the weighted input at the corresponding time. After that, the encoder is mapped as shown in Equation (10).
Through the attention mechanism, the encoder can selectively focus on the spatio-temporal sequence of different elements at each time step. Figure 6 also shows that each ConvLSTM unit in each layer can encode the current weighted sequence of the input with reference to the hidden state of the previous time step, that is, the output of the previous ConvLSTM unit will be used as the input of the ConvLSTM unit itself. The hidden state output by the ConvLSTM unit at each layer is finally passed to the context matcher mechanism in the decoder, and the encoding operation ends.
- Decoder structure
The unfolding structure of the decoder in the revised model fusing multi-element and spatio-temporal features is shown in Figure 7. The purpose of the decoder is to decode the encoded information. After the input sequence is passed from the encoder layer, the hidden states of each encoder layer are passed to the context matching mechanism in the decoder, which matches the hidden states of the decoder by summing the hidden states of the encoder over all the time steps. The purpose of introducing the context matcher mechanism is to prevent performance loss in the time dimension of the input sequence. The context matching mechanism is described in Equation (11):
In Equation (11), represents the hidden state of the decoder, and is the hidden state at time step passed by the encoder. Next, these states are passed to the ConvLSTM unit in the decoder. The ConvLSTM unit will take the model training label value at time t as its input value, decode the hidden state , and output the final correction result of the model through the spatial attention module. The integration of the spatial attention module can help the model to better deal with the noise interference in the data so that the model can adaptively select the area that needs to be paid attention to in order to better adapt to the complex characteristic changes in the wind field forecast data and improve the correction effect of the model in complex terrain areas.
2.7. Experiments
Considering the difference in the error characteristic distribution between the forecast data with different forecast timelines, we divided the CMA–REPS forecast data into three groups according to the forecast timelines (24 h, 48 h, 72 h) for the bias correction problem of the ensemble numerical forecast wind field grid forecast data in this paper. Figure 8 illustrates the experimental setup of this paper. After data preprocessing, the ensemble average of the CMA–REPS forecast data and the ERA5-Land reanalysis data of the four meteorological elements (2 t, 10 u, 10 v, 10 w) used in the bias correction experiment in this paper are obtained. For a single set of CMA–REPS forecast data , we select ERA5-Land Observation data at time t for splicing, and the dimension of the spliced data is . Then, a time sliding window is established for the data, and the first four times of concatenated data are selected for combination based on time t. Finally, the input size of our bias correction model is obtained as . Then, we group the live data corresponding to the CMA–REPS forecast data at the forecast time according to the correction elements (10 u, 10 v, 10 w) and use them as the training label values (dimension is ) of the model one by one for model training. The input sequence and the training label values are standardized by Min–Max and then input into the bias correction model that fuses multi-feature and spatio-temporal features for training. Finally, after nine groups of experiments, the revised results of near-surface wind field elements 10 u, 10 v, and 10 w in the forecast time of 24 h, 48 h, and 72 h, respectively, are obtained, and the data grid size is . In a single training dataset, taking the revised 24 h 10 u forecast data as an example, the training data of the model are the ERA5-Land live data of T-time and their first four forecasts (t-12 h, t-24 h, t-36 h, t-48 h) and the 24 h forecast data of CMA–REPS (5 8101101). The training label is t + 24 h of 10 u live data (11101101).
For the training of the model, Adam [42] is used as the optimizer of the model, the initial learning rate (lr) is set to 0.1, the learning rate decay factor is set to 0.1, the exponential decay rate of the first moment estimation is set to 0.9, and the exponential decay rate of the second moment estimation is set to 0.999. If the score index of the validation set does not decrease for four consecutive times, the model parameters with the best score index of this training are saved, and then the learning rate is attenuated to , and the model parameters saved last time are used to continue training until the model has the optimal score of the validation set. Compared with the traditional stochastic gradient descent algorithm, the Adam algorithm can design independent adaptive learning rates for different parameters by calculating the order moments of the gradient and has a more efficient computational efficiency. To further improve the computational efficiency and robustness of the model, we also batch train the model and set the batch size to 8. The loss function of the model is the mean square error (MSE), which is calculated in Equation (12). In the equation, and , respectively, represent the observed value in the training set and the fixed value after model training, and n represents the number of samples in the training set.
For the measurement of model correction performance and the test analysis of wind field results after correction, this paper used RMSE and MAE to evaluate and compare with the wind field correction results obtained by the CMA–REPS ensemble average, multiple linear regression, LSTM, and U-net. Our model combines both temporal and spatial features of data. Most of the current deep learning ensemble prediction correction methods are carried out based on U-net, and LSTM and U-net are typical models in extracting temporal and spatial features respectively, so the comparison between our model, LSTM, and U-net is of great significance. In addition, multiple linear regression is a traditional correction method. By comparing the performance of our model with the CMA–REPS ensemble average and multiple linear regression, we can measure whether our method has a positive correction effect on the numerical ensemble prediction results. RMSE and MAE are calculated as follows:
where is the number of test samples, and and are the test set observations and the model values, respectively.
3. Results
3.1. Results of 10 u Correction
Table 3 and Table 4, respectively, show the CMA–REPS wind field correction model (Attention-ConvLSTM) based on the attention mechanism and ConvLSTM and other correction methods for comparison. The average RMSE and average MAE of the 10 u data predicted at 24 h, 48 h, and 72 h are corrected on the test set. For the 10 u data of 24 h prediction on the test set, the average RMSE and average MAE after correction by the Attention-ConvLSTM model are 50.32% and 51.72% lower than the ensemble average of CMA–REPS. At the same time, the average RMSE of the Attention-ConvLSTM model after correction is 34.22% and 9.15% lower than that of the LSTM and UNET methods, and the average MAE is 36.44% and 11.98% lower than that of the LSTM and U-Net methods, respectively. For the 48-h prediction of 10 u data on the test set, the average RMSE and average MAE of the Attention-ConvLSTM model after correction are 45.03% and 46.46% lower than the ensemble average of CMA–REPS, and 26.41% and 27.87% lower than that of LSTM. It is 11.07% and 12.28% lower than that of U-net. For the 72-h prediction of 10 u data on the test set, the average RMSE and average MAE of the Attention-ConvLSTM model after correction are 40.15% and 41.75% lower than the ensemble average of CMA–REPS and 24.37% and 26.94% lower than those of LSTM. It is 3.27% and 5.04% lower than that of U-net. Comparatively, among the three forecasting timelines, the Attention-ConvLSTM model proposed in this paper improves the 10 u data correction effect of 24 h forecasting more obviously. In other prediction timings, the Attention-ConvLSTM model also shows a certain improvement in terms of the correction effect compared with other deep learning correction models. This shows that the deep learning wind field correction model integrating multiple elements and spatio-temporal features can further improve the bias correction effect of 10 u data predicted by CMA–REPS compared with the deep learning wind field correction model that only considers a single temporal feature or spatial feature.
Figure 9 illustrates the trend of RMSE over time between the 10 u data corrected by each revised model and the live data on the test set with different forecast timeliness. Figure 9 shows that for most of the time on the test set, the data errors corrected by the Attention-ConvLSTM model are at a low level, and the second-best corrected model is the U-net model. The corrected 10 u data error of the U-net model and Attention-ConvLSTM model generally maintains a relatively stable trend on the test set. Although the correction effect of the LSTM model is better than that of the CMA–REPS ensemble average most of the time, it occasionally fluctuates, and the error of its corrected data is higher than that of CAM-REPS itself. Compared with the correction method based on deep learning, the traditional correction method based on multiple linear regression adopted in this paper is not satisfactory for the correction effect of 10 u forecast data of the test set, and the overall error of the corrected data fluctuates greatly.
Figure 10 shows the 10 u revised result of the 24 h forecast reported from 00:00 on 4 April 2022. It can be seen from Figure 10 that the ensemble average of CMA–REPS (Figure 10b) forecasting data has a large overall error, which is significant in areas with complex landforms, large topographic fluctuations, and complex climatic conditions such as mountains, plateaus, and coastal areas. After the multiple linear regression model (Figure 10c), LSTM model (Figure 10d), and U-net model (Figure 10e) were revised, the prediction results were significantly improved, and this significant improvement was concentrated in the central and southern plain areas of the study area. However, the terrain of the east sea and the plateau in the northwest of North China is complicated, and there are still some errors in the revised forecast results compared with the actual data (Figure 10a). The Attention-ConvLSTM model (Figure 10f) not only has a better correction effect in the central and southern plain areas of the study area but a significant improvement in the prediction effect in the above complex terrain areas can also be seen. This shows that the spatial attention mechanism can effectively improve the prediction correction effect of the model for complex terrain areas.
3.2. Results of 10 v Correction
Table 5 and Table 6 show the average RMSE and average MAE of 10 v data predicted at 24 h, 48 h, and 72 h by each revised model on the test set after correction, respectively. The corrected Attention-ConvLSTM model that integrates multiple elements and spatio-temporal features still demonstrates a better scoring performance in RMSE and MAE of 10 v data after correction compared to other methods. The average RMSE and MAE of the 24 h forecast 10 v data corrected by the Attention-ConvLSTM model are 0.9665 and 0.7311, which are 49.96% and 52.69% lower than those of the CMA–REPS set on average. Compared with the average of the CMA–REPS set, the RMSE and MAE of the revised U-net model are only reduced by 47.42% and 47.71%. For the 48 h 10 v data forecast on the test set, the corrected average RMSE and average MAE of the Attention ConvLSTM model are 44.53% and 47.01% lower than those of the CMA–REPS set, and 1.78% and 2.14% lower than those of the UNET model. For 10 v data predicted for 72 h on the test set, the corrected average RMSE and average MAE of the Attention ConvLSTM model are 39.73% and 41.90% lower than those of the CMA–REPS set and 1.78% and 2.14% lower than those of the UNET model. Compared with the 24 h and 48 h forecasts, the Attention-ConvLSTM model has a lower improvement effect on the average RMSE and average MAE of the 72 h forecast data after correction, but it can still significantly reduce the error of 10 v forecast data.
Figure 11 illustrates the trend of the RMSE over time between the 10 v data corrected by each revised model and the live data on the test set with different forecast timeliness. It can be seen from the figure that the trend change is roughly the same as that of the 10 u data. That is, most of the time in the test set, the error of 10 v data corrected by the Attention-ConvLSTM model is lower than that of 10 v data corrected by other methods. However, there are occasionally small fluctuations, and the data error corrected by the Attention-ConvLSTM model is slightly higher than that of the U-net model. In general, the correction error of the U-net model and Attention-ConvLSTM model in the test set is always at a low level. The corrected data errors of the LSTM model and the traditional method have a large fluctuation range on the test set, and occasionally the corrected errors are higher than the average of the CMA–REPS set, especially the traditional correction method based on multiple linear regression.
Figure 12 shows an example analysis of the correction of bias in 10 v forecast data, which corresponds to the 10 v correction result of the 24 h forecast reported from 12:00 on 16 April 2022. It can be clearly seen from Figure 12 that after the correction by the Attention-ConvLSTM model (Figure 12f), the 10 v forecast data are closer to the actual data of ERA5-Land on the whole, which is specifically shown in the western plateau, mountain area, and the eastern plain and coastal area of the study area. Specifically shown in Figure 12 is the selected area in a red box, including the western plateau, mountain area, eastern plain and coastal area. The 10 v correction results of Multiple Linear, U-net, and LSTM in these regions are significantly smaller than those of ERA5, while the correction results of Attention-ConvLSTM are closer to ERA5.
3.3. Results of 10 w Correction
Table 7 and Table 8 list the average RMSE and average MAE of the revised models of the CMA–REPS ensemble average, multiple linear regression, LSTM neural network, U-net neural network, and Attention-ConvLSTM on the test set after revising the 10 w data of 24 h, 48 h, and 72 h prediction. The results are similar to 10 u and 10 v, and the Attention-ConvLSTM correction model performs the best among all the compared methods. The average RMSE and MAE of the 10 w data corrected by this model are at a low level under different forecast timelines. Among them, for the 24 h prediction of 10 w data on the test set, the average RMSE and MAE corrected by the Attention-ConvLSTM model are 63.42% and 66.43% lower than those of the CMA–REPS set and 37.1% and 39.3% lower than those of the LSTM method. They are 7.59% and 9.16% lower than the U-net method. For the 10 w data of 48 h prediction on the test set, the average RMSE and average MAE of the Attention-ConvLSTM model after correction are 58.55% and 61.27% lower than those of the CMA–REPS set on average. The average RMSE of the proposed method is 28.64% and 4.11% lower than that of the LSTM method and the UNET method, and the average MAE is 31.29% and 3.38% lower than that of the LSTM method and the UNET method, respectively. For the 72 h forecast 10 w data on the test set, the average RMSE and average MAE of the corrected Attention-ConvLSTM model reach 1.0039 and 0.7808, respectively, which are 56.26% and 59.08% lower than those of the CMA–REPS set. It is easy to find that the improvement in the correction error of the Attention-ConvLSTM model on the 10 w forecast data is negatively correlated with the prediction duration, that is, the longer the prediction duration is, the smaller the correction amplitude of the Attention-ConvLSTM model on the 10 w forecast data is.
Figure 13 illustrates the trend of the RMSE over time between the 10 w data corrected by each revised model and the live data on the test set with different prediction timeliness. For the 24 h forecast, the time distribution of the 10 w data error corrected by the Attention-ConvLSTM model and U-net model on the test set is significantly lower than that of other methods, indicating that the spatial feature extraction ability of the model is very crucial for improving the correction effect of grid forecast data. Compared with the 10 u and 10 v data of 24 h prediction, the gap between the correction effect of the Attention-ConvLSTM model and U-net model is not significant, but in general, the correction effect of the Attention-ConvLSTM model is slightly better than that of the U-net model. For the 48 h forecast, the distribution characteristics of the 10 w data error in time after correction by each model are not much different from the 24 h forecast ratio. Most of the time on the test set, the data error corrected by the Attention-ConvLSTM model is lower than that of other methods. For the 10 w data of the 72 h forecast, the correction performance of the correction model based on deep learning is significantly better than that of other methods on the test set, but the correction effect gap between the three deep learning correction models is not as obvious as that of other prediction timelines. However, in general, the data error after the correction of the Attention-ConvLSTM model is still basically at a low state.
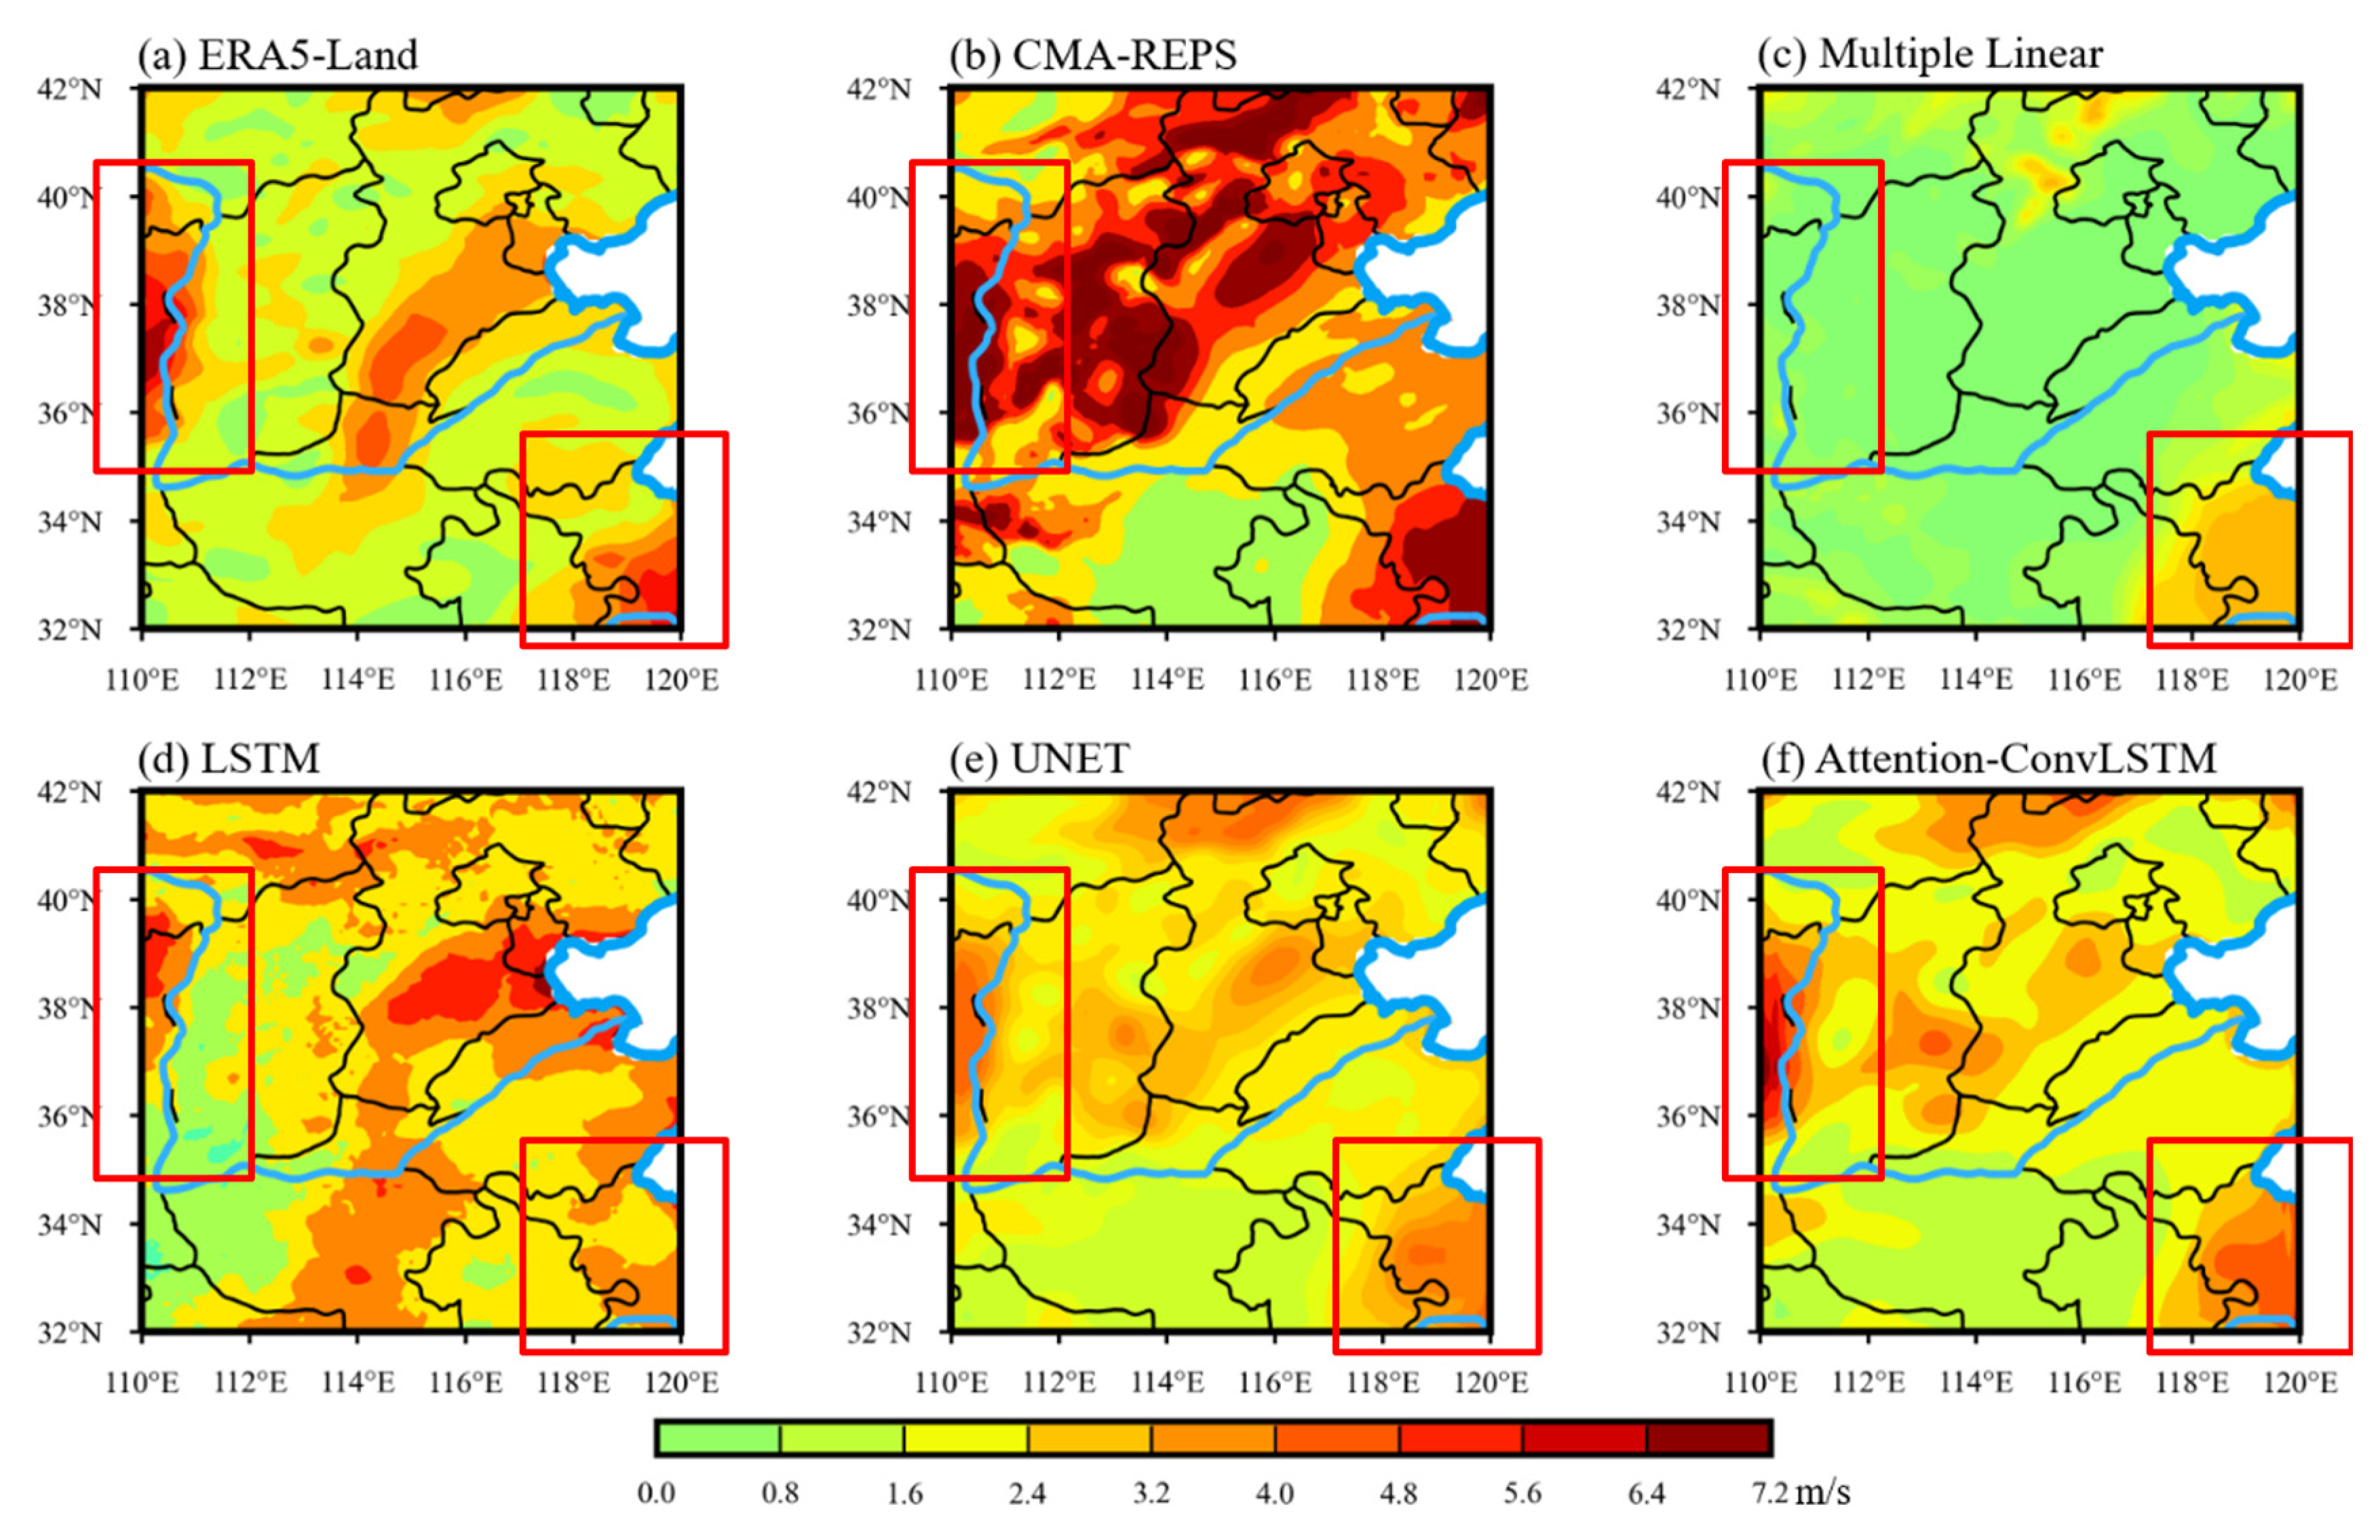
Figure 14 shows an example analysis of the correction of bias in 10 w forecast data, which corresponds to the 10 w correction result of the 24 h forecast reported from 00:00 on 25 March 2022. It can be seen from Figure 14 that the ensemble average results of CMA–REPS (Figure 14b) are relatively large as a whole, especially in the red-box-selected part of the figure, including the mountainous areas and eastern and southeastern coastal areas of the study area. The forecast results corrected by the multiple linear regression method (Figure 14c) are significantly smaller than the actual ERA5-Land data (Figure 14a) as a whole. The three correction models based on deep learning have achieved positive correction effects, and the 10 w prediction data corrected by the U-net model (Figure 14e) and Attention-ConvLSTM model (Figure 14f) are closer to the actual data. Compared with the U-net model, the Attention-ConvLSTM model integrating multiple factors and spatio-temporal features has further improved the correction effect of 10 w forecast data, which is specifically manifested in the western plateau and southeast of the study area.
4. Conclusions
Aiming to solve the problem of the correction of bias in grid point forecast data of wind fields predicted by numerical ensemble, this study conducted correction experiments on the 10 m near-surface wind field data (10 u, 10 v, 10 w) predicted by CMA–REPS based on the deep learning method. Considering that the grid forecast data have the dual characteristics of space and time, this paper proposes a new ensemble numerical forecast wind field correction model based on the ConvLSTM unit and attention mechanism, which integrates multiple factors and spatio-temporal features. Taking the RMSE and MAE as test indexes, the ensemble numerical prediction correction experiment, evaluation test, and comparative analysis of different method models were carried out. The main conclusions are as follows:
The correction method based on deep learning can significantly improve the accuracy of near-surface wind field prediction data of CMA–REPS, making it closer to the real data of ERA5. Compared with the LSTM model, the UNET model and the model we propose in this paper are better than the LSTM method in terms of RMSE score and MAE score performance, and the revised data have a better prediction effect on the whole. This shows that the ability of the model to extract spatial features is crucial to improve the correction ability of the model. Due to the ability to extract the temporal characteristics of CMA–REPS forecast data, our model has further improved the RMSE and MAE score performance of the revised data compared with the UNET method. Moreover, the integration of the spatial attention module makes the correction effect of our model significantly better than that of the UNET model in complex terrain areas.
However, there are still some shortcomings in the experimental content, so we still have large room for improvement. Due to the limitation of available meteorological element data for the CMA–REPS forecast, in our study, we only used 2 m temperature forecast data to compensate for model correction training on the basis of 10 m near-surface wind field data predicted by CMA–REPS. Under the constraints of the conceptual model of “atmospheric physical mechanism interpretable”, more relevant meteorological elements and other key factors can be added to the model training to further improve the wind field correction effect of the model for numerical ensemble forecast. At the same time, multi-source data such as terrain data can also be added to the model to ascertain the multi-modal deep learning wind field correction model for numerical ensemble prediction. Due to the limitation of the computing performance of hardware equipment, we only revised the near-surface wind field data of CMA–REPS in North China. In the future, with the improvement in hardware computing power, we can expand the prediction range and resolution of grid forecast data and study the numerical weather forecast wind speed correction model applicable to China.
Author Contributions
Conceptualization, M.C.; methodology, H.Y.; software, K.X.; validation, M.C. and C.C.; formal analysis, M.C. and B.M.; investigation, H.Y.; resources, H.Y.; data curation, B.M.; writing—original draft preparation, B.M.; writing—review and editing, M.C.; visualization, Y.D.; supervision, H.Y.; project administration, M.C.; funding acquisition, C.C. and H.Y. All authors have read and agreed to the published version of the manuscript.
Funding
This work was supported by the National Key Research and Development Program of China (grant No. 2021YFC3000902), the Technology Program of Sichuan Province (grant No. 2022YFS0542), and Smart Gridded Forecast Innovation Team Fund of Sichuan Meteorological Administration.
Institutional Review Board Statement
Not applicable.
Informed Consent Statement
Not applicable.
Data Availability Statement
Not applicable.
Conflicts of Interest
The authors declare no conflict of interest.
References
- Deng, Y.; Wang, B.; Lu, Z. A Hybrid Model Based on Data Preprocessing Strategy and Error Correction System for Wind Speed Forecasting. Energy Convers. Manag. 2020, 212, 112779. [Google Scholar] [CrossRef]
- Coiffier, J. Fundamentals of Numerical Weather Prediction; Cambridge University Press: Cambridge, UK, 2011. [Google Scholar]
- Du, J.; Chen, J. The Corner Stone in Facilitating the Transition from Deterministic to Probabilistic Forecasts-Ensemble Forecasting and Its Impact on Numerical Weather Prediction. Meteor Mon. 2010, 36, 1–11. (In Chinese) [Google Scholar]
- Wang, T.W.; Chen, D.H. A Brief Overview of Ensemble Forecasts. Meteor Res. Appl. 2007, 1, 6–12+24. (In Chinese) [Google Scholar]
- Dai, K.; Zhu, Y.J.; Bi, B.G. The review of statistical post-process technologies for quantitative precipitation forecast of ensemble prediction system. Acta Meteorol. Sin. 2018, 76, 493–510. [Google Scholar] [CrossRef]
- Su, X.; Yuan, H.L. The Research Progress of Ensemble Statistical Postprocessing Methods. Adv. Meteor Sci. Technol. 2020, 10, 30–41. (In Chinese) [Google Scholar]
- Ren, C.C.; Duan, M.K. Calibration and inconsistency analysis of ECMWF wind speed ensemble forecasts. Trans. Atmos Sci. 2019, 42, 360–369. (In Chinese) [Google Scholar]
- Thorarinsdottir, T.L.; Gneiting, T. Probabilistic Forecasts of Wind Speed: Ensemble Model Output Statistics by Using Heteroscedastic Censored Regression. J. R. Stat. Soc. Ser. A Stat. Soc. 2010, 173, 371–388. [Google Scholar] [CrossRef]
- Gneiting, T.; Raftery, A.E.; Westveld, A.H.; Goldman, T. Calibrated Probabilistic Forecasting Using Ensemble Model Output Statistics and Minimum CRPS Estimation. Mon. Weather Rev. 2005, 133, 1098–1118. [Google Scholar] [CrossRef]
- Bao, L.; Gneiting, T.; Grimit, E.P.; Guttorp, P.; Raftery, A.E. Bias Correction and Bayesian Model Averaging for Ensemble Forecasts of Surface Wind Direction. Mon. Weather Rev. 2010, 138, 1811–1821. [Google Scholar] [CrossRef]
- Baran, S. Probabilistic Wind Speed Forecasting Using Bayesian Model Averaging with Truncated Normal Components. Comput. Stat. Data Anal. 2014, 75, 227–238. [Google Scholar] [CrossRef]
- Chmielecki, R.M.; Raftery, A.E. Probabilistic Visibility Forecasting Using Bayesian Model Averaging. Mon. Weather Rev. 2011, 139, 1626–1636. [Google Scholar] [CrossRef]
- Sloughter, J.M.; Gneiting, T.; Raftery, A.E. Probabilistic Wind Speed Forecasting Using Ensembles and Bayesian Model Averaging. J. Am. Stat. Assoc. 2010, 105, 25–35. [Google Scholar] [CrossRef]
- Taillardat, M.; Mestre, O.; Zamo, M.; Naveau, P. Calibrated Ensemble Forecasts Using Quantile Regression Forests and Ensemble Model Output Statistics. Mon. Weather Rev. 2016, 144, 2375–2393. [Google Scholar] [CrossRef]
- Sun, Q.D.; Jiao, R.L.; Xia, J.J.; Yan, Z.W.; Li, H.C.; Sun, J.H.; Wang, L.Z.; Liang, Z.M. Adjusting Wind Speed Prediction of Numerical Weather Forecast Model Based on Machine Learning Methods. Meteor Mon. 2019, 45, 426–436. (In Chinese) [Google Scholar]
- Rasp, S.; Lerch, S. Neural Networks for Postprocessing Ensemble Weather Forecasts. Mon. Weather Rev. 2018, 146, 3885–3900. [Google Scholar] [CrossRef]
- Grönquist, P.; Yao, C.; Ben-Nun, T.; Dryden, N.; Dueben, P.; Li, S.; Hoefler, T. Deep Learning for Post-Processing Ensemble Weather Forecasts. Philos. Trans. R. Soc. A 2021, 379, 20200092. [Google Scholar] [CrossRef] [PubMed]
- Han, L.; Chen, M.; Chen, K.; Chen, H.; Zhang, Y.; Lu, B.; Song, L.; Qin, R. A Deep Learning Method for Bias Correction of ECMWF 24–240 h Forecasts. Adv. Atmos. Sci. 2021, 38, 1444–1459. [Google Scholar] [CrossRef]
- Zhang, Y.; Chen, M.; Han, L.; Song, L.; Yang, L. Multi-element deep learning fusion correction method for numerical weather prediction. Acta Meteorol. Sin. 2022, 80, 153–167. [Google Scholar] [CrossRef]
- Huang, G.; Liu, Z.; Van Der Maaten, L.; Weinberger, K.Q. Densely Connected Convolutional Networks. In Proceedings of the IEEE Conference on Computer Vision and Pattern Recognition, Honolulu, HI, USA, 21–26 July 2017; pp. 4700–4708. [Google Scholar]
- Cao, Y.; Liu, L.; Dong, Y. Convolutional Long Short-Term Memory Two-Dimensional Bidirectional Graph Convolutional Network for Taxi Demand Prediction. Sustainability 2023, 15, 7903. [Google Scholar] [CrossRef]
- Shi, X.; Chen, Z.; Wang, H.; Yeung, D.Y.; Wong, W.K.; Woo, W.C. Convolutional LSTM Network: A Machine Learning Approach for Precipitation Nowcasting. In Proceedings of the Advances in Neural Information Processing Systems, Montreal, QC, Canada, 7–12 December 2015. [Google Scholar]
- Chou, C.; Park, J.; Chou, E. Generating High-Resolution Climate Change Projections Using Super-Resolution Convolutional LSTM Neural Networks. In Proceedings of the 2021 13th International Conference on Advanced Computational Intelligence (ICACI), Wanzhou, China, 14–16 May 2021; pp. 293–298. [Google Scholar] [CrossRef]
- Yang, X.; Zhang, J.; Zhou, J. Multi-source rainfall fusion method based on ConvLSTM network. J. Huazhong Univ. Sci. Technol. (Nat. Sci. Ed.) 2022, 50, 33–39. [Google Scholar] [CrossRef]
- Deng, F.; Chen, Z.; Liu, Y.; Yang, S.; Hao, R.; Lyu, L. A Novel Combination Neural Network Based on ConvLSTM-Transformer for Bearing Remaining Useful Life Prediction. Machines 2022, 10, 1226. [Google Scholar] [CrossRef]
- Vaswani, A.; Shazeer, N.; Parmar, N.; Uszkoreit, J.; Jones, L.; Gomez, A.N.; Kaiser, Ł.; Polosukhin, I. Attention Is All You Need. In Proceedings of the Advances in Neural Information Processing Systems, Long Beach, CA, USA, 4–9 December 2017; p. 30. [Google Scholar] [CrossRef]
- Tekin, S.F.; Karaahmetoglu, O.; Ilhan, F.; Balaban, I.; Kozat, S.S. Spatio-Temporal Weather Forecasting and Attention Mechanism on Convolutional Lstms. arXiv 2021, arXiv:2102.00696. [Google Scholar]
- Ronneberger, O.; Fischer, P.; Brox, T. U-Net: Convolutional Networks for Biomedical Image Segmentation. In Proceedings of the International Conference on Medical Image Computing and Computer-Assisted Intervention, Munich, Germany, 5–9 October 2015. [Google Scholar]
- Chen, J.; Li, X.L. The Review of 10 Years Development of the GRAPES Global/Regional Ensemble Prediction. Adv. Meteor Sci. Technol. 2020, 10, 9–18. (In Chinese) [Google Scholar]
- Shen, X.S.; Wang, J.J.; Li, Z.C.; Chen, D.H.; Gong, J.D. China’s independent and innovative development of numerical weather prediction. Acta Meteorol. Sin. 2020, 78, 451–476. [Google Scholar] [CrossRef]
- Wang, J.; Chen, J.; Zhuang, Z.; Zhang, H.; Wang, J. Characteristics of Initial Perturbation Growth Rate in the Regional Ensemble Prediction System of GRAPES. Chin. J. Atmos. Sci. 2018, 42, 367–382. [Google Scholar] [CrossRef]
- Yuan, Y.; Li, X.L.; Chen, J.; Xia, Y. Stochastic Parameterization Toward Model Uncertainty for the GRAPES Mesoscale Ensemble Prediction System. Meteor Mon. 2016, 42, 1161–1175. (In Chinese) [Google Scholar]
- Wang, J.Z.; Chen, F.J.; Chen, J.; Liu, X.Q.; Li, H.Q.; Deng, G.; Li, X.L.; Wang, Y.Z. Verification of GRAPES-REPS Model Precipitation Forecasts over China during 2019 Flood Season. Chin. J. Atmos. Sci. 2021, 45, 664–682. [Google Scholar] [CrossRef]
- Wu, Z.Q.; Zhang, J.; Chen, J.; Pang, B.; Xia, Y.; Chen, F.J. The study on the method of conditional typhoon vortex relocation for GRAPES regional ensemble prediction. Acta Meteorol. Sin. 2020, 78, 163–176. [Google Scholar] [CrossRef]
- Bauer, P.; Thorpe, A.; Brunet, G. The Quiet Revolution of Numerical Weather Prediction. Nature 2015, 525, 47–55. [Google Scholar] [CrossRef]
- Muñoz-Sabater, J.; Dutra, E.; Agustí-Panareda, A.; Albergel, C.; Arduini, G.; Balsamo, G.; Boussetta, S.; Choulga, M.; Harrigan, S.; Hersbach, H.; et al. ERA5-Land: A state-of-the-art global reanalysis dataset for land applications. Earth Syst. Sci. Data 2021, 13, 4349–4383. [Google Scholar] [CrossRef]
- Caron, J.L. On the suitability of BUFR and GRIB for archiving data. In AGU Fall Meeting Abstracts; American Geophysical Union: Washington, DC, USA, 2011; Volume 2011, p. IN53B-1619. [Google Scholar]
- Hu, D. An Introductory Survey on Attention Mechanisms in NLP Problems. In Proceedings of the SAI Intelligent Systems Conference, London, UK, 5–6 September 2019; pp. 432–448. [Google Scholar]
- Mnih, V.; Heess, N.; Graves, A. Recurrent Models of Visual Attention. In Proceedings of the Advances in Neural Information Processing Systems, Montreal, QC, Canada, 8–13 December 2014; p. 27. [Google Scholar] [CrossRef]
- Zhang, L.; Zhu, G.; Mei, L.; Shen, P.; Shah, S.A.; Bennamoun, M. Attention in convolutional LSTM for gesture recognition. In Proceedings of the Advances in Neural Information Processing Systems, Montreal, QC, Canada, 3–8 December 2018; p. 31. [Google Scholar]
- Woo, S.; Park, J.; Lee, J.-Y.; Kweon, I.S. Cbam: Convolutional Block Attention Module. In Proceedings of the European Conference on Computer Vision (ECCV), Munich, Germany, 8–14 September 2018; pp. 3–19. [Google Scholar]
- Kingma, D.P.; Ba, J. Adam: A Method for Stochastic Optimization. arXiv 2014, arXiv:1412.6980. [Google Scholar]
Figure 1.
The selected area in North China.
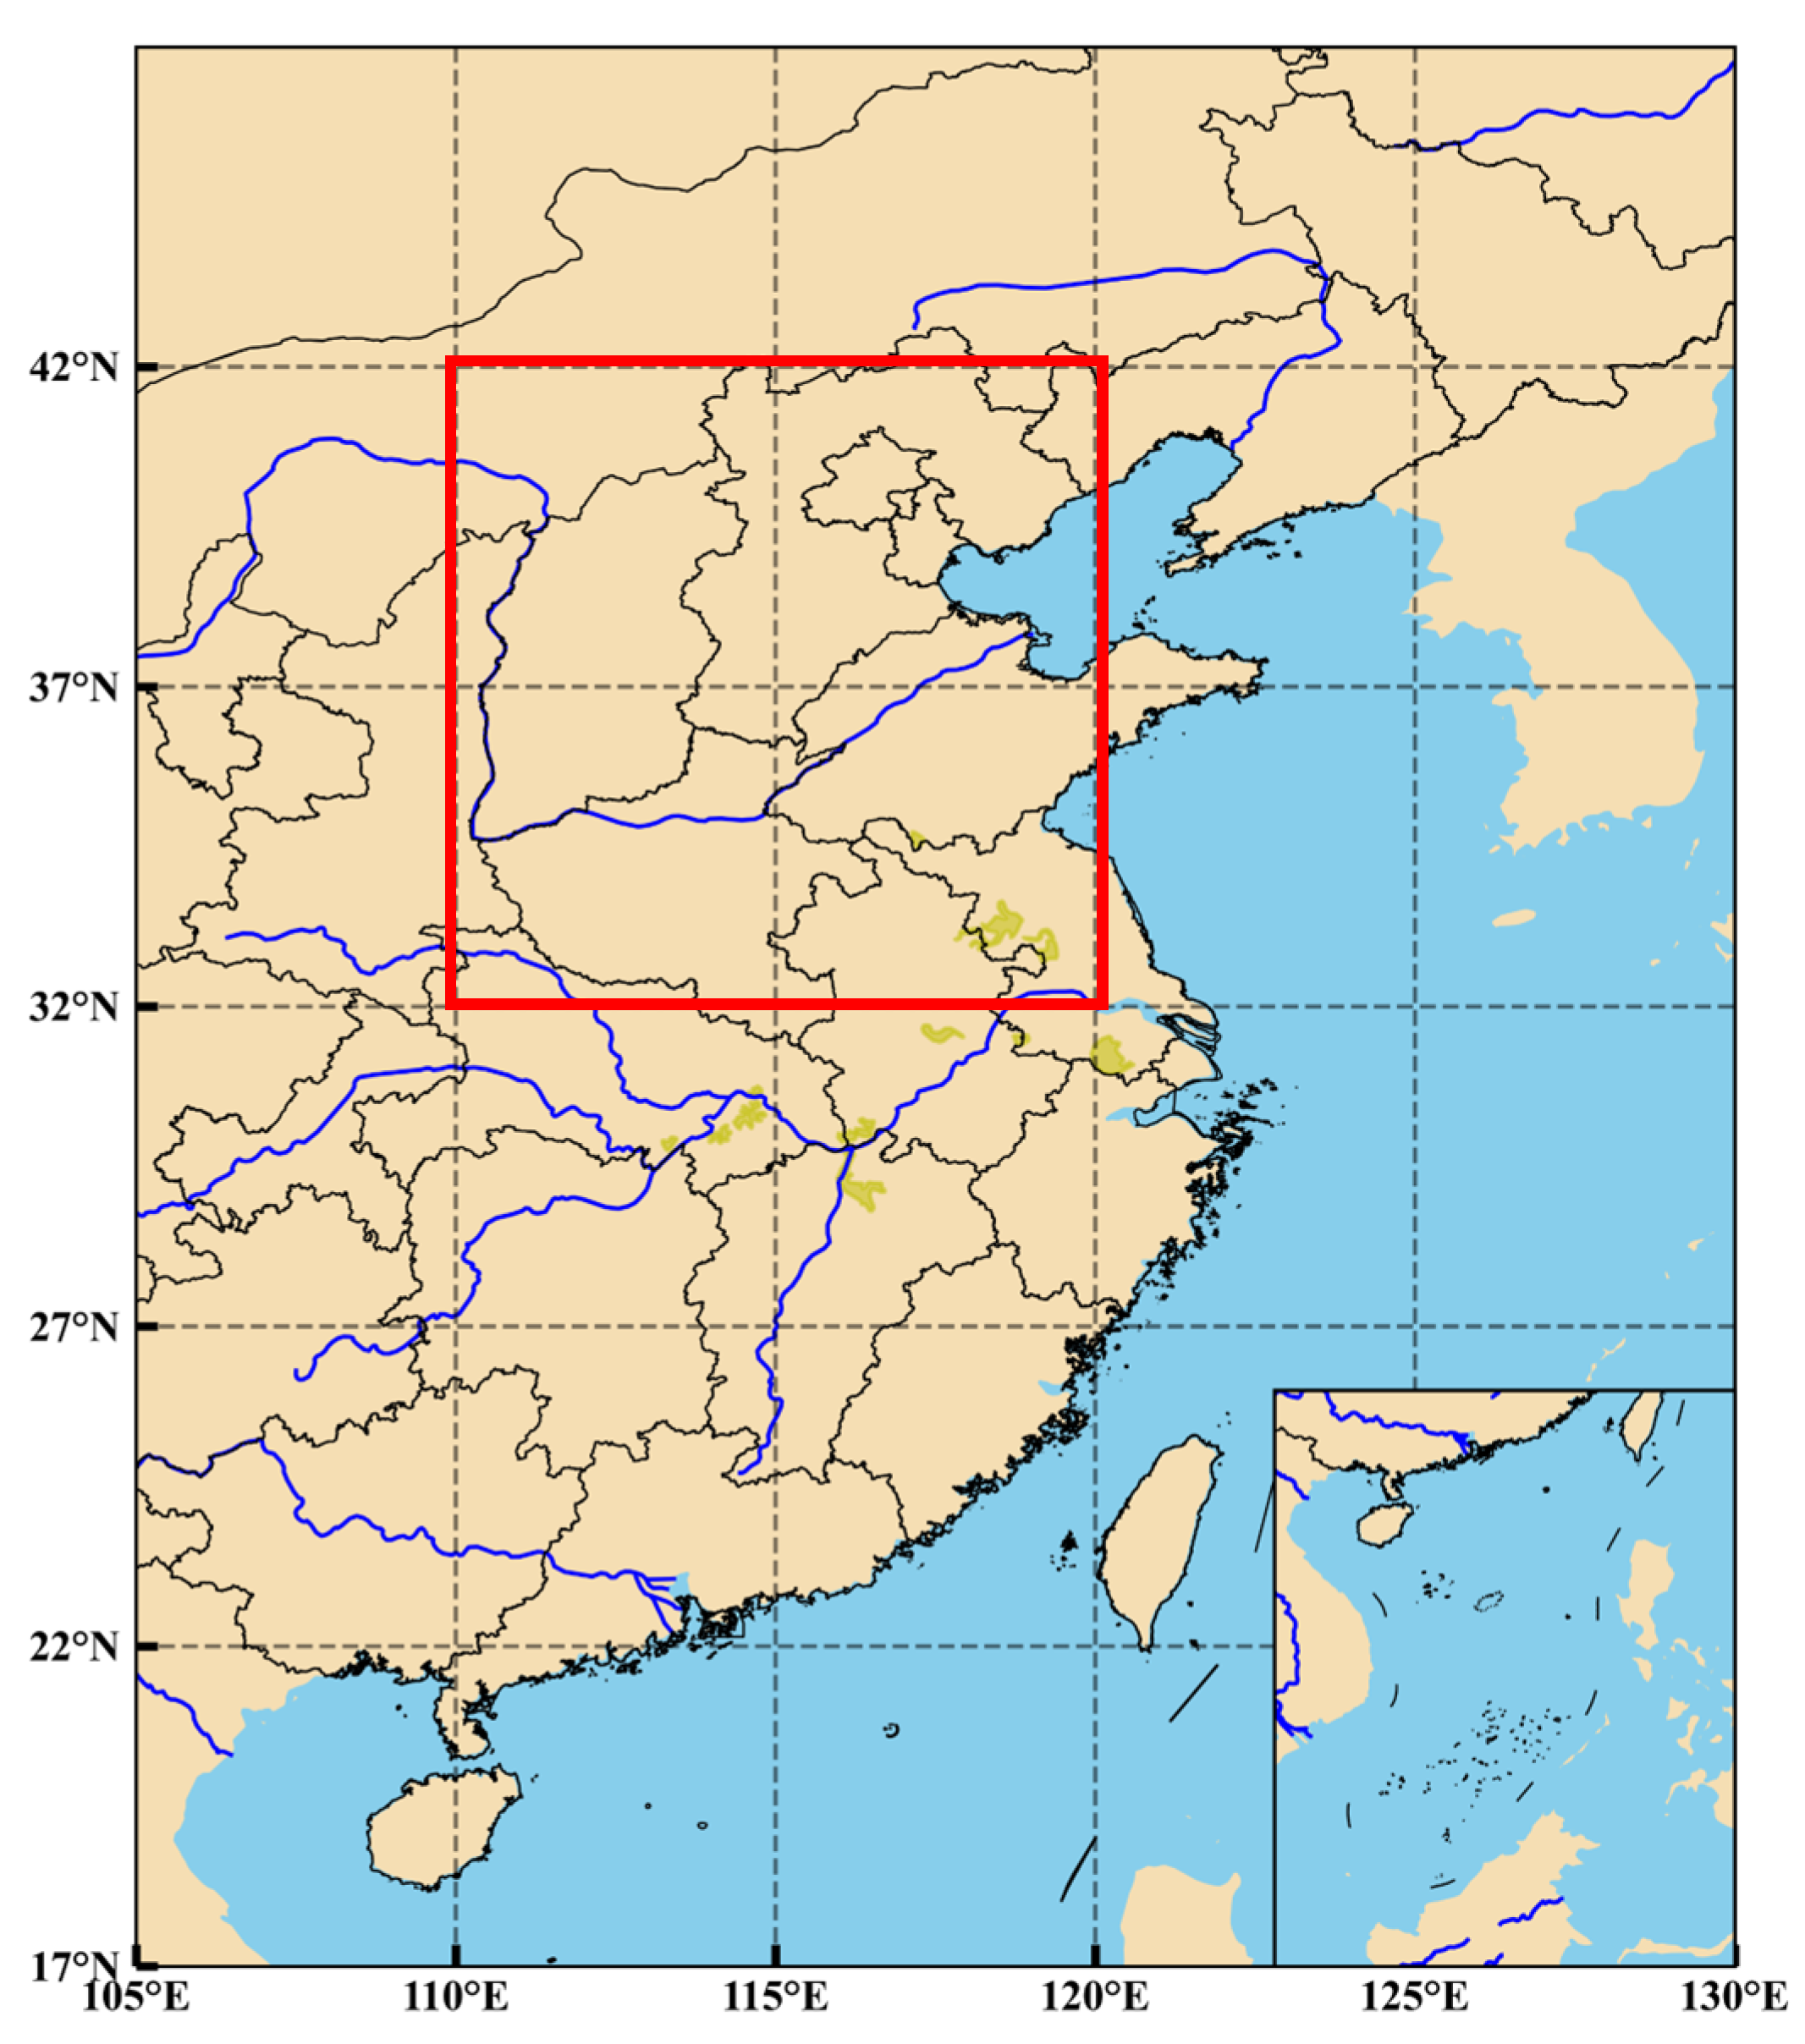
Figure 2.
Convolutional LSTM unit.

Figure 3.
Attention mechanism in ConvLSTM.
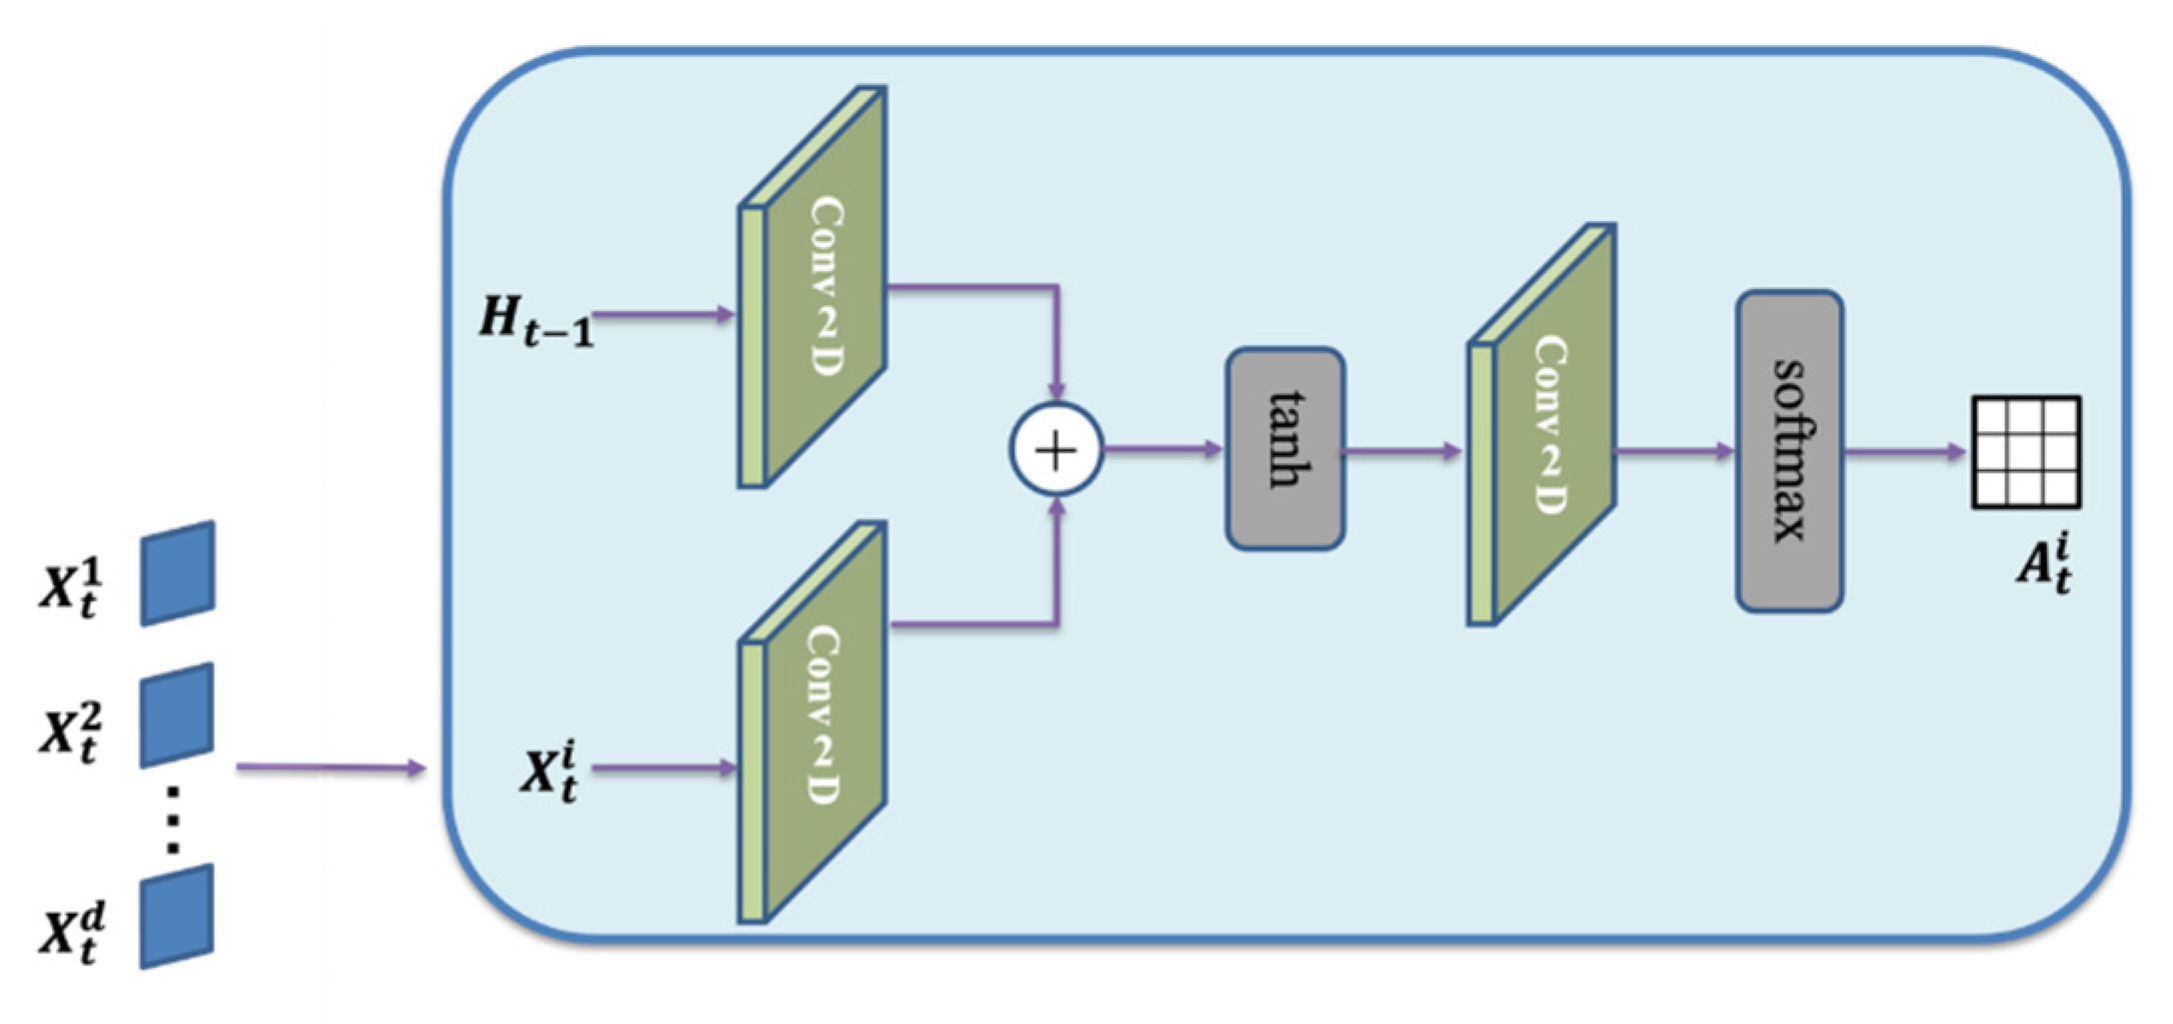
Figure 4.
Spatial attention module.
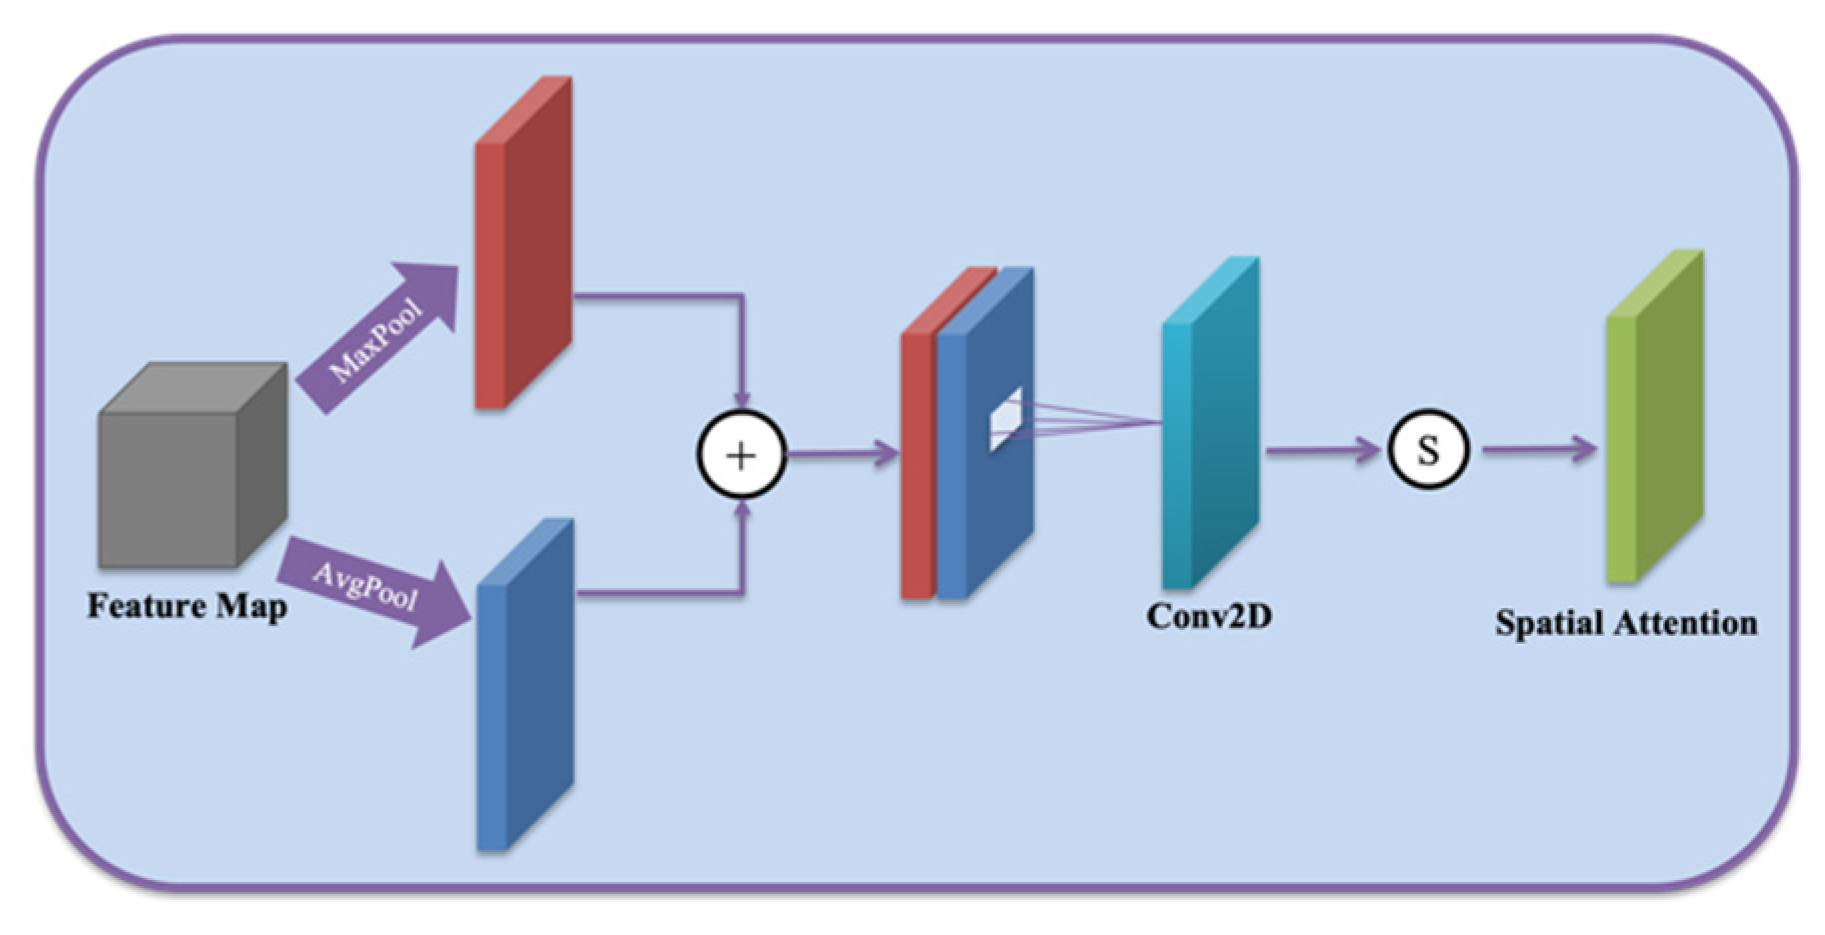
Figure 5.
Ensemble forecast wind field correction model fusing multiple factors and spatio-temporal characteristics.
Figure 5.
Ensemble forecast wind field correction model fusing multiple factors and spatio-temporal characteristics.
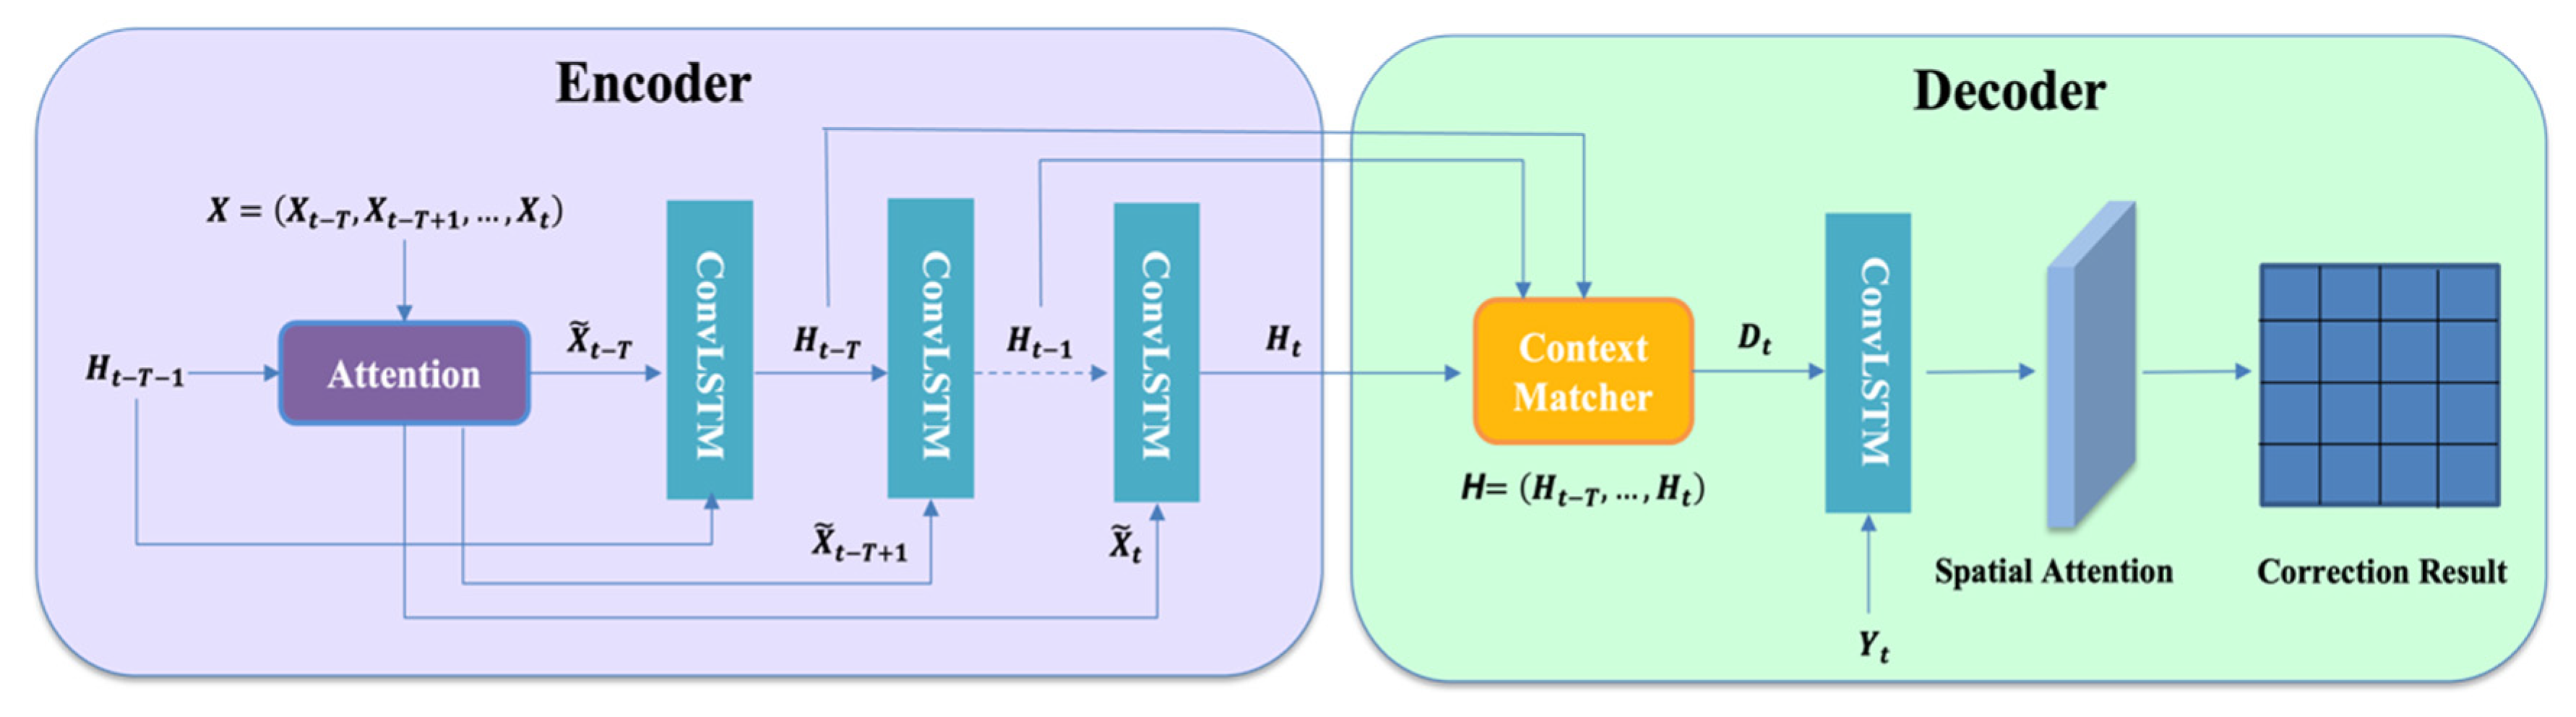
Figure 6.
Expansion of the encoder structure in the revised model fusing multi-feature and spatio-temporal features.
Figure 6.
Expansion of the encoder structure in the revised model fusing multi-feature and spatio-temporal features.
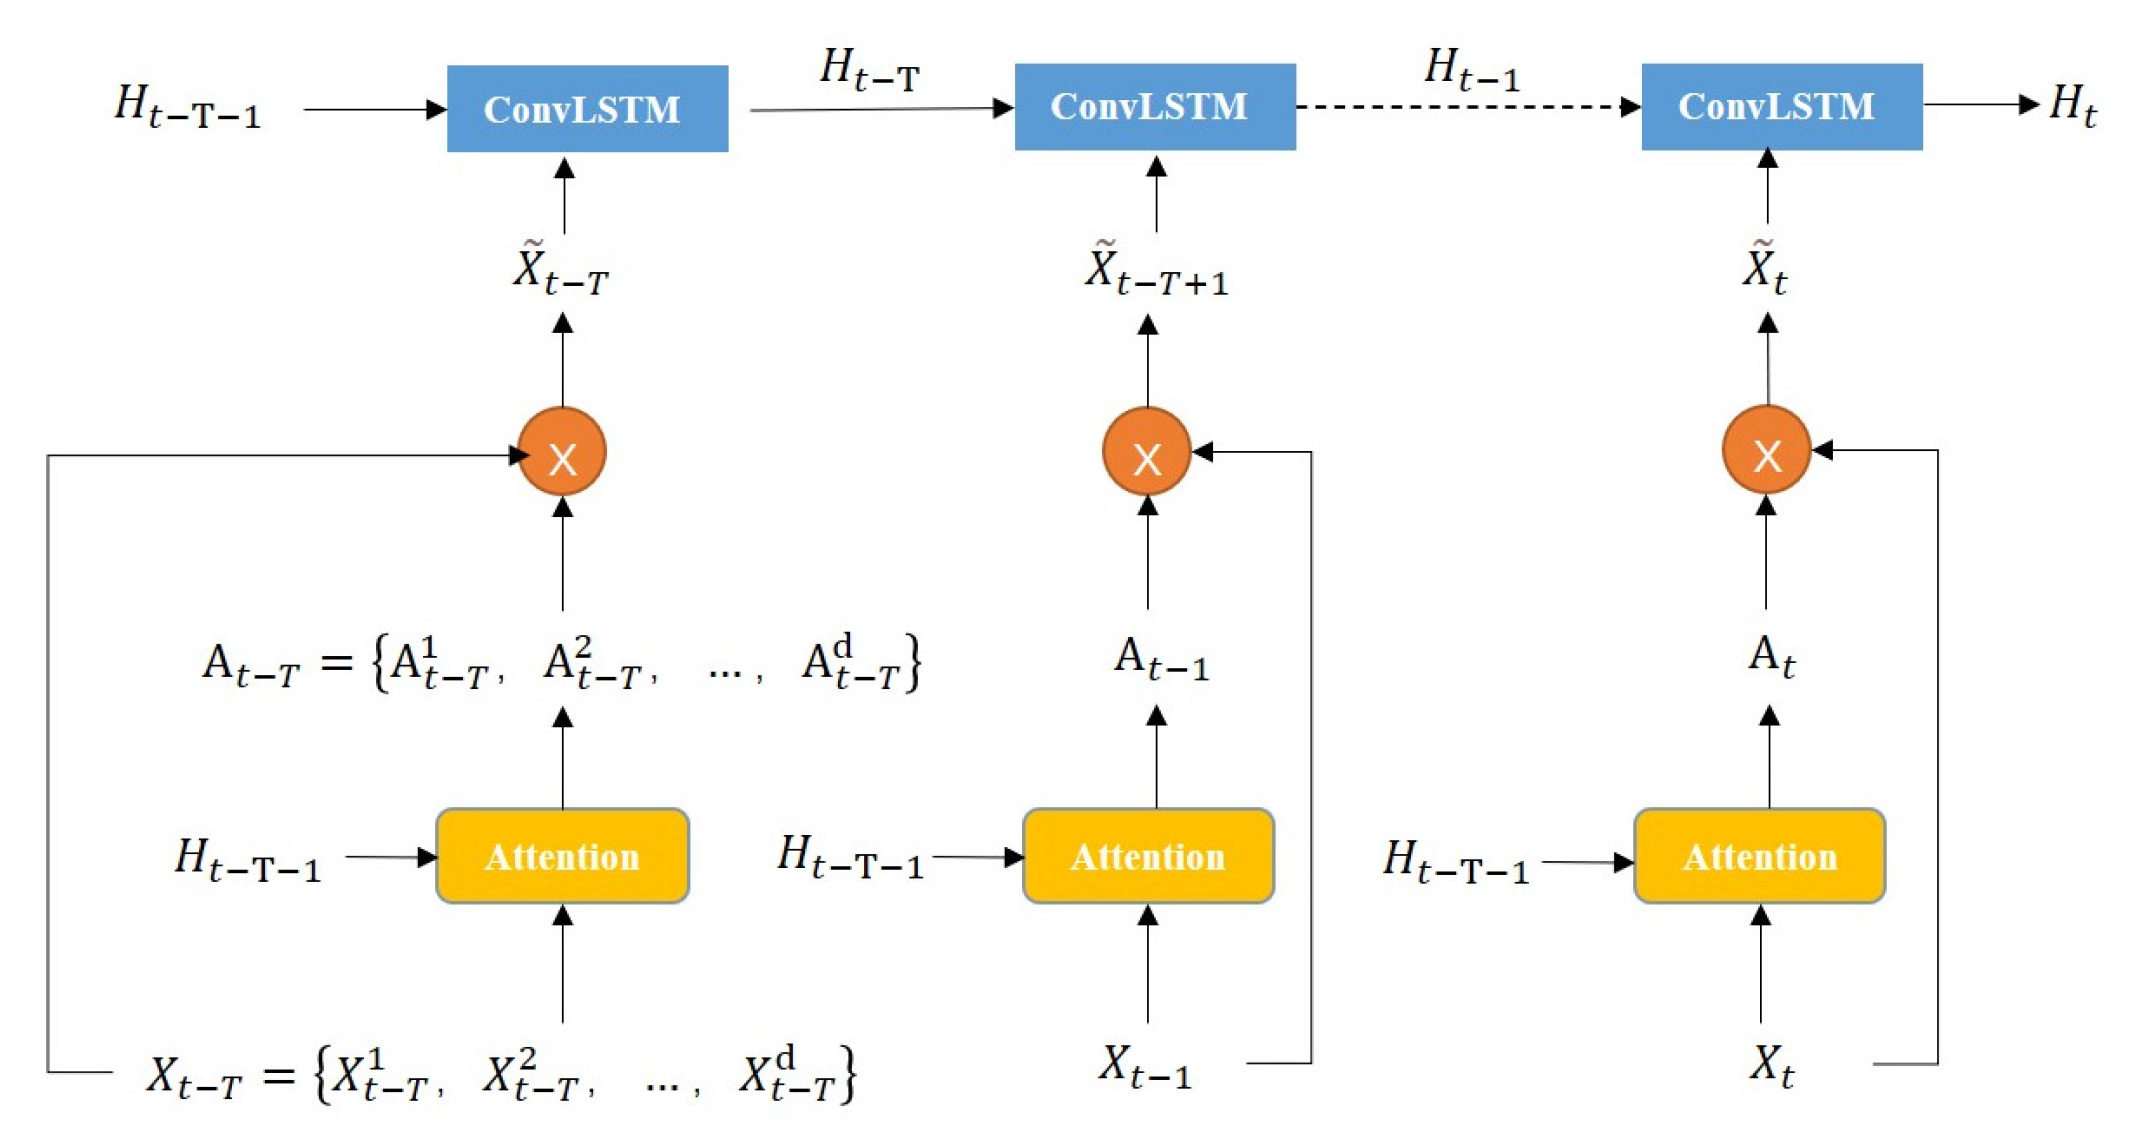
Figure 7.
Decoder expansion structure diagram in the revised model fusing multi-element and spatio-temporal features.
Figure 7.
Decoder expansion structure diagram in the revised model fusing multi-element and spatio-temporal features.
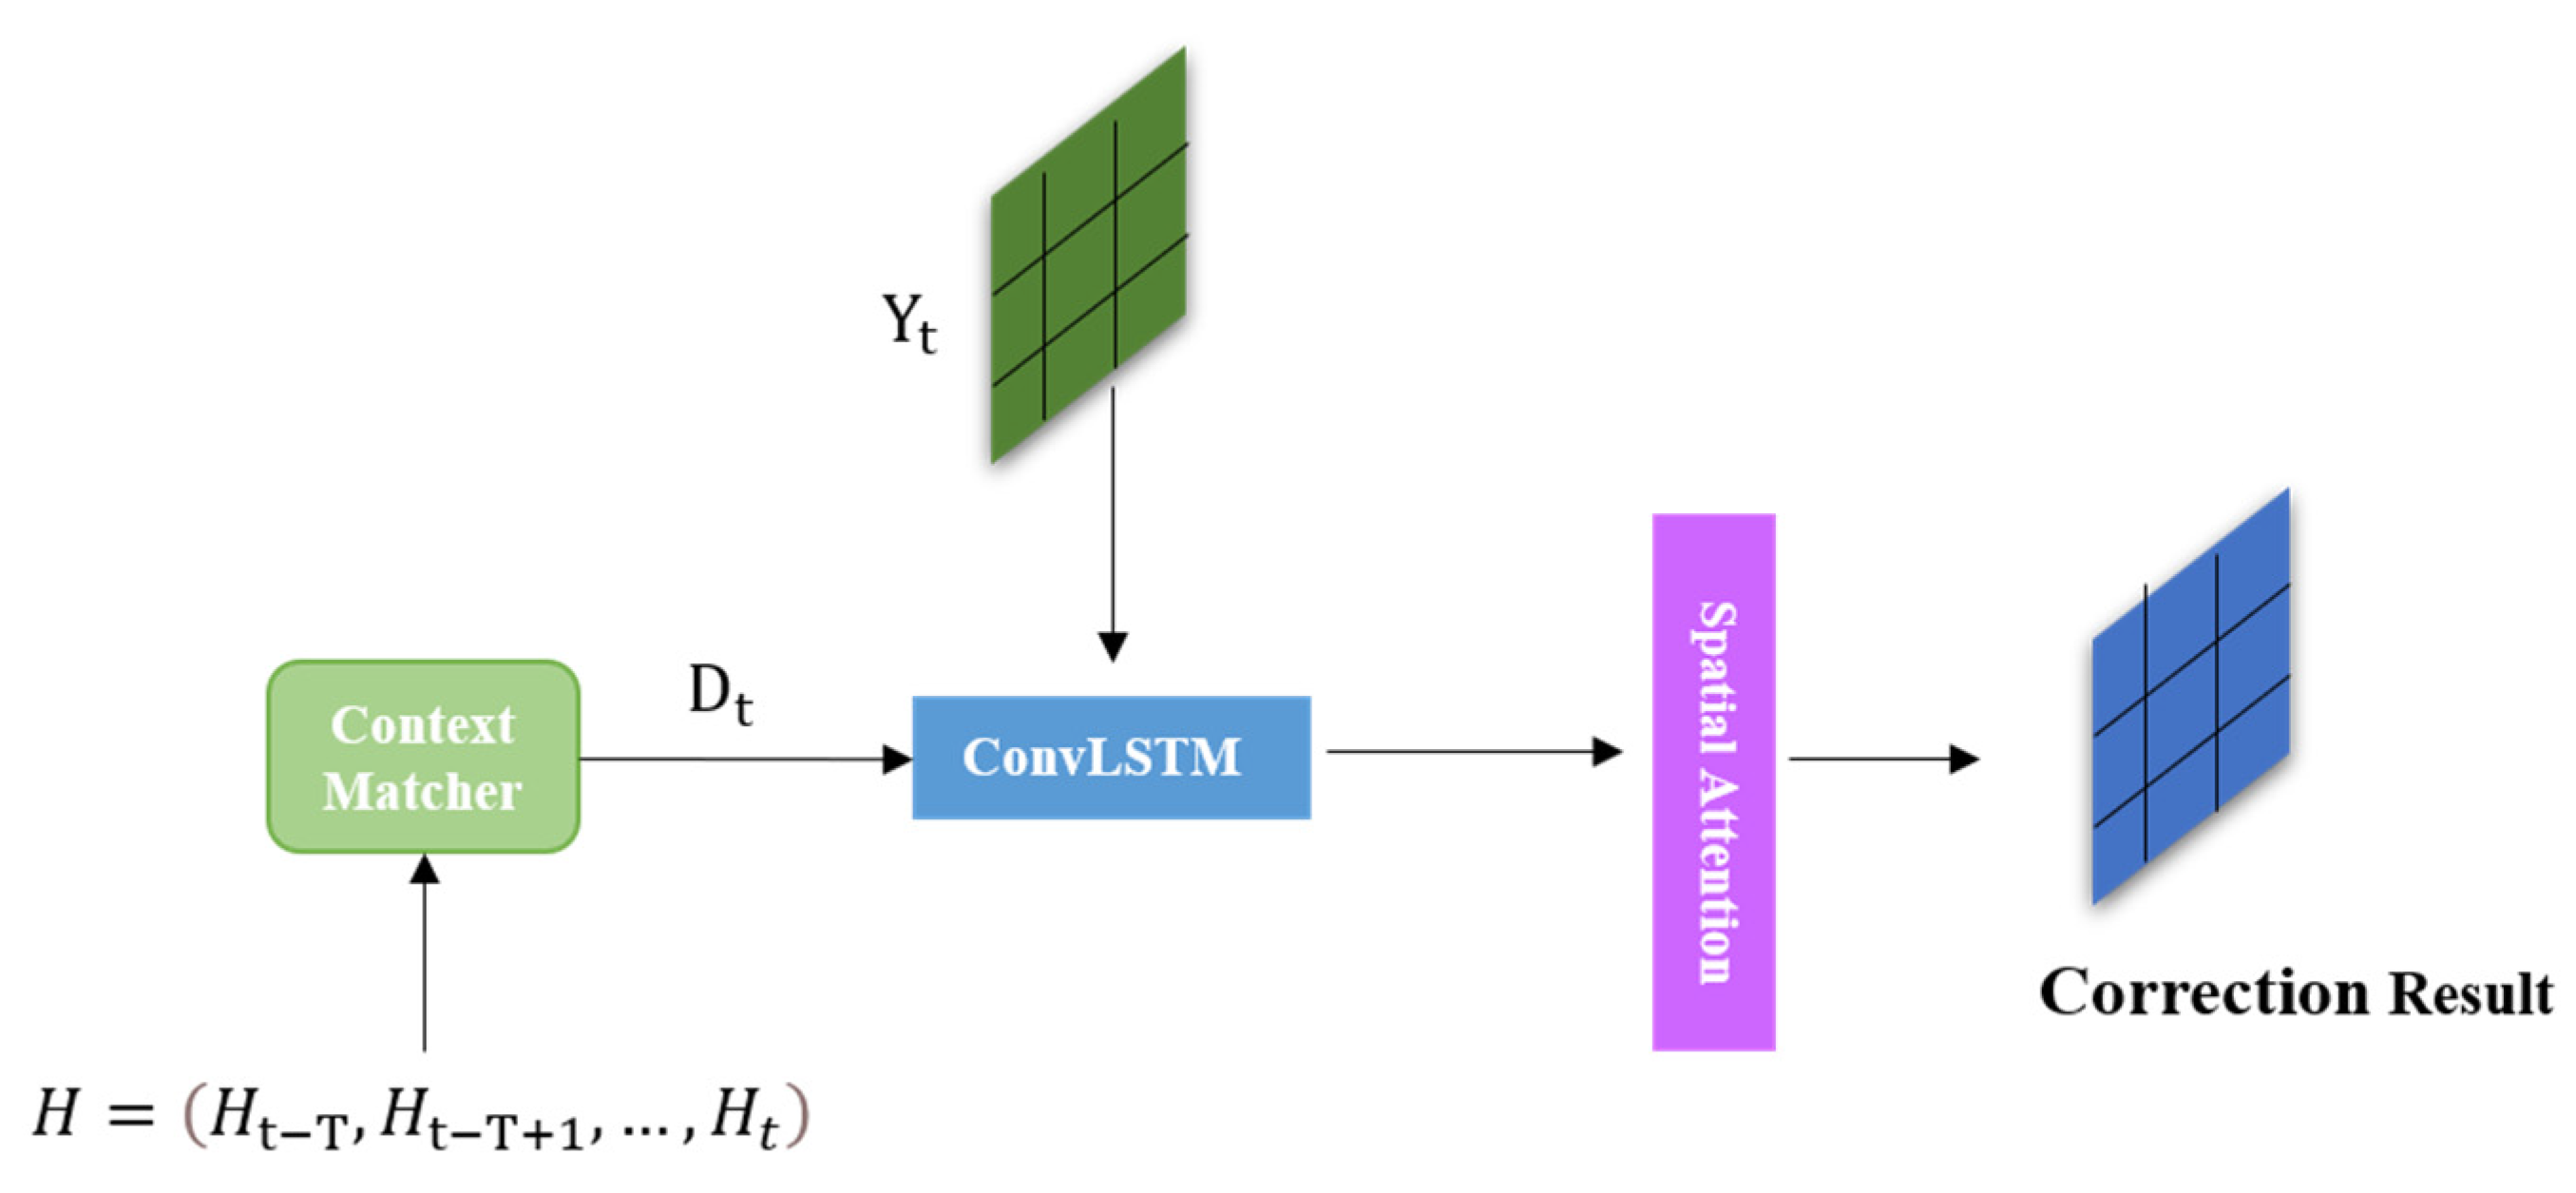
Figure 8.
Experimental setup.
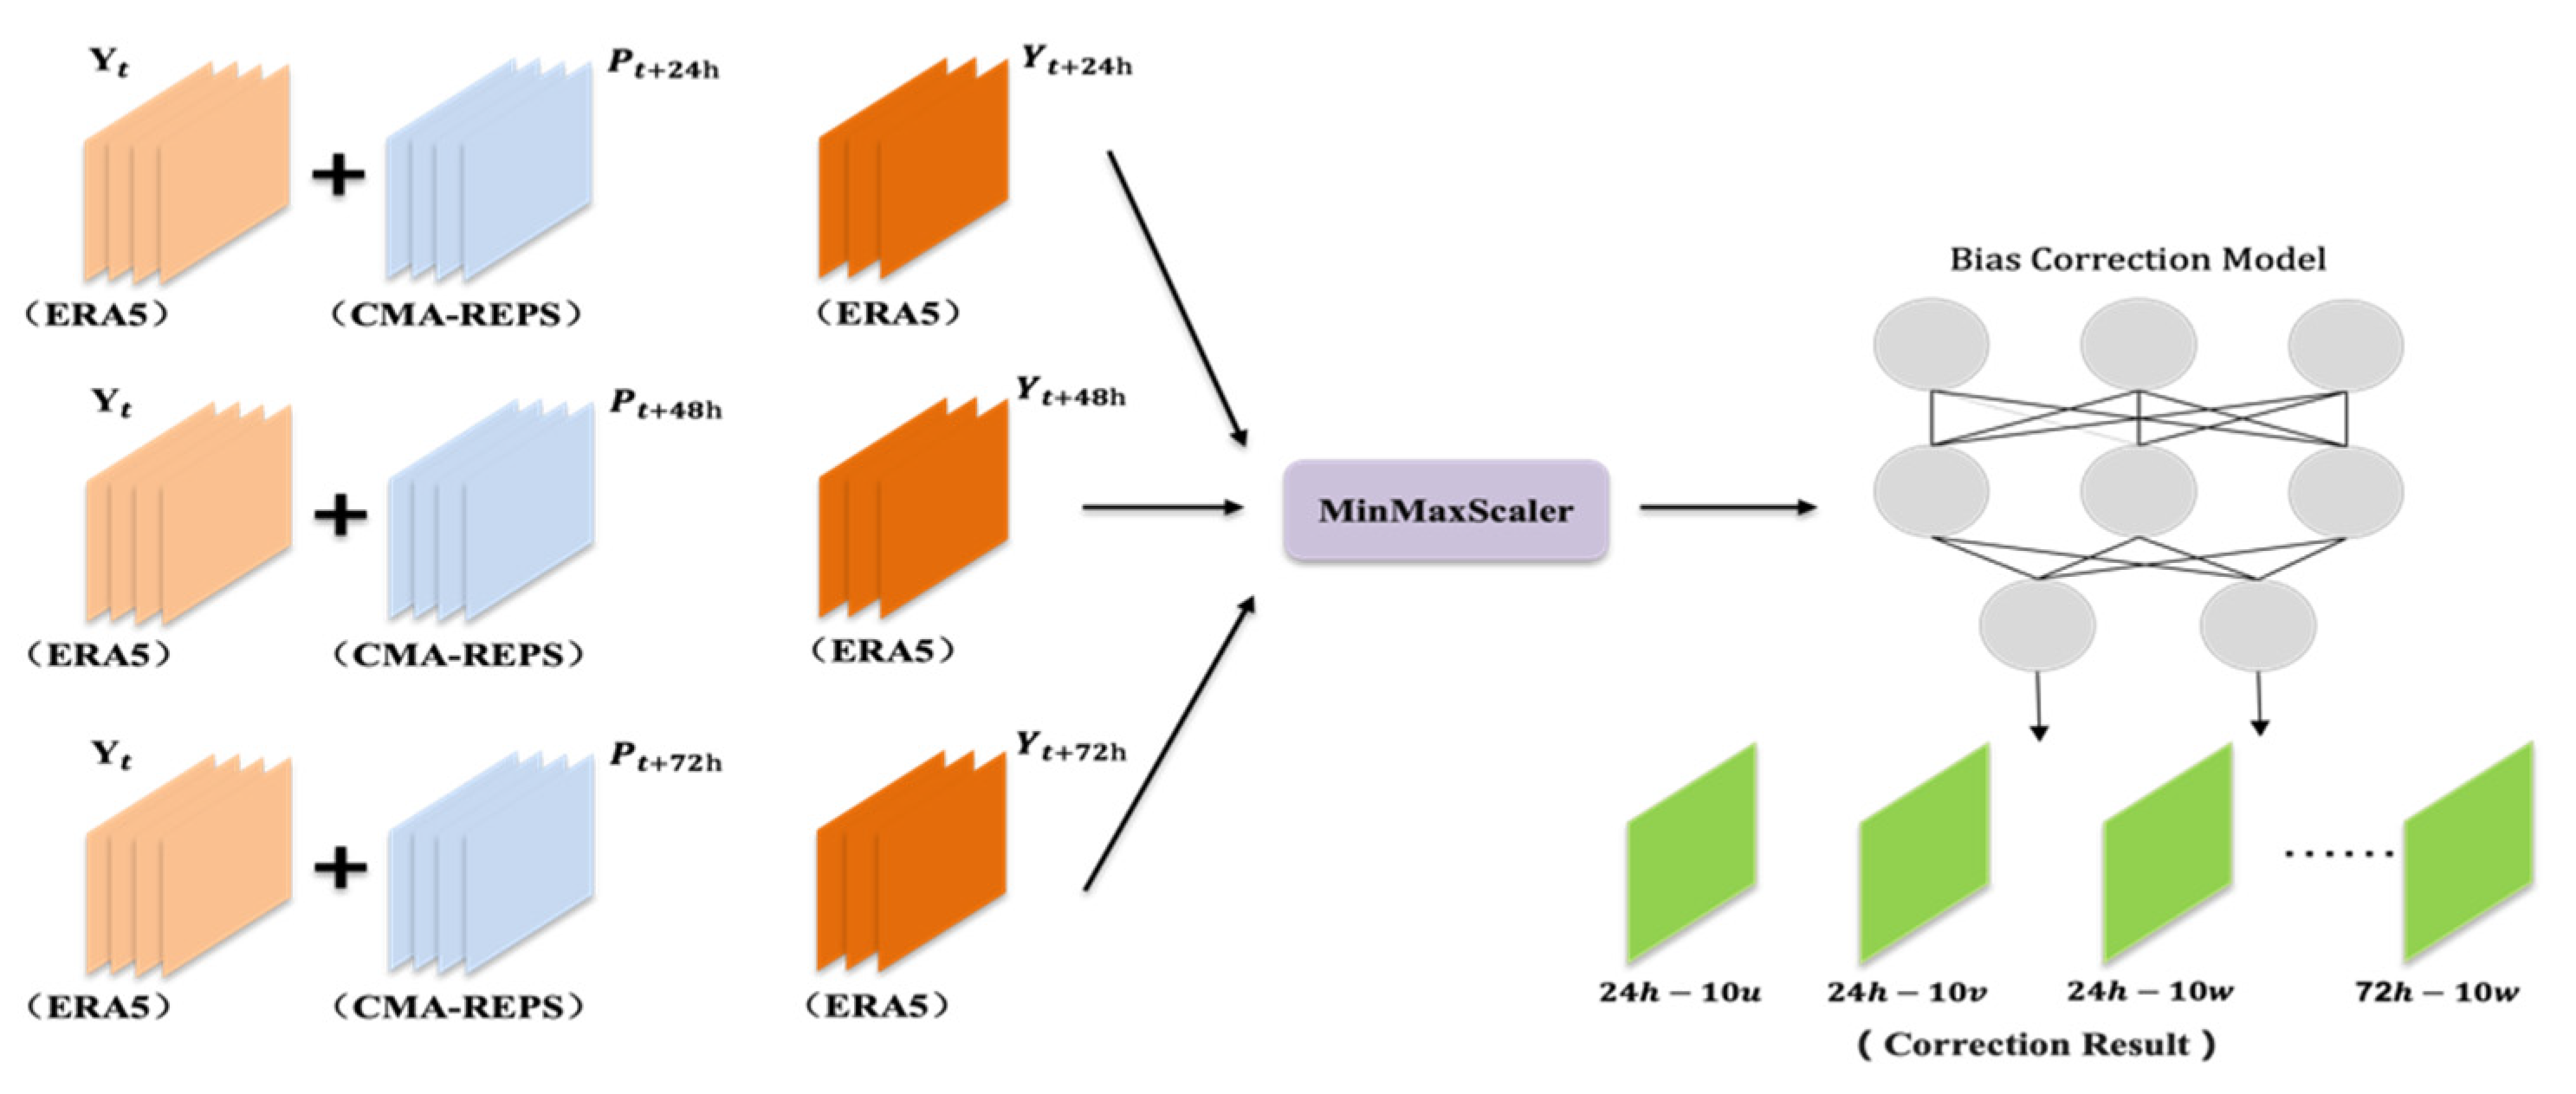
Figure 9.
Distribution curve of RMSE of 10 u correction results.
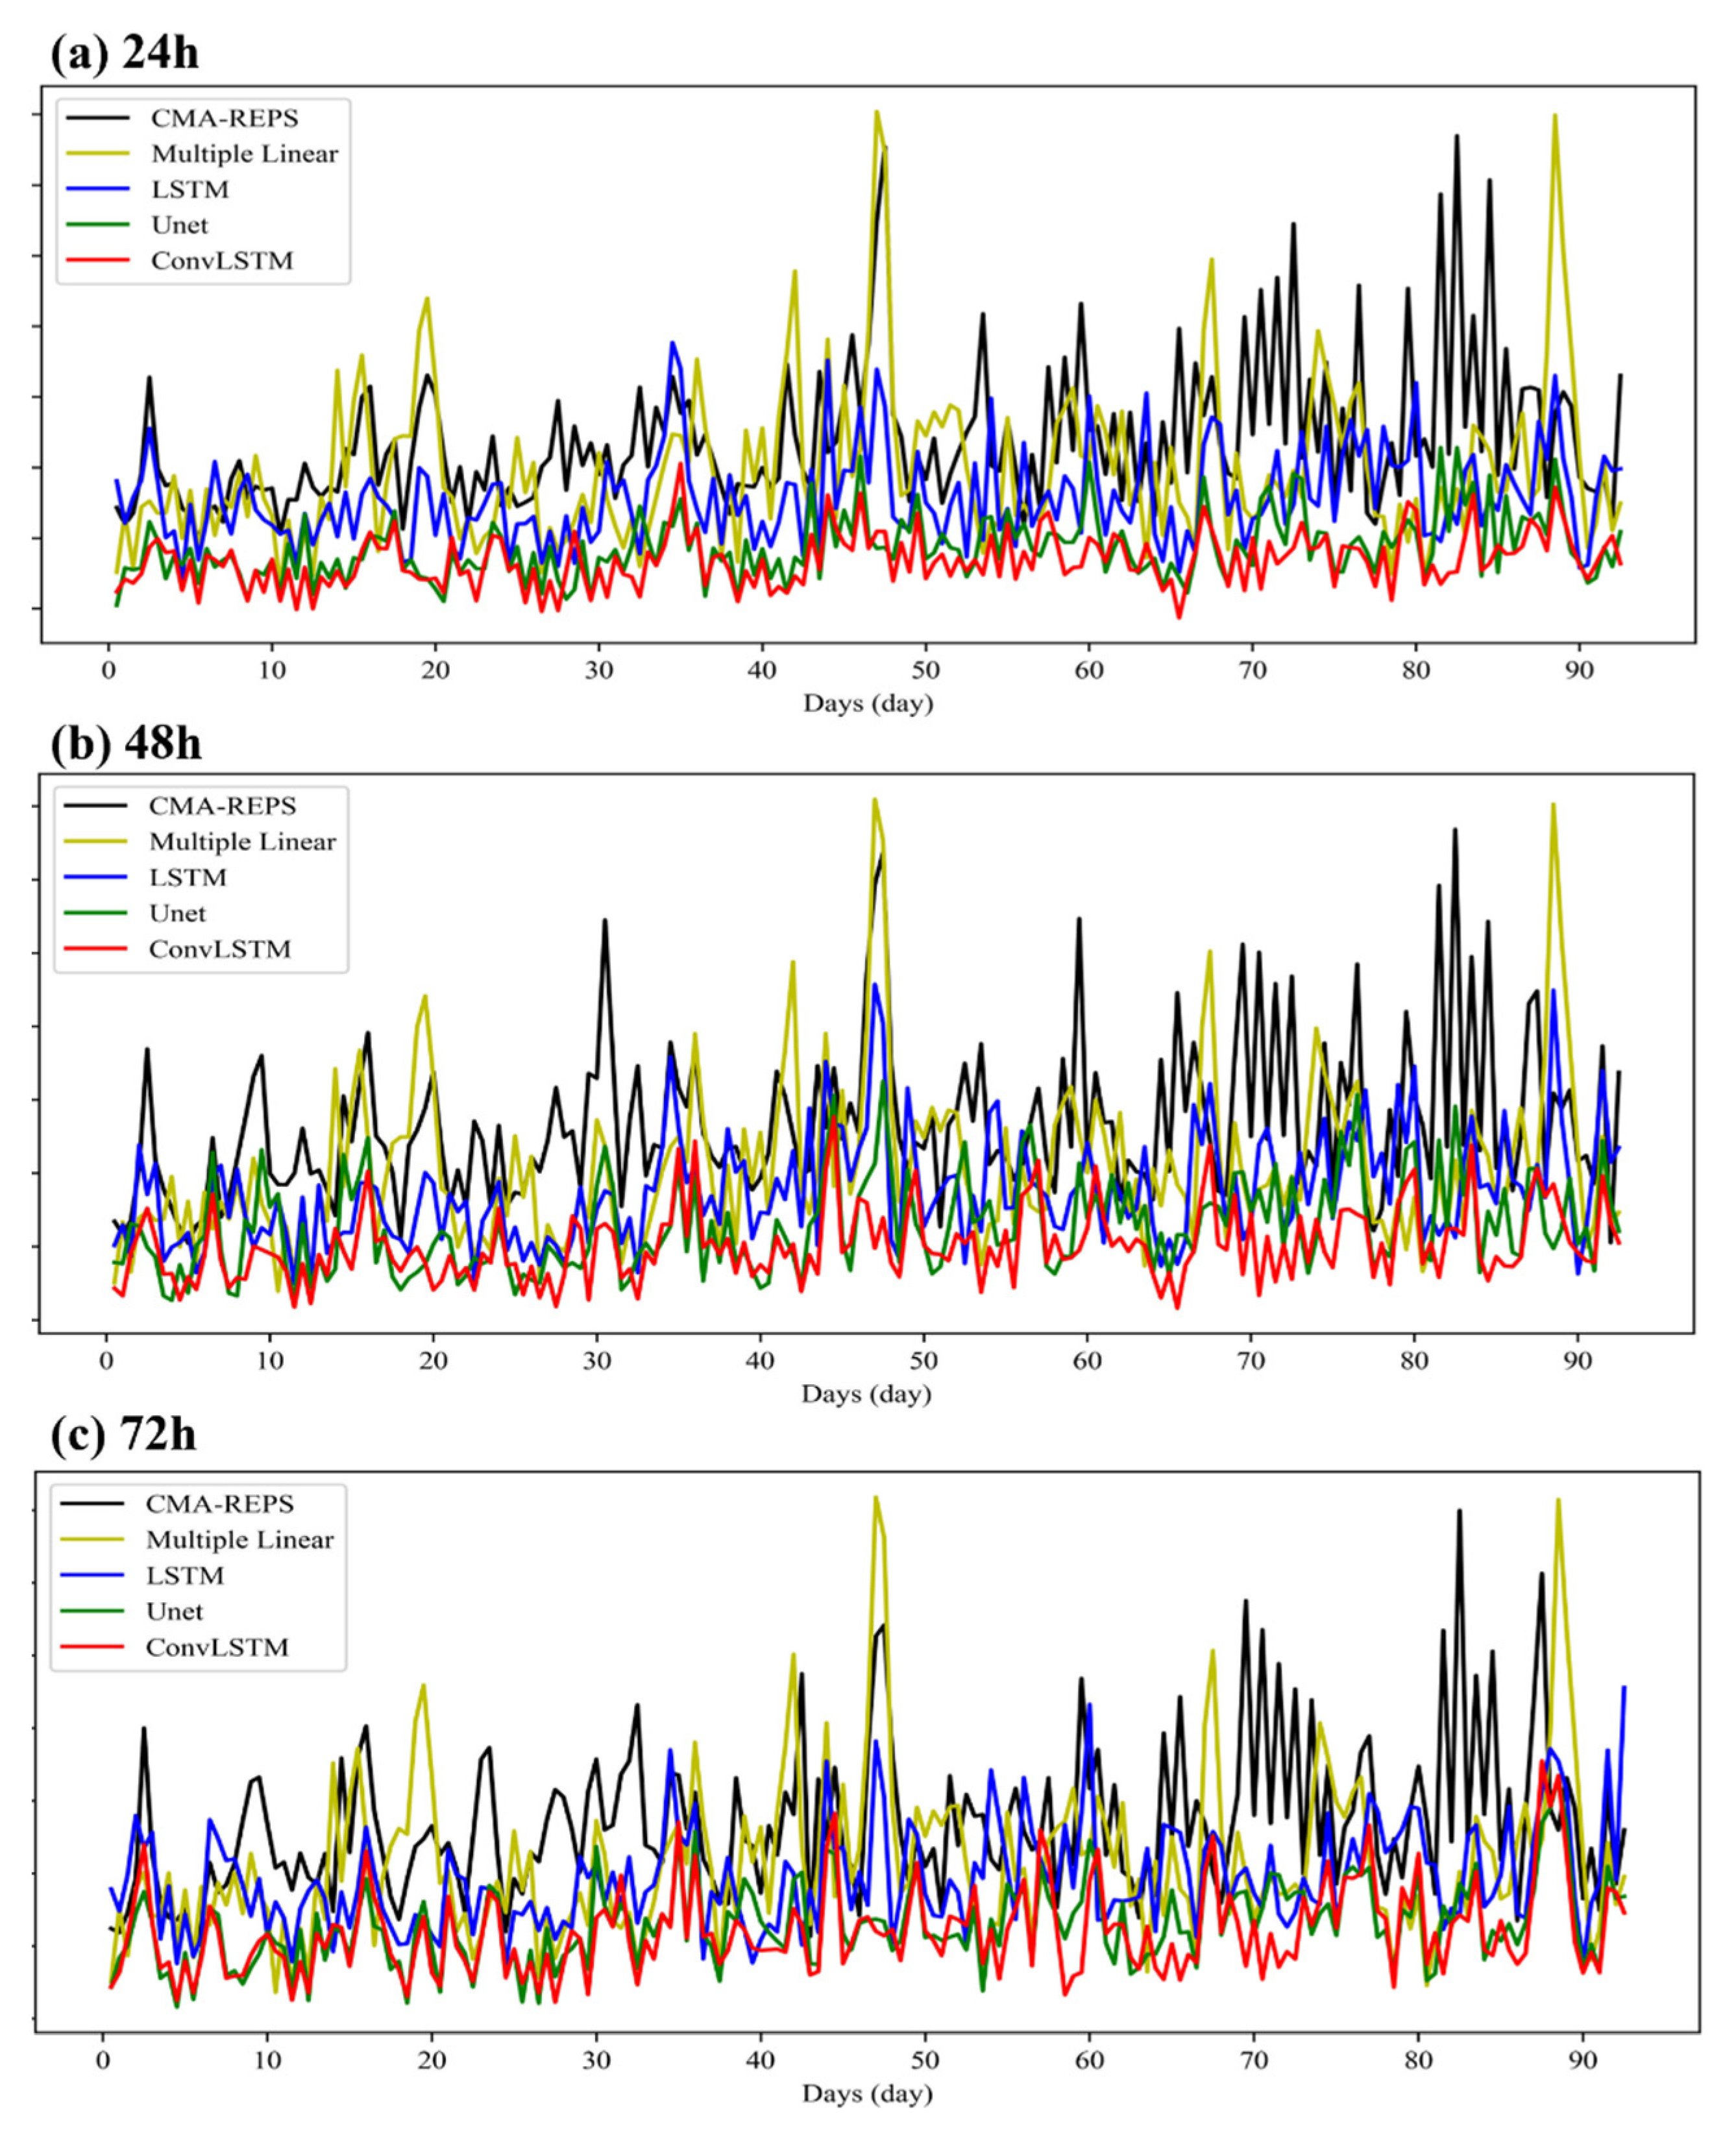
Figure 10.
Revised results of 24 h forecast 10 u at 00:00 on 4 April 2022.

Figure 11.
Distribution curve of RMSE of 10 v correction results.

Figure 12.
Revised results of 24 h forecast 10 v at 12:00 on 16 April 2022.
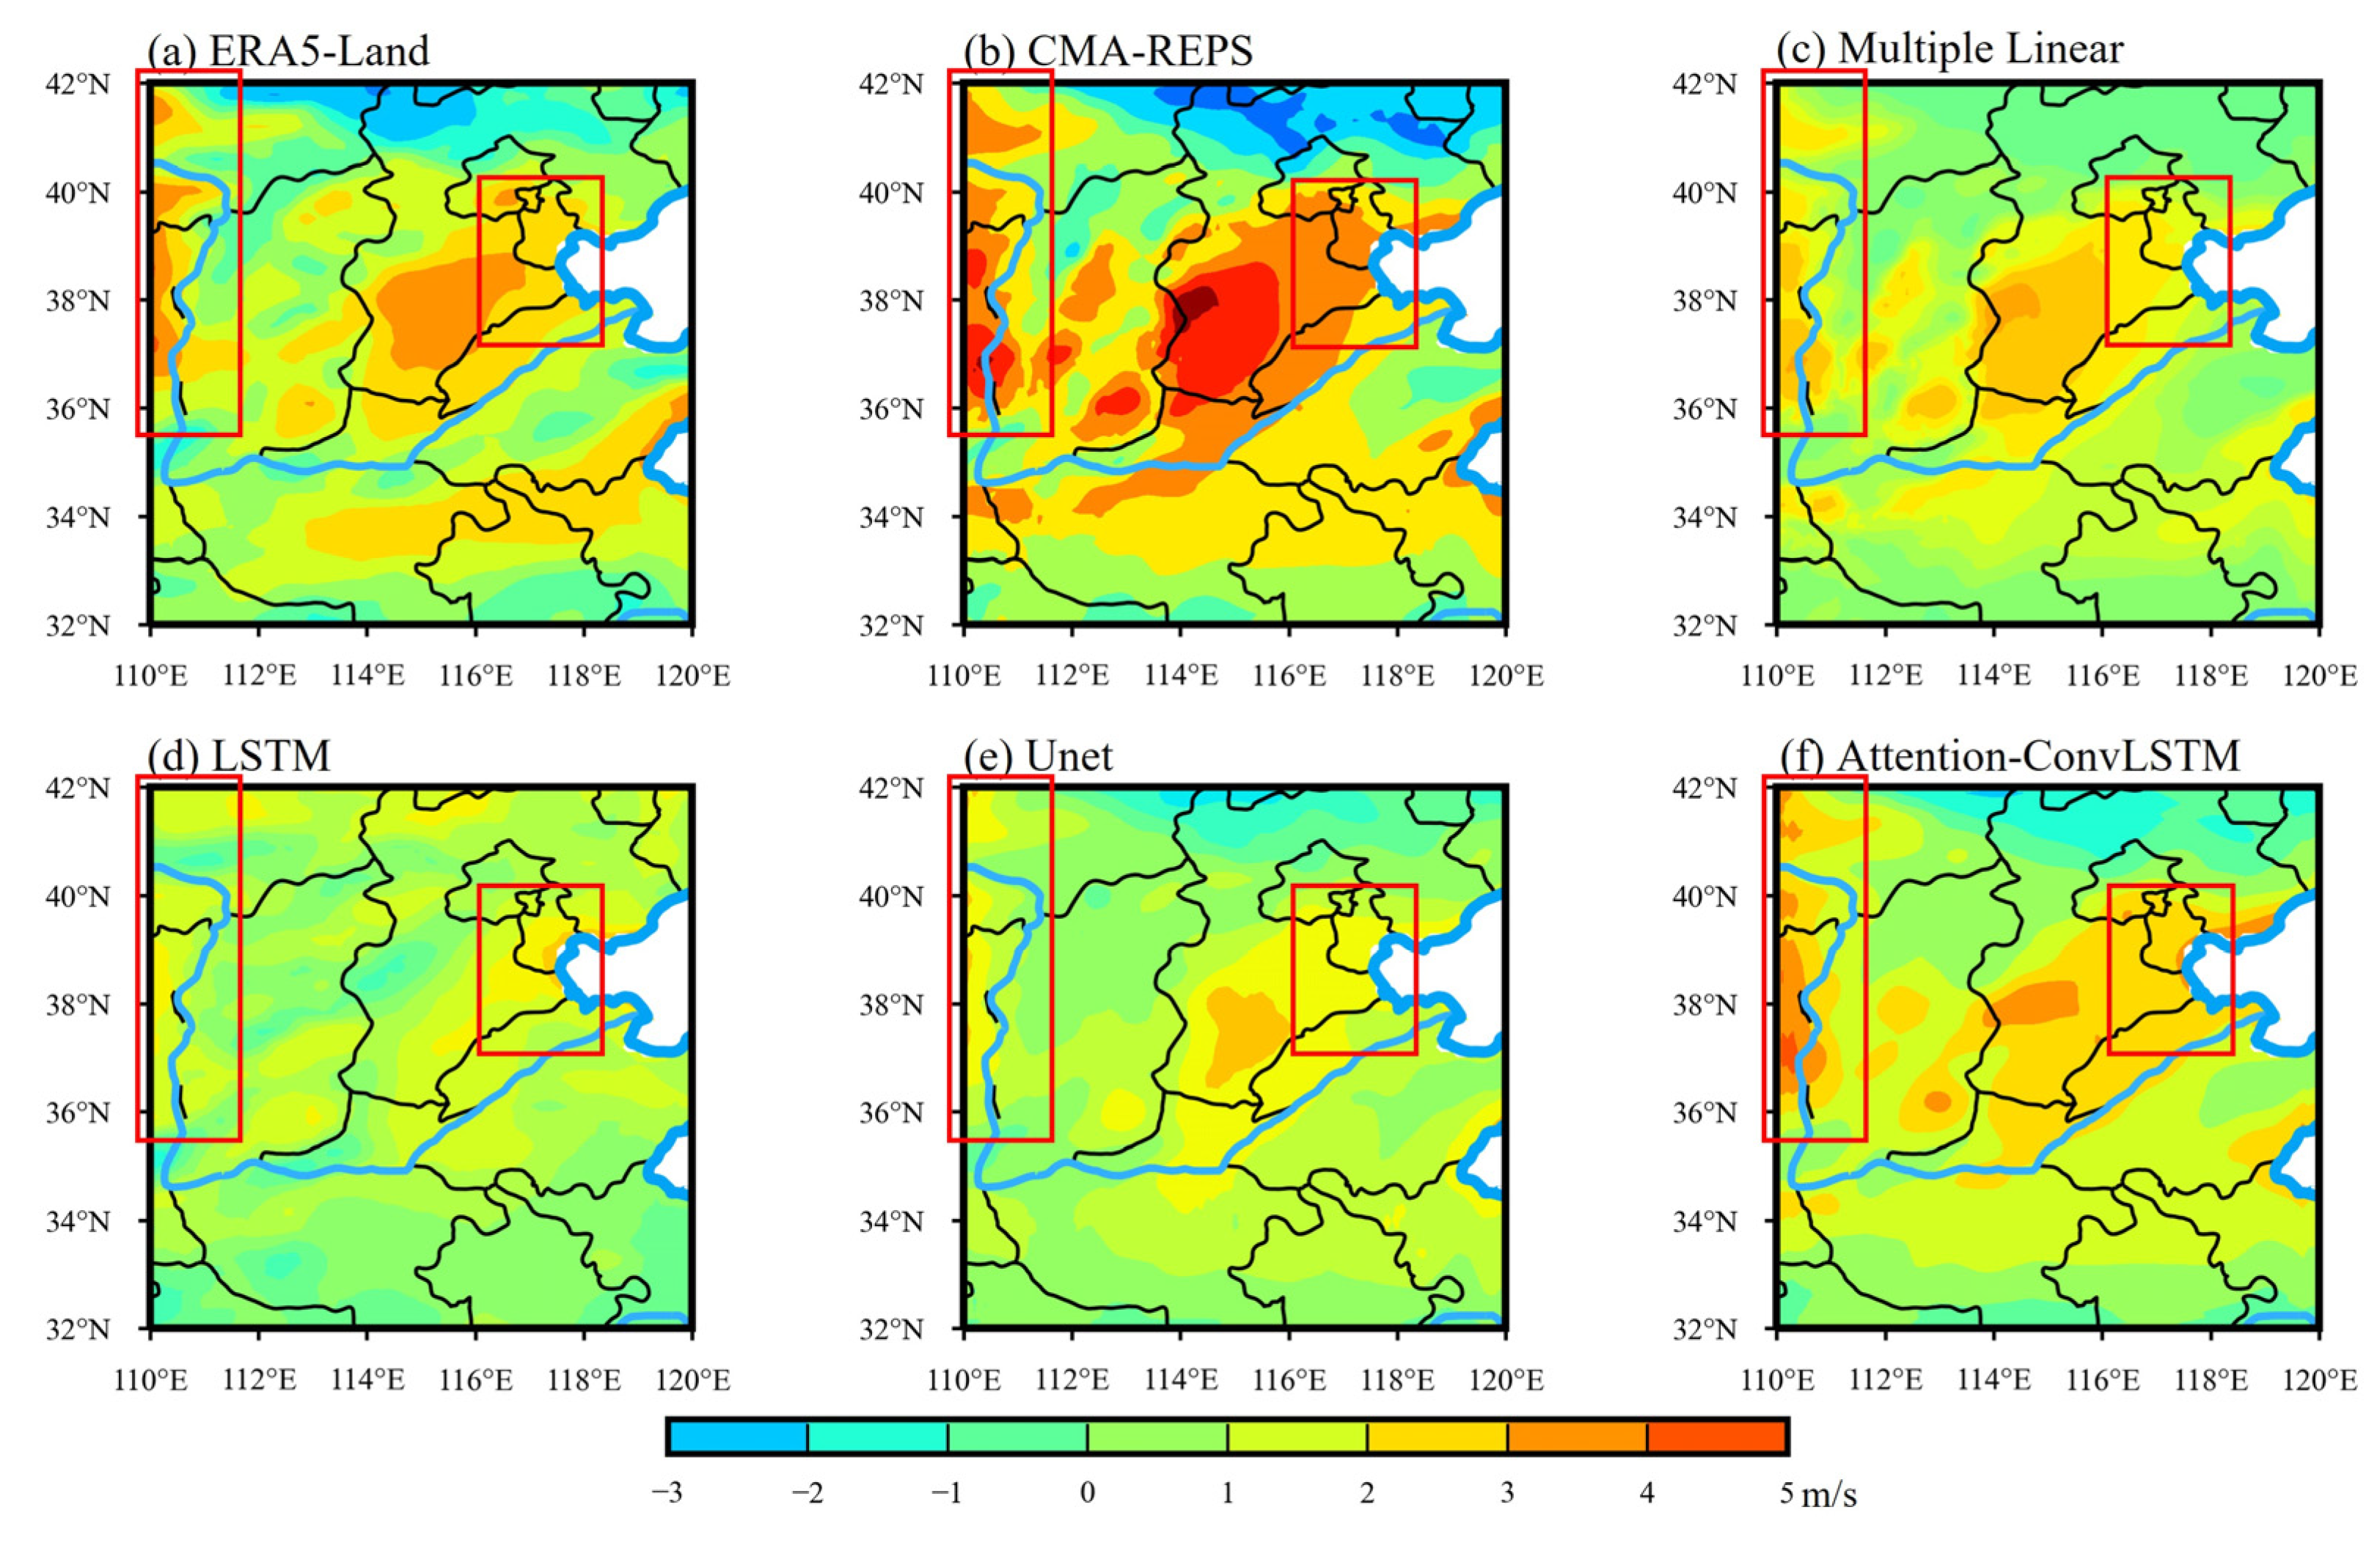
Figure 13.
Distribution curve of RMSE of 10 w revised results.
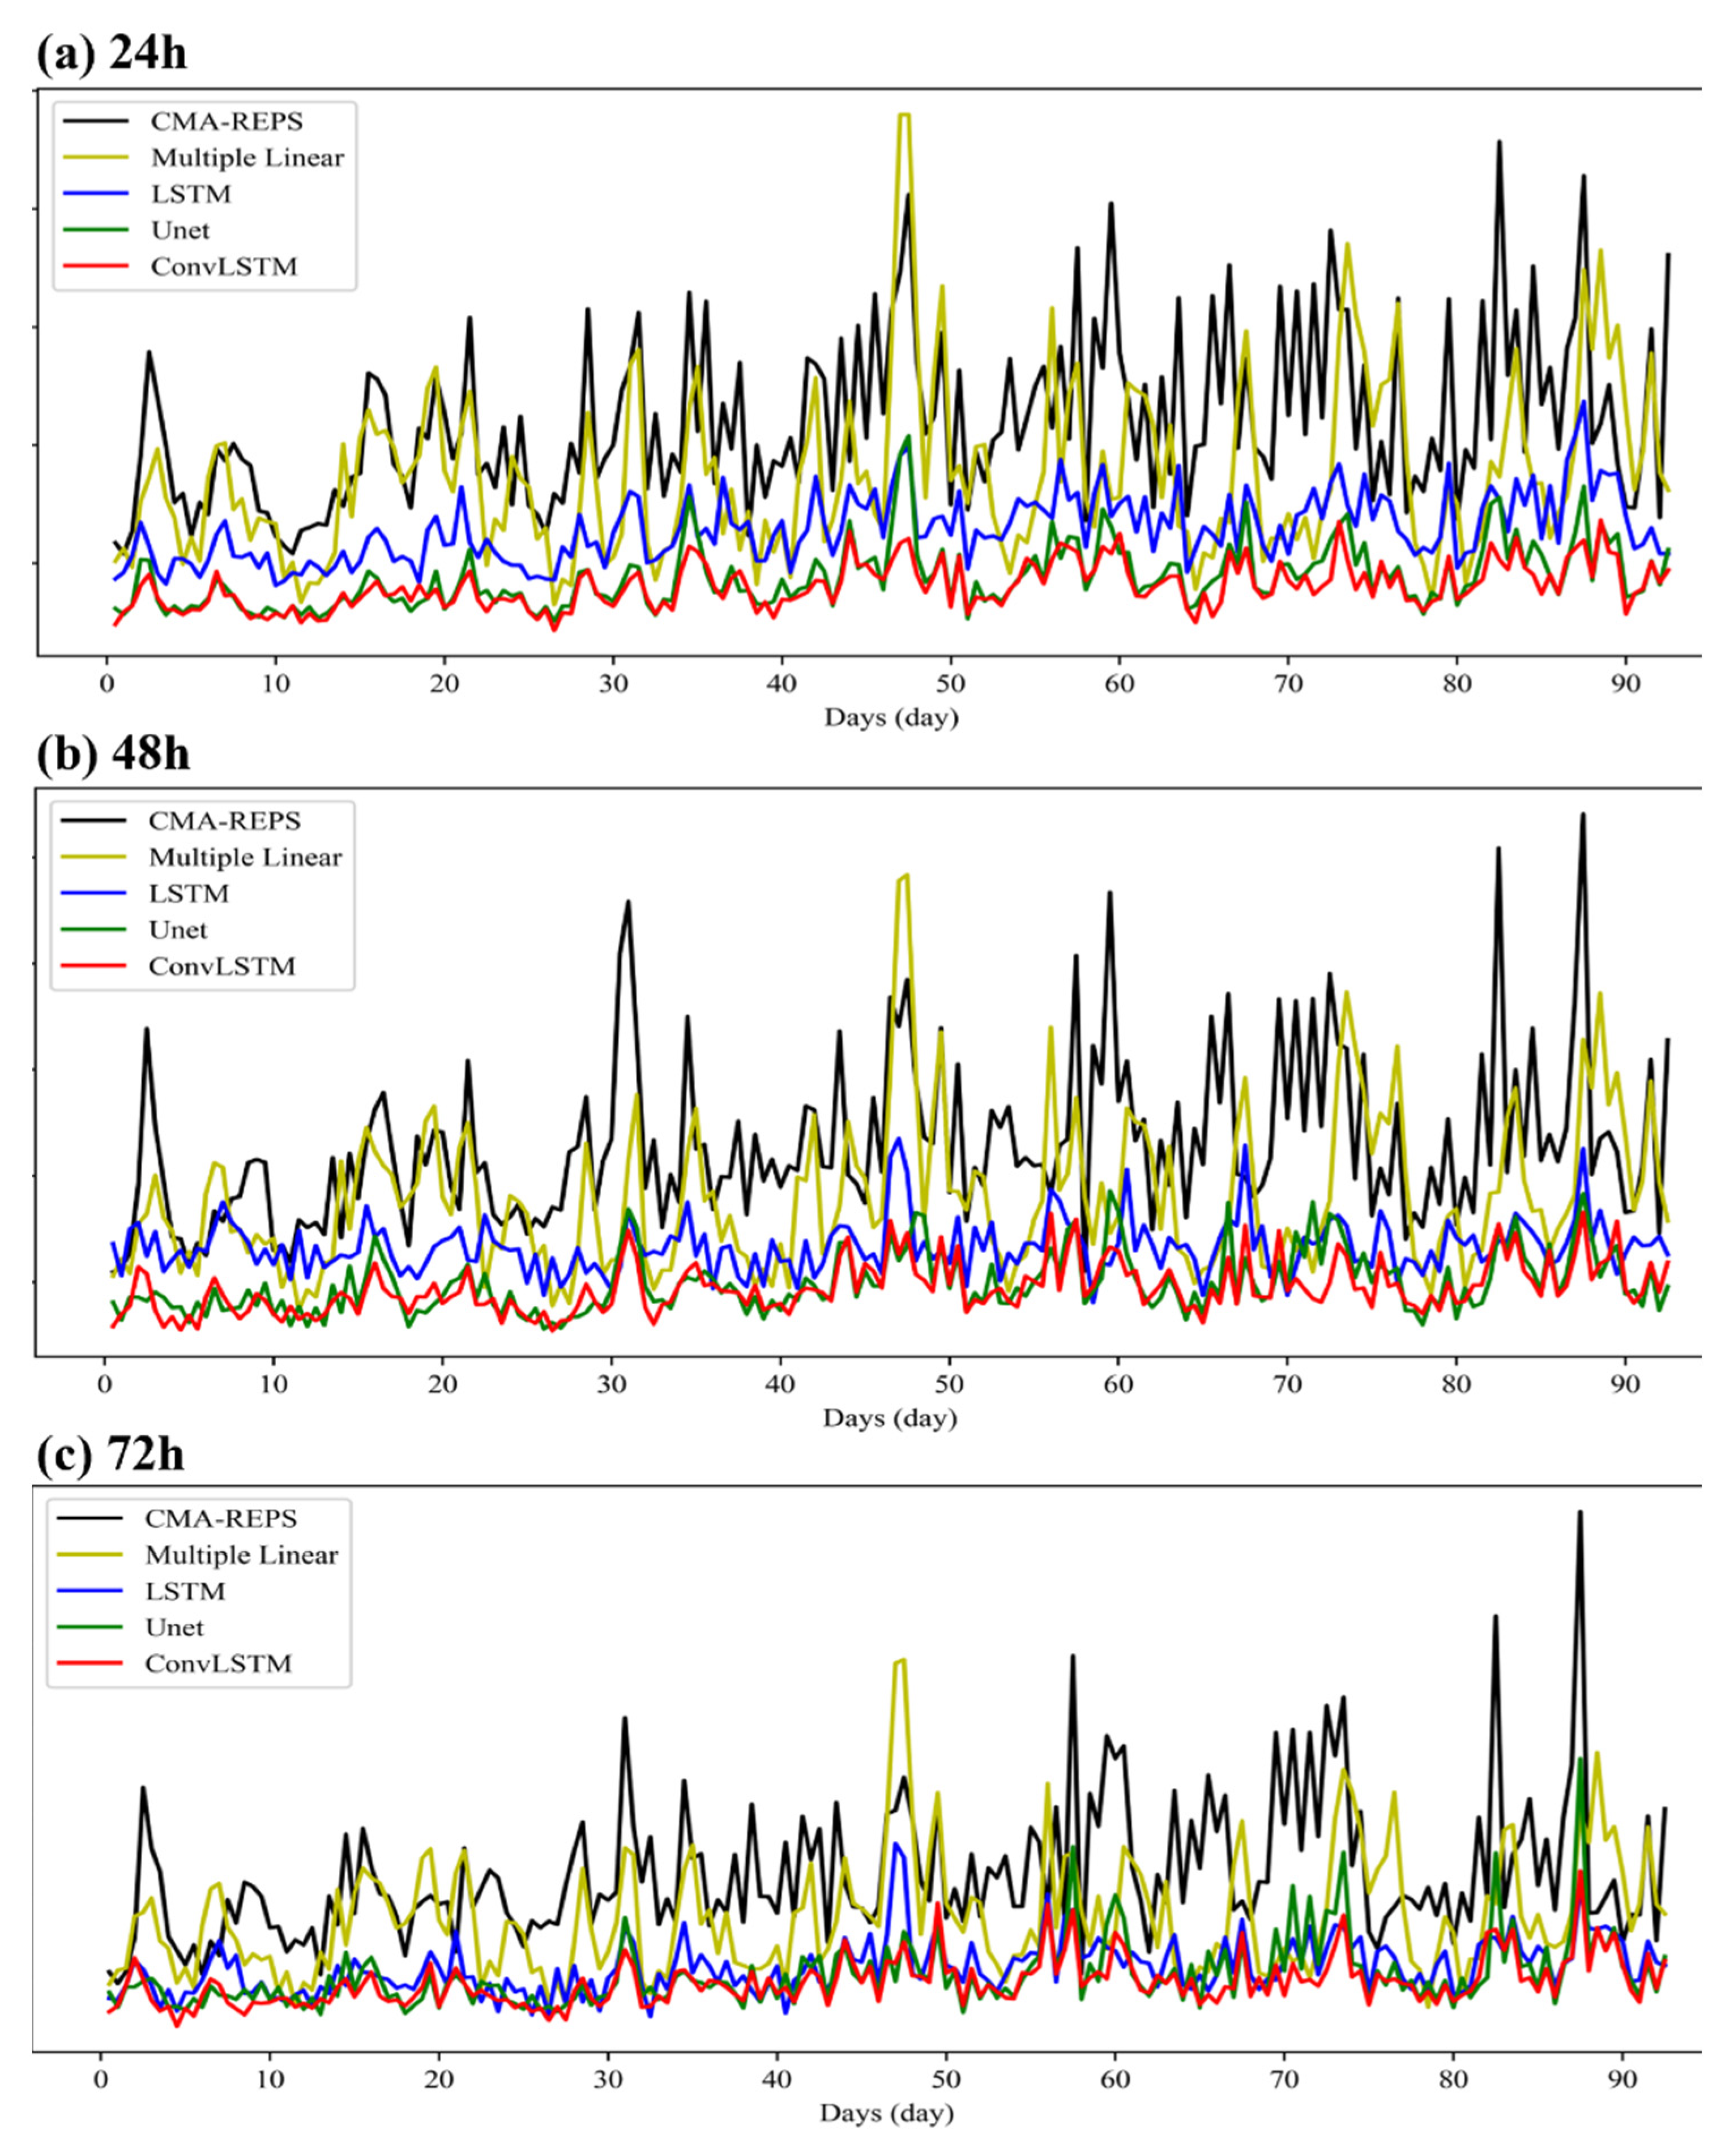
Figure 14.
Revised results of 24 h forecast 10 w at 00:00 25 March 2022.

Table 1.
CMA–REPS (China Meteorological Administration–Regional Ensemble Prediction System) set specific parameters.
Table 1.
CMA–REPS (China Meteorological Administration–Regional Ensemble Prediction System) set specific parameters.
| Parameter Name | Parameter Setting |
|---|---|
| Control forecast | CMA-MESO (China Meteorological Administration Mesoscale Mode) |
| Resolution | 0.1°/L50 |
| Control forecast initial values and side boundaries | NCEP-GFS (National Centers for Environmental Prediction- Global Forecast System) |
| Assimilation analysis technique | Cloud analysis |
| Initial value uncertainty | ETKF (Ensemble transform Kalman filter) (6 h loop) |
| Model uncertainty | Single physics + SPPT |
| Boundary uncertainty | CMA–REPS (China Meteorological Administration–Regional Ensemble Prediction System) |
| Typhoon uncertainty | Conditional typhoon vortex relocation technique |
| Set members | 15 |
| Forecast area | 15~65° N, 70~140° E (before 7 June 2022), 10~60° N, 70~145° E (after 7 June 2022) |
| Predictive aging | 0–84 h (0000, 1200 UTC), 0–6 h (0600, 1800 UTC) |
| Mode output interval | 1 h |
Table 2.
ERA5-Land data.
| Name | Value |
|---|---|
| Data type | Gridded |
| Horizontal coverage | Global |
| Horizontal resolution | 0.1° × 0.1°; Native resolution is 9 km. |
| Vertical coverage | From 2 m above the surface level, to a soil depth of 289 cm. |
| Vertical resolution | Four levels of the ECMWFs surface model: Layer 1: 0–7 cm, Layer 2: 7–28 cm, Layer 3: 28–100 cm, Layer 4: 100–289 cm. Some parameters are defined at 2 m over the surface. |
| Temporal coverage | January 1950 to present |
| Temporal resolution | Hourly |
| File format | GRIB (General Regularly distributed Information in Binary form) |
Table 3.
Average RMSE of 10 u corrected results.
| Experiment | CMA–REPS | Multiple Linear | LSTM | UNET | Attention-ConvLSTM |
|---|---|---|---|---|---|
| 24 h | 1.7036 | 1.4900 | 1.2867 | 0.9316 | 0.8464 |
| 48 h | 1.8439 | 1.5406 | 1.3773 | 1.1397 | 1.0135 |
| 72 h | 1.8542 | 1.5745 | 1.4673 | 1.1472 | 1.1097 |
Table 4.
Average MAE of 10 u corrected results.
| Experiment | CMA–REPS | Multiple Linear | LSTM | UNET | Attention-ConvLSTM |
|---|---|---|---|---|---|
| 24 h | 1.3367 | 1.2003 | 1.0153 | 0.7331 | 0.6453 |
| 48 h | 1.4564 | 1.2460 | 1.0809 | 0.8889 | 0.7797 |
| 72 h | 1.4603 | 1.2786 | 1.1642 | 0.8957 | 0.8506 |
Table 5.
Average RMSE of the revised results for 10 v.
| Experiment | CMA–REPS | Multiple Linear | LSTM | UNET | Attention-ConvLSTM |
|---|---|---|---|---|---|
| 24 h | 1.9316 | 1.5327 | 1.4245 | 1.0156 | 0.9665 |
| 48 h | 2.0673 | 1.6194 | 1.5801 | 1.2578 | 1.1468 |
| 72 h | 2.1453 | 1.6814 | 1.5735 | 1.3164 | 1.2930 |
Table 6.
Average MAE of the revised results for 10 v.
| Experiment | CMA–REPS | Multiple Linear | LSTM | UNET | Attention-ConvLSTM |
|---|---|---|---|---|---|
| 24 h | 1.5455 | 1.1968 | 1.1435 | 0.8082 | 0.7311 |
| 48 h | 1.6619 | 1.2803 | 1.2665 | 0.9854 | 0.8806 |
| 72 h | 1.7255 | 1.3395 | 1.2532 | 1.0245 | 1.0026 |
Table 7.
Average RMSE of the 10 w revised results.
| Experiment | CMA–REPS | Multiple Linear | LSTM | UNET | Attention-ConvLSTM |
|---|---|---|---|---|---|
| 24 h | 2.2121 | 1.7518 | 1.2863 | 0.8775 | 0.8091 |
| 48 h | 2.2964 | 1.7971 | 1.3337 | 0.9926 | 0.9518 |
| 72 h | 2.2951 | 1.7741 | 1.2219 | 1.0864 | 1.0039 |
Table 8.
Average MAE of the 10 w revised results.
| Experiment | CMA–REPS | Multiple Linear | LSTM | UNET | Attention-ConvLSTM |
|---|---|---|---|---|---|
| 24 h | 1.8313 | 1.3943 | 1.0129 | 0.6754 | 0.6148 |
| 48 h | 1.9067 | 1.4509 | 1.0746 | 0.7642 | 0.7384 |
| 72 h | 1.9081 | 1.4223 | 0.9281 | 0.8595 | 0.7808 |
Disclaimer/Publisher’s Note: The statements, opinions and data contained in all publications are solely those of the individual author(s) and contributor(s) and not of MDPI and/or the editor(s). MDPI and/or the editor(s) disclaim responsibility for any injury to people or property resulting from any ideas, methods, instructions or products referred to in the content. |
© 2023 by the authors. Licensee MDPI, Basel, Switzerland. This article is an open access article distributed under the terms and conditions of the Creative Commons Attribution (CC BY) license (https://creativecommons.org/licenses/by/4.0/).
Share and Cite
MDPI and ACS Style
Chen, M.; Yang, H.; Mao, B.; Xie, K.; Chen, C.; Dong, Y. An Ensemble Forecast Wind Field Correction Model with Multiple Factors and Spatio-Temporal Features. Atmosphere 2023, 14, 1650. https://doi.org/10.3390/atmos14111650
AMA Style
Chen M, Yang H, Mao B, Xie K, Chen C, Dong Y. An Ensemble Forecast Wind Field Correction Model with Multiple Factors and Spatio-Temporal Features. Atmosphere. 2023; 14(11):1650. https://doi.org/10.3390/atmos14111650
Chicago/Turabian StyleChen, Min, Hao Yang, Bo Mao, Kaiwen Xie, Chaoping Chen, and Yuanchang Dong. 2023. "An Ensemble Forecast Wind Field Correction Model with Multiple Factors and Spatio-Temporal Features" Atmosphere 14, no. 11: 1650. https://doi.org/10.3390/atmos14111650
Note that from the first issue of 2016, this journal uses article numbers instead of page numbers. See further details here.