
Discriminating Technique of Typhoon Rapid Intensification Trend Based on Artificial Intelligence

1
National Meteorological Center, Beijing 100081, China
2
School of Artificial Intelligence, Beijing University of Posts and Telecommunications, Beijing 100876, China
*
Author to whom correspondence should be addressed.
Atmosphere 2022, 13(3), 448; https://doi.org/10.3390/atmos13030448
Submission received: 24 December 2021
/
Revised: 28 February 2022
/
Accepted: 3 March 2022
/
Published: 10 March 2022
(This article belongs to the Special Issue Meteorological Extremes in China)
Abstract
:The trend detection of the sudden change of typhoon intensity has always been a difficult issue in typhoon forecast. Artificial intelligence (AI) can implicitly extract the complex features in the images through learning a large number of samples, and it has been widely applied in the meteorological field nowadays. In this study, based on the deep residual network (ResNet) model and the long short-term memory (LSTM) model, an automatic and objective method of identifying the trend of typhoon rapid intensification (RI) is presented through marking and learning the key information on the satellite images of the typhoons on the Northwest Pacific and South China Sea from 2005 to 2018. This method introduces the typhoon lifecycle indication and can effectively forecast and identify the trend of typhoon RI. By applying the detecting method in analyzing the operational typhoon satellite cloud images in 2019, we find that the method can well capture the sudden change tendency of typhoon intensity, and the threat score of independent sample estimation in 2019 reached 0.24. In addition, four typhoon cases with RI processes from 2019 to 2021 are tested, and the results show that the AI-based identification method of typhoon RI is superior to the traditional subjective intensity prediction method, and it has important application values.
1. Introduction
A typhoon is one of the most disastrous weather affecting China. In recent years, extreme storms and secondary geological disasters caused by landfall typhoons have brought huge losses to the national economy and people’s lives. Therefore, it is imperative to improve the forecast skills for typhoons. The rapid intensification (RI) of typhoons in offshore areas has always been a difficult point in operational weather forecasting, and it has drawn great attention from domestic and foreign meteorologists. The statistical results [1] show that about 17% of typhoons go through RI when they are close to islands or continental coasts. Feng et al. [2] created statistics of tropical cyclones with abrupt intensity changes in China’s coastal waters from 1970 to 1991, and they found that when tropical cyclones moved to China’s coastal waters, the intensity suddenly increased by 20.4%. Lin et al. [3] pointed out that about 13.5% of tropical cyclones moving into the offshore of South China suddenly increased, with an average of about 0.8 typhoons per year and the highest frequency in September. Lu et al. [4] analyzed 22 typhoons with RI in the offshore areas of South China and found that 15 RI typhoons occurred in September. Some experts have also made a lot of explorations of the reasons for typhoon RI in offshore areas. For example, Yu, Y.B. and Zheng, and Z.G. [5] discussed the mechanisms of typhoon RI at offshore areas in China from the perspective of kinetic energy. Hu et al. [6] analyzed the large-scale environment of a sudden change of typhoon intensity before landing, and they pointed out that typhoon RI usually occurs in the southwest or south of the subtropical high. Lin et al. [3] pointed out that southwest monsoon, cross-equatorial airflow, easterly wave, weak cold air, and westerly trough are the main systems that induce typhoon RI at offshore areas of South China. Su and H.M. [7] claimed that the enhancement of the outflow from the top of the typhoon center and the weak cold air entering the north of the typhoon are the main reasons for the offshore intensification of No. 9914 Typhoon Dann. The statistical analysis of landfall typhoons [8] show that the vertical shear of environmental wind is related to the typhoon intensity with a 6-h time-lag. Zheng et al. [9] simulated No. 1010 Typhoon Meranti, which suddenly intensified at offshore areas, and showed that the sea surface temperature can affect the latent heat, sensible heat, and water vapor flux transport from the ocean to the typhoon. Chen et al. [10] and Zheng et al. [11] pointed out that a weak vertical shear between high and low levels and suitable sea surface temperature are important reasons for the RI of the No. 1409 super typhoon Rammasun in offshore areas. Xu, Y.L. and Huang, and Y.W. [12] carefully analyzed the ocean and atmospheric conditions when No. 1522 Typhoon Mujigae moved into the South China Sea and found that the RI of Mujigae in the offshore areas is closely related to the interaction between the underlying surface and the ambient atmosphere.
At present, except for the comprehensive forecast method, other objective forecast methods of typhoon intensity in operational weather services are mainly based on statistical forecast or statistical-dynamic models, and most of them use statistical methods such as regression, which are weak in describing the rapid change of typhoon intensity. Moreover, many previous studies on the prediction of typhoon RI used the prediction variables as features, such as statistics of typhoon intensity forecast SHIPS series, or by analyzing the climatic characteristics and temporal and spatial characteristics of tropical cyclones (such as season, month, latitude and longitude, air pressure change, monthly mean water temperature field, etc.), meteorologists used statistics to find some laws as the important basis for judging whether tropical cyclones will rapidly enhance. However, depending on the research of prediction variables, there is a lack of exploration of new technologies to make better use of the original data, and some laws discovered can only be used as auxiliary means, so it is difficult to predict whether the typhoon will strengthen rapidly and accurately in real time. With the help of AI and the operational use of high spatial and temporal resolution satellite images of tropical cyclones in real time, it will be able to automatically identify and discriminate the RI trend of the typhoon to further improve China’s typhoon monitoring, forecasting, and early warning capabilities to provide favorable support.
In recent years, with the rapid development of artificial intelligence (AI) technology, machine learning, and deep learning, it has been widely used in the fields of finance, agriculture, military affairs, and so on. Therefore, aiming at the identification of typhoon RI, this problem can be solved with the help of time series prediction technology in the field of computer vision, which can identify the trend of typhoon RI in real time based on meteorological big data. With the development of AI technology, neural networks and other methods with strong nonlinearity have made some progress in the application of weather forecast. Pradhan et al. [13] estimated the typhoon grade by using the multi-layer convolutional neural network (CNN). Zahera et al. [14] used long short-term memory (LSTM) and deep neural network (DNN) to estimate typhoon intensity. Wei et al. [15] used the neural network method to divide the typhoon intensity more explicitly. Zhang et al. [16] estimated the typhoon intensity by establishing a statistical relationship between the channel characteristics of a FY-3C microwave thermometer and typhoon intensity. Many studies have shown that AI technology may have good performance in typhoon intensity prediction [17,18]. In 2020, Bai et al. [19] from Taiwan University put forward an attention-based deep learning method, ConvLSTM, to identify typhoon RI. Therefore, with the continuous development of meteorological satellites in China, it is a good idea to introduce and develop AI techniques in detecting the trend of typhoon RI.
2. Data and Method
The TC data used in this paper include the best track dataset (http://tcdata.typhoon.org.cn/zjljsjj_sm.html accessed on 2 March 2022) provided by the China Meteorological Administration (Shanghai Typhoon Research Institute) from 2005 to 2018. This data set includes the position of TC once every 6 h, the lowest central air pressure, the maximum wind speed near the center, etc. The real-time forecast products of typhoon intensity from 2019 to 2021 are from the National Meteorological Center. The Himawari-8 satellite data from 2005 to 2017 were selected as the training set, the satellite data from 2018 as the validation set, and the FY4A satellite data from 2019 to 2021 as the test set.
According to previous studies [20,21], the definition of typhoon RI is that the typhoon wind speed increases by 15 m/s within 24 h. According to the sample statistics from 2005 to 2017, it was found that the RI cases account for less than 5% of all typhoon cases. Generally, for a data set, if the target event is few and the proportion is less than 10%, it is called an extremely imbalanced data set. For imbalanced data sets, machine learning algorithms often fail to achieve satisfactory classification results.
Statistics of the training samples from 2005 to 2017 show that there are 95% more cases with an increase of typhoon wind speed by about 14 m/s within 24 h in the samples with RI (Figure 1). Therefore, in order to increase the number of RI cases, to increase the number of positive samples of a few categories, to and reduce the number of negative samples of most categories, we defined the cases with an increase of typhoon speed by more than 7 m/s within 12 h as the positive samples of typhoon RI. The formula is as follows:
where is the current time, is the last 12 h of the current time, and RI is marked as 1 for time T, which means that the typhoon wind speed will increase more than 7 m/s within T-12 ~ T hours.
In the training process, although the number of positive samples increased by adopting the new threshold of RI (wind speed increases by 7 m/s in 12 h), the ratio of positive samples to negative samples in the whole data set (with RI samples as positive samples and non-RI samples as negative samples) was still about 1:11 (Figure 2). As the positive and negative samples were not evenly distributed, a re-weighting method was applied to the training data. Weighting means giving different punishments to imbalanced categories. Different weights were applied to the loss (the difference between the model predicted value and the true value of the sample) calculated by different categories in the training process, so that the model optimization tended to favor the few categories (RI samples).
where , Formula (2) represents the loss weight given to the actual positive (RI) samples, represents the probability that the samples are predicted to be positive by the RI trend detection model, represents the loss weight given to the actual negative (non-RI) samples, represents the probability that the samples are predicted to be negative, and represents the label of the samples (positive samples are 1 and negative samples are 0).
In addition, the lack of historical data during typhoon genesis is a problem in series prediction and series discrimination. The input data is the typhoon wind speed at four consecutive time steps, and for the initial time we used the wind speed samples at the current time or the previous time to complement the wind speed samples at the historical time. When the sample was missing, that is, in the whole historical series of typhoons, it was inevitable to find that there were some moments when the data was lost. It resulted in the discontinuity of the sample series, which brings risks to the model prediction. Aiming at the problem of missing samples, if the typhoon data was missed, the data of the nearest previous typhoon sample was used instead.
3. The Identification Model of Typhoon RI Trend
3.1. Brief Introduction
Based on the deep residual network (ResNet) model in the field of artificial intelligence and the deep learning model LSTM based on spatio-temporal correlation, the key features in the satellite cloud images are labeled, learned, and predicted to realize the detection and prediction of typhoon RI. Firstly, the features of typhoon intensity are extracted based on the ResNet model, and then the features of typhoon intensity change are extracted according to the LSTM model. Furthermore, the strategy fusion is carried out according to the period of typhoon intensity trend and the detection of typhoon intensity mutation, and finally, the judgment result of the typhoon intensity mutation trend is the output.
Specifically (as shown in Figure 3), the input of the RI trend detection model is the satellite cloud images and its corresponding typhoon windspeed sequence. The images are generally a gray scale image with higher resolution. The identification method contains several steps. The first step (Step S1) is data labeling. In this step, the dataset of typhoon intensity (maximum windspeed) is built based on satellite cloud images. The data format is mage 1, image 2,…, image N, intensity 1, intensity 2,…, intensity N, RI labeling, life cycle indication. Step 2 (S2) is the fine-tuning of the pre-trained CNN module. According to the typhoon images and the corresponding intensities, the CNN classification model is pre-trained to obtain the visual spatial features of a single image. Step 3 (S3) is the training feature extraction module. In order to better train the feature extractor, it is necessary to train the whole model to verify whether the training is completed. The training process directly uses the originally labeled data for training. Step 4 (S4) is to train the classifier. In this step, we used the result of feature extraction obtained in step S3, that is, we froze the training parameters of the LSTM and CNN, and we trained the classifier again by combining the re-sampler method and the re-weighting method and by using the indication of typhoon life cycle. Here, the typhoon life cycle indication is calculated by the typhoon intensity series in the labeled data. In step 5 (S5), we input the typhoon sequence to be tested into the trained S2 + S3 + S4 model. Data format of the test data was <{image 1, image 2,…, image N}, {intensity 1, intensity 2,…, intensity N}, life cycle indication>. The only difference of the test data from the training data is that there is no RI labeling data. After testing the data with the trained RI trend detection model, we can obtain the result of the RI trend in the next 12 h or 24 h. Steps S1–S4 are training stages, and step S5 is the independent test stage.
3.2. Model Training Process
In this study, a new method for typhoon RI detection based on satellite cloud images was proposed. In this method, the CNN based pre-trained model and the LSTM-based time series model were combined as feature extractors, and three-stage training method was adopted. In the first stage, the fine-tuned and pre-trained CNN model was used to extract visual spatial features. In the second stage, a feature extractor was developed based on a combination of the fine-tuned CNN model and the LSTM time series model. In the third stage, a new parameter life cycle indication was introduced to the model and a classifier was trained by applying re-sampler and re-weighting methods to imbalance data. It effectively avoided the detection result deviation caused by the imbalance of the RI samples, so as to more accurately predict and detect the trend of typhoon RI.
The newly developed model (Figure 4) uses the typhoon images at four consecutive historical moments (with a 6-h interval) to predict typhoon RI. We used the pre-trained CNN model to extract the feature of typhoon intensities at four moments (with wind speed ≥10m/s). Then, the life cycle indication (intensification stage or weakening stage) was obtained according to the intensity change. The life cycle indication after embedding and the concat of LSTM were imported to the model to detect the RI and its probability.
The satellite remote sensing cloud image of No. 1909 Typhoon LEKIMA for four consecutive times, which cover the whole life cycle of the typhoon from its formation to dissipation, is shown in Figure 5a–d. Using the typhoon data of four consecutive moments, with the current moment at 00:00 UTC on 7 August 2019, we extracted the spatio-temporal features from the satellite cloud images and calculated the time series of typhoon intensity. The results showed that the probability of RI occurrence at 12:00 UTC on 7 August 2019 is about 0.83, and the labeled RI index is 1. In the observation, the RI process did occur within 12 h (the wind speed increased from 15 m/s to 38 m/s). Figure 5e–h is the case of Typhoon Wipha (No. 1907). The satellite cloud images at four consecutive moments, with a current moment at 06:00 UTC on 31 July 2019, were used as the input of the same model to predict the RI occurrence at 18:00 UTC on 31 July 2019. The results showed that the probability of RI occurrence is about 0.24, and the RI was labeled as 0. In the observation, no RI occurred in 12 h (the wind speed increased by 3 m/s). The above cases are two successful cases of model prediction. It is difficult to tell whether there will be an RI process by simply looking at satellite images manually, but the model prediction provides a more objective and correct detection.
4. Test Analysis of Model Effect
4.1. Model Assessment Indicators
The accuracy index of the model was tested by a TS score, missing rate, and false rate, where TP represents frequency counted when the actual RI is predicted as RI, TN represents the frequency counted when the actual non-RI is predicted as non-RI, FN represents the frequency counted when the actual RI is predicted as non-RI, and FP represents the frequency counted when the actual non-RI is predicted as RI. The equations of the three indicators are as follows:
The TS score represents the proportion of the correct prediction of RI after excluding the correct prediction of non-RI.
The missing rate represents the proportion of prediction errors (non-RI) for the instant of RI in reality.
The false rate represents the proportion of prediction errors (RI) for the real non-RI.
4.2. Analysis of Model Test Results
In order to test the model performance, 28 typhoon cases in 2019 were analyzed. The threshold of the predicted RI probability is defined as λ, which is in the range of 0 and 1. An empirical threshold was also given by experiments to define RI. As shown in Table 1, compared with λ = 0.50, when λ = 0.55, the number of successfully predicted non-RI cases increased and FPR decreased correspondingly. Compared with λ = 0.60, when λ = 0.55, the number of falsely predicted RI cases decreased and the FNR decreased correspondingly. Therefore, the threshold λ is set as 0.55.
In the observation, there were 16 out of 28 cases with RI and 46 RI moments in 2019. The model developed in this study has successfully predicted 38 RI moments and 15 RI cases. The TS reaches 0.24. The results indicated that the AI-based typhoon RI trend detection method performed better than the traditional subjective methods, and it shows potential values in operational weather forecast.
4.3. Comparison between AI and Different Forecast Results
According to a further statistics comparison in 2019, it can be found from Table 2 that the TS of the NCEP model was 0.21, the TS of CMA’s forecast was 0.15, and the TS of our AI algorithm was 0.24. Our method greatly reduced the missing rate at the expense of a certain false rate and has high prediction accuracy for actual RI samples. The results also showed that the technology based on artificial intelligence is superior to the traditional subjective intensity forecasting method.
4.4. Cases Study
Four typhoon cases with RI, including No. 1909 Typhoon Lekima, No. 2019 Typhoon Goni, No. 2102 Typhoon Surigae, and No. 2114 typhoon Chanthu, from 2019 to 2021 were analyzed. The probability threshold of 0.55 was used to predict the occurrence of RI. If the probability exceeded 0.55, it was deemed as RI, otherwise it is non-RI.
For Typhoon Lekima in Figure 6a, we labeled 157 pieces of information and 15 RI moments. The FNR and FPR were 5.7% and 10.9%, respectively, and the TS was 0.48. For Typhoon Goni in Figure 6b, we labeled 123 pieces of information and eight RI moments. The FNR and FPR were 0% and 11%, respectively, and the TS score was 0.42. For Typhoon Surigae in Figure 6c, we labeled 73 pieces of information and seven RI moments. The FNR and FPR were 0% and 12.5%, respectively, and the TS score reached 0.50. For Typhoon Chanthu in Figure 6d, we labeled 182 pieces of information and nine RI moments. The FNR and FPR were 44.4% and 6.4%, respectively, and the TS score reached 0.27.
As shown in Figure 6, compared with the NCEP numerical model and the CMA subjective forecast, the AI’s typhoon rapid intensification discrimination model was more effective. The NCEP model’s forecast and the CMA’s subjective forecast were weaker than the actual wind speed during the typhoon rapid intensification phase (e.g., Typhoon 2019 “GONI” on 29–30 October, Typhoon 2114 “Chandu” on 8 September). The AI’s rapid intensification discriminant model was not only more accurate in predicting the probability of the rapid typhoon intensification, but it also can give the trend judgment of whether the rapid intensification is about 24 h in advance, which is a good prospect for application in an actual typhoon intensity forecast.
Heat maps are a common visualization tool that aggregate a large amount of data and represent it with progressive color bands, which can visually show the similarities and differences between data. One of the important roles is to show the correlation between different indicators and different samples. As shown in Figure 7, there was a positive correlation between the cloud structure of the typhoon vortex and the wind speed and rapid intensification of the typhoon at the same time, especially the vortex structure near the center of typhoon. When the cloud pattern and its corresponding intensity are subjected to LSTM, there is high confidence in the ability to discriminate the RI trend in the next phase.
In summary, by using the prediction model developed in this study, the average TS score of the four typhoon RI cases from 2019 to 2021 exceeded 0.27. The AI-based RI trend detection method performed better than the traditional subjective method, and the newly developed method has good application prospects in operational typhoon forecast.
5. Conclusions and Discussion
In this study, a new typhoon RI trend detection method was developed based on the ResNet model and the LSTM model. By labeling and learning the key information in the satellite cloud images in the northwest Pacific and South China Sea, the life cycle indication was introduced, and an automatic and objective method for identifying the trend of typhoon RI was proposed, which can effectively identify and forecast the trend of the typhoon RI. The main innovations of this study are as follows:
- (1)
- A time series prediction framework for identifying the trend of typhoon RI was proposed, in which the ResNet model and double-layer LSTM network were combined by PIPELINE, and the life cycle indication was considered to extract more accurate spatio-temporal evolution characteristics of a typhoon;
- (2)
- A three-stage training method, including the methods of re-sampling and re-weighting, was used to deal with the imbalance of typhoon RI samples;
- (3)
- A new typhoon RI index, a typhoon life cycle indication, was introduced to increase the prediction accuracy.
Compared with the traditional methods, the newly developed method introduced in this study can predict typhoon RI objectively and efficiently. The new model can deal well with missing data and imbalanced data, so it can extract RI features more accurately and can increase the accuracy of RI detection.
At present, this study focused on the RI detection in the northwest Pacific and South China Sea. With historical data of typhoons in other sea areas, we can expand the typhoon RI trend discrimination in other sea areas around the world in the future. Due to a shortage of data samples and other reasons, the method currently has a high false rate for some non-RI processes, which is our subsequent work.
Author Contributions
Conceptualization, G.Z. and Q.Q.; methodology, J.X. and Y.X. (Yajing Xu); software, J.X. and Y.X. (Yajing Xu); validation, G.Z. and Q.Q.; formal analysis, G.Z.; writing—original draft preparation, G.Z.; writing—review and editing, Q.Q.; project administration, Y.X. (Yinglong Xu); funding acquisition, Y.X. (Yinglong Xu). All authors have read and agreed to the published version of the manuscript.
Funding
This research was funded by the National Key R&D Program of China (Grant Nos. 2017YFC1501604), National Natural Sciences General Foundations of China (Grant Nos. 41875056/42075013), Key special projects planned in key areas of Guangdong Province (Grant Nos. 2019B111101002), and National Natural Sciences Foundations of China (Grant Nos. 41405049).
Institutional Review Board Statement
Not applicable.
Informed Consent Statement
Not applicable.
Data Availability Statement
The data presented in this study are available on request from the corresponding author. The data are not publicly available due to privacy.
Conflicts of Interest
The authors declare no conflict of interest.
References
- Yu, H.; Duan, Y. A statistical analysis on intensity change of tropical cyclone over northwestern pacific. Acta Meteorol. Sin. 2002, 60, 680–687. [Google Scholar] [CrossRef]
- Feng, J.; Chen, D. Analyses of climatic characteristics accompanying sudden intensity changes in offshore tropical cyclones in China. J. Trop. Meteorol. 1995, 11, 35–42. [Google Scholar]
- Lin, L.; Liang, Q.; Huang, Z. Analysis of Circulation Pattern of Rapidly Intensified Offshore Tropical Cyclones of South China. Meteorol. Mon. 2006, 32, 14–18. [Google Scholar]
- Lu, B.; Qian, W. Phase-locking in early autumn when typhoon suddenly intensifies in South China offshore. Chin. J. Geophys. 2012, 55, 1523–1531. [Google Scholar]
- Yu, Y.; Zheng, Z. Physical Factors Contributing to Energy Development of Super Typhoon Saomai (2006). Chin. J. Atmos. Sci. 2010, 34, 669–680. [Google Scholar] [CrossRef]
- Hu, C.; Duan, Y.; Yu, H.; Yu, R. The diagnostic analysis of the rapid change in tropical cyclones intensity before landfall in South China. J. Trop. Meteorol. 2005, 21, 377–382. [Google Scholar]
- Su, H. Analysis on the Main Causes of 9914 Typhoon Offshore Intensity Enhancement. Taiwan Strait 2001, 20, 298–300. [Google Scholar]
- Xu, M.; Yu, J.; Lai, A.; Peng, J.X. A Statistical Analysis on the Relations between Effect of Wind Vertical Shear and Landing Typhoons Intensity. Torrential Rain Disasters 2009, 28, 339–344. [Google Scholar]
- Zheng, F.; Zeng, Z.; Lei, X.; Chen, L.; Zhang, L. Numerical Simulation of a Sudden Enhancement Typhoon in Offshore Area. Zhejiang Meteorol. 2017, 38, 6–13. [Google Scholar]
- Jian, C.; Sun, H.; Gao, A. Comparative analysis of intensity changes between super typhoons Rammasun (1409) and Damrey (0518) during the period of entering the Beibu Gulf. Torrential Rain Disasters 2014, 33, 392–400. [Google Scholar]
- Zheng, Y.; Cai, Q.; Cheng, S.; Li, X. Characteristics on intensity and precipitation of super typhoon Rammasun (1409) and reason why it rapidly intensified offshore. Torrential Rain Disasters 2014, 33, 333–341. [Google Scholar]
- Xu, Y.; Huang, Y. The activity characteristics and forecasting difficulties of tropical cyclones over Western North Pacific and South China Sea in 2015. J. Mar. Meteorol. 2017, 37, 31–41. [Google Scholar]
- Pradhan, R.; Aygun, R.S.; Maskey, M.; Ramachandran, R.; Cecil, D.J. Tropical Cyclone Intensity Estimation Using a Deep Convolutional Neural Network. IEEE Trans. Image Process. 2018, 27, 692–702. [Google Scholar] [CrossRef] [PubMed]
- Zahera, H.M.; Sherif, M.A.; Ngonga, A. Jointly Learning from Social Media and Environmental Data for Typhoon Intensity Prediction. In Proceedings of the 10th K-CAP ’19: International Conference on Knowledge Capture, Marina Del Rey, CA, USA, 19–21 November 2019. [Google Scholar]
- Wei, T.; Wei, H.; Xu, X.; Wang, C. Tropical Cyclone Maximum Wind Estimation from Infrared Satellite Data with Integrated Convolutional Neural Networks. In Proceedings of the 2019 International Conference on Internet of Things (iThings) and IEEE Green Computing and Communications (GreenCom) and IEEE Cyber, Physical and Social Computing (CPSCom) and IEEE Smart Data (SmartData), Atlanta, GA, USA, 14–17 July 2019. [Google Scholar]
- Zhang, M.; Qian, D.; Qiu, H. Estimating Intensity of Tropical Cyclone over the Western North Pacific Based on FY 3C/MWTS II Data. Meteorol. Mon. 2017, 43, 573–580. [Google Scholar]
- Zou, G.; Qian, H.; Zheng, Z.; Huang, D.; Liu, Z. Classification of Typhoon Grade Based on Satellite Cloud Image and Deep Learning. Remote Sens. Inf. 2019, 34. [Google Scholar]
- Combinido, J.S.; Mendoza, J.R.; Aborot, J. A Convolutional Neural Network Approach for Estimating Tropical Cyclone Intensity Using Satellite-based Infrared Images. In Proceedings of the 2018 24th International Conference on Pattern Recognition (ICPR), Beijing, China, 20–24 August 2018. [Google Scholar]
- Bai, C.-Y.; Chen, B.-F.; Lin, H.-T. Benchmarking Tropical Cyclone Rapid Intensification with Satellite Images and Attention-Based Deep Models. In Joint European Conference on Machine Learning and Knowledge Discovery in Databases; Springer: Cham, Switzerland, 2020. [Google Scholar]
- Huang, R.C.; Lei, X.T. Comparative analysis of the influence of environment field on rapid intensifying and weakening of tropical cyclones over offshore waters of China. J. Trop. Meteor. 2010, 26, 129–137. (In Chinese) [Google Scholar]
- Kaplan, J.; DeMaria, M.; Knaff, J.A. A Revised Tropical Cyclone Rapid Intensification Index for the Atlantic and Eastern North Pacific Basins. Weather Forecast. 2010, 25, 220–241. [Google Scholar] [CrossRef]
Figure 1.
RI data set sample distribution map.

Figure 2.
Data set sample distribution map.
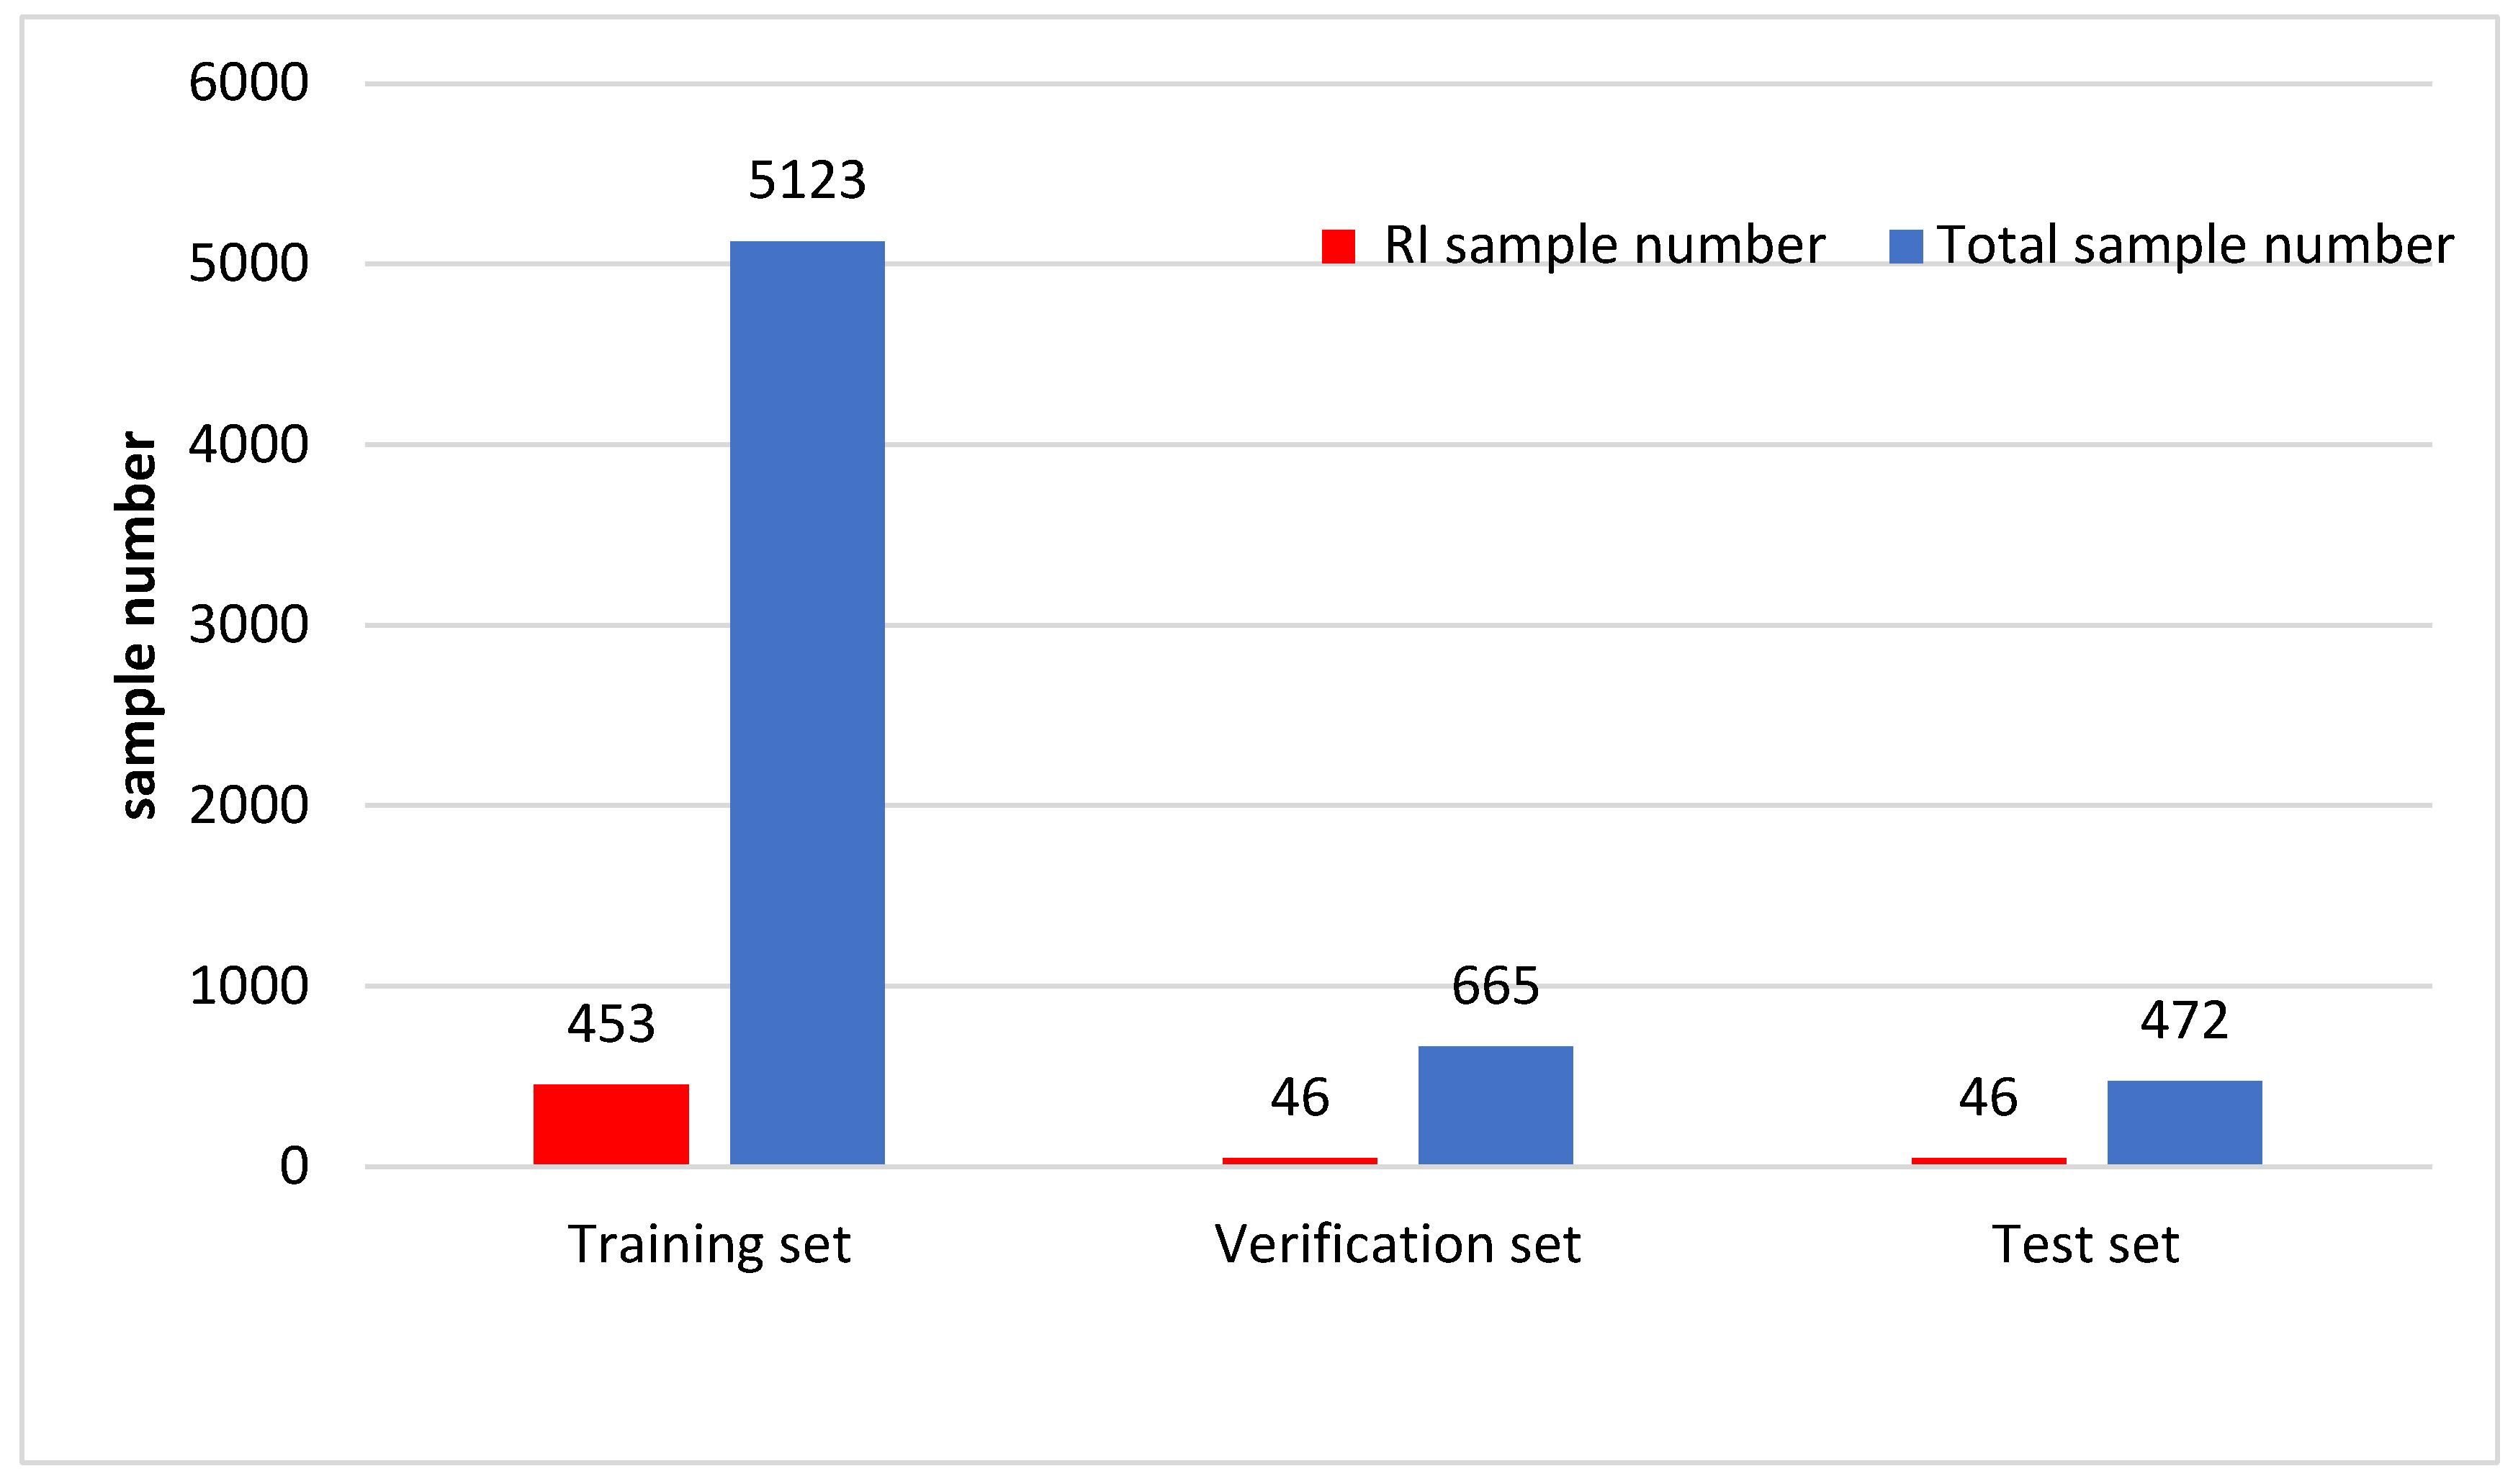
Figure 3.
Model diagram.
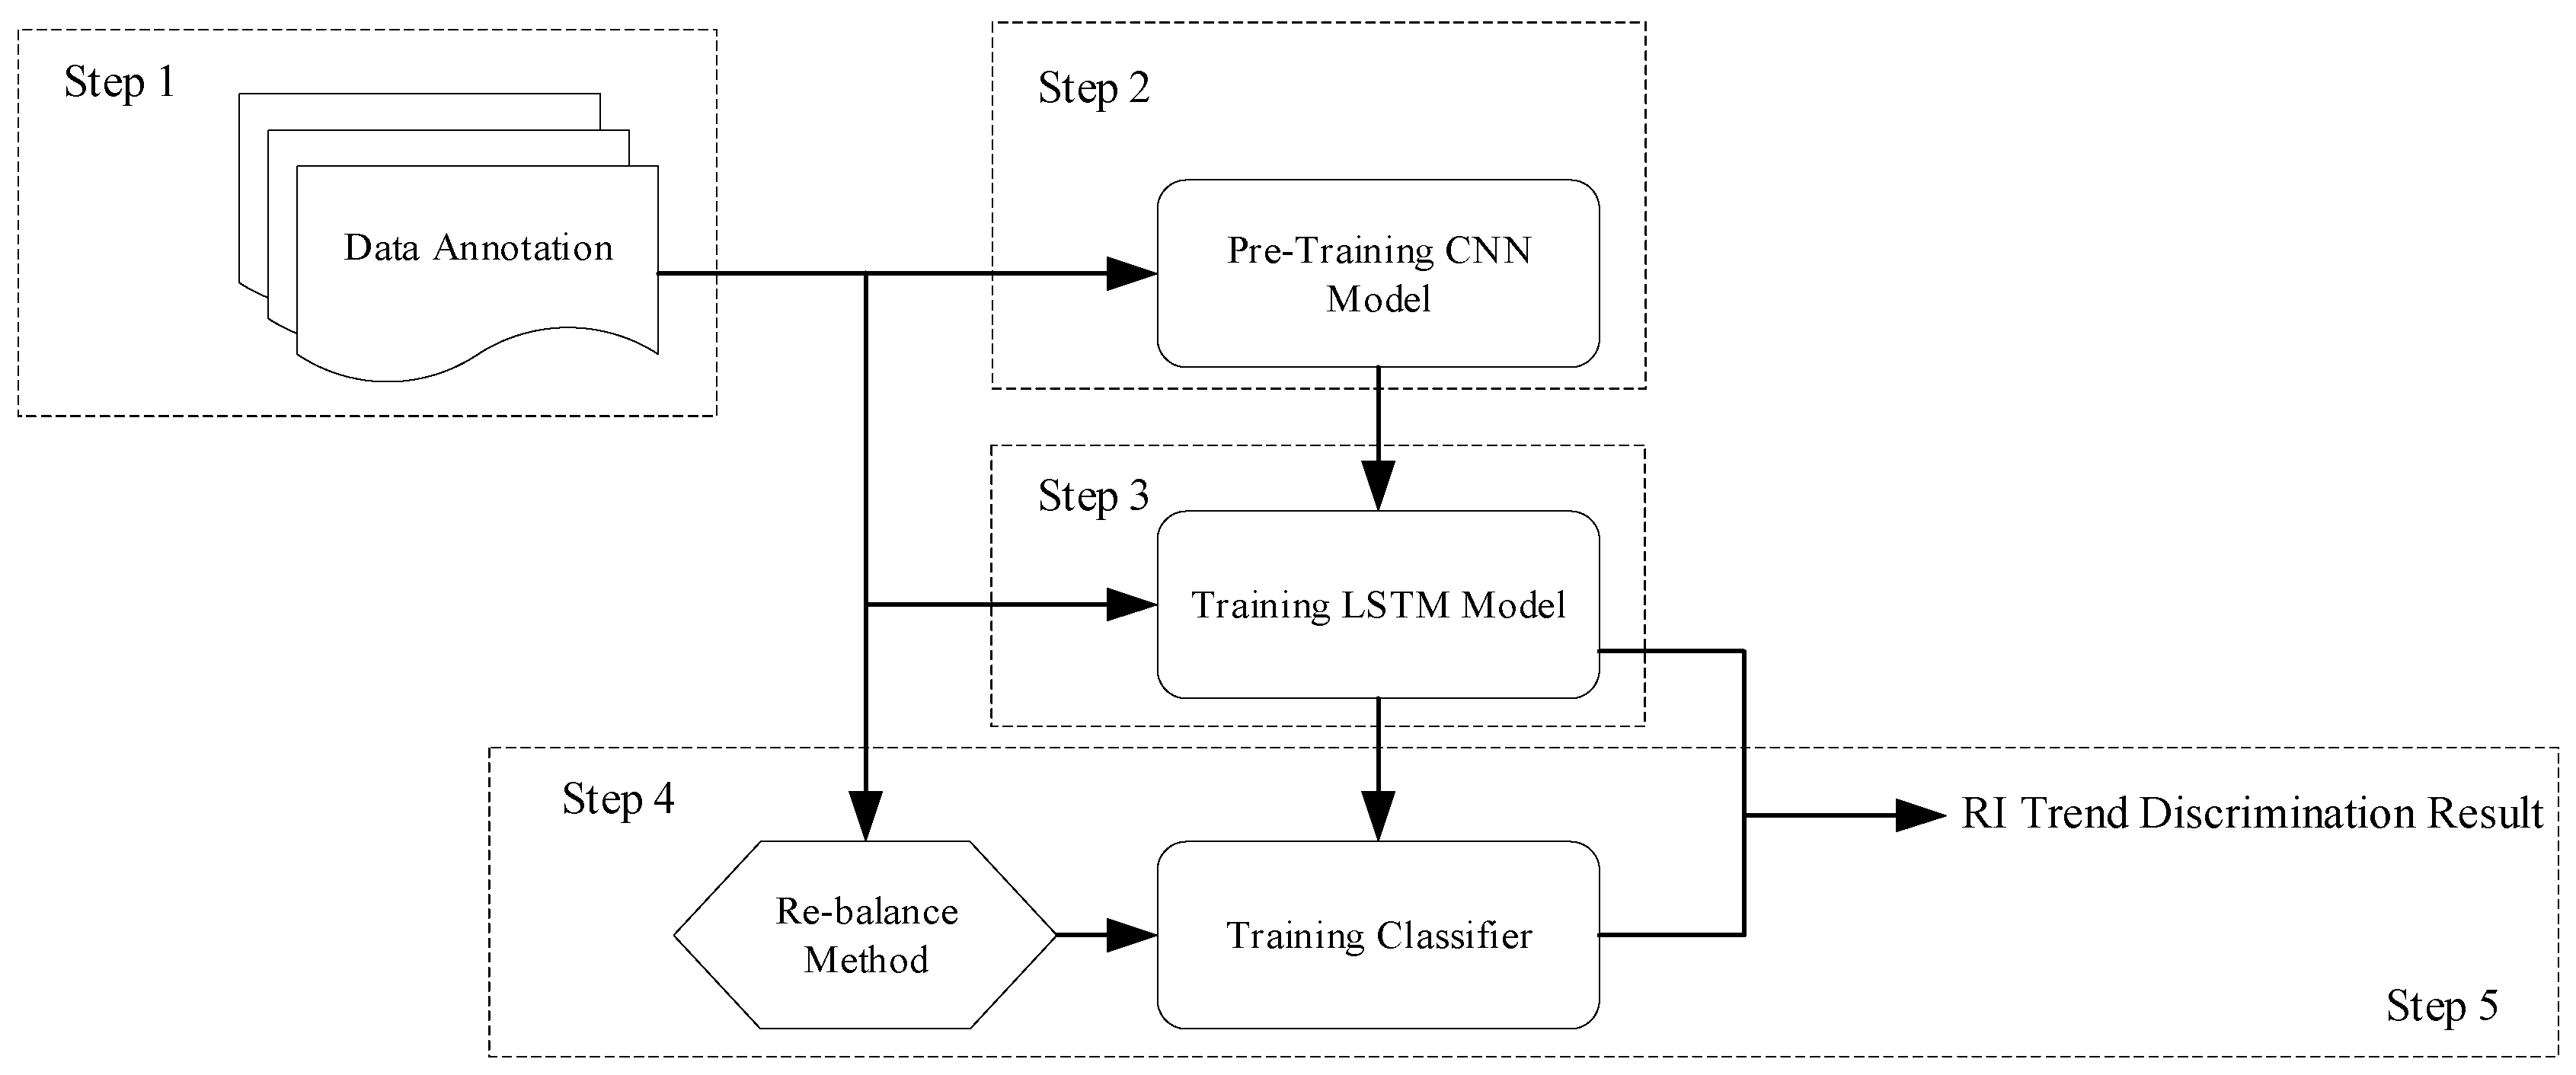
Figure 4.
Model technological process diagram.
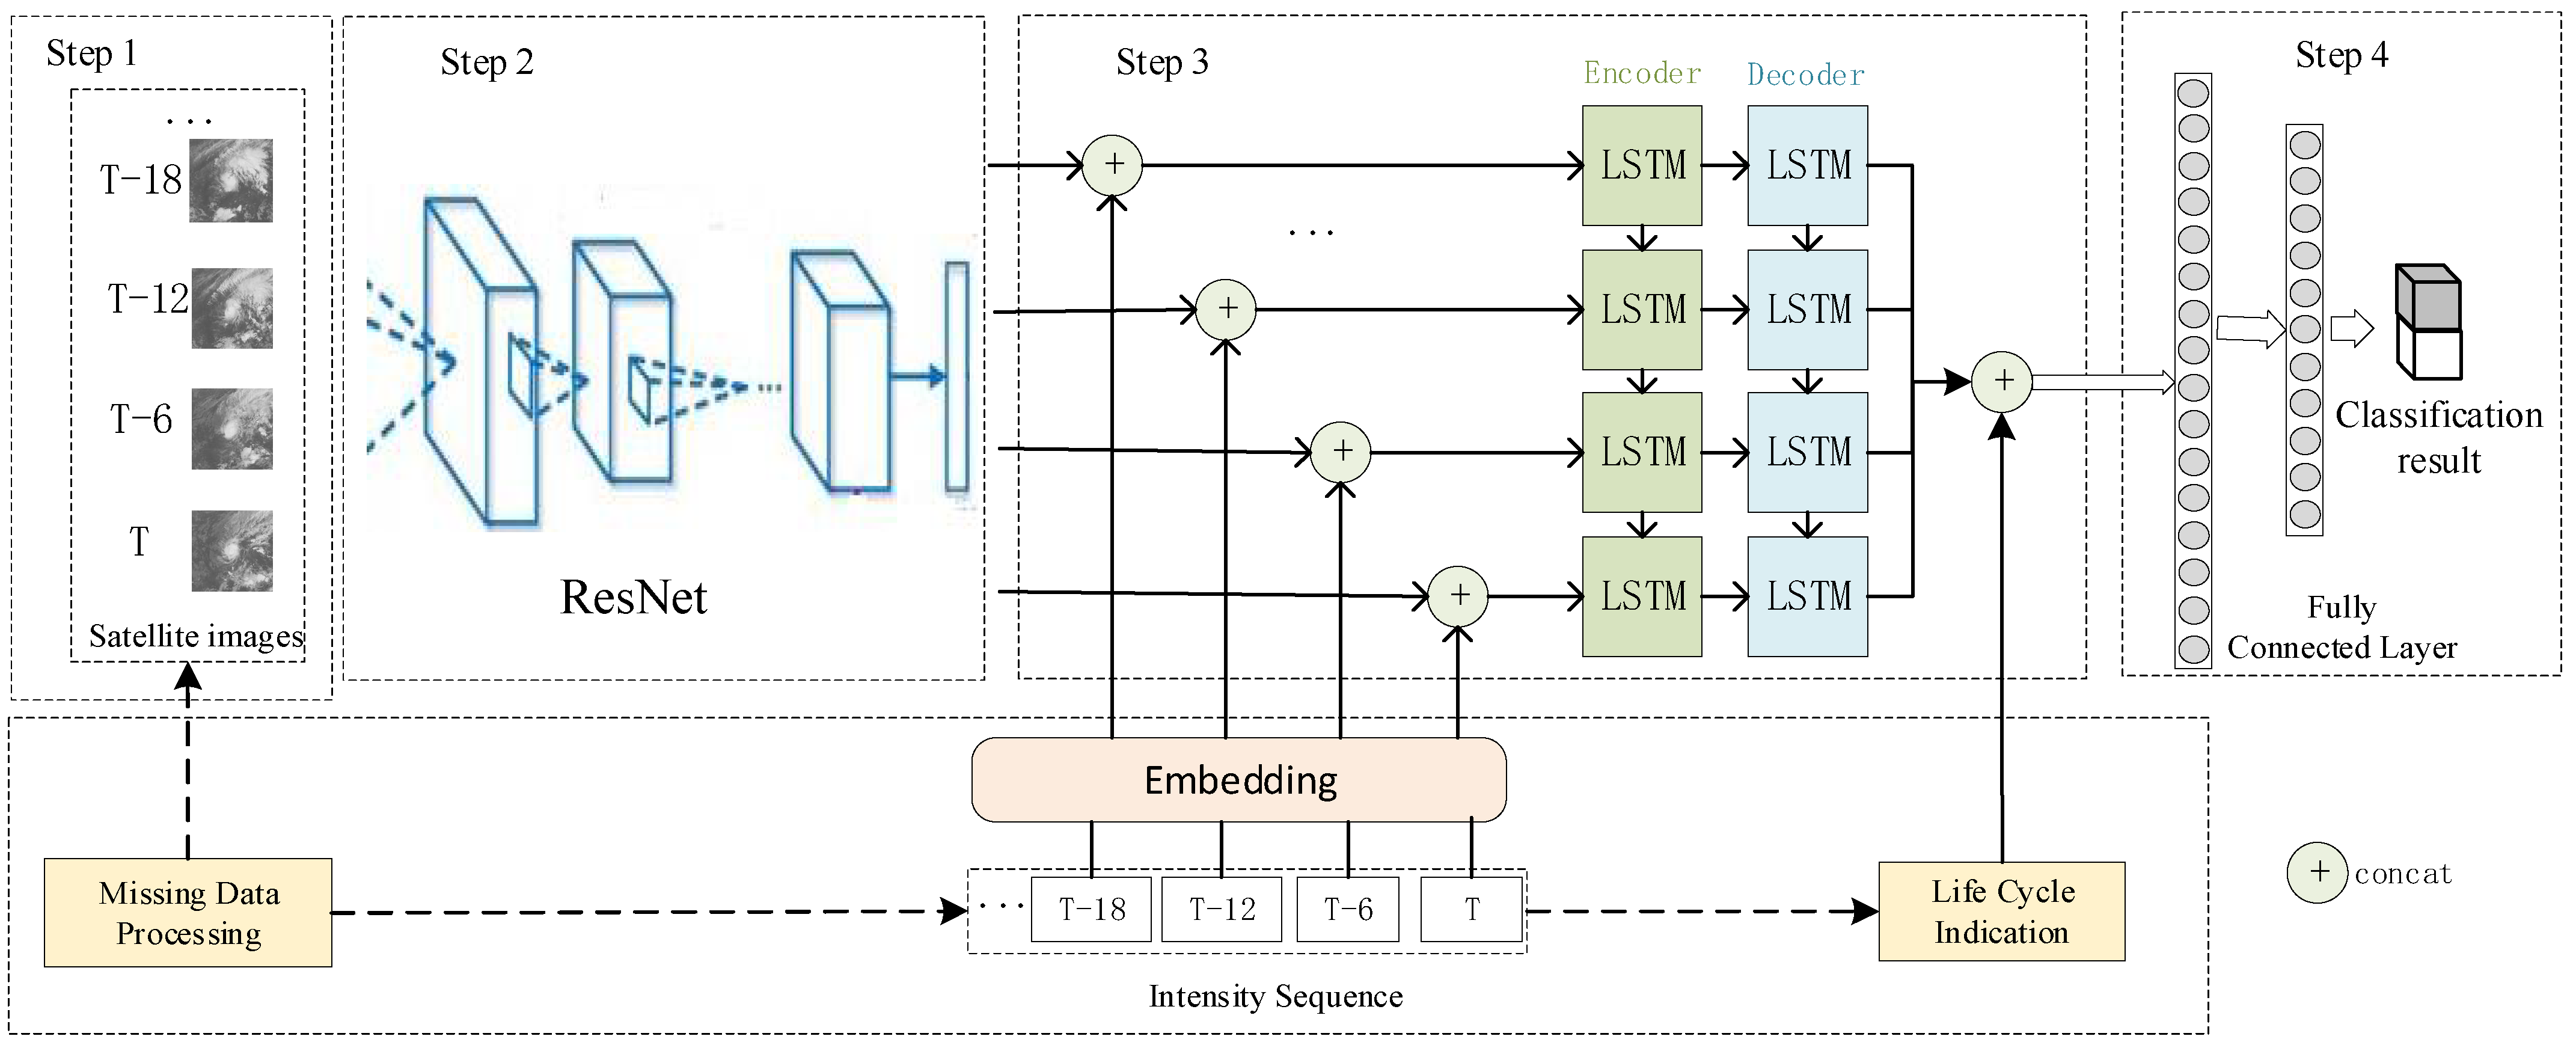
Figure 5.
Satellite remote sensing cloud images of No. 1909 Typhoon LEKIMA (a. 06:00 UTC on 6, b. 12:00 UTC on 6, c. 18:00 UTC on 6, d. 00:00 UTC on 7) August 2019 and cloud images of No. 1907 Typhoon Wipha (e. 12:00 UTC on 30, f. 18:00 UTC on 30, g. 00:00 UTC on 31, h. 06:00 UTC on 30) July 2019.
Figure 5.
Satellite remote sensing cloud images of No. 1909 Typhoon LEKIMA (a. 06:00 UTC on 6, b. 12:00 UTC on 6, c. 18:00 UTC on 6, d. 00:00 UTC on 7) August 2019 and cloud images of No. 1907 Typhoon Wipha (e. 12:00 UTC on 30, f. 18:00 UTC on 30, g. 00:00 UTC on 31, h. 06:00 UTC on 30) July 2019.
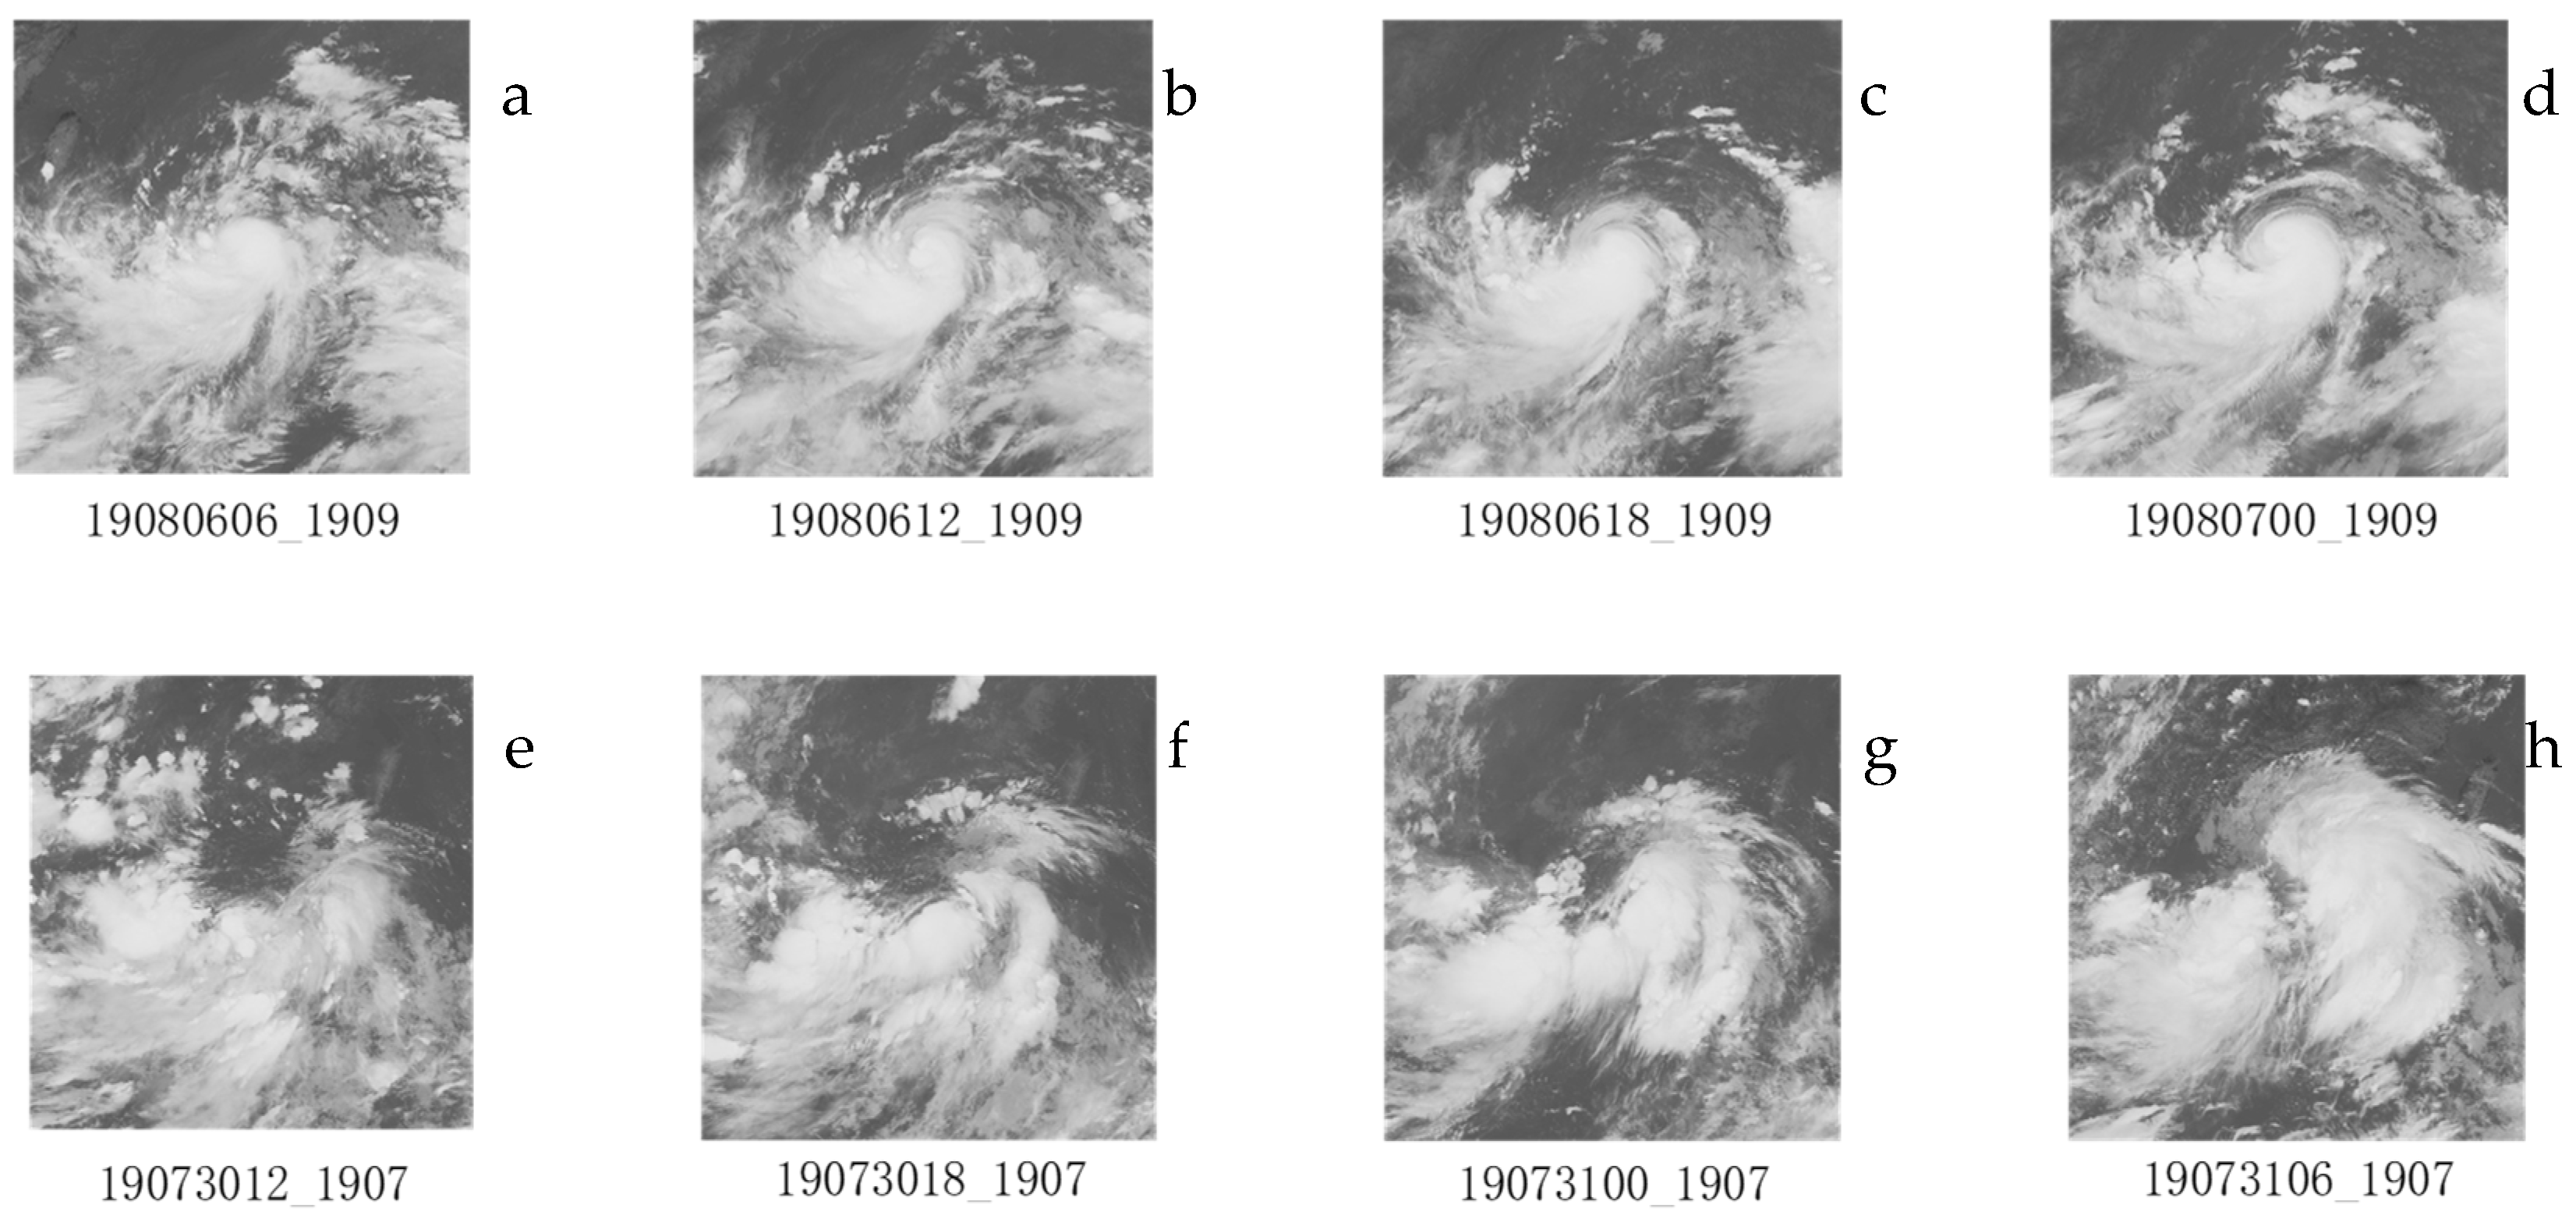
Figure 6.
The RI probability predicted by the model (purple asterisk) compared with the actual intensity (black dot line) and the forecast intensity of the NCEP model (blue line) and CMA (green line) for: (a) 1909 Typhoon LEKIMA, (b) 2019 Typhoon GONI, (c) 2102 Typhoon SURIGAE, and (d) 2114 Typhoon CHANTHU.
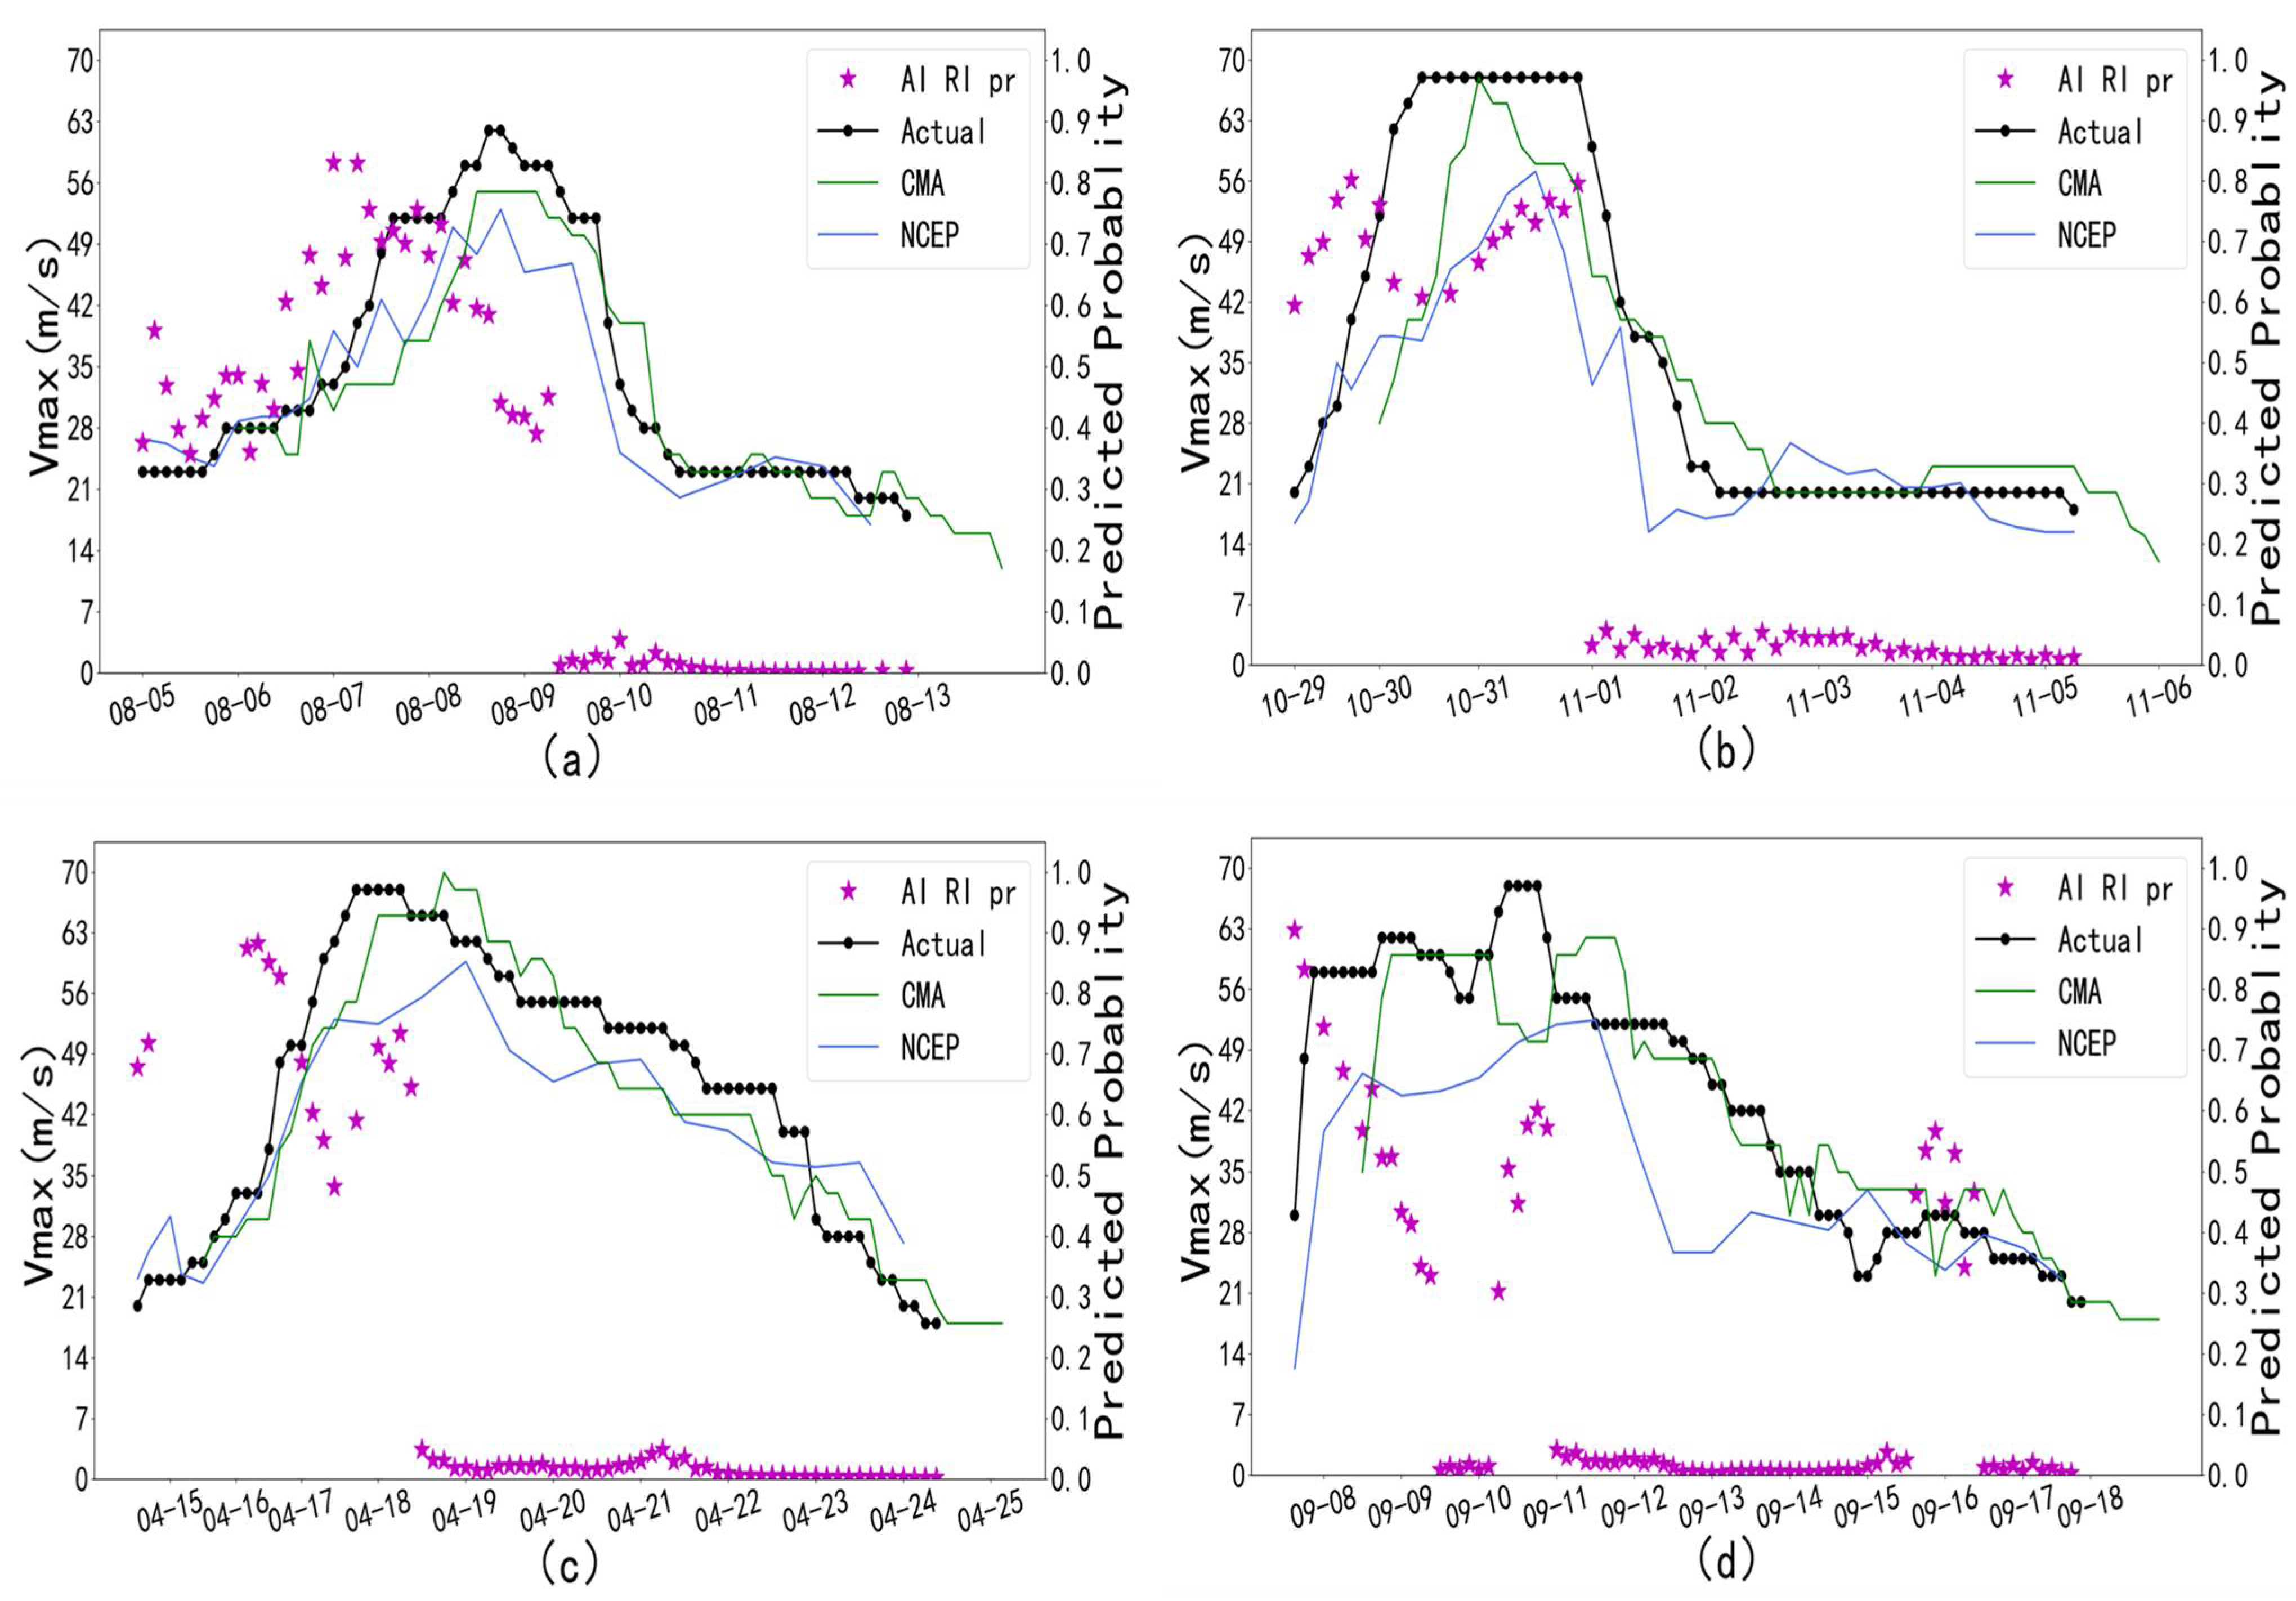
Figure 7.
(a) The FY-4A satellite cloud of Typhoon 1909 at 08–07 09:00; (b) is the heat map obtained by passing through the ResNet model and convolving the last layer of the ResNet model; (c) is obtained by superimposing (a) and (b) together.
Figure 7.
(a) The FY-4A satellite cloud of Typhoon 1909 at 08–07 09:00; (b) is the heat map obtained by passing through the ResNet model and convolving the last layer of the ResNet model; (c) is obtained by superimposing (a) and (b) together.


Table 1.
Comparison table for the selection of the RI probability threshold for model prediction.
| TP | FP | TN | FN | FPR | FNR | TS | |
|---|---|---|---|---|---|---|---|
| 39 | 134 | 292 | 7 | 31.5% | 15.2% | 0.22 | |
| 38 | 116 | 310 | 8 | 27.2% | 17.3% | 0.24 | |
| 35 | 95 | 331 | 11 | 22.3% | 23.9% | 0.25 |
Table 2.
Comparison table between the AI algorithm and different subjective and objective forecasts.
Table 2.
Comparison table between the AI algorithm and different subjective and objective forecasts.
| TP | FP | TN | FN | FPR | FNR | TS | |
|---|---|---|---|---|---|---|---|
| NCEP | 22 | 52 | 474 | 29 | 10.0% | 56.9% | 0.21 |
| CMA | 16 | 79 | 898 | 15 | 8.1% | 48.4% | 0.15 |
| AI | 38 | 116 | 310 | 8 | 27.2% | 17.3% | 0.24 |
Publisher’s Note: MDPI stays neutral with regard to jurisdictional claims in published maps and institutional affiliations. |
© 2022 by the authors. Licensee MDPI, Basel, Switzerland. This article is an open access article distributed under the terms and conditions of the Creative Commons Attribution (CC BY) license (https://creativecommons.org/licenses/by/4.0/).
Share and Cite
MDPI and ACS Style
Zhou, G.; Xu, J.; Qian, Q.; Xu, Y.; Xu, Y. Discriminating Technique of Typhoon Rapid Intensification Trend Based on Artificial Intelligence. Atmosphere 2022, 13, 448. https://doi.org/10.3390/atmos13030448
AMA Style
Zhou G, Xu J, Qian Q, Xu Y, Xu Y. Discriminating Technique of Typhoon Rapid Intensification Trend Based on Artificial Intelligence. Atmosphere. 2022; 13(3):448. https://doi.org/10.3390/atmos13030448
Chicago/Turabian StyleZhou, Guanbo, Jian Xu, Qifeng Qian, Yajing Xu, and Yinglong Xu. 2022. "Discriminating Technique of Typhoon Rapid Intensification Trend Based on Artificial Intelligence" Atmosphere 13, no. 3: 448. https://doi.org/10.3390/atmos13030448
Note that from the first issue of 2016, this journal uses article numbers instead of page numbers. See further details here.