1. Introduction
Comparative geomagnetic vector observations are a mutually corroborating operational recording process and are a fundamental means of ensuring operational continuity and stability for land-based geomagnetic repeat stations [
1,
2,
3]. As the sampling rate and resolution of magnetic variometers continue to increase, non-negligible measurement differences arise between comparative instruments [
4,
5]. Therefore, it is increasingly important and necessary to analyze and correct the data agreement of comparative observations. Broadly speaking, comparative geomagnetic vector observations can come from variometers with different probes or even from different platforms, such as seafloor geomagnetic observatories versus coastal land-based repeat observatories [
6] or satellite magnetic surveys versus ground observatories [
7]. More commonly, comparative geomagnetic vector observations are obtained from a pair of variometers with the same type of probes and from the same observatory.
After observing and analyzing data from several observatories with comparative observations from the Geomagnetic Network of China, we found that there were some significant and non-negligible differences in the comparative data, even between variometers with the same type of probe. The maximum absolute value of the difference between the daily comparative observations can be 1.5–3 nT, while for long-term comparative observations, where the data length is typically at least three months, this value can even reach 20–30 nT. There are various characteristics of the measurement difference between the daily and long-term comparative data. For daily data, the difference in the comparative measurements comes mainly from the relative attitude angles and scale factor between two sensors, as shown in
Figure 1a. According to the requirements for the construction of geomagnetic stations in China, there is a strict requirement for temperature control to be less than 0.3 °C per day and 3 °C per year in the variation rooms of geomagnetic observatories. Some geomagnetic observatories with good temperature control or small daily temperature differences, such as Lijiang Observatory, have temperature variations of less than 0.04 °C/day in their variation rooms. The effect of temperature is therefore negligible in the daily comparative data. For long-term comparisons, after daily corrections, i.e., corrections for attitude angle and scale factor, the difference in the comparative data is considered to be mainly due to temperature variations and other types of instrument drift. In
Figure 1b, all three components of the geomagnetic difference show the same trend as the temperature. With the increasing number of observatories running comparative observations, analyzing and correcting the agreement of comparative data may become an essential process for some operators of observatories and also for some data users [
8]. This process will further enhance the operational stability of geomagnetic observatories, and it should receive more attention as it also provides important theoretical guidance in verifying the quality of vector instruments.
In this paper, the characteristics of two long-term correction parameters, the relative temperature coefficient and the long-term time drift, are analyzed and discussed using observatory data from a broader source and a longer time span than in previous work. In terms of temperature effects, we have already identified some special cases where the relative temperature coefficient varies relatively significantly during different processes of warming and cooling, which means that this parameter has temperature asymmetry. This feature was further analyzed and, more importantly, proved to be somewhat generalized by four sets of two-year-long comparative data. Laboratory tests have shown that the main cause of the temperature asymmetry in the relative temperature coefficients comes from the temperature asymmetry in the temperature coefficients of the instrument itself. This is ultimately attributed to the temperature asymmetry of the fluxgate magnetometer core material. This problem can be solved by segmenting long time spans of comparative data according to temperature inflection points during long-term observations. The long-term time drift of the comparative data is not as significant as the relative temperature coefficient. We explored the extent to which the fitted linear residual distribution fits the normal distribution to assess the fitted model for long-term time drift. However, it was eventually found that the absolute value of the long-term time drift was very small or even negligible for comparative measurements performed using the variometers with the same type of probe. It is therefore recommended that long-term time drift correction be carried out with caution.
2. Data and Methodology
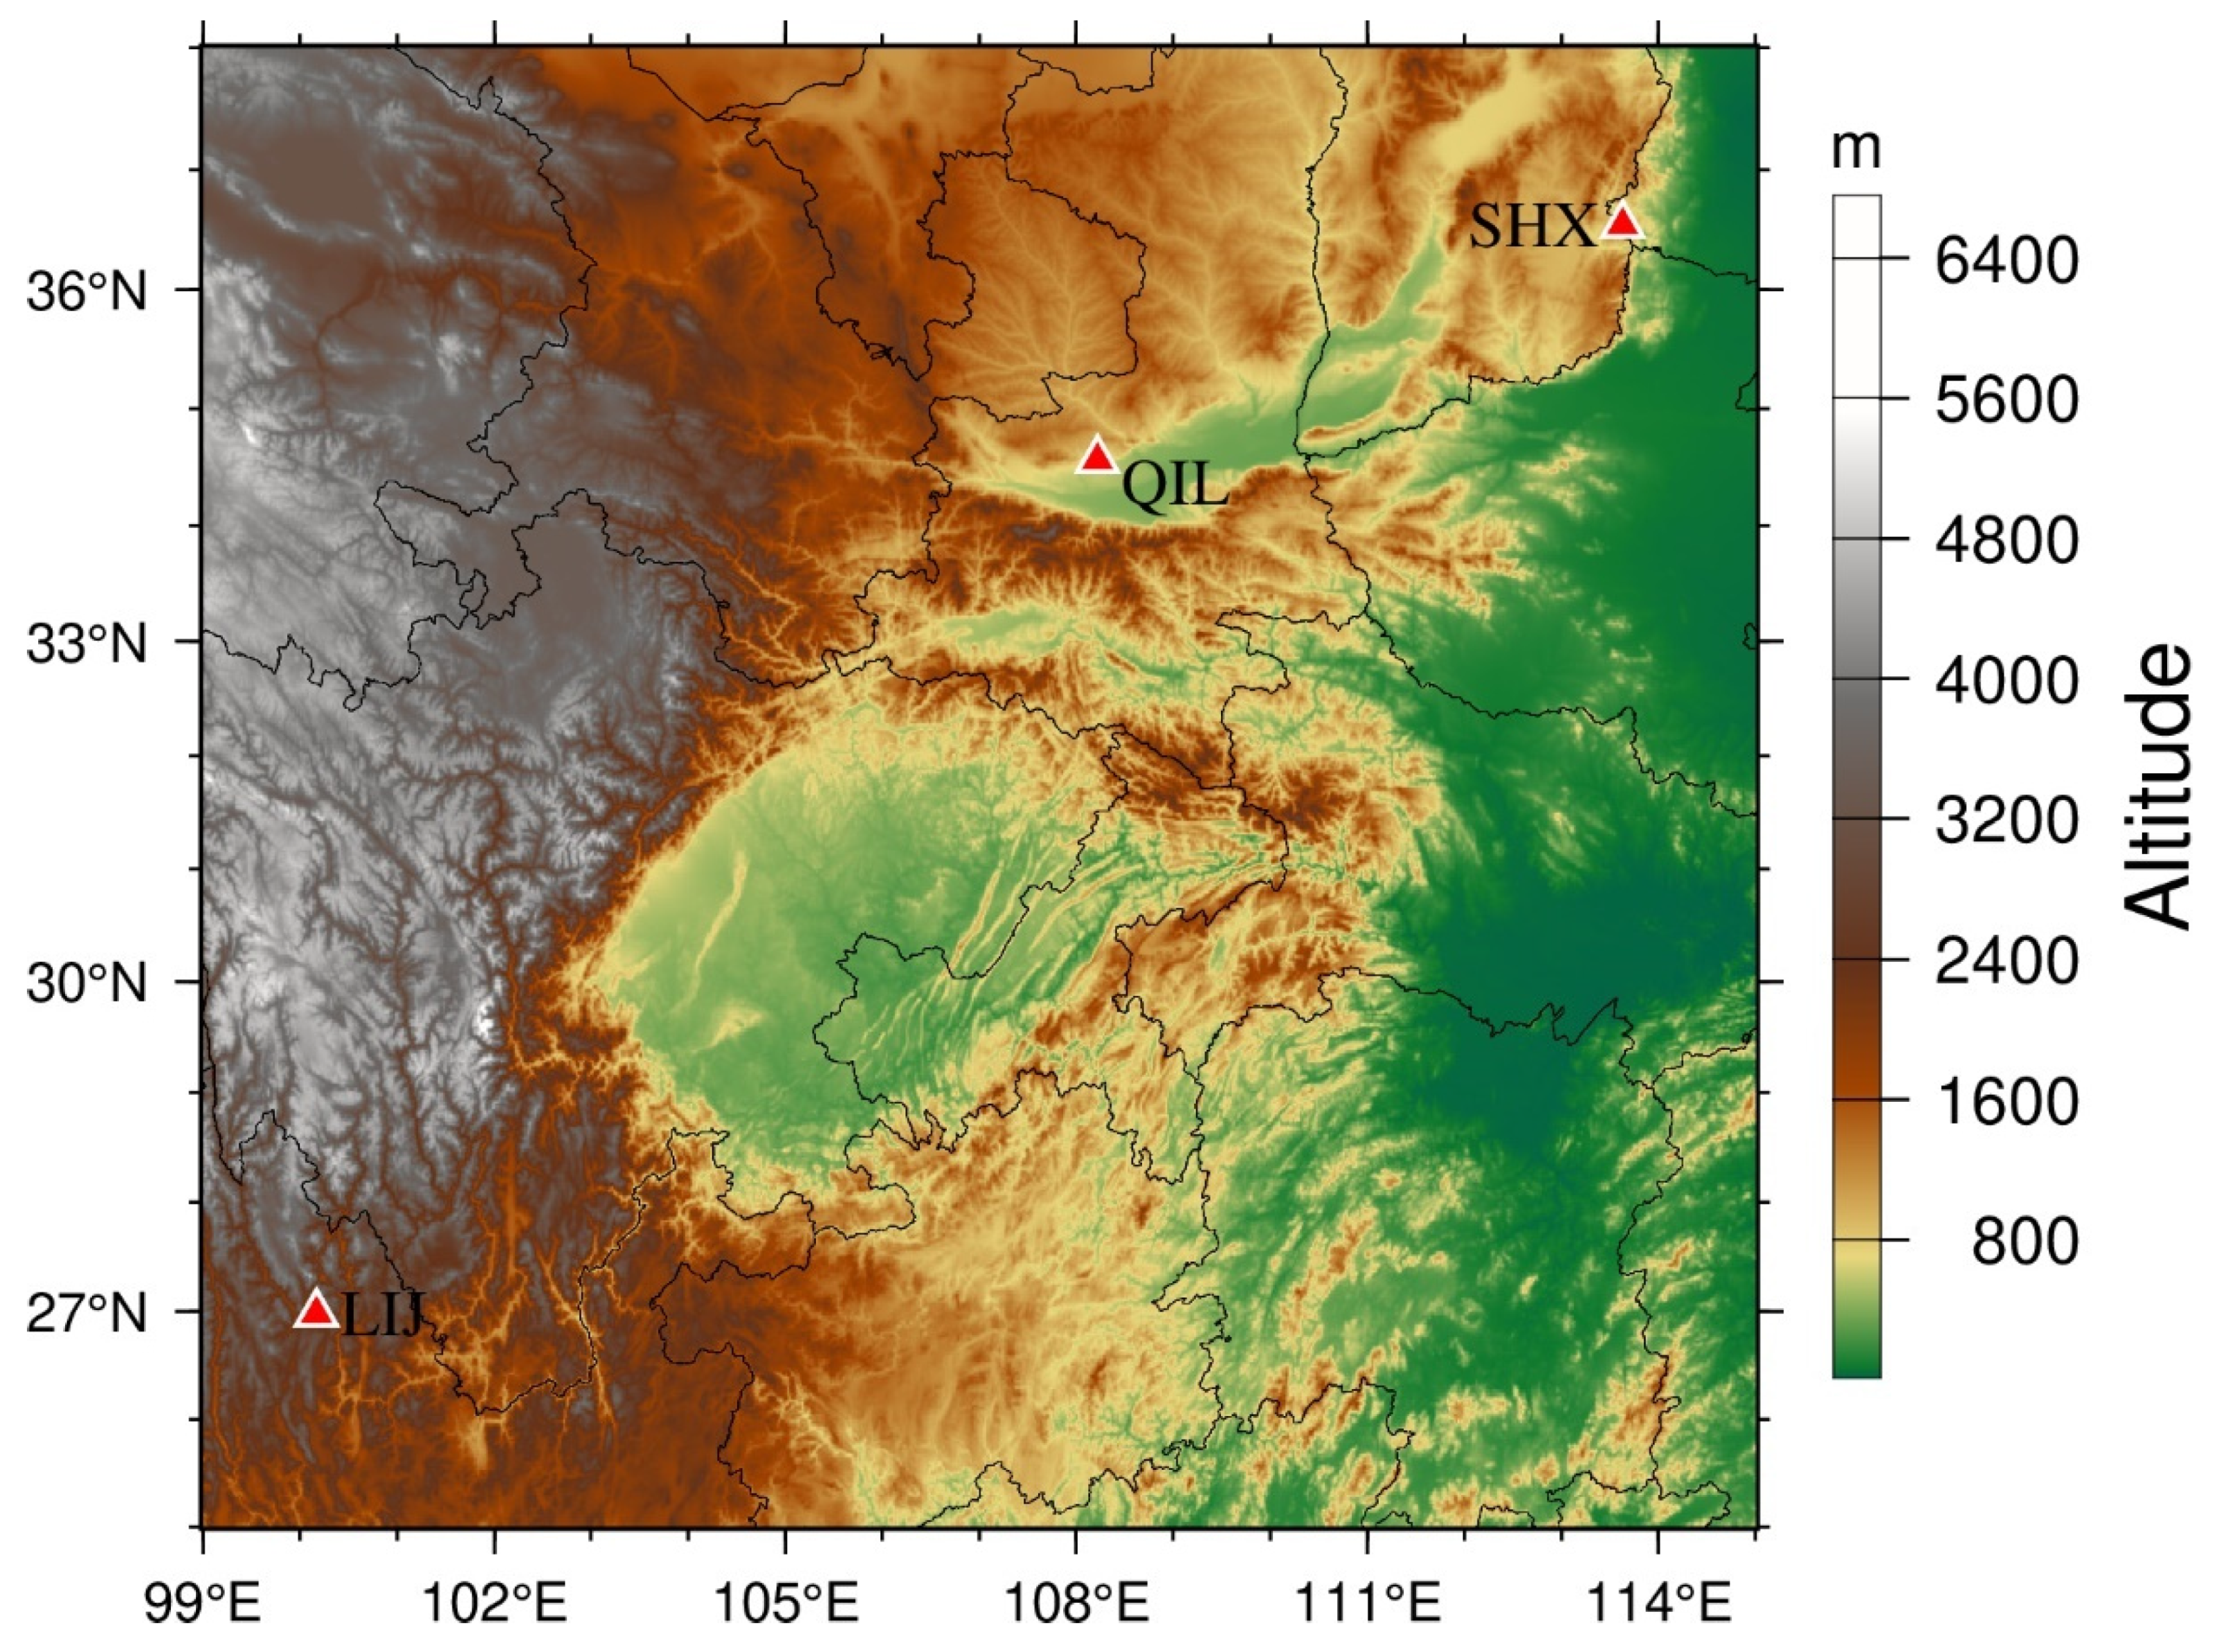
Four two-year-long sets of data were used to characterize the effects of temperature and instrumental drift in the long-term comparative observations from the Qianling observatory (January 2020–December 2021), the Lijiang observatory (May 2019–July 2021), and the Shexian observatory (January 2020–December 2021). The various time coverage of the comparative observations is mainly due to the fact that the station operational comparative observations at Qianling and Shexian observatories only started from January 2020, and the Lijiang observatory had construction interference from August 2021. The locations of these three observatories in China are shown in
Figure 2. In the subsequent analyses, the four sets of comparative data were named QIL-1, QIL-2, LIJ, and SHX for convenience, where QIL-1 and QIL-2 represent the comparative data from two different tested variometers against the same standard variometer in the Qianling observatory. These four sets of comparative measurements were carefully selected for their good temperature control performance over a longer period of time, the high completeness of the data record, and, more importantly, the high quality of the data with little influence from the observational environment. The magnetic variometers used in the comparative observations were the GM4 magnetometers developed by the Institute of Geophysics, China Earthquake Administration. GM4 is a compensated, non-suspended, three-component fluxgate magnetometer with a dynamic range of ±62,500 nT, a linearity better than 4‰, and rms noise less than 0.1 nT [
9,
10].
The methods used in this paper to calculate the correction for comparative observations and to evaluate the data agreement are described in detail in our earlier work [
8]. The main factors affecting the data agreement of the station comparative data are thought to be the attitude angle, the scale factor, the relative temperature coefficient and the long-term time drift. The attitude angle and scale factor are calculated day by day using a genetic algorithm. This method allows one to accurately and efficiently calculate the relative attitude angles between the two sets of instruments, and to obtain the scale factor introduced by the different voltages to the magnetic field conversion coefficients of the instruments. The relative temperature coefficients and the long-term time drift are obtained by linear regression analysis. The assumption that the long-term time drift is a linear model of the scale factor over time rather than a random error has been proposed in a comparative study between geomagnetic observation of the seafloor with geomagnetic observation of coastal stations, and such a comparison is an effective method in filtering out errors due to changes in the geomagnetic field baseline [
11]. In addition, in order to study and assess the agreement of data from comparative observations, qualitative and quantitative analyses were carried out using the B–A plot method rather than correlation coefficients. A typical trend in the distribution of points in the B–A plot qualitatively describes the relative relationship between the comparative measurements, and the length of the 95% confidence interval quantitatively describes the fluctuation of the differences in the comparative data [
12,
13]. Researchers can decide whether the corrected comparative data are satisfactory or whether further refined correction operations should be performed, depending on the requirements of their work.
3. Calculation Results and Assessment of Data Agreement
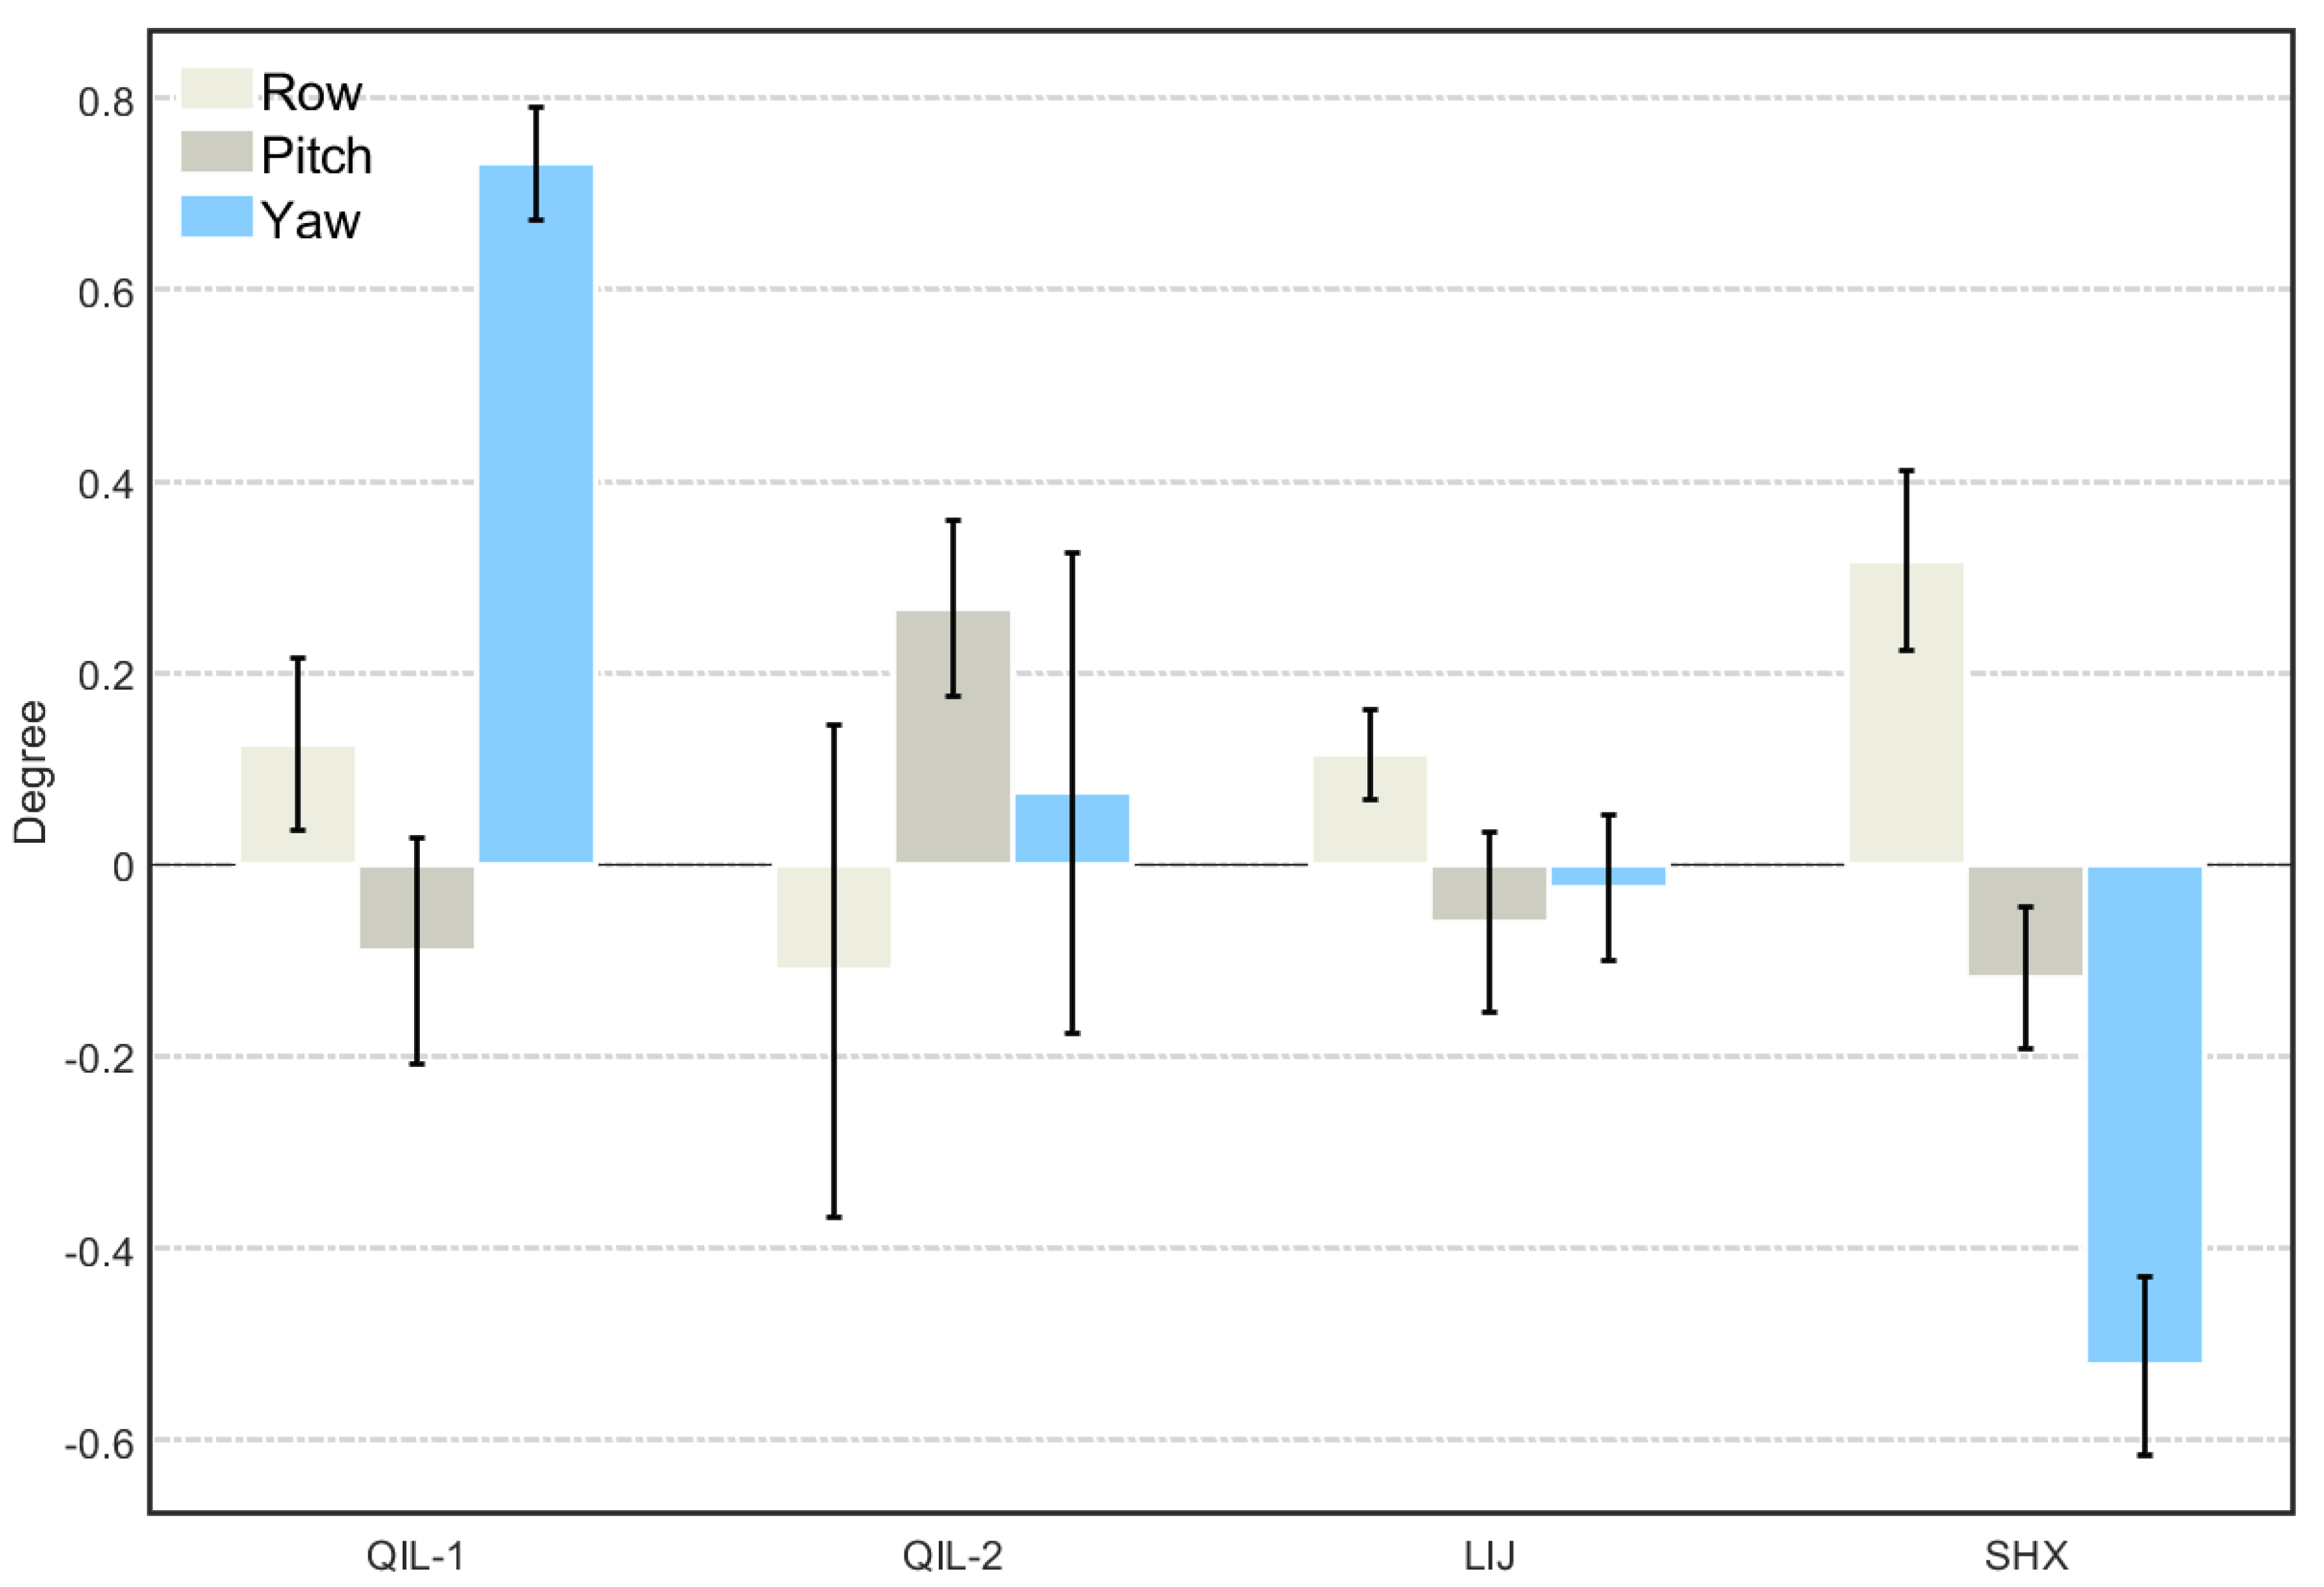
The correction parameters for the comparative data were calculated using progressive stripping. A genetic algorithm was implemented day by day to calculate the attitude angle and the scale factor. The relative attitude angles between the probes placed on the marble piers standing on the bedrock are usually considered to be fixed. Based on statistical calculations, histograms were created with an error bar for the attitude angles of the four sets of comparative measurements over a period of up to two years and are shown in
Figure 3.
As can be seen from
Figure 3, the standard deviation of the statistically calculated values of the attitude angle varies between the different sets of comparative data, and this fluctuation is mainly determined by the quality of the comparative measurements at each observatory. If the standard deviation of an angle calculation result is less than 0.057°, the introduced magnetic field error is less than 1 nT, which is tolerable. However, long-term comparative observations are often subject to a variety of disturbances and instrument restarts, which introduce data step problems. Therefore, an angular standard deviation of 0.057° is not always guaranteed. When the standard deviation of the angle is slightly greater than this limit and its mean value is neither negligible nor zero, we still consider there to be a relative attitude angle in that direction. Finally, we identified an attitude angle when the standard deviation is less than half the mean in a set of certain comparative data. In contrast, for cases where the standard deviation is significantly greater than the calculated mean, which means that the length of the error bar covers even its histogram, no significant relative attitude angle is considered to exist in that direction and a value of zero is taken.
After daily correction, a linear regression of the geomagnetic vector difference to the temperature or scale factor to the time series gives the relative temperature coefficient parameter and long-term time drift.
Table 1 shows the results of the four correction parameters calculated for the four sets of comparative data.
In
Table 1, the final determined attitude angle parameter is highlighted in bold and underlined. A positive attitude angle means that the tested instrument is rotating counterclockwise about a certain axis with respect to the standard instrument.
The B–A plot used to assess the comparative data agreement before and after correction is shown in
Figure 4, taking LIJ as an example.
Qualitatively, the diagonal distribution presented by the raw data in the B–A plot disappears after the daily correction, which is a typical effect of the attitude angle and the scale factor correction. Quantitatively, the 95% confidence intervals for the B–A plots decreased from 3.54/8.29 nT, 3.52/9.89 nT, and 6.96/15.83 nT to −1.29/0.15 nT, −1.61/−1.16 nT, and −1.41/0.66 nT, respectively, before and after correction. The length of the interval is significantly reduced, and the mean value of the difference is closer to zero, which is more in line with the B–A plot model of random error.
The 95% confidence intervals before and after correction for the remaining three sets of comparative measurements are shown in
Table 2.
The mean values of the differences in some correction results listed above are significantly different from zero, mainly due to some faulty restarts of the instrument over a 2-year period. The restarting of the instrument is accompanied by the reoperation of the instrument’s compensation coil, whose compensation current corresponds to a change in the compensation magnetic field, thus creating a step in the data, which causes the mean value to deviate from zero. Furthermore, the length of the confidence interval for certain components of some comparative measurements, represented by the H component of QIL-2 and SHX, did not improve significantly after correction. In addition to some problems with the data quality itself, the relative temperature coefficients change before and after the temperature inflection point, giving a poor linear fit and thus a bad correction, especially if the actual relative temperature coefficient for that component is quite small.
4. Characteristics of the Relative Temperature Coefficient
For long-term comparative observations, there is usually an optimum data length for optimal correction. For instruments’ comparative testing, unlike linearity, frequency response, or other laboratory metrics [
14,
15], a pair of instruments needs to be placed in the natural geomagnetic field environment and observed for as long as possible to fully reflect the effects of temperature and time drift and to perform a series of relevant calibrations [
16,
17]. Since the test phase is always terminated by the actual observation mission, the test time will not last indefinitely apparently. Therefore, in either case, the length of the comparison data should always be segmented according to the actual situation. Fluxgate magnetometers are known to be highly sensitive to temperature [
18]. The effect of temperature on fluxgate magnetometers is usually described only by a fixed temperature drift rate even if its application scenario is not to monitor the geomagnetic field [
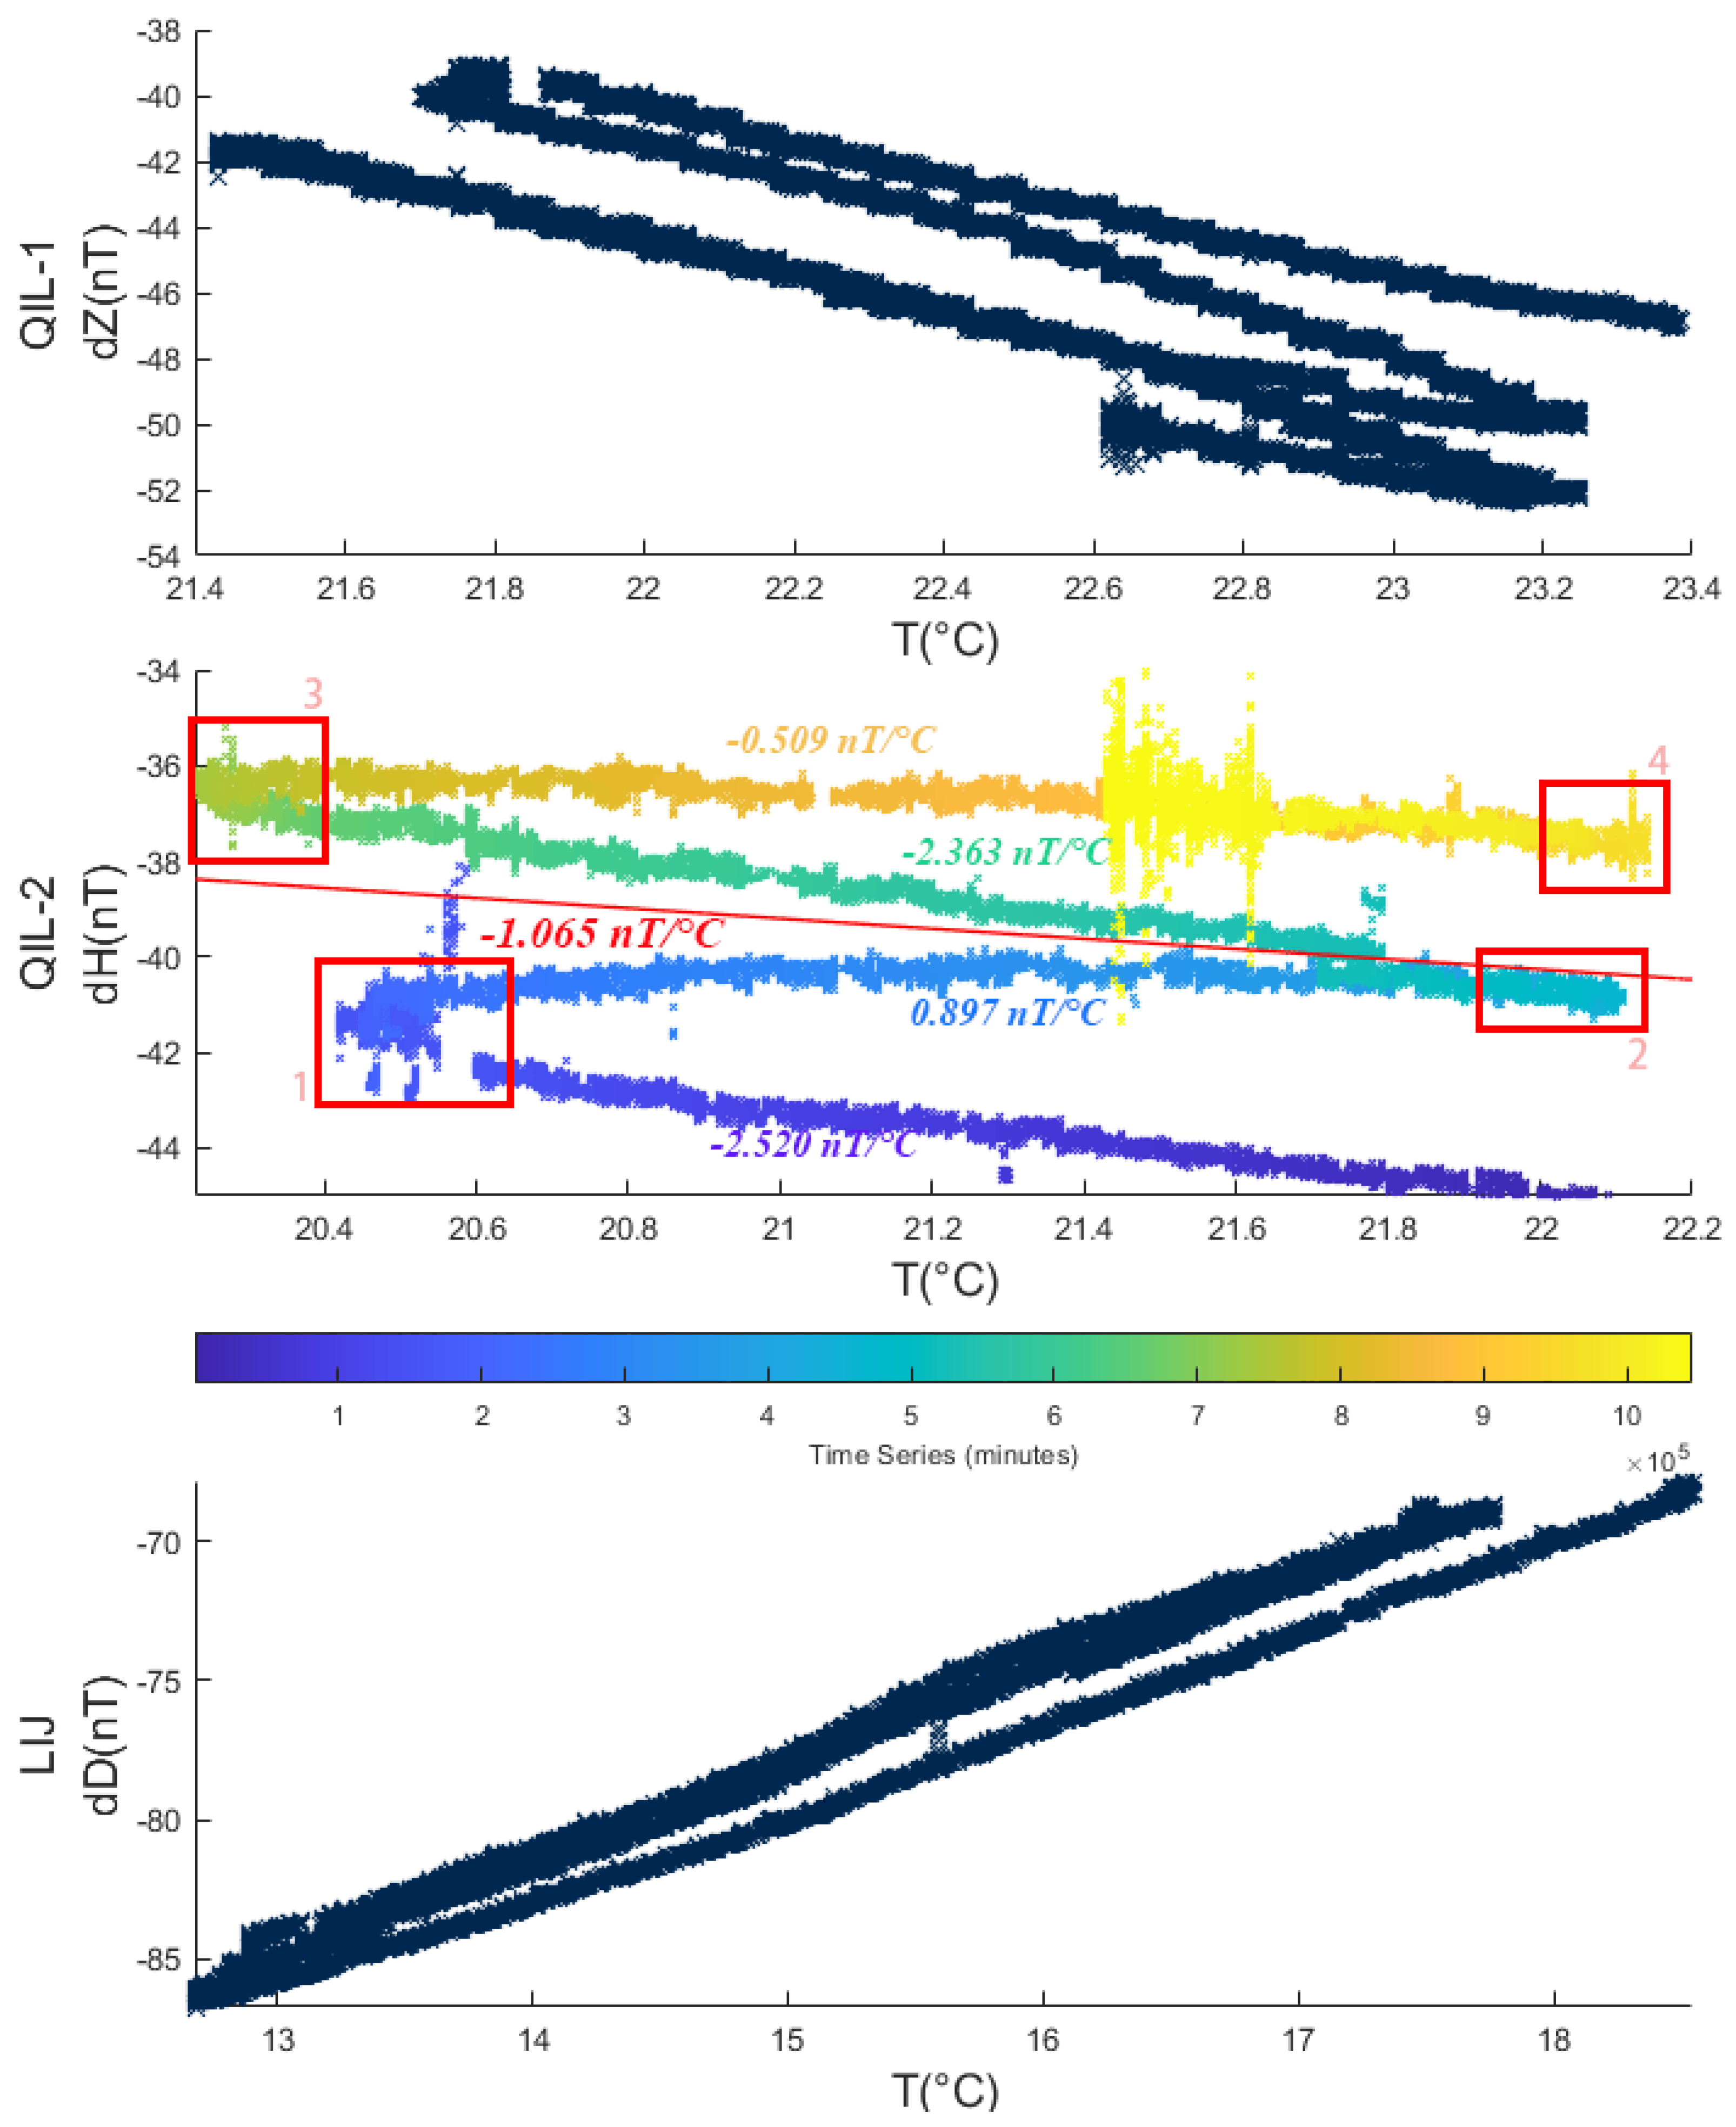
19]. However, we found in our long-term comparative geomagnetic observations that this effect leads to temperature asymmetry in the relative temperature coefficients. The scatter plots of the temperature versus the difference in comparative data show one or more V shapes, as shown in
Figure 5, which means that the relative temperature coefficient changes around the temperature inflection point.
The V-shaped distribution is common in scatter plots of the temperature versus the difference in comparative data.
Figure 5 shows scatter plots of the temperature versus the difference in the Z component of QIL-1, the H component of QIL-2, and the D component of LIJ. The H component of QIL-2 with the most pronounced trend was selected for specific analysis. In the middle panel of
Figure 5, the colors change from cool to warm, representing the passage of time from past to present. Red boxes 1, 2, 3, and 4 are the four temperature inflection points that occurred during the 2 years of the variation room, in May 2020, November 2020, May 2021, and November 2021, respectively. Large changes in the slope of the fitted straight line only occur during alternating temperature trends. For example, around red box 1 in
Figure 5, the slope of the purple line, representing the cooling process from January to April 2020, is −2.520 nT/°C, while the slope of the blue line, representing the warming process from June to October 2020, is 0.897 nT/°C. However, the slopes of the fitted straight lines are almost identical for the same trend of temperature change over discrete time periods. For example, the slope of the purple line in
Figure 5, representing the cooling process from January to April 2020, is −2.520 nT/°C, and similarly, the slope of the light green line, representing the cooling process from December 2020 to April 2021, is −2.363 nT/°C.
The V-shaped distribution in the scatter plot clearly has an impact on the slope and intercept of the linear regression of the relative temperature coefficients. Firstly, if the long-term comparative data are not segmented properly, there is a risk that the total slope will deviate significantly from the slope of the actual straight line in each segment and will not accurately reflect the relative temperature coefficients between the two sets of comparative instruments. Secondly, the intercept of the total fitted straight line may fail to represent any of the actual straight lines, resulting in large zero deviations in the temperature-corrected B–A plot.
To further corroborate the idea that the temperature drift rate of the instrument itself changes during warming and cooling, two tests were carried out in a laboratory temperature-controlled chamber environment. In Test 1, we placed the fluxgate magnetometer in a temperature-controlled chamber, which we, in turn, placed inside a magnetically shielded cylinder, with no external magnetic field applied. We adjusted the temperature control chamber so that the internal temperature could cool down before warming up. In Test 2, a constant magnetic field was applied to the shielded cylinder during the temperature change.
Figure 6 shows the scatter plots of the instrument temperature versus measured values for both tests. It can be seen that the laboratory tests also show a similar V-shaped distribution to the long-term comparative measurements, suggesting that the temperature coefficient of the separate magnetometer changes during the warming and cooling process.
We attribute this temperature asymmetry in the relative temperature coefficients to the characteristics of the sensor itself, specifically to the properties of the fluxgate core material. The temperature characteristics of fluxgate magnetometers have been investigated for different use cases [
20,
21], but there are still few descriptions of changes in the temperature coefficient of fluxgate magnetometers during temperature rise and fall. The dominant core materials for fluxgate magnetometers used to date for geomagnetic observations are permalloy and Co-based amorphous ribbons [
9], and instrument scientists in the geophysical field should pay attention to the basic properties of these materials for specific applications. At this stage, data segmentation based on temperature inflection points is always the best option for solving the long-term comparative data agreement correction.
5. Characteristics of Long-Term Time Drift
The time drift of an instrument usually refers to fluctuations in measurement over time that cannot be further corrected for by known influences. For a single fluxgate magnetometer, time drift refers to the presence of small measurement fluctuations that differ from noise even after testing for linearity, dynamic range, etc. Related studies point out that such drifting is generally due to random errors that float along either horizontal or inclined straight lines [
22,
23,
24]. In the field of geomagnetic observations, there are two broad categories of methods for calculating time drift. One of these is the calibration of the instrument time drift using records of a geomagnetic field baseline. This method usually uses the daily variation in the geomagnetic field recorded by a standard variometer with a good observing environment and good data quality at the observatory, and then combines the absolute observations of the geomagnetic field recorded by a fluxgate theodolite with a scalar magnetometer to obtain the calculation, which is similar in nature to the calibration of a vector instrument using a scalar one [
25]. Another method is to use the comparative geomagnetic vector observations to directly calculate the change in relative scale factor between the two sets of instruments [
11]. The former has the advantage of being able to obtain absolute time drift parameters for a single instrument, but there is some unavoidable error due to the introduction of the slow changes in the geomagnetic field baseline itself. The latter, which can be interpreted as the relative value of the time drift between the comparative instruments, filters out the error of the slowly changing geomagnetic field baseline during the comparison, but it requires knowledge of one of the instruments’ time drifts in order to give the absolute time drift values of the other.
The long-term time drift parameter in this paper falls into the latter category, i.e., the relative time drift between the comparative instruments. If the time drift of the two sets of instruments is less consistent, then a scatter plot of the time series and its scale factor will show a climbing or declining trend over time. Further, the residuals between the data points and the fitted points are considered to be random errors whose statistical distribution should be approximately normally distributed. With this method, the statistical distributions of the mean residual and the linear regression residual can be analyzed to check how well the linear regression model fits the actual data point set.
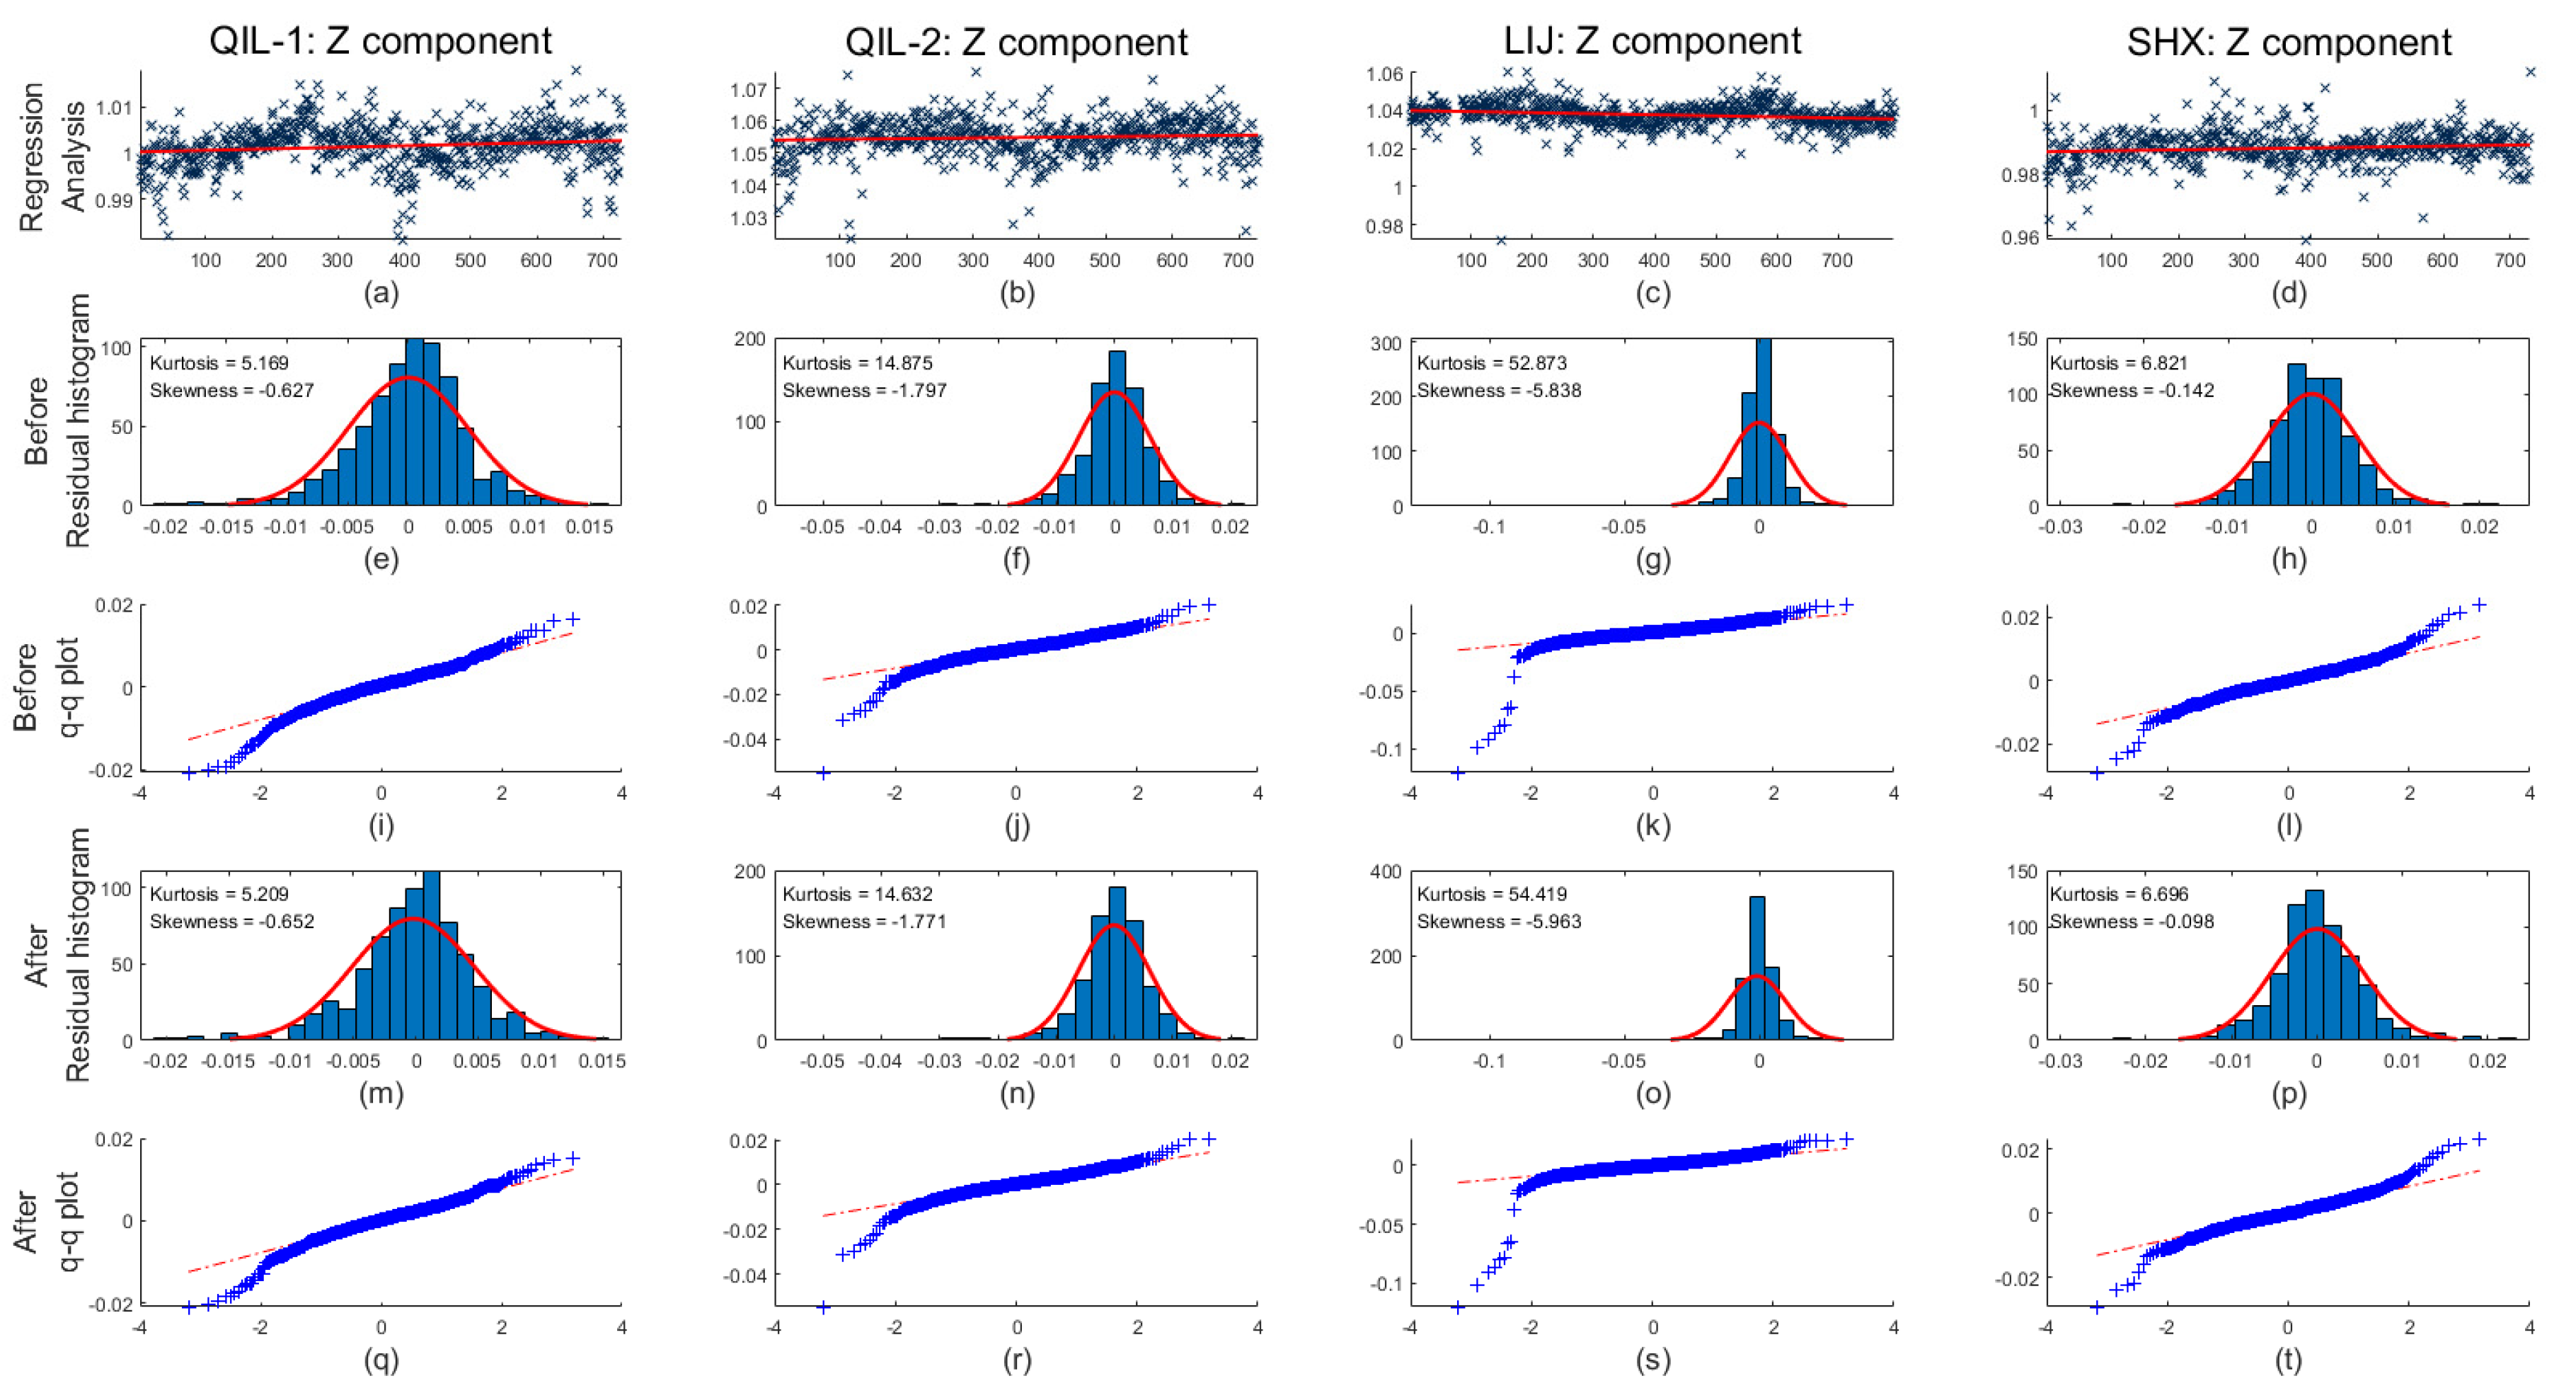
An example of the reliability analysis of the long-term time drift estimation is shown in
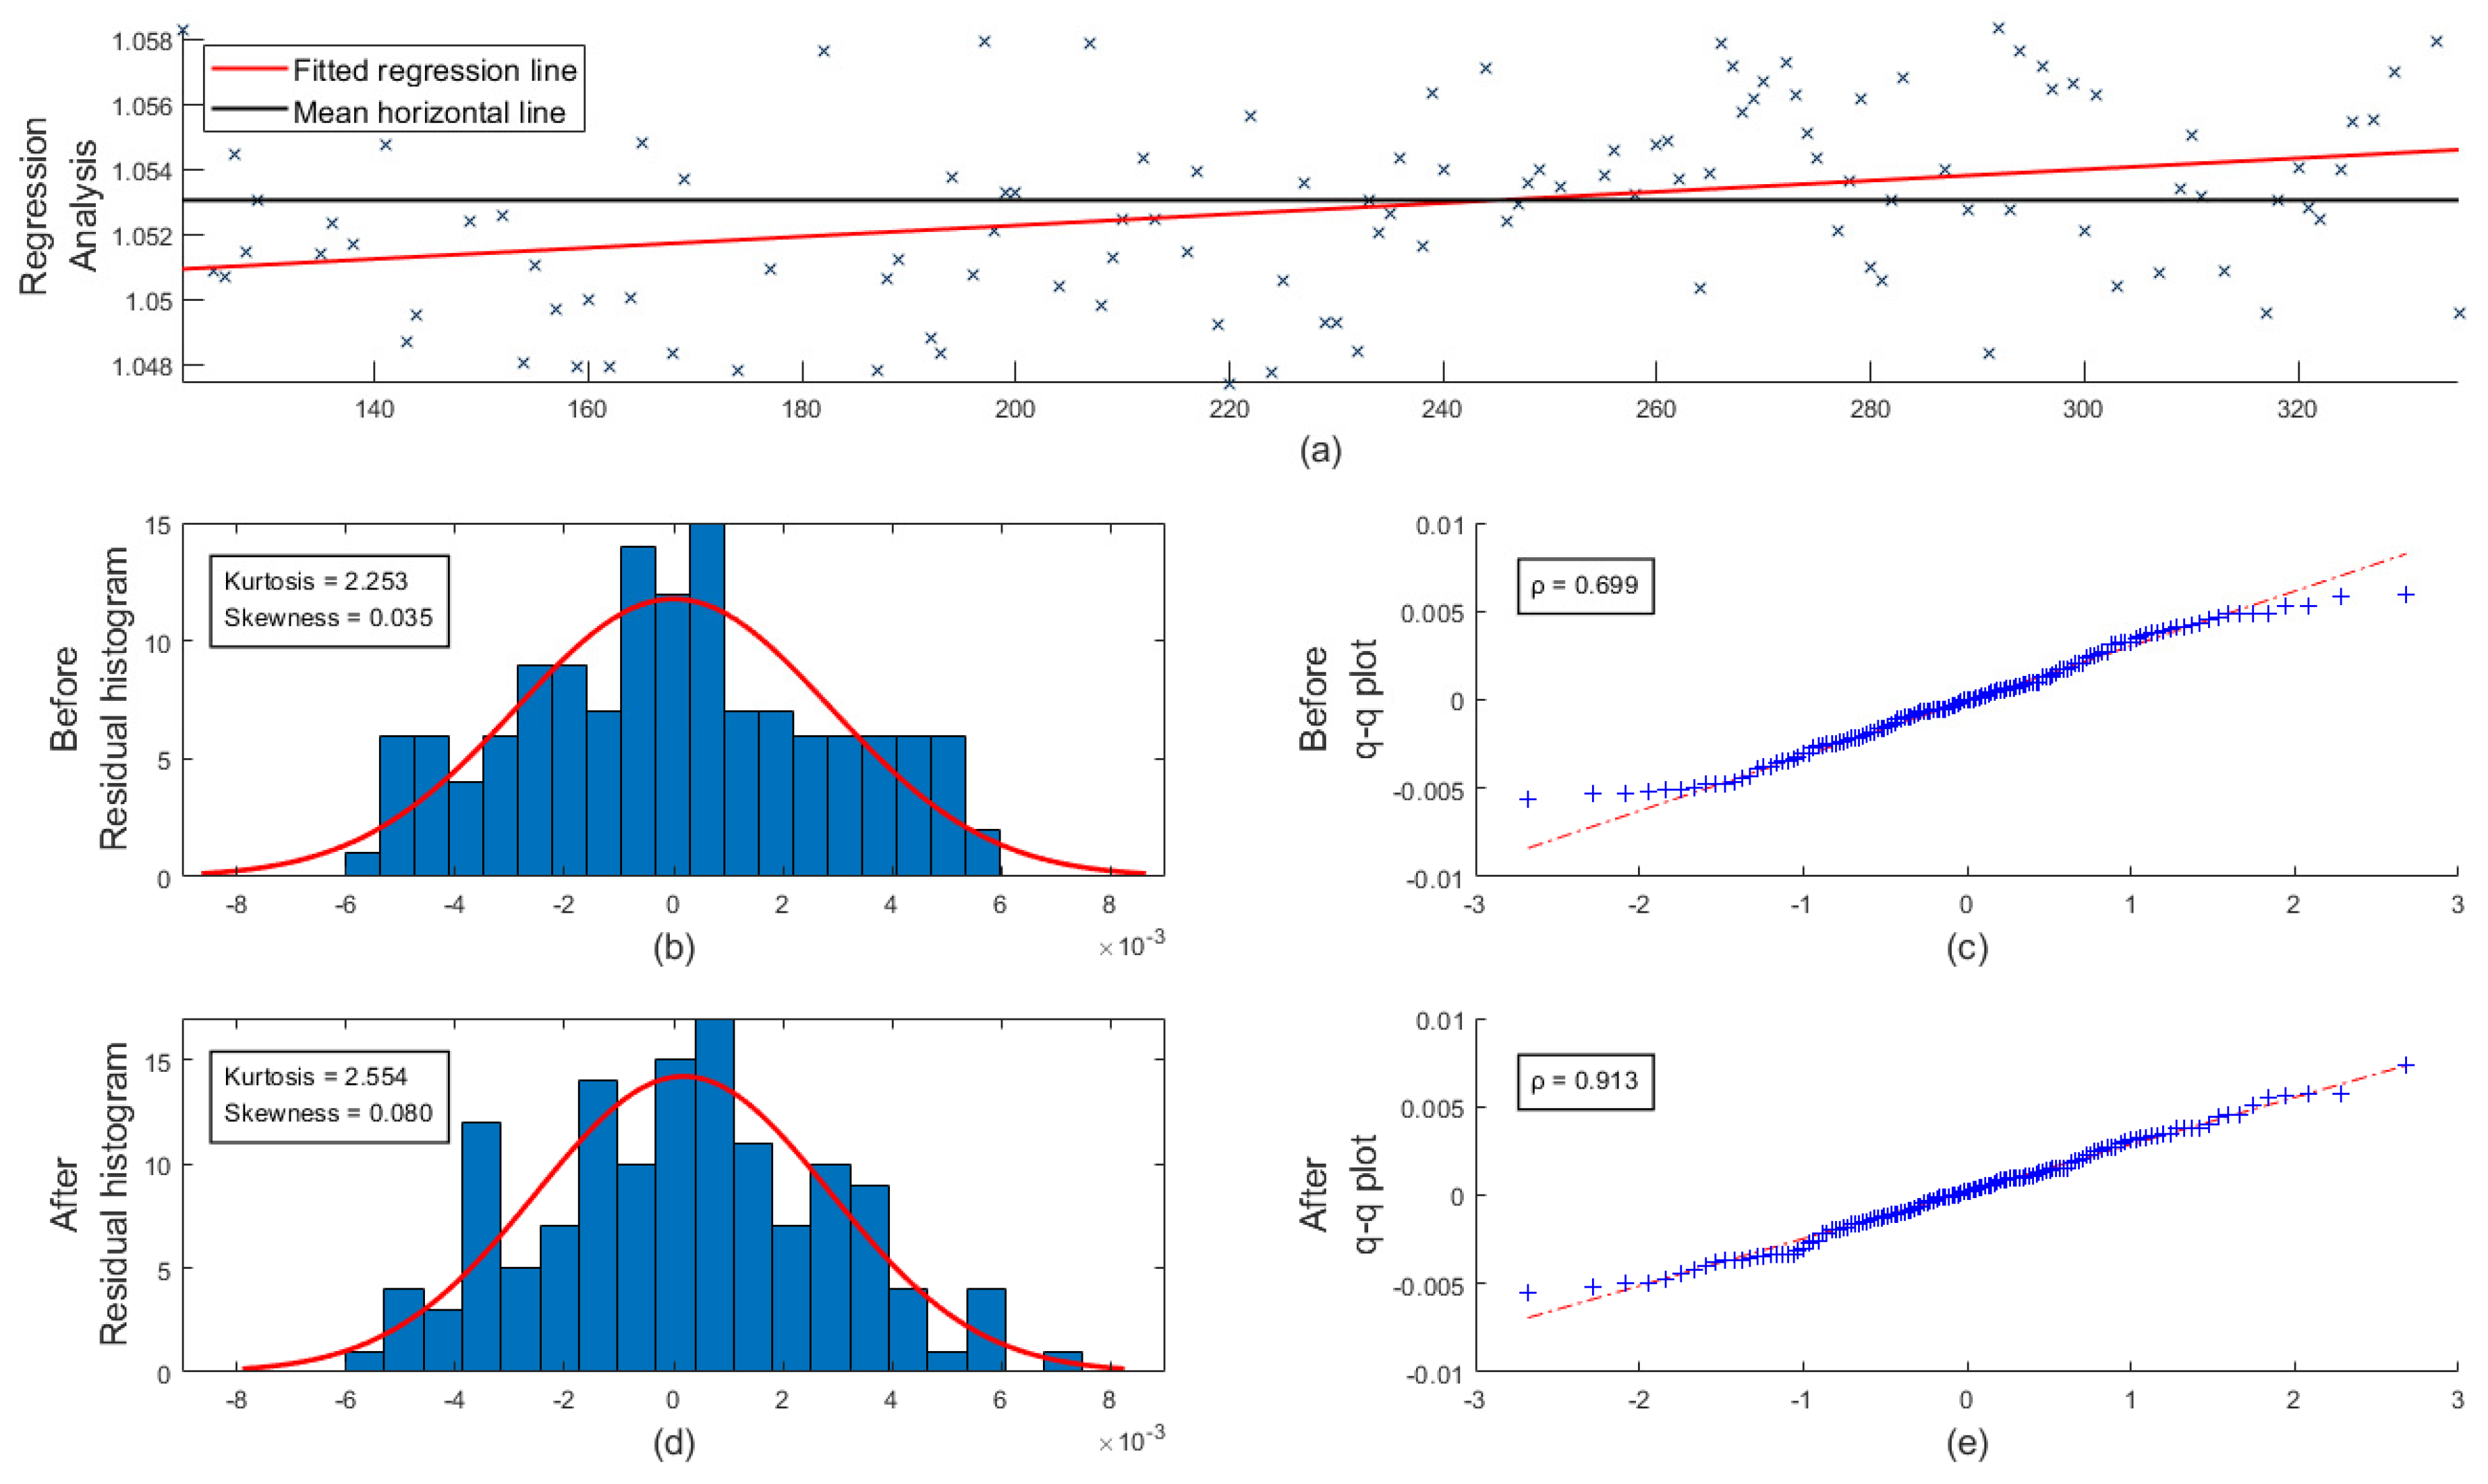
Figure 7, using QIL-2 comparative data from May to November 2020.
Figure 7a shows a scatter plot of the scale factor over time, in which the black line represents the mean value of the dataset and the red line represents the linear regression fitted line.
Figure 7b,d are histograms with a normal distribution fit, in which the black and red lines from
Figure 7a are selected as the corrected straight lines, respectively. The corresponding quantile–quantile plots (q–q plots) follow to the right of
Figure 7b,d in
Figure 7c,e, respectively, which also present the probabilities of similarity between experimental and normal theoretical distributions given by Pearson correlation analysis. These quantile–quantile plots display the quantiles of the residual versus the theoretical quantile values from a normal distribution. If the distribution of the residual is normal, then the data plot appears linear and the probability of similarity will be higher. It can be seen that the distribution in
Figure 7d is much closer to a normal distribution than the one in
Figure 7b. The kurtosis of the linear regression’s residual distribution is closer to the kurtosis value of the normal distribution, which is equal to three, the linearity of the data points in the corresponding q–q plots is greater, and the probability of similarity will be higher between experimental and normal theoretical distributions is much higher (from 0.699 to 0.913), all of which indicate that the linear regression of the time drift has a positive correction effect to some extent. However, after examining the long-term time drift of four sets of two-year-long comparative measurements, we concluded that the long-term time drift of the same probe fluxgate variometers that meet the operational requirements of the Geomagnetic Network of China is so small that it can be neglected without correction.
The drift linear regression analysis for long-term time and the associated histograms with a normal distribution fit are presented in
Figure 8 for four comparative observations. Coincidentally or not, the largest absolute values of long-term time drift in all four sets of comparative measurements are in the Z component. In both
Figure 8 and the long-term time drift section of
Table 1, we can see that the absolute values are very small, in the order of 10
−6 or even 10
−7, and the slope of the fitted straight line is nearly horizontal. The histogram of the residual distribution shows a normal-like distribution, whether corrected or not. The problem that the kurtosis of the residual distribution was much larger than the standard normal distribution was also not effectively improved after correction. In the q–q plots, improvements in linearity after linear regression correction rarely occur. The improved normality of the residual distribution in the histograms and the q–q plots after linear regression is not significant, indicating that the time drift of the fluxgate variometers that meet the requirements of the Geomagnetic Network of China is not significant. In terms of time drift, variometers show good performance or at least a consistent trend of drift. The long-term time drift reflects the relative relationship between the two instruments, so it is logical and practical that there is no large time drift between two magnetic variometers with the same type of probe. However, if researchers are performing comparative measurements between variometers with different types of probes, they should still pay attention to the calculation of the long-term time drift and the correction effect.
Unlike the effects of temperature, the results of calculating and correcting for long-term time drift parameters cannot be improved simply by changing the length of the dataset. On the contrary, the longer the length of the dataset, the better the results should reflect the characteristics of long-term time drift. The data used in the earlier work, as well as the data in this paper, do not yield a more significant long-term time drift, and therefore the long-term time drift correction can be left out of the actual comparative geomagnetic observations, as there is insufficient evidence that such linear regressions are reliable and valid. However, the calculation of relative drifts of instruments using a linear regression analysis of the change in the instruments’ scale factors over time is still of theoretical interest for different probe instruments or different observing platforms, such as coastal land-based station observations versus seafloor observations. This method can also be used to examine whether there is a significant time drift in the tested instrument in comparison with a standard instrument.
6. Conclusions
We analyzed four sets of two-year-long comparative observations from the Qianling, Lijiang, and Shexian observatories of the Geomagnetic Network of China. Parameters such as attitude angle, scale factor, relative temperature coefficient, and long-term time drift were calculated based on genetic algorithms and linear regression. The characteristics of the calculation of the relative temperature coefficient and the reliability analysis of the long-term time drift are highlighted.
By examining the scatter plots of temperature versus vector differences for multiple sets of comparative measurements, we found and confirmed that the relative temperature coefficients exhibit temperature asymmetry. During the alternation between warming and cooling, the relative temperature coefficients show a large difference or even a V-shaped distribution in the scatter plots, while during the same period of temperature change, the value varies very little. Segmenting the length of the data according to temperature trends can be a good solution to this problem.
On the other hand, the linear regression’s residual distribution of the long-term time drift is considered to consist of random errors conforming to a normal-like distribution. The model’s reliability can be tested qualitatively using histograms with a normal distribution fit and a q–q plot. However, using several analyses of the actual observed data, we found that the kurtosis of the residual distribution was larger than for the standard normal distribution. For fluxgate variometers with the same probe, the long-term time drift is not significant and the calculated results are small in absolute value, even negligible. Therefore, long-term time drift correction should be carried out carefully for operational comparative measurements from observatories. The calculation and correction of long-term time drift are still important for the purpose of testing and comparing instruments with different types of probes, and for testing the data agreement from different observation platforms.
Comparative geomagnetic vector observations can further improve the operational robustness of observatories, and the data agreement assessment and correction of the observations can improve the quality of the backup instruments, all of which can be of fundamental value in seismic analysis, earthquake forecasting, and spatial environment studies. Such tests and analyses should therefore attract more attention from instrument scientists and data processors from observatories.
Author Contributions
Conceptualization, Y.T.; methodology and formal analysis, Z.H.; investigation, X.Z.; resources, G.L.; writing—original draft preparation, Z.H.; writing—review and editing, Z.H.; visualization, X.S.; project administration, X.H.; funding acquisition, X.H. All authors have read and agreed to the published version of the manuscript.
Funding
This work was supported by National Key Research and Development Program of China (2018YFC1503803) and the Special Fund of the Institute of Geophysics, China Earthquake Administration (DQJB16B03).
Institutional Review Board Statement
Not applicable.
Informed Consent Statement
Not applicable.
Data Availability Statement
The datasets analyzed during the current study are available from the corresponding author on reasonable request. The geomagnetic data are provided by the Geomagnetic Network of China.
Acknowledgments
We thank the Geomagnetic Network of China for the availability of geomagnetic data. We are grateful to the Beijing National Earth Observatory for providing the relevant temperature testing facilities. We also thank the handling editor, the academic editors, and the two anonymous reviewers for their suggestions and comments, which greatly improved the manuscript.
Conflicts of Interest
The authors declare no conflict of interest.
Abbreviations
| LIJ | Lijiang Geomagnetic Observatory |
| QIL | Qianling Geomagnetic Observatory |
| SHX | Shexian Geomagnetic Observatory |
References
- Marsal, S.; Curto, J.J. A new approach to the hourly mean computation problem when dealing with missing data. Earth Planet Space 2009, 61, 945–956. [Google Scholar] [CrossRef] [Green Version]
- Newitt, L.R.; Barton, C.E.; Bitterly, J. Guide for Magnetic Repeat Station Surveys; International Association of Geomagnetism and Aeronomy: Boulder, CO, USA, 1996. [Google Scholar]
- Elias, A.G.; de Haro Barbas, B.F.; Zossi, B.S.; Medina, F.D.; Fagre, M.; Venchiarutti, J.V. Review of Long-Term Trends in the Equatorial Ionosphere Due the Geomagnetic Field Secular Variations and Its Relevance to Space Weather. Atmosphere 2022, 13, 40. [Google Scholar] [CrossRef]
- Wang, X.M.; Teng, Y.T.; Tan, J.; Wu, Q.; Wang, Z. Influencing factors of tri-axial fluxgate sensor horizontal and orientation on the accuracy of geomagnetic variation records. Acta Seismol. Sin. 2017, 39, 429–435. [Google Scholar]
- Liu, C.; Teng, Y.T.; Wang, X.M.; Wu, Q.; Zhang, X.T. Consistency correction for the observed data of fluxgate magnetometer based on genetic algorithms. Prog. Geophys. 2019, 34, 0751–0756. (In Chinese) [Google Scholar] [CrossRef]
- Toh, H.; Goto, T.; Hamano, Y. A new seafloor electromagnetic station with an Overhauser magnetometer, a magnetotelluric variograph and an acoustic telemetry modem. Earth Planet Space 1998, 50, 895–903. [Google Scholar] [CrossRef] [Green Version]
- Hammer, M.D.; Cox, G.A.; Brown, W.J.; Beggan, C.D.; Finlay, C.C. Geomagnetic Virtual Observatories: Monitoring geomagnetic secular variation with the Swarm satellites. Earth Planets Space 2021, 73, 54. [Google Scholar] [CrossRef]
- He, Z.B.; Hu, X.X.; Teng, Y.T.; Zhang, X.X.; Shen, X.Y. Data agreement analysis and correction of comparative geomagnetic vector observations. Earth Planets Space 2022, 74, 29. [Google Scholar] [CrossRef]
- Wang, X.M.; Teng, Y.T.; Fan, X.Y.; Wang, C.; Wu, Q.; Ma, J. Design of a suspended high-stability fluxgate sensor. Meas. Sci. Technol 2021, 32, 065101. [Google Scholar] [CrossRef]
- Shen, X.Y.; Teng, Y.T.; Hu, X.X. Design of a Low-Cost Small-Size Fluxgate Sensor. Sensors 2021, 21, 6598. [Google Scholar] [CrossRef]
- Toh, H.; Hamano, Y.; Ichiki, M. Long-term seafloor geomagnetic station in the northwest Pacific: A possible candidate for a seafloor geomagnetic observatory. Earth Planet Space 2006, 58, 697–705. [Google Scholar] [CrossRef] [Green Version]
- Bland, J.M.; Altman, D.G. Measuring agreement in method comparison studies. Stat. Methods Med. Res. 1999, 8, 135–160. [Google Scholar] [CrossRef] [PubMed]
- Giavarina, D. Understanding bland altman analysis. Biochem. Med. 2015, 25, 141–151. [Google Scholar] [CrossRef] [PubMed] [Green Version]
- Zhao, L.; Du, A.M.; Qiao, D.H.; Sun, S.Q.; Zhang, Y.; Qu, J.M.; Guo, Z.F.; Li, Z.; Feng, X.; Gu, S.R.; et al. The ROVER fluxgate magnetometer. J. Deep. Space Explor. 2018, 5, 472–477. (In Chinese) [Google Scholar] [CrossRef]
- Pan, D.H.; Li, J.; Jin, C.Y.; Liu, T.H.; Lin, S.X.; Li, L.Y. A new calibration method for triaxial fluxgate magnetometer based on magnetic shielding room. IEEE Trans. Ind. Electron. 2019, 67, 4183–4192. [Google Scholar] [CrossRef]
- Hemshorn, A.; Auster, H.U.; Fredow, M. DI-flux measurement of the geomagnetic field using a three-axial fluxgate sensor. Meas. Sci. Technol. 2009, 20, 027004. [Google Scholar] [CrossRef]
- Alken, P.; Olsen, N.; Finlay, C.C. Co-estimation of geomagnetic field and in-orbit fluxgate magnetometer calibration parameters. Earth Planet Space 2020, 72, 49. [Google Scholar] [CrossRef] [Green Version]
- Snare Robert, C. A history of vector magnetometry in space. In Measurement Techniques in Space Plasmas Fields; Pfaff Robert, F., Borovsky Josep, E., Young David, T., Eds.; American Geophysical Union: Washington, DC, USA, 1998; pp. 101–114. [Google Scholar] [CrossRef]
- Rühmer, D.; Bögeholz, S.; Ludwig, F.; Schilling, M. Vector fluxgate magnetometer for high operation temperatures up to 250 °C. Sens. Actuators A Phys. 2015, 228, 118–124. [Google Scholar] [CrossRef]
- Nishio, Y.; Tohyama, F.; Onishi, N. The sensor temperature characteristics of a fluxgate magnetometer by a wide-range temperature test for a Mercury exploration satellite. Meas. Sci. Technol. 2007, 18, 2721. [Google Scholar] [CrossRef]
- Pang, H.F.; Chen, D.X.; Pan, M.C.; Luo, S.T.; Zhang, Q.; Luo, F.L. Nonlinear temperature compensation of fluxgate magnetometers with a least-squares support vector machine. Meas. Sci. Technol. 2012, 23, 025008. [Google Scholar] [CrossRef]
- Gordon, D.; Brown, R. Recent advances in fluxgate magnetometry. IEEE Trans. Magn. 1972, 8, 76–82. [Google Scholar] [CrossRef]
- Bartington, G.; Chapman, C.E. A high-stability fluxgate magnetic gradiometer for shallow geophysical survey applications. Archaeol. Prospect. 2003, 11, 19–34. [Google Scholar] [CrossRef]
- Meng, L.F.; Pan, Z.H.; Yi, Z.; Wang, G.Q.; Zhang, T.L. Error properties of the fluxgate magnetometer offset based on Davis-Smith method. Chin. J. Geophys. 2018, 61, 3545–3551. (In Chinese) [Google Scholar] [CrossRef]
- Olsen, N.; Tøffner-Clausen, L.; Sabaka, T.J.; Brauer, P.; Merayo, J.M.G.; Jørgensen, J.L.; Léger, J.-M.; Nielsen, O.V.; Primdahl, F.; Risbo, T. Calibration of the Ørsted vector magnetometer. Earth Planet Space 2003, 55, 11–18. [Google Scholar] [CrossRef] [Green Version]
| Publisher’s Note: MDPI stays neutral with regard to jurisdictional claims in published maps and institutional affiliations. |
© 2022 by the authors. Licensee MDPI, Basel, Switzerland. This article is an open access article distributed under the terms and conditions of the Creative Commons Attribution (CC BY) license (https://creativecommons.org/licenses/by/4.0/).


