
Effects of Rainfall on the Characteristics of Soil Greenhouse Gas Emissions in the Wetland of Qinghai Lake


1
School of Geographical Sciences, Qinghai Normal University, Xining 810008, China
2
Key Laboratory of Natural Geography and Environmental Processes of Qinghai Province, Qinghai Normal University, Xining 810008, China
3
Key Laboratory of Qinghai-Tibet Plateau Surface Process and Ecological Conservation, Ministry of Education, Qinghai Normal University, Xining 810008, China
*
Author to whom correspondence should be addressed.
Atmosphere 2022, 13(1), 129; https://doi.org/10.3390/atmos13010129
Submission received: 17 December 2021
/
Revised: 10 January 2022
/
Accepted: 10 January 2022
/
Published: 13 January 2022
(This article belongs to the Section Climatology)
Abstract
:Niaodao, a lakeside wetland, was used as the focus of this study to investigate the effect of rainfall changes on the greenhouse gas fluxes of wetland ecosystems. Wetland plots with different moisture characteristics (+25%, −25%, +75%, and −75% rainfall treatments and the control treatment (CK)) were constructed to observe in situ field greenhouse gas emissions at 11:00 and 15:00 (when the daily mean values were similar) in the growing season from May to August 2020 by static chamber–gas chromatography and to investigate the responses of wetland greenhouse gases to different rainfall treatments. The results showed the following: (1) The carbon dioxide (CO2) flux ranged from −49.409 to 374.548 mg·m−2·h−1. The mean CO2 emission flux was greater at 11:00 than at 15:00, and the +25% and +75% treatments exhibited substantially higher CO2 emissions. In addition, the CO2 flux showed a small peak at the beginning of the growing season when the temperature first started to rise. All treatments showed the effect of the CO2 source, and their effects were significantly different. (2) The methane (CH4) flux ranged from −213.839 to 330.976 µg·m−2·h−1 and exhibited an absorption state at 11:00 and an emission state at 15:00. The CH4 emission flux in August (the peak growing season) differed greatly between treatments and was significantly negatively correlated with the rainfall amount (p < 0.05). (3) The nitrous oxide (N2O) flux ranged from −10.457 to 16.878 µg·m−2·h−1 and exhibited a weak source effect throughout the growing season, but it was not significantly correlated with soil moisture; it was, however, negatively correlated with soil temperature. (4) The different treatments resulted in significant differences in soil physical and chemical properties (electrical conductivity, pH, total soil carbon, and total soil nitrogen). The rainfall enhancement treatments significantly improved soil physical and chemical properties.
1. Introduction
In 2019, the greenhouse gas concentration reached a historical high. The global mean concentrations of carbon dioxide (CO2), methane (CH4), and nitrous oxide (N2O) in this year were 410.5 ± 0.2 ppm, 1877.0 ± 2.0 ppb, and 332.0 ppb ± 0.1 [1], respectively, which were 148%, 260%, and 123% of the preindustrial levels [2]. Over a period of 100 years, the ratio of warming potentials per unit mass of CO2, CH4, and N2O was 1:28:265 [3]. Under the effect of human activities, the atmospheric concentrations of N2O and CH4 are increasing at annual rates of approximately 0.3% [1] and 0.8% [4], respectively. Soil is the main emission source of greenhouse gases in the atmosphere. Irrigation, fertilization, and farming methods all impact greenhouse gas emissions through affecting the physical and chemical properties of the soil [5]. Wetlands are ecosystems with rich species diversity and high productivity. The long-term flooded anaerobic environment of wetlands leads to the accumulation of organic matter, making wetlands an important CO2 sink [6]. Due to the dual effects of human activities and climate change, large-scale wetland degradation has gradually reduced the carbon (C) sink function of wetlands, and the accelerated decomposition of organic matter has released large amounts of CH4 and N2O [7].
In recent years, the water level of Qinghai Lake has been rising. In 2018, the area of the lake reached 4317.53 km2 [8], and the area of its inundation zone increased by 21.86 km2 compared with that in 2014 [8]. Although estuarine and riparian wetlands account for a relatively small proportion of the total area of wetlands in the world, they are extremely sensitive to global climate changes, because they are under the joint effect of land and sea, two major surface ecosystems [9]. The role of unique environmental factors (such as climate, hydrology, soil, and vegetation) of estuarine and riparian wetlands in the capture, fixation, and transformation of C and nitrogen (N) has been the focus of research by scientists worldwide [10]. Vegetation in these wetlands plays an important role in the production, consumption, and transport of greenhouse gases [11].
The exchange of greenhouse gas flux in wetlands is a complex biochemical process, which is affected by many environmental and biological factors [12], among which the influence of the soil moisture content on the greenhouse gas flux is more significant [13]. Most studies have shown that rainfall leads to an increase in CO2 and N2O emissions and CH4 uptake [14]. However, some studies have shown that a certain degree of rainfall can dissolve CO2 and N2O in soil pore water, thus reducing the flux of CO2 and N2O after rainfall [15,16]. Therefore, it is very important to study the effects of increasing and decreasing precipitation on greenhouse gas fluxes in lakeside wetlands. Precipitation directly affects the soil moisture content, and the soil moisture content affects the amount of N2O produced in the process of soil nitrification by affecting the partial pressure of O2 in the soil. Within a certain range of water content, the denitrification rate and N2O emissions increase significantly with the increase of the water content [17]. When the moisture content further increases, the decrease of the soil oxygen pressure will reduce the denitrification rate and increase the proportion of N2O to nitrified nitrogen [18]. Soil moisture affects CH4 oxidation by two aspects: one is the supply of CH4 and oxygen to CH4-oxidizing bacteria through gas diffusion, and the other is the activity of CH4-oxidizing bacteria. Flooding slows gas transport and inhibits the activity of CH4-oxidizing bacteria, thereby increasing CH4 emissions [19]. However, if the soil moisture content is too low, the osmotic pressure of CH4-oxidizing bacteria will increase and the activity will decrease, which is not conducive to the oxidation of CH4 [20].
Soil microorganisms are mostly aerobic, and the amount of CO2 released by microorganisms through respiration is affected by the soil moisture content. Past research has shown that soil CO2 emissions under anaerobic conditions are 80% of those under aerobic conditions [21]. This may be because anaerobic conditions greatly limit the respiration of soil microorganisms or inhibit the synthesis and chemical reactions of some enzymes, resulting in a decrease in the available C sources for microorganisms [22]. However, past research has also found that short-term soil CO2 emissions under anaerobic conditions are approximately 50% higher than those under aerobic conditions, which may be due to the decomposition and release of some C-containing compounds that cannot be utilized by microorganisms [23]. CO2 can be produced through the aerobic respiration of plants, animals, microorganisms, and some redox processes under anaerobic conditions, while CH4 can only be produced under anaerobic conditions [22]. N2O can be produced under both aerobic and anaerobic environments. The anaerobic environment enhances the intensity of denitrification, thereby further reducing N2O to N2.
In the past 50 years, climate change on the Tibetan Plateau has been characterized by warming and wetting, indirectly affecting the groundwater level. Precipitation is an important factor affecting greenhouse gas emissions [24]. Past research has shown that, when precipitation increases, the N2O flux increases [25]. Precipitation most directly impacts the soil moisture content. In a study on the Tibetan Plateau, Hu et al. [26] found that a low soil moisture content significantly affects the dynamic balances of the number and activity of methanogens and methanotrophic bacteria and that methanotrophic bacteria produce a CH4-absorbing effect. However, the CH4 in wetlands remains uncertain due to the complex and diverse hydrological conditions and processes of different types of wetlands [27]. Lakeside wetlands are unique ecosystems. What is the impact of changes in precipitation on the C cycle of these ecosystems? What are the C sink and source functions? To fully understand the C cycle of this type of wetland ecosystem, in-depth research must be conducted on the C cycle of lakeside wetlands. In this study, the greenhouse gas emission and absorption patterns of the ecosystem of Niaodao, a lakeshore wetland, were observed under different precipitation levels in the field during the growing season, and the differences between the influencing factors and the main control factors were analyzed. The results provide a reference and a theoretical basis for assessing the C budget of the same type of ecosystem.
2. Overview of the Study Area and Research Methods
2.1. Overview of the Study Area
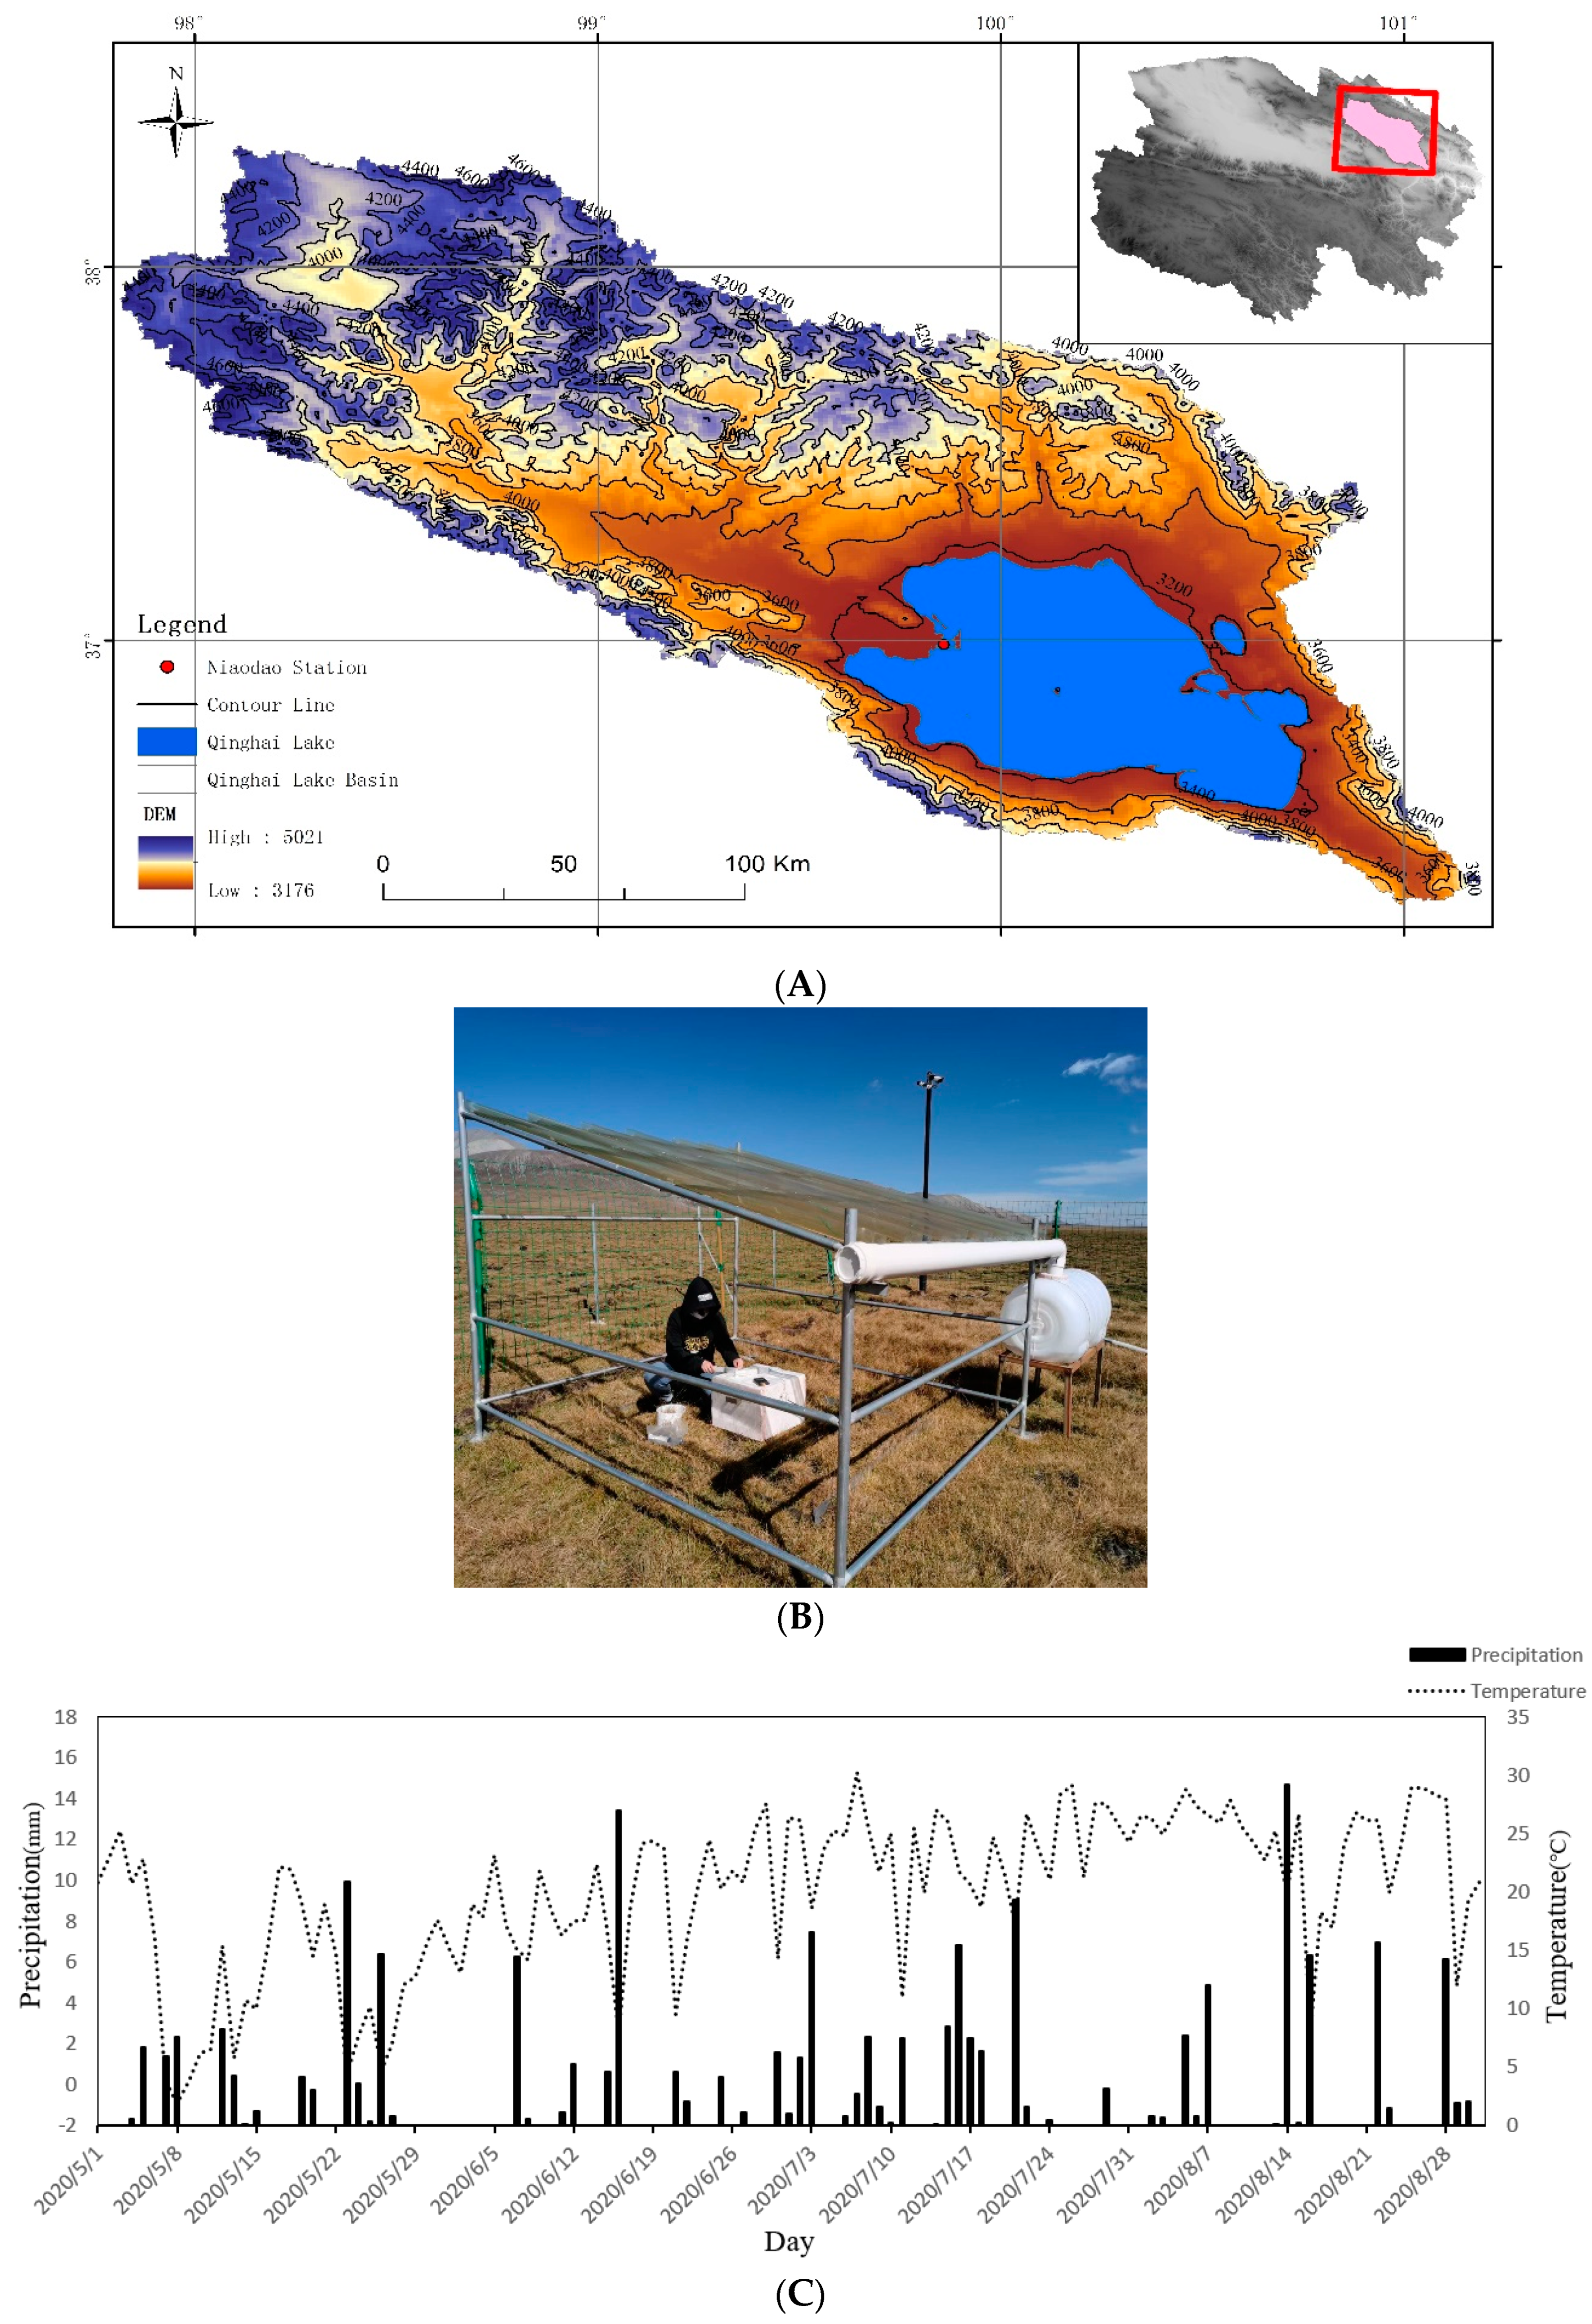
Niaodao of Qinghai Lake is located at 36°57′ N–37°04′ N and 99°44′ E–99°54′ E, with an elevation of 3194–3226 m and a total area of 600 km2 [28]. Its topography is high in the northwest and low in the southeast. It is located at the confluence of the monsoon region in Eastern China and the westerly zone of the Tibetan Plateau. Thus, it has a semiarid alpine climate characterized by draught, little rainfall, frequent winds, strong solar radiation, and large diurnal temperature differences. It has obvious continental climate characteristics, with an annual mean temperature of −0.7 °C, a mean temperature of 12.4 °C in the hottest month of July, a mean temperature of −12.7 °C in the coldest month, an extreme maximum temperature of 28 °C, and an extreme minimum temperature of −31 °C. The annual mean precipitation is 420 mm, and the precipitation is concentrated in June–August. The annual evaporation is approximately 3.8 times the annual precipitation. The annual number of strong wind days is above 48 (A wind force of level 6 and above recorded by an ultrasonic anemometer (wind speed of 10 min ≥ 7 m/s) is defined as a strong wind day), and the maximum strong wind days in a year is 78 days. The annual sunshine duration is 3040 h, but the suitable period for plant growth is only 90–100 days. The thin soil layer is formed by the differentiation of Triassic or Permian gneiss and littoral sediments and thus contains a high content of gravel. The soil texture is sandy loam(Figure 1).
The vegetation height is approximately 30–40 cm. The dominant plant species include Allium polyrhizum, Artemisia frigida, Astragalus adsurgens, Calamagrostis pseudophragmites, Carex moorcroftii, Leymus secalinus, Oxytropis falcata, Poa alpigena, Polygonum sibiricum, and Potentilla anserina, forming a vegetation cover of more than 60%. According to the statistics of the Hydrological Bureau of Qinghai Province, the water level of Qinghai Lake has continued to rise since 2004. The inundation zone of Qinghai Lake in 2018 was 21.86 km2 larger than that in 2014 [8], and the lakeside wetland of Niaodao expanded by 20–500 m.
2.2. Research Methods
According to the data of the Hydrological Bureau of Gangcha County [29], the precipitation in Niaodao has been relatively abundant since 2005. The annual precipitation in this area is 420 mm, the simulated +25% precipitation change is approximately 525 mm, the −25% precipitation change is approximately 315 mm, the +75% precipitation change is approximately 735 mm, and the −75% precipitation change is approximately 105 mm. The purpose of this study was to simulate the effect of extreme increases and decreases in precipitation in this type of wetland on the vegetation, soil, and microorganisms, thereby further deriving the effect of precipitation on greenhouse gases of such ecosystems.
The greenhouse gases in the in situ simulated rainfall experiments in the growing season were measured using the static chamber–gas chromatography method. The plot area was 40 m × 40 m, including 9 pieces 3.2 m × 2.6 m plots. The plot layout was three rows and three columns, with plots in each column belonging to the same treatment group and plots in each row being three replicates of the same treatment. A 3-m-wide buffer zone was set between adjacent subplots, a 5-m-wide buffer zone was set around the plot, and a 20-cm-wide runoff prevention zone was set around each plot. In this experiment, the black box method was used. The box used in this study was made out of a stainless-steel sheet. The box body was divided into two parts. The exterior of the box was wrapped in white foam. The box was opaque, 40 cm long, 40 cm wide, and 30 cm high. The static box base was 40 cm × 40 cm. During sampling, the base tank was filled with water to prevent air leakage. A thermometer, a fan, and a pumping interface were installed in the box. The aboveground and underground biomass was not removed during any treatment in this study.
Since the precipitation in this area is concentrated in June–August, samples were collected regularly during the growing season from May to August in 2020. Two rounds of experiments were performed every month at local times 11:00 and 15:00. The sampling interval was 15 min (0 min, 15 min, and 30 min). Samples of 50-mL air were collected in airtight syringes and immediately sent to Qinghai Normal University for indoor measurements. In addition, the soil temperature and soil moisture in the 0–10-cm soil layer, temperature in the chamber, and air humidity of each plot were recorded at different time periods. Similar to the air sample collection, one soil sample was collected from the 0–10-cm soil layer in each plot every month. The soil samples were passed through a 50-mesh soil sieve to remove stones and other impurities, thus resulting in homogeneous soil samples. After the soil samples were cleansed, the underground biomass was picked up with tweezers. The sieved soil samples were air-dried indoors and stored for later measurement of the total N, total C, soil electrical conductance, and pH.
Before measuring the concentration of each sample, two standard air samples were injected for calibration. Finally, the following formula was used to calculate the greenhouse gas flux [30]:
where F (mg·m−2·h−1) is the measured gas emission flux, ρ (g/L) is the measured gas density under standard conditions, V (m3) is the air volume in the sampling box, A (m2) is the area covered by the sampling box, P (hPa) is the air pressure at the sampling point, P0 (hPa) is the atmospheric pressure under the standard state, T0 (K) is the absolute temperature of the air under the standard state, T (K) is the absolute temperature of the air in the sampling box under the standard state, and dCt/dt is the rate of change of the concentration of the air in the sampling box.
2.3. Data Processing
The experimental data were the mean of three sets of repeated measurement data. A correlation analysis was used to analyze the coupling relationship between the greenhouse gas fluxes and soil moisture and temperature. Significant differences in the greenhouse gas fluxes among the different precipitation treatments were analyzed, and the physical and chemical properties of different soil environments were assessed using multiple comparisons. SPSS (Statistical Product and Service Solutions)(IBM SPSS Statistics for Windows, Version 21.0. IBM Corp., Armonk, NY, USA) was used for the data analysis, and Origin (2018) software was used for plotting.
3. Results and Analysis
3.1. Greenhouse Gas Variation Patterns in Niaodao in the Growing Season under Different Rainfall Treatments
3.1.1. CO2 Flux Variation Patterns during the Growing Season
The seasonal CO2 fluxes in Niaodao exhibit pulsed variations (Figure 2), all indicating emission sources with the same variation pattern. The CO2 flux was significantly different between the four rainfall treatments and the control treatment (CK) (Table 1); the differences among the five treatments also reached significance (p < 0.05). During the four-month observation period, the CO2 fluxes of all the treatments were positive, and the mean CO2 emission rates under the four rainfall treatments and CK during the observation period followed a descending order of +75% (117.26 mg·m−2·h−1) > CK (114.80 mg·m−2·h−1) > −75% (107.05 mg·m−2·h−1) > +25% (106.45 mg·m−2·h−1) > −25% (62.27 mg·m−2·h−1). Therefore, the four treatments and CK all showed the function of an atmospheric CO2 source during the observation period.
The CO2 emission fluxes of the different rainfall treatments ranged from −49.409 to 374.548 mg·m−2·h−1. The peak CO2 emission flux of the +25% treatment occurred at 11:00 on 10 July (228.188 mg·m−2·h−1), while the peak values of all the other treatments occurred on June 20. Although the CO2 emission flux from the +75% treatment was lower than that from the −75% treatment at 11:00 (11:00: +75% < −75%, 2.82 mg·m−2·h−1), the CO2 emission fluxes from the different rainfall enhancement treatments were greater than those from the rainfall reduction treatments at different time periods (11:00: +25% > −25%, 24.66 mg·m−2·h−1; 15:00: +25% > −25%, 41.18 mg·m−2·h−1, +75% > −75%, 10.21 mg·m−2·h−1). As shown by the comparison of the CO2 emission fluxes at 11:00 and 15:00, the CO2 emission fluxes from the different rainfall enhancement treatments were lower at 11:00 than at 15:00, while those from the rainfall reduction treatments were higher at 11:00 than at 15:00 (+25%: 11:00 < 15:00, 16.20 mg·m−2·h−1; +75%: 11:00 < 15:00, 10.56 mg·m−2·h−1; −25%: 11:00 > 15:00, 3.33 mg·m−2·h−1; −75%: 11:00 > 15:00, 2.47 mg·m−2·h−1). The CO2 emission fluxes were significantly different among the different rainfall treatments (Table 1). Figure 2A is the change of the CO2 flux at 11:00, and Figure 2B is the change of the CO2 flux at 15:00.
3.1.2. CH4 Flux Variation Patterns during the Growing Season
The CH4 emission flux exhibited characteristics of absorption at 11:00 and emission at 15:00 (Figure 3). The CH4 flux was significantly different between the four rainfall treatments and CK (Table 1); the differences among the five treatments also reached significance (p < 0.05). During the observation period, the mean CH4 emission rates of the four rainfall treatments and CK followed the descending order of −25% (43.22 µg·m−2·h−1) > −75% (18.88 µg·m−2·h−1) > +25% (9.33 µg·m−2·h−1) > +75% (−5.76 µg·m−2·h−1) > CK (−16.30 µg·m−2·h−1). During the observation period, the rainfall enhancement was negatively correlated with the CH4 flux, and the source and sink functions varied during this period.
The CH4 flux was relatively stable from 22 May to 20 July, exhibiting a peak or trough on August 11. The CH4 flux varied in the range of −213.839–330.976 µg·m−2·h−1 across the different rainfall treatments. The emission fluxes from the two rainfall enhancement treatments were smaller than those from the two rainfall reduction treatments at 11:00 and 15:00 (11:00: +25% < −25%, 3.51 µg·m−2·h−1, +75% < −75%, 3.46 µg·m−2·h−1; 15:00: +25% < −25%, 64.29 µg·m−2·h−1, +75% < −75%, 45.81 µg·m−2·h−1). As shown by the comparison of the CH4 emission fluxes at 11:00 and 15:00, all the emission fluxes, except that from the +75% treatment, were greater at 11:00 than at 15:00, and the CH4 emission fluxes from the other treatments were smaller at 11:00 than at 15:00 (+25%: 11:00 < 15:00, 15.96 µg·m−2· h−1; −25%: 11:00 < 15:00, 76.75 µg·m−2·h−1; +75%: 11:00 > 15:00, 4.27 µg·m−2·h−1; −75%: 11:00 < 15:00, 38.08 µg·m−2·h−1). The CH4 emission fluxes were significantly different among the different rainfall treatments (Table 1). Figure 3A is the change of the CH4 flux at 11:00, and Figure 3B is the change of the CH4 flux at 15:00.
3.1.3. N2O Flux Variation Patterns during the Growing Season
The N2O emission flux at 11:00 did not show a clear pattern, while the N2O emission flux at 15:00 peaked roughly between 10 June and 20 June (Figure 4). The N2O flux was significantly different between the four rainfall treatments and CK (Table 1), and the differences among the five treatments reached a significant level (p < 0.05). During the observation period, the mean N2O emission rates under the four rainfall treatments and CK followed the descending order of +25% (2.54 µg·m−2·h−1) > −25% (1.81 µg·m−2·h−1) > +75% (1.62 µg·m−2·h−1) > CK (−0.15 µg·m−2· h−1) > −75% (−0.58 µg·m−2· h−1). During the observation period, when the treatment was −75%, the N2O flux began to change from absorption to emission.
The N2O fluxes under the different rainfall treatments ranged from −10.457 to 16.878 µg·m−2·h−1. Although the N2O emission flux from the +25% treatment was lower than that from the −25% treatment at 11:00 (11:00: +25% < −25%, 2.31 µg·m−2·h−1), the N2O emission fluxes under the rainfall enhancement treatments were higher than those under the rainfall reduction treatments (11:00: +75% > −75%, 1.49 µg·m−2·h−1; 15:00: +25% > −25%, 3.77 µg·m−2·h−1, +75% > −75%, 2.91 µg·m−2·h−1). As shown by the comparison of the N2O emission fluxes at 11:00 and 15:00, the N2O emission fluxes of the rainfall enhancement treatments were lower at 11:00 than at 15:00, while the N2O emission fluxes of the rainfall enhanced treatments were higher at 11:00 than at 15:00 (+25%: 11:00 < 15:00, 4.81 µg·m−2·h−1; +75%: 11:00 < 15:00, 0.60 µg·m−2·h−1; −25%: 11:00 > 15:00, 1.26 µg·m−2·h−1; −75%: 11:00 > 15:00, 0.82 µg·m−2·h−1). The N2O emission fluxes were significantly different among the different rainfall treatments (Table 1). Figure 4A is the change of the N2O flux at 11:00, and Figure 4B is the change of the CH4 flux at 15:00.
3.2. Test of Applicability of Data Standardization and Factor Analysis
3.2.1. Principal Component Analysis Procedure
The first two principal components explained 57.507% of the total variance, indicating that the two principal components extracted could represent 57.507% of the original data of the eight soil physical and chemical properties. Therefore, it is reasonable to evaluate the soil physical and chemical properties with a principal component analysis. The two principal components were extracted and denoted as Y1 and Y2, and the principal component coefficients were calculated:
Y1 = 0.30960X1 + 0.25944X2 − 0.11650X3 + 0.37918X4 + 0.45901X5 + 0.47896X6 − 0.35275X7 + 0.33872X8
Y2 = 0.40538X1 + 0.56030X2 − 0.30983X3 − 0.32653X4 + 0.19852X5 − 0.03432X6 + 0.40445X7 − 0.33859X8
From the above formulas, in Y1, the absolute values of the coefficients of X6 (soil temperature), X5 (soil moisture), X4 (electrical conductivity), X7 (total N), X8 (total C), and X1 (aboveground biomass) are greater than the absolute values of the coefficients of X2 (underground biomass) and X3 (pH). Therefore, Y1 is a comprehensive representation of the six soil physical and chemical properties. This indicates that it is necessary to use the six indicators to explain the impact of the soil physical and chemical properties on greenhouse gases under changes in rainfall. In the process of greenhouse gas emission and absorption, it is necessary to comprehensively consider the changes in soil temperature and moisture and the soil C and N contents and vegetation content to more comprehensively explain the greenhouse gas fluxes.
In Y2, the absolute values of the coefficients of X2 (underground biomass), X1 (aboveground biomass), X7 (total N), X8 (total C), X4 (conductivity), and X3 (pH) are greater than the absolute values of the coefficients of X5 (soil moisture) and X6 (soil temperature). Therefore, Y2 is a comprehensive representation of the six soil physical and chemical properties. Y2 represents the effect of rainfall on the source and sink capacity of the greenhouse gases, and the greenhouse gas fluxes may be increased or decreased via the rational control of the soil physical and chemical properties.
3.2.2. Aboveground and Underground Biomass
During the growing season, the aboveground and belowground biomass of Niaodao showed different trends. The aboveground biomass trend of the ±25% treatments was consistent with aboveground biomass trend of CK: the aboveground biomass increased from May to July, peaked in July (+25%: 0.82 g·m−2, −25%: 0.57 g·m−2), and started to decrease in August. The aboveground biomass of the ±75% treatments increased continuously from May to August. The underground biomass trend of the ±75% treatments was consistent with the CK trend, which first increased and then decreased and peaked in July (+75%: 0.016 g·m−2, −75%: 0.017 g·m−2). The underground biomass trend of the ±75% treatments was consistent with the underground biomass trend of CK: the underground biomass first increased, then decreased, and peaked in July (+75%: 0.016 g·m−2, −75%: 0.017 g·m−2). The underground biomass of the ±25% treatment peaked in June (+25%: 0.015 g·m−2, −25%: 0.016 g·m−2). The underground biomass was significantly different between the different rainfall treatments (Table 2 and Figure 5). Table 1 shows that the dominant species of the different treatments were slightly different. Since Niaodao has a relatively thin (10 cm) soil layer with a high content of gravel and a mean vegetation cover of less than 65%, the vegetation height during the peak growing season was 10–30 cm higher under the rainfall reduction treatments than under the rainfall enhancement treatments. Among the eight dominant plant species, Thermopsis lanceolate, Allium przewalskianum, and Melissitus ruthenicus are xerophilous plants, which is in-line with the decrease in the soil moisture content of the rainfall reduction treatments.
3.2.3. Soil Total Nitrogen and Total Carbon
In the different rainfall treatments, the total soil N in Niaodao showed a trend of first increasing and then decreasing, and the total soil C showed a trend of first decreasing and then increasing(Figure 6). The total soil N peaked in June (1.13 g·kg−1). In addition, the monthly total soil N was higher under the rainfall enhancement treatments (May: 1.27, June: 1.43, July: 0.91, and August: 0.76) than under the rainfall reduction treatments (May: 0.92, June: 0.90, July: 0.36, and August: 0.07). The total soil C troughed (9.78 g·kg−1) in June. The total soil C was lower under the rainfall enhancement treatments (18.03) than under the rainfall reduction treatments (18.86) only in June and was higher under the rainfall enhancement treatments (May: 22.28, July: 26.06, and August: 29.72) than under the rainfall reduction treatments (May: 21.47, July: 25.34, and August: 27.39) in the other three months. The total soil C was significant different among the different rainfall treatments (Table 3).
4. Discussion
4.1. Characteristics and Influencing Factors of CO2 Fluxes
CO2 emission fluxes in wetlands arise primarily from soil microbial respiration [31]. The field observations in the growing season of 2020 showed that the wetland plots under different rainfall treatments all served as CO2 emission sources and that the high CO2 emission fluxes in the two time periods at the beginning of the growing season may be due to the release of CO2 frozen in the soil as the soil warmed up, forming a small peak, which is consistent with the results of Wu et al. [32]. Soil moisture plays a crucial role in microbial activity. Studies have shown that, within a certain soil moisture range, the microbial activity increases with an increasing moisture content. According to the study of Cai [33], the soil moisture content in different soil environments has different effects on CO2 fluxes, and a higher soil moisture content in sandy loam may reduce the CO2 emission fluxes, which is consistent with the results of this study. When the groundwater level rises, the highest soil moisture in Niaodao reached 100% under the rainfall enhancement treatments. An anaerobic environment with a soil moisture high state reduces the available C source for soil microorganisms [34]. Increasing the soil temperature will provide a good combination of water and heat and promote microbial activity and root respiration. The mean soil temperature at 15:00 in Niaodao was 5–8 °C higher than that at 11:00, and the mean CO2 emission fluxes at 15:00 were approximately 4.00 mg·m−2·h−1 higher than that at 11:00.
4.2. Characteristics and Influencing Factors of CH4 Fluxes
The CH4 emission environment is mostly anaerobic, and the soil water and heat conditions directly determine the CH4 flux. The community characteristics of methanogens and aerobic methanotrophic bacteria also vary with changes in the soil moisture and temperature [32]. Sandy loam soil has good aeration due to its special structure, and the higher moisture content of sandy loam soil does not have a significant impact on the CH4 flux. The CH4 emission fluxes in Niaodao were greatly affected by the soil temperature (p < 0.05). The mean CH4 emission fluxes at 15:00 were higher than those at 11:00 by approximately 15 µg·m−2·h−1, which is consistent with the results of Cao [35]. Changes in the soil moisture content caused by rainfall patterns are an important factor affecting soil greenhouse gas fluxes [36]. When the soil moisture content decreases, water stress increases the water dependence of microorganisms such as methanogens; thus, rainfall reduction can enhance CH4 fluxes. The −25% treatment had a significant effect on the CH4 flux.
4.3. Characteristics and Influencing Factors of N2O Fluxes
The production and emission of N2O in wetlands arise primarily from nitrification and denitrification [37]. N2O emissions are closely related to the soil temperature. During the growing season, as the atmospheric temperature rises, the soil temperature rises, and the N2O fluxes slowly change from absorption to emission. Past research has shown that a certain degree of rainfall will dissolve N2O in the soil and thus reduce the N2O fluxes [15,38]. In this study, the mean N2O flux of the +25% treatment was 2.31 μg·m−2·h−1 less than that of the −25% treatment, while the mean N2O flux of the +75% treatment was 1.49 µg·m−2·h−1 higher than that of the −75% treatment, indicating that N2O emissions were suppressed by the soil moisture content under the +25% treatment but were significantly enhanced by the soil moisture content under the +75% treatment. The substrates of nitrification and denitrification are soil C and N, and soil C and N pools have a great impact on the N2O emission flux [15]. The results herein showed that the total soil C responded consistently to the rainfall enhancement and reduction treatments and that the total soil C had a significant correlation among the treatments (p < 0.05). The total soil C was higher under the rainfall enhancement treatments than under the rainfall reduction treatments and was higher under the +75% treatment than under the +25% treatment, perhaps because the increase in moisture content enhanced the microbial activity, resulting in an increase in the total soil C. The variation pattern of the total soil N was consistent with that of the total soil C. As the soil moisture increased, the microbial activity increased, and the N2O flux also increased.
5. Conclusions
The simulated rainfall significantly affected the greenhouse gas emissions of Niaodao, a lakeside wetland, during the growing season. The soil electrical conductivity, total N content, total C content, and pH were significantly correlated among the different rainfall treatments (p < 0.05), and some of them were extremely significantly correlated (p < 0.01). The aboveground and underground biomass increased as the moisture content increased.
During the entire growing season, all treatments showed the effect of the CO2 source. The +25% and +75% treatments significantly increased the CO2 emission fluxes (p < 0.05), and the CO2 emission fluxes at 15:00 were significantly higher than those at 11:00. At the beginning of the growing season, the CO2 fluxes showed a small peak due to increasing temperatures and then decreased, and the mean CO2 flux was 101.57 mg·m−2·h−1. The soil temperature significantly affected the CH4 flux. The CH4 flux of Niaodao in the growing season exhibited the characteristics of absorption at 11:00 and emission at 15:00. The soil moisture had little effect on the CH4 flux (p > 005). The mean CH4 flux during the growing season was 9.87 µg·m−2·h−1. The rainfall enhancement treatments increased the N2O emission flux, showing a weak source effect. The N2O emission flux was not significantly correlated with the soil temperature (p > 0.05). The effect of the rainfall enhancement treatments on the greenhouse gas flux was more prominent during the high-temperature periods.
Under the premise of climate warming and the continuous rise of the water level of Qinghai Lake, rainfall enhancement treatments have more prominent effects on the greenhouse effect, which directly or indirectly affects the ecological process of the wetland and the C and N budget balance in this area. These results provide a reference for the regional C pool balance.
Author Contributions
Conceptualization, Z.Y.; methodology, Z.Y.; software, Z.Y. and F.L.; validation, K.C.; formal analysis, Z.Y. and Z.C.; investigation, K.C.; resources, K.C.; data curation, Z.Y.; writing—original draft preparation, Z.Y.; writing—review and editing, Z.Y. and F.L.; visualization, Z.Y.; supervision, K.C.; project administration, K.C.; and funding acquisition, K.C. All authors have read and agreed to the published version of the manuscript.
Funding
This research was funded by the second comprehensive scientific investigation and study of the Qinghai-Tibet Plateau, grant number 2019ZQKK0405, the National Natural Science Foundation of China, grant number 41661023, and the Qinghai Province Science and Technology Plan, grant number 2020-ZJ-Y06.
Institutional Review Board Statement
Not applicable.
Acknowledgments
Thanks to Qinghai Normal University and the Key Laboratory of Natural Geography and Environmental Processes of Qinghai Province for providing technical support, and thanks to Chen for their help.
Conflicts of Interest
The authors declare no conflict of interest.
References
- World Meteorological Organization. WMO Greenhouse Gas Bulletin (No.15): The State of Greenhouse Gases in the Atmosphere Based on Global Observations through 2018[EB/OL]. Available online: https://library.wmo.int/index.php?lvl=notice_display&id=21620#.X4ER_PkpXAR (accessed on 25 November 2019).
- IPCC. Climate Change 2014: Synthesis Report. In Contribution of Working Groups I, II and III to the Fifth Assessment Report of the Intergovernmental Panel on Climate Change; Core Writing Team, Pachauri, R.K., Meyer, L.A., Eds.; IPCC: Geneva, Switzerland, 2014; 151p. [Google Scholar]
- IPCC. The Physical Science Basis. In Working Group I Contribution to the Fifth Assessment Report of the Intergovernmental Panel on Climate Change: Climate Change 2013; Cambridge University Press: Cambridge, UK; New York, NY, USA, 2013. [Google Scholar]
- Prather, M.; Ehhalt, D.; Dentener, F.; Derwent, R.; Dlugokencky Edward, J.; Holland, E.; Isaksen, I.; Katima, J.; Kirchhoff, V.; Matson, P.; et al. Atmospheric chemistry and greenhouse gases. In Climate Change: Working Group I: The Scientific Basis; Cambridge University Press: Cambridge, UK, 2001. [Google Scholar]
- Kallenbach, C.; Rolston, D.E.; Horwath, W.R. Cover cropping affects soil N2O and CO2 emissions differently depending on type of irrigation. Agric. Ecosyst. Environ. 2012, 137, 251–260. [Google Scholar] [CrossRef]
- Mitsch, W.J.; Bernal, B.; Nahlik, A.M.; Mander, Ü.; Zhang, L.; Anderson, C.J.; Jørgensen, S.E.; Brix, H. Wetlands, carbon, and climate change. Landsc. Ecol. 2013, 28, 583–597. [Google Scholar] [CrossRef]
- Matthews, E.; Fung, I. Methane emission from natural wetlands-global distribution, area and environmental characteristics of sources. Glob. Biogeochem. Cycles 1987, 1, 61–86. [Google Scholar] [CrossRef]
- Wang, T.; Lu, L.; Liu, G.; Shan, W.; Luo, M.; Wang, J.; Zhou, Y.; Wang, F. Analysis on the evolution and driving factors of the wetland of Qinghai Lake. J. China Inst. Water Resour. Hydropower Res. 2020, 18, 274–283. [Google Scholar]
- Li, Y. Research on the Influence Mechanism of Vegetation in the Process of Greenhouse Gas Emissions from Wetlands in the Yangtze River Estuary; East China Normal University: Shanghai, China, 2015; pp. 50–55. [Google Scholar]
- Aura, C.M.; Musa, S.; Ogello, E.O.; Otwoma, L.M.; Miriam, W.; Kundu, R. Methane emissions from riverine and swampy coastal wetlands: Influence of open and macrophyte-infested areas. Lakes Reserv. Res. Manag. 2011, 16, 265–272. [Google Scholar] [CrossRef]
- Wang, D.Q.; Chen, Z.L.; Xu, S.Y. Methane emission from Yangtze estuarine wetland, China. J. Geophys. Res. 2009, 114, 1588–1593. [Google Scholar] [CrossRef] [Green Version]
- Bao, F.; Zhou, G. Research progress on grassland soil respiration in China. Acta Phytoecol. Sin. 2010, 34, 713–726. [Google Scholar]
- Raich, J.W.; Schlesinger, W.H. The global carbon dioxide flux in soil respiration and its relationship to vegetation and climate. Tellus Ser. B-Chem. Phys. Meteorol. 1992, 44, 81–99. [Google Scholar] [CrossRef] [Green Version]
- Rochette, P.; Desjardins, R.L.; Pattey, E. Spatial and temporal variability of soil respiration in agricultural fields. Can. J. Soil Sci. 1991, 71, 189–196. [Google Scholar] [CrossRef]
- Gu, C.; Riley, W.J. Combined effects of short term rainfall patterns and soil texture on soil nitrogen cycling: A modeling analysis. J. Contam. Hydrol. 2010, 112, 141–154. [Google Scholar] [CrossRef] [Green Version]
- Lee, M.S.; Nakane, K.; Nakatsubo, T.; Mo, W.H.; Koizumi, H. Effects of rainfall events on soil CO2 flux in a cool temperate deciduous broad-leaved forest. Ecol. Res. 2002, 17, 401–409. [Google Scholar] [CrossRef]
- Li, L.; Pan, Y.; Zhou, X. Nitrification of main types of soil in Taihu Lake area and its influencing factors. Soils 1987, 19, 289–293. [Google Scholar]
- Khalil, K.; Mary, B.; Renault, P. Nitrous oxide production by nitrification and denitrification in soil aggregates as affected by O2 concentration. Soil Biol. Biochem. 2004, 36, 687–699. [Google Scholar] [CrossRef]
- Tian, G.; He, Y.; Li, Y. Effect of water and fertilization management on emission of CH4 and N2O in paddy soil. Soil Environ. Sci. 2002, 11, 294–298. [Google Scholar]
- Nesbit, S.P.; Breitenbeck, G.A. A laboratory study of factors influencing methane uptake by soils. Agric. Ecosyst. Environ. 1992, 41, 39–54. [Google Scholar] [CrossRef]
- Dendooven, L.; Anderson, J.M. Maintenance of denitrification in pasture soil following anaerobic events. Soil Biol. Biochem. 1995, 27, 1251–1560. [Google Scholar] [CrossRef]
- Tiedje, J.M.; Sexstone, A.J.; Myrold, D.D.; Robinson, J.A. Denitrification: Ecological niches, competition and survival. Antonie Van Leeuwenhoek 1982, 48, 545–553. [Google Scholar] [CrossRef]
- Ellis, S.; Howe, M.T.; Goulding, K.W.T.; Mugglestone, M.A.; Dendooven, L. Carbon and Nitrogen dynamics in a grassland soil with varing pH: Effects of pH on the denitrification potential and dynamics of the reduction enzymes. Soil Biol. Biochem. 1998, 30, 359–367. [Google Scholar] [CrossRef]
- Ehrlich, H.L.; Newman, D. Lithosphere as microbial habitat. Geomicrobiology 2009, 5, 37–55. [Google Scholar]
- Wang, G.; Hao, M.; Chen, D. Effects of nitrification inhibitors and aeration regulation on soil N2O emissions. J. Plant Nutr. Fertil. 2006, 32–36. [Google Scholar] [CrossRef]
- Hu, Q.; Wu, Q.; Li, D.; Cao, G. Comparative study on CH4 release from alpine grassland under different soil moisture content. J. Ecol. 2005, 118–122. [Google Scholar]
- Kirschke, S.; Bousquet, P.; Ciais, P.; Saunois, M.; Canadell, J.G.; Dlugokencky, E.J.; Bergamaschi, P.; Bergmann, D.; Blake, D.R.; Bruhwiler, L.; et al. Three decades of global methane sources and sinks. Nat. Geosci. 2013, 6, 813–823. [Google Scholar] [CrossRef]
- Wang, S.; Chen, G.; Bai, Y. The relationship between plant community species diversity and soil environmental factors in the bird island area of Qinghai Lake. Chin. J. Appl. Ecol. 2005, 186–188. [Google Scholar]
- Li, H.; Ma, L. Analysis of the annual distribution and inter-annual variation of precipitation in Qinghai Lake Basin. Water Conserv. Sci. Technol. Econ. 2014, 20, 80–81. [Google Scholar]
- Cao, G.; Xu, X.; Long, R.; Wang, Q.; Wang, C.; Du, Y.; Zhao, X. Methane emissions by alpine plant communities in the Tibetan Plateau. Biol. Lett. 2008, 4, 681–684. [Google Scholar] [CrossRef] [Green Version]
- Zhang, J.; Peng, C.; Zhu, Q.; Xue, W.; Shen, Y.; Yang, Y.; Shi, G.; Shi, S.; Wang, M. Temperature sensitivity of soil carbon dioxide and nitrous oxide emissions in mountain forest and meadow ecosystems in China. Atmos. Environ. 2016, 142, 340–350. [Google Scholar] [CrossRef]
- Wu, X.; Zang, S.; Ma, D.; Ren, J.; Li, H.; Zhao, G. Greenhouse gas fluxes from forest soils in permafrost regions of Daxinganling Mountains. Acta Geogr. Sin. 2020, 75, 2319–2331. [Google Scholar]
- Cai, Z.; Arvin, M. The influence of soil moisture status on CH4 oxidation, N2O and CO2 emissions. Soil 1999, 289–294+298. [Google Scholar]
- Li, P.; Wei, W.; Lang, M. Short-term effects of different moisture on greenhouse gas emissions from sandy loam soil in semi-arid areas. J. Agric. Environ. Sci. 2021, 40, 1124–1132. [Google Scholar]
- Xiaoai, C. Research on Greenhouse Gas Emission Flux during the Thawing Period of Wetland in the Riverside Zone of the Grassland Region; Inner Mongolia University: Hohhot, China, 2019. [Google Scholar]
- Liyan, Z.; Bingrui, J.; Guangsheng, Z.; Wei, Z.; Yu, W. Carbon exchange and its regulation mechanism in the growing season of China’s northern prime-leaf forest. Chin. J. Appl. Ecol. 2010, 21, 2449–2456. [Google Scholar]
- Liu, R.; Hu, H.; Suter, H.; Hayden, H.L.; He, J.; Mele, P.; Chen, D. Nitrification Is a primary driverof nitrous oxide production in laboratory microcosms from different land-use soils. Front. Microbiol. 2016, 7, 1373–1383. [Google Scholar] [CrossRef] [PubMed] [Green Version]
- Cheng, G.; Liu, T.; Wang, G.; Duan, L.; Li, D. Effects of rainfall and litter on soil greenhouse gas fluxes of artificial poplar forests. J. Agric. Environ. Sci. 2019, 38, 1398–1407. [Google Scholar]
Figure 1.
Overview map of the study area (A). Field precipitation simulation device (B). Precipitation and temperature from May to August in the study area (C).
Figure 1.
Overview map of the study area (A). Field precipitation simulation device (B). Precipitation and temperature from May to August in the study area (C).

Figure 2.
CO2 emission characteristics during the growing season under different rainfall treatments. Change diagram of the CO2 emission flux at 11:00 a.m. (A). Change diagram of the CO2 emission flux at 3:00 p.m. (B).
Figure 2.
CO2 emission characteristics during the growing season under different rainfall treatments. Change diagram of the CO2 emission flux at 11:00 a.m. (A). Change diagram of the CO2 emission flux at 3:00 p.m. (B).

Figure 3.
CH4 emission characteristics during the growing season under different rainfall treatments. Change diagram of the CH4 emission flux at 11:00 a.m. (A). Change diagram of the CH4 emission flux at 3:00 p.m. (B).
Figure 3.
CH4 emission characteristics during the growing season under different rainfall treatments. Change diagram of the CH4 emission flux at 11:00 a.m. (A). Change diagram of the CH4 emission flux at 3:00 p.m. (B).

Figure 4.
N2O emission characteristics during the growing season under different rainfall treatments. Change diagram of the N2O emission flux at 11:00 a.m. (A). Change diagram of the N2O emission flux at 3:00 p.m. (B).
Figure 4.
N2O emission characteristics during the growing season under different rainfall treatments. Change diagram of the N2O emission flux at 11:00 a.m. (A). Change diagram of the N2O emission flux at 3:00 p.m. (B).

Figure 5.
The aboveground and underground biomass changes during the growing season of the Niaodao Lakeside wetland.
Figure 5.
The aboveground and underground biomass changes during the growing season of the Niaodao Lakeside wetland.

Figure 6.
Changes of the soil total nitrogen and total carbon in the Niaodao Lakeside wetland during the growing season under different rainfall treatments.
Figure 6.
Changes of the soil total nitrogen and total carbon in the Niaodao Lakeside wetland during the growing season under different rainfall treatments.


Table 1.
Multiple comparisons of the CO2, CH4, and N2O fluxes treated by five types of rainfall in the Niaodao Lakeside wetland.
Table 1.
Multiple comparisons of the CO2, CH4, and N2O fluxes treated by five types of rainfall in the Niaodao Lakeside wetland.
| Treatment | 22 May | 10 June | 20 June | 10 July | 20 July | 11 August | |
|---|---|---|---|---|---|---|---|
| CO2 flux | CK | 159.50 ± 26.04 b | 8.51 ± 6.72 c | 326.57 ± 21.94 a | 101.95 ± 21.94 b | 90.51 ± 14.33 b | 1.77 ± 21.56 c |
| +25% | 174.98 ± 29.04 ab | 23.89 ± 22.08 b | 237.90 ± 66.48 a | 132.82 ± 39.67 ab | 45.64 ± 37.90 b | 23.48 ± 4.00 b | |
| −25% | 94.58 ± 19.30 b | 6.28 ± 2.12 d | 180.97 ± 28.50 a | 22.54 ± 15.35 cd | −7.06 ± 8.79 d | 76.29 ± 17.94 d | |
| +75% | 172.40 ± 36.45 b | −4.27 ± 13.64 c | 290.66 ± 25.31 a | 159.84 ± 28.88 b | 49.30 ± 10.79 c | 35.62 ± 13.17 c | |
| −75% | 119.36 ± 30.15 b | 25.17 ± 8.35 c | 212.34 ± 21.80 a | 114.23 ± 11.00 b | 44.22 ± 20.25 bc | 43.18 ± 5.67 bc | |
| CH4 flux | CK | 4.23 ± 17.55 a | −22.33 ± 10.98 a | −4.31 ± 1.64 a | −6.10 ± 3.91 a | −0.73 ± 2.40 a | −68.58 ± 63.10 a |
| +25% | 26.29 ± 23.54 a | −16.87 ± 14.43 a | −3.39 ± 0.76 a | −1.21 ± 2.52 a | 46.47 ± 22.04 a | 4.68 ± 1.96 a | |
| −25% | 1.34 ± 29.12 b | −3.79 ± 1.14 b | 0.24 ± 5.95 b | −10.91 ± 5.57 b | 59.71 ± 30.96 b | 212.76 ± 50.81 a | |
| +75% | −3.22 ± 17.81 a | −2.10 ± 2.30 a | −30.99 ± 20.34 a | −4.92 ± 2.66 a | −0.01 ± 7.72 a | 6.71 ± 2.67 a | |
| −75% | 22.66 ± 29.97 a | −4.19 ± 1.18 a | −1.28 ± 1.29 a | −2.19 ± 1.13 a | 5.40 ± 3.48 a | 17.65 ± 3.74 | |
| N2O flux | CK | 2.69 ± 2.86 a | 1.07 ± 2.99 a | 8.31 ± 7.92 a | −4.89 ± 4.20 a | −6.10 ± 2.76 a | −1.96 ± 1.54 a |
| +25% | 0.44 ± 0.85 a | 5.35 ± 3.43 a | 7.70 ± 4.14 a | 4.17 ± 2.94 a | −4.06 ± 2.64 a | 1.63 ± 2.66 a | |
| −25% | 2.07 ± 0.80 a | 5.07 ± 5.47 a | 1.03 ± 4.37 a | 3.97 ± 4.98 a | −3.08 ± 1.24 a | 1.77 ± 1.30 a | |
| +75% | 2.43 ± 1.35 ab | 8.85 ± 3.74 a | 7.88 ± 3.34 a | −6.44 ± 4.60 b | −1.18 ± 1.94 ab | −1.85 ± 0.92 ab | |
| −75% | −1.68 ± 1.43 a | −5.04 ± 2.84 a | 4.27 ± 3.01 a | 0.61 ± 3.22 a | −0.98 ± 1.77 a | −0.68 ± 1.88 a |
Note: There is a significant difference between the mean values of the letters that are not shared.
Table 2.
August vegetation survey form of the Niaodao Lakeside wetland.
| Treatment | Dominant Plant | Vegetation Cover/% | Vegetation Height/cm | Vegetation Surface Thickness/cm |
|---|---|---|---|---|
| CK | Stipa sareptana, Carex moorcroftii, Elymus nutans Griseb | 55 | 25.1–45.4 | 1.1 |
| +25% | Stipa sareptana, Allium przewalskianum | 65 | 20.2–50.3 | 1.0 |
| −25% | Thermopsis lanceolate, Leymus secalinus, Elymus nutans Griseb, Allium przewalskianum | 57 | 30.5–85.2 | 0.8 |
| +75% | Stipa sareptana, Asparagus cochinchinensis | 60 | 13.8–48.5 | 1.2 |
| −75% | Leymus secalinus, Elymus nutans Griseb, Melissitus ruthenicus | 55 | 1.3–29.6 | 0.6 |
Table 3.
Physical and chemical properties of the surface soil under different rainfall treatments during the growing season.
Table 3.
Physical and chemical properties of the surface soil under different rainfall treatments during the growing season.
| Treatment | Month | Conductivity | pH | Aboveground Biomass | Underground Biomass | Soil Total Nitrogen | Soil Total Carbon |
|---|---|---|---|---|---|---|---|
| CK | May | 77.93 ± 0.81 b | 8.82 ± 0.03 c | 0.09 ± 0.01 a | 0.005 ± 0.001 a | 1.03 ± 0.09 a | 22.66 ± 0.33 a |
| June | 153.37 ± 3.95 a | 8.72 ± 0.01 c | 0.22 ± 0.02 b | 0.01 ± 0.001 a | 1.00 ± 0.02 b | 7.11 ± 0.47 b | |
| July | 208 ± 2.88 b | 8.83 ± 0.01 a | 0.27 ± 0.07 b | 0.02 ± 0.004 a | 0.83 ± 0.10 ab | 27.67 ± 2.23 a | |
| August | 367.5 ± 5.12 c | 9.02 ± 0.01 b | 0.14 ± 0.01 a | 0.01 ± 0.001 a | 0.93 ± 0.02 a | 23.29 ± 3.12 a | |
| +25% | May | 58.27 ± 0.79 d | 9.10 ± 0.02 ab | 0.17 ± 0.02 a | 0.006 ± 0.002 a | 1.17 ± 0.09 a | 23.25 ± 0.76 a |
| June | 110.13 ± 0.76 b | 9.07 ± 0.01 a | 0.61 ± 0.01 a | 0.02 ± 0.001 a | 1.24 ± 0.13 b | 6.77 ± 0.47 b | |
| July | 79.47 ± 1.36 d | 8.88 ± 0.01 a | 0.82 ± 0.08 a | 0.01 ± 0.002 a | 0.66 ± 0.22 bc | 27.61 ± 1.24 a | |
| August | 546.77 ± 5.19 b | 9.03 ± 0.01 b | 0.48 ± 0.07 a | 0.01 ± 0.0002 a | 0.72 ± 0.03 a | 28.91 ± 2.65 a | |
| −25% | May | 87.90 ± 1.14 a | 9.08 ± 0.01 b | 0.14 ± 0.05 a | 0.005 ± 0.001 a | 0.93 ± 0.02 a | 25.76 ± 3.00 a |
| June | 86.87 ± 0.56 c | 9.02 ± 0.01 a | 0.32 ± 0.07 b | 0.02 ± 0.0004 a | 0.88 ± 0.07 b | 6.65 ± 0.85 b | |
| July | 94.13 ± 1.12 c | 8.93 ± 0.02 a | 0.57 ± 0.12 ab | 0.02 ± 0.002 | 0.24 ± 0.09 c | 26.89 ± 1.46 a | |
| August | 651.63 ± 0.56 a | 8.92 ± 0.04 c | 0.56 ± 0.21 a | 0.01 ± 0.003 a | 0.07 ± 0.02 b | 27.49 ± 0.17 a | |
| +75% | May | 61.53 ± 0.53 c | 9.20 ± 0.03 a | 0.20 ± 0.05 a | 0.005 ± 0.002 a | 1.36 ± 0.22 a | 21.30 ± 0.38 a |
| June | 87.43 ± 0.52 c | 8.95 ± 0.02 b | 0.41 ± 0.04 b | 0.02 ± 0.002 a | 1.62 ± 0.12 a | 7.96 ± 1.71 b | |
| July | 92.77 ± 1.66 c | 9.03 ± 0.01 a | 0.46 ± 0.03 b | 0.02 ± 0.002 a | 1.16 ± 0.09 a | 24.52 ± 0.44 a | |
| August | 186.20 ± 1.23 e | 8.87 ± 0.01 c | 0.53 ± 0.16 a | 0.006 ± 0.002 a | 0.80 ± 0.20 a | 30.54 ± 1.64 a | |
| −75% | May | 78.3 ± 0.57 b | 9.12 ± 0.01 ab | 0.17 ± 0.02 a | 0.004 ± 0.001 a | 0.91 ± 0.03 a | 17.19 ± 1.60 a |
| June | 72.5 ± 0.90 d | 8.93 ± 0.01 b | 0.24 ± 0.04 b | 0.01 ± 0.002 a | 0.92 ± 0.03 b | 20.40 ± 2.50 a | |
| July | 226.07 ± 4.51 a | 9.00 ± 0.07 a | 0.32 ± 0.03 b | 0.02 ± 0.001 a | 0.48 ± 0.10 bc | 23.78 ± 0.56 a | |
| August | 235.67 ± 2.18 d | 9.15 ± 0.02 a | 0.34 ± 0.11 a | 0.01 ± 0.002 a | 0.07 ± 0.01 b | 27.30 ± 0.08 a |
Note: There is a significant difference between the mean values of the letters that are not shared.
Publisher’s Note: MDPI stays neutral with regard to jurisdictional claims in published maps and institutional affiliations. |
© 2022 by the authors. Licensee MDPI, Basel, Switzerland. This article is an open access article distributed under the terms and conditions of the Creative Commons Attribution (CC BY) license (https://creativecommons.org/licenses/by/4.0/).
Share and Cite
MDPI and ACS Style
Yang, Z.; Chen, K.; Liu, F.; Che, Z. Effects of Rainfall on the Characteristics of Soil Greenhouse Gas Emissions in the Wetland of Qinghai Lake. Atmosphere 2022, 13, 129. https://doi.org/10.3390/atmos13010129
AMA Style
Yang Z, Chen K, Liu F, Che Z. Effects of Rainfall on the Characteristics of Soil Greenhouse Gas Emissions in the Wetland of Qinghai Lake. Atmosphere. 2022; 13(1):129. https://doi.org/10.3390/atmos13010129
Chicago/Turabian StyleYang, Ziwei, Kelong Chen, Fumei Liu, and Zihan Che. 2022. "Effects of Rainfall on the Characteristics of Soil Greenhouse Gas Emissions in the Wetland of Qinghai Lake" Atmosphere 13, no. 1: 129. https://doi.org/10.3390/atmos13010129
Note that from the first issue of 2016, this journal uses article numbers instead of page numbers. See further details here.