
Relationships between the Southwest Monsoon Surge and the Heavy Rainfall Associated with Landfalling Super Typhoon Rammasun

1
Key Laboratory of Meteorological Disaster, Ministry of Education/Joint International Research Laboratory of Climate and Environment Change/Collaborative Innovation Center on Forecast and Evaluation of Meteorological Disasters, Nanjing University of Information Science and Technology, Nanjing 210044, China
2
Key Laboratory of South China Sea Meteorological Disaster Prevention and Mitigation of Hainan Province, Haikou 570203, China
3
Hainan Meteorological Observatory, Haikou 570203, China
*
Author to whom correspondence should be addressed.
Atmosphere 2022, 13(1), 130; https://doi.org/10.3390/atmos13010130
Submission received: 15 December 2021
/
Revised: 7 January 2022
/
Accepted: 11 January 2022
/
Published: 14 January 2022
(This article belongs to the Special Issue Understanding and Simulating Air–Sea Interactions under Extreme Weather and Climate Conditions)
Abstract
:Based on the China Meteorological Administration (CMA) best-track data, the ERA5 reanalysis, and the Global Precipitation Measurement (GPM) precipitation data, this paper analyzes the reasons for the heavy rainfall event of Super Typhoon Rammasun in 2014, and the results are as follows: (1) Rammasun was blocked by the western Pacific subtropical high (WPSH), the continental high, and the mid-latitude westerly trough. Such a stable circulation pattern maintained the vortex circulation of Rammasun. (2) During the period of landfall, the southwest summer monsoon surge was reinforced due to the dramatic increase of the zonal wind and the cross-equatorial flow near 108° E. The results of the dynamic monsoon surge index (DMSI) and boundary water vapor budget (BWVB) show that the monsoon surge kept providing abundant water vapor for Rammasun, which led to the enhanced rainfall. (3) The East Asian monsoon manifested an obvious low-frequency oscillation with a main period of 20–40 days in the summer of 2014, which propagated northward significantly. When the low-frequency oscillation reached the extremely active phase, the monsoon surge hit the maximum and influenced the circulation of Rammasun. Meanwhile, the convergence and water vapor flux associated with the low-frequency oscillation significantly contributed to the heavy rainfall.
1. Introduction
A tropical cyclone (TC, known as a typhoon over the western North Pacific) is one of the most important synoptic systems of tropical and subtropical ocean and land. Since 1949, an average of more than seven typhoons have made landfall in China every year, which can produce serious loss of life and property. Many extreme rainfall records of China are connected with typhoon activities [1]. The landfall of Typhoon Nina (1975) caused 24 h accumulated precipitation of more than 1000 mm in Henan Province [2], which is still the maximum 24 h rainfall record in mainland China. Although Typhoon Morakot (2009) did not break the 24 h rainfall record on Taiwan Island, it still produced precipitation of 2855 mm in the whole process and caused great damage there [3].
The rainstorm of a typhoon is affected by complex processes including multiscale systems. The East Asian summer monsoon (EASM) season is concurrent with the active typhoon season, and the EASM is a major factor of typhoon precipitation. Typhoons in the western North Pacific are mostly associated with monsoons, which have an important impact on the lifetime of typhoons. Many previous studies have explored the relationship between monsoons and typhoons [3,4,5,6,7,8,9,10,11]. The rainfall of a typhoon is mainly associated with its intensity and structure. Several existing studies have demonstrated that there is a positive relationship between typhoon rainfall and its intensity [12,13,14]. Wang and Zhou [5] suggested that the variability of monsoon systems have a positive effect on the rapid intensification of typhoons in the western Pacific and South China Sea. The adjustment of the East Asian monsoon in the South China Sea provides a more favorable environmental condition for the rapid intensification of typhoons from early July to mid-July during the Meiyu season [10]. Under the influence of the southwesterly monsoon flow, typhoons can easily produce comparatively active and long-lasting outer rainbands or mesoscale convective systems [3,8,9]. The asymmetric, long-lasting rainbands, mainly resulting from the convergence between the monsoon flow and the vortex circulation, possibly contribute 40% to 50% of typhoon precipitation [6]. When a typhoon is approaching the land or making landfall, the long-lasting rainband, together with the slowdown of the typhoon movement, causes heavy precipitation over land. The rainfall associated with a typhoon is related to the summer monsoon, mainly via the flux of moist and unstable air [15]. When the monsoon breaks out, water vapor and heat will be transported into the circulation of the typhoon, which is conducive to heavy rainfall [16]. Due to the low-frequency oscillation of the EASM, the monsoon surge exhibits obvious northward propagation in the South China Sea, which could impact typhoon circulation dramatically. From 1980 to 2017, a clear increasing tendency of precipitation associated with strong typhoons was observed in southern China, which was mainly caused by sufficient water vapor supply [17]. Hence, the typhoon–monsoon interaction, especially that related to intense typhoons, needs to be further explored.
In 2014, Rammasun formed on 12 July about 210 km west of Guam. Then, it moved northwestward as a severe tropical storm and landed in the Philippines on 15 July as a severe typhoon. After that, Rammasun quickly gained strength and became a super typhoon on 18 July and then made landfall again in Hainan Island, China. With its movement, Rammasun struck Guangdong and Guangxi Province subsequently [18]. During Rammasun’s landfall in Hainan, the intra-seasonal oscillation of monsoons reached an extremely active phase and was closely related to the significantly enhanced monsoon surge, which suggests that the monsoon surge might have had a positive relationship with the enhanced rainfall of Rammasun. There have been many studies on the reasons for the sudden intensification of Rammasun in the South China Sea and the heavy rainfall brought to Hainan. Throughout all the studies, more consideration has been given to the high and low altitude situation, vertical wind distribution, water vapor transport and typhoon structure, while less detailed research has been completed on the EASM surge [19,20].
It is well known that the South China Sea-Western North Pacific region has significant intra-seasonal oscillations of 30–60 days [21,22] and low-frequency oscillations of about 20 days [23], which are directly related to global atmospheric and oceanic changes, such as the East Asian summer wind and ENSO [24,25]. Many studies have pointed out that the development of tropical cyclones is closely related to the low-frequency oscillations in the atmosphere [26,27]. However, few studies have combined low-frequency oscillations with monsoon surges to explore the connection with the intensely enhanced rainfall of Rammasun.
In order to further understand the relationship between the monsoon surge, low-frequency oscillation of the EASM and the intensely enhanced rainfall of Rammasun and provide informative results for future forecast studies of landfalling TC precipitation, this paper analyzes the large-scale environmental field of Rammasun. The low-frequency oscillation in the South China Sea-Western North Pacific region has been used to figure out monsoon surge, and the relationship between monsoon surge and typhoon rainstorm increase is discussed by using low-frequency oscillation propagation. In addition, the vortex-removal method has also been utilized to stress the impact of the monsoon surge, thus casting light on the mechanisms behind the interaction between the monsoon surge and the heavy rainfall event.
This paper is organized as follows: Section 2 describes the data and methods. Section 3 gives an overview of Super Typhoon Rammasun, including the path and the characteristics of heavy rainfall during its landing in Hainan. Section 4 discusses the possible reasons for the heavy rainfall event based on fields of basic atmospheric elements including geopotential height field, water vapor transportation and convergence. Section 5 looks into the low-frequency oscillation and monsoon surge during the landfall period in detail and analyzes the association between low-frequency wind field without TC circulation and water vapor transposition, so as to find out how a monsoon surge impacts enhanced rainfall. Finally, discussion and conclusions are presented in Section 6.
2. Data and Methods
2.1. Data
The basic details of Super Typhoon Rammasun, including the center position and intensity, were obtained from the Shanghai Typhoon Institute (STI) of the China Meteorological Administration (CMA) best-track dataset [28,29]. Compared with other best-track datasets, the STI/CMA dataset also includes the observational data of typhoons when they are close to China.
The precipitation of Rammasun was derived from the Integrated Multi-satellite Retrievals for the Global Precipitation Measurement (GPM) Mission (IMERG) product. The Global Precipitation Measurement (GPM) mission [30] comprises an international network of satellites to provide the next generation of global observations of rain and snow [30,31]. Built upon the success of the widely used TMPA products, the newly released Integrated Multi-satellite Retrievals for GPM (IMERG) products [32,33,34] continue to make improvements in areas such as spatial and temporal resolutions, snowfall estimates, etc., which will be valuable for research and applications around the world [35]. Half-hourly Integrated Multi-satellite final-run for GPM (IMERG-V06) is utilized in this article. Final-run data means the data has been corrected by real data at the ground station. The correlation coefficient is 0.83 for the GPM data and the real data at the ground station, which is better than the IMERG data, during Rammasun landfall [36]. The accuracy of GPM is closer to the real precipitation data. Additionally, compared with March–December 2014 3-hourly TRMM data (3B42V7), the correlation between IMERG data and real rainfall data is higher. The IMERG data has reasonable agreement with the real data. Furthermore, the IMERG data is valuable for regions lacking precipitation-measuring instruments on the Earth’s surface [35].
The circulation features and other environmental conditions were directly derived from the European Centre for Medium-Range Weather Forecasts ERA5 reanalysis data with a spatial resolution of 0.25° × 0.25° [37]. Compared with the previous ERA-Interim reanalysis, this new dataset has some significant improvements, as it boasts an enhanced horizontal resolution of 31 km and has hourly outputs throughout. The ERA5 data also incorporates more historical observations, especially satellite data, into an advanced data assimilation model system to improve accuracy and assesses atmospheric uncertainties by using an ensemble reanalysis product, for the first time, consisting of 10 sources with a temporal resolution of 3 h [37].
In the current study, both the reanalysis data and precipitation data were sorted out with a 6 h temporal interval (00 UTC, 06 UTC, 12 UTC, and 18 UTC) to match the temporal resolution of the best-track dataset. It should be noted that the IMERG precipitation was accumulated in the 6 h interval.
2.2. Method
With the background monsoon circulation, the monsoon surge is highly associated with low-level jet and contributes to heavy rainfalls. According to the definition from the Glossary of Meteorology of the American Meteorological Society, the monsoon surge refers to the temporary extension of monsoon flow into a region not normally dominated by persistent monsoon flow. A monsoon surge is generally calculated as the mean wind components in a selected region [38,39]. A dynamic monsoon surge index (DMSI) has been used considering the east-to-west movement of typhoons in the western North Pacific [11]. The DMSI has been defined as follows:
where represents the 850 hPa zonal wind, means the longitudinal range from 40° to 10° in the west of the typhoon center, refers to the latitudinal range from 20° to 0° in the south of the typhoon center, and N is the grid number in the region.
This paper also investigates the evolution of water vapor budget along the four (east, west, south, and north) boundaries of the rectangular region with side lengths of 11° from the center of Rammasun to determine the water vapor transportation to TC on an 850 hPa level. The specific calculation for BWVB was defined as:
where the right-hand side of Equation (2) is separated into four terms which refer to the water vapor flows into the selected zone from the southern, northern, western, and eastern boundaries. k and n are the number of grids along the meridional and zonal directions in the selected zone, and ∆l is the grid spacing on each boundary.
TCs have prominent impacts on different temporal and spatial scale environments. By contrasting the TC-removed field with the original reanalysis data, previous studies have already indicated that TC can contribute more than 50% to the intraseasonal variance of vorticity and enhance both kinetic energy and vorticity near the track of TC in the western North Pacific [40,41]. In order to reduce the effect of TC on the low-frequency oscillation, the circulation of Rammasun was subtracted from the reanalysis data following the vortex-removal method in Galarneau and Davis [42]. This technique calculates the TC-related rotational and divergent winds within the given radius (usually 500 km) of the TC domain based on the TC-related stream function and velocity potential through the Helmholtz equations. After solving the Helmholtz equation, the TC-related rotational and divergent winds are excluded from the original dataset to get the non-TC wind field.
After removing the TC vortex, power spectrum analysis and bandpass filter were used to separate the wind associated with low-frequency oscillations from the TC-removed zonal wind. The power spectrum analysis is a method applied to the variation of a particular dataset to compute its frequency spectrum [43]. The spectrum of a specific signal indicates the relative magnitude of its frequency on the total signals. In this study, the power spectrum analysis extracted the most important temporal-scale oscillation in the TC-removed reanalysis dataset, while the bandpass filter transmitted the signal of specific frequency wind and blocked the signals of lower and higher frequency wind.
In short, Figure 1 shows the main research process, including every methodology we have proposed, of our study.
3. Overview of the Super Typhoon Rammasun
Super Typhoon Rammasun, the ninth typhoon in the 2014 western North Pacific typhoon season, is the most intense tropical cyclone to make landfall in China since 1949. After forming to the east of the Philippines over the western North Pacific on 12 July, Rammasun moved westward and intensified to the stage of severe typhoon before its first landfall in the Philippines. After crossing the mid-Philippines, it entered the South China Sea and reintensified rapidly due to the favorable environmental conditions there. It reached the maximum intensity of its lifetime near Hainan Island in the early morning of 18 July. At 15:30 BJT (7:30 UTC) on the same day, Rammasun landed in the Wenchang city of Hainan with a maximum wind of more than 70 m/s. After moving across Hainan Island and Qiongzhou Strait, Rammasun made the third and fourth landfall of its lifetime over mainland China, and finally weakened and dissipated at Guangxi Province on 20 July.
This study mainly focuses on the precipitation enhancement during Rammasun’s second landfall in Hainan Island. Figure 2 shows the 6 h accumulated rainfall distribution of Rammasun from 00 UTC to 18 UTC on 18 July. Before Rammasun’s landfall in Hainan Island, the inner-core structure of Rammasun was well-organized and the rainfall was mainly compact near the typhoon center (Figure 2a). Since the second landfall in Hainan at 7:30 UTC on 18 July, the precipitation of the inner core lost its compactness and began weakening (Figure 2b). During Rammasun’s propagation through Hainan Island, the near-center precipitation was much weaker than the terrain-forced rainfall over the west of Hainan Island (Figure 2c). The maximum rainfall tended to occur on the left side of the motion, which differs from the result of a previous study [44], possibly contributed by the influence of the terrain and monsoon. Considering the difference of rainfall distribution between different periods, the rainfall enhancement was divided into two stages based on whether Rammasun made landfall or not. In the first stage of rainfall enhancement (from 18 UTC 17 July to 06 UTC 18 July), the enhancement of precipitation was mainly distributed around the track of Rammasun, possibly due to the rapid intensification of this super typhoon (Figure 2d). At this stage, Rammasun had not made landfall in Hainan yet, but the circulation had already began influencing Hainan, with the 6 h rainfall intensity reaching no more than 40 mm. At the second stage, Rammasun landed on Hainan, and the rainfall was enhanced rapidly mainly over the left-side area of its path, making the 6 h cumulative precipitation in the northeastern region of Hainan Island gradually increase to more than 140 mm (Figure 2b,c). A precipitation increase of about 120 mm can thus be observed compared to the result of the previous period (Figure 2f).
The compact, extreme, and sudden precipitation caused by the landfalling Super Typhoon Rammasun led to huge property damage and casualties. In general, the analysis of TC precipitation starts from the environmental field, including the 500 hPa geopotential height field and the 850 hPa wind field. The interaction of the low- and mid-latitude systems and their reasonable spatial and temporal distribution are crucial for the intensity of TC and the increase of heavy rainfall [45]. It is also believed that if a TC that makes landfall is continuously associated with low-level jet, it will lead to persistent heavy rainfall from the TC. The air on the mainland is warm and the temperature of the low-level jet is low before TC landfall. As the TC is moving to the mainland, the warm air on the mainland is forced by the peripheral airflow of the tropical cyclone and starts to spread southward. After the low-level jet warms up by crossing the warm air, the warm advection to the TC significantly enhances. With other favorable dynamic conditions, a large-scale continuous heavy rainfall will form. This model has been verified many times in operations. Thus, the environmental field is a key feature associated with the sudden precipitation caused by landfalling Super Typhoon Rammasun [11].
4. Possible Reasons for the Heavy Rainfall
4.1. The 500 hPa Geopotential Height Field
To find out how the circulation impacted the extreme rainfall, the 500 hPa geopotential height field was analyzed. During the landfall period of Rammasun, the western Pacific subtropical high (WPSH) extended significantly westward, with a ridge point reaching around 113° E and a double ridge pattern forming (Figure 3a,b). The mid-latitude westerly trough developed eastward, preventing the subtropical high from moving westward. A low-pressure zone formed between the continental high and the subtropical high. After its landfall, Rammasun was located in the low-pressure zone, forming a relatively stable pattern featuring “a trough in the north and a vortex in the south” (Figure 3b,c) together with the mid-latitude westerly trough. Such a saddle-shaped circulation pattern could hinder the motion of Rammasun and slow down the translation speed, thereby providing suitable conditions for the maintenance of circulation, which was conducive to enhanced rainfall [7]. Nevertheless, to cause huge precipitation, like Rammasun, this kind of geopotential height field only provides a favorable necessary condition while a large amount of water vapor transport [46], which is related to the wind field and specific humidity, is required.
4.2. Characteristics of Wind Field and Water Vapor Flux
Before Rammasun made landfall in Hainan Island, the southwestern side of Rammasun had been affected by the southwest monsoon from the South China Sea. During the landfall of Rammasun, the cross-equatorial air current on 105° E and the Somali jet gradually increased with time, forming a continuous low-level jet at 20° N which further developed the southwest monsoon in the South China Sea (Figure 3c). Furthermore, the wind field is significantly associated with water vapor transportation, which is even more vital to the heavy rainfall.
From 00 UTC to 06 UTC on 18 July, a complete water vapor transport belt initially formed from the Arabian Sea to the South China Sea under the influence of the combination of two cross-equatorial air currents. Water vapor, transported along with its circulation to the northeastern side of Hainan Island, where the precipitation increase hit the maximum, was injected into Rammasun. Thus, a rainfall enhancement was produced in this area (Figure 4c,d), and the water vapor was supplemented to compensate for the energy attenuation as well [47], which played an important role in the occurrence of heavy rainfall.
The direction of the water vapor flux is only related to the ambient wind field while the magnitude of the water vapor flux is not only related to specific humidity, but also determined by the wind speed. If low wind speed occurs, no water vapor transport belt will formed even when the specific humidity is large. Therefore, the gradual formation of the water vapor transport belt with a westward direction in Figure 4c,d is determined by the enhancing zonal wind. Figure 5 shows the time-latitude cross section of 850 hPa zonal wind and wind vector. It can be seen that the westerly wind had not strengthened to more than 9 m/s before 15 July, and the area with relatively large values was located at around 7° N. However, after 15 July, the westerly wind increased above 9 m/s in the southern part of the South China Sea. Besides, a large-value area appeared and continued to expand, spreading to around 15° N on 17–18 July, where it reached the Rammasun circulation and was merged into the vortex circulation of Rammasun. This was of great significance to maintaining the intensity of Rammasun and bringing massive water vapor into the circulation, thus contributing to the heavy rainfall event.
4.3. Dynamic Monsoon Surge Index and Boundary Water Vapor Budget
The DMSI, as defined in Section 2, represents the intensity of a monsoon during the movement of a typhoon. To figure out the water vapor budgets on different orientations of Rammasun, the BWVB has also been introduced in Section 2, which reveals the water vapor budgets of four boundaries of Rammasun during its lifetime.
Figure 6 shows the evolution of DMSI and BWVB during the Rammasun lifetime. The DMSI increased continuously for three days before the heavy rainfall event. At this time, the inflows on the south and west boundaries enhanced, while an outflow increased rapidly on the north boundary. Subsequently, several hours after the heavy rainfall event emerged on 19 July, the growth rate of the DMSI dropped sharply. Simultaneously, the inflows on the south and west boundaries declined as well, but the overall inflow was maintained at a relatively high value due to a strengthened inflow on the east boundary.
The consistent evolution between DMSI and BWVP certifies that the enhanced rainfall of Rammasun was related to the intensity of the monsoon. Before the heavy rainfall event emerged, the monsoon had strengthened continuously, as shown by the increasing speed of the southwest wind near the region of Rammasun, but it had not reached an extremely active phase. The enhanced wind from the Pacific Ocean brought abundant water vapor inflow to the west and south boundaries of Rammasun, providing a favorable water vapor condition for the subsequent rainfall enhancement in Hainan. When the monsoon reached an extremely active phase, the southwest wind near the region of Rammasun increased to a peak, and so did the water vapor inflows to the west and south boundaries of Rammasun. At this time, Rammasun arrived at Hainan, and the heavy rainfall event occurred. It is noteworthy that the water vapor inflow intensified rapidly on the south boundary before 19 July. However, the zonal wind cannot interpret this phenomenon since the vapor transportation on the south boundary is related to the meridional wind according to Equation (2). Thus, the cross-equatorial airflow is analyzed below, especially its importance to the variation of the south boundary.
The south wind to the south of a TC turns to the southeast, injecting into the circulation of Rammasun. If the flow carries a large amount of heat, momentum, and water vapor from the tropical ocean, a favorable condition for typhoon development will be provided on the south boundary. The cross-equatorial airflow around 100° E showed a significant eastward propagation process (Figure 7). On 18 July, the positive meridional wind anomaly increased. Around 108° E, there was a cross-equatorial airflow which was enhanced to more than 5 m/s. This further developed the southwest monsoon to the south boundary of Rammasun, contributing to the increasing BWVB and intensity of the monsoon. The enhancement of zonal and meridional winds can be summarized as the enhancement of the southeast monsoon. There will be a dramatic increase in precipitation in the TC making landfall when the strongest northward propagation of the EASM surge occurs [7].
5. Impact of the Southwest Monsoon Surge on the Heavy Rainfall of Landfalling Rammasun at Hainan
5.1. Characteristics of the Low-Frequency Oscillation of the East Asian Summer Monsoon Surge
The different phases of intraseasonal oscillations have different effects on the monsoon surge. Since the area, 105~115° E, 12~20° N, in the northern South China Sea is located to the southwest of the landfalling typhoon and the path of the southwest monsoon, the zonal wind in this area can represent the southeast monsoon and will inject into the circulation of Rammasun, exhibiting a positive relationship with the intensity of Rammasun. Thus, in this study, the power spectrum analysis was applied to the 850 hPa mean zonal wind in the area to study the lower tropospheric zonal wind in the northern South China Sea from May to September 2014. The 850 hPa wind in the summer of 2014 was mainly dominated by a 20–40 days low-frequency oscillation (Figure 8). Band-pass filtering of the average zonal wind in this area (Figure 9) has shown that the low-level zonal wind of EASM on the 850 hPa level had a low-frequency oscillation with a period of 20–40 days. The peak period (17–18 July) refers to an extremely active phase of the low-frequency oscillation at the time of the heaviest rainfall in Hainan. This result indicates that the low-frequency oscillation definitely played an important role in the heavy rainfall during the landfall of Rammasun.
The low-frequency zonal wind can strengthen the intensity and propagation of the monsoon surge. Thus, according to the 20–40 days filtered zonal wind on 850 hPa along 111° E in 2014 (Figure 10), the monsoon surge had an obvious northward propagation process from early to late July. In early July, the negative low-frequency oscillation center in low-latitude regions changed to a positive one, representing the emergence of a new monsoon surge. At the same time, the low-frequency west wind began to propagate northward and reached about 18° N around 18 July, when it was located at the south side of Rammasun. The monsoon surge was strongest at this time, which corresponds to the heavy rainfall in Hainan. Due to the strong monsoon surge, continuous inflow intruded into the southern circulation of Rammasun, which favored the maintenance of the circulation and the heavy rainfall. So far, it has been tentatively proved that the monsoon surge was closely connected with the heavy rain event in Hainan. The low-frequency wind field and vapor transportation will be further analyzed in the next part.
5.2. Characteristics of Low-Frequency Water Vapor Flux
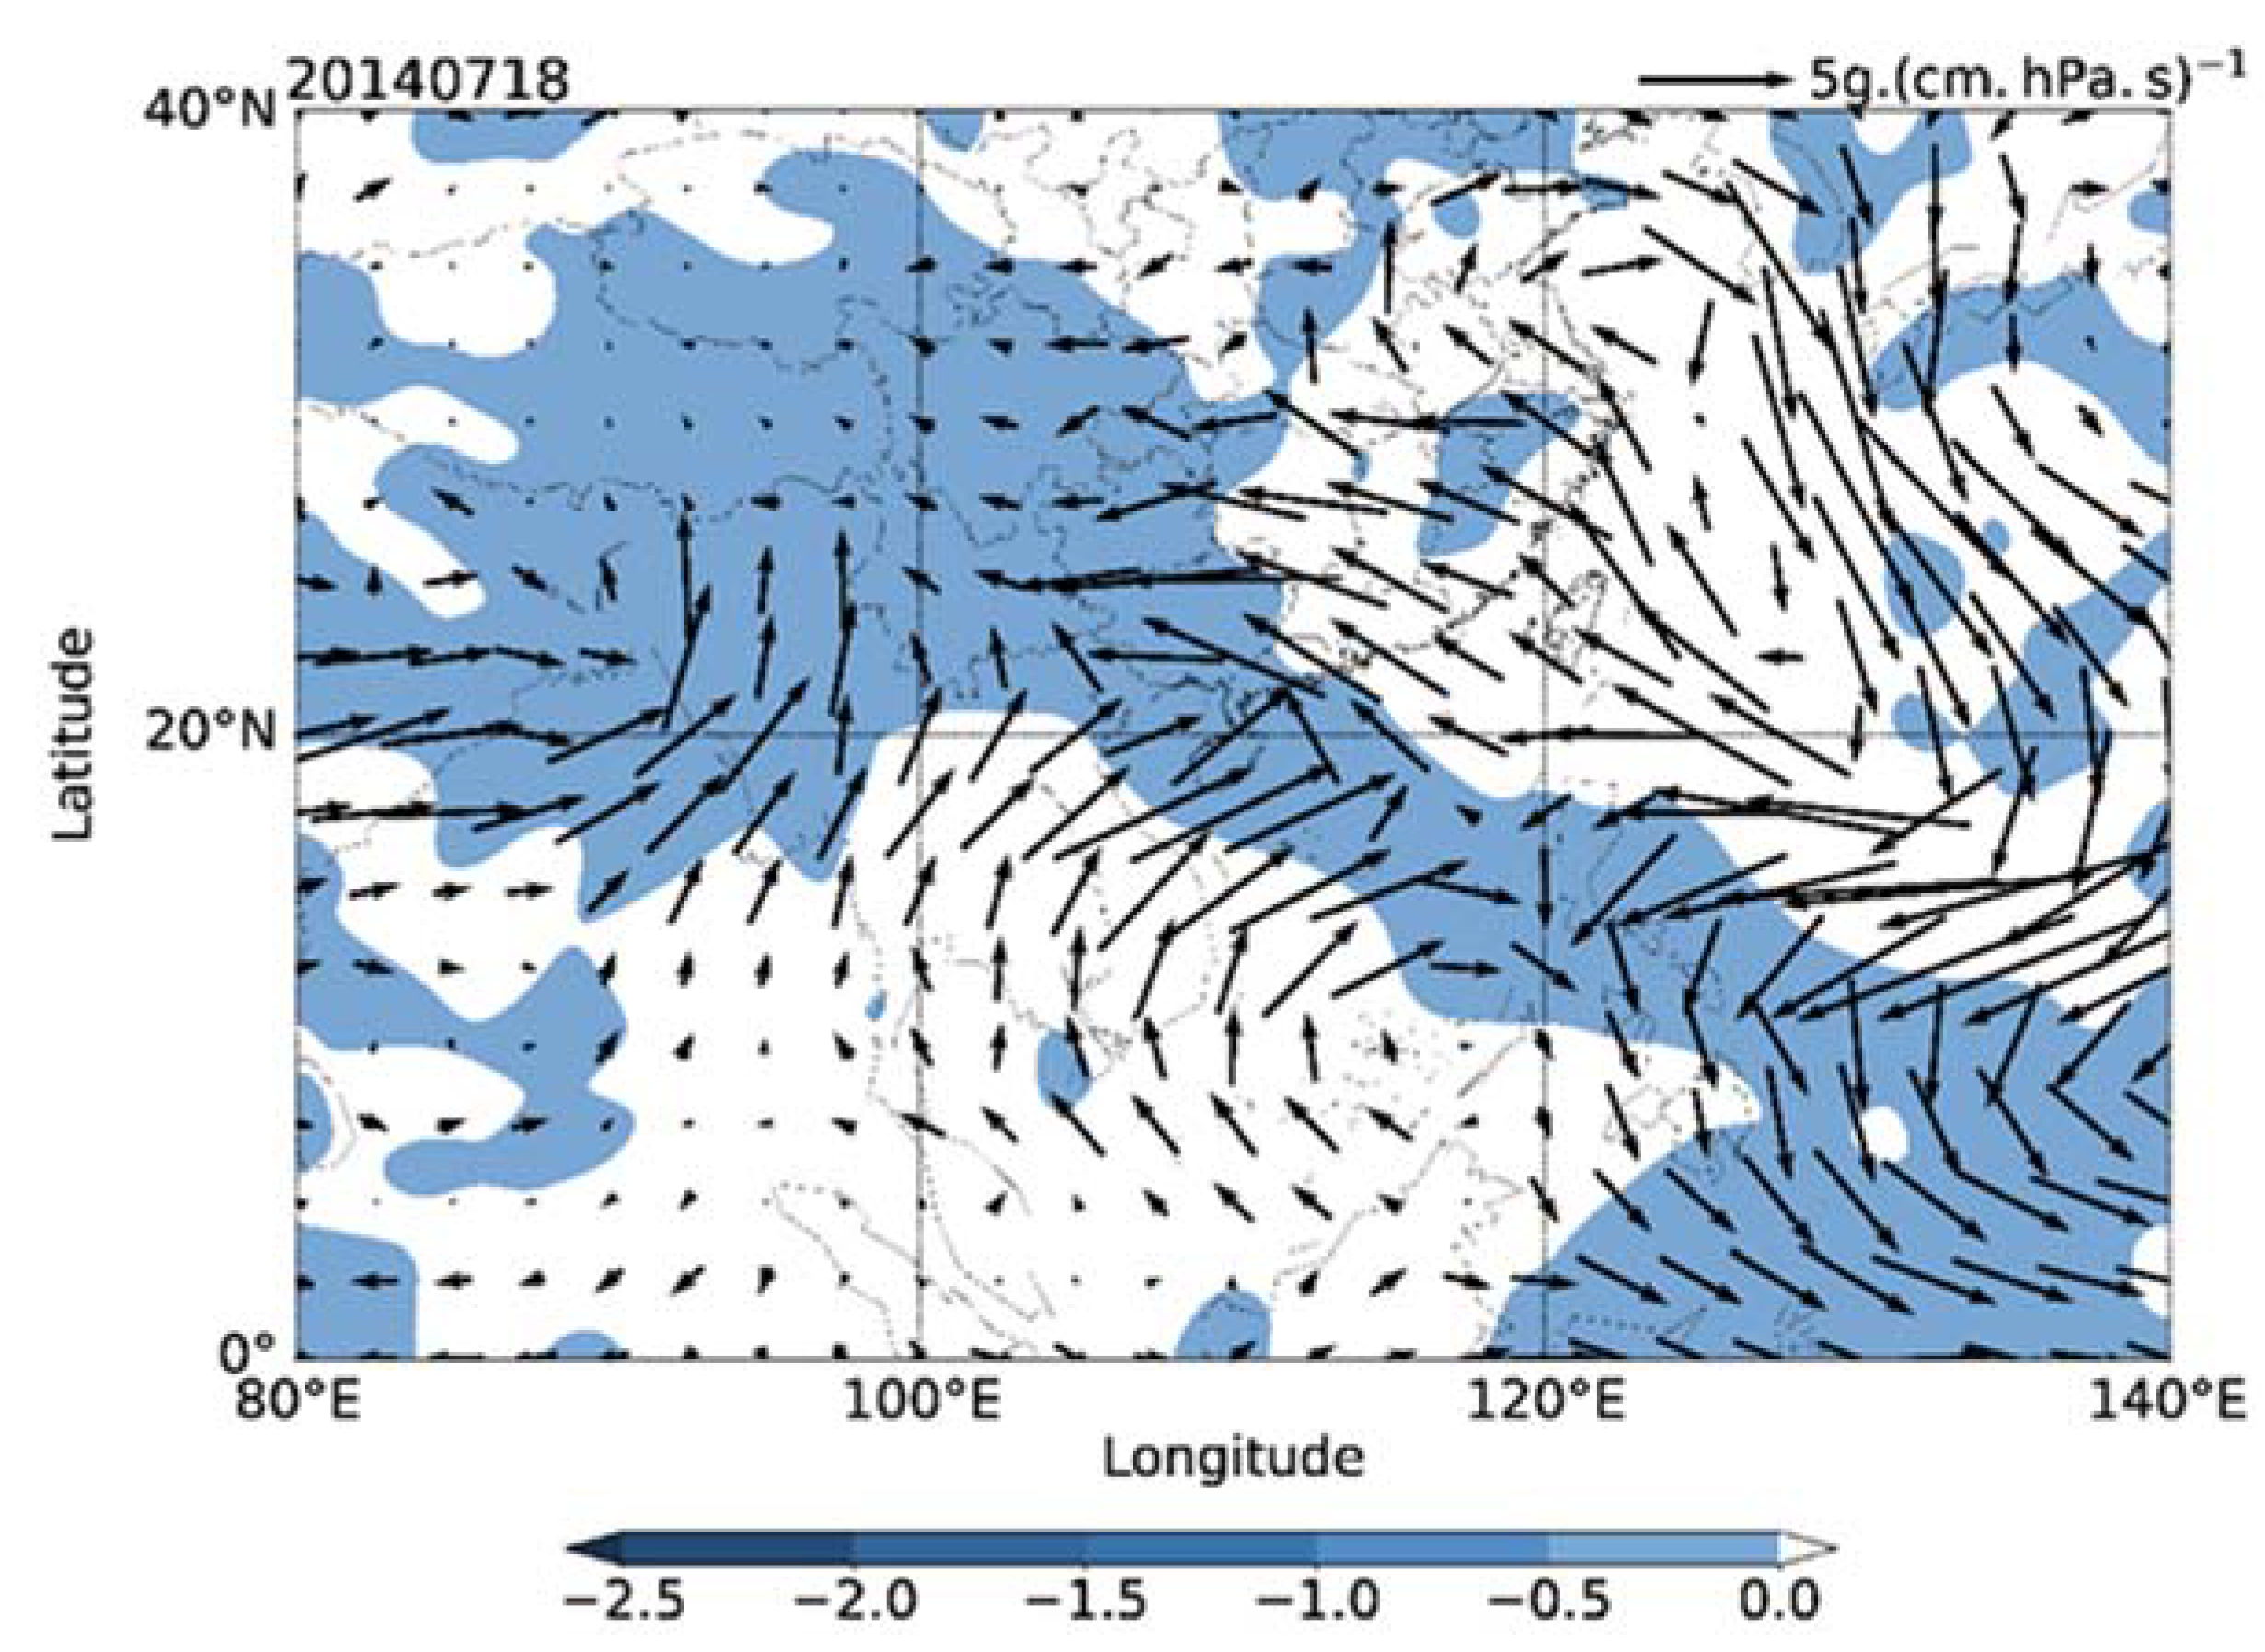
In this study, we investigated the low-frequency wind field before the extremely active phase in mid-July 2014. It has been found that the low-frequency west wind had low intensity and was located mainly at the central and southern parts of the South China Sea, and no obvious convergence existed. Then, the low-frequency west wind in the southern region increased gradually as its position moved northward, and the low-frequency south wind near 108° E also began to grow, which was connected with the west wind airflow. In the extremely active phase, the low-frequency west wind propagated northward, and South China was controlled by the low-frequency cyclonic circulation. The convergence zone near Hainan Island contributed to the heavy rainfall event occurring in Hainan. Considering the water vapor transportation, the convergence zone of the low-frequency water vapor flux located at Hainan in the early phase of mid-July got weaker and smaller, while the EASM developed towards the active phase. With the strengthening of the southwest monsoon, the low-frequency water vapor transportation from the Bay of Bengal intensified, extending to the South China Sea near Hainan. During the extremely active phase, the monsoon surge reached its maximum. The west wind and water vapor transportation in the north of the Indochina Peninsula and the South China Sea strengthened tremendously and their ranges expanded. As a result, the powerful water vapor convergence zone controlled the area around Hainan Island (Figure 11).
The EASM has an obvious characteristic of northward propagation, which is associated with the low-frequency wind field. The landfalling process of Rammasun co-occurred with the northward propagation process of the EASM, and the extremely active period of monsoon surge corresponded to the strongest increase in heavy rainfall in Hainan. During the summer of 2014, the lower-tropospheric zonal wind in the northern South China Sea was dominated by a 20–40 days low-frequency oscillation. When the low-frequency oscillation was in an extremely active phase, the water vapor transportation was greatly strengthened and its range was expanded, providing adequate water vapor flux near Hainan Island for the rainfall enhancement. The monsoon surge associated with the low-frequency oscillation of the EASM plays an important role in the occurrence of extreme heavy rainfall.
6. Summary and Conclusions
Super Typhoon Rammasun caused torrential rainfall after it landed in Hainan, which is rare in history. This paper mainly explores the related large-scale environmental circulation, the reasons for this heavy rainfall and the relationships between the southwest monsoon surge and the heavy rainfall.
The 500 hPa synoptic circulation conditions before and during the landfall of Rammasun were relatively stable. After the landfall, Rammasun was located at the low-pressure zone between the continental high and the WPSH. Together with the eastward movement of the westerly trough, a pattern featuring a north trough and a south vortex formed. On its west boundary, the WPSH exhibited a “double ridge” pattern conducive to the maintenance of typhoon circulation, which was favorable to the heavy rainfall and decreasing translation speed of Rammasun.
The cross-equatorial wind and zonal wind on 850 hPa enhanced significantly, which was associated with the strengthened monsoon surge. The enhanced winds supplied large amounts of heat and water vapor into Rammasun’s circulation. Additionally, analyses of DMSI and BWVB provided more details on the impact of the monsoon surge. The DMSI and the water vapor inflows on the west and south boundaries increased rapidly before the peak of the monsoon and the emergence of the heavy rainfall event. The evolution patterns of the cross-equatorial wind, the zonal wind, and the intensity of the monsoon have been found to be consistent during the same period.
The EASM in 2014 had an obvious 20–40 days low-frequency oscillation which featured a significant northward propagation. When the low-frequency oscillation reached an extremely active phase, the monsoon surge was strongest and intruded into Rammasun’s circulation, which concurred with the fiercely heavy rainfall in Hainan. The convergence of low-frequency air currents, the water vapor transportation and the low-frequency water vapor flux convergence in Hainan also brought more water vapor momentum to Rammasun, which was undoubtedly a crucial factor for the heavy rainfall as well.
Our conclusion indicates that the monsoon surge had a prominent effect on the extreme precipitation and rainfall enhancement during the landfall of Rammasun. However, there are several limitations in our study. Firstly, the variabilities of the intra-seasonal oscillation, including monsoon surge and monsoon trough, cannot be perfectly predicted. The major challenge of prediction lies in producing more reliable forecasts of water vapor transportation towards monsoon-influenced typhoons [3]. Further efforts are still required to explore the multiscale interaction between monsoons and typhoons. Secondly, not all TCs are associated with monsoon surges. If the low-frequency oscillation is in an inactive phase, the impact of a monsoon surge on landfall TC precipitation will no longer be as described in the conclusions in this paper. Therefore, how to accurately forecast the monsoon surge before typhoon landfall is one of the future research directions. Finally, the accuracy of the method we have utilized to remove TC circulation from the wind field still needs to be improved in future studies.
Author Contributions
Conceptualization, L.W.; methodology, L.W. and Y.D.; formal analysis, H.L., L.W. and Y.D.; writing—original draft preparation, H.L. and Y.D.; writing—review and editing, Y.D. and L.W.; visualization, H.L.; funding acquisition, L.W. and H.C. All authors have read and agreed to the published version of the manuscript.
Funding
This research was jointly supported by the National Natural Science Foundations of China (41975085), the National Key R&D Program of China (2019YFC1510004), and the Key Laboratory of South China Sea Meteorological Disaster Prevention and Mitigation of Hainan Province (SCSF202003).
Institutional Review Board Statement
Not applicable.
Informed Consent Statement
Not applicable.
Data Availability Statement
The CMA-STI best-track dataset is downloaded from the website of CMA Tropical Cyclone Data Center (https://tcdata.typhoon.org.cn/zjljsjj_zlhq.html, 16 January 2021). The ERA5 reanalysis dataset from the ECMWF (https://cds.climate.copernicus.eu/cdsapp#!/dataset/reanalysis-era5-pressure-levels?tab=form, 7 July 2021). The precipitation data is from NASA’s Global Precipitation Measurement (https://disc.gsfc.nasa.gov/datasets/GPM_3IMERGHH_06/summary?keywords=%22IMERG%20final%22, 22 May 2021).
Acknowledgments
We thank the Shanghai Typhoon Institute (STI) of China Meteorological Administration (CMA), the European Centre for Medium Range Weather Forecasts (ECMWF) and the National Aeronautics and Space Administration (NASA) for providing datasets used in this study.
Conflicts of Interest
The authors declare no conflict of interest.
References
- Tao, S.Y. Rainstorms in China; Science Press: Beijing, China, 1980; p. 225. (In Chinese) [Google Scholar]
- Chen, L.S.; Duan, Y.H.; Song, L.L.; Xu, Y.L. Typhoon Forecast and Disaster; China Meteorological Press: Beijing, China, 2012; p. 370. (In Chinese) [Google Scholar]
- Lee, C.S.; Wu, C.C.; Wang, T.C.C.; Elsberry, R.L. Advances in understanding the ‘‘perfect monsoon-influenced typhoon’’: Summary from International Conference on Typhoon Morakot (2009). Asia-Pac. J. Atmos. Sci. 2011, 47, 213–222. [Google Scholar] [CrossRef] [Green Version]
- Chien, F.-C.; Liu, Y.-C.; Lee, C.-S. Heavy Rainfall and Southwesterly Flow after the Leaving of Typhoon Mindulle (2004) from Taiwan. J. Meteorol. Soc. Jpn. 2008, 86, 17–41. [Google Scholar] [CrossRef] [Green Version]
- Wang, B.; Zhou, X. Climate variation and prediction of rapid intensification in tropical cyclones in the western North Pacific. Theor. Appl. Clim. 2007, 99, 1–16. [Google Scholar] [CrossRef] [Green Version]
- Lee, C.-S.; Chen, B.-F.; Elsberry, R.L. Long-lasting convective systems in the outer region of tropical cyclones in the western North Pacific. Geophys. Res. Lett. 2012, 39, 21812. [Google Scholar] [CrossRef]
- Wang, L.J.; Lu, S.; Guan, Z.Y.; He, J.L. Effects of Low-Latitude Monsoon Surge on the Increase in Downpour from Tropical Storm Bilis. J. Trop. Meteorol. 2010, 16, 101–108. [Google Scholar]
- Chen, B.F.; Elsberry, R.L.; Lee, C.S. Origin and maintenance of the long-lasting, outer mesoscale convective system in Typhoon Fengshen (2008). Mon. Weather Rev. 2014, 142, 2838–2859. [Google Scholar] [CrossRef]
- Chen, B.F.; Elsberry, R.L.; Lee, C.S. Synoptic controls of outer mesoscale convective systems in western North Pacific tropical cyclones. Asia-Pac. J. Atmos. Sci. 2016, 52, 11–23. [Google Scholar] [CrossRef]
- Qiu, W.; Wu, L.; Ren, F. Monsoonal Influences on Offshore Rapid Intensification of Landfalling Typhoons in a Sheared Environment over the South China Sea. Weather Forecast. 2020, 35, 623–634. [Google Scholar] [CrossRef]
- Zhao, D.; Yu, Y.; Chen, L. Impact of the Monsoonal Surge on Extreme Rainfall of Landfalling Tropical Cyclones. Adv. Atmos. Sci. 2021, 38, 771–784. [Google Scholar] [CrossRef]
- Rodgers, E.B.; Adler, R.F.; Pierce, H.F. Contribution of Tropical Cyclones to the North Atlantic Climatological Rainfall as Observed from Satellites. J. Appl. Meteorol. 2001, 40, 1785–1800. [Google Scholar] [CrossRef]
- Jiang, H. The Relationship between Tropical Cyclone Intensity Change and the Strength of Inner-Core Convection. Mon. Weather Rev. 2012, 140, 1164–1176. [Google Scholar] [CrossRef]
- Liu, M.; Vecchi, G.A.; Smith, J.A.; Knutson, T.R. Causes of large projected increases in hurricane precipitation rates with global warming. Npj Clim. Atmos. Sci. 2019, 2, 38. [Google Scholar] [CrossRef] [Green Version]
- Cheng, Z.Q.; Chen, L.S.; Li, Y. Interaction between landfalling tropical cyclone and summer monsoon with influences on torrential rain. J. Appl. Meteorol. Sci. 2012, 23, 660–671, (In Chinese with English abstract). [Google Scholar]
- Lei, X.; Chen, L. An Overview on The Interaction Between Tropical Cyclone and Mid-Latitude Weather Systems. J. Trop. Meteorol. 2001, 17, 452–461. [Google Scholar]
- Liu, L.; Wang, Y. Trends in Landfalling Tropical Cyclone–Induced Precipitation over China. J. Clim. 2020, 33, 2223–2235. [Google Scholar] [CrossRef]
- Zhou, M.; Kuang, Y.; Ruan, Z.; Xie, M. Geospatial modeling of the tropical cyclone risk in the Guangdong Province, China. Geomat. Nat. Hazards Risk 2021, 12, 2931–2955. [Google Scholar] [CrossRef]
- Sun, J.; Zuo, J.; Ling, Z.; Yan, Y. Role of ocean upper layer warm water in the rapid intensification of tropical cyclones: A case study of typhoon Rammasun (1409). Acta Oceanol. Sin. 2016, 35, 63–68. [Google Scholar] [CrossRef]
- Li, X.; Davidson, N.E.; Duan, Y.; Tory, K.; Sun, Z.; Cai, Q. Analysis of an Ensemble of High-Resolution WRF Simulations for the Rapid Intensification of Super Typhoon Rammasun (2014). Adv. Atmos. Sci. 2020, 37, 187–210. [Google Scholar] [CrossRef]
- Nakazawa, T. Intra-seasonal variations of OLR in the tropics during the FGGE year. J. Meteorol. Soc. Jpn. 1986, 64, 17–31. [Google Scholar] [CrossRef] [Green Version]
- Nakazawa, T. Mean features of 30–60-day variations as inferred from 8-year OLR data. J. Meteorol. Soc. Jpn. 1986, 64, 777–786. [Google Scholar] [CrossRef] [Green Version]
- He, J.H.; Murakami, T.; Nakazawa, T. The changes of the 40–50 days periodic oscillation of circulation and the water vapor transportation in the summer of 1979 the Asian monsoon region. J. Nanjing Inst. Meteor. 1984, 2, 163–175. (In Chinese) [Google Scholar]
- Hartmann, D.L.; Michelsen, M.L.; Klein, S.A. Seasonal Variations of Tropical Intraseasonal Oscillations: A 20–25-Day Oscillation in the Western Pacific. J. Atmos. Sci. 1992, 49, 1277–1289. [Google Scholar] [CrossRef] [Green Version]
- Ju, J.H.; Qian, C.; Cao, J. The intraseasonal oscillation of East Asian summer monsoon. J. Chin. J. Atmos. Sci. 2005, 29, 187–194. (In Chinese) [Google Scholar]
- Qian, X.A.Y. Relationship between OLR low-frequency oscillation and the formation of typhoon over the western Pacific. J. Meteorol. Mon. 1987, 10, 8–13. [Google Scholar]
- Bister, M.; Emanuel, K.A. Low frequency variability of tropical cyclone potential intensity 1. Interannual to interdecadal variability. J. Geophys. Res. Earth Surf. 2002, 107, ACL-26. [Google Scholar] [CrossRef]
- Ying, M.; Zhang, W.; Yu, H.; Lu, X.; Feng, J.; Fan, Y.; Zhu, Y.; Chen, D. An Overview of the China Meteorological Administration Tropical Cyclone Database. J. Atmos. Ocean. Technol. 2014, 31, 287–301. [Google Scholar] [CrossRef] [Green Version]
- Lu, X.; Yu, H.; Ying, M.; Zhao, B.; Zhang, S.; Lin, L.; Bai, L.; Wan, R. Western North Pacific Tropical Cyclone Database Created by the China Meteorological Administration. Adv. Atmos. Sci. 2021, 38, 690–699. [Google Scholar] [CrossRef]
- Hou, A.Y.; Kakar, R.K.; Neeck, S.; Azarbarzin, A.A.; Kummerow, C.D.; Kojima, M.; Oki, R.; Nakamura, K.; Iguchi, T. The global precipitation measurement mission. Bull. Am. Meteorol. Soc. 2014, 95, 701–722. [Google Scholar] [CrossRef]
- Huffman, G.J.; Bolvin, D.T.; Braithwaite, D.; Hsu, K.L.; Joyce, R.J.; Kidd, C.; Nelkin, E.J.; Sorooshian, S.; Stocker, E.F.; Tan, J.; et al. Integrated Multi-satellite Retrievals for the Global Precipitation Measurement (GPM) Mission (IMERG). In Satellite Precipitation Measurement; Levizzani, V., Kidd, C., Kirschbaum, D.B., Kummerow, C.D., Nakamura, K., Turk, F.J., Eds.; Springer: Berlin/Heidelberg, Germany, 2020; pp. 343–353. [Google Scholar]
- Huffman, G.J.; Bolvin, D.T.; Braithwaite, D.; Hsu, K.; Joyce, R.; Kidd, C.; Nelkin, E.J.; Xie, P. NASA Global Precipitation Measurement (GPM) Integrated Multi-satellitE Retrievals for GPM (IMERG). In Algorithm Theoretical Basis Document (ATBD) Version 4.5; NASA: Washington, DC, USA, 2015; p. 26. [Google Scholar]
- Huffman, G.J.; Bolvin, D.T.; Nelkin, E.J. Integrated Multi-SatellitE Retrievals for GPM (IMERG) Technical Documentation; NASA/GSFC Code: Washington, MD, USA, 2019; p. 47.
- Huffman, G.J.; Bolvin, D.T.; Nelkin, E.J. Day 1 IMERG Final Run Release Notes; NASA/GSFC: Greenbelt, MD, USA, 2015; p. 9.
- Liu, Z. Comparison of Integrated Multisatellite Retrievals for GPM (IMERG) and TRMM Multisatellite Precipitation Analysis (TMPA) Monthly Precipitation Products: Initial Results. J. Hydrometeorol. 2016, 17, 777–790. [Google Scholar] [CrossRef]
- Wang, R.; Chen, J.; Wang, X. Comparison of IMERG Level-3 and TMPA 3B42V7 in Estimating Typhoon-Related Heavy Rain. Water 2017, 9, 276. [Google Scholar] [CrossRef] [Green Version]
- Hersbach, H.; Bell, B.; Berrisford, P.; Hirahara, S.; Horányi, A.; Muñoz-Sabater, J.; Nicolas, J.; Peubey, C.; Radu, R.; Schepers, D.; et al. The ERA5 global reanalysis. Q. J. R. Meteorol. Soc. 2020, 146, 1999–2049. [Google Scholar] [CrossRef]
- Dong, M.; Chen, L.; Li, Y.; Lu, C. Rainfall Reinforcement Associated with Landfalling Tropical Cyclones. J. Atmos. Sci. 2010, 67, 3541–3558. [Google Scholar] [CrossRef]
- Hai, O.S.; Samah, A.A.; Chenoli, S.N.; Subramaniam, K.; Ahmad Mazuki, M.Y. Extreme Rainfalls that Caused Devastating Flooding across the East Coast of Peninsular Malaysia during November and December 2014. Weather Forecast. 2017, 32, 849–872. [Google Scholar] [CrossRef]
- Hsu, H.-H.; Hung, C.-H.; Lo, A.-K.; Wu, C.-C.; Hung, C.-W. Influence of Tropical Cyclones on the Estimation of Climate Variability in the Tropical Western North Pacific. J. Clim. 2008, 21, 2960–2975. [Google Scholar] [CrossRef]
- Ko, K.C.; Hsu, H.H.; Chou, C. Propagation and maintenance mechanism of the TC/sub-monthly wave pattern and TC feedback in the western North Pacific. J. Clim. 2012, 25, 8591–8610. [Google Scholar] [CrossRef] [Green Version]
- Galarneau, T.J., Jr.; Davis, C.A. Diagnosing Forecast Errors in Tropical Cyclone Motion. J. Mon. Weather Rev. 2013, 141, 405–430. [Google Scholar] [CrossRef] [Green Version]
- Oppenheim, A.V. Discrete-Time Signal Processing; Pearson Education India: Tamil, India, 1999. [Google Scholar]
- Corbosiero, K.L.; Molinari, J. The Relationship between Storm Motion, Vertical Wind Shear, and Convective Asymmetries in Tropical Cyclones. J. Atmos. Sci. 2003, 60, 366–376. [Google Scholar] [CrossRef]
- Yao, C.; He, H.Y.; Huang, M.C. A Comparison Analysis of the Large-Scale Circulations of the Two Typhoons Invaded the Western Part of South China. J. Acta Sci. Nat. Univ. Sunyatseni 2005, 6, 110–113, (In Chinese with English abstract). [Google Scholar]
- Malkus, J.; Riehl, H. On the dynamics and energy transformations in steady-state hurricanes. Tellus 1960, 12, 1–20. [Google Scholar] [CrossRef] [Green Version]
- Yang, Y.; Lin, Z.; Shen, X.; Zheng, X.; Shou, S. The numerical simulation of typhoon No. 200604 (Bilis) rainfall. J. Meteorol. Sci. 2009, 1, 71–76. [Google Scholar]
Figure 1.
The flowchart of the methods used in this study.

Figure 2.
The 6 h accumulated precipitation (shading, unit: mm) and tracks of Rammasun (a) from 00 UTC to 06 UTC 18 July, (b) from 06 UTC to 12 UTC 18 July, and (c) from 12 UTC to 18 UTC 18 July; this is the same as (a–c) but for rainfall difference (shading, unit: mm) of Rammasun (d) between the precipitation from 18 UTC 17 July to 00 UTC 18 July and that from 06 UTC to 12 UTC 17 July, (e) between the precipitation from 00 UTC to 06 UTC 18 July and that from 12 UTC to 18 UTC 17 July, and (f) between the precipitation from 06 UTC to 12 UTC 18 July and that from 18 UTC 18 July to 00 UTC 19 July.

Figure 3.
The 850 hPa wind field (vector, units:) and the 500 hPa geopotential height field (units: dagpm; the heavy solid line indicates the area of WPSH) at (a) 18 UTC 17 July; (b) 00 UTC 18 July; (c) 06 UTC 18 July; (d) 12 UTC 18 July. The shading shows the wind speed greater than or equal to 12 .
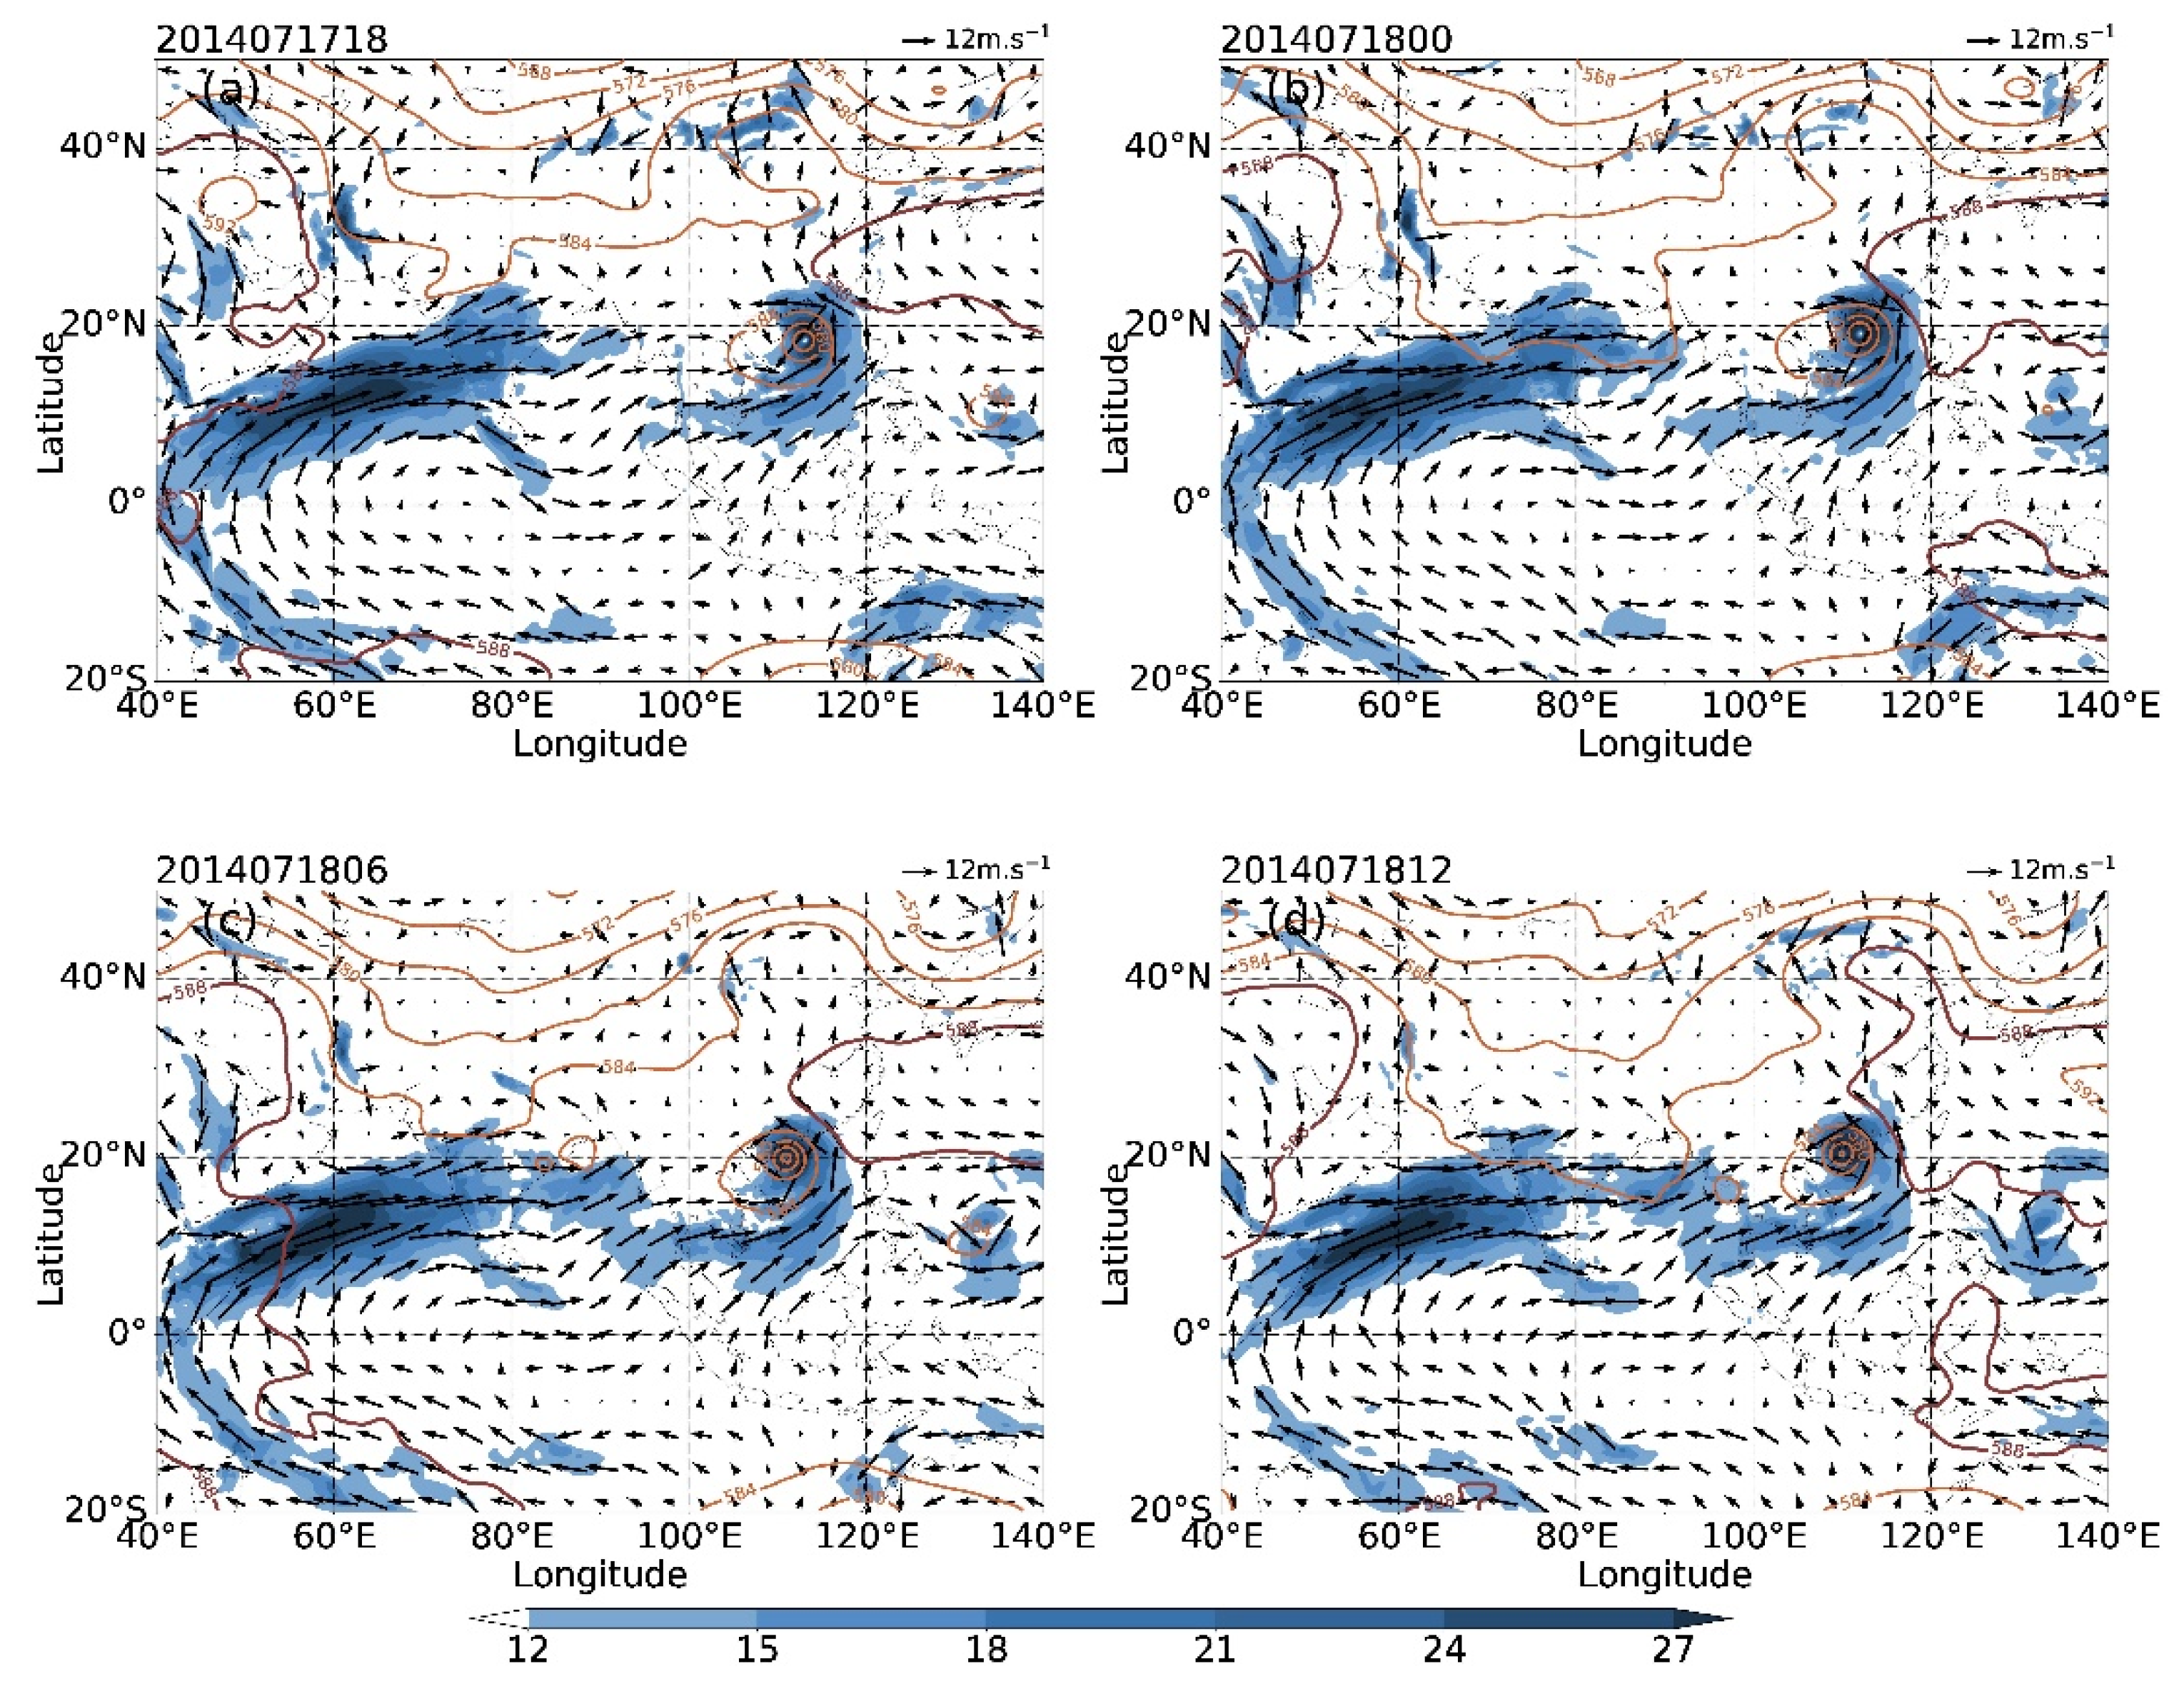
Figure 4.
The 850 hPa water flux (vector, units:) at (a) 18 UTC 17 July; (b) 00 UTC 18 July; (c) 06 UTC 18 July; (d) 12 UTC 18 July. The shading shows the water vapor flux greater than or equal to 12 .
Figure 4.
The 850 hPa water flux (vector, units:) at (a) 18 UTC 17 July; (b) 00 UTC 18 July; (c) 06 UTC 18 July; (d) 12 UTC 18 July. The shading shows the water vapor flux greater than or equal to 12 .
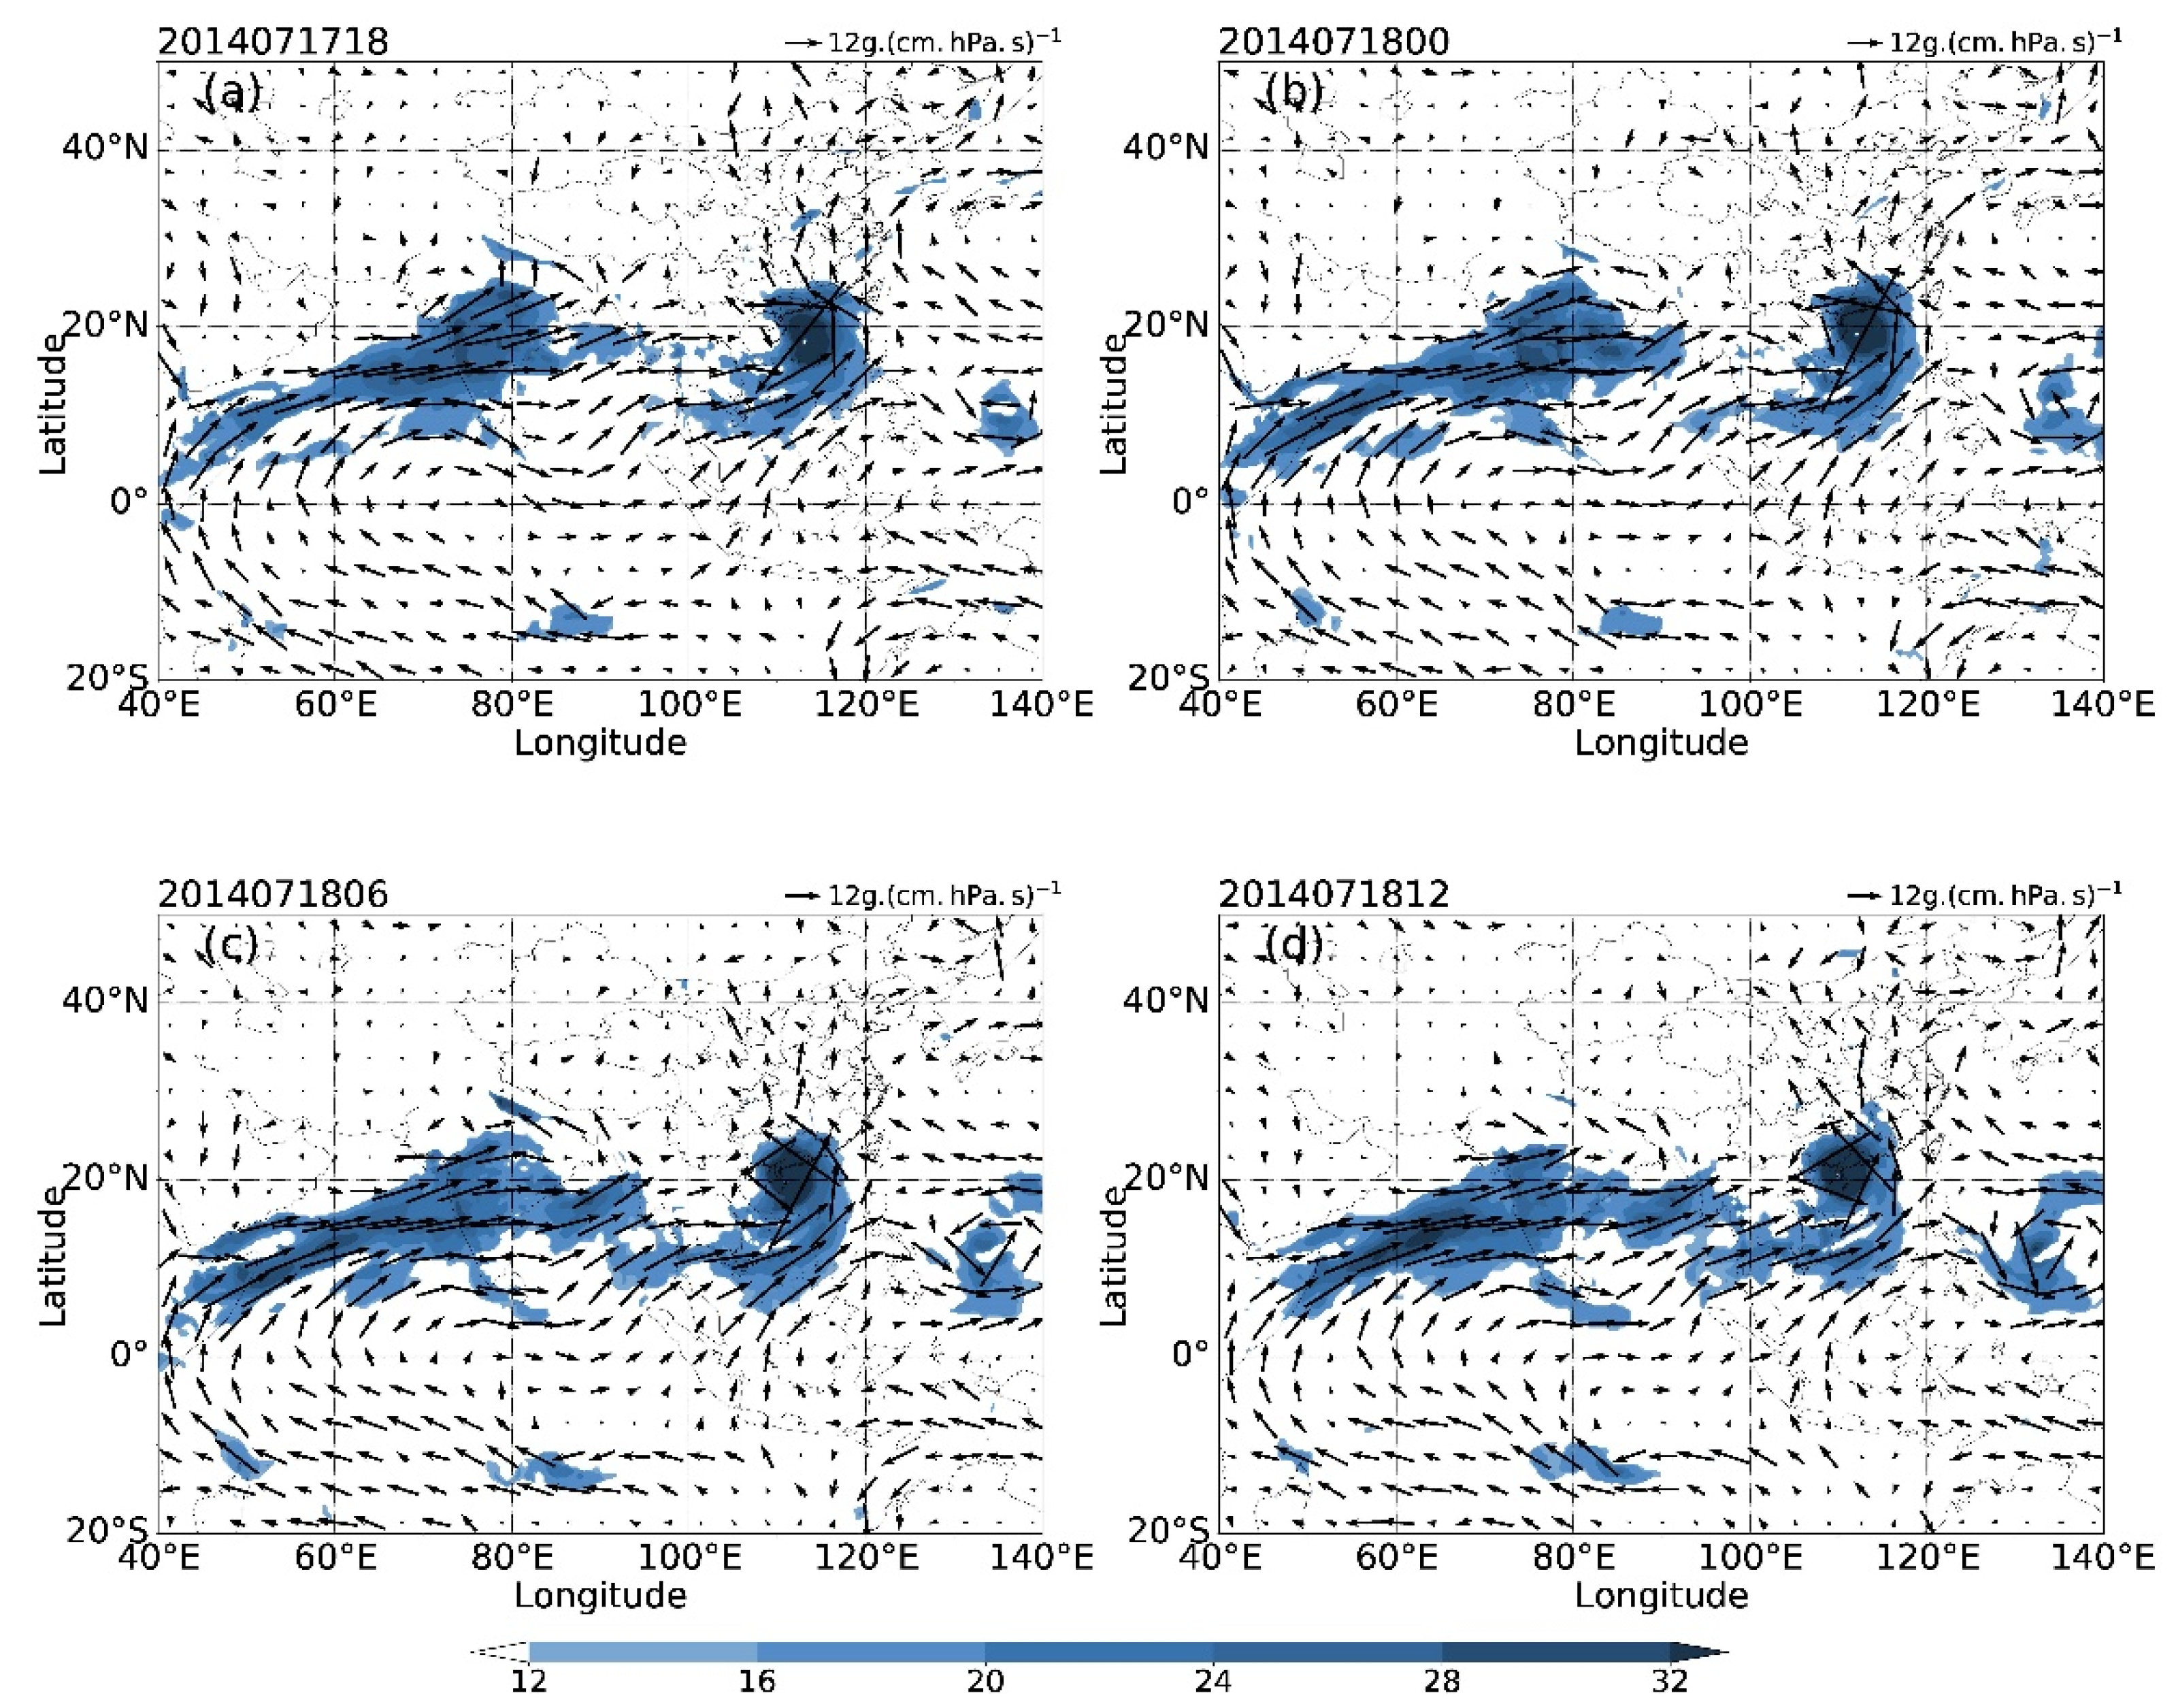
Figure 5.
Time-latitude cross section of 850 hPa zonal wind vectors on 111° E from 13 July to 21 July (units: m s−1; the shading shows the zonal wind greater than or equal to 6 m s−1).
Figure 5.
Time-latitude cross section of 850 hPa zonal wind vectors on 111° E from 13 July to 21 July (units: m s−1; the shading shows the zonal wind greater than or equal to 6 m s−1).

Figure 6.
The BWVB (units: kg m−1 s−1) and DMSI during the lifetime of Rammasun.
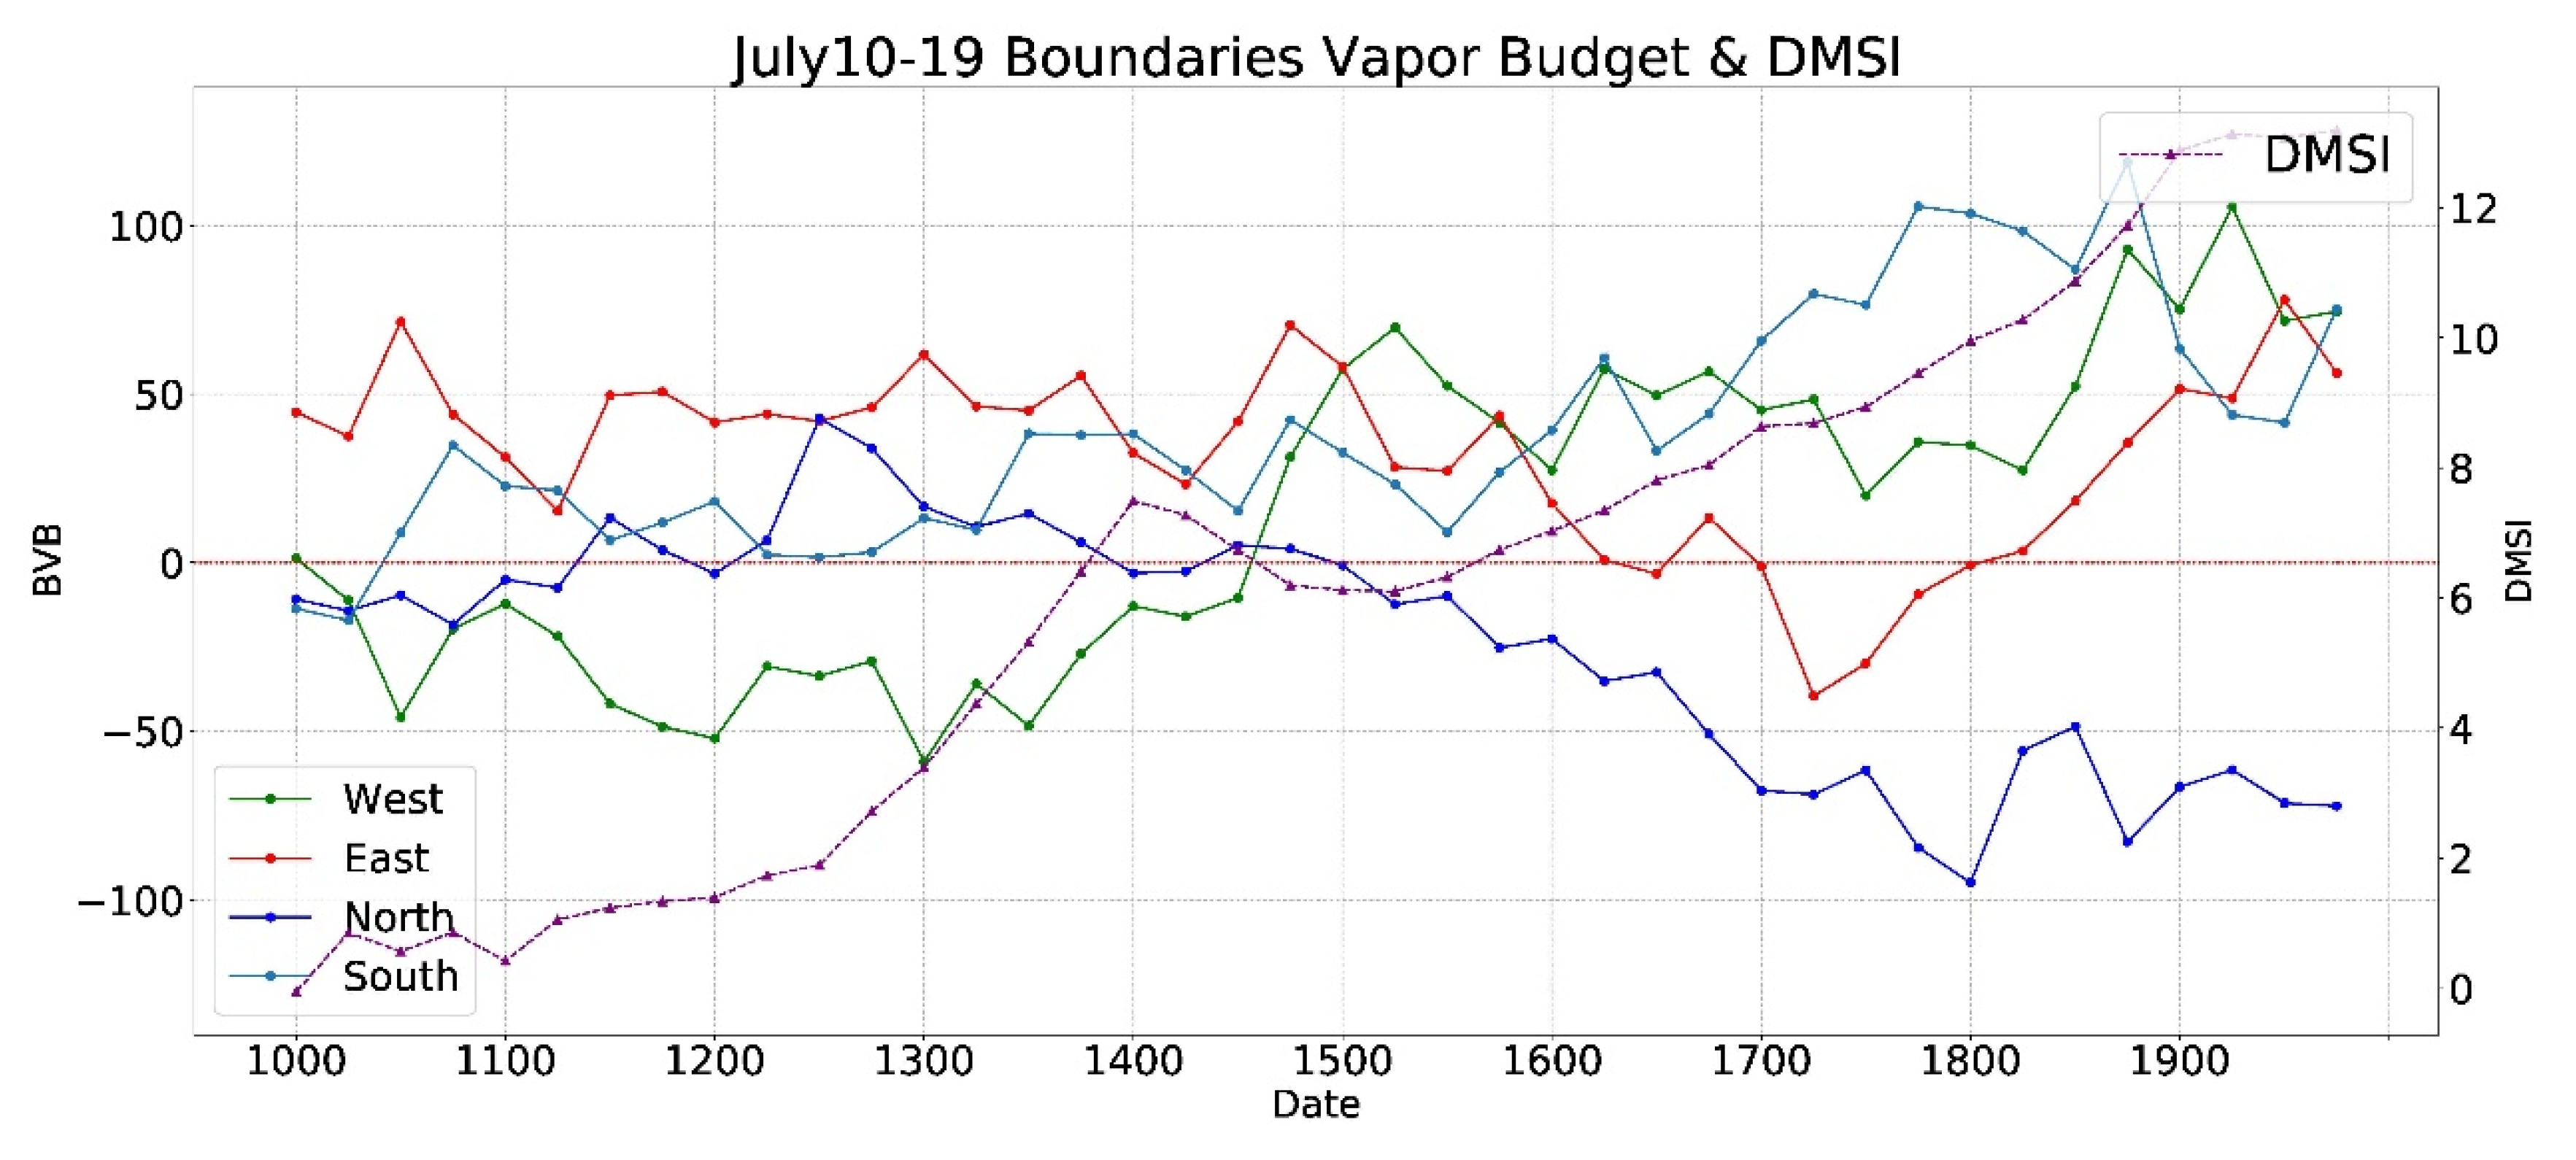
Figure 7.
Time-longitude sections of 850 hPa meridional wind anomaly along the equator from 13 July to 21 July (units: m s−1; the shading indicates the positive anomaly).
Figure 7.
Time-longitude sections of 850 hPa meridional wind anomaly along the equator from 13 July to 21 July (units: m s−1; the shading indicates the positive anomaly).
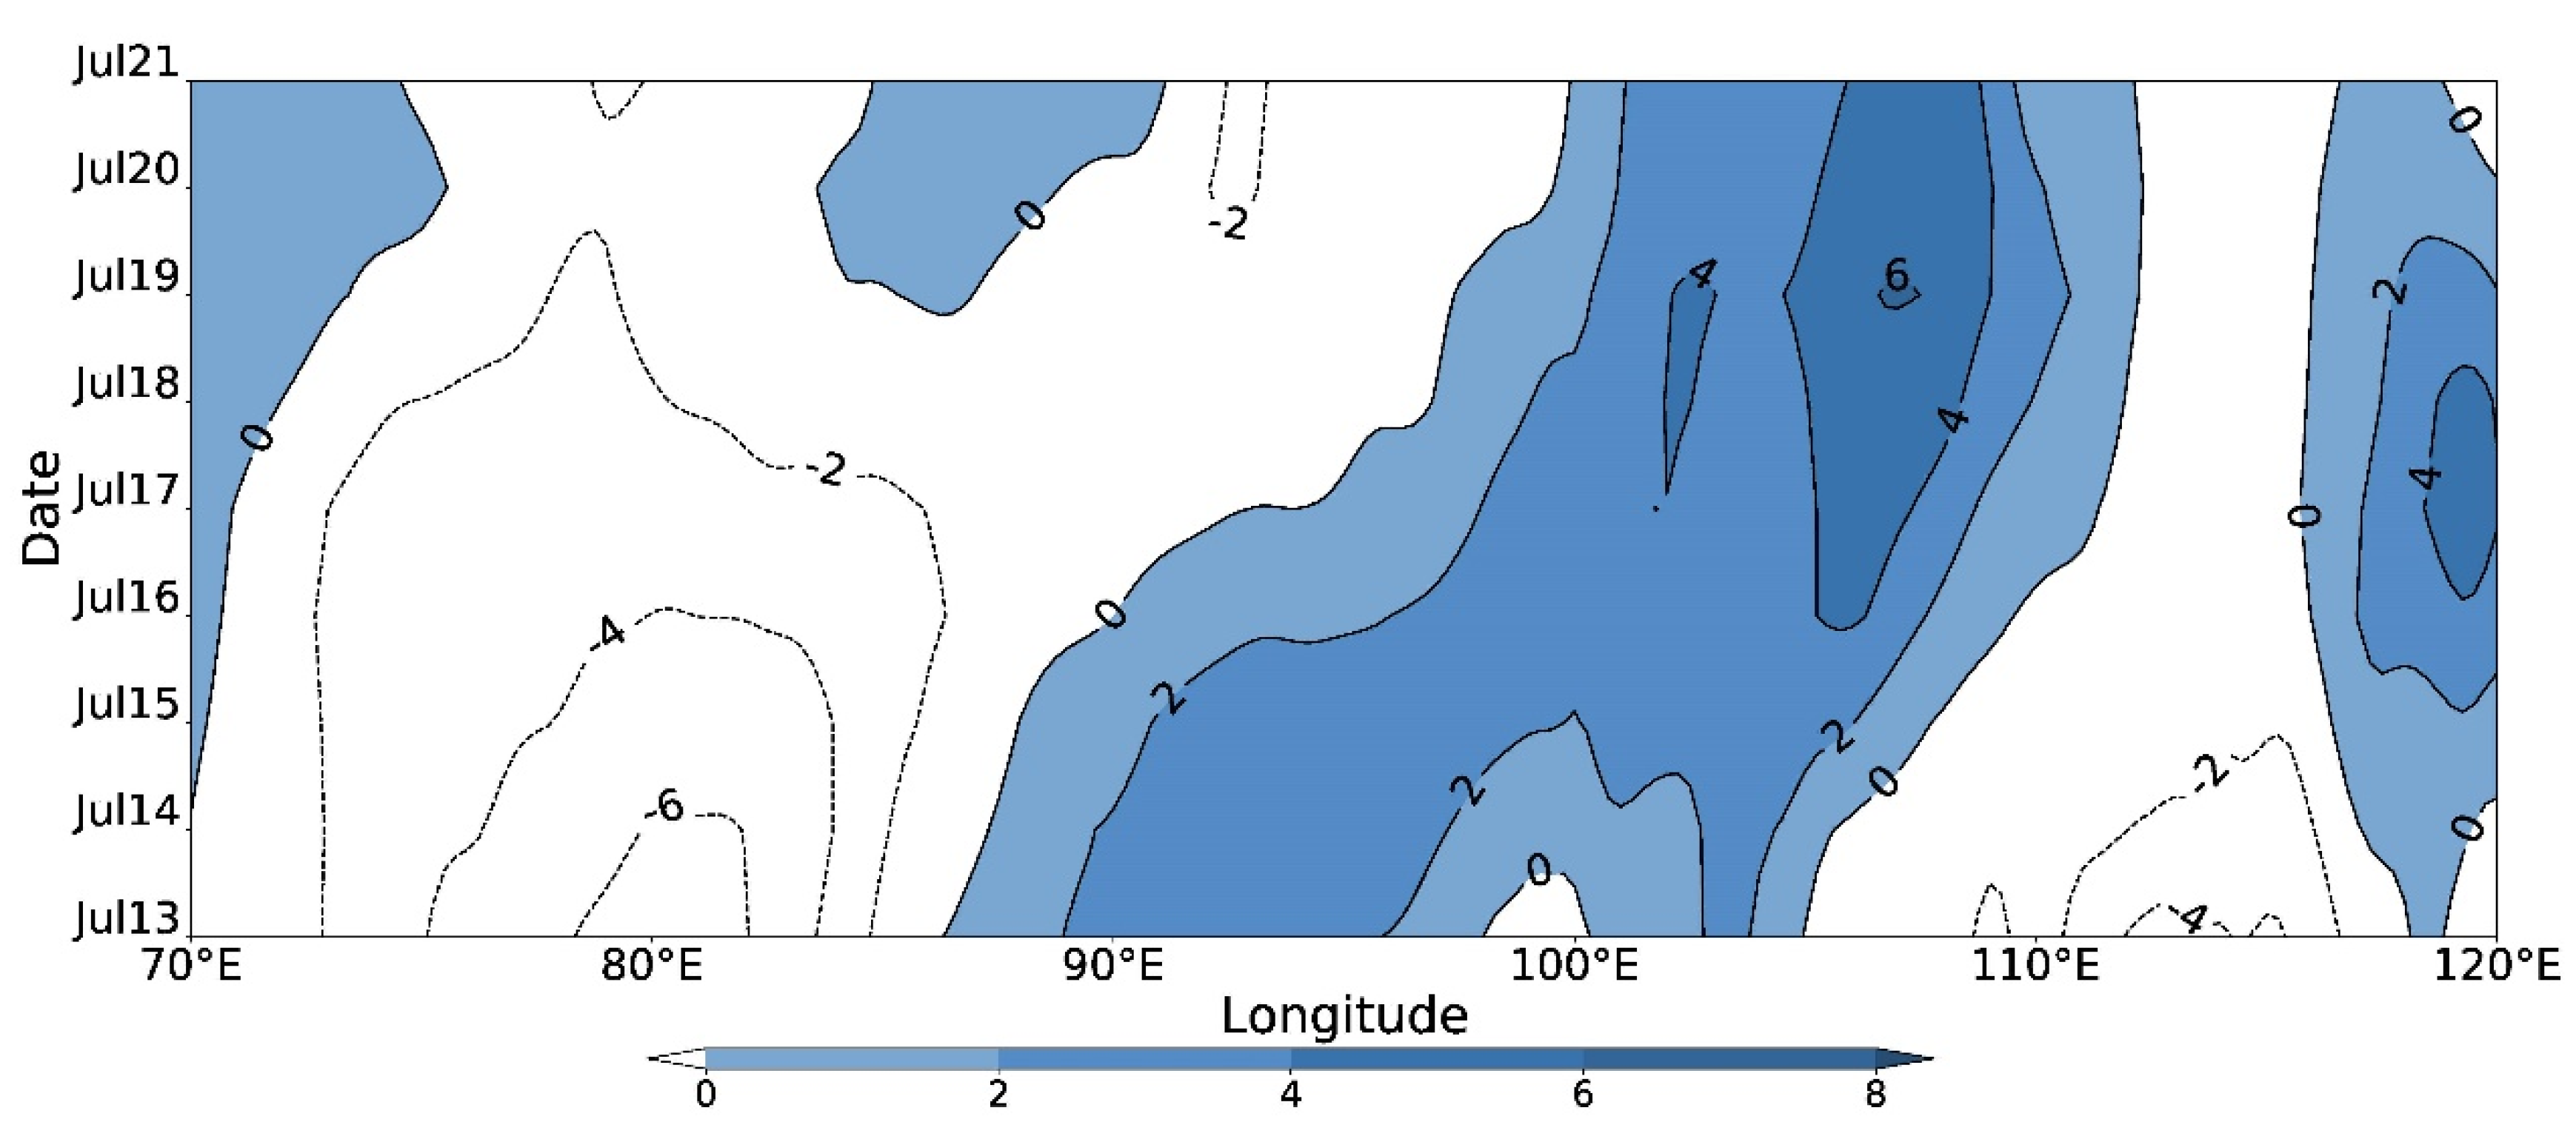
Figure 8.
Power spectrum analysis of smoothed zonal wind on 850 hPa in the northern South China Sea (105~115° E, 12~20° N) during May–September 2014 (the red dotted line indicates 95% confidence).
Figure 8.
Power spectrum analysis of smoothed zonal wind on 850 hPa in the northern South China Sea (105~115° E, 12~20° N) during May–September 2014 (the red dotted line indicates 95% confidence).
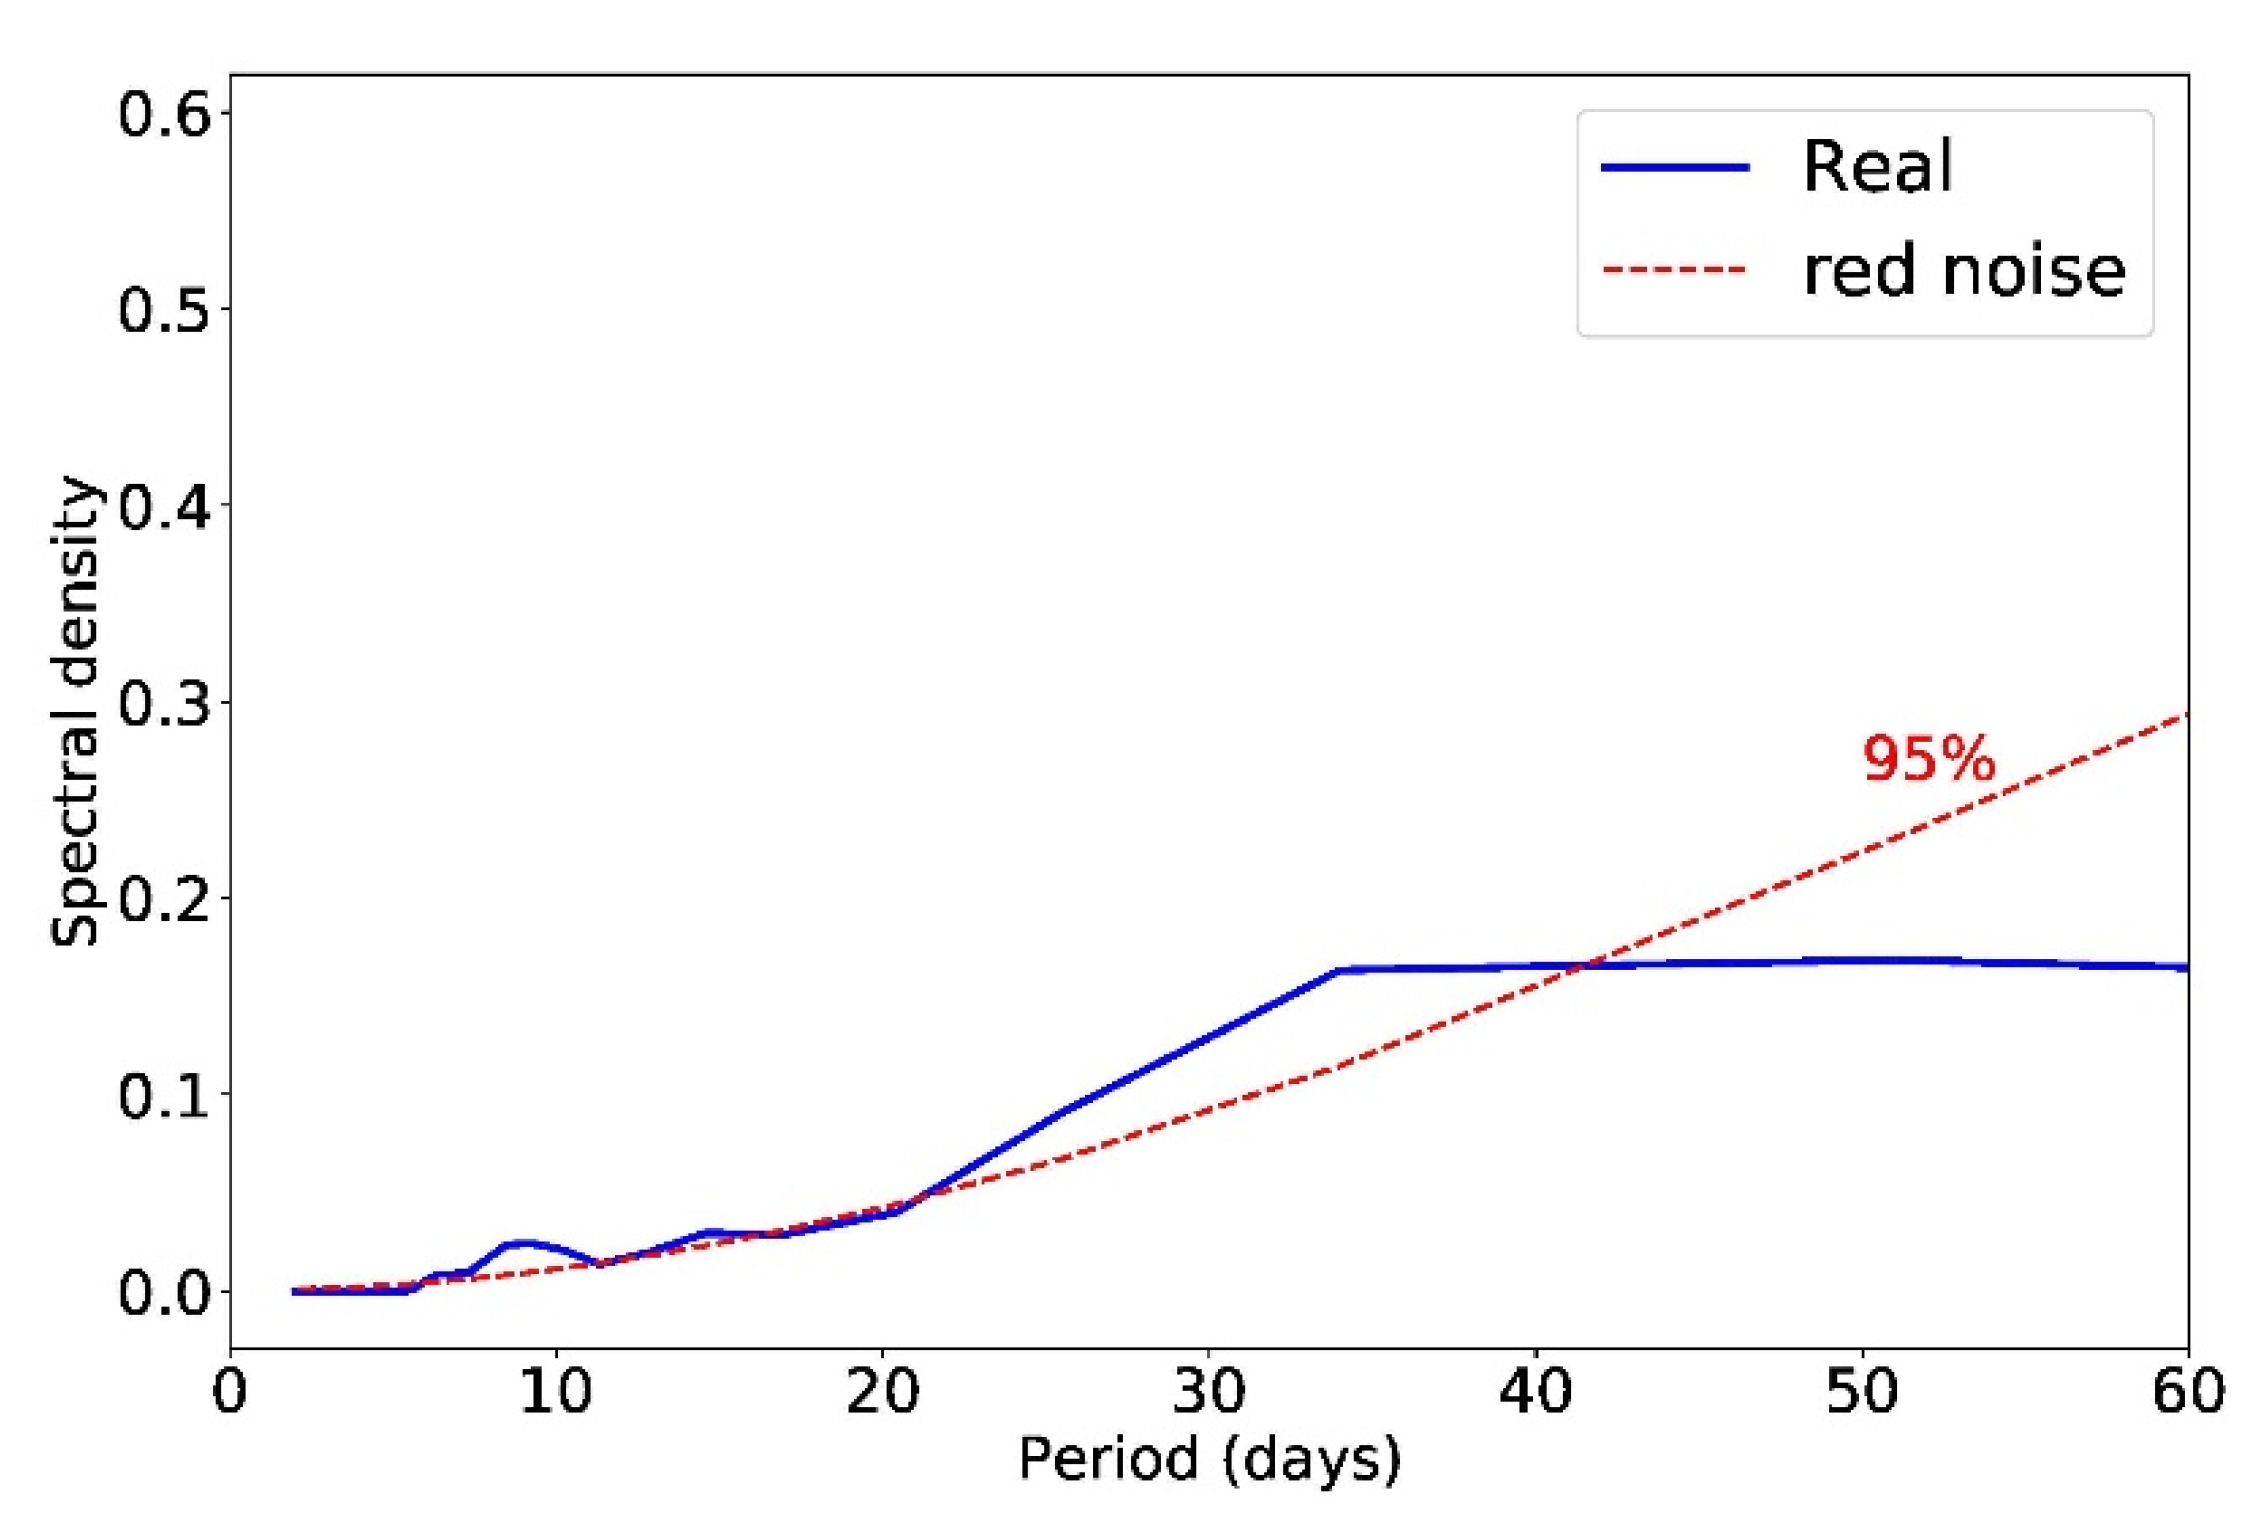
Figure 9.
The 20–40 d bandpass filtered time curve of 850 hPa zonal wind over the north of the South China Sea (105~115° E, 12~20° N) during May–September 2014 (units: m s−1).
Figure 9.
The 20–40 d bandpass filtered time curve of 850 hPa zonal wind over the north of the South China Sea (105~115° E, 12~20° N) during May–September 2014 (units: m s−1).

Figure 10.
Time-latitude sections of 20–40 d filtered 850 hPa zonal wind without TC along 111° E in 2014 (units: m s−1; the shading donates the low-frequency westerly greater than 0.5 m s−1).
Figure 10.
Time-latitude sections of 20–40 d filtered 850 hPa zonal wind without TC along 111° E in 2014 (units: m s−1; the shading donates the low-frequency westerly greater than 0.5 m s−1).
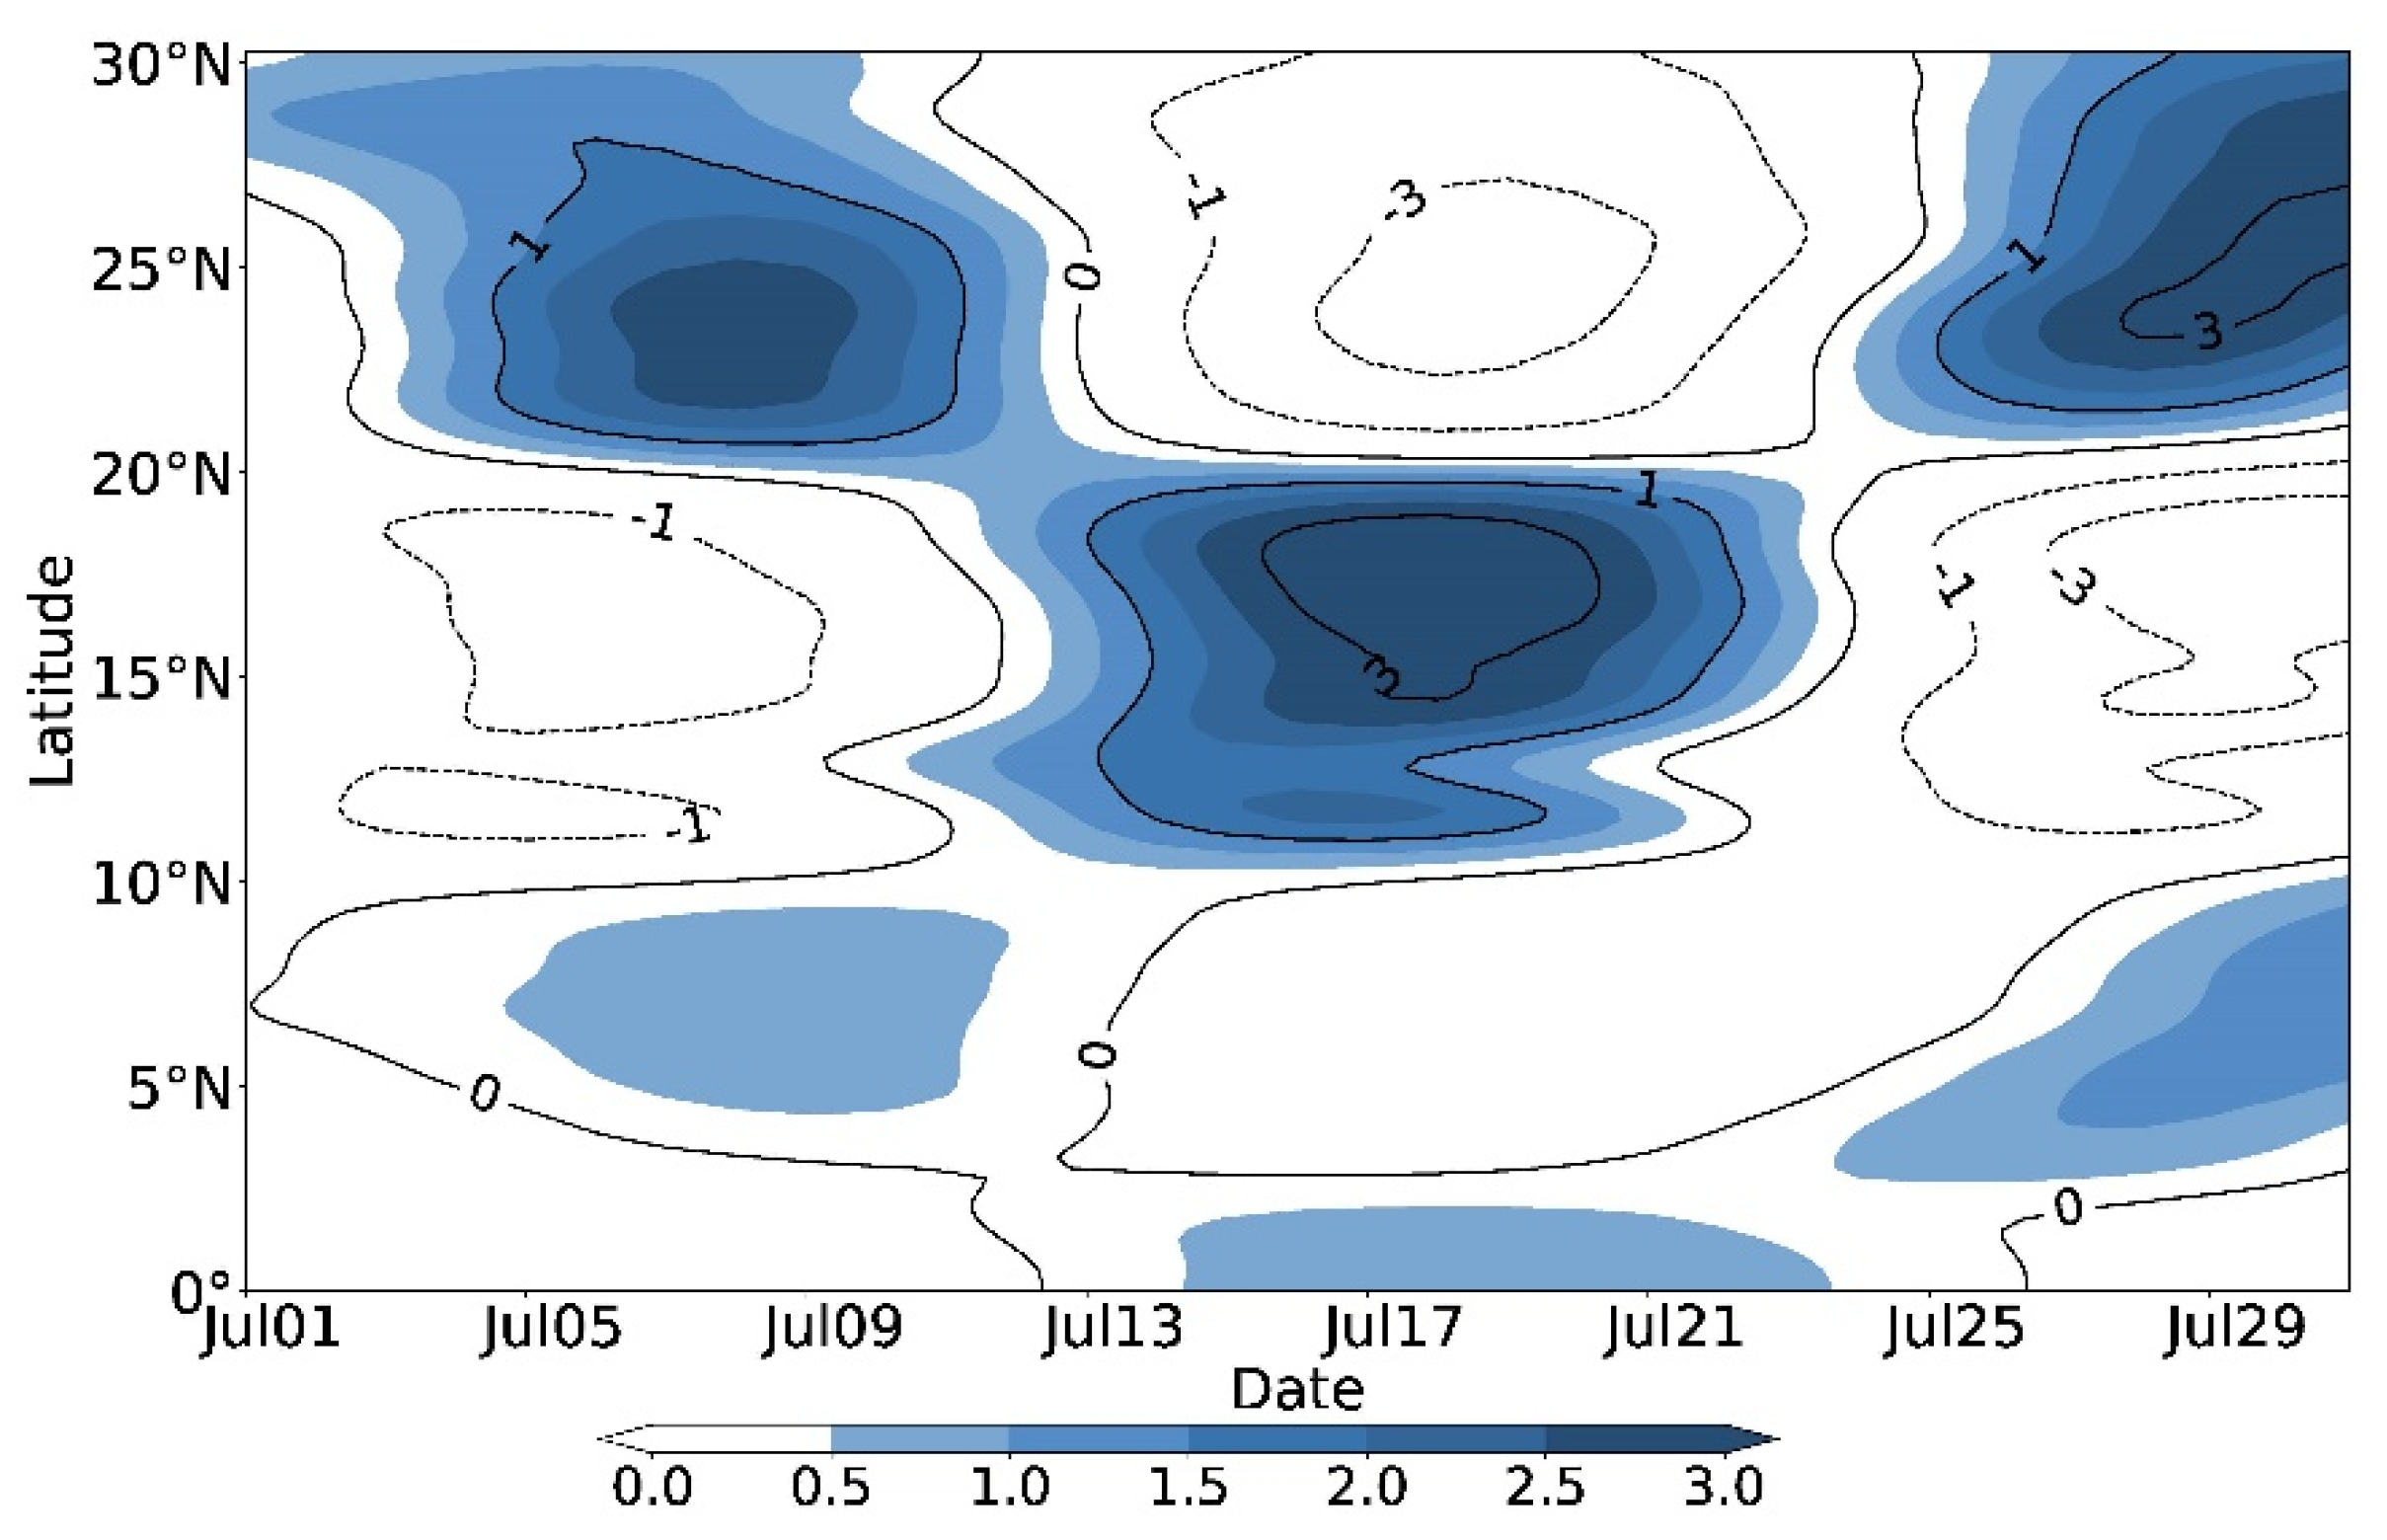
Figure 11.
The 850 hPa low-frequency water vapor flux without TC (vector; units: units: ) and its divergence on July 18 (shading denotes the flux convergence; units: ).
Figure 11.
The 850 hPa low-frequency water vapor flux without TC (vector; units: units: ) and its divergence on July 18 (shading denotes the flux convergence; units: ).
Publisher’s Note: MDPI stays neutral with regard to jurisdictional claims in published maps and institutional affiliations. |
© 2022 by the authors. Licensee MDPI, Basel, Switzerland. This article is an open access article distributed under the terms and conditions of the Creative Commons Attribution (CC BY) license (https://creativecommons.org/licenses/by/4.0/).
Share and Cite
MDPI and ACS Style
Liu, H.; Wang, L.; Dai, Y.; Chen, H. Relationships between the Southwest Monsoon Surge and the Heavy Rainfall Associated with Landfalling Super Typhoon Rammasun. Atmosphere 2022, 13, 130. https://doi.org/10.3390/atmos13010130
AMA Style
Liu H, Wang L, Dai Y, Chen H. Relationships between the Southwest Monsoon Surge and the Heavy Rainfall Associated with Landfalling Super Typhoon Rammasun. Atmosphere. 2022; 13(1):130. https://doi.org/10.3390/atmos13010130
Chicago/Turabian StyleLiu, Haoyu, Lijuan Wang, Yufan Dai, and Hong Chen. 2022. "Relationships between the Southwest Monsoon Surge and the Heavy Rainfall Associated with Landfalling Super Typhoon Rammasun" Atmosphere 13, no. 1: 130. https://doi.org/10.3390/atmos13010130
Note that from the first issue of 2016, this journal uses article numbers instead of page numbers. See further details here.