Article

Rapid Diagnosis of Nitrogen Nutrition Status in Summer Maize over Its Life Cycle by a Multi-Index Synergy Model Using Ground Hyperspectral and UAV Multispectral Sensor Data

1
State Key Laboratory of Simulation and Regulation of Water Cycle in River Basin, China Institute of Water Resources and Hydropower Research, Beijing 100038, China
2
College of Water Conservancy Engineering, Tianjin Agricultural University, Tianjin 300384, China
3
National Center of Efficient Irrigation Engineering and Technology Research, Beijing 100048, China
*
Author to whom correspondence should be addressed.
Atmosphere 2022, 13(1), 122; https://doi.org/10.3390/atmos13010122
Submission received: 28 November 2021 / Revised: 9 January 2022 / Accepted: 10 January 2022 / Published: 12 January 2022
(This article belongs to the Section Biosphere/Hydrosphere/Land–Atmosphere Interactions)

Abstract

:
Global climate change and the spread of COVID-19 have caused widespread concerns about food security. The development of smart agriculture could contribute to food security; moreover, the targeted and accurate management of crop nitrogen is a topic of concern in the field of smart agriculture. Unmanned aerial vehicle (UAV) spectroscopy has demonstrated versatility in the rapid and non-destructive estimation of nitrogen in summer maize. Previous studies focused on the entire growth season or early stages of summer maize; however, systematic studies on the diagnosis of nitrogen that consider the entire life cycle are few. This study aimed to: (1) construct a practical diagnostic model of the nitrogen life cycle of summer maize based on ground hyperspectral data and UAV multispectral sensor data and (2) evaluate this model and express a change in the trend of nitrogen nutrient status at a spatiotemporal scale. Here, a comprehensive data set consisting of a time series of crop biomass, nitrogen concentration, hyperspectral reflectance, and UAV multispectral reflectance from field experiments conducted during the growing seasons of 2017–2019 with summer maize cultivars grown under five different nitrogen fertilization levels in Beijing, China, were considered. The results demonstrated that the entire life cycle of summer maize was divided into four stages, viz., V6 (mean leaf area index (LAI) = 0.67), V10 (mean LAI = 1.94), V12 (mean LAI = 3.61), and VT-R6 (mean LAI = 3.94), respectively; moreover, the multi-index synergy model demonstrated high accuracy and good stability. The best spectral indexes of these four stages were GBNDVI, TCARI, NRI, and MSAVI2, respectively. The thresholds of the spectral index of nitrogen sufficiency in the V6, V10, V12, VT, R1, R2, and R3–R6 stages were 0.83–0.44, −0.22 to −5.23, 0.42–0.35, 0.69–0.87, 0.60–0.75, 0.49–0.61, and 0.42–0.53, respectively. The simulated nitrogen concentration at the various growth stages of summer maize was consistent with the actual spatial distribution.

1. Introduction

Considering global climate change and the COVID-19 pandemic, crops affected by droughts, floods, pests, diseases, and lack of nutrients such as Nitrogen (N) have garnered more attention [1,2,3,4]. Nitrogen is essential for crop growth and development [5]. Using remote sensing technology to estimate nitrogen content, existing relevant studies mainly focus on nodes in a certain growth period, which makes it difficult to support relevant business requirements. Maize is one of the most widely planted crops worldwide, grown in over 170 countries. China is the second largest corn producer globally; moreover, summer corn dominates the Huang-Huai-Hai plain in China. Therefore, the fixed-point production and management of nitrogen that considers the entire life cycle of summer maize is of great significance. Site-specific crop-production management (SCM) is an information-based technology for agricultural production management [6]. Nitrogen is a vital nutrient for summer maize production in the North China plain; however, excessive fertilization has adverse effects on the environment [7,8,9]. The nitrogen demand of summer maize varies spatially across fields, which could lead to localized differences in plant growth [10,11]. Hence, nitrogen management is a primary consideration in SCM [12,13]. An accurate and rapid monitoring of the nitrogen concentration in crops during the plant life cycle is key to assessing crop nitrogen nutrition and for the SCM of nitrogen fertilizer [14]. It is also a key method for reducing the risk of environmental pollution caused by improper fertilization management [15,16].
Field variability can be evidenced by maps describing crop status. Maps could be obtained as outputs of proximal (unmanned aerial vehicle (UAV)-mounted) and remote sensing techniques using optical sensors [17], which could then be used to interpret the dynamics of plant nitrogen demand during the crop’s life cycle [18]. Maps help to undertake this rapidly and accurately, instead of using destructive and time-consuming ground-plant sampling and analytical measurements [19,20,21].
Various satellite-mounted sensors are suitable for monitoring a crop’s nitrogen nutrient status, providing information at different levels of spatial (pixels from 300 to 0.3 m) and temporal (every 1–44 days) resolution [22]. Numerous studies have shown that nitrogen-sensitive bands are concentrated in the visible and near-infrared regions [18]. Furthermore, spectral indices are mainly calculated from the reflectance of visible and near-infrared bands according to ratios, normalization, or certain formulas [23,24,25,26]. However, satellite remote sensing data are greatly affected by weather—it is rainy and cloudy during the growing period of summer maize. It is challenging to obtain remote sensing data in time under cloudy conditions [18,27,28,29,30]. Furthermore, some authors stress that this technique has limited operational flexibility for real-time field monitoring or management due to the low spatial resolution of the images acquired and the long intervals between satellite revisits.
In recent years, the limitations of remote sensing satellites have opened up new opportunities for the innovative use of unmanned aerial vehicles (UAVs) in crop monitoring. Equipped with multispectral digital cameras, these devices can be used to periodically fly over a field to obtain spectral information on crops in the visible and near-infrared regions and calculate the vegetation index with very high spatial resolution (usually <20 mm).
UAVs are easy to carry and operate and can help realize the real-time monitoring of nutrients and water management [31], weed control, disease, and pest detection and can give an estimation of the grain yield [22,32] of different crops (such as rice [33,34], wheat [35], maize [36], etc.), thus providing a guarantee for the SCM. With the advent of robust and reliable unmanned aircraft and low-payload spectral scanners [23,37,38,39], an opportunity now exists for using high-resolution hyperspectral imaging techniques to predict the nitrogen nutrition status of summer maize [23,24,25,28,40]. However, due to the high correlation of adjacent bands in a hyperspectral sensor, the redundant information is relatively increased. In comparison, the number of multispectral sensor bands are less than the hyperspectral ones, with 3 to 10 bands (generally divided into the red, green, blue, visible, thermal infrared (two bands), near-infrared, and panchromatic bands), while redundant information is relatively reduced [41,42]. Additionally, the hyperspectral imaging technology of UAVs requires specific flight conditions and expensive equipment, contributing to high data acquisition costs and limited promotion and application of low-altitude accurate observations [37]. The UAV multispectral technology has garnered considerable attention due to its flexibility, convenience, and low cost. In particular, in comparison to near-surface hyperspectral point measurements, it is also attractive with regard to its scale capabilities for nitrogen management [15,20,38,43].
Numerous scholars have proposed many spectral indices for various research areas, crops, and growth stages [23,24,25,26]. Numerous diagnostic studies on the spectral nitrogen nutrition status of summer maize were also undertaken; however, they primarily focused on one or several key growth stages [44]. Studies that consider the nitrogen nutrition status during the entire life cycle of summer maize are lacking. Most of them consider multiple linear support vector machines, machine learning language, and other methods to study and analyze crop nitrogen spectral diagnostic models. Research on a simple and practical universal model is lacking.
So far, the application of spectral technology in diagnosing summer maize nitrogen has primarily focused on single spectral technology, such as by only considering ground hyperspectral research, UAV research, or remote sensing research. Some researchers have combined ground hyperspectral technology with satellite remote sensing technology; however, few have combined ground hyperspectral technology with UAV multispectral technology. Previous studies have noted that spectral indices are developed for the entire growing season of crops; hence, they could overestimate or underestimate plant parameters at specific growth stages. For precision farming, exponents based on growth stages could be required to prevent the smoothing that could occur when an entire seasonal equation is applied to a particular stage [45]. Additionally, spectral tests generally occur in cycles of 1–2 years; moreover, inter-annual changes also need to be studied and discussed.
Therefore, ground hyperspectral technology and UAV multispectral technology were combined here to diagnose the nitrogen nutrition status over the entire life cycle of summer maize. This study aimed to: (i) construct and evaluate a diagnostic model of nitrogen considering the entire life cycle of summer maize using systematic near-surface hyperspectral data from 2017 to 2019; (ii) optimize the summer maize life cycle nitrogen diagnostic model using UAV multispectral data from 2019; and (iii) determine the spectral index thresholds of sufficient and inadequate plant nitrogen nutrition nutrient levels at different stages of the summer maize life cycle based on the optimized nitrogen diagnostic model and the critical nitrogen concentration model.

2. Materials and Methods

2.1. Field Experiments and Environmental Conditions

Field experiments were conducted in the China National Research Center of Water-saving Irrigation Engineering Technology, Daxing District, Beijing, China (39°39′ N, 116°15′ E, 34 m above sea level) in three consecutive growing seasons (2017–2019). Daxing is located within semiarid-temperate, continental monsoon climate zones. The soil at the experimental site was classified as a tidal soil comprising a silty loam in the 0–100 cm soil layer. The average soil bulk density in the 0–60 cm soil layer is 1.42 g cm−3. The average nitrate nitrogen content, ammonia nitrogen content, and PH value are 20.44 mg kg−1, 5.20 mg kg
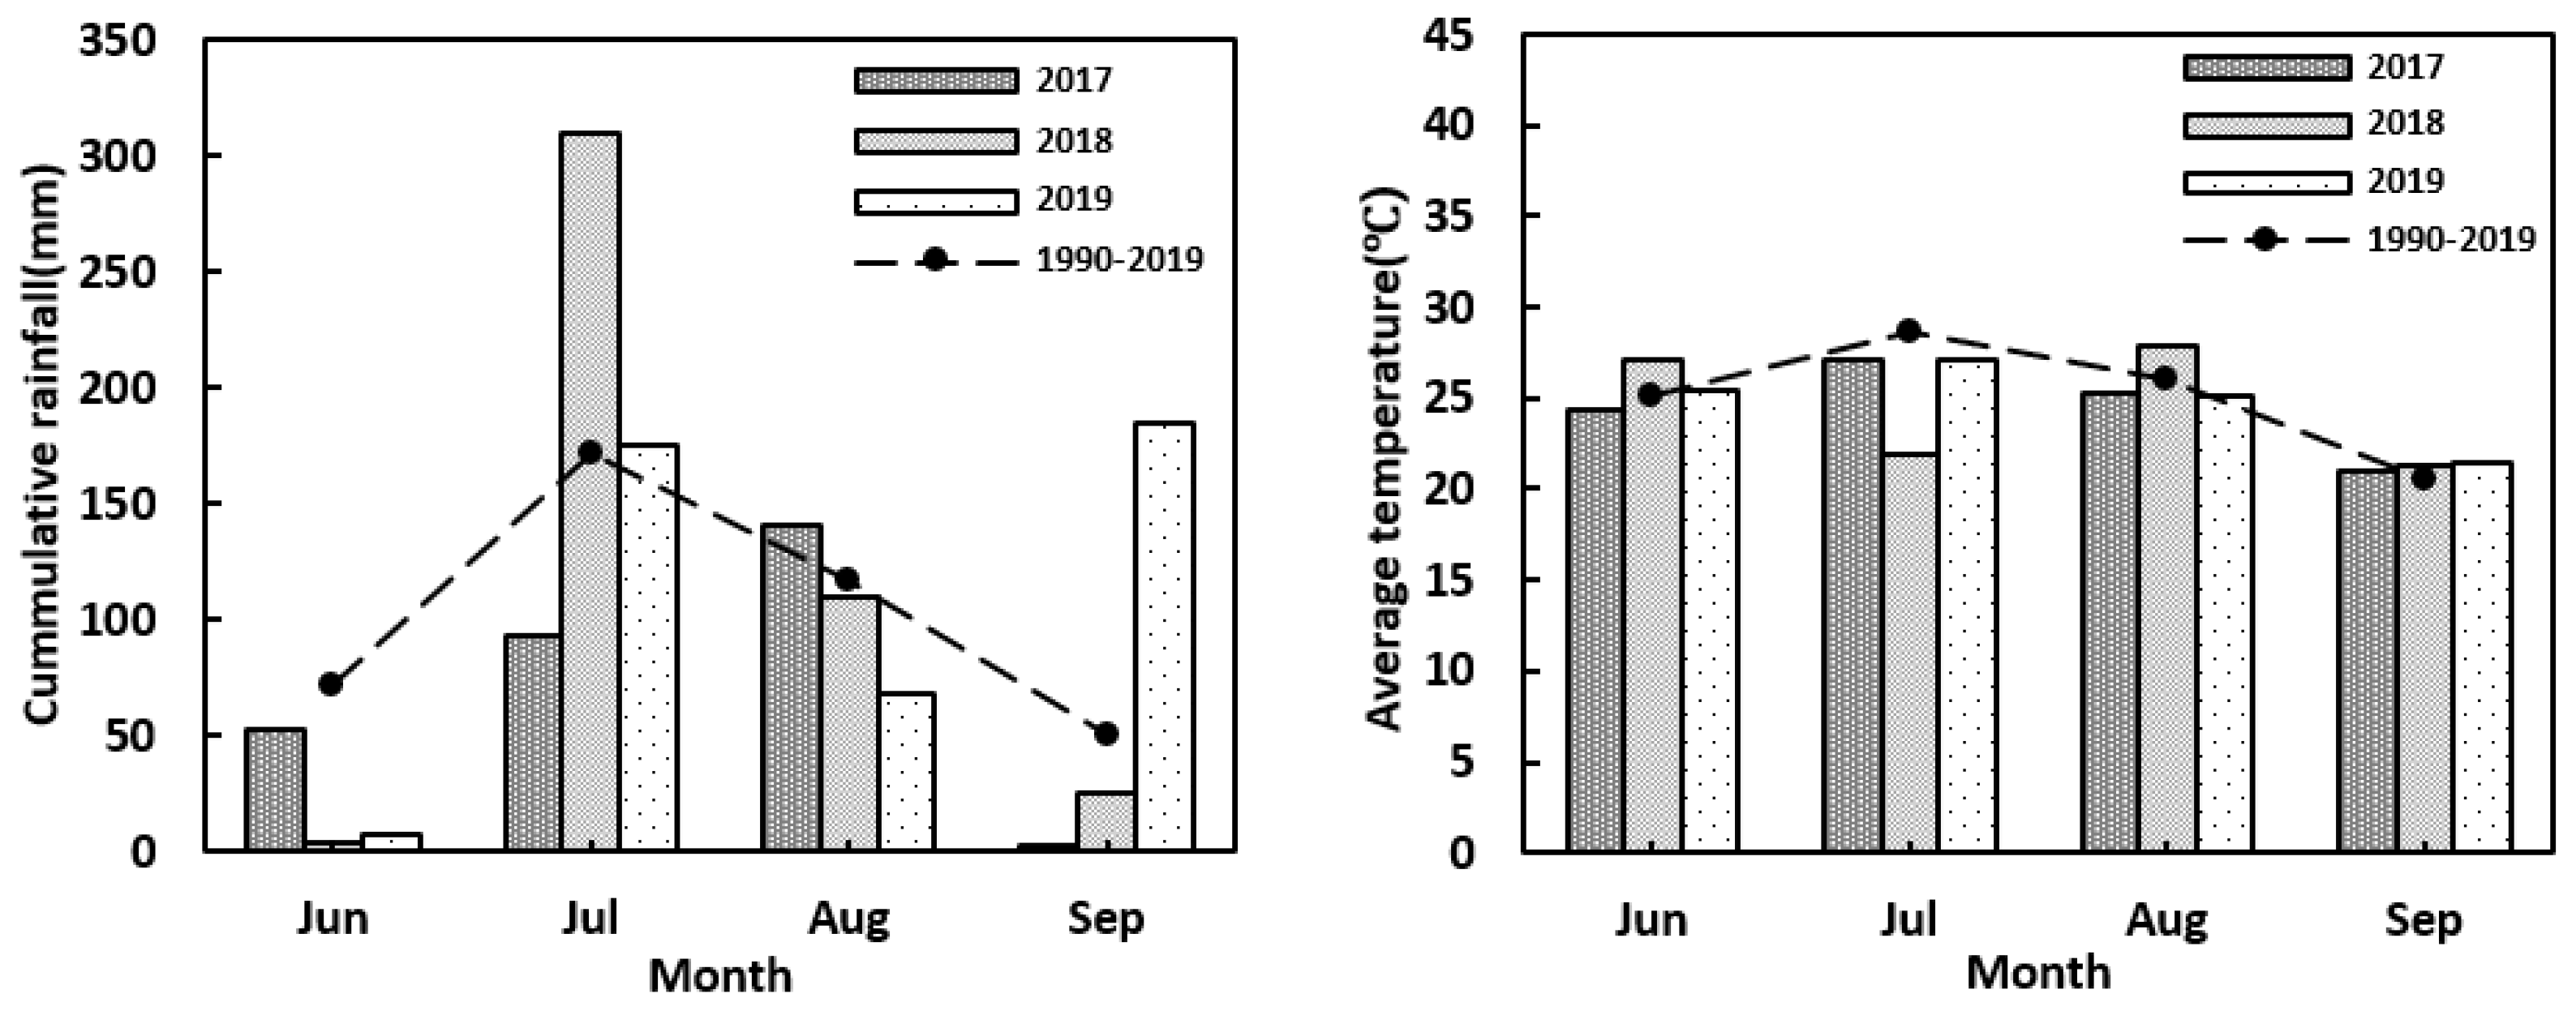
−1, and 8.2, respectively, before the summer maize sowing. The mean annual temperature is 13.4 °C and the mean annual precipitation is 532 mm. The three experimental seasons were characterized by varying environmental conditions, with major differences in rainfall and temperature, especially for July (beginning of the growing period in summer) and September (end of the growing period in autumn). In Figure 1, the cumulative rainfall (mm) and mean temperatures (°C) of the three experimental seasons are presented with values of the long-term mean (1990–2019).
A random block design with three replications was used. The area of each plot was 60 m2, with a planting density of 55,000 plants per ha−1. The distribution obtained was maintained during the three years, preventing interference of the residual mineral nitrogen. The soil surrounding each plot was insulated to ensure that the fertilizer did not penetrate the other plots. The field experiment area was surrounded by a 5 m protected area. Cultivation and sowing were carried out simultaneously in accordance with the local uniform farming model. The terrain is flat. The soil is uniform in texture and fertility. The maize plant spacing was 30 cm and the row spacing was 60 cm. In all three seasons, a widely grown Chinese summer maize cultivar (Jiyuan 168) was sown on 11 June in 2017, and on 15 June in 2018 and 2019 at five levels of N fertilization (0 (N0), 140 (N1), 209 (N2), 279 (N3), and 419 (N4) kg·N·ha−1) with three replications. The N fertilizer was split into two doses in a ratio of 1:3 (before sowing and the tasseling (VT) stage of summer maize) and applied on 8 June and 9 August in 2017, on 12 June and 13 August in 2018, and on 12 June and 5 August in 2020. Prior to sowing, “keba” compound fertilizer (15% N) was applied. In the V12 stage, urea fertilizer (47% N) was applied. Due to a severe water shortage, 60 mm irrigation was undertaken prior to sowing in all three years of the field trials. Weeds, pests, and pathogens were frequently monitored and controlled as needed. The summer maize was harvested on 24 September in 2017–2019.
The “Jiyuan” 168 cultivar was characterized by a short ripening period, lodging resistance, good quality, good resistance, and an outstanding yield. In China, the variety is widely grown in summer maize areas.
Field test data are the basis for the model-adjustment verification, and previous studies have shown that the most effective model-adjustment parameter data are the observation data under different environments (including climate and field treatment, etc.) [46]. Therefore, the nitrogen gradient set in this study was relatively large.

2.2. Plant Sampling and Spectral Measurements

Tissue samples were collected to measure the tissue nitrogen concentration in the above-ground biomass the day after the spectral data were collected. The plants were sampled by cutting the base of the stem just above the soil surface. Additional details regarding sample acquisition (i.e., date, stage, sample number, etc.) are listed in supplementary Table S1. Before the annual first test, three representative plants were selected in each plot and marked as reference plants for each sampling. Three plants were then selected for each sampling with reference to the plant height, stem diameter, and panicle size of the reference plants. The plant samples were oven-dried at 105 °C for 0.5 h and then at 75 °C until a constant weight was achieved. Thereafter, the samples were weighed and ground to pass through a 1 mm sieve. The nitrogen concentration of the plants was measured using Kjeldahl digestion (Table S2).
Here, spectral reflectance includes hyperspectral reflectance and multispectral reflectance. Hyperspectral reflectance was measured from 2017 to 2019, using the passive, non-imaging spectroradiometer, FieldSpec HandHeld 2 (ASD Inc., Boulder, CO, USA). This device provides hyperspectral data within a wavelength range of 325–1075 nm at a sampling interval of 1.5 nm. The spectral sampling dates were synchronized with the plant sampling dates; moreover, the spectral measurements were undertaken on sunny days around midday (10:00–14:00) Beijing time under clear sky conditions. The sensor had a field of view of 25°. After optimization of the ASD instrument, the reflectance of the device was set to 100% by measuring the reflectance of a spectral on a reference panel (white reference panel 25.4 × 25.4 cm, calibrated as 99% reflective). The white reference was measured approximately every 5–10 min to check the instrument’s stability for 100% reflectance. The white reference measurements were conducted by bringing the sensor close (~0.4 m) to a spectral to ensure that the reflectance of only the reference panel was measured. Three representative points were selected from each test plot; furthermore, the sensor probe was kept vertically downward during measurement. To ensure that maximum information on the plants was obtained within the measured range, and to minimize the influence of the soil background, the sensor was placed ~20 cm away from the plant canopy. The data were converted to five multispectral wavebands centered at 475 nm (blue, bandwidth: 20 nm), 560 nm (green, bandwidth: 20 nm), 668 nm (red, bandwidth: 10 nm), 840 nm (near infrared, bandwidth: 40 nm), and 717 nm (red edge, bandwidth: 10 nm) by calculating the average reflectance of the three readings per waveband.
Multispectral reflectance was measured through a UAV, equipped with a multispectral sensor in 2019. The platform used here comprised the Jingweim-M600 hex rotor UAV system controlled by the open-source flight control Pixhawk (DJI, Shenzhen, China). At present, there are many kinds of multispectral sensors (such as the Red Edge sensor, the DJI Phantom 4 Multispectral Camera, the Parrot Sequoia+, the Sentera 6X, etc.). Through a literature review and a cost-performance analysis [46,47,48], the Red Edge sensor (Mica Sense, Seattle, WA, USA) was selected. The focal length of the camera was 5.5 mm, with an image resolution of 1280 × 960 pixels. The camera was equipped with five spectral channels, with central wavelengths of 475 nm (blue), 560 nm (green), 668 nm (red), 840 nm (near infrared), and 717 nm (red edge); it was also equipped with a 30 cm × 30 cm gray plate and a light intensity sensor. The light intensity sensor corrected the image of the external light during the shooting process. The gray plate had a fixed reflectance; moreover, this plate was corrected before and after the UAV measurements. The UAV image acquisition was conducted on seven occasions between July 2019 and September 2019 and was synchronized with the time of the ground data acquisition. The UAV images were acquired from 10 am to 12 am, while the flight altitude was set to 60 m. The course was fixed during flight (Figures S1 and S2). The overlap between the course and the side was set to 80%, the ground resolution was 4.09 cm, and the flight speed was 3 m/s. A total of 335 images were collected after the flight and imported into the Pix4Dmapper software for Mosaic. Thereafter, the reflectivity and orthophoto images of the study area were obtained after gray plate reflectivity correction.
Multispectral data of the hyperspectral conversion from the first two experiments (2017 and 2018) were used as the training set, while those from the third experiment (2019) and the multispectral data set obtained by a UAV were, respectively, used for validating the new parameters (“validation data set”).

2.3. Data Processing and Analysis

2.3.1. Calculation of Simulated Multispectral Reflectance

The equation below was used to convert the near-ground hyperspectral reflectance into multispectral reflectance. Thus, a multispectral model to diagnose nitrogen content in the plant canopy was constructed:
R = λ = λ m i n λ = λ m a x S λ R λ / λ = λ m i n λ = λ m a x S λ
where R represents the reflectivity of the wide band of the simulated multispectral; λmin and λmax represent the starting and ending wavelengths of the UAV sensor, respectively; Sλ represents the value of the spectral response function of the sensor at the lambda wavelength; and Rλ represents the hyperspectral reflectance of the summer maize plant canopy spectrum at the lambda wavelength [49].

2.3.2. Multispectral Index

This index is a combination of two or more sensitive bands of vegetation; it helps highlight the vegetation characteristics. Here, over twenty spectral indices that had a good correlation with the nitrogen concentrations of the crops were selected from the published literature for modeling and for verification of the analysis. Table 1 shows the formulas for calculating these multispectral indices.

2.3.3. Critical Nitrogen Content Curve

The critical nitrogen content (Nc) was calculated by Equation (2):
N c = a W m a x b
where a represents the critical nitrogen content of the plants’ aboveground unit biomass; b represents the dilution coefficient of the critical nitrogen content; and Wmax represents the maximum aboveground biomass of the plants (103 kg·ha−1). The values of a and b were determined based on the field test data.

2.3.4. Leaf Area Index (LAI)

Three summer maize plants which had been tested by hyperspectral measurement in the plots were sampled. The total leaf area was measured using CanoScan LiDE 300. The LAI was calculated using Equation (3):
LAI = t o t a l   l e a f   a r e a   o f   p l a n t t h e   p l a n t   o c c u p i e s   l a n d   a r e a

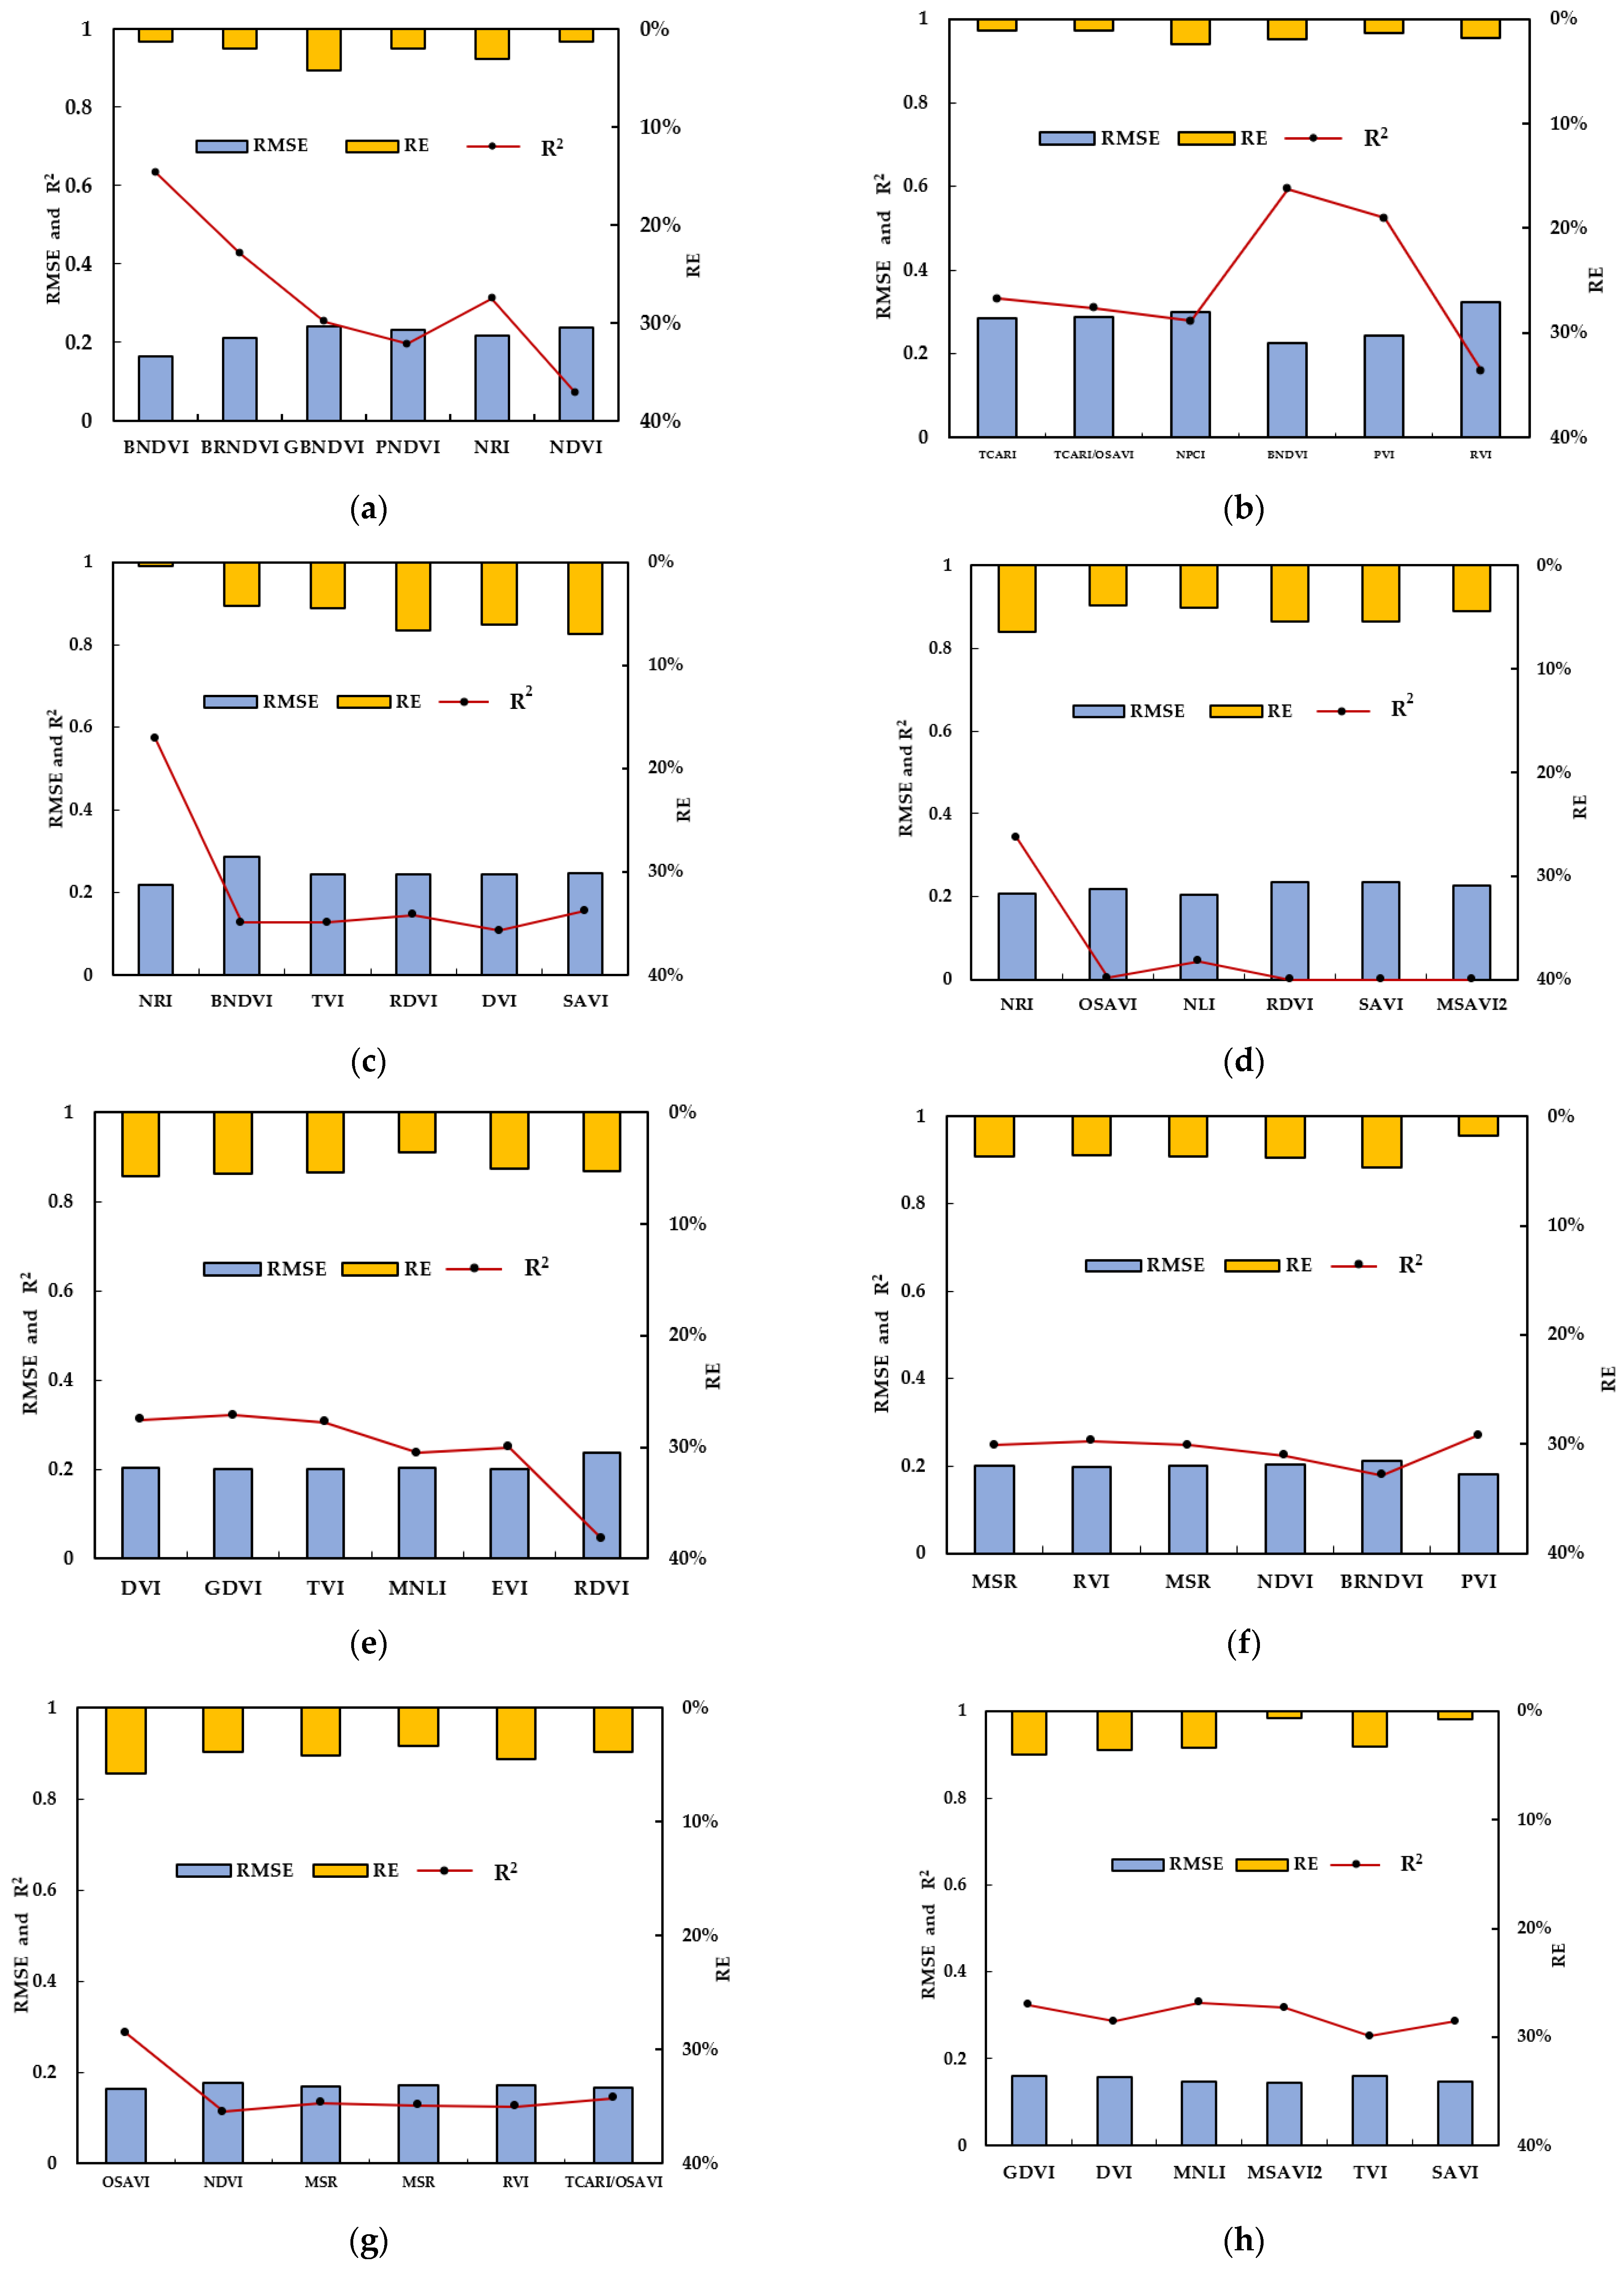
2.4. Model Evaluation

Using regression statistics, quantitative monitoring models were established to determine plant nitrogen content during various growth stages using a multispectral index. The simulated values of the quantitative monitoring model were calculated by the determination coefficient (R
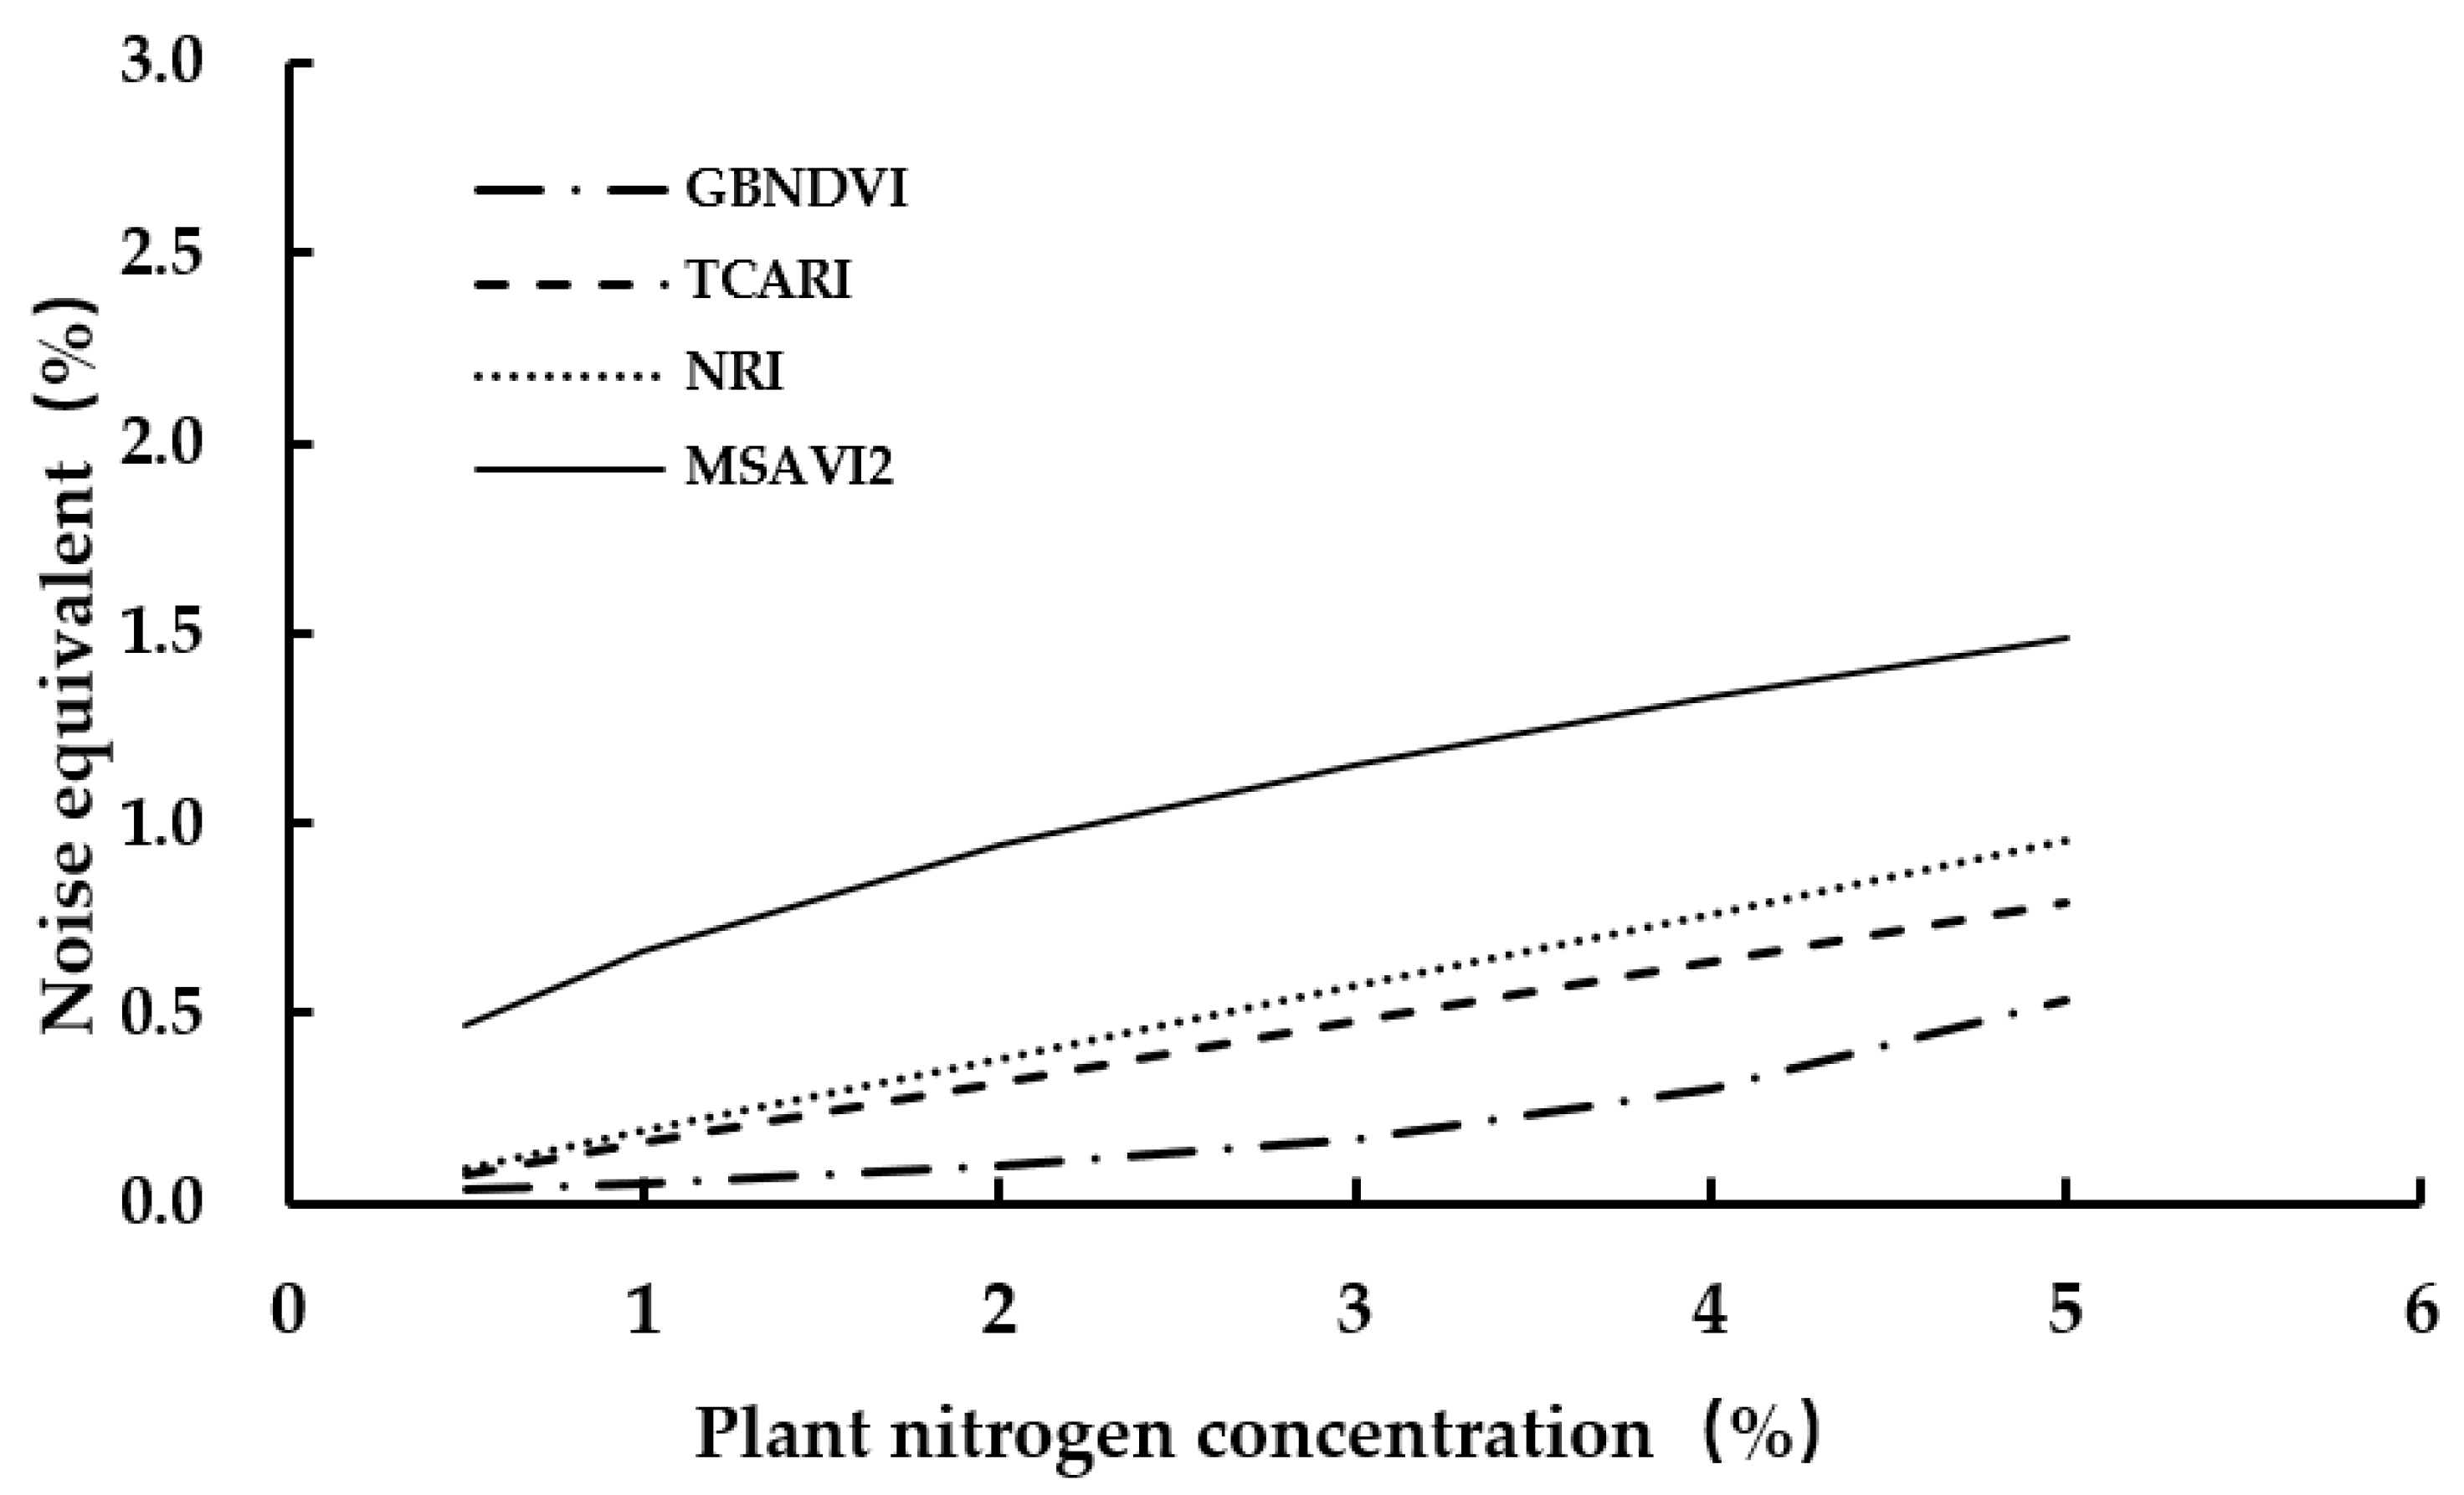
2), the root mean square error (RMSE), and the relative error (RE). The sensitivities of the different spectral vegetation indices for detecting changes in plant nitrogen concentration in the growth stages were tested by utilizing the noise equivalent (NE) method, as reported by Viña et al. [68]. The modeling and analysis were undertaken in Microsoft Excel 2010. Nitrogen prediction maps from the UAV data were drawn using ENVI and ArcGIS.

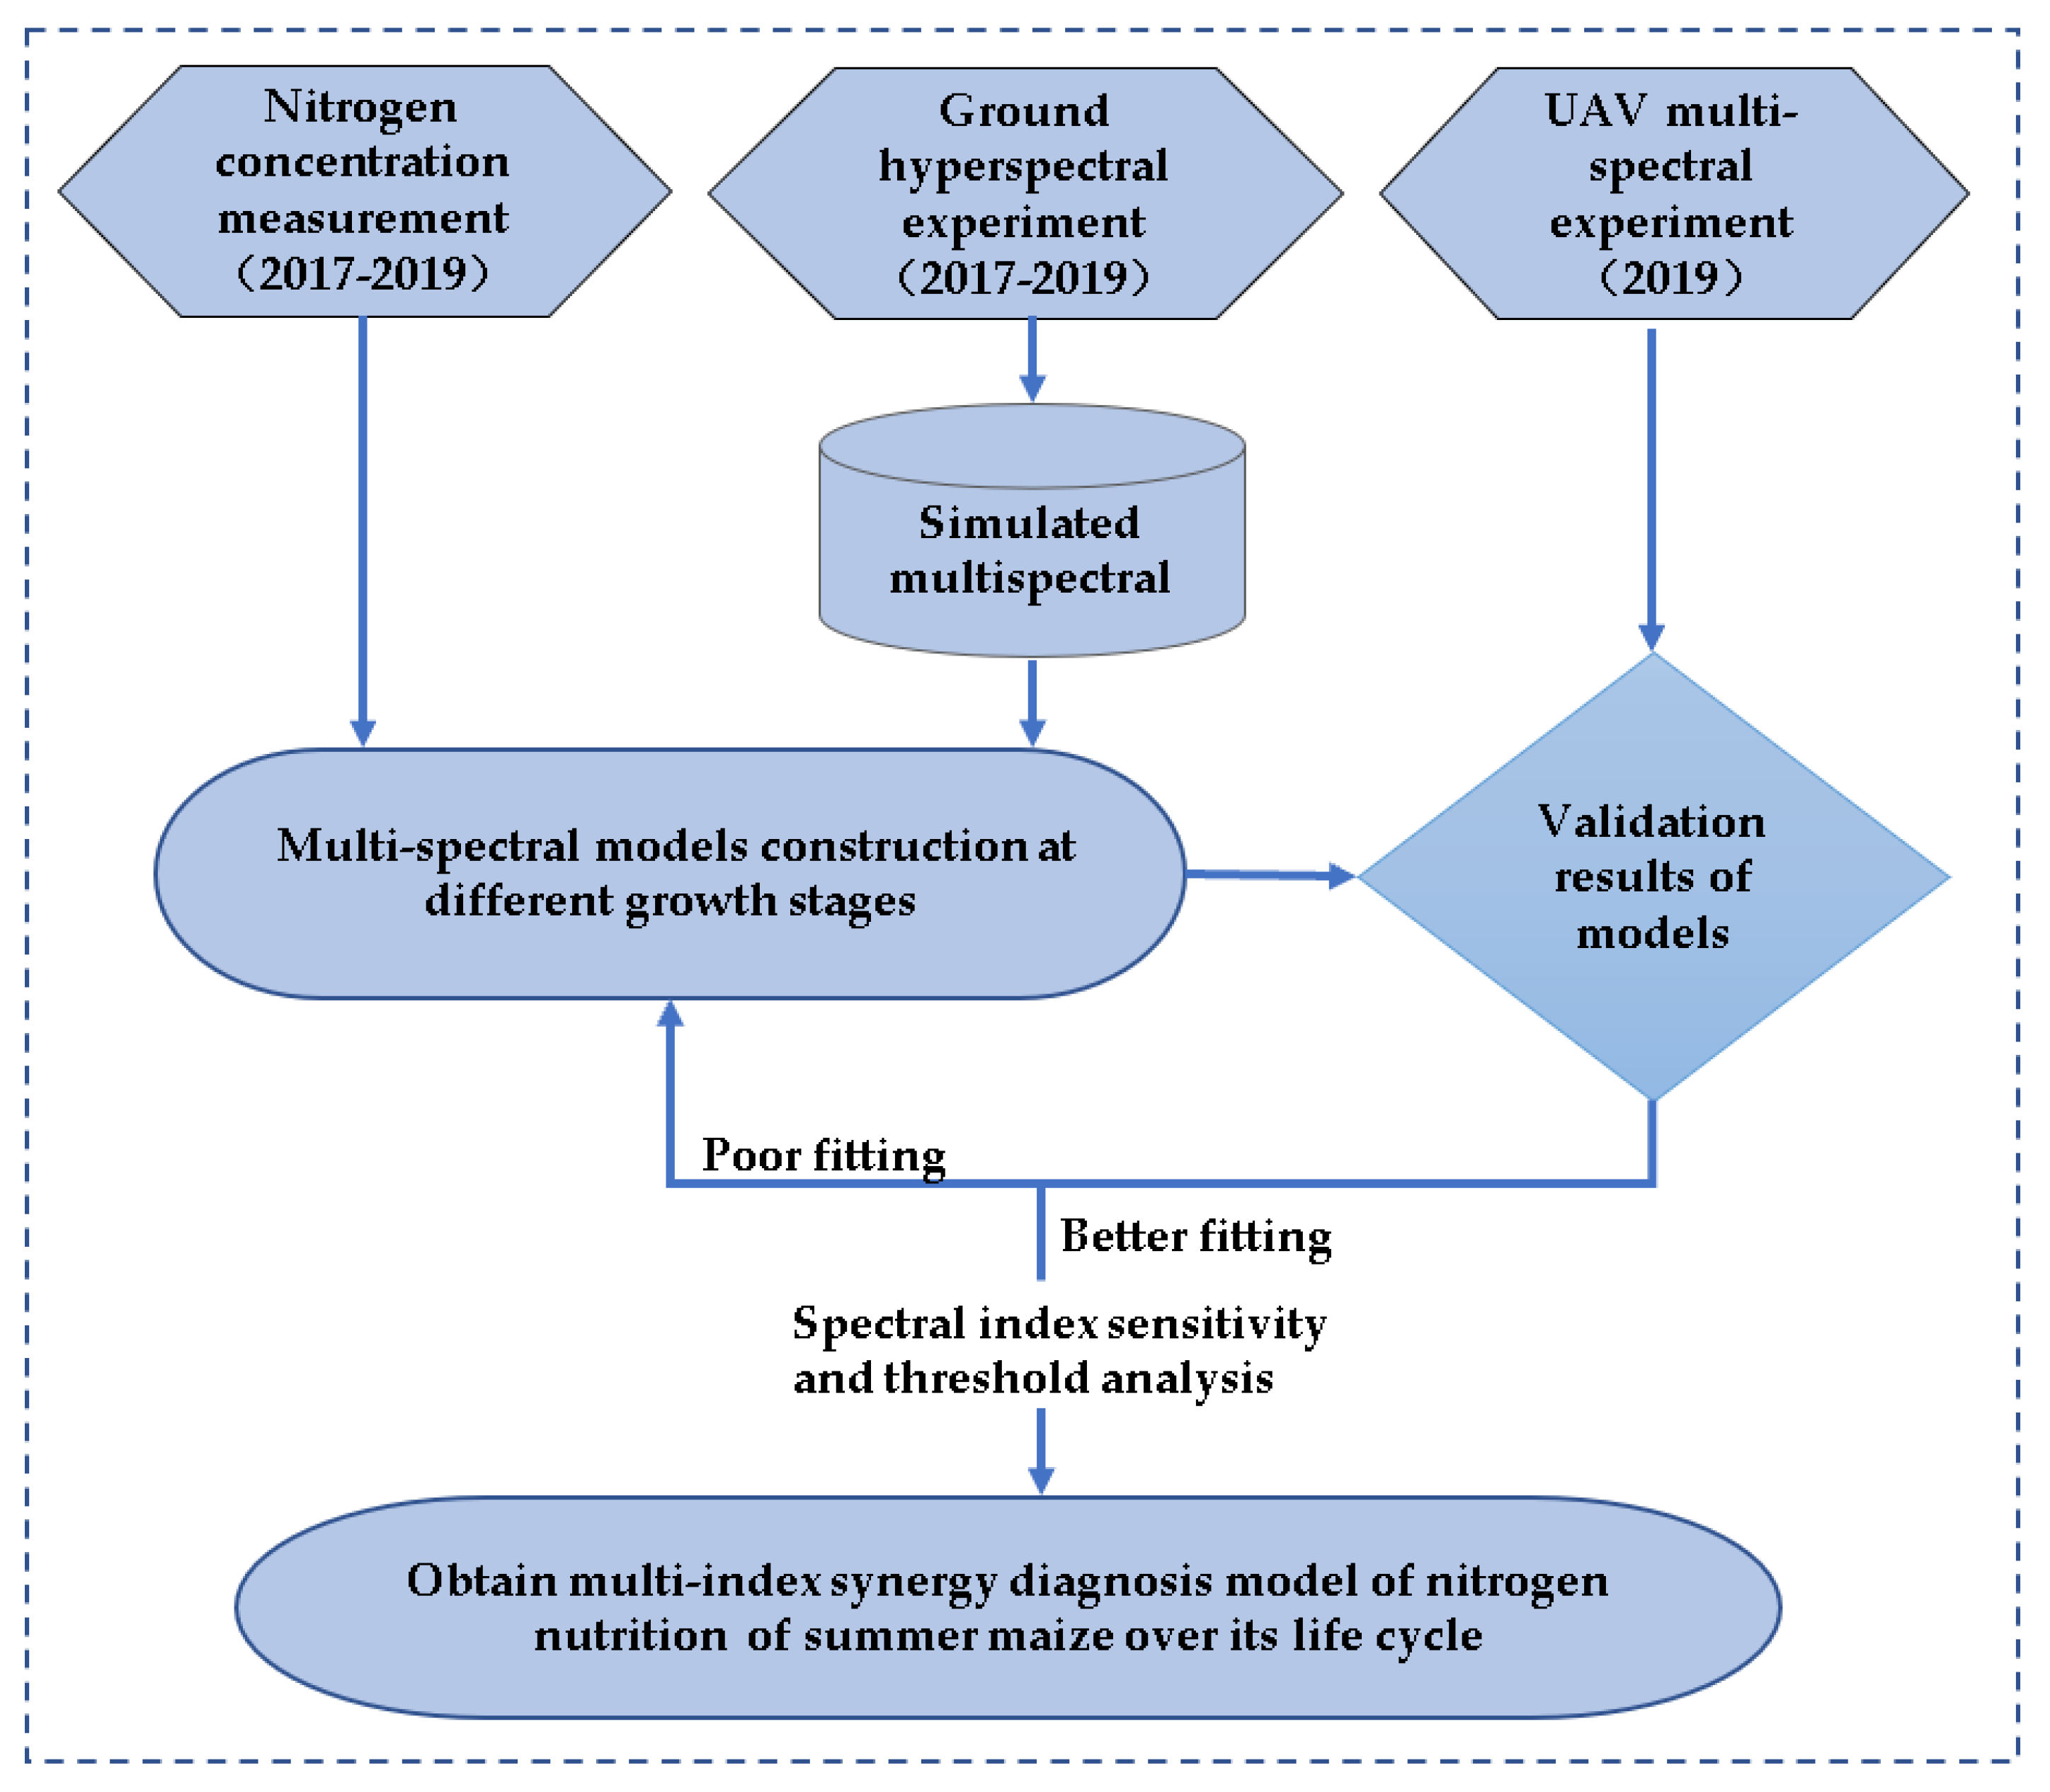
2.5. Diagnosis Flow of Nitrogen Nutrition Status

The diagnosis flow of the nitrogen nutrition status in this study is illustrated in Figure 2. First, three years of near-surface hyperspectral data were simulated as multi-spectral data.
Furthermore, the whole growth stages of summer maize were divided into different stages, and models were established. The suitable multi-spectral indices for the nitrogen nutrition estimation were screened by comparative analysis by using the simulated multi-spectral experiment. In this step, the multi-spectral indices were calculated by using simulated spectra, and the relationship between the various multi-spectral indices and the nitrogen nutrition was analyzed to identify the spectral indices that enabled an accurate estimation of the nitrogen nutrition.
Finally, the multi-spectral models of nitrogen concentration were validated by the UAV multi-spectral field observation data. It was concluded that the whole growth period of summer maize could be divided into several stages for better diagnosis of the nitrogen nutrition. Then, the multi-index synergy diagnosis model of the nitrogen nutrition of summer maize over its life cycle was determined. The sensitivity of these indices to environmental interference factors was evaluated. In this step, we calculated the LAI and the critical nitrogen concentration curve and gave the spectral diagnostic threshold.

3. Results

3.1. Model Construction and Optimization

The ground hyperspectral data measured between 2017 and 2019 were simulated as multispectral data based on Equation (1). Here, the entire growth period of summer maize was divided into eight growth stages (V6, V10, V12, VT, R1, R2, R3, and R6); moreover, the relationship between the plant nitrogen concentration and the multispectral index was established using the experimental data for 2017 and 2018. Based on twenty-six commonly used multispectral indices, the first six spectral indices with good correlation coefficients in each maize growth period were selected. A model for diagnosing the relationship between the nitrogen concentration and the multispectral indices of the different growth stages was established. Table 2 shows the results.
Table 2 showed that in the different growth stages of summer maize, the multispectral indices were closely related to the nitrogen concentration of the plants; however, they were not completely consistent. The top six multispectral indices in each stage were as follows: in V6: BNDVI, BRNDVI, GBNDVI, PNRI, NRI, and NDVI; in V10: TCARI, TCARI/OSAVI, NPCI, BNDVI, PVI, and RVI; in V12: NRI, BNDVI, TVI, RDVI, DVI, and SAVI; in VT: NRI, OSAVI, NLI, RDVI, SAVI, and MSAVI2; in R1: DVI, GDVI, TVI, MNLI, EVI, and RDVI; in R2: MSR1, RVI, MSR2, NDVI, BRNDVI, and PVI; in R3: OSAVI, NDVI, MSR1, MSR2, RVI, and TCARI/OSAVI; and in R6: GDVI, DVI, MNLI, MSAVI2, TVI, and SAVI.
The top six multispectral indices of each stage were nonidentical due to the different environments and physiological ecologies of the crops at the different growth stages. Stages V12 and VT were closely related to the multispectral index NRI. Although the corresponding diagnostic models were linear, the slopes were inconsistent. The slope of the V12 stage model was −5.833 and that of the VT stage model was −2.816. The nitrogen concentration of the plants at the V12 stage varied greatly with the NRI because the nitrogen concentration of these plants was more sensitive to changes in the NRI.
In the V6, V10, V12, and R3 stages, the determination coefficients of the optimal multispectral index and plant nitrogen content were mostly above 0.5, while those in the VT, R1, R2, and R6 stages were basically below 0.4. To improve the accuracy of the multispectral diagnostic model of the nitrogen concentration of summer maize, considering the entire growth stage of summer maize, the LAI changed greatly from V6 to V12 (0.34–3.66), while it changed insignificantly after VT (3.13–4.74). Therefore, stages VT to R6 were combined into one stage for remodeling; hence, the model was further optimized (Table 3).
After model optimization, the spectral indexes of the top six were MSAVI2, GRNDVI, MSR, NDVI, NRI, and VARI, respectively. The determination coefficients were all above 0.45, and the top one was 0.682. The model determination coefficient was higher than that of the individual models for each stage of growth. Therefore, the multispectral diagnostic model of plant nitrogen concentration in the whole growth period of summer maize was divided into an eight-stage model (V6, V10, V12, VT, R1, R2, R3, and R6) and optimized in a four-stage model (V6, V10, V12, VT-R6). The results showed that the modeling precision was improved by the optimized four-stage model.

3.2. Model Evaluation

3.2.1. Evaluation of Eight-Stage Model

This model was evaluated based on the multispectral data converted from the hyperspectral data and UAV multispectral data of 2019. The accuracy of the top six models in the different growth stages of summer maize was analyzed using the multispectral data converted from the hyperspectral data at eight stages. The equation of the fit between the measured and the predicted values, the determination coefficient R2, the RMSE, and the RE is shown in Figure 3. The RMSE of the maize at different growth stages ranged from 0.14% to 0.32%, while the RE was <10%; these values indicated that the errors of the models were insignificant, while the stability of these models was suitable. Therefore, the model for diagnosing the nitrogen concentration of maize at different stages could be optimized by R2. Generally, a higher R2 was selected for the appropriate multispectral index diagnostic model.
According to Figure 3, the BNDVI spectral index in V6 was prominent in the validation set, with R2 reaching 0.634. The appropriate spectral index for stage V10 was BNDVI (R2 = 0.594). NRI (R2 = 0.573 and 0.342, respectively) was used in both the V12 and the VT stages. The estimation accuracy of DVI, GDVI, and TVI in the R1 period was relatively high. MSR1, RVI, MSR2, and NDVI could be used during stage R3. The optimal multispectral index at stage R2 was OSAVI (R2 = 0.287). MNLI, GDVI, or MSAVI2 could be used as the optimal multispectral index at the maturity stage.
To further verify the regional practicability of the multispectral plant nitrogen model at different stages, field verification was undertaken using the 2019 UAV multispectral data from V6 to R3 across seven stages. Table 4 shows the results. The RMSE values of the top six multispectral index diagnostic models at three stages (V6, V10, and R1) were between 0.01% and 0.31%. The errors were relatively small, with the RE values being within 10%. Therefore, the appropriate spectral index and its model could be determined based on the R2 value in these three stages. The six spectral indices of PNDVI, NDVI, BRNDVI, GBNDVI, BNDVI, and NRI in stage V6 all maintained high accuracy (R2 > 0.68); among these, the accuracy of GBNDVI was particularly high. The accuracy of TCARI in stage V10 was relatively good (R2 = 0.547). In stage V12, NRI (R2 = 0.612) was significantly better than that in the other indices (R2 < 0.30). The prediction level of stage VT was very poor. TVI was better (R2 = 0.648) in stage R1. In the R2 and R3 stages, the RMSE values lay between 0.01% and 0.31%; however, the RE values were well over 30%. These results indicated that these models were unstable and had large errors.

3.2.2. Evaluation of Optimized Four-Stage Model

The four growth stages in the optimized four-stage model mean that the entire growth period of summer maize was divided into four stages: V6, V10, V12, and VT to R6. The first three stages (V6, V10, and V12) were evaluated in the previous section. The evaluation of the fourth stage model (VT to R6) was undertaken based on the UAV multispectral data. The results are shown in Table 5 and Figure 3. The accuracy (R2) of the top six multispectral index (MSAVI2, GRNDVI, MSR, NDVI, NRI, and VARI) diagnostic models in the VT to R6 stage ranged from 0.311 to 0.735. The spectral index with the highest R2 was MSAVI2, followed by NDVI (R2 = 0.497). The RMSE values ranged from 0.22% to 0.53%, and the RE values ranged from 6.32% to 22.0%. The multispectral indices with an RE < 10% were MSAVI2 and GRNDVI. Therefore, in the VT to R6 stage, the model established by the MSAVI2 multispectral index had high accuracy and good stability.
Figure 4 shows the evaluation of the optimal spectral index prediction model for the nitrogen diagnosis of summer maize at different growth stages. The dotted line represents the 1:1 line. It was better to divide the whole life cycle of summer maize into four stages to diagnose the nitrogen nutrition status. Figure 3a represented the V6 stage, and the optimum spectral index was GBNDVI. Figure 3b represented the V10 stage, and the optimum spectral index was TCARI. Figure 3c represented the V12 stage, and the optimum spectral index was NRI. Figure 3d represented the VT to R6 stage, and the optimum spectral index was MSAVI2.
In conclusion, the prediction accuracy of the nitrogen concentration in the whole life cycle of summer maize using the four-stage model was higher, and it is in good agreement with the actual observed value. Therefore, the four-stage model (Table 6) can be used to jointly predict the nitrogen concentration in the life cycle of summer maize.

3.3. Model Inversion Results Based on UAV Images

Combined with the UAV images, the monitoring and diagnosis of plant nitrogen concentration were undertaken based on the model established by the optimal multispectral index. Figure 4 shows the prediction results of each growth period. Moreover, the plant nitrogen concentrations estimated based on the appropriate multispectral index at different growth stages were consistent with the spatial distributions of the actual plant nitrogen concentration. The R2 values of the regression equations established by the estimated and measured value at stages V6, V10, V12, and VT to R6 were 0.833, 0.547, 0.612, and 0.735, respectively. The TVI spectral index could be used to diagnose stage R1 in stage VT to R6 with an R2 of 0.75. The prediction accuracies of stages V6, V12, and VT to R6 were higher than that of stage V10. Compared with the results of the satellite observation experiments, it was found that the prediction accuracy of this method was higher than that of the satellite observation experiments [47,48,49]. Furthermore, it could overcome the influence of satellite remote sensing by heavy field cycle [22] and weather cloud [18,27,28,29,30]. For example, Li, F.L. et al. [49] only estimated the leaf nitrogen content of winter wheat at the turning-green stage by ground hyperspectrum data combined with GF-1 satellite data, and the highest predictive determination coefficient was 0.59. The average determination coefficient of the model proposed in this study was 0.68.
According to the spectral diagnostic model and the critical nitrogen concentration of summer maize at different growth stages (Figure S3), the nitrogen nutrition status of field summer maize could be diagnosed based on the value range of the spectral index, as in Figure 5. At the V6 stage (Figure 5a), the corresponding value of the optimal spectral index (GBNDVI) corresponding to the critical nitrogen concentration was 0.61. At the V10 stage (Figure 5b), the corresponding value of the optimal spectral index (TCARI) was −2.73. At the V12 stage (Figure 5c), the corresponding value of the optimal spectral index (NRI) was 0.39. At the R1 stage (Figure 4d), the corresponding value of the optimal spectral index (TVI) was 21.63. At the R2 stage (Figure 5e), the corresponding value of the optimal spectral index (MSAVI2) was 0.55. At the R3 stage (Figure 5f) represented, the corresponding value of the optimal spectral index (MSAVI2) was 0.48. The nitrogen nutrition status of field summer maize could be diagnosed based on the value range of the spectral index.

4. Discussion

4.1. Difficulties and Rationality of Experiment Implementation

This small-scale field trial, with well documented spatial differentiation of five different N-levels, enabled a case study for nitrogen concentration estimations based on a combination of near-ground hyperspectral data and UAV multispectral push scan scanner data. In comparison to other studies using similar spectral technology, this study carried out both near-ground hyperspectral trials that could facilitate accurate predictions and UAV multispectral trials with convenient and rapid prediction at a field scale; it was a suitable combination of both. The experiment lasted three years. As compared to other similar studies [18,30,69,70,71], the changes in nitrogen concentration (Figure S3) and spectral data during the life cycle of summer maize were observed here. The results provided detailed experimental data for predicting nitrogen concentration by spectral technology during the life cycle of summer maize and enabled a more accurate prediction of nitrogen concentrations.

4.2. Sensitivity, Validity, and Applicability of the Model

The proposed four-stage combined model (V6, V10, V12, and VT–R6) could be applied more effectively. The four-stage model was constructed based on the GBNDVI, TCARI, NRI, and MSAVI2 spectral indices, whose functions were logarithmic, linear, linear, and power for each spectral index, respectively. The form of model function is consistent with other research results [29,34,72,73]. To further analyze these indices, the sensitivity of the model using NE was discussed (Figure 6). The results indicated that the GBNDVI-based model demonstrated the lowest NE values, especially when the plant nitrogen concentrations exceeded 4%. When the plant nitrogen concentration was <5%, the NE value was <0.5. The TCARI-based model consistently demonstrated the second lowest NE for accessing plant nitrogen concentrations, especially those exceeding 1%. The NRI model demonstrated similar NE values to the TCARI index. When the plant nitrogen concentrations were <3%, the NE values of the TCARI and NRI models were <0.5. The MSAVI2 model had low NE values; however, as compared to the other three spectral indices, its NE value was the highest. However, the NE was <0.1 when the plant nitrogen concentration was <2%. Due to a decrease in the plant nitrogen concentration with the advancement of the growth period (Figure S3), the GBNDVI, TCARI, NRI, and MSAVI2 models all showed high sensitivity in their application stage.
In order to better highlight the validity of the four-stage model, we discussed the diagnosis of the nitrogen nutrition status of summer maize at different growth stages based on the spectral index combined with the critical nitrogen concentration of summer maize (Figure S3). At stage V6, the critical nitrogen concentration was 3.52%, and the corresponding GBNDVI value was 0.61; furthermore, the spectral index range corresponding to the normal nitrogen concentration was 0.83–0.44 (here, a critical nitrogen concentration of 0.9 to 1.1 times was considered as normal nitrogen fertilizer; that of >1.1 times as excess nitrogen fertilizer; and that <0.9 times as deficient nitrogen fertilizer). At stage V10, the critical nitrogen concentration was 2.50%, while the TCARI value was −0.22 to −5.23. At this stage, the summer maize grew rapidly, the demand for fertilizer increased, and the differences between the different base fertilizer levels were significant. At stage V12, the critical nitrogen concentration was 2.2%, while the NRI was 0.42–0.35. The MSAVI2 model was applied from the VT to R6 stage; however, the critical nitrogen concentration was significantly different in the VT, R1, R2, and R3–R6 stages (1.70%, 1.50%, 1.25%, and 1%, respectively). Therefore, the corresponding MSAVI2 ranges were 0.69–0.87, 0.60–0.75, 0.49–0.61, and 0.42–0.53, respectively. The spectral index obtained from the UAV sensor data helped to effectively diagnose the nitrogen nutritional status of summer maize.
The applicability of the four-stage model was further discussed considering the LAI. The GBNDVI model was suitable for a low cover of summer maize. At this stage, the LAI was <1; there was more exposed soil, and the LAI varied from 0.34 to 0.94, with an average of 0.67; moreover, the vegetation cover was low. Sun et al. [74] found that the GBNDVI spectral indices could well predict the aboveground biomass of rapeseed. Wang et al. [75] found that the GBNDVI index model helped to best predict herb quantity in the Yellow River wetlands. The results of these previous studies are consistent with the current study. The TCARI model was suitable in considering the rapid growth stage of summer maize. In this stage, the LAI varied from 1.11 to 2.51, with an average of 1.94; moreover, there was a low to medium cover of summer maize. Previous studies have found that changes in the background reflectance affect the reflectance slope between 550 and 700 nm; furthermore, changes in the Rnir/Rg ratio in the TCARI calculation formula were closely related to the changes in the reflectance characteristics of the background material (soil and non-photosynthetic components). Cohen et al. [76] found that TCARI was strongly correlated with leaf N at the rapid growth stage. Therefore, TCARI is suitable for a low to medium coverage of summer maize. The NRI model was suitable for a medium to high cover of summer maize. At this stage, the LAI of maize varied from 2.66 to 4.66, with an average of 3.61. The plants grew rapidly; however, their morphology was basically stable. The NRI is the normalized index of green and red light, which helps to better reflect the nitrogen nutrition status of crops at this stage. Wang et al. [77] found that the nitrogen concentration in rice at the booting stage was also closely related to the NRI. The results were similar to those of this study. The MSAVI2 model was suitable for a high cover of summer maize. The LAI of maize changed from 3.13 to 4.74, with an average of 3.94; the change was insignificant in comparison to that of the previous stage.

4.3. Feasibility of Data Acquisition

Only the growth stage of summer maize was determined when the four-stage model was applied in the field; moreover, the UAV sensor data were obtained. First, the corresponding diagnostic model was selected based on the stage; thereafter, the corresponding spectral index was calculated based on the spectral data. The nitrogen nutrition status of summer maize was diagnosed based on the range of normal fertilization. The model proposed here was simple, easy to calculate, and convenient for obtaining data. The UAV was equipped with a multispectral sensor. Compared with the hyperspectral sensor, although the hyperspectral sensor can obtain hundreds of narrow spectral bands at the same time with high accuracy [35], the multispectral sensor can obtain spectral information on blue, green, red, near infrared, and red edge bands, including nitrogen-sensitive bands. Basically, it can meet our work on the diagnosis of the nitrogen nutrition status of crops [17,34]. Furthermore, the cost was lower than that of a UAV equipped with a hyperspectral sensor [15,44]. It was convenient for a wide range of people and a wide range of regional applications [30,32,37].

4.4. Limitations of the Method and the Focus of Future Work

In order to analyze the interannual applicability of the model, this study only carried out a 3-year study based on the same variety of summer maize. This method has a certain reference value for other varieties and other crops in the carrying out of similar research. However, it should be noted that, firstly, as different crop types, there will be differences in the division of the growth stages; secondly, different crop types may have different sensitive bands and appropriate spectral indices. Further tests involving different varieties of maize and a wide range of vegetation types and regional scales should be considered to verify the use of spectral indices in determining the nitrogen content in plants. To facilitate the application of the model, this study only analyzed the unitary model; moreover, further studies on the multivariate model could be undertaken. Consideration of a combination of the radiative transfer model and the statistical model is also promising in going ahead. This study undertook three years of experiments, which could be further carried out in the future to supplement the samples, further improve the model, and expand its applications.

5. Conclusions

Here, ground hyperspectral technology was combined with UAV multispectral technology; thereafter, a multi-index synergy model of nitrogen concentration during the life cycle of summer maize was proposed based on the data of a 3-year systematic field experiment. Based on the critical nitrogen concentration model, the spectral index thresholds of sufficient nitrogen levels were determined at different stages.
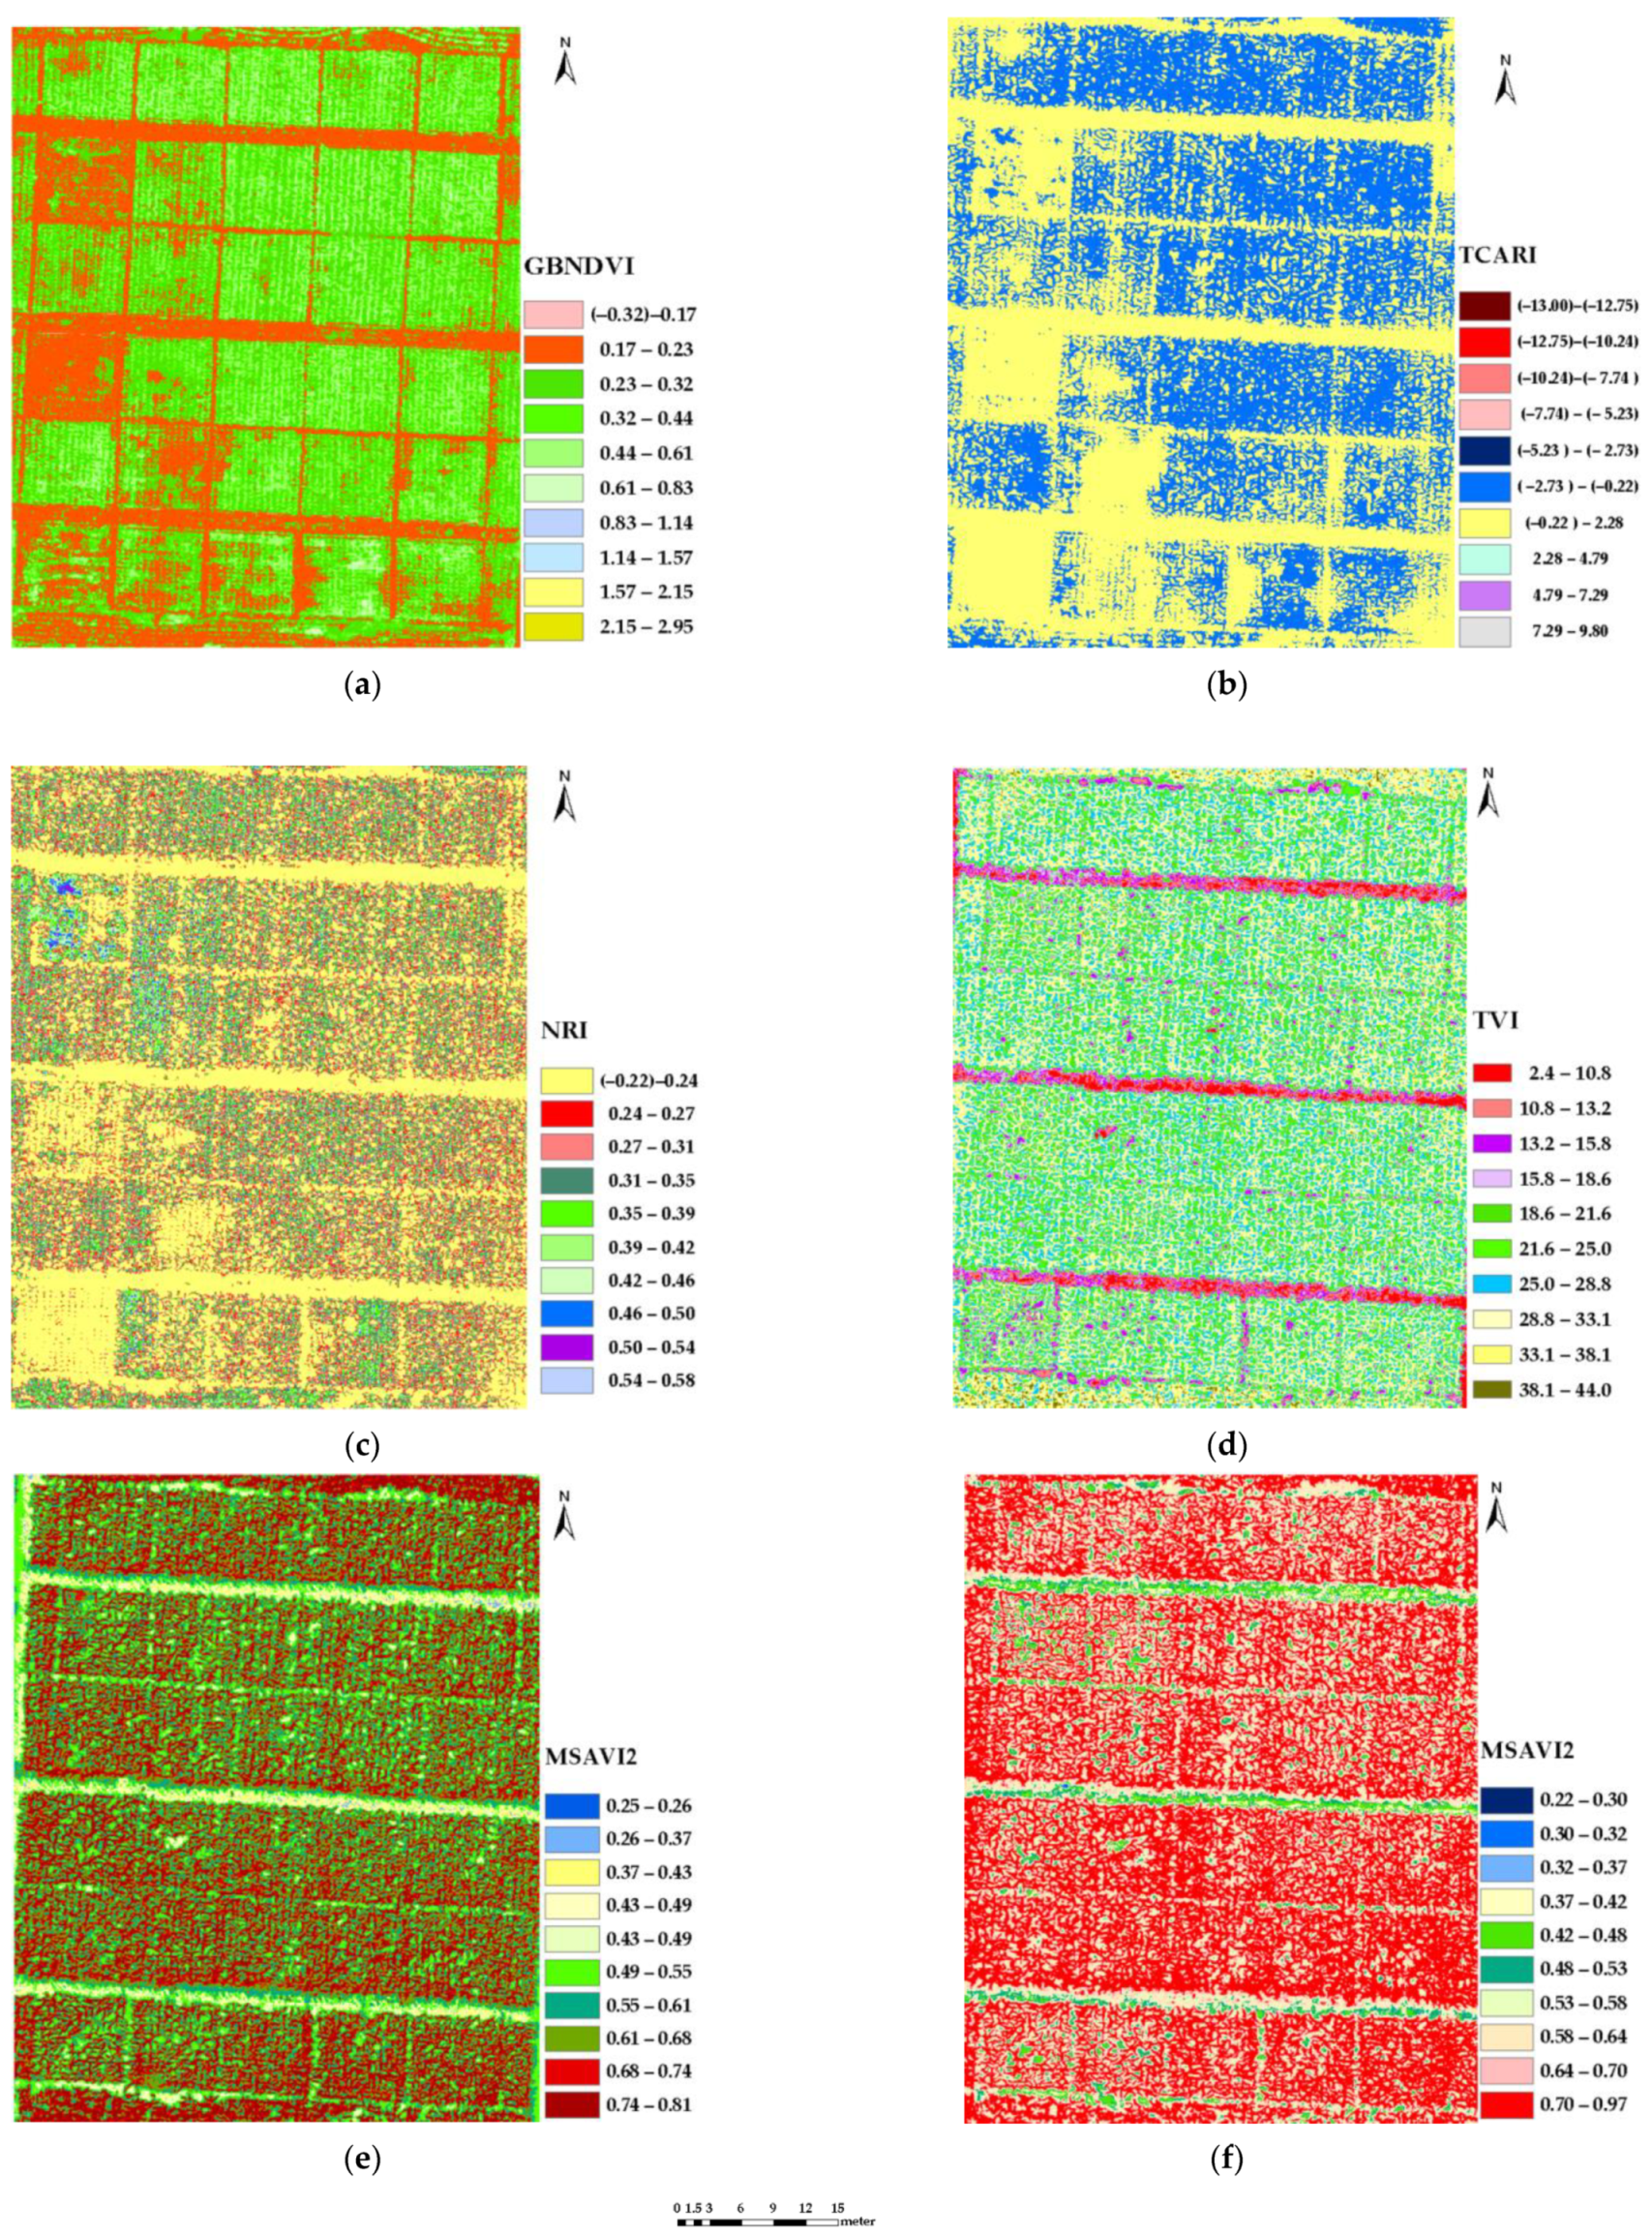
The results of this study showed that the optimized four-stage, multi-index synergy model could better diagnose the nitrogen nutrition status considering the entire life cycle of summer maize. GBNDVI was suitable for stage V6 with low coverage (mean LAI = 0.67), the evaluation accuracy R2 was 0.833, while the spectral index threshold of nitrogen adequacy ranged from 0.83 to 0.44. TCARI was suitable for stage V10 with medium and low coverage (mean LAI = 1.94), with an R2 of 0.547. The spectral index threshold of nitrogen adequacy ranged from −0.22 to −5.23. NRI was suitable for stage V12 with medium to high coverage (mean LAI = 3.61), and with an R2 of 0.612. The spectral index threshold of nitrogen adequacy was 0.42–0.35. MSAVI2 was suitable for stage VT–R6 with high coverage (mean LAI = 3.94), and with an R2 of 0.735. The spectral index thresholds of nitrogen adequacy in stages VT, R1, R2, and R3-R6 were 0.69–0.87, 0.60–0.75, 0.49–0.61, and 0.42–0.53, respectively.
The nitrogen concentration of summer maize plants simulated by the optimal multispectral index synergy model constructed at the different growth stages was similar to the actual spatial distribution. This study provides technical support for the timely, rapid, convenient, and accurate diagnosis of summer maize nitrogen nutrition and provides a basis for the SCM of nitrogen.

Supplementary Materials

The following supporting information can be downloaded at: https://www.mdpi.com/article/10.3390/atmos13010122/s1, Table S1: number of experimental observations (n), tissue sampling date, hyperspectral acquisition date and local time, UAV sampling area and local time, Table S2: nitrogen concentration of summer maize plants, Figure S1: UAV aerial photography operations, Figure S2: UAV route, Figure S3: relationship between plant critical nitrogen concentration and crop biomass of summer maize. “•” represented the data in 2017. “×” represented the data in 2018. “▲” represented the data in 2019.

Author Contributions

Conceptualization, N.H., B.Z. and Y.L.; data curation, N.H., Z.P., Q.Z. and Z.W.; methodology, N.H., B.Z. and Y.L.; funding acquisition, B.Z.; software, Z.W.; validation, N.H. and B.Z.; writing—original draft, N.H., B.Z., Y.L., Z.P., Q.Z. and Z.W.; writing—review and editing, N.H. All authors have read and agreed to the published version of the manuscript.

Funding

This research was funded by the National Key R&D Program of China (2019YFC0409203), the fund of China Institute of Water Resources and Hydropower Research (ID0145B742017, ID0145B492017 and ID0145B082017), the fund of State Key Laboratory of Simulation and Regulation of Water Cycle in River Basin China Institute of Water Resources and Hydropower Research (SKL2020TS08), and the Chinese National Natural Science Fund (51379217, 91425302 and 51609170).

Institutional Review Board Statement

Not applicable.

Informed Consent Statement

Not applicable.

Data Availability Statement

Not applicable.

Acknowledgments

We are thankful to all those who contributed to this study.

Conflicts of Interest

The authors declare no conflict of interest.

References

  1. Duarte, A.G.; Longstaffe, F.J.; Way, D.A. Nitrogen fertilisation influences low CO2 effects on plant performance. Funct. Plant Biol. 2020, 47, 134–144. [Google Scholar] [CrossRef]
  2. Dier, M.; Hüther, L.; Schulze, W.X.; Erbs, M.; Koehler, P.; Weigel, H.-J.; Manderscheid, R.; Zörb, C. Elevated atmospheric CO2 concentration has limited effect on wheat grain quality regardless of nitrogen supply. J. Agric. Food Chem. 2020, 68, 3711–3721. [Google Scholar] [CrossRef]
  3. Córcoles, H.L.; Juan, J.; Picornell, M.R. Biomass production and yield in irrigated maize at different rates of nitrogen in a semi-arid climate. NJAS-Wang J. Life Sci. 2020, 92, 10032. [Google Scholar] [CrossRef]
  4. Dong, K.W.; Riley, W.J.; Wu, Y. More fertilizer and impoverished roots required for improving wheat yields and profits under climate change. Field Crops Res. 2020, 249, 107756. [Google Scholar]
  5. Gao, Y.; Liang, A.; Zhang, Y.; Mclaughlin, N.; Fan, R. Dynamics of microbial biomass, nitrogen mineralization and crop uptake in response to placement of maize residue returned to chinese mollisols over the maize growing season. Atmosphere 2021, 12, 1166. [Google Scholar] [CrossRef]
  6. Noh, H.; Zhang, Q.; Shin, B.; Han, S.; Feng, L. A neural network model of maize crop nitrogen stress assessment for a multi-spectral imaging sensor. Biosyst. Eng. 2006, 94, 477–485. [Google Scholar] [CrossRef]
  7. Hatfield, J.L.; Gitelson, A.A.; Schepers, J.S.; Walthall, C.L. Application of spectral remote sensing for agronomic decisions. Agron. J. 2008, 100, 117–131. [Google Scholar] [CrossRef] [Green Version]
  8. Lu, D.J.; Lu, F.F.; Pan, J.X.; Cui, Z.N.; Zou, C.Q.; Chen, X.P.; He, M.; Wang, Z. The effects of cultivar and nitrogen management on wheat yield and nitrogen use efficiency in the North China Plain. Field Crops Res. 2015, 171, 157–164. [Google Scholar] [CrossRef]
  9. Meng, Q.F.; Peng, H.; Wu, L.; Chen, X.P.; Cui, Z.L.; Zhang, F.S. Understanding production potentials and yield gaps in intensive maize production in China. Field Crops Res. 2013, 143, 91–97. [Google Scholar] [CrossRef] [Green Version]
  10. Wang, H.; Guo, Z.; Shi, Y.; Wang, H.G.; Zhen, W. Impact of tillage practices on nitrogen accumulation and translocation in wheat and soil nitrate-nitrogen leaching in drylands. Soil Till. Res. 2015, 153, 20–27. [Google Scholar] [CrossRef]
  11. Serrano, L.; Filella, I.; Penuelas, J. Remote sensing of biomass and yield of winter wheat under different nitrogen supplies. Crop. Sci. 2000, 40, 723–731. [Google Scholar] [CrossRef] [Green Version]
  12. Luo, J.; Ma, R.; Feng, H.; Li, X. Estimating the total nitrogen concentration of reed canopy with hyperspectral measurements considering a non-uniform vertical nitrogen distribution. Remote Sens. 2016, 8, 789. [Google Scholar] [CrossRef] [Green Version]
  13. Huang, W.; Yang, Q.; Pu, R.; Yang, S. Estimation of nitrogen vertical distribution by bi-directional canopy reflectance in winter wheat. Sensors 2004, 14, 20347–20359. [Google Scholar] [CrossRef] [PubMed] [Green Version]
  14. Kayad, A.; Sozzi, M.; Gatto, S.; Whelan, B.; Sartori, L.; Marinello, F. Ten years of corn yield dynamics at field scale under digital agriculture solutions: A case study from north Italy. Comput. Electron. Agric. 2021, 185, 106126. [Google Scholar] [CrossRef]
  15. Wei, P.F.; Xu, X.G.; Li, Z.Y.; Yang, G.J.; Li, Z.H.; Feng, H.K.; Chen, G.; Fan, L.L.; Wang, Y.L.; Liu, S.B. Remote sensing estimation of nitrogen content in summer maize leaves based on multispectral images of UAV. Trans. Chin. Soc. Agric. Eng. 2019, 35, 126–133. (In Chinese) [Google Scholar]
  16. Jeong, H.; Bhattarai, R. Exploring the effects of nitrogen fertilization management alternatives on nitrate loss and crop yields in tile-drained fields in Illinois. J. Environ. Manag. 2018, 213, 341–352. [Google Scholar] [CrossRef] [PubMed]
  17. Colorado, J.D.; Cera-Bornacelli, N.; Caldas, J.S.; Petro, E.; Jaramillo-Botero, A. Estimation of nitrogen in rice crops from UAV-captured images. Remote Sens. 2020, 12, 3396. [Google Scholar] [CrossRef]
  18. Corti, M.; Cavalli, D.; Cabassi, G.; Vigoni, A.; Degano, L.; Gallina, P.M. Application of a low-cost camera on a UAV to estimate maizenitrogen-related variables. Precis. Agric. 2019, 20, 675–696. [Google Scholar] [CrossRef]
  19. Olfs, H.-W.; Blankenau, K.; Brentrup, F.; Jasper, J.; Link, A.; Lammel, J. Soil- and plant-based nitrogen-fertilizer recommendations in arable farming. J. Plant Nutr. Soil. Sci. 2005, 168, 414–431. [Google Scholar] [CrossRef]
  20. Li, L.T.; Wang, S.Q.; Ren, T.; Wei, Q.Q.; Ming, J.; Li, J.; Li, X.; Cong, R.; Lu, J. Ability of models with effective wavelengths to monitor nitrogen and phosphorus status of winter oilseed rape leaves using in situ canopy spectroscopy. Field Crops Res. 2018, 215, 173–186. [Google Scholar] [CrossRef]
  21. Chen, P.F.; Haboudane, D.; Tremblay, N.; Wang, J.H.; Vigneault, P.; Li, B.G. New spectral indicator assessing the efficiency of crop nitrogen treatment in corn and wheat. Remote Sens. Environ. 2010, 114, 1987–1997. [Google Scholar] [CrossRef]
  22. Wójtowicz, M.; Wójtowicz, A.; Piekarczyk, J. Application of remote sensing methods in agriculture. Commun. Biol. Crop Sci. 2016, 11, 31–50. [Google Scholar]
  23. Li, F.; Miao, Y.; Hennig, S.D.; Gnyp, M.L.; Chen, X.P.; Jia, L.L.; Bareth, G. Evaluating hyperspectral vegetation indices for estimating nitrogen concentration of winter wheat at different growth stages. Precis. Agric. 2010, 11, 335–357. [Google Scholar] [CrossRef]
  24. Lulu, M.; Xin, L.; Ze, Z. Establishment of nitrogen nutrition diagnosis model for drip-irrigation cotton based on critical nitrogen concentration. Trans. Chin. Soc. Agric. Eng. 2018, 49, 277–284. (In Chinese) [Google Scholar]
  25. Mistele, B.; Schmidhalter, U. Estimating the nitrogen nutrition index using spectral canopy reflectance measurements. Eur. J. Agron. 2008, 29, 184–190. [Google Scholar] [CrossRef]
  26. Bagheri, N.; Ahmadi, H.; Alavipanah, S.K.; Omid, M. Multispectral remote sensing for site-specific nitrogen fertilizer management. Pesqui. Agropecu. Bras. 2013, 48, 1394–1401. [Google Scholar] [CrossRef] [Green Version]
  27. Sims, D.A.; Gamon, J.A. Relationships between leaf pigment content and spectral reflectance across a wide range of species, leaf structures and developmental stages. Remote Sens. Environ. 2002, 81, 337–354. [Google Scholar] [CrossRef]
  28. Zhang, J.J.; Du, P.; Guo, J.B.; Cao, R.; Zhang, J.; Ma, X.M. Study of critical nitrogen concentration model and nitrogen nutrition diagenosis in winter wheat with different N efficiency. J. Triticeae Crops 2017, 11, 86–94. (In Chinese) [Google Scholar]
  29. Palka, M.; Manschadi, A.M.; Koppensteiner, L.; Neubauer, T.; Fitzgerald, G.J. Evaluating the performance of the CCCI-CNI index for estimating N status of winter wheat. Eur. J. Agron. 2021, 130, 126346. [Google Scholar] [CrossRef]
  30. Nigon, T.J.; Yang, C.; Paiao, G.D.; Mulla, D.J.; Fernández, F.G. Prediction of early season nitrogen uptake in maize using high-resolution aerial hyperspectral imagery. Remote Sens. 2020, 12, 1234. [Google Scholar] [CrossRef] [Green Version]
  31. Geipel, J.; Link, J.; Wirwahn, J.A.; Claupein, W. A programmable aerial multispectral camera system for in-season crop biomass and nitrogen content estimation. Agriculture 2016, 6, 4. [Google Scholar] [CrossRef] [Green Version]
  32. Huang, Y.; Thomson, S.J.; Lan, Y.; Maas, S.J. Multispectral imaging systems for airborne remote sensing to support agricultural production management. Int. J. Agric. Biol. Eng. 2010, 3, 50–62. [Google Scholar]
  33. Ge, H.; Xiang, H.; Ma, F.; Li, Z.; Du, C. Estimating plant nitrogen concentration of rice through fusing vegetation indices and color moments derived from UAV-RGB images. Remote Sens. 2021, 13, 1620. [Google Scholar] [CrossRef]
  34. Wang, Y.P.; Chang, Y.C.; Shen, Y. Estimation of nitrogen status of paddy rice at vegetative phase using unmanned aerial vehicle based multispectral imagery. Precis. Agric. 2021, 23, 1–17. [Google Scholar] [CrossRef]
  35. Tao, H.; Feng, H.; Xu, L.; Miao, M.; Yang, G.; Yang, X. Estimation of the yield and plant height of winter wheat using UAV-based hyperspectral images. Sensors 2020, 20, 1231. [Google Scholar] [CrossRef] [Green Version]
  36. Gilliot, J.M.; Michelin, J.; Hadjard, D.; Houot, S. An accurate method for predicting spatial variability of maize yield from UAV-based plant height estimation: A tool for monitoring agronomic field experiments. Precis. Agric. 2021, 22, 897–921. [Google Scholar] [CrossRef]
  37. Caturegli, L.; Corniglia, M.; Gaetani, M.; Grossi, N.; Magni, S.; Migliazzi, M.; Angelini, L.; Mazzoncini, M.; Silvestri, N.; Fontanelli, M. Unmanned aerial vehicle to estimate the nitrogen status of turfgrasses. PLoS ONE 2016, 11, e0158268. [Google Scholar]
  38. Liu, H.Y.; Zhu, H.; Wang, P. Quantitative modeling for leaf nitrogen content of winter wheat using UAV-based hyperspectral data. Int. J. Remote Sens. 2017, 38, 2117–2134. [Google Scholar] [CrossRef]
  39. Hunt, E.R.; Horneck, D.A.; Spinelli, C.B.; Turner, R.W.; Bruce, A.E.; Gadler, D.J. Monitoring nitrogen status of potatoes using small unmanned aerial vehicles. Precis. Agric. 2018, 19, 314–333. [Google Scholar] [CrossRef]
  40. Singh, S.K.; Houx, J.H.; Maw, M.J.W.; Fritschi, F.B. Assessment of growth, leaf N concentration and chlorophyll content of sweet sorghum using canopy reflectance. Field Crops Res. 2017, 209, 47–57. [Google Scholar] [CrossRef]
  41. Sylvain, J.; Fabienne, M.; Ryad, B.; Nathalie, G. Retrieving LAI, chlorophyll and nitrogen contents in sugar beet crops from multiangular optical remote sensing: Comparison of veg- etation indices and PROSAIL inversion for field phenotyping. Field Crops Res. 2017, 210, 33–46. [Google Scholar]
  42. Liu, C.H.; Ma, W.Y.; Chen, Z.C.; Wang, C.Y.; Lu, J.J.; Yue, X.Z.; Wang, Z.; Fang, Z.; Miao, Y. Nitrogen nutrition diagnosis of winter wheat based on the UAV remote sensing. J. Henan Poly. Univ. 2018, 37, 45–53. (In Chinese) [Google Scholar]
  43. Swain, K.C.; Thomson, S.J.; Jayasuriya, H.P. Adoption of an unmanned helicopter for low-altitude remote sensing to estimate yield and total biomass of a rice crop. Trans. ASABE 2010, 53, 21–27. [Google Scholar] [CrossRef] [Green Version]
  44. Gabriel, J.L.; Zarco-Tejada, P.J.; López-Herrera, P.J.; Perez-Martín, E.; Alonso-Ayuso, M.; Quemada, M. Airborne and ground level sensors for monitoring nitrogen status in a maize crop. Biosyst. Eng. 2017, 160, 124–133. [Google Scholar] [CrossRef]
  45. Diker, K.; Bausch, W.C. Potential Use of Nitrogen Reflectance Index to estimate Plant Parameters and Yield of Maize. Biosyst. Eng. 2003, 85, 437–447. [Google Scholar] [CrossRef]
  46. He, D.; Wang, E.; Wang, J.; Robertson, M.J. Data requirement for effective calibration of process-based crop models. Agric. For. Metorol. 2017, 234, 136–148. [Google Scholar] [CrossRef]
  47. Mittermayer, M.; Gilg, A.; Maidl, F.X.; Ntscher, L.; Hülsbergen, K.J. Site-specific nitrogen balances based on spatially variable soil and plant properties. Precis. Agric. 2021, 22, 1416–1436. [Google Scholar] [CrossRef]
  48. Huang, S.; Miao, Y.; Yuan, F.; Martin, G.; Yao, Y.; Qiang, C. Potential of rapideye and worldview-2 satellite data for improving rice nitrogen status monitoring at different growth stages. Remote Sens. 2017, 9, 227. [Google Scholar] [CrossRef] [Green Version]
  49. Li, F.L.; Chang, Q.R.; Shen, J.; Wang, L. Remote sensing estimation of winter wheat leaf nitrogen content based on GF-1 satellite data. Trans. Chin. Soc. Agric. Eng. 2016, 32, 157–164. (In Chinese) [Google Scholar]
  50. Cao, Q.; Miao, Y.M.; Li, F.; Gao, X.W.; Liu, B.; Lu, D.J.; Chen, X.P. Developing a new crop circle active canopy sensor-based precision nitrogen management strategy for winter wheat in the North China Plain. Precis. Agric. 2016, 18, 2–18. [Google Scholar] [CrossRef]
  51. Chen, J.M. Evaluation of vegetation indices and modified simple ratio for boreal applications. Can. J. Remote Sens. 1996, 22, 229–242. [Google Scholar] [CrossRef]
  52. Daughtry, C.S.T.; Walthall, C.L.; Kim, M.S. Estimating corn leaf chlorophyll concentration from leaf and canopy reflectance. Remote Sens. Environ. 2000, 74, 229–239. [Google Scholar] [CrossRef]
  53. Tucker, C.J. Red and photographic infrared linear combinations for monitoring vegetation. Remote Sens. Environ. 1979, 8, 127–150. [Google Scholar] [CrossRef] [Green Version]
  54. Gitelson, A.A.; Kaufman, Y.J.; Stark, R.; Rundquista, D. Novel algorithms for remote estimation of vegetation fraction. Remote Sens. Environ. 2002, 80, 76–87. [Google Scholar] [CrossRef] [Green Version]
  55. Gong, P.; Pu, R.; Biging, G.S.; Larrieu, M.R. Estimation of forest leaf area index using vegetation indices derived from Hyperion hyperspectral data. IEEE Trans. Geosci. Remote Sens. 2003, 41, 1355–1362. [Google Scholar] [CrossRef] [Green Version]
  56. Haboudane, D.; Miller, J.R.; Tremblay, N.; Zarco-Tejada, P.J.; Dextraze, L. Integrated narrow—Band vegetation indices for prediction of crop chlorophyll content for application to precision agriculture. Remote Sens. Environ. 2002, 81, 416–426. [Google Scholar] [CrossRef]
  57. Haboudane, D.; Miller, J.R.; Pattey, E.; Zarco-Tejada, P.J.; Strachan, I.B. Hyperspectral vegetation indices and novel algorithms for predicting green LAI of crop canopies: Modeling and validation in the context of precision agriculture. Remote Sens. Environ. 2004, 90, 337–352. [Google Scholar] [CrossRef]
  58. Huete, A.R. A soil adjusted vegetation index SAVI. Remote Sens. Environ. 1988, 25, 295–309. [Google Scholar] [CrossRef]
  59. Jordan, C.F. Derivation of leaf—Area index from quality of light on the forest floor. Ecology 1969, 50, 663–666. [Google Scholar] [CrossRef]
  60. Liu, H.Q.; Huete, A.A. Feedback-based modification of the NDVI to minimize canopy background and atmospheric noise. IEEE Trans. Geosci. Remote Sens. 1995, 33, 457–465. [Google Scholar] [CrossRef]
  61. Navarro, G.; Caballero, M.; Silva, G.; Parra, P.C.; Águeda, V.; Caldeira, R.M.A. Evaluation of forest fire on Madeira Island using Sentinel-2A MSI imagery. Int. J. Appl. Earth. OBS 2017, 58, 97–106. [Google Scholar] [CrossRef] [Green Version]
  62. Penuelas, J.; Gamon, J.A.; Fredeen, A.L.; Merino, J.; Field, C.B. Reflectance indices associated with physiological changes in nitrogen and water-limited sunflower leaves. Remote Sens. Environ. 1994, 48, 135–146. [Google Scholar] [CrossRef]
  63. Qi, J.; Chehbouni, A.; Huete, A.R.; Kerr, Y.H.; Sorooshian, S. A modified soil adjusted vegetation index (MSAVI). Remote Sens. Environ. 1994, 48, 119–126. [Google Scholar] [CrossRef]
  64. Rouse, J.W.; Haas, R.H.; Schell, J.A.; Deering, D.W.; Harlan, J.C. Monitoring the vernal advancements and retrogradation of natural vegetation. NASA/GSFCT Type III Final. Rep. 1974, 1. Available online: https://ntrs.nasa.gov/citations/19730017588 (accessed on 27 November 2021).
  65. Schleicher, T.D.; Bausch, W.C.; Delgado, J.A.; Ayer, P.D. Evaluation and refinement of the nitrogen reflectance index (NRI) for site specific fertilizer management. In Proceedings of the 2001 ASAE Annual International Meeting, Sacramento, CA, USA, 30 July–1 August 2001. [Google Scholar]
  66. Li, X.C.; Xu, X.G.; Bao, Y.S.; Huang, W.J.; Luo, J.H.; Dong, Y.Y.; Song, X.Y.; Wang, J.H. Retrieving LAI of Winter Wheat Based on Sensitive Vegetation Index by the Segmentation Method. Sci. Agric. 2012, 45, 3486–3496. (In Chinese) [Google Scholar]
  67. Wang, F.M.; Huang, J.F.; Tang, Y.l.; Wang, X.Z. New vegetation index and its application in estimating leaf area index of rice. Chin. J. Rice Sci. 2007, 21, 159–166. (In Chinese) [Google Scholar] [CrossRef]
  68. Viña, A.; Gitelson, A.A.; Nguy-Robertson, A.L.; Peng, Y. Comparison of different vegetation indices for the remote assessment of green leaf area index of crops. Remote Sens. Environ. 2011, 115, 3468–3478. [Google Scholar] [CrossRef]
  69. Fan, L.; Zhao, J.; Xu, X.; Liang, D.; Yang, G.; Feng, H.; Yang, H.; Wang, Y.; Chen, G.; Wei, P. Hyperspectral-Based Estimation of Leaf Nitrogen Content in Corn Using Optimal Selection of Multiple Spectral Variables. Sensors 2019, 19, 2898. [Google Scholar] [CrossRef] [Green Version]
  70. Torino, M.S.; Ortiz, B.V.; Fulton, J.P.; Balkcom, K.S.; Wood, C.W. Evaluation of vegetation indices for early assessment of corn status and yield potential in the southeastern united states. Agron. J. 2014, 106, 1389–1401. [Google Scholar] [CrossRef]
  71. Li, F.; Miao, Y.; Feng, G.; Yuan, F.; Yue, S.; Gao, X.; Liu, Y.; Liu, B.; Ustin, S.L.; Chen, X. Improving estimation of summer maize nitrogen status with red edge-based spectral vegetation indices. Field Crops Res. 2014, 157, 111–123. [Google Scholar] [CrossRef]
  72. Osco, L.P.; José, M.J.; Ramos, A.P.M.; Furuya, D.E.G.; Teodoro, P.E. Leaf nitrogen concentration and plant height prediction for maize usingUAV-based multispectral imagery and machine learning techniques. Remote Sens. 2020, 12, 3237. [Google Scholar] [CrossRef]
  73. Lu, J.; Cheng, D.; Geng, C.; Zhang, Z.; Xiang, Y.; Hu, T. Combining plant height, canopy coverage and vegetation index from uav-based rgb images to estimate leaf nitrogen concentration of summer maize. Biosyst. Eng. 2021, 202, 42–54. [Google Scholar] [CrossRef]
  74. Sun, J.Y.; Huang, Y.; Cao, H.X.; Jiao, Y.G. Correlation analysis between aboveground biomass of rape andcanopy spectral vegetation index. Guangxi Agric. Sci. 2009, 40, 716–723. (In Chinese) [Google Scholar]
  75. Wang, J.B.; Zhang, J.; Ma, Y. Study on the above ground vegetation biomass estimation model basedon GF-1 WFV satellite image in the Yellow River estuary wetland. Acta Laser Biol. Sin. 2014, 23, 604–608. (In Chinese) [Google Scholar]
  76. Cohen, Y.; Alchanatis, V.; Zusman, Y.; Dar, Z.; Onfil, D.J.; Karnieli, A.; Zilberman, A.; Moulin, A.; Ostrovsky, V.; Levi, A.; et al. Leaf nitrogen estimation in potato based on spectral data and on simulated bands of the VENμS satellite. Precis. Agric. 2010, 11, 520–537. [Google Scholar] [CrossRef]
  77. Wang, W.; Yao, X.; Yao, X.; Tian, Y.; Liu, X.; Ni, J.; Cao, W.; Zhu, Y. Estimating leaf nitrogen concentration with three-band vegetation indices in rice and wheat. Field Crops Res. 2012, 129, 90–98. [Google Scholar] [CrossRef]
Figure 1. Cumulative rainfall (mm) and mean temperature during the summer maize growing seasons 2017–2019 in Daxing, Beijing, China.
Atmosphere 13 00122 g001
Figure 2. Flow chart of diagnosis of nitrogen nutrition status.
Atmosphere 13 00122 g002
Figure 3. The top six multispectral indices of summer maize at the V6 (a), V10 (b), V12 (c), VT (d), R1 (e), R2 (f), R3 (g), and R6 (h) growth stages and their life cycle diagnostic evaluation.
Atmosphere 13 00122 g003
Figure 4. Evaluation results of the UAV multispectral nitrogen diagnosis models of summer maize at the V6 (a), V10 (b), V12 (c), and VT-R6 (d) growth stages.
Atmosphere 13 00122 g004
Figure 5. Spatial distribution of nitrogen diagnosis of summer maize plants by UAV at the V6 (a), V10 (b), V12 (c), R1 (d), R2 (e), and R3 (f) growth stages.
Atmosphere 13 00122 g005
Figure 6. Noise equivalent of plant nitrogen concentration estimation by the spectral indices of GBNDVI, TCARI, NRI, and MSAVI2.
Atmosphere 13 00122 g006
Table 1. Multispectral reflectance indices used to estimate nitrogen content of crops in this study.
NumberMultispectral IndexFormulaLiterature Source
1GOSAVI(1 + 0.16) (Rnir − Rg)/(Rnir + Rg + 0.16)[50]
2MSR1[(Rnir/Rr) − 1]/[ (Rnir/Rr)0.5 + 1][51]
3DVIRnir − Rr[52]
4GDVIRnir − Rg[53]
5VARI(Rg − Rr)/(Rg + Rr − Rb)[54]
6GRVI(Rnir/Rg) − 1[54]
7MNLI(1.5 R2nir − 1.5 Rg)/(R2nir + Rr + 0.5)[55]
8OSAVI1.16 (Rnir − Rr)/(0.16 + Rnir + Rr)[56]
9TCARI3 [(Rnir − Rr) − 0.2 (Rnir − Rg) (Rnir/Rr)]
10TCARI/OSAVITCARI/OSAVI
11RDVI(Rnir − Rr)/(Rnir + Rr)0.5[57]
12TVI0.5 [120 (Rnir − Rg)−200 (Rr − Rg)]
13SAVI1.5 (Rnir − Rr)/(Rnir + Rr + 0.5)[58]
14RVIRnir/Rr[59]
15EVI2.5 (Rnir − Rr)/(Rnir + 6 Rr − 7.5 Rb + 1)[60]
16GNDVI(Rnir − Rg)/(Rnir + Rg)[61]
17NPCI(Rr − Rb)/(Rr + Rb)[62]
18MSAVI20.5 [(2 Rnir + 1) − [(2 Rnir + 1)2 − 8 (Rnir − Rr)]0.5][63]
19NDVI(Rnir − Rr)/(Rnir + Rr)[64]
20NRI(Rg − Rr)/(Rg + Rr)[65]
21NLI(R2nir + Rr)/(R2nir − Rr)[66]
22BNDVI(Rnir − Rb)/(Rnir + Rb)[67]
23BRNDVI[Rnir − (Rr + Rb)]/[Rnir + (Rg + Rb)]
24GBNDVI[Rnir − (Rg + Rb)]/[Rnir + (Rg + Rb)]
25GRNDVI[Rnir − (Rg + Rr)]/[Rnir + (Rg + Rr)]
26PNDVI[Rnir − (Rg + Rr + Rb)]/[Rnir + (Rg + Rr + Rb)]
Note: Rnir, Rr, Rg, and Rb were spectral reflectance of the near-infrared, red, green, and blue wave segments, respectively.
Table 2. Multispectral diagnosis models and evaluation results of the summer maize nitrogen concentration at different growth stages.
Growth StageMultispectral IndexDiagnosis ModelR2
V6GBNDVIy = −1.112ln(x) + 2.9630.643
BNDVIy = −3.686x + 6.4880.571
BRNDVIy = −1.194ln(x) + 2.9270.536
PNDVIy = −0.560ln(x) + 2.9400.472
NRIy = −2.993x + 4.2970.547
NDVIy = −1.997ln(x) + 3.1010.543
V10TCARIy = −0.0998x + 2.2280.552
BNDVIy = 4.8586x − 1.62170.448
TCARI/OSAVIy = −0.0874x + 2.2090.423
PVIy = 12.764x + 10.3880.372
NPCIy = 1.725x + 2.6600.295
RVIy = 2.118e0.0115x0.274
V12NRIy = −5.833x + 4.4570.587
TVIy = 4.021e−0.018x0.395
DVIy = 4.029e−1.153x0.377
RDVIy = 7.343e−1.753x0.371
SAVIy = 8.028e−1.790x0.353
BNDVIy = −6.90ln(x) + 1.5450.340
VTNRIy = −2.816x + 2.1210.424
OSAVIy = −2.525x + 3.4000.334
NLIy = −1.414x + 2.4900.331
RDVIy = 2.835e−1.026x0.323
SAVIy = 2.956e−1.042x0.315
MSAVI2y = −1.414x + 2.4890.309
R1DVIy = 2.983e−1.992x0.328
TVIy = 2.933e−0.031x0.343
GDVIy = 3.035e−2.170x0.297
EVIy = 3.563e−1.379x0.235
MNLIy = −1.889x + 1.8700.229
RDVIy = 4.061e−1.941x0.227
R2NDVIy = 3.544x3.7310.376
MSR1y = 0.632x1.2900.367
MSR2y = 0.412x1.4250.367
RVIy = 0.167x1.0140.363
BRNDVIy = 3.052x1.7080.343
PVIy = 586.49e16.675x0.279
R3OSAVIy = 1.946x1.3030.522
NDVIy = 1.649x1.3870.513
RVIy = 0.490ln(x) + 0.1530.500
MSR2y = 0.815x0.6050.498
MSR1y = 0.341x + 0.3800.493
TCARI/OSAVIy = −0.276x + 0.9340.490
R6DVIy = 2.860x0.8890.347
GDVIy = 3.055x0.9500.343
TVIy = 0.093x0.8150.334
MNLIy = 0.690e2.654x0.330
MSAVI2y = 2.241x1.0310.325
SAVIy = 2.563x1.2250.317
Note: ”y%” represented the nitrogen concentration of the summer maize plant. “x” represented multispectral indices, the same as below.
Table 3. Multispectral diagnosis models and evaluation results of the summer maize nitrogen concentration in the stages from VT to R6.
Growth StageMultispectral IndexDiagnosis
ModelR2
VT-R6MSAVI2y = 2.115x0.8790.682
GRNDVIy = 2.198x0.7740.523
MSRy = 0.925x0.4800.501
NDVIy = 2.010x1.5060.492
NRIy = 1.926x + 1.0920.481
VARIy = 1.190x + 1.1050.452
Table 4. Results of UAV multispectral diagnosis and evaluation of nitrogen in summer maize at different growth stages.
Growth StageMultispectral IndexRelationshipRMSE (%)RE (%)R2
V6 BNDVIy = 0.443x + 1.8010.285.150.798
BRNDVIy = 0.551x + 1.4530.244.130.843
GBNDVIy = 0.734x + 1.1620.265.970.833
PNDVIy = 0.559x + 1.4340.233.880.861
NRIy = 0.491x + 1.7070.242.990.689
NDVIy = 0.324x + 2.2240.315.270.845
V10TCARIy = 0.590x + 1.0850.035.420.547
TCARI/OSAVIy = 0.223x + 1.8170.014.110.292
NPCIy = −0.169x + 3.1050.058.830.211
BNDVIy = 0.384x + 1.7090.067.590.277
PVIy = 0.176x + 2.0310.010.140.307
RVIy = 0.361x + 1.6430.042.670.249
V12NRIy = 0.997x–0.2440.319.510.612
BNDVIy = 0.265x + 1.5170.4916.110.143
TVIy = 0.242x + 1.7000.3711.420.232
RDVIy = 0.315x + 1.4690.4012.860.282
DVIy = 0.230x + 1.6990.4012.660.225
SAVIy = 0.334x + 1.4080.4113.320.283
VT NRIy = −0.011x + 0.2161.5388.510.001
OSAVIy = −0.025x + 2.7421.0257.830.002
NLIy = −0.111x + 2.7620.9250.340.010
RDVIy = −0.015x + 2.2990.6132.920.002
SAVIy = −0.014x + 2.5750.8749.140.001
MSAVI2y = −0.0045x + 2.3470.6736.730.001
R1DVIy = 0.408x + 0.7570.187.240.636
GDVIy = 0.333x + 0.8460.208.520.602
TVIy = 0.447x + 0.7180.166.000.648
MNLIy = 0.259x + 0.9470.219.030.536
EVIy = 0.329x + 0.8900.185.980.611
RDVIy = 0.260x + 0.9110.2311.490.578
R2MSRy = 0.608x + 1.4530.9979.540.689
RVIy = 0.851x + 1.5691.40113.30.698
MSRy = 0.695x + 1.6111.25101.10.706
NDVIy = 0.383x + 1.6800.9475.570.727
BRNDVIy = 0.253x + 1.7270.8466.380.715
PVIy = 0.263x + 1.6950.8264.840.707
R3OSAVIy = 0.081x + 1.1920.4346.470.081
NDVIy = 0.185x + 1.1400.4650.760.532
MSRy = 0.303x + 0.9470.3740.260.532
MSRy = 0.327x + 1.3060.7484.310.533
RVIy = 0.269x + 1.1290.5257.910.534
TCARI/OSAVIy = 0.481x + 1.0670.6371.880.497
Table 5. Evaluation results of nitrogen in summer maize in the VT to R6 stages.
Multispectral IndexUAV Data Evaluation
RelationshipRMSE (%)RE (%)R2
MSAVI2y = 0.848x + 0.3310.226.380.735
GRNDVIy = 0.306x + 1.9620.536.880.491
MSRy = 0.121x + 1.5170.4218.300.373
NDVIy = 0.085x + 1.5210.3915.030.497
NRIy = 0.736x + 0.6890.4921.830.332
VARIy = 0.787x + 0.6210.5022.200.311
Table 6. A four-stage combined diagnostic model of nitrogen concentration in summer maize.
Growth StageFour-Stage Combined Diagnostic Model
Multispectral IndexModel
V6GBNDVIy = −1.112ln(x) + 2.963
V10TCARIy = −0.0998x + 2.228
V12NRIy = −5.833x + 4.457
VT-R6MSAVI2y = 2.116x0.879
Publisher’s Note: MDPI stays neutral with regard to jurisdictional claims in published maps and institutional affiliations.

