
Air Pollution Role as Risk Factor of Cardioinhibitory Carotid Hypersensitivity


1
Department of Clinical and Internal Medicine, Anesthesiology and Cardiovascular Sciences, Policlinico Umberto I, “Sapienza” University of Rome, 00185 Rome, Italy
2
Department of Clinical and Molecular Medicine, Sant’ Andrea Hospital, “Sapienza” University of Rome, 00185 Rome, Italy
*
Author to whom correspondence should be addressed.
Atmosphere 2022, 13(1), 123; https://doi.org/10.3390/atmos13010123
Submission received: 27 December 2021
/
Revised: 9 January 2022
/
Accepted: 10 January 2022
/
Published: 12 January 2022
(This article belongs to the Topic Assessing Indoor Pollution and Its Impacts on the Human Health)
Abstract
:Little is known about the impact of air pollution on neuroautonomic system. The authors have investigated possible influence of air pollution and outdoor temperature on the carotid sinus hypersensitivity (CSH), as main cause of neurally mediated syncope in forty-years-old subjects and older. Pollutants’ concentrations and outdoor temperature of days in which 179 subjects with recurrent syncope underwent carotid sinus massage (CSM) were analyzed. Before this manoeuvre, cardiovascular control by short period heart and blood pressure spectral duration of segment between the end of P and R ECG-waves (PeR) were registred; RR variability on the same short period ECG recordings and their spectral coherence were also analyzed. CSH was found in 57 patients (28 with cardioinhibitory response and 29 subjects showed vasodepressor reaction), while 122 subjects had a normal response. CSM performed during high ozone concentrations was associated with slightly higher risk of cardioinhibitory response (odd ratio 1.012, 95% CI 1.001–1.023, p < 0.05), but neither this or other polluting agent nor outdoor temperature seemed to influence autonomic control in basal resting condition. Thus, ozone seemed to influence response to the CSM in CSH patients and it is probably able to facilitate a cardioinhibitory response, perhaps through an increase of nerve acetylcholine release. P→PR coherence could be useful in predicting a sinus cardioinhibitory hypersensitivity in those cases when CSM is contraindicated.
1. Introduction
Air pollution and periods of extremely high outdoor temperature are associated with an increase in both morbidity and mortality [1,2,3], particularly in the elderly and children [4]. In this context, it is known that polluting substances are able to significantly alter cardiovascular autonomic control [5,6,7,8], thus worsening the cardiovascular patients’ condition and facilitating the occurrence of arrhythmias [7,9,10,11].
Little is known about the interactions between air pollution and the autonomic nervous system. Based on previously studied models, it can be assumed that there is an impact on the regulation of the nervous system [7,8,9,10,11].
The manifestation of altered neuroatuonomic regulation par excellence is syncope, which was therefore chosen as a pathological condition to be studied in relation to the concentration of some pollutants in the atmosphere.
Syncope, also known as fainting, is a loss of consciousness and muscle strength characterized by a fast onset, short duration and spontaneous recovery. It is caused by a decrease in blood flow to the brain, typically from low blood pressure. There are sometimes symptoms before the loss of consciousness such as lightheadedness, sweating, pale skin, blurred vision, nausea, vomiting, or feeling warm. In 30% of cases, syncope is neuromediated and, in particular, in young subjects in vasovagal, whereas in elderly it is often determined by carotid sinus hypersensitivity (CSH) [12].
The carotid sinus massage (CSM) is considered the gold standard test to detect CSH in over 40 years old patients in evaluation for syncope. It consists in applying firm and steady pressure to the right or left carotid sinus—not simultaneously—and recording ECG and blood pressure responses. CSH could be vasodepressory (sudden reduction of blood pressure < 30 mmHg), cardioinhibitory (reduction of heart rate under 45 bpm or > 6 s asystole) or both of them in the same moment (rare) [13]. In few cases, CSM is contraindicated, for instance after a recent transient ischemic attack or stroke within the preceding 3 months or clinically significant ipsilateral carotid stenosis or bruit [13].
Some authors [14,15,16] have found a strong relationship between some pollutants, like particulate matter (PM 10 and PM 2.5) [17] and ozone and the cardiovascular system’s modulation. In particular, Kowalska M et al. [14] have shown an increased risk of arrhythmias and stroke even in cases of short-term exposure to these pollutants. Moreover, research in animal models has shown the effect of ozone on cardiac function and on inflammation [16]. Ozone, in particular, seems to have some influence on heart rate variability in elderly [18].
Although an intuitive link might exist between the heat and a neurally mediate syncope (i.e., cutaneous vasodilatation, sweating, dehydration, etc.) [19,20,21], the pathophysiologic link between this clinical feature and air pollution may appear more intricate. Up to now, specific data about the relation between carotid sinus hypersensitivity, air pollution and outdoor temperature are missing.
2. Materials and Methods
Heart rate and blood pressure variability data have been retrospectively analyzed in a large cohort of consecutive outpatients with history of recurrent syncope who had undergone carotid sinus massage, focusing on a possible relationship between outside air pollution and temperature and their CSM response. During registration, we obtained II lead ECG from each patient. Furthermore, we measured the short period standard deviation and spectral coherence of P wave and PR segment in basal condition, hypothesizing a possible specific temporal trend of oscillation of these ECG variables in those subjects with a CSM cardioinibitory response (i.e., sinus arrest or atrioventricular block). In addition, we observed a decrease of spectral coherence between the oscillations of P wave and PR segment in subjects with asystole during head-up tilt [22].
2.1. Study Subjects and Protocol
We retrospectively studied the ECG and systolic blood pressure (SBP) recordings obtained in 179 consecutive outpatients, enrolled from June 2014 to September 2016, in our Syncope Unit at Policlinico Umberto I Hospital, in Rome, Italy. All patients studied were older than 40 years, with a history of recurrent syncope and negative responses to head-up tilt testing with or without pharmacological stimulation and, accordingly, had undergone a CSM in order to complete the work-up for a possible syncope neuroautonomic genesis.
CSM consisted of manual compression with the tips of the second, third and fourth fingers of one hand, at the site of the maximum carotid pulse, between the angle of jaw and the cricoid cartilage on anterior margin of sternocleidomastoid muscle, with face rotated watching the other side. The massage was applied up and down the carotid artery on right and left sides in upright position for 10 s, to allow symptoms to develop. The time interval between two massages had to be long enough in order to restore baseline heart and blood pressure values. Before the CSM, all patients rested for 15 min supine, then a first 5-min ECG recording was obtained during controlled breathing (15 breaths per minute, 0.25 Hz) at rest. All subjects underwent the tests in the same laboratory and with constant temperature (about 24 °C). We excluded patients with previous TIA (transient ischemic attack) or stroke within the 3 past months or history of significant carotid stenosis or patients with complete or incomplete right or left bundle branch blocks. CSM responses were considered positive for carotid sinus hypersensitivity (CSH) if this manoeuvre elicited symptomatic (syncope or presyncope) hypotension (vasodepressory response) with or without bradycardia (cardioinhibitory response) [23,24]. Then, according to the CSM, three different groups were created: subjects with cardionihibitory response whether CSM induced prolonged asystole, defined as R-R intervals lasting at least 3 s (Figure 1a), subjects with vasodepressory response if they showed prevalently hypotension during CSM without asystole (i.e., fallen SBP > 50 mmHg) (Figure 1b) and subjects with no CSM response.
Data of outdoor temperature and humidity, measured on the day of the ECG and blood pressure recording, were directly obtained from an Italian website (www.ilmeteo.it, a free, online database, from June 2014 to September 2016, when patients have been enrolled) while the air pollution data were obtained from the daily report of the regional center of air quality (www.arpalazio.net, always from June 2014 to September 2016), what were considered were those data related to the closest air pollution testing station with respect our laboratory (1 km from Hospital). Weather and polluting agents’ concentration data were the mean of several measurements registered daily. The following pollution air data were considered: carbonmonoxide (mg/m3), ozone (ppb), particulate matter with diameter less than 10 μm (PM10) (μg/m3) and benzene (mg/m3). Conversely, concerning the particulate matter with diameter less than 2.5 μm (PM2.5) (μg/m3), weekly data were used because of the lack of daily data. The research was conducted according to the principles stated in the Declaration of Helsinki. The Ethical Committee of Policlinico Umberto I approved the study. All patients provided their informed consent to using their personal information and data.
2.2. Offline Data Analysis
ECG and beat-to-beat SBP (Finometer™, FMS, Arnhem, The Netherlands) signals were acquired and digitalized with a custom-designed card (National Instruments USB-6008, Austin, TX, USA) at a sampling frequency of 500 Hz. Points used for the ECG segment analysis were detected automatically by a classic adaptive derivative/threshold algorithm. Software for data acquisition, storage and analysis were designed and produced by our research group with the LabView program (National Instruments, Austin, TX, USA). An expert cardiologist (GP) checked the different points and, when needed, manually corrected the possible mistakes, in the automatic point-markers with an interactive software.
The following ECG intervals were obtained: R-R, P (from start to end of P wave), P-R (from the start of P to the R wave), PeR (from end of P to R wave) and P, PeR ratio (Figure 2).
The mean and standard deviation values were measured for each of these intervals and the spectral power expressed was analyzed in normalized (NU). NU were calculated as follows: Low Frequency R-R interval in normalized units (LFRRnu) = Low Frequency (LF) power/[Total Power (TP)−Very Low Frequency (VLF) power] × 100; High Frequency R-R interval (HFRRnu) = High Frequency (HF) power/(TP−VLF power) × 100 [22,25,26,27].
For RR and SBP, the total power (TP) was determined (TP), i.e., total spectral density (from 0 to 0.40 Hz) as well as the following spectral components: a high-frequency (HF) (from 0.15 to 0.4 Hz Eq), a low-frequency (LF) component (from 0.04 to 0.15 Hz Eq) and a very-low-frequency (VLF) component (below 0.04 Hz Eq) [25,26,27]. The spontaneous baroreflex sensitivity was calculated with the alpha (α) index. This method yields two α indexes: α LF (√RR LF: √ SBP LF) and α HF (√ RR HF: √ SBP HF) [28,29]. Finally, the coherence function for the various spectral components was estimated. Coherence expresses the power fraction at a given frequency in an autoregressive algorithm (Figure 3).
The relative value of each spectral power component of RR intervals was also measured either time series and is explained as a linear transformation of the other, thus, measuring the linear association between the two signals. The coherence function γ(f) was then computed according to the formula:
where f is frequency, Pxx [f] is the P interval spectrum, Pyy [f] are the PR or PeR interval spectra and Pxy [f] is the cross spectrum. The coherence function measures the linear interaction between two interval oscillations as a function of their frequency, the coherence function value ranges between zero and one (Figure 4), mean coherences were measured by averaging γ[f] over the frequency bands: from 0 to 0.40 Hz.
γ[f] = Pxy [f]/2/Pxx [f] Pyy [f]
2.3. Statistical Analysis
All data are expressed as means ± SD or as median [25–75th range]. The data were compared between the study groups (CSM cardioinhibitory response versus CSM vasodepressory response + CSM negative response). One-way analysis of variance (ANOVA) and Bonferroni tests were used to compare data for the normally distributed variables. The Kruskal-Wallis and the Mann-Whitney test were used to compare non-normally distributed variables (as evaluated by Kolmogorov-Smirnov test). Categorical variables were analyzed with the χ2 test. To assess the difference between the effect of polluting agents on CSM, the subjects were grouped according to high and low levels of each single polluting agents. Equal to or higher than the 75th percentile was arbitrarily chosen as the cut-off in considering each polluting agent. In addition, we compared for all the polluting agents the prevalence of CSM with the χ2 test.
An initial sample size analysis of 179 observations was performed with a confidence interval of 99.9% and a margin of error of 1%.
Subjects with a positive response also repeated the CSM on a day with low level of polluting agents to assess the influence of pollution on CSM response. The χ2 test was also used in this case. A multivariable logistic regression analysis was used to determine which clinical, atmospheric or air pollution variables were independently associated with the probability of having a positive CSM. Stepwise multiple regression analysis was used to determine possible relationships between the studied variables. Receiver operating characteristic (ROC) curves were used to determine the optimal threshold spectral and non-spectral values for positive CSM and areas under ROC curves and 95% confidence intervals (CI) were calculated to compare the predicative efficiencies. p values of less than or equal to 0.05 were considered statistically significant.
3. Results
In the analysis of the data of 179 subjects, 28 subjects showed a cardioinhibitory response to the CSM, 29 a vasodepressory response and 122 had no significant CSM reaction (Table 1).
No difference between groups was found with respect the general characteristics, drug therapy, air pollution, or weather data (Table 2).
Only the group studied on days with high ozone level showed a significant prevalence of cardioinhibitory response to CSM (p < 0.05) (Table 3).
3.1. Carotid Sinus Hypersensitivity: The Cardioinhibitory Responses
Within the CSM cardioinhibitory response group, 18 subjects showed right carotid sinus hypersensitivity, while within the CSM vasodepressory response group, 26 subjects had both left and right carotid sinus hypersensitivity and only three an isolated left carotid sinus hypersensitivity. Sixteen subjects with positive cardioinhibitory response to CSM showed sinus arrest followed by normal sinus rhythm restoration; in nine patients, the sinus arrest was followed by junctional rhythm and in one subject, by idioventricular rhythm; finally, three subjects had complete atrioventricular block. On the contrary, only five subjects with vasodepressory response reported a sinus arrest followed by junctional rhythm and one atrioventricular complete block during CSM, but their RR intervals were less than 3 s. The cardioinhibitory group showed longer RR intervals during CSM in comparison with the other two study groups (RR length: cardiohinibitory group 4.6 ± 2.0 s; vasodepressory group 1.6 ± 0.6 s; negative CSM response 1.0 ± 0.3 s, p < 0.001) as well the vasodepressory group showed a significant higher lengthening of RR intervals than the negative CSM group (p < 0.05). The PP intervals during CSM showed similar differences in behavior between groups (cardioinhibitory response, PP: 5.6 ± 2.8 s, p < 0.001; vasodepressory response, PP: 2.5 ± 2.4 s, p < 0.001; normal response: 1.1 ± 0.9 s, p < 0.05). The vasodepressory group (systolic blood pressure (SBP): 66 ± 16 mm Hg/diastolic blood pressure (DBP): 44 ± 12 mm Hg) showed a significantly lower blood pressure during CSM than the other study groups (cardioinhibitory response SBP: 73 ± 22 mm Hg/DBP: 47 ± 15 mm Hg, p < 0.05; normal response SBP120 ± 22 mm Hg/DBP: 74 ± 16 mm Hg, p < 0.001).
Fifteen patients with cardioinhibitory and 15 with vasodepressory response repeated the CSM in a low concentration pollution day and consequently we had a reduction of cardioinhibitory response CSM from 32 to 17% (χ2: 4.98, p < 0.05).
3.2. ECG Data
All data for P wave P-R, PeR and RR intervals calculated during controlled breathing (Table 2 and Table 3) were similar in the study groups except for PeR standard deviation, P→PR and P→PeR spectral coherences (Table 4). Particularly, we found a significant lower PeR standard deviation for subjects with cardioinhibitory response at CSM in comparison with normal responses (p < 0.05) (Table 4). The same group showed also lower P→PeR spectral coherences than the other two groups (p < 0.001) (Table 3). Finally, P→PR was higher in the group with cardioinhibitory response than in both groups with vasodepressory and normal response (p < 0.001) (Table 4). No differences were observed between the three study groups for RR and SBP spectral data (Table 5).
3.3. Pollution
With regard to air pollution data, multivariate logistic regression analysis identified ozone as an independent predictor of cardioinhibitory response after CSM (B: 0.012, odd ratio 1.012, 95% CI 1.001–1.023, p < 0.05). The other polluting agents and weather data were not associated with cardioinhibitory response. The increase of following variables was associated with both pattern of CSM response: R-R mean (β: 0.005, odd ratio 1.005, 95% CI 1.001–1.001, p < 0.05), αLF (β: 0.211, odd ratio 1.235, 95% CI 1.033–1.475, p < 0.05). The decrease of the remaining variables was predictive of CSM results: SBP mean (β: −0.016, odd ratio 0.984, 95% CI 0.968–1.000, p < 0.05), αHF (β: −0.256, odd ratio 1.235, 95% CI 0.668–0.896, p < 0.05), PeR standard deviation (β: −0.355, odd ratio 0.701, 95% CI 0.523–0.940, p < 0.05).
The possible influence of autonomic nervous control on sinus node or atrioventricular activity and the correlation between P→PR or P→PeR coherences (dependent variable) and the different spectral components (independent variables: ln TPRR, ln VLFRR, ln LFRR, ln HFRR, ln LF/HF, LFRRnu, HFRRnu) were also studied. Only the subjects with cardioinhibitory response during CSM showed some significant relationships between these variables. Particularly, we found a significant positive relationship between P→PR coherence and ln HFRR (r: 0.490; r2: 0.241; p: 0.008) (Figure 5) and between P→PeR coherence (r: 0.390; r2: 0.152; p: 0.04) and always the same ln HFRR (β:−0.050, p: 0.04), the latter relationship was negative and slightly weak.
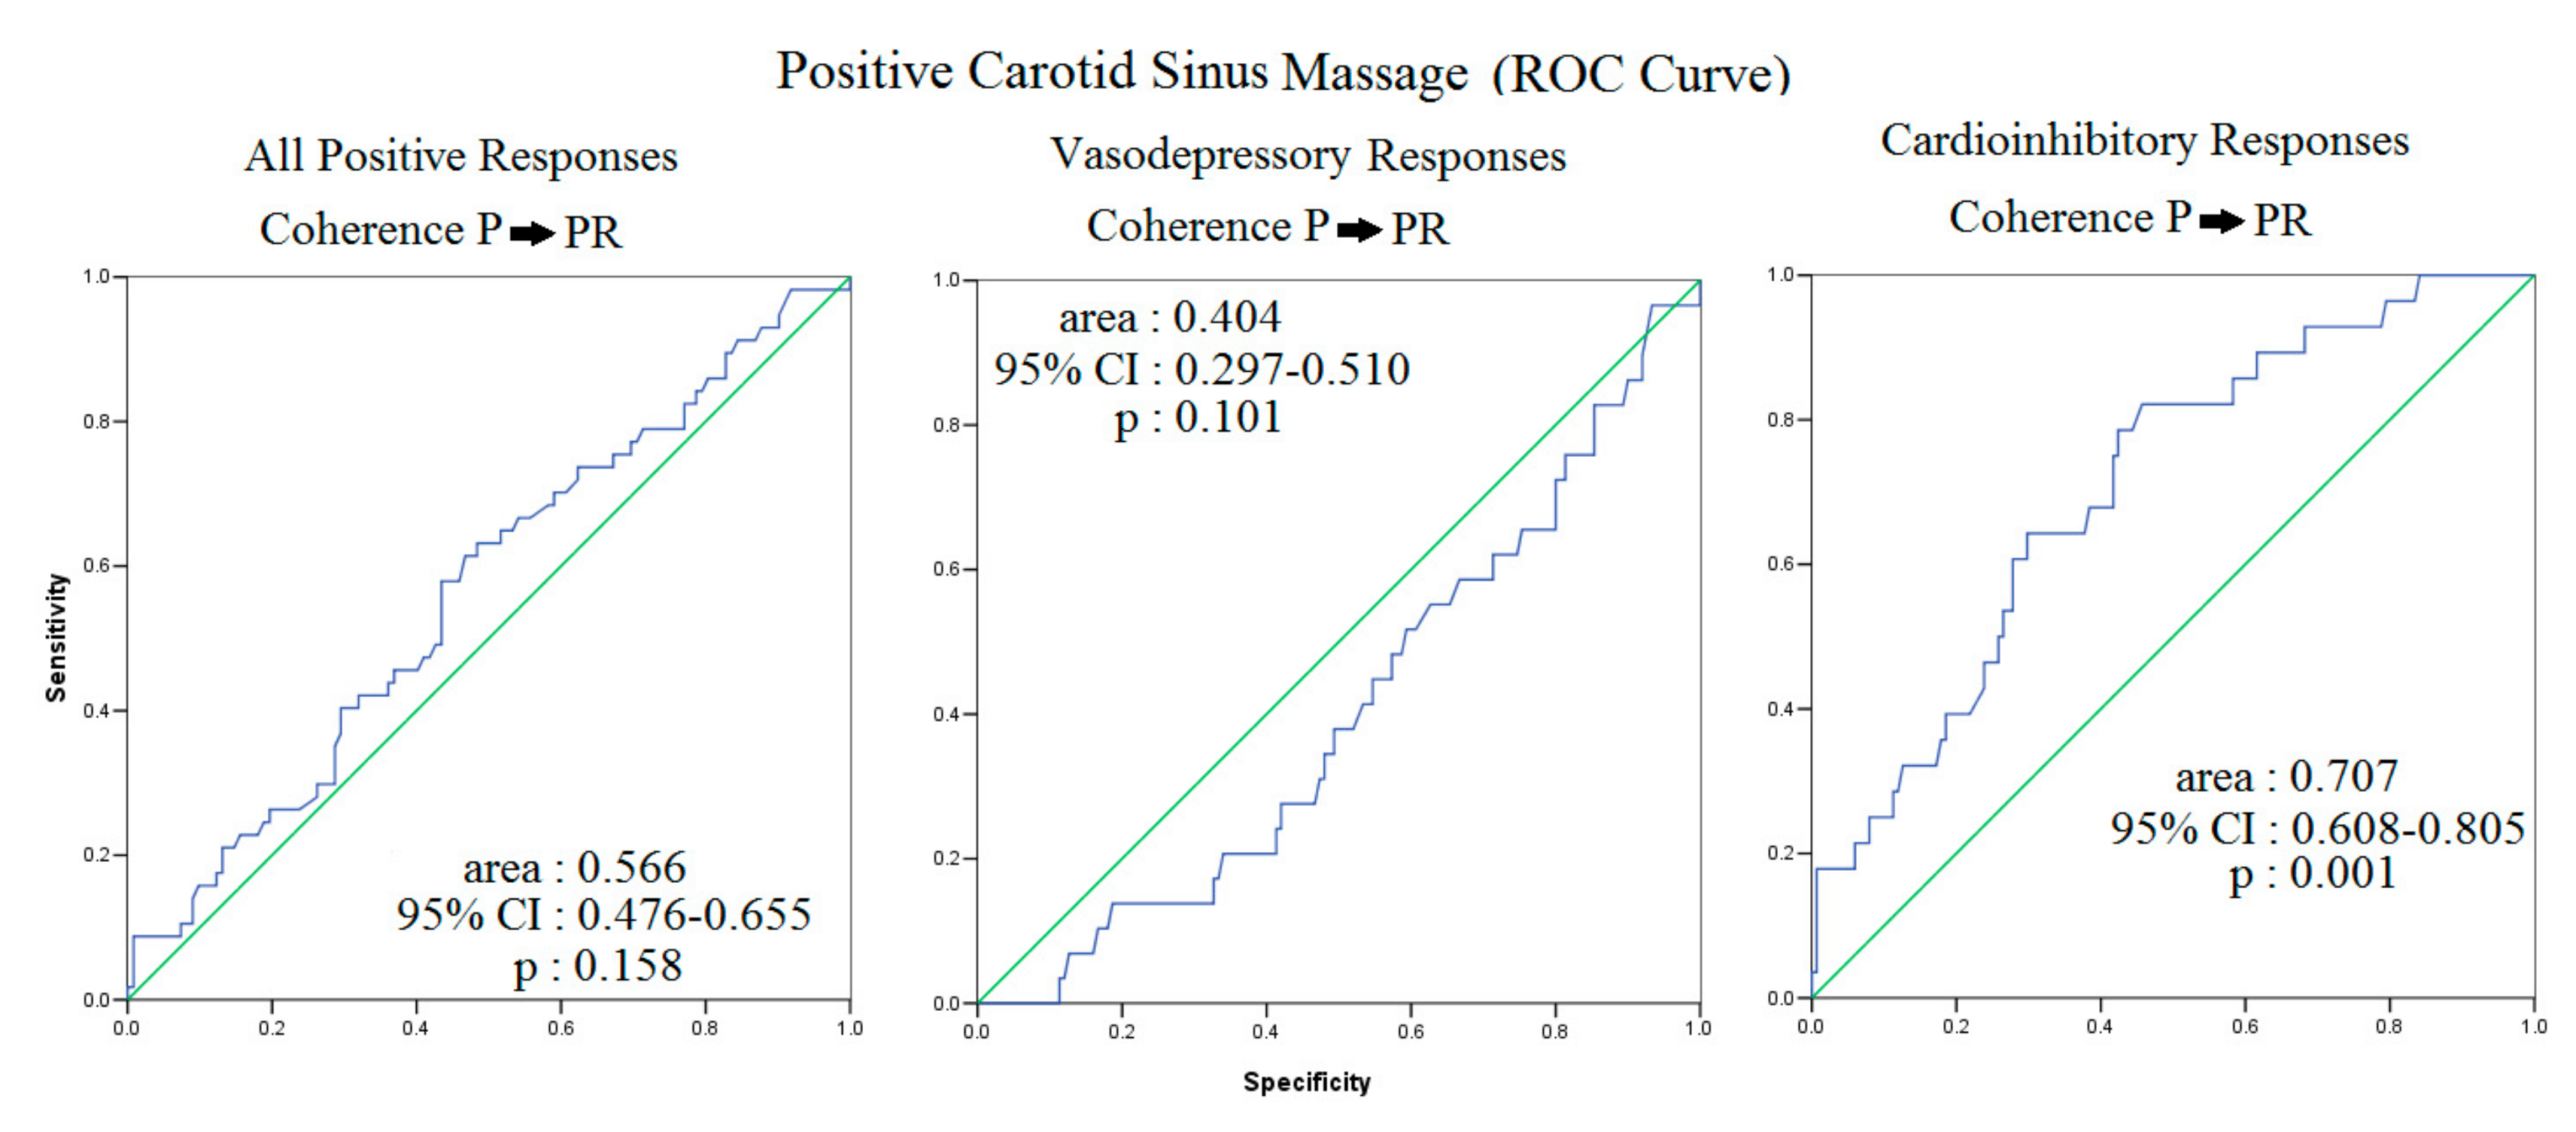
In the other two groups, the multiple regression analysis did not show any significant relationship between P→PR coherence and spectral data. Finally, the ROC curve analysis showed that P→PR had better sensitivity and specificity for predicating positive cardioinhibitory response to the CSM (Figure 6).
4. Discussion
The present retrospective study supplied three original findings: first, a possible association between ozone levels and a CSM cardioinhibitory response in patients with a neutrally mediated syncope; second, a significant association between some spectral and nonspectral variables and a positive CSM response; third, a significantly higher increase of P→PR coherence and decrease of P→PeR coherence in those subjects with cardioinhibitory response with respect those with a CSM vasodepressory or a negative response.
4.1. Ozone and RR, PR and P Wave Variability
In demonstrating a significant correlation between ozone concentration and cardioinhibitory response to CSM in patients aged more than 40 years old with known syncope anamnesis, these data suggest that the different pathological response to CSM and maybe the associated syncope, may be influenced by high ozone atmospheric levels or other factors. In other words, it is possible that patients with a remarkable predisposition could develop a different CSM response depending on changing external conditions (pollution, temperature, humidity) or varying clinical characteristics (volemia, drugs, psychological status). Remarkably, only a CSM cardioinhibitory response in patients with history of recurrent syncope represents a real indication for a pacemaker implantation. In such a context, our data suggest that this therapeutic choice could be misleadingly influenced by the atmospheric ozone levels. Conversely, although well demonstrated that the CSM vasodepressory response is influenced by the maximum external temperature [21], it should be considered a possible underestimation of CSM cardioinhibitory responses in this environmental condition.
From a pathophysiological viewpoint, we do not know the ozone threshold capable of influencing the carotid sinus baroreflex and we have not clearly studied and explained its underlying causes [30,31]. Albeit speculative, the structures involved are thought to be afferent nervous fibers (glossopharyngeal nerve), truncus encephalic nuclei (nucleus tractus solitarius, ambiguous nucleus, dorsal vagal nucleus, etc.), or afferent nerve fiber (vagus nerve). However, our study offers no explanation about this point. We know from previous observations that ozone could interfere with the autonomic nervous system function [32], particularly in the elderly [18]. Indeed, it could alter heart rate variability [8], it could promote the onset of ventricular arrhythmias [33] and could increase the risk of sudden cardiac death [11] as well as of stroke [34]. Whereas these observations agree with our results—which emphasized the danger of the exposition to this polluting agent—any variations with respect to spectral components of RR-interval, blood pressure, α indexes in relation to ozone levels or to different study groups did not find agreement. Nonetheless, the differences between our results and those of previous studies could easily be explained by thinking about the different study techniques of HRV acquisition (i.e., HRV on 24-h ECG recordings without controlled breathing versus 5 min short-term HRV power spectral analysis during controlled breathing). Another possible reason underlying the lack of a significant relationship between ozone and autonomic nervous system activity in our study could be due to the fact that ozone does not induce a chronic improvement of vagal activity. Indeed, it could be responsible for the sensitization of patient during slight stimulations, inducing exaggerated, reflex, cardiac responses. Furthermore, some milestone studies conducted in animal models [35,36,37,38] have demonstrated an exaggerated parasympathetic response to ozone. The key to this problem could reside in the synaptic space instead of the whole autonomic nervous system. In fact, this polluting agent can cause oxidative stress and inflammation [39] and could increase achetylcholine release, induced by the inhibition of M2 receptors on presynaptic side of parasympathetic ganglia 24 h after its inhalation [32], amplifying a cardioinhibitory response (sinus arrest and atrioventricular block) just in the presence of an external or endogenous (blood pressure) trigger, without detectable vagal control modifications. However, the controlled breathing technique used during registration probably induced only a slight vagal stimulation [26], not strong enough to detect a difference caused by ozone. Conversely, a vasodepressory response could not be induced because of the absence of M2 receptors on parasympathetic terminations on arteriolar vessels. Moreover, the inflammation is not capable, at rest, of influencing the sympathetic activity of smooth muscles of arteriolar vessels [40]. Nevertheless, the hypothesis of M2 receptors involvement in vivo has to be evaluated.
4.2. RR, P Wave, PR Segment, SBP and Sinus Hypersensitivity
As the carotid sinus hypersensitivity diagnosis is easy to obtain (requiring just an electrocardiograph, a beat-to-beat arterial pressure evaluator and an operator capable of performing the maneuver), the need to seek alternative tests or markers was not felt. The availability of ECG recorders (both implantable and not implantable—with either long or medium recordable capability), as well as telemonitoring devices, has increased the possibility to detect the syncopal event, but these wide opportunities have complicated the choice of the correct diagnostic tools. The CSM has to be considered the gold standard and the first diagnostic maneuver in the elderly, after exclusion of cardiac causes, even if it has low specificity, as it can be positive even in healthy subjects without syncope history [41]. Nevertheless, before a loop recorder implantation, a CSM has to be performed in order to detect carotid sinus hypersensitivity, in patients without intense carotid bruits, stroke, TIA or myocardial infarction in the past 3 months. In this case, the maneuver could help clinicians detect carotid sinus hypersensitivity avoiding loop recorder implantation. In particular, in our study it was observed that the increase of medium RR interval and the reduction of systolic blood pressure, in a beat to beat 5 min registration at rest and during controlled breathing, are two simply detectable risk factors for carotid sinus hypersensitivity. Considering markers which mirror the baroreflex sensitivity or the atrio-ventricular conduction, the increase of αLF, the decrease of αHF and PeR standard deviation are equally predictive for carotid sinus hypersensitivity diagnosis. Otherwise, these indexes are not able to distinguish the CSM response, so they are only slightly useful for treatment choice. The most promising indexes seem to be P→PR and P→PeR coherences, but specific studies have to be performed to confirm preliminary data. In particular, P→PR coherence has demonstrated a good profile from the sensitivity and specificity points of view, deserving more evaluations in a prospective study. In all, the importance of a non-invasive marker of syncope, from ECG, is clear: easily obtainable, transmittable and cheap, in particular in patients who cannot undergo CSM.
4.3. Possible Pathophysiologic Meaning of P→PR and P→PeR Coherence
The pathophysiologic meaning of the P→PR increase and of the reduction of P→PeR coherence remain unknown. This pattern could be elicited by the same physiological pathway. From a descriptive point of view, it means that the P wave oscillations and PR interval have similar temporal characteristics in subjects with tendency to carotid sinus syndrome. On the other hand, a specular behavior of P→PeR has been observed, meaning that the oscillations of P wave and of PeR do not have a temporal coherence. Notably, PeR segment derives from the electric conduction of atrioventricular node and Hiss bundle. The only observation that seems more likely interpretable is that P→PR is the only marker significantly related to high frequency (sinusal vagal activation) not exclusively in subjects with carotid sinus syndrome with cardiohinibitory response. This fact could be associated to a vagal hyperactivation just in this group of subjects. Remarkably, 25 of 28 patients (90%) showed a sinusal arrest and just 3 of them a third-degree AV block. Therefore, we can imagine that the sinusal vagal activity could be the one more involved in the carotid sinus hypersensitivity. Similar results were obtained in animal models [35,36,37,38]. Finally, we found the opposite behavior of P→PR in subjects with and without asystole during head-up tilt, but we observed surprisingly a reduction of P→PR in subjects with asystole. In other words, during vasovagal syncope in younger subjects a lower P→PR coherence was noted, instead in the present study we have reported an increase of the same parameter in older subjects with cardioinhibitory response during carotid sinus massage. Both of maneuvers induce a strong vagal stimulation, but the pattern of P→PR seems to be completely opposite under the same study condition for both subject types with high vagal reflex responses.
The causes of this apparent discrepancy are unknown but likely the different P→PR data are attributable to different population of two studies: particularly the two study groups showed a different age and, furthermore, two examined clinic conditions could have two unlike basal autonomic regulation of sinus and atrioventricular nodes.
5. Conclusions
All considered, high ozone concentration in the atmosphere could alter the CSM responses, increasing the cardiohinibitory ones. This evidence should be confirmed in a larger trial in order to obtain more reliable data and an ozone concentration cut off (if possible). Moreover, P→PR coherence, evaluated during a simple ECG study, could be useful in predicting a sinus cardioinhibitory hypersensitivity in those cases when CSM is contraindicated. Thus, this study confirms the well-known relationship between autonomic nervous system and the ozone concentration, providing future perspective in the CSM responses and pacemaker implementations in clinical settings
These preliminary data on human need to be supported in larger populations and at different climate conditions and pollutants concentrations in order to better clarify the link between these polluting agents and autonomic nervous system. Although, this study is speculative, however, understanding the relationships between pollutants and the autonomic nervous system and their impact on cardiovascular health is now of primary importance, as polluting substances are able to significantly alter cardiovascular autonomic control [5,6,7,8] and worsening the cardiovascular patients’ condition, triggering arrhythmias [7,9,10,11]. This is a single center study. The assessment a multicenter observational study should be performed in near future.
Author Contributions
Conceptualization, G.P. and F.M.; methodology, G.P.; software, G.P.; validation, G.P. and F.M.; formal analysis, G.P.; investigation, F.M. and D.M.; data curation, F.M.; writing—original draft preparation, G.P. and F.M.; writing—review and editing, D.M.; visualization, G.P., F.M. and D.M.; supervision, G.P. All authors have read and agreed to the published version of the manuscript.
Funding
This research has not received any financial support by private or public institutions.
Institutional Review Board Statement
Policlinico Umberto I Ethical Committee was informed and approved the retrospective and descriptive use of the registry.
Informed Consent Statement
All patients at the moment of the test signed an informed consent, aware that their clinical information could be analyzed anonymously at any time.
Data Availability Statement
All data, materials, and codes used in this study are available upon request from the corresponding author.
Conflicts of Interest
The authors wish to declare that there are no competing interests regarding the publication of this article.
References
- Mustafić, H.; Jabre, P.; Caussin, C.; Murad, M.H.; Escolano, S.; Tafflet, M.; Périer, M.-C.; Marijon, E.; Vernerey, D.; Empana, J.-P.; et al. Main Air Pollutants and Myocardial Infarction. JAMA J. Am. Med Assoc. 2012, 307, 713–721. [Google Scholar] [CrossRef]
- Shah, A.S.V.; Langrish, J.P.; Nair, H.; McAllister, D.A.; Hunter, A.L.; Donaldson, K.; Newby, D.E.; Mills, N.L. Global association of air pollution and heart failure: A systematic review and meta-analysis. Lancet 2013, 382, 1039–1048. [Google Scholar] [CrossRef] [Green Version]
- Fouillet, A.; Rey, G.; Wagner, V.; Laaidi, K.; Empereur-Bissonnet, P.; Le Tertre, A.; Frayssinet, P.; Bessemoulin, P.; Laurent, F.; De Crouy-Chanel, P.; et al. Has the impact of heat waves on mortality changed in France since the European heat wave of summer 2003? A study of the 2006 heat wave. Int. J. Epidemiol. 2008, 37, 309–317. [Google Scholar] [CrossRef]
- Newby, D.E.; Mannucci, P.M.; Tell, G.S.; Baccarelli, A.; Brook, R.D.; Donaldson, K.; Forastiere, F.; Franchini, M.; Franco, O.; Graham, I.; et al. Expert position paper on air pollution and cardiovascular disease. Eur. Heart J. 2014, 36, 83–93. [Google Scholar] [CrossRef] [Green Version]
- Perez, C.M.; Hazari, M.S.; Farraj, A.K. Role of Autonomic Reflex Arcs in Cardiovascular Responses to Air Pollution Exposure. Cardiovasc. Toxicol. 2015, 15, 69–78. [Google Scholar] [CrossRef] [PubMed]
- Lee, M.-S.; Eum, K.-D.; Fang, S.C.; Rodrigues, E.G.; Modest, G.A.; Christiani, D.C. Oxidative stress and systemic inflammation as modifiers of cardiac autonomic responses to particulate air pollution. Int. J. Cardiol. 2014, 176, 166–170. [Google Scholar] [CrossRef] [Green Version]
- Meo, S.A.; Suraya, F. Effect of environmental air pollution on cardiovascular diseases. Eur. Rev. Med. Pharmacol. Sci. 2015, 19, 4890–4897. [Google Scholar] [PubMed]
- Arjomandi, M.; Wong, H.; Donde, A.; Frelinger, J.; Dalton, S.; Ching, W.; Power, K.; Balmes, J.R. Exposure to medium and high ambient levels of ozone causes adverse systemic inflammatory and cardiac autonomic effects. Am. J. Physiol. Circ. Physiol. 2015, 308, H1499–H1509. [Google Scholar] [CrossRef] [PubMed]
- Fiordelisi, A.; Piscitelli, P.; Trimarco, B.; Coscioni, E.; Iaccarino, G.; Sorriento, D. The mechanisms of air pollution and particulate matter in cardiovascular diseases. Hear. Fail. Rev. 2017, 22, 337–347. [Google Scholar] [CrossRef]
- Zhao, A.; Chen, R.; Kuang, X.; Kan, H. Ambient Air Pollution and Daily Outpatient Visits for Cardiac Arrhythmia in Shanghai, China. J. Epidemiol. 2014, 24, 321–326. [Google Scholar] [CrossRef] [Green Version]
- Raza, A.; Bellander, T.; Bero-Bedada, G.; Dahlquist, M.; Hollenberg, J.; Jonsson, M.; Lind, T.; Rosenqvist, M.; Svensson, L.; Ljungman, P.L. Short-term effects of air pollution on out-of-hospital cardiac arrest in Stockholm. Eur. Heart J. 2014, 35, 861–868. [Google Scholar] [CrossRef] [Green Version]
- Piccirillo, G.; Moscucci, F.; Magrì, D. Syncope: Physiopathology, diagnosis and therapy. La Clin. Ter. 2015, 166, e216–e233. [Google Scholar]
- Pasquier, M.; Clair, M.; Pruvot, E.; Hugli, O.; Carron, P.-N. Carotid Sinus Massage. N. Engl. J. Med. 2017, 377, e21. [Google Scholar] [CrossRef] [PubMed]
- Galli, A.; Barbic, F.; Borella, M.; Costantino, G.; Perego, F.; Dipaola, F.; Casella, F.; Duca, P.G.; Diedrich, A.; Raj, S.; et al. Influence of Climate on Emergency Department Visits for Syncope: Role of Air Temperature Variability. PLoS ONE 2011, 6, e22719. [Google Scholar] [CrossRef] [Green Version]
- Alexander, P. Association of monthly frequencies of diverse diseases in the calls to the public emergency service of the city of Buenos Aires during 1999–2004 with meteorological variables and seasons. Int. J. Biometeorol. 2012, 57, 83–90. [Google Scholar] [CrossRef]
- Piccirillo, G.; Moscucci, F.; Pascucci, M.; Di Barba, D.; Montesanti, D.; Magrí, D. Effects of weather on neurally mediated syncope tests. Int. J. Cardiol. 2014, 176, 1411–1413. [Google Scholar] [CrossRef]
- Kowalska, M.; Kocot, K. Short-term exposure to ambient fine particulate matter (PM2.5 and PM10) and the risk of heart rhythm abnormalities and stroke. Postepy Hig. Med. Dosw. (Online) 2016, 70, 1017–1025. [Google Scholar] [CrossRef]
- Shutt, R.H.; Kauri, L.M.; Weichenthal, S.; Kumarathasan, P.; Vincent, R.; Thomson, E.M.; Liu, L.; Mahmud, M.; Cakmak, S.; Dales, R. Exposure to air pollution near a steel plant is associated with reduced heart rate variability: A randomised crossover study. Environ. Health 2017, 16, 4. [Google Scholar] [CrossRef] [PubMed] [Green Version]
- Wang, G.; Jiang, R.; Zhao, Z.; Song, W. Effects of ozone and fine particulate matter (PM2.5) on rat system inflammation and cardiac function. Toxicol. Lett. 2013, 217, 23–33. [Google Scholar] [CrossRef] [PubMed]
- Lim, Y.-H.; Bae, H.-J.; Yi, S.-M.; Park, E.; Lee, B.-E.; Hong, Y.-C. Vascular and cardiac autonomic function and PM2.5 constituents among the elderly: A longitudinal study. Sci. Total Environ. 2017, 607–608, 847–854. [Google Scholar] [CrossRef]
- Jia, X.; Song, X.; Shima, M.; Tamura, K.; Deng, F.; Guo, X. Acute effect of ambient ozone on heart rate variability in healthy elderly subjects. J. Expo. Sci. Environ. Epidemiol. 2011, 21, 541–547. [Google Scholar] [CrossRef] [PubMed]
- Piccirillo, G.; Moscucci, F.; Fiorucci, C.; Di Iorio, C.; Mastropietri, F.; Magrì, D. Time- and frequency domain analysis of beat to beat P-wave duration, PR interval and RR interval can predict asystole as form of syncope during head-up tilt. Physiol. Meas. 2016, 37, 1910–1924. [Google Scholar] [CrossRef] [Green Version]
- Epstein, A.E.; DiMarco, J.P.; Ellenbogen, K.A.; Estes, N.M.; Freedman, R.A.; Gettes, L.S.; Gillinov, A.M.; Gregoratos, G.; Hammill, S.C.; Hayes, D.L.; et al. 2012 ACCF/AHA/HRS Focused Update Incorporated Into the ACCF/AHA/HRS 2008 Guidelines for Device-Based Therapy of Cardiac Rhythm Abnormalities. Circulation 2013, 127, e283–e352. [Google Scholar] [CrossRef] [PubMed]
- Lopes, R.; Gonçalves, A.; Campos, J.; Frutuoso, C.; Silva, A.; Touguinha, C.; Freitas, J.; Maciel, M.J. The role of pacemaker in hypersensitive carotid sinus syndrome. Europace 2010, 13, 572–575. [Google Scholar] [CrossRef]
- Piccirillo, G.; Ogawa, M.; Song, J.; Chong, V.J.; Joung, B.; Han, S.; Magrì, D.; Chen, L.S.; Lin, S.-F.; Chen, P.-S. Power spectral analysis of heart rate variability and autonomic nervous system activity measured directly in healthy dogs and dogs with tachycardia-induced heart failure. Heart Rhythm. 2009, 6, 546–552. [Google Scholar] [CrossRef] [PubMed] [Green Version]
- Task Force of the European Society of Cardiology and the North American Society of Pacing and Electrophysiology. Heart rate variability: Standards of measurement, physiological interpretation and clinical use. Circulation 1996, 93, 1043–1065. [Google Scholar] [CrossRef] [Green Version]
- Magrì, D.; Sciomer, S.; Fedele, F.; Gualdi, G.; Casciani, E.; Pugliese, P.; Losardo, A.; Ferrazza, G.; Pasquazzi, E.; Schifano, E.; et al. Increased QT variability in young asymptomatic patients with β-thalassemia major. Eur. J. Haematol. 2007, 79, 322–329. [Google Scholar] [CrossRef]
- Piccirillo, G.; Cacciafesta, M.; Viola, E.; Santagada, E.; Nocco, M.; Lionetti, M.; Bucca, C.; Moisè, A.; Tarantini, S.; Marigliano, V. Influence of aging on cardiac baroreflex sensitivity determined non-invasively by power spectral analysis. Clin. Sci. 2001, 100, 267–274. [Google Scholar] [CrossRef]
- Piccirillo, G.; Di Giuseppe, V.; Nocco, M.; Lionetti, M.; Moisè, A.; Naso, C.; Tallarico, D.; Marigliano, V.; Cacciafesta, M.; Moisè, A. Influence of aging and other cardiovascular risk factors on baroreflex sensitivity. J. Am. Geriatr. Soc. 2001, 49, 1059–1065. [Google Scholar] [CrossRef]
- Sutton, R. Carotid sinus syndrome: Progress in understanding and management. Glob. Cardiol. Sci. Pract. 2014, 2014, 18. [Google Scholar] [CrossRef]
- Amin, V.; Pavri, B.B. Carotid Sinus Syndrome. Cardiol. Rev. 2015, 23, 130–134. [Google Scholar] [CrossRef] [PubMed]
- Yost, B.L.; Gleich, G.J.; Jacoby, D.B.; Fryer, A.D. The changing role of eosinophils in long-term hyperreactivity following a single ozone exposure. Am. J. Physiol. Cell. Mol. Physiol. 2005, 289, L627–L635. [Google Scholar] [CrossRef]
- Rich, D.Q.; Schwartz, J.; Mittleman, M.; Link, M.; Luttmann-Gibson, H.; Catalano, P.J.; Speizer, F.E.; Dockery, D.W. Association of Short-term Ambient Air Pollution Concentrations and Ventricular Arrhythmias. Am. J. Epidemiol. 2005, 161, 1123–1132. [Google Scholar] [CrossRef] [PubMed]
- Lisabeth, L.D.; Escobar, J.D.; Dvonch, J.T.; Sánchez, B.N.; Majersik, J.J.; Brown, D.; Smith, M.A.; Morgenstern, L.B. Ambient air pollution and risk for ischemic stroke and transient ischemic attack. Ann. Neurol. 2008, 64, 53–59. [Google Scholar] [CrossRef] [Green Version]
- Uchiyama, I.; Simomura, Y.; Yokoyama, E. Effects of acute exposure to ozone on heart rate and blood pressure of the conscious rat. Environ. Res. 1986, 41, 529–537. [Google Scholar] [CrossRef]
- Vaughan, T.R., Jr.; Moorman, W.J.; Lewis, T.R. Cardiopulmonary effects of acute exposure to ozone in the dog. Toxicol. Appl. Pharmacol. 1971, 20, 404–411. [Google Scholar] [CrossRef]
- Watkinson, W.P.; Campen, M.J.; Nolan, J.P.; Costa, D.L. Cardiovascular and systemic responses to inhaled pollutants in rodents: Effects of ozone and particulate matter. Environ. Health Perspect. 2001, 109, 539–546. [Google Scholar] [CrossRef] [Green Version]
- Gordon, T.; Taylor, B.F.; Amdur, M.O. Ozone Inhibition of Tissue Cholinesterase in Guinea Pigs. Arch. Environ. Health Int. J. 1981, 36, 284–288. [Google Scholar] [CrossRef]
- Chuang, K.-J.; Chan, C.-C.; Su, T.-C.; Lee, C.-T.; Tang, C.-S. The Effect of Urban Air Pollution on Inflammation, Oxidative Stress, Coagulation, and Autonomic Dysfunction in Young Adults. Am. J. Respir. Crit. Care Med. 2007, 176, 370–376. [Google Scholar] [CrossRef] [PubMed]
- Tank, J.; Biller, H.; Heusser, K.; Holz, O.; Diedrich, A.; Framke, T.; Koch, A.; Grosshennig, A.; Koch, W.; Krug, N.; et al. Effect of Acute Ozone Induced Airway Inflammation on Human Sympathetic Nerve Traffic: A Randomized, Placebo Controlled, Crossover Study. PLoS ONE 2011, 6, e18737. [Google Scholar] [CrossRef] [Green Version]
- Krediet, C.T.P.; Parry, S.W.; Jardine, D.L.; Benditt, D.G.; Brignole, M.; Wieling, W. The history of diagnosing carotid sinus hypersensitivity: Why are the current criteria too sensitive? Europace 2011, 13, 14–22. [Google Scholar] [CrossRef] [PubMed]
Figure 1.
(a,b). Representative ECG and systolic blood pressure (SBP) recordings during carotid sinus massage in two patients with carotid sinus hyper sensibility with cardioinhibitory (a) and vasodepressive response (b). Panel A shows the recording sinus arrest, asystole, recovery of sinus electrical activity with complete atrioventricular block (between 83th and 85th s) and junctional rhythm, at the end (after 87th s) recovery of normal electrical activity and systole. Panel B shows the recording with reduction of blood pressure (from 150/80 to 75/50 mmHg) during carotid sinus massage without asystole.
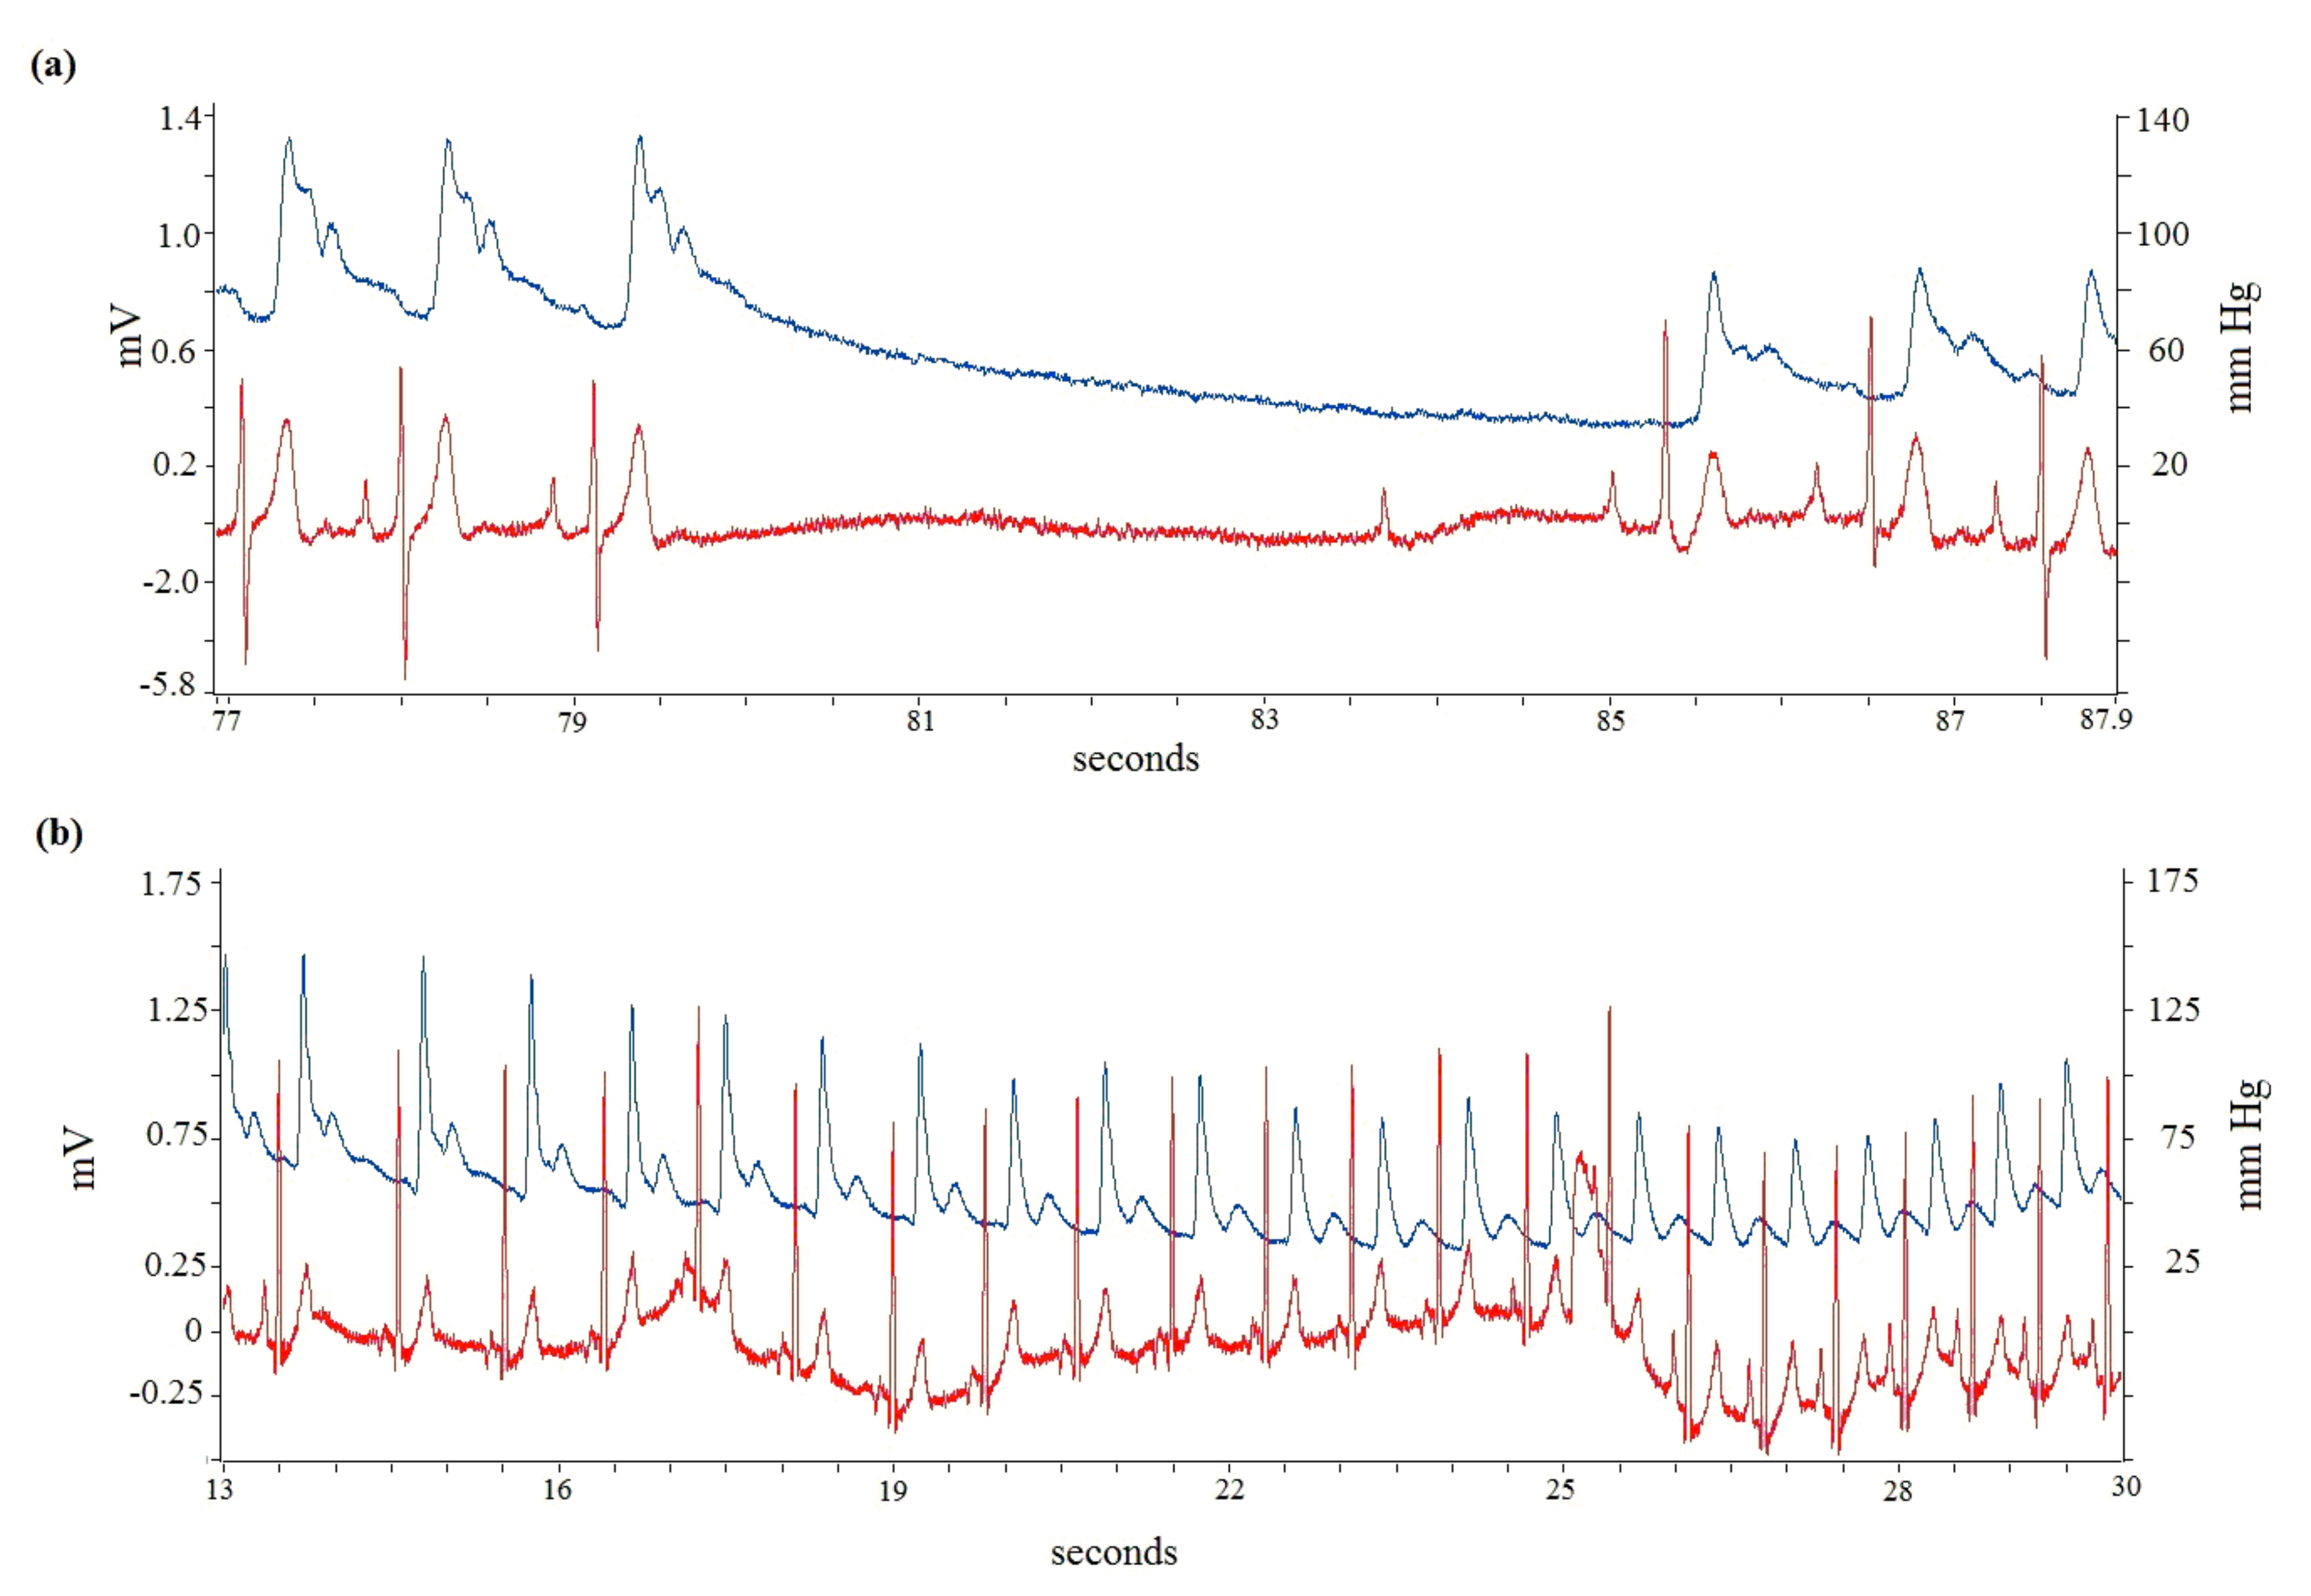
Figure 2.
RR, P wave (the intervals between the start and end of P wave), PR (from the start of P wave to the peak of R wave) and PeR (between the end of P wave and the peak of R wave).
Figure 2.
RR, P wave (the intervals between the start and end of P wave), PR (from the start of P wave to the peak of R wave) and PeR (between the end of P wave and the peak of R wave).
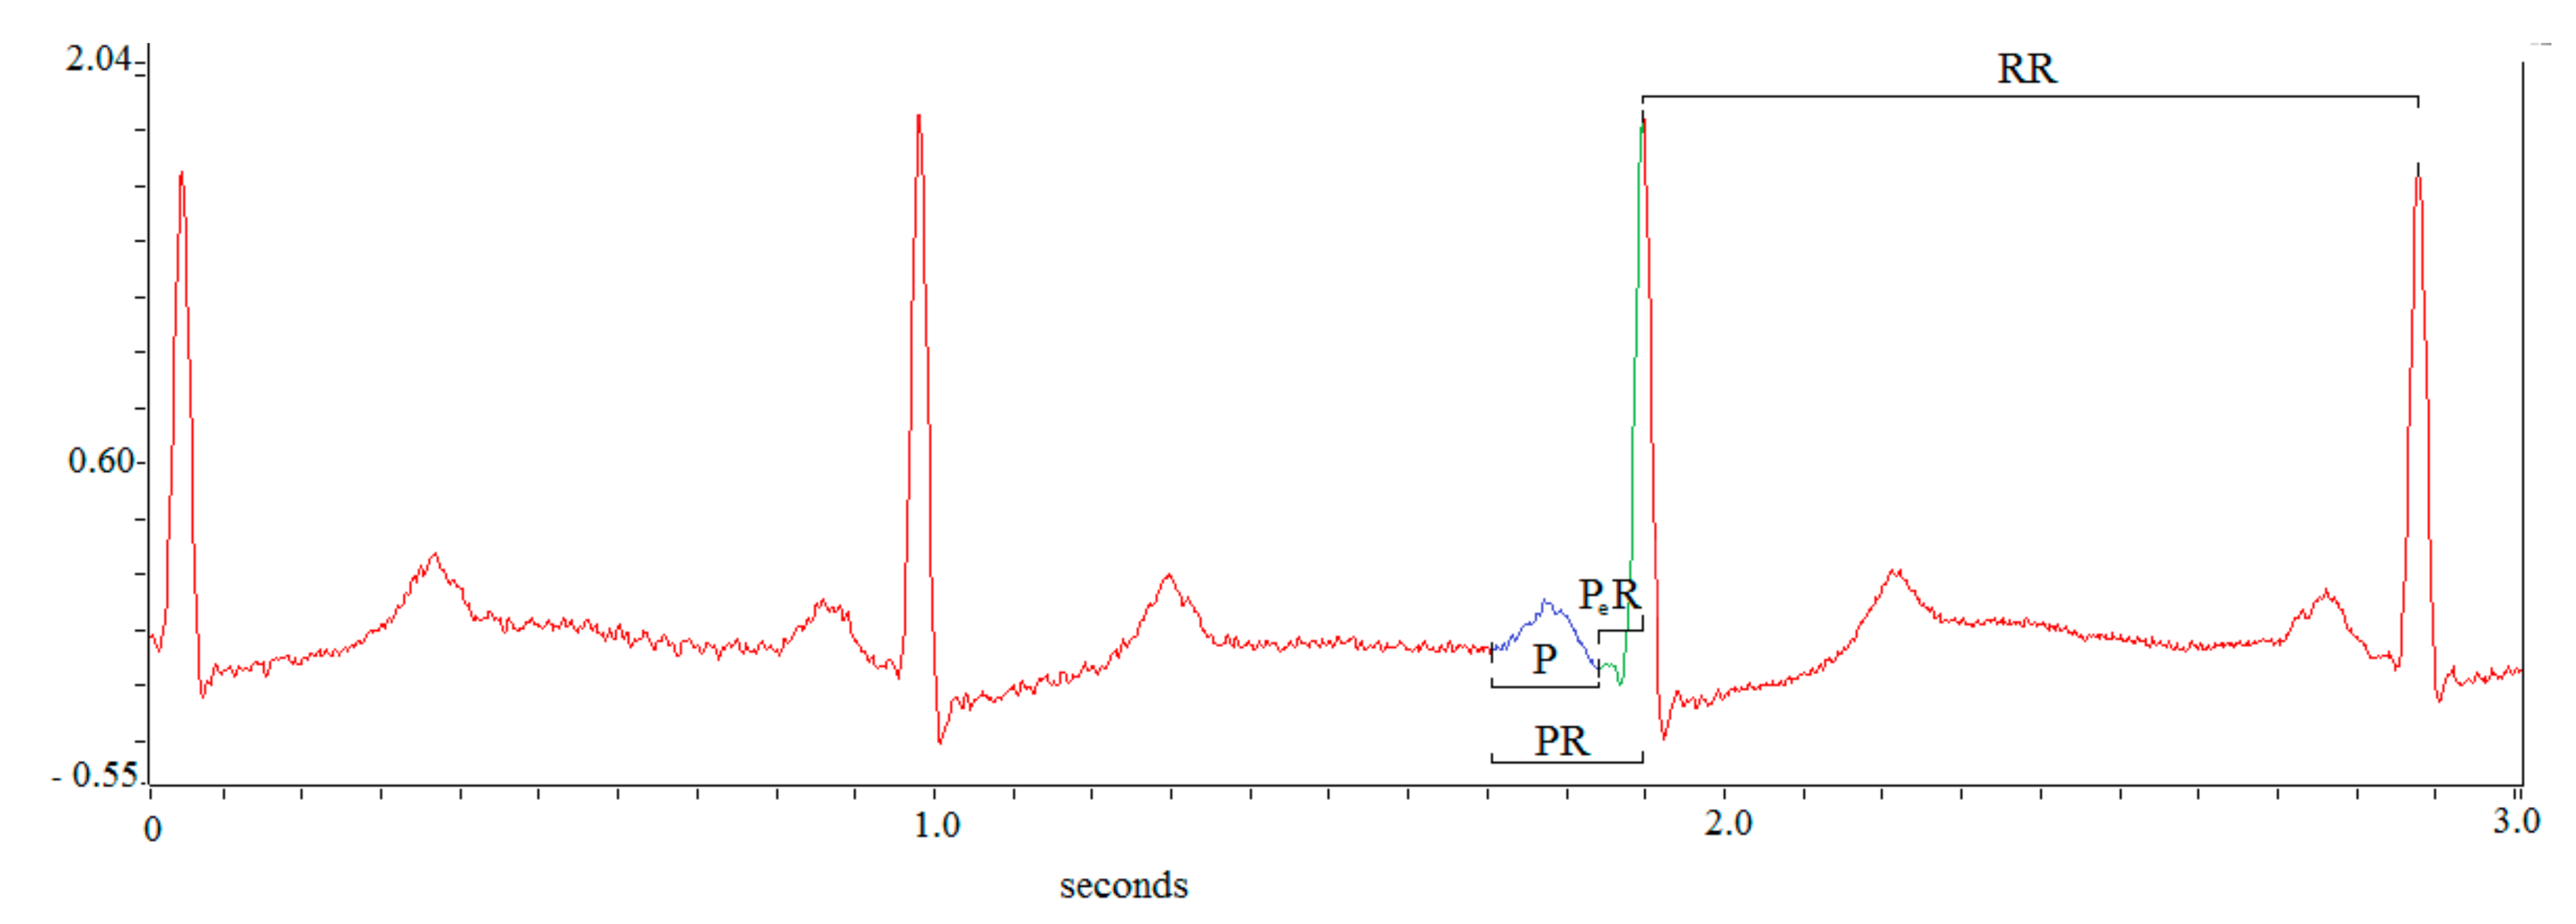
Figure 3.
Simultaneous recordings of the study ECG variables (5-min). Note the oscillatory behaviour of every variables (SBP: systolic bold pressure; RR: R-R wave interval; PR: PR interval; P: P wave duration; PeR: P wave end-R wave interval) during controlled breathing (15 breaths per minute).
Figure 3.
Simultaneous recordings of the study ECG variables (5-min). Note the oscillatory behaviour of every variables (SBP: systolic bold pressure; RR: R-R wave interval; PR: PR interval; P: P wave duration; PeR: P wave end-R wave interval) during controlled breathing (15 breaths per minute).
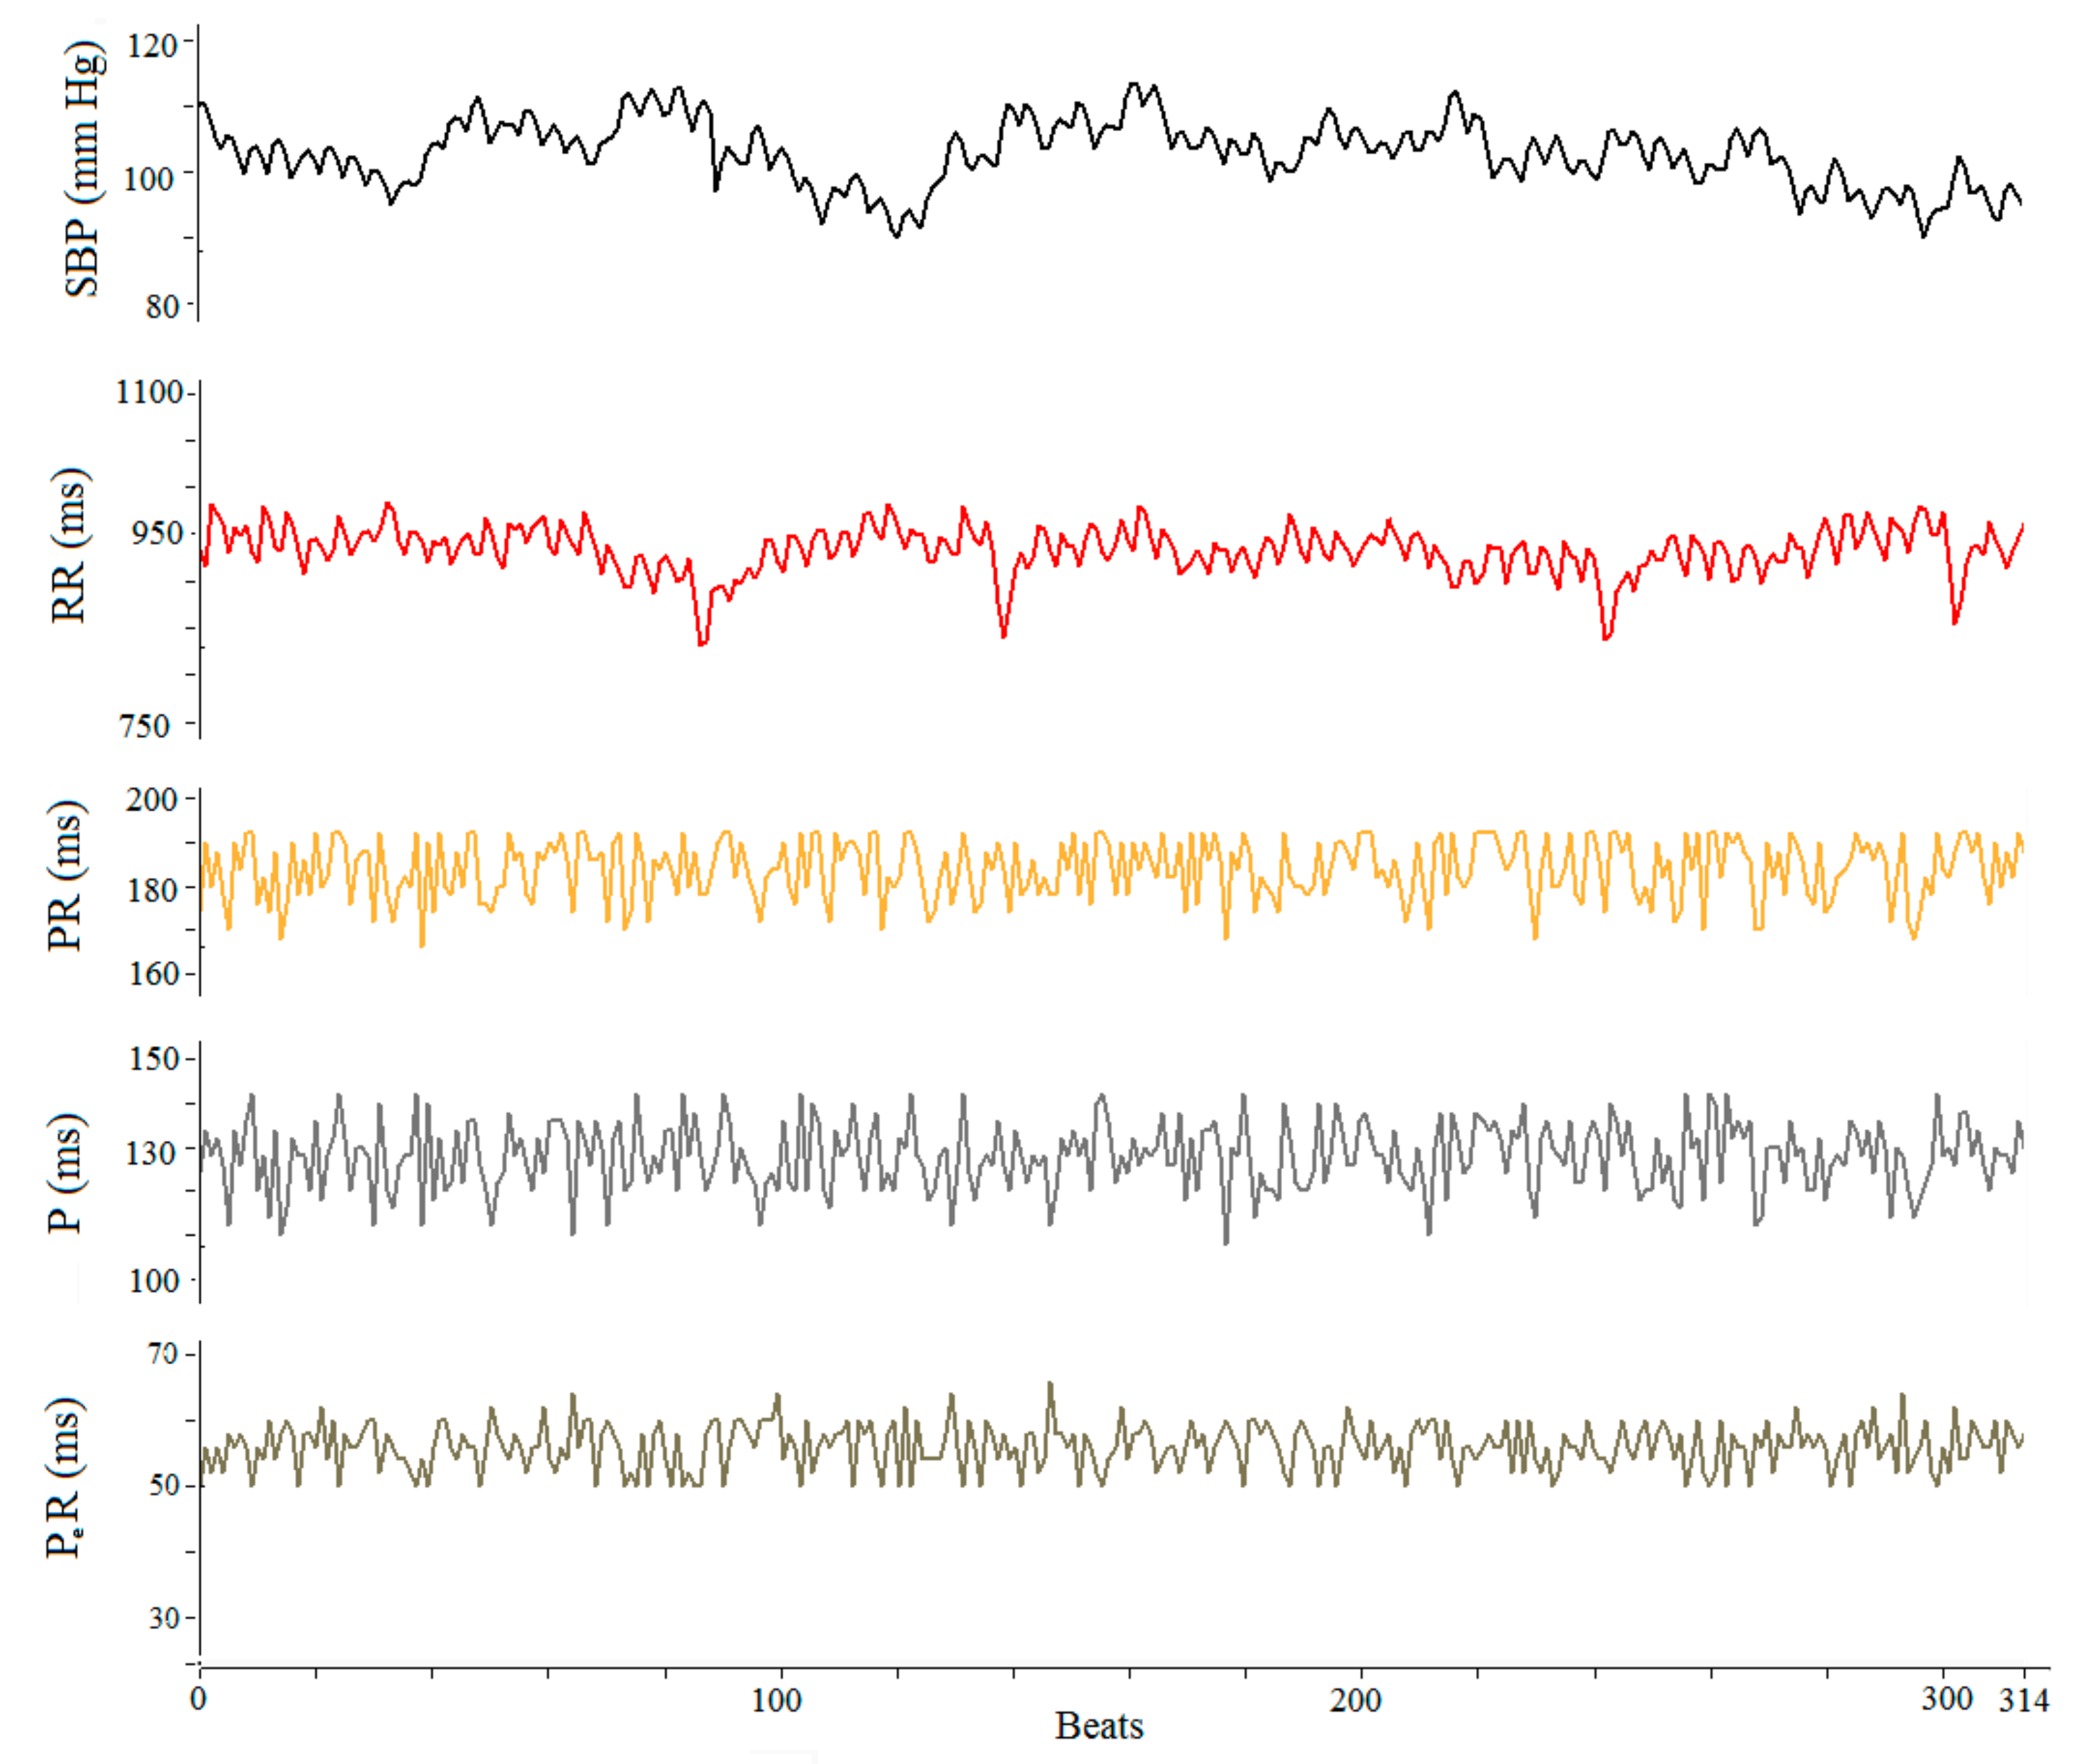
Figure 4.
On the left panel the power spectral analysis of RR, PR and P intervals (recording in the Figure 3); on the right panel the spectral coherence (P→PR) of two signals.
Figure 4.
On the left panel the power spectral analysis of RR, PR and P intervals (recording in the Figure 3); on the right panel the spectral coherence (P→PR) of two signals.
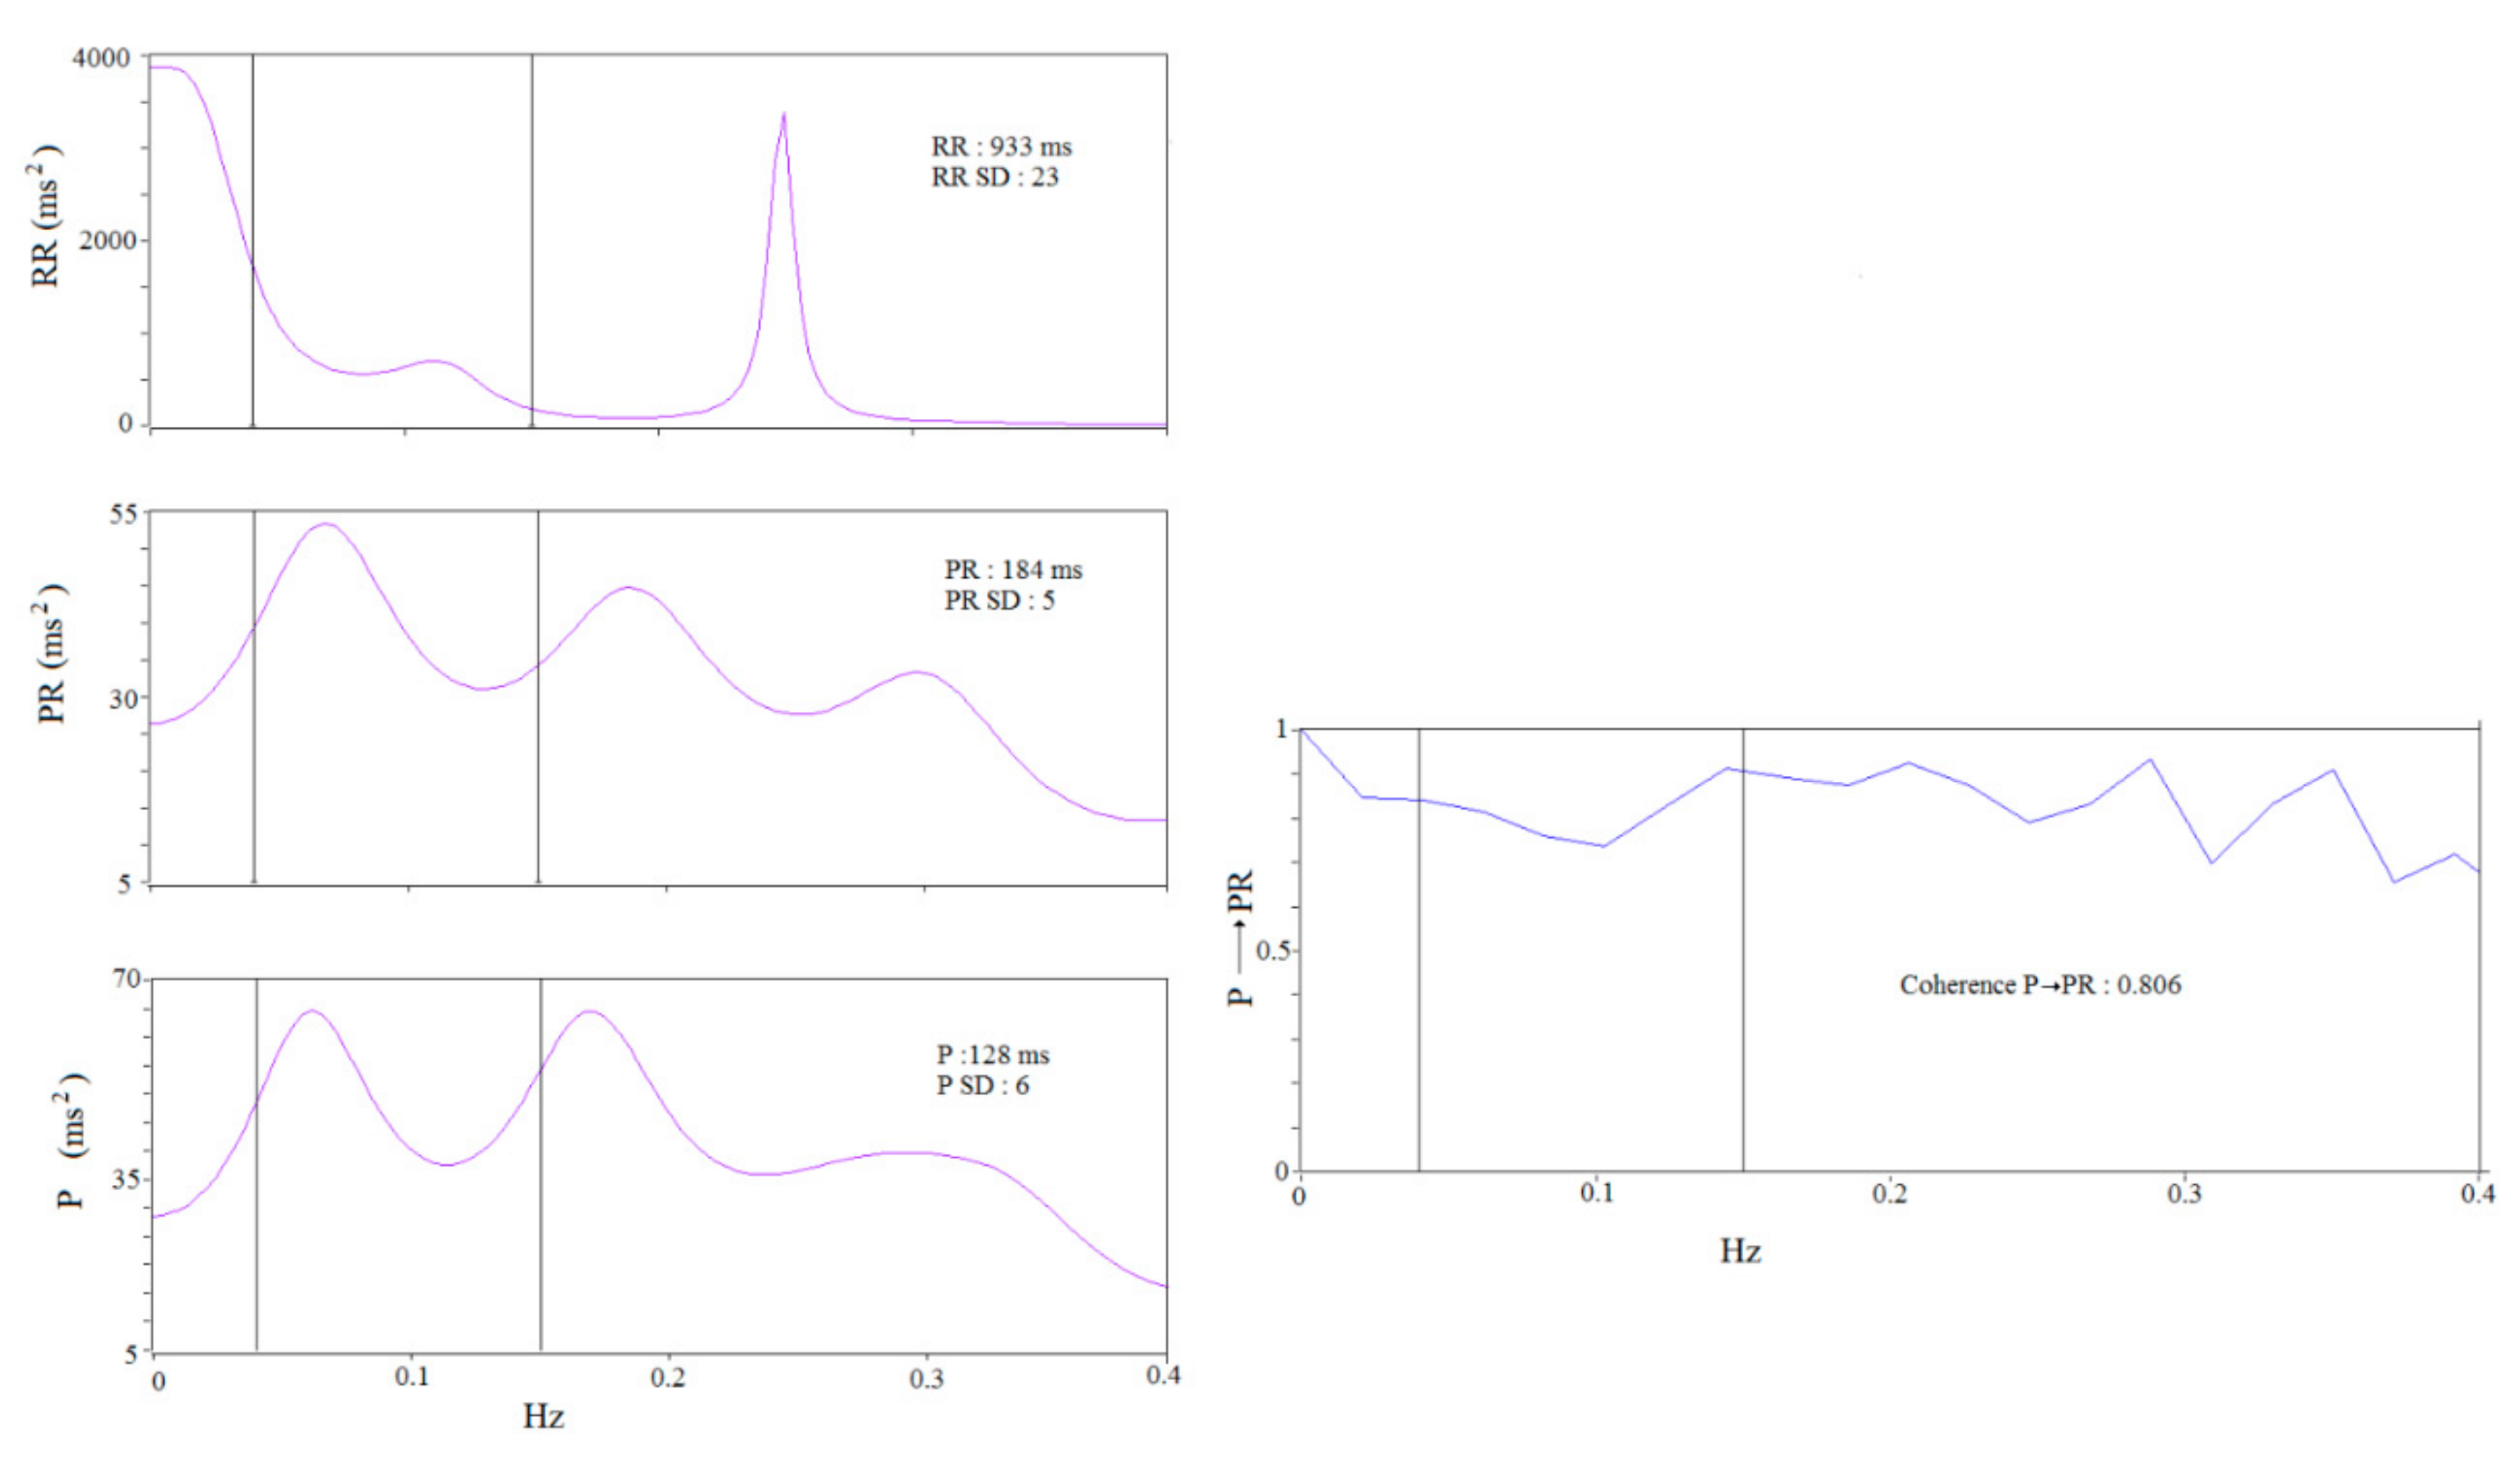
Figure 5.
Relation between P→PR coherence and natural logarithm of high frequency (HF) power detected from RR spectral analysis. HF is marker of sinus vagal control. A positive correlation was found in the in subjects with a cardioinhibitory response.
Figure 5.
Relation between P→PR coherence and natural logarithm of high frequency (HF) power detected from RR spectral analysis. HF is marker of sinus vagal control. A positive correlation was found in the in subjects with a cardioinhibitory response.
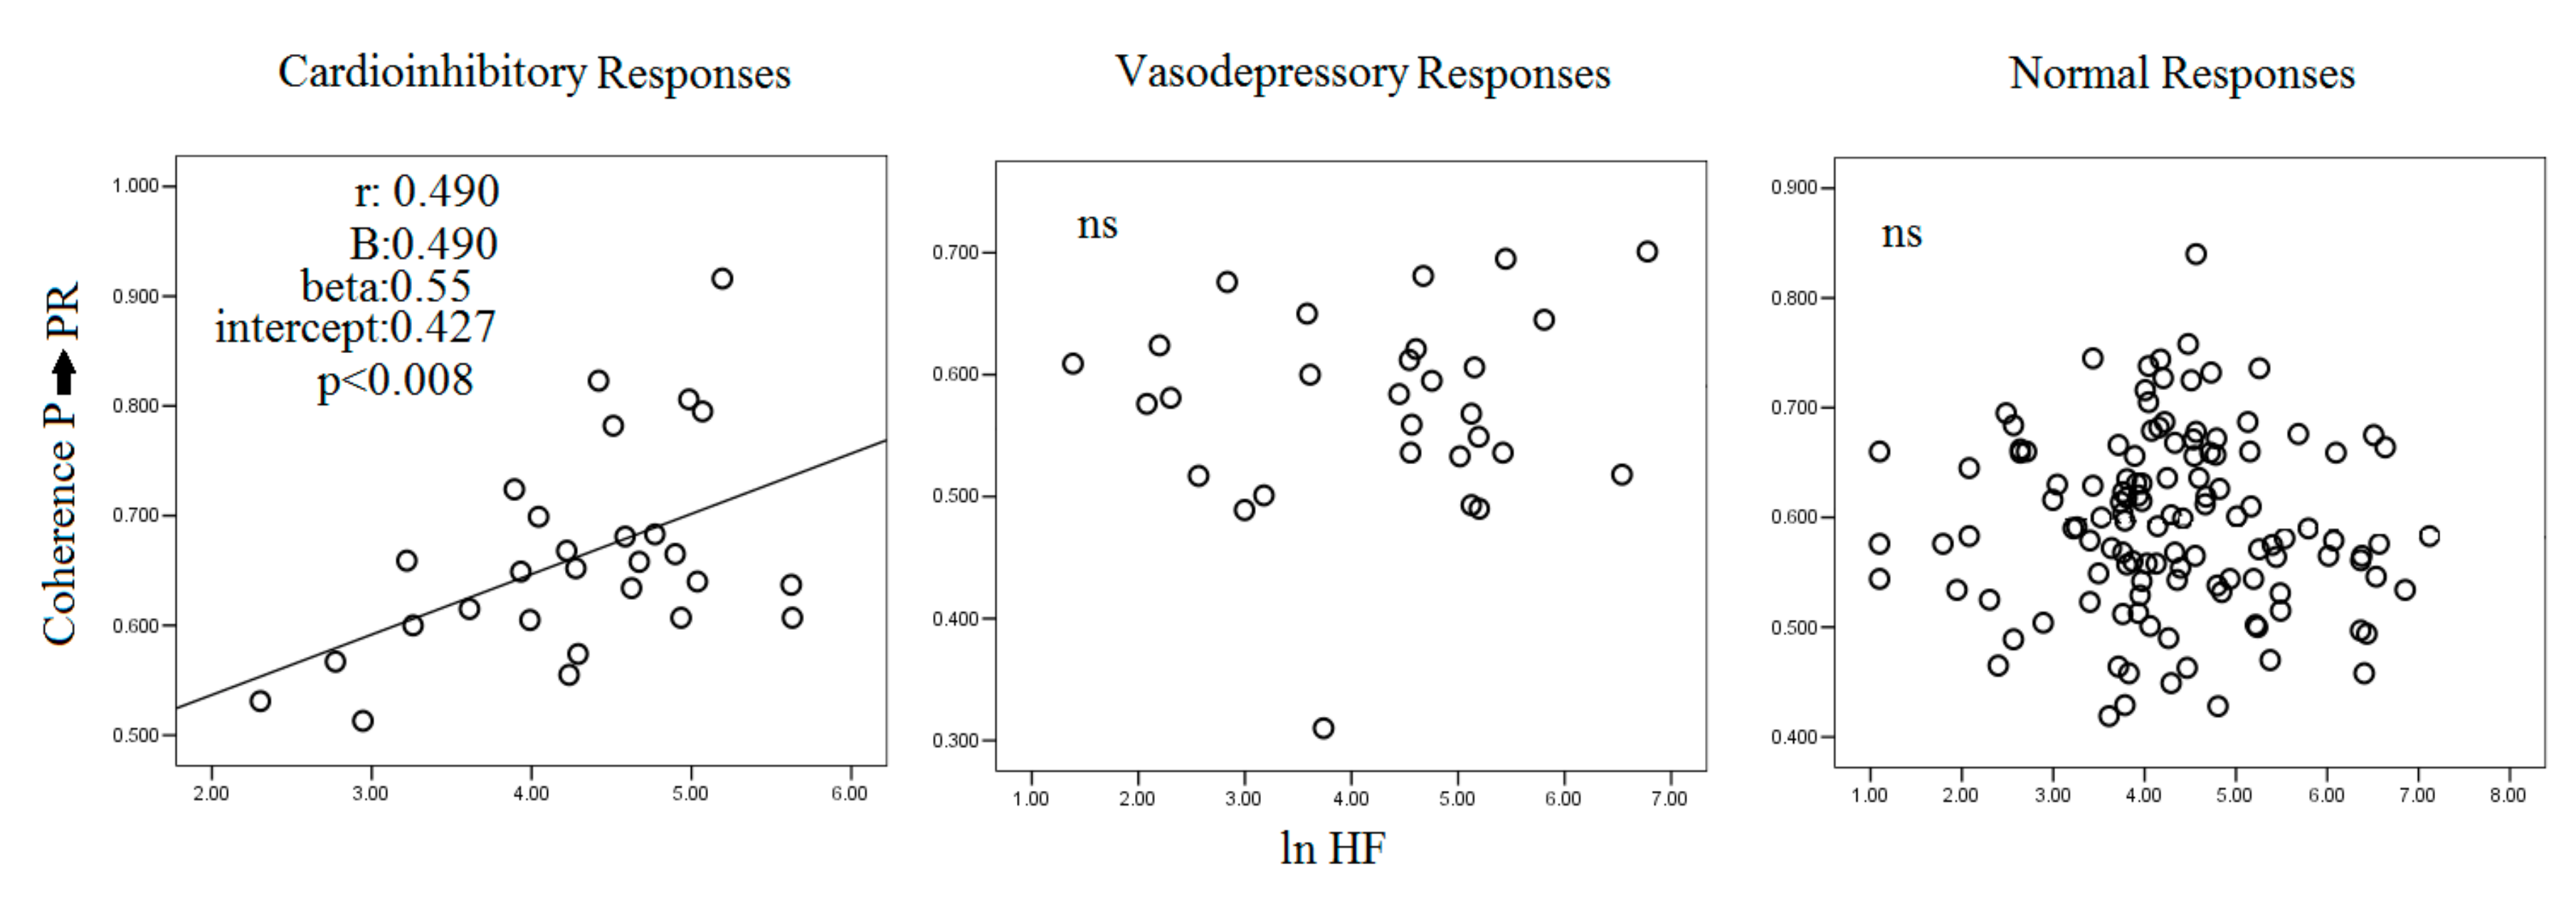
Figure 6.
Receiver operating characteristic curve (ROC) analysis showing that P→PR coherence predicts an incidence of sinus hypersensitivity with cardioinhibitory response.
Figure 6.
Receiver operating characteristic curve (ROC) analysis showing that P→PR coherence predicts an incidence of sinus hypersensitivity with cardioinhibitory response.

Table 1.
General characteristics of the three study groups.
| Positive Sinus Carotid Massage | ||||
|---|---|---|---|---|
| Variables | Subjects with Cardioinhibitory Response N = 28 | Subjects with Vasodepressory Response N = 29 | Subjects with Normal Response N = 122 | p Values |
| Age, yrs | 72 ± 10 | 71 ± 10 | 67 ± 10 | 0.052 |
| M/F, | 20/8 | 14/15 | 36/86 | 0.107 |
| BMI, kg/m2 | 26 ± 4 | 26 ± 4 | 26 ± 3 | 0.851 |
| HR, beats/min | 67 ± 11 | 69 ± 11 | 70 ± 9 | 0.338 |
| SBP, mm Hg | 127 ± 22 | 120 ± 18 | 125 ± 20 | 0.117 |
| DBP, mm Hg | 74 ± 9 | 70 ± 8 | 73 ± 9 | 0.431 |
Data are expressed as mean ± SD. M/F: male/female; BMI: body mass index; HR: heart rate; SBP: systolic blood pressure; DBP: diastolic blood pressure; mm Hg: millimeter of mercury.
Table 2.
Air Pollutants and Weather Data on the Day of the Cardiovascular Test.
| Positive Sinus Carotid Massage | ||||
|---|---|---|---|---|
| Variables | Subjects with Cardioinhibitory Response N = 28 | Subjects with Vasodepressory Response N = 29 | Subjects with Normal Response N = 122 | p Values |
| Carbon Monoxide, mg/m3 | 0.535 ± 0.270 | 0.610 ± 0.255 | 0.655 ± 0.309 | 0.062 |
| Ozone, μg/m3 | 106 ± 36 | 90 ± 40 | 86 ± 40 | 0.075 |
| Nitrogen Dioxide, μg/m3 | 86 ± 33 | 92 ± 20 | 89 ± 26 | 0.533 |
| Particulate Matter 10 μm, μg/m3 | 28 ± 14 | 28 ± 12 | 28 ± 13 | 0.905 |
| Particulate Matter 2.5 μm, μg/m3 * | 20 ± 8 | 19 ± 9 | 21 ± 8 | 0.589 |
| Benzene, mg/m3 | 1.10 ± 0.23 | 1.14 ± 0.25 | 1.17 ± 0.21 | 0.133 |
| Maximum Temperature, °C | 23 ± 7 | 21 ± 7 | 20 ± 8 | 0.129 |
| Minimum Temperature, °C | 12 ± 7 | 10 ± 7 | 10 ± 7 | 0.209 |
| Mean Temperature, °C | 18 ±7 | 15 ± 7 | 15 ± 7 | 0.162 |
| Relative Humidity, % | 71 ± 12 | 73 ± 12 | 73 ± 12 | 0.642 |
Air pollutants: carbon monoxide, ozone, nitrogen dioxide, particulate matter, 10 and 2.5, benzene; Weather data: maximum temperature, minimum temperature, mean temperature, relative humidity; *: weekly data.
Table 3.
Pollutants’ concentrations (≥75th percentile or ≤75th percentile) in patients with positive CSM and cardioinhibitory response.
Table 3.
Pollutants’ concentrations (≥75th percentile or ≤75th percentile) in patients with positive CSM and cardioinhibitory response.
| ≥75th Percentile | ≤75th Percentile | |||
|---|---|---|---|---|
| Variables (75th Percentile) | Subjects with Positive Cardioinhibitory Response N (%) | Subjects with Positive Cardioinhibitory Response N (%) | χ2 | p Values |
| Carbon Monoxide, (0.8 mg/m3) | 7 (14%) | 21 (16%) | 0 | 0.0772 |
| Ozone, (117 μg/m3) | 15 (32%) | 13 (10%) | 7.4 | 0.0067 |
| Nitrogen Dioxide, (102 μg/m3) | 8 (18%) | 20 (15%) | 0 | 0.675 |
| Particulate 10 μm, (32 μg/m3) | 8 (17%) | 20 (15%) | 0 | 0.784 |
| Particulate 2.5 μm, (22 μg/m3) | 9 (15%) | 19 (16%) | 0 | 0.886 |
| Benzene, (1.4 mg/m3) | 8 (15%) | 20 (16%) | 0 | 0.896 |
| Maximum Temperature, (27 °C) | 10 (20%) | 18 (14%) | 0.8 | 0.384 |
| Minimum Temperature, (°C) | 9 (20%) | 19 (14%) | 0.5 | 0.413 |
| Mean Temperature, °C | 12 (26%) | 16 (12%) | 3.3 | 0.0601 |
| Relative Humidity, %, | 8 (17%) | 20 (15%) | 0.1 | 0.784 |
Air pollutants: carbon monoxide, ozone, nitrogen dioxide, particulate matter, 10 and 2.5, benzene; Weather data: maximum temperature, minimum temperature, mean temperature, relative humidity; the value of Particulate Matter 2.5 was weekly sampled.
Table 4.
5 Minutes of ECG and Pressure Data during Controlled Breathing.
| Positive Sinus Carotid Massage | ||||
|---|---|---|---|---|
| Variables | Subjects with Cardioinhibitory Response N = 28 | Subjects with Vasodepressory Response N = 29 | Subjects with Normal Response N = 122 | p Values |
| RR mean, ms | 902 ± 85 | 901 ± 156 | 853 ± 120 | 0.053 |
| RR standard deviation | 25 ± 9 | 25 ± 10 | 27 ± 12 | 0.455 |
| PR mean, ms | 221 ± 28 | 209 ± 27 | 210 ± 26 | 0.143 |
| PR standard deviation | 6 ± 1 | 6 ± 1 | 6 ± 1 | 0.171 |
| P mean, ms | 121 ± 19 | 119 ± 21 | 119 ± 18 | 0.866 |
| P standard deviation | 8 ± 2 | 8 ± 2 | 8 ± 2 | 0.141 |
| PeR mean, ms | 95 ± 25 | 90 ± 18 | 90 ± 25 | 0.758 |
| PeR, standard deviation | 5 ± 2 * | 5 ± 1 | 6 ± 1 | 0.020 |
| P/PeR mean | 1.34 ± 0.40 | 1.37 ± 0.37 | 1.41 ± 0.46 | 0.766 |
| P/PeR standard deviation | 1.55 ± 0.72 *# | 1.48 ± 0.21 | 1.47 ± 0.20 | 0.003 |
| P → PR, coherence | 0.662 ± 0.093 **## | 0.547 ± 0.080 | 0.596 ± 0.081 | <0.001 |
| P → PeR, coherence | 0.454 ± 0.107 *# | 0.547 ± 0.086 | 0.527 ± 0.089 | <0.001 |
RR mean: R-R interval mean duration, RR standard deviation: R-R interval standard deviation; PR mean: P-R interval mean duration, PR standard deviation: P-R interval standard deviation; P mean: P wave mean duration, P wave standard deviation: P standard deviation; PeR mean: PeR interval mean duration, PeR standard deviation: PeR interval standard deviation; P/PeR mean: P wave and PeR interval mean ratio, P/PeR mean: P wave and PeR interval mean ratio standard deviation; P→PR and P→PeR are the coherences between P wave and PR and PeR intervals. ** p < 0.001 Subjects with Cardioinhibitory Response versus Subjects with Vasodepressory; * p < 0.05 Subjects with Cardioinhibitory Response versus Subjects with Vasodepressory; ## p < 0.001 cardioinhibitory versus normal response; # p < 0.05 Subjects with cardioinhibitory versus normal response.
Table 5.
5 Minutes of ECG and Pressure Data during Controlled Breathing.
| Positive Sinus Carotid Massage | ||||
|---|---|---|---|---|
| Variables | Subjects with Cardioinhibitory Response N = 28 | Subjects with Vasodepressory Response N = 29 | Subjects with Normal Response N = 122 | p Values |
| TPRR, ms2 | 515 (786) | 586 (668) | 643 (889) | 0.617 |
| VLFRR, ms2 | 381 (491) | 263 (415) | 331 (536) | 0.677 |
| LFRR, ms2 | 98 (130) | 90 (258) | 122 (140) | 0.861 |
| HFRR, ms2 | 83 (90) | 96 (158) | 70 (126) | 0.924 |
| LF/HF | 1.47 (1.42) | 1.38 (1.41) | 1.45 (1.77) | 0.837 |
| LFRR, nu | 51 ± 16 | 52 ± 16 | 53 ± 17 | 0.837 |
| HFRR, nu | 41 ± 18 | 39 ± 17 | 38 ± 17 | 0.762 |
| TPSBP, mm Hg2 | 25 (39) | 31 (27) | 40 (29) | 0.905 |
| VLFSBP, mm Hg2 | 17 (28) | 22 (31) | 20 (27) | 0.858 |
| LFSBP, mm Hg2 | 4 (5) | 4 (5) | 4 (5) | 0.529 |
| HFSBP, mm Hg2 | 2 (3) | 3 (2) | 2 (3) | 0.607 |
| αLF, ms/mm Hg | 6 (4) | 6 (7) | 6 (5) | 0.825 |
| αHF, ms/mm Hg | 7 (6) | 6 (5) | 7 (6) | 0.342 |
TPRR: Total Power of R-R interval; VLFRR: Very Low Frequency of R-R interval, LFRR: Low Frequency of R-R interval, HFRR: High Frequency of R-R; LH/HF: low frequency and high frequency ratio; ms2: mseconds2; NU: normalized units; TPSBP: Total Power of systolic blood pressure; VLFSBP: Very Low Frequency of systolic blood pressure; LFSBP: Low Frequency of systolic blood pressure; HFSBP: High Frequency of systolic blood pressure; αLF: α index of Low Frequency, αHF: α index of High frequency; mm Hg: millimeter of mercury; ms: millisecond.
Publisher’s Note: MDPI stays neutral with regard to jurisdictional claims in published maps and institutional affiliations. |
© 2022 by the authors. Licensee MDPI, Basel, Switzerland. This article is an open access article distributed under the terms and conditions of the Creative Commons Attribution (CC BY) license (https://creativecommons.org/licenses/by/4.0/).
Share and Cite
MDPI and ACS Style
Piccirillo, G.; Moscucci, F.; Magrì, D. Air Pollution Role as Risk Factor of Cardioinhibitory Carotid Hypersensitivity. Atmosphere 2022, 13, 123. https://doi.org/10.3390/atmos13010123
AMA Style
Piccirillo G, Moscucci F, Magrì D. Air Pollution Role as Risk Factor of Cardioinhibitory Carotid Hypersensitivity. Atmosphere. 2022; 13(1):123. https://doi.org/10.3390/atmos13010123
Chicago/Turabian StylePiccirillo, Gianfranco, Federica Moscucci, and Damiano Magrì. 2022. "Air Pollution Role as Risk Factor of Cardioinhibitory Carotid Hypersensitivity" Atmosphere 13, no. 1: 123. https://doi.org/10.3390/atmos13010123
Note that from the first issue of 2016, this journal uses article numbers instead of page numbers. See further details here.