
Quantification and Characterization of Metals in Ultrafine Road Dust Particles


1
Environmental Health Science and Research Bureau, Health Canada, 251 Sir Frederick Banting Driveway, Ottawa, ON K1A 0K9, Canada
2
School of the Environment, University of Toronto, Toronto, ON M5S 3E8, Canada
3
Dalla Lana School of Public Health, University of Toronto, Toronto, ON M5T 3M7, Canada
4
Department of Physical and Environmental Sciences, University of Toronto (Scarborough), Toronto, ON M1C 1A4, Canada
5
Department of Earth and Environmental Science, University of Ottawa, Ottawa, ON K1N 6N5, Canada
*
Author to whom correspondence should be addressed.
Atmosphere 2021, 12(12), 1564; https://doi.org/10.3390/atmos12121564
Submission received: 4 November 2021
/
Revised: 23 November 2021
/
Accepted: 24 November 2021
/
Published: 26 November 2021
(This article belongs to the Special Issue Road Dust in Urban and Industrial Environments: Sources, Pollutants, Impacts, and Management)
Abstract
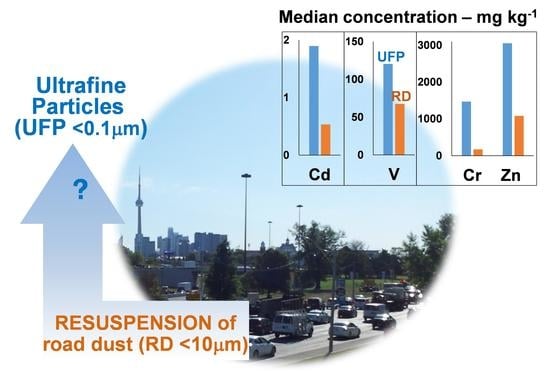
:Road dust is an important source of resuspended particulate matter (PM) but information is lacking on the chemical composition of the ultrafine particle fraction (UFP; <0.1 µm). This study investigated metal concentrations in UFP isolated from the “dust box” of sweepings collected by the City of Toronto, Canada, using regenerative-air-street sweepers. Dust box samples from expressway, arterial and local roads were aerosolized in the laboratory and were separated into thirteen particle size fractions ranging from 10 nm to 10 µm (PM10). The UFP fraction accounted for about 2% of the total mass of resuspended PM10 (range 0.23–8.36%). Elemental analysis using ICP-MS and ICP-OES revealed a marked enrichment in Cd, Cr, Zn and V concentration in UFP compared to the dust box material (nano to dust box ratio ≥ 2). UFP from arterial roads contained two times more Cd, Zn and V and nine times more Cr than UFP from local roads. The highest median concentration of Zn was observed for the municipal expressway, attributed to greater volumes of traffic, including light to heavy duty vehicles, and higher speeds. The observed elevated concentrations of transition metals in UFP are a human health concern, given their potential to cause oxidative stress in lung cells.
1. Introduction
The chemical composition and contribution of ultrafine particles (UFP; <0.1 µm) to the toxicity of airborne particulate matter (PM) has yet to be fully characterized. Ambient air pollution has been associated with various adverse health effects such as respiratory and cardiovascular disease and lung cancer [1,2]. Air quality regulations have been established in many countries to limit the mass concentration of PM ≤ 10 µm aerodynamic diameter (PM10), as well as PM ≤ 2.5 µm (PM2.5). However, no regulation currently exists around the world for UFP due to a scarcity of data [3].
The penetration depth of PM into the respiratory system is largely determined by its size. PM10 is defined as the “thoracic” fraction, with 50% of particles small enough to penetrate beyond the larynx [4]. PM2.5 represents the “respirable” particles capable of reaching the unciliated airways of the pulmonary region; this fine fraction can particularly affect those considered to be most vulnerable when exposed, including children and elders [2,3,4]. Ultrafine particles are of special concern due to their ability to reach the alveoli and be translocated into the blood stream. Upon entering systemic circulation, UFPs are easily distributed throughout the body and can accumulate in secondary organs such as the liver, brain and heart [5]. There is also evidence that UFP can be directly translocated to the brain via the olfactory pathway [6,7]. To better assess the potential impacts of UFP on health, more data on their concentration and composition in common sources of airborne PM, including road dust are essential.
Road dust contains particles from soils, eroded material from buildings and pavements, vehicle exhaust and non-exhaust emissions, de-icing salt and atmospheric deposition [8,9]. Resuspension of road dust represents a major source of PM10 in urban environments [10,11,12,13,14] but its contribution to airborne UFP remains ill-defined. According to the Air Quality Expert Group [3], combustion related to vehicular transport is one of the main sources of UFP in Europe. UFP arising from exhaust combustion have a short lifetime and are generally highest near intense traffic areas [12]. Vehicle non-exhaust emissions from frictional processes such as braking, tire wearing, and abrasion of road surface can also release UFP. While abrasion processes tend to emit coarser particles in brake and tire wear dust (>2.5 µm), UFP are also generated as a result of volatilization and re-condensation under higher temperature conditions characteristic of intense braking [8,11,15,16]. In laboratory tests using a brake dynamometer, the number of UFP released was at least three orders of magnitude higher than micron-size particles; a marked increase in UFP emissions occurred at around 300 °C, corresponding to the combustion of volatile organic compounds in the brakes [15]. In the last couple of decades, the implementation of stringent exhaust emission standards, along with improvements in engine technology, has resulted in a significant decline of automotive exhaust emissions. At the same time, the contribution of non-exhaust vehicle emissions, including nanoparticles, to ambient pollution has become an increasingly important issue to be considered in the context of air quality [11].
Compared to PM10 and PM2.5, the chemical composition of UFP has been much less studied, largely due to challenges in collecting enough material for chemical analysis [17]. Airborne UFP contain a large fraction of organic compounds (up to 50%) [18]. The metal content of this fraction is also significant in urban environments. For instance, the mass concentration of the metal oxides of UFP measured in seven Californian cities was reported to range from 0.6% to 26% [19]. Metals and organic compounds have been identified as the main cause of the human toxicity of inhaled PM due to their ability to cause cellular oxidative stress by promoting electron transfer and inducing the production of reactive oxygen species (ROS) [20,21]. Trace elements, such as Pb, Zn, Cu, Cd, Cr, Ni, V and As, and ultratrace metals, such as Pt, Pd and Rh, released by vehicle exhaust or non-exhaust emissions (e.g., tires, brake pads) are typically elevated in urban road dust compared to the local background [22,23,24,25]. Of particular concern is the fact that these potentially toxic elements are even more enriched in the fine inhalable particles (PM10 or PM2.5) compared to bulk road dust [9,14,26,27,28,29,30]. Similarly, enrichment in Cu, Zn, Sb, and Ti was observed in the nano-size fraction compared to the original bulk road dust (<100 µm) from Moscow [17].
In companion papers, Levesque et al. [31] and Wiseman et al. [14] recently evaluated the sources, concentrations and lung bioaccessibility of metals and metalloids in road dust samples collected by street-sweeping vehicles from expressways, arterial and local roads in Toronto (ON, Canada; 2.9 million inhabitants). These studies showed an enrichment in several metal(loid)s as particle size decreased: from the bulk road dust (<2 mm) to the dust box sweepings (<10 µm), and from the dust box sweepings to the fine fraction (<1.8 µm). The current study investigates the metal(loid) concentrations in UFP resuspended from a few key dust box sweepings representative of the three road types. The objectives of this study are to: (1) quantify the proportion of resuspendable UFP in a range of dust box sweepings, (2) determine metal(loid) concentrations in the nano-scale fractions; and (3) discuss the significance of the results for human health in view of selected relevant research studies. The overall goal is to advance our understanding of the metal composition of UFP and its potential implication for human health in an urban context.
2. Materials and Methods
2.1. Road Dust Samples
Road dust samples were collected in the fall of 2015 and the spring of 2016 by the city of Toronto using regenerative-air-street sweepers (see Wiseman et al. [28] for further details). Each sample represents a dust composite collected over many kilometers (from 6 to 45 km) and several hours. Samples from the dust box compartments of the street-sweeping vehicles were used in this study. Previous characterization of the dust box sweepings reported a measured median particle size diameter of 9.4 µm [28]. For the aerosolization and particle size fractionation experiments in the present study, a subset of six samples were selected from the 32 dust box samples characterized by Wiseman et al. [14]. The number of investigated samples was limited by the lengthy and time-consuming fractionation protocol. The samples were selected among different road types and areas in Toronto to represent a range of traffic volumes: two from local roads (“LR”) from two different districts (<2500 vehicles day−1; 30–50 km h−1), three from arterial roads (“Art”) within the same district (8000–40,000 vehicles day−1; 40–60 km h−1) and one from an expressway (“Ex”) (>40,000 vehicles day−1; 80–100 km h−1). Samples were collected in three different community council areas (formerly called districts): (1) Toronto and East York (D1), which includes downtown and is the most densely populated; (2) Etobicoke York (D2); and (3) Scarborough (D4) [32]. The three arterial samples included in this study are from the same roads in Scarborough (D4), collected during consecutive weeks as part of the city’s sweeping schedule (Art-D4-W1, -W2, -W3). Prior to particle size fractionation, the dust box sweepings were sieved < 56 µm to discard possible larger particles. Based on laser diffraction analysis, the median particle size diameter for the six sieved dust box samples ranged from 9.8 to 21.2 µm. These samples are referred to as “dust box” in this paper.
2.2. Particle Size Fractionation of the Resuspended Dust Box
The approach for aerosolization and particle size fractionation has been described by Levesque et al. [31]. Briefly, a fluidized bed aerosol generator (TSI Incorporated, model 3400 A) was used to resuspend the dust samples using a flow rate of 10 L/min and helium (He) as the carrier gas. The fluidized bed is composed of 100 µm bronze beads maintained in boiling action by the He flow to facilitate deagglomeration and resuspension of pre-existing fine particles in the dust. This approach has been selected because the particle size distribution of the produced aerosols is representative of the parental sample. The optimized breaking of aggregates by the boiling action of beads may overestimate the aerosol mass compared to natural road conditions but a conservative estimate is preferable for health risk assessment. A ½ inch cyclone at the top of the chamber prevents the dispersal of particles > 40 µm. After 1 h of stabilization, the aerosol generator was connected to a micro-orifice uniform deposit impactor (MSP Corp., MOUDI IITM 125B) consisting of 13 impaction stages, which allows separation of the particles into size fractions ranging from 0.01 to 10 µm (aerodynamic diameter; Table 1). The dust was collected on Teflon filters (47 mm PTFE with polymethylpentene (PMP) support rings, Pall Corp.) for 2 to 4 h; each sample was run in triplicate [31]. Between each sample, the aerosol generator and the impactor were disassembled and washed with deionized water to avoid cross-contamination. Buoyancy-corrected gravimetric analysis of the Teflon filters prior to and after loading was performed inside Health Canada’s “Archimedes M3TM” Buoyancy-Corrected Gravimetric Analysis Facility as described in Rasmussen et al. [33].
2.3. Element Analysis
Total element concentrations of the dust box samples were determined in triplicate using a 1 h ultrasonic dissolution in 45% HNO3/0.8% HF and a solid to solution ratio of 2 mg: 6 mL [34]. Inductively coupled plasma—mass spectrometry (ICP-MS) or inductively coupled plasma—optical emission spectrometry (ICP-OES) was used for elemental determination, depending on the concentration level. Filters from the resuspension experiments (two to three replicates per size fraction) were characterized for total concentrations using the same method.
2.4. Quality Assurance
Considering that filter samples in the nano-scale fraction are characterized by negligible to small particle mass (<0.26 mg/filter), it was important to implement rigorous quality assurance measures throughout the study to evaluate the reliability of the results. The accuracy of the gravimetric analyses was assessed by weighing a series of filter blanks (n = 15, mean weight 0.01 mg). For a filter with dust mass loading below the mean filter blank weight, concentrations of elements were not calculated to avoid generating artificially high values. Procedural blanks, filter blanks and certified reference materials for indoor dust (NIST 2584), urban particulate matter (NIST 1648), soil (NIST 2711), road dust (BCR-723) and auto catalysts (NIST 2557) were included during acid digestion of the dust-loaded filters and ICP determination. QA/QC results for digestion recovery of reference materials and limits of detection for elements of interest for ICP analyses are given in Supplemental Information (Table S1). As reported by Levesque et al. [31], total element recoveries for NIST 2584 ranged between 80–120%. When considering other reference materials, the recoveries fell within the 70–130% range, except for Cr (<43%) in BCR-723 and NIST 1648, and Ti (<63%) for all materials (SI-Table S1). In the NIST 1648 reference material, chromium occurs dominantly as chromite; refractory minerals such as chromite are not fully dissolved by acid digestion [35,36]. Therefore, the ultrasonic HNO3/HF digestion method used in this study might underestimate total Cr in road dust samples if a fraction was in the form of chromite. For loaded filters, negative ICP values lower than the mean value of all procedural blanks minus three standard deviations were treated as outliers and were discarded [37]. Negative values falling within the mean value for all procedural blanks minus three standard deviations were replaced by “0”. Positive values smaller than the limit of detection (<LOD) were kept as is but were flagged [38]. Procedural blank and filter blank values within each batch were subtracted from the ICP readings. Fresh bronze beads were used for each sample. A blank resuspension run was conducted to assess the occurrence of possible dust contamination by the bronze beads. The initial results were inconclusive, however, as loading masses on filters were <LOD. To investigate this further, the bronze beads were digested by aqua regia in triplicate for total element analysis by ICP-OES or ICP-MS. The beads contained on average: 87.3 wt.% Cu, 10.8 wt.% Sn, 193 mg Pb kg−1, 36 mg Ni kg−1, 34 mg Zn kg−1, 11 mg Bi kg−1, 11 mg As kg−1, 1.8 mg Ag kg−1, 1.3 mg Co kg−1, and 1.0 mg Sb kg−1. Concentrations of Cu, Sn, Pb, Ni, Bi and As in the bronze beads were higher than, or in the same range as, those from the road dust samples. Given the potential for cross-contamination, these elements were not included in the analyses of aerosolized dust.
2.5. Data Analysis
Given frequent missing or <LOD values in the nano-scale range, the MOUDI fractions were categorized into three classes (micron, sub-micron and nano size; Table 1) to facilitate descriptive statistical analyses. Median and inter quantile ranges (IQR) were preferred as a measure of dispersion rather than mean and standard deviation because they are less influenced by outliers and can be used with a large number of <LOD values [39,40]. The IQR is calculated as the difference between the 75th and the 25th percentile values and provides the central range where 50% of the data reside [39]. For a given element and class fraction considered, concentrations greater than the median + 3 IQR were individually re-examined and discarded as outliers (NIST/SEMATECH [41]) when justifiable reasons could be identified (e.g., too low dust mass close to the filter blank weight). Otherwise, they were kept as representative of the natural variation associated with such nano-scale environmental samples.
2.6. Statistical Analysis
Kruskal–Wallis non-parametric ANOVA was used to determine differences between medians for road types; critical differences between medians and distributions were then evaluated using the Wilcoxon–Mann–Whitney rank test with a significance set at p < 0.05 [42]. These statistical analyses were conducted using Analyze-it for Microsoft Excel 2016. Hierarchical agglomerative clustering (HAC) was performed to highlight similarities between elements in the nano-scale dust according to their inter-correlation distances. The analysis was completed on the standardized (Z-score normalization) dataset of all measured nano-size dust fractions. HAC was applied on the Spearman’s correlation matrix transformed using the square root of (1 − r2), where r is the correlation between the standardized variables; the latter transformation converts correlations into metric distances [43]. The Ward criterion was chosen for merging clusters. HAC was carried out using the R v.4.0.0 packages [44].
3. Results and Discussion
3.1. Basic Properties of the Dust Box Samples
The organic C content of the studied dust box samples varied from 3.8 to 8.7 wt.% (Table 2). Major elements present in the dust box samples were Si, Fe, Mg, Al and S (Table 2). Si, Fe and Al are generally representative of crustal elements. In terms of trace elements, Zn, Cu, Pb and Cr were the most abundant in the dust box, with concentrations that were elevated compared to those previously reported for surficial soils from the same physiographic region (Table 2) [45]. The concentrations of Zn, Cu, Pb and Cr were also higher than those measured in street dust collected from residential areas in the less populated city of Ottawa (Table 2) [46]. Several studies have reported these metals as the most abundant trace elements in road dust due to their occurrence in brake pads (Cu, Cr, Pb, Zn), tire rubber (Zn, Pb) and vehicle fuel combustion residues (Zn as an additive; Pb, Cu as natural contaminants) [9,13,22,23,26,47]. Other sources for these metals are wind erosion from soils and industrial emissions [13]. The three arterial road samples collected within the same district but on different weeks (Art-D4-W1, -W2, -W3) had, overall, a comparable composition over time (Table 2).
3.2. UFP in Resuspended Road Dust Box Samples
Hereinafter, the term “resuspended PM10” is used to refer to the aerosolized fraction of dust box with an aerodynamic particle diameter < 10 µm and >10 nm, based on the adopted MOUDI fractionation scheme (Table 1). Overall, for the six samples, most of the resuspendable mass of dust particles was found in the micron and sub-micron fractions: a median of 72 wt.% of the resuspended PM10 was collected in the 1–10 µm fractions, while a median of 26 wt.% was recovered in the 0.1–1 µm sub-micron fractions (Figure 1). The <100 nm fractions accounted for around 2 wt.% of the resuspended PM10 (min–max: 0.23–8.36 wt.%); 50% of the UFP population values ranged within 1.25 to 5.25 wt.% of resuspended PM10 (Figure 1). Interestingly, dust from the downtown district (D1), including both the expressway or local road samples, contained the highest amount of very fine particles: >47 wt.% (median) of the resuspended PM10 was retained in the sub-micron fraction and up to 7 wt.% (median) was recovered as nanoparticles (Figure 1). While the sample number examined does not support a statistical analysis of results on a per district basis, these results might reflect differences in UFP emissions as a function of traffic volume, intensity and type, including fleet composition, between the downtown core of Toronto and other less populated districts (D2 and D4). A long-term air monitoring study in downtown Toronto reported that non-tailpipe PM2.5 emissions (soil/road dust resuspension, brake and tire wear) have increased since 2011 [48]. The authors explained the results with longer dry periods (greater accumulation of road dust) and the increases in the number of heavier vehicles on the roads, such as minivans, sport-utility vehicles and light trucks (greater friction on the road surface).
The detailed size fractionation of UFP is presented in Table 3. While the variability was typically high between replicates within the same size fraction, the majority of UFP mass was generally found in the coarser UFP fractions. Of the total UFP mass, >65% was associated with the 32–100 nm fraction while <35% was measured on the 10–32 nm filters (Table 3).
3.3. Metals in UFP
This section does not include metals potentially impacted by cross-contamination (Cu, Sn, Pb, Ni, Bi and As) due to the bronze beads used for aerosolization (see discussion Section 2.4). In addition, Ag, Bi, Zr, B, Ce, Se and Si were not included in the statistical analysis because >50% of the values in the sub-micron and nano fractions were <LOD.
Compared to the dust box samples, the most notable enrichment in UFP was observed for Cd, Cr, Zn and V (nano/dust box ratio close to or >2; Figure 2). Fe and Ba also tended to accumulate in UFP, but to a lesser extent (nano/dust box ratio > 1.4). Ermolin et al. [17] also observed abnormally high Cd and Zn concentrations in UFP isolated from Moscow dust. This pattern of metal enrichment in UFP slightly differed from that of the sub-micron fraction of the same samples, which showed an additional marked enrichment in Mo and Sb (sub-micron/dust box ratio > 2; SI-Figure S1). In UFP, Mo and Sb median concentrations were <LOD. Several other studies have reported comparable metal enrichment in the fine road dust fractions for V, Cr and Mo (PM2.5/bulk<0.3mm ratio > 5 in road dust from Shanghai [9]), Cd and Zn (PM2/bulk<2mm ratio = 2 for highways in Spain [26]), Cr and Cd (PM2.5/PM10 ratio > 2 for road dust in Dongying, China [49]), and Zn and Sb (PM2.5/bulk<2mm ratio ≥ 2 in urban dust, Italy [27]).
The multivariate method of HAC was applied to the dataset of all nano-size fractions to regroup studied variables into subsets (clusters) according to their correlation-based similarities. The first group to form at the lowest value of the dissimilatory scale (Ba, V) has the highest similarity (Figure 3). As the dissimilatory scale values increase, the grouping becomes more heterogeneous, that is, group members’ similarities decrease. High correlation or similarity between elements may reflect a common origin [18,27,48,50]. A non-exhaustive list of anthropogenic metal sources commonly associated with road dust is summarized in Table 4.
Hereinafter, the dendrogram is interpreted by cutting the tree at a dissimilatory value of 1.4 to form four main clusters (Figure 3). The first cluster includes Al, Mn and Mg; all of which were not found to be enriched in UFP (Figure 2). The co-occurrence of Al, Mn and Mg in this cluster suggests a geogenic origin, as these elements are common constituents of soil minerals [50]. The second cluster groups Ba and V with Fe, which were all found to be moderately enriched in UFP. Steel and alloys used in various vehicle components are a possible common source of these metals (Table 4). Other potential sources for these elements include brake pads (Fe; Ba as a filler), pigments/filler in paints and catalysts used in plastic and rubber production (Ba, V; Table 4). Fossil fuel combustion is also a known source of V (Table 4). In Toronto, elevated concentrations of Ba and Fe, as well as Cu and Sb, in PM2.5 sampled near major roads were previously attributed to brake wear [48]. In contrast, a recent study examining the elemental concentrations of bulk road dust (<2 mm) and dust box (median < 10 µm) collected in Toronto found that Ba concentrations in road dust were not elevated compared to soil background levels [14]. Ba was also not observed to significantly vary as a function of road type and corresponded to levels of traffic volume and predicted braking activity. While a moderate association was observed between Ba and Sb concentrations, suggesting that brake wear may be a source of Ba, Wiseman et al. [14] concluded that geogenic sources of Ba are likely to be comparatively more important. The third cluster relates Co and Cr with Cd at higher values on the dissimilatory scale. Both Cd and Cr had a nano/dust box ratio > 2, while Co was moderately enriched (median nano/dust box ratio = 1.3). In relation to road dust, Cr, Cd and Co may originate from fossil fuel combustion, pigments in paints or plastic, and various steel components from vehicles (Table 4). Cement may also be a source of Cd and Cr, while tires can release Cd- and Co-containing rubber particles via wear and tear processes during driving (Table 4). The fourth cluster is composed of Ti and Zn, linked at high values on the dissimilatory scale, indicating some similarity but lower correlation between these metals (rs = 0.44; p < 0.0066; SI-Figure S2). Compared to dust box concentrations, UFP was enriched in Zn but not in Ti (Figure 2). Tires are a frequently reported source of Zn in road dust (Table 4), although other traffic-related sources such as brake wear can contribute to emissions of this element, especially for UFP [14,15]. TiO2 and ZnO nanoparticles (NP) were observed in Shanghai PM2.5 dust [9]. Nano- or micron-size particles of ZnO and TiO2 are used as fillers or activators during the production of rubber-based composites [9,59]. Source apportionment studies in Toronto suggested local overnight industrial activity (metals processing), brake wear emissions and the combustion of lubricating oils containing Zn thiophosphate stabilizer to explain the Zn variation in airborne fine (PM2.5) and ultrafine (PM0.1) particles [55,61].
While metal enrichments in UFP and observed statistical associations between variables can help to clarify potential anthropogenic contributions, caution needs to be exercised in using trace elements as ‘markers’ to identify specific sources. The identification of specific elemental sources is hindered by the occurrence of multiple and overlapping sources for a given trace element, combined with the variability in chemical composition of automotive components between manufacturers. These limitations are reflected in Table 4 and have been previously discussed by Thorpe and Harrison [8] and Wiseman et al. [14]. Source identification is even more challenging in the case of UFP because they may be generated from thermal processes during which interactions with other sources or elements may occur. Therefore, complementary electron microscopic analysis would be needed to ascertain their origin with confidence.
3.4. Impact of Road Type on Key Metal Concentrations in UFP
Understanding the spatial variability of the chemical composition of UFP in specific environments provides insight into potential sources and health risks [18]. The impact of road type on metal concentrations in UFP was evaluated for the four metals with the greatest preferential accumulation in the nano-scale fractions (Cd, Cr, Zn and V; nano/dust box ratio close to or >2), after regrouping all resuspended nano fractions on the basis of major road type only (Figure 4). While these results should be interpreted with caution due to the limited number of dust box samples examined, the representativeness of each composite sample is reinforced by the strategy of sampling over many kilometers and several hours.
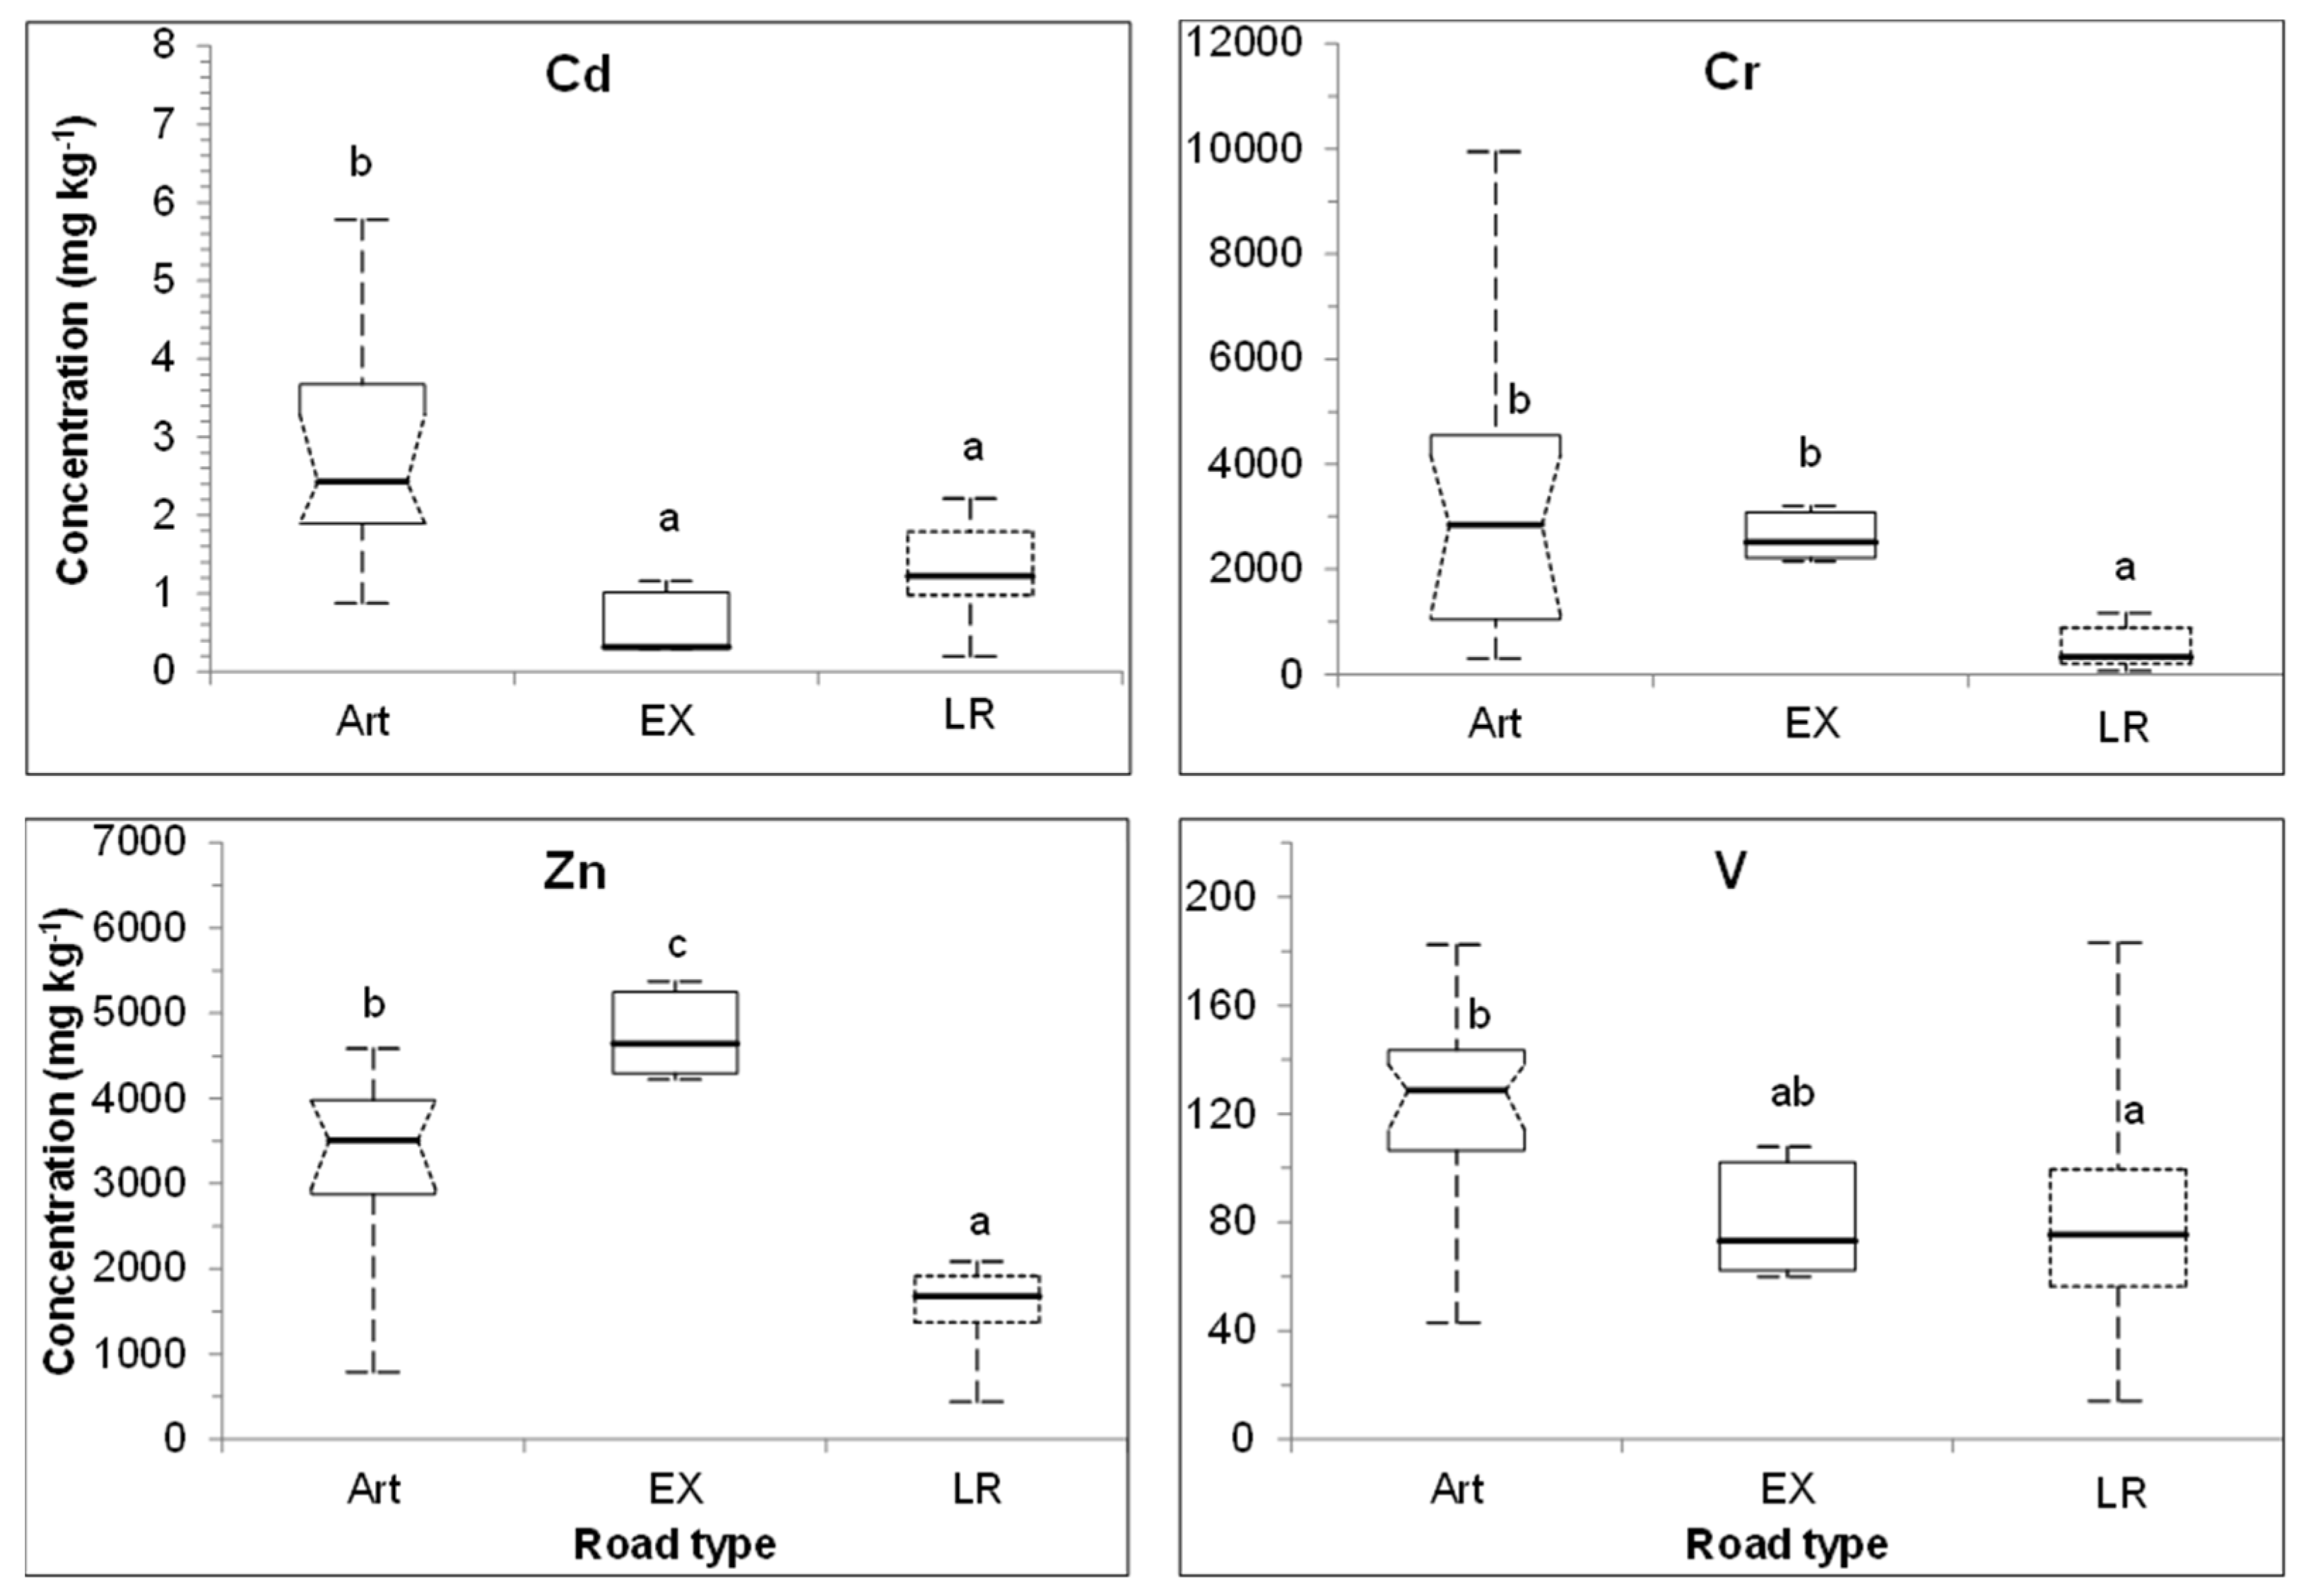
Among these four elements, Cr and Zn were the most abundant in UFP (Figure 4). Metal concentrations in UFP varied widely and the min–max ranges were (mg kg−1): 60–11,228 (Cr); 259–5372 (Zn); 14–202 (V); 0.19–7.20 (Cd). The variation in Cd, Cr, Zn, and V concentrations in the nano-scale fractions was large for arterial roads (n = 31) and generally lower for expressways (n = 5) and local roads (except for V in LR; n = 11; Figure 4). Median concentrations of Cd, Cr, Zn and V in UFP from arterial road dust were significantly higher than those from local roads. Ultrafine particles from arterial roads containing two times more Cd, Zn and V and nine times more Cr than UFP from local roads (2.43 mg Cd kg−1, 2846 mg Cr kg−1, 3508 mg Zn kg−1, 129 mg V kg−1 for Art vs. 1.22 mg Cd kg−1, 329 mg Cr kg−1, 1677 mg Zn kg−1, 75 mg V kg−1 for LR; Figure 4). For UFP from the expressway, median concentrations of Cd and V (0.31 mg Cd kg−1 and 73 mg V kg−1) were not significantly different from those measured in UFP from local roads (1.22 mg Cd kg−1 and 75 mg V kg−1), and their median Cr concentration was comparable to that of arterial roads (respectively 2515 vs. 2846 mg kg−1; Figure 4). Zn median concentration in UFP was the highest at the expressway with 4644 mg kg−1 compared to 3508 and 1677 mg kg−1 for arterial and local roads, respectively (Figure 4). In a related study in Toronto, the same trend was observed for Zn in dust box samples (median PM < 10 µm) [14].
Several factors, including seasonal effects, occurrence of industries, traffic pattern and intensity, can influence metal composition in dust [3,9,18,25,62]. Compared to arterial or local roads, expressways are characterized by heavier traffic with more heavy-duty commercial vehicles and higher speed, which can have an impact on contaminant release [55]. As discussed above, non-tailpipe traffic emissions related to the wear and tear of tires and brake components, as well as oil combustion, were identified as sources of Zn in airborne PM [8,15,16,22,55]. The UFP number concentration and particle size distribution emitted from road-tire friction or braking are influenced by various factors such as vehicle speed, vehicle weight, traffic pattern and frictional heat [8,11,16,63]. For example, slip events and harsh braking were associated with an increase in UFP concentrations released from tire wear [16]. High speed was also associated with a relative increase of finer particles (PM2.5, which includes UFP) related to tire wear, likely due to the predominance of volatilization processes [16]. Likewise, an increase of concentrations in UFP from brake wear occurred at elevated temperature of the cast iron disc due to volatilization [15].
3.5. Implications for Human Health
3.5.1. Risk of Exposure to UFP and Their Oxidative Potential
In Toronto road dust, UFP constituted a small mass fraction of resuspended PM10 (median 2 wt.%; Figure 1). However, toxicological studies generally agree that particle number and surface area are better metrics than mass to relate PM impact to health effects [18]. In terms of particle number concentration, UFP dominate in ambient air; in Europe, they account for >90% of airborne particles [3]. Considering that road vehicles are often the dominant sources of UFP in urban environments, populations living close to heavy-traffic roads are generally expected to be exposed to higher UFP concentration than those living in less traffic area [18,64]. The high number of UFP is of toxicological concern because the presence of high UFP numbers combined with their large surface area result in more particles accumulating in exposed lung cells, ultimately having an enhanced potential to induce adverse effects on target organs [5].
Our results indicate that communities living close to arterial roads would be exposed to UFP with higher concentrations of Cr, Cd, Zn and V compared to those living in less intense traffic areas (near local roads). Exposure to Zn-rich UFP from resuspended road dust would be the highest close to expressways. Transition metals are believed to play a direct role in the genotoxicity of PM by promoting the formation of ROS, which can lead to DNA damage [65]. The capacity of metals in UFP to cause oxidative stress and inflammation in the lung environment can be measured by various acellular oxidative potential (OP) assays [21]. A study in Toronto demonstrated that elements associated with non-tailpipe traffic emissions including Ba, Fe, Zn were moderately correlated with measured oxidative potential of PM2.5 dust [48]. Likewise, elevated Fe and Ba concentrations in PM10 from road emissions in London (UK) were associated with increased oxidative potential measured by depletion of glutathione [20]. In Birmingham (UK), various size fractions of airborne PM (<7 µm) collected at high-traffic locations displayed greater oxidative potential than comparable size-fraction PM sampled in areas with less traffic [65]. While the sampling location was generally a stronger determinant than particle size for the observed PM toxicity on the cells, it was noteworthy that the finest PM (<0.5 µm) caused a significantly greater release of pro-inflammatory mediators than the coarser fractions (0.5 to 7 µm), regardless of sampling locations. Wessels et al. [65] suggested that metal enrichment reported for UFP at high-traffic locations might explain their pro-inflammatory action.
3.5.2. Toxicity of Metals in UFP
Compared to the dust box samples, the enrichment in Cr, Cd, Zn, V and, to a lesser extent, Fe and Ba in UFP raises the question of potential toxic effects linked to exposures via the inhalation pathway. Cd and its compounds, as well as Cr (VI) and its compounds, have been classified as known carcinogens to humans (group 1, International Agency for Research on Cancer-IARC) based on strong evidence for increased risk of lung cancer [66]. Vanadium oxide is classified as a possible carcinogen (group 2B, IARC) and is a respiratory irritant [66]. Nanoparticles can lead to oxidative stress via two main modes of action: induction based on the dissolved species (high solubility like CuO and ZnO) vs. the nanoparticle itself (low solubility, e.g., α−Fe2O3, Fe3O4, Al2O3) [67].
For the fine fraction (<1.8 µm) of these Toronto Road dust samples, the metal solubility/bioaccessibility in the lung environment was evaluated in a related study using ammonium citrate (pH 4.4) to simulate lysosomal fluid and Gamble’s solution (pH 7.2) to simulate interstitial lung fluid [31]. At pH 4.4, the following bioaccessibility (% of total concentration) was reported for local road dust: Zn (78%) > Ba (56%) > Fe (35%) ≈ V (33%) > Cr (14%); Cd was <LOD. Metal bioaccessibilities were much lower in the Gamble’s extracts (range for local road, arterial road and expressway): Ba (7 to 21%) > Zn (6 to 8%); Fe, V, Cr and Cd were <LOD. These in vitro bioaccessibility assays indicated that Zn would be the transition metal with the highest solubility following inhalation of these UFP. Given the high concentration of Zn in expressway UFP, combined with its high bioaccessibility, further research should address the potential inhalation toxicity of these UFP.
In addition to solubility, research on fairly homogeneous engineered NP (such as metal oxide nanomaterials) has shown that their capacity to induce oxidative and pro-inflammatory effects in the cells depends on their basic physico-chemical and mineralogical properties such as: size, crystalline structure, morphology, aspect ratio, surface area, catalytic nature, band gap energy level, composition, and surface coating [67,68,69,70]. In heterogeneous and complex media such as dust, metals occur as a mixture of various species with different properties. For example, a wide variety of Zn species were found in indoor dust and road dust, including distinct mineral phases (e.g., Zn oxide, Zn sulfide, Zn hydroxyl carbonate), Zn organic compounds (e.g., Zn phosphate), Zn sorbed on organic or Fe-, Mn-, Al-oxyhydroxide phases, and Zn-bearing silicates [71,72,73]. Likewise, a variety of Fe-bearing nanoparticles have been detected in street dust and vehicular emissions, including ferrihydrite, goethite, hematite, magnetite, maghemite, siderite, metallic Fe, wüstite, ferrohexahydrite and carbon/Fe agglomerates [9,74,75]. Understanding the mineralogical composition and speciation of metals in the nano-scale fraction of road dust is thus crucial to assess their solubility and potential toxicological impact. However, such studies are scarce and future research efforts should be oriented in that direction.
4. Conclusions
Resuspension of road dust is one of the major sources of airborne PM pollution in large cities. The literature has established elevated concentrations of key metals associated with vehicle emissions, and a tendency for metals to accumulate in the thoracic (PM10) and respirable (PM2.5) size fractions. Our study demonstrates that some of the transition metals, such as Cd, Cr, Zn and V, further concentrate into resuspendable UFP, a particle size fraction particularly relevant to human health concerns. The inhalation of UFP has the potential to cause oxidative stress in lung cells and transition metals play an active role in these toxicological responses. Much effort has been dedicated in the last 10 years to investigate the toxicological impact of engineered nanoparticles. However, important knowledge gaps still exist on the composition and toxicological impact of environmental UFP. To address the toxicological impact of metals in UFP, there is a need to advance our understanding of their contributing sources (natural vs. anthropogenic), their mineral phases/metal speciation, and their transformations resulting from thermal and chemical reactions during incidental release from vehicles, or from interactions with other road dust components (e.g., carbonaceous phase).
Supplementary Materials
The following are available online at https://www.mdpi.com/article/10.3390/atmos12121564/s1, Table S1: QA/QC for ICP measurements of certified reference materials; Figure S1: Ratios of element concentrations in the aerosolized sub-micron fractions compared to the dust box; Figure S2: Scatterplot matrix of Spearman’s correlations between variables in UFP.
Author Contributions
Conceptualization, P.E.R. and C.L.S.W.; Data curation, S.B., C.L. and P.E.R.; Formal analysis, S.B.; Funding acquisition, P.E.R. and C.L.S.W.; Methodology, P.E.R. and C.L.; Visualization, S.B.; Writing—original draft, S.B.; Writing—review & editing, P.E.R., C.L. and C.L.S.W. All authors have read and agreed to the published version of the manuscript.
Funding
The project was supported by Health Canada’s Chemicals Management Plan Nanotechnology Fund and the Natural Sciences and Engineering Research Council of Canada (NSERC Discovery Grants Program, RGPIN-2018-05966).
Data Availability Statement
Not applicable.
Acknowledgments
The authors thank Vesna Stefanovic-Briatico from the City of Toronto for coordinating the collection of the road dust sweepings, and Jianjun Niu for technical assistance in the laboratory. Mario Beauchemin (Natural Resources Canada, Ottawa; retired) is gratefully acknowledged for his contribution with hierarchical agglomerative clustering. The thorough internal reviews by Mary-Luyza Avramescu and Kathy Nguyen (Health Canada, Ottawa) were greatly appreciated.
Conflicts of Interest
The authors declare no conflict of interest.
References
- WHO. Preventing Disease through Healthy Environments: A Global Assessment of the Burden of Disease from Environmental Risks; World Health Organization: Geneva, Switzerland, 2016; 147p, ISBN 978 92 4 156519 6. [Google Scholar]
- WHO. Ambient Air Pollution: A Global Assessment of Exposure and Burden of Disease; World Health Organization: Geneva, Switzerland, 2016; 131p, ISBN 978 92 4 151135 3. [Google Scholar]
- Air Quality Expert Group. Ultrafine Particles (UFP) in the UK; Prepared for the Department for Environment, Food and Rural Affairs; Scottish Government; Welsh Government; and Department of the Environment in Northern Ireland; Report No. PB14510; Department for Environment, Food and Rural Affairs: London, UK, 2018. Available online: https://uk-air.defra.gov.uk/library/reports.php?report_id=968 (accessed on 21 April 2020).
- Brown, J.S.; Gordon, T.; Price, O.; Asgharian, B. Thoracic and respirable particle definitions for human health risk assessment. Part. Fibre Toxicol. 2013, 10, 12. [Google Scholar] [CrossRef] [Green Version]
- Geiser, M.; Kreyling, W.G. Deposition and biokinetics of inhaled nanoparticles. Part. Fibre Toxicol. 2010, 7, 2–17. [Google Scholar] [CrossRef] [Green Version]
- Sutunkova, M.P.; Katsnelson, B.A.; Privalova, L.I.; Gurvich, V.B.; Konysheva, L.K.; Shur, V.; Shishkina, E.V.; Minigalieva, I.A.; Solovjeva, S.N.; Grebenkina, S.V.; et al. On the contribution of the phagocytosis and the solubilization to the iron oxide nanoparticles retention in and elimination from the lungs under long-term inhalation. Toxicology 2016, 363–364, 19–28. [Google Scholar] [CrossRef]
- Tian, L.; Shang, Y.; Chen, R.; Bai, R.; Chen, C.; Inthavong, K.; Tu, J. Correlation of regional deposition for inhaled nanoparticles in human and rat olfactory. Part. Fibre Toxicol. 2019, 16, 6. [Google Scholar] [CrossRef] [PubMed]
- Thorpe, A.; Harrison, R.M. Sources and properties of non-exhaust particulate matter from road traffic: A review. Sci. Total Environ. 2008, 400, 270–282. [Google Scholar] [CrossRef]
- Yang, Y.; Vance, M.; Tou, F.; Tiwari, A.; Liu, M.; Hochella, M.F., Jr. Nanoparticles in road dust from impervious urban surfaces: Distribution, identification, and environmental implications. Environ. Sci. Nano 2016, 3, 534–544. [Google Scholar] [CrossRef] [Green Version]
- Lenschow, P.; Abraham, H.-J.; Kutzner, K.; Lutz, M.; Preu, J.-D.; Reichenbächer, W. Some ideas about sources of PM10. Atmos. Environ. 2001, 35 (Suppl. S1), S23–S33. [Google Scholar] [CrossRef]
- Kumar, P.; Pirjola, L.; Ketzel, M.; Harrison, R.M. Nanoparticle emissions from 11 non-vehicle exhaust source—A review. Atmos. Environ. 2013, 67, 252–277. [Google Scholar] [CrossRef] [Green Version]
- Pant, P.; Harrison, R.M. Estimation of the contribution of road traffic emissions to particulate matter concentrations from field measurements: A review. Atmos. Environ. 2013, 77, 78–97. [Google Scholar] [CrossRef]
- Ramirez, O.; Sánchez de la Campa, A.M.; Amato, F.; Moreno, T.; Silva, L.F.; de la Rosa, J.D. Physicochemical characterization and sources of thoracic fraction of road dust in a Latin American megacity. Sci. Total Environ. 2019, 652, 434–446. [Google Scholar] [CrossRef]
- Wiseman, C.L.S.; Levesque, C.; Rasmussen, P.E. Elemental sources and concentrations in thoracic-sized road dust fractions and their potential for resuspension. Sci. Total Environ. 2021, 786, 147467. [Google Scholar] [CrossRef] [PubMed]
- Kukutschová, J.; Moravec, P.; Tomášek, V.; Matejka, V.; Smolík, J.; Schwarz, J.; Seidlerová, J.; Šafářová, K.; Filip, P. On airborne nano/micro-sized wear particles released from low-metallic automotive brakes. Environ. Pollut. 2011, 159, 998–1006. [Google Scholar] [CrossRef]
- Kim, G.; Lee, S. Characteristics of tire wear particles generated by a tire simulator under various driving conditions. Environ. Sci. Technol. 2018, 52, 12153–12161. [Google Scholar] [CrossRef] [PubMed]
- Ermolin, M.S.; Fedotov, P.S.; Ivaneev, A.I.; Karandashev, V.K.; Fedyunina, N.N.; Eskina, V.V. Isolation and quantitative analysis of road dust nanoparticles. J. Anal. Chem. 2017, 72, 520–532. [Google Scholar] [CrossRef]
- Heal, M.R.; Kumar, P.; Harrison, R.M. Particles, air quality, policy and health. Chem. Soc. Rev. 2012, 41, 6606–6630. [Google Scholar] [CrossRef] [PubMed] [Green Version]
- Cass, G.R.; Hughes, L.A.; Bhave, P.; Kleeman, M.J.; Allen, J.O.; Salmon, L.G. The chemical composition of atmospheric ultrafine particles. Phil. Trans. R. Soc. Lond. A 2000, 358, 2581–2592. [Google Scholar] [CrossRef]
- Godri, K.J.; Harrison, R.M.; Evans, T.; Baker, T.; Dunster, C.; Mudway, I.S.; Kelly, F.J. Increased oxidative burden associated with traffic component of ambient particulate matter at roadside and urban background school sites in London. PLoS ONE 2011, 6, e21961. [Google Scholar] [CrossRef] [Green Version]
- Bates, J.T.; Fang, T.; Verma, V.; Zeng, L.; Weber, R.J.; Tolbert, P.E.; Abrams, J.Y.; Sarnat, S.E.; Klein, M.; Mulholland, J.A.; et al. Review of acellular assays of ambient particulate matter oxidative potential: Methods and relationships with composition, sources and health effects. Environ. Sci. Technol. 2019, 53, 4003–4019. [Google Scholar] [CrossRef]
- Apeagyei, E.; Bank, M.S.; Spengler, J.D. Distribution of heavy metals in road dust along an urban-rural gradient in Massachusetts. Atmos. Environ. 2011, 45, 2310–2323. [Google Scholar] [CrossRef]
- Abdel-Latif, N.M.; Saleh, I.A. Heavy metals contamination in roadside dust along major roads and correlation with urbanization activities in Cairo, Egypt. J. Am. Sci. 2012, 8, 379–389. [Google Scholar]
- Wiseman, C.L.S.; Hassan Pour, Z.; Zereini, F. Platinum group element and cerium concentrations in roadside environments in Toronto, Canada. Chemosphere 2016, 145, 61–67. [Google Scholar] [CrossRef] [PubMed]
- Miazgowicz, A.; Krennhuber, K.; Lanzerstorfer, C. Metals concentrations in road dust from high traffic and low traffic area: A size dependent comparison. Int. J. Environ. Sci. Technol. 2020, 17, 3365–3372. [Google Scholar] [CrossRef] [Green Version]
- Acosta, J.A.; Faz, A.; Kalbitz, K.; Jansen, B.; Martínez-Martínez, S. Heavy metal concentrations in particle size fractions from street dust of Murcia (Spain) as the basis for risk assessment. J. Environ. Monit. 2011, 13, 3087–3096. [Google Scholar] [CrossRef] [PubMed]
- Padoan, E.; Romè, C.; Ajmone-Marsan, F. Bioaccessibility and size distribution of metals in road dust and roadside soils along a peri-urban transect. Sci. Total Environ. 2017, 601–602, 89–98. [Google Scholar] [CrossRef] [PubMed]
- Wiseman, C.L.S.; Niu, J.; Levesque, C.; Chénier, M.; Rasmussen, P.E. An assessment of the inhalation bioaccessibility of platinum group elements in road dust using a simulated lung fluid. Environ. Pollut. 2018, 241, 1009–1017. [Google Scholar] [CrossRef]
- Lanzerstorfer, C. Heavy metals in the finest size fractions of road-deposited sediments. Environ. Pollut. 2018, 239, 522–531. [Google Scholar] [CrossRef]
- Lanzerstorfer, C.; Logiewa, A. The upper size limit of the dust samples in road dust heavy metal studies: Benefits of a combined sieving and air classification sample preparation procedure. Environ. Pollut. 2019, 245, 1079–1085. [Google Scholar] [CrossRef]
- Levesque, L.; Wiseman, C.L.S.; Beauchemin, S.; Rasmussen, P.E. Thoracic fraction (PM10) of resuspended urban dust: Geochemistry, particle size distribution and lung bioaccessibility. Geosciences 2021, 11, 87. [Google Scholar] [CrossRef]
- Statistics Canada. Census Profile by Toronto Community Areas. 2016. Available online: https://www.toronto.ca/city-government/data-research-maps/neighbourhoods-communities/community-council-area-profiles/ (accessed on 15 April 2020).
- Rasmussen, P.E.; Gardner, H.D.; Jianjun, J. Buoyancy-corrected gravimetric analysis of lightly loaded filters. J. Air Waste Manag. Assoc. 2010, 60, 1065–1077. [Google Scholar] [CrossRef]
- Niu, J.; Rasmussen, P.E.; Chénier, M. Ultrasonic dissolution for ICP-MS determination of trace elements in lightly loaded airborne PM filters. Intern. J. Environ. Anal. Chem. 2013, 93, 661–678. [Google Scholar] [CrossRef]
- Morrison, J.M.; Goldhaber, M.B.; Lee, L.; Holloway, J.M.; Wanty, R.B.; Wolf, R.E.; Ranville, J.F. A regional-scale study of chromium and nickel in soils of northern California, USA. Appl. Geochem. 2009, 24, 1500–1511. [Google Scholar] [CrossRef]
- Huggins, F.E.; Huffman, G.P.; Robertson, J.D. Speciation of elements in NIST particulate matter SRMs 1648 and 1650. J. Hazar. Mater. 2000, 74, 1–23. [Google Scholar] [CrossRef]
- Tabachnick, B.G.; Fidell, L.S. Using Multivariate Statistics, 2nd ed.; HarperCollins Publishers: New York, NY, USA, 1989. [Google Scholar]
- Analytical Methods Committee. What Should Be Done with Results below the Detection Limit? Mentioning the Unmentionable; AMC Technical Brief. No. 5; Royal Society of Chemistry: London, UK, 2001; Available online: https://www.rsc.org/images/results-below-detection-limit-technical-brief-5_tcm18-214854.pdf (accessed on 26 September 2019).
- Helsel, D.R. Less than obvious. Statistical treatment of data below detection limit. Environ. Sci. Technol. 1990, 24, 1767–1774. [Google Scholar] [CrossRef]
- USEPA. Guidance for Data Quality Assessment. Practical Methods for Data Analysis; EPA QA/G-9. QA00 Update; United States Environmental Protection Agency: Washington, DC, USA, 2000. Available online: https://www.epa.gov/sites/production/files/2015-06/documents/g9-final.pdf (accessed on 15 October 2019).
- NIST/SEMATECH. e-Handbook of Statistical Methods; Section 7.1.6; U.S. Department of Commerce: Washington, DC, USA, 2012. Available online: http://www.itl.nist.gov/div898/handbook/ (accessed on 26 September 2019).
- Hart, A. Mann-Whitney test is not just a test of medians: Differences in spread can be important. Br. Med. J. 2001, 323, 391–393. [Google Scholar] [CrossRef] [Green Version]
- Van Dongen, S.; Enright, A.J. Metric distances derived from cosine similarity and Pearson and Spearman correlations. arXiv 2012, arXiv:1208.3145v1. [Google Scholar]
- R Core Team. A Language and Environment for Statistical Computing; Version 4.0.0; Released 24 April 2020; R Foundation for Statistical Computing: Vienna, Austria, 2020; Available online: https://www.r-project.org/ (accessed on 2 June 2020).
- McKeague, J.A.; Desjardins, J.G.; Wolynetz, M.S. Minor Elements in Canadian Soils; Land Resource Research Institute Contribution No. LRRI 27; Agriculture and Agri-Food Canada: Edmonton, AB, Canada, 1979; 75p. [Google Scholar]
- Rasmussen, P.E.; Subramanian, K.S.; Jessiman, B.J. A multi-element profile of house dust in relation to exterior dust and soils in the city of Ottawa, Canada. Sci. Total Environ. 2001, 267, 125–140. [Google Scholar] [CrossRef]
- Ciacci, L.; Reck, B.K.; Nassar, N.T.; Graedel, T.E. Lost by design. Environ. Sci. Technol. 2015, 49, 9443–9451. [Google Scholar] [CrossRef] [PubMed]
- Jeong, C.-H.; Traub, A.; Huang, A.; Hilker, N.; Wang, J.M.; Herod, D.; Dabek-Zlotorynska, E.; Celo, V.; Evans, G.J. Long-term analysis of PM2.5 from 2004 to 2007 in Toronto: Composition, sources, and oxidative potential. Environ. Pollut. 2020, 263, 114652. [Google Scholar] [CrossRef]
- Kong, S.; Lu, B.; Ji, Y.; Zhao, X.; Bai, Z.; Xu, Y.; Liu, Y.; Jiang, H. Risk assessment of heavy metals in road and soil dusts within PM2.5, PM10 and PM100 fractions in Dongying city, Shandong Province, China. J. Environ. Monit. 2012, 14, 791–803. [Google Scholar] [CrossRef]
- Padoan, E.; Malandrino, M.; Giacomino, A.; Grosa, M.M.; Lollobrigida, F.; Martini, S.; Abollino, O. Spatial distribution and potential sources of traces elements in PM10 monitored in urban and rural sites of Piedmont region. Chemospere 2016, 145, 495–507. [Google Scholar] [CrossRef]
- WHO. World Health Organization Air Quality Guidelines for Europe, 2nd ed.; CD ROM Version; World Health Organization: Geneva, Switzerland, 2000; Available online: https://www.euro.who.int/en/health-topics/environment-and-health/air-quality/publications/pre2009/who-air-quality-guidelines-for-europe,-2nd-edition,-2000-cd-rom-version (accessed on 12 October 2020).
- Canadian Council of Ministers of the Environment (CCME). Canadian soil quality guidelines for the protection of environmental and human health: Cadmium (1999). In Canadian Environmental Quality Guidelines; Canadian Council of Ministers of the Environment: Winnipeg, MB, Canada, 1999. [Google Scholar]
- Canadian Council of Ministers of the Environment (CCME). Canadian water quality guidelines for the protection of aquatic life: Chromium—Hexavalent chromium and trivalent chromium. In Canadian Environmental Quality Guidelines; Canadian Council of Ministers of the Environment: Winnipeg, MB, Canada, 1999. [Google Scholar]
- Canadian Council of Ministers of the Environment (CCME). Canadian soil quality guidelines for the protection of environmental and human health: Zinc (2018). In Canadian Environmental Quality Guidelines; Canadian Council of Ministers of the Environment: Winnipeg, MB, Canada, 1999. [Google Scholar]
- Dabek-Zlotorzynska, E.; Celo, V.; Ding, L.; Herod, D.; Jeong, C.-H.; Evans, G.; Hilker, N. Characteristics and sources of PM2.5 and reactive gases near roadways in two metropolitan areas in Canada. Atmos. Environ. 2019, 218, 116980. [Google Scholar] [CrossRef]
- WHO. Asphalt (Bitumen); Concise International Chemical Assessment Document 59; World Health Organization: Geneva, Switzerland, 2004; ISBN 92 4 153059 6. [Google Scholar]
- Canadian Council of Ministers of the Environment (CCME). Canadian soil quality guidelines for the protection of environmental and human health: Vanadium (1997). In Canadian Environmental Quality Guidelines; Canadian Council of Ministers of the Environment: Winnipeg, MB, Canada, 1999. [Google Scholar]
- Canada. Screening Assessment Cobalt and Cobalt-Containing Substances; Cat. No.: EN14-273/2017E-PDF; Environment and Climate Change Canada: Gatineau, QC, Canada; Health Canada: Tunney’s Pasture, ON, Canada, 2017. Available online: https://www.ec.gc.ca/ese-ees/default.asp?lang=En&n=DCEB359C-1 (accessed on 18 June 2020).
- Datta, J.; Kosiorek, P.; Wloch, M. Effect of high loading of titanium dioxide particles on the morphology, mechanical and thermo-mechanical properties of the natural rubber-based composites. Iran. Polym. J. 2016, 25, 1021–1035. [Google Scholar] [CrossRef] [Green Version]
- Canadian Council of Ministers of the Environment (CCME). Canadian soil quality guidelines for the protection of environmental and human health: Barium. In Canadian Environmental Quality Guidelines; Canadian Council of Ministers of the Environment: Winnipeg, MB, Canada, 2013. [Google Scholar]
- Jeong, C.-H.; Wang, J.M.; Hilker, N.; Debosz, J.; Sofowote, U.; Su, Y.; Noble, M.; Healy, R.M.; Munoz, T.; Dabek-Zlotorzynska, E.; et al. Temporal and spatial variability of traffic-related PM2.5 sources: Comparison of exhaust and non-exhaust emissions. Atmos. Environ. 2019, 198, 55–69. [Google Scholar] [CrossRef]
- Khan, R.K.; Strand, M.A. Road dust and its effect on human health: A literate review. Epidemiol. Health 2018, 40, e2018013. [Google Scholar] [CrossRef] [PubMed]
- Nosko, O.; Vanhanen, J.; Olofsson, U. Emission of 1.3–10 nm airborne particles from brake materials. Aerosol Sci. Technol. 2017, 51, 91–96. [Google Scholar] [CrossRef] [Green Version]
- Hata, M.; Zhang, T.; Bao, L.; Otani, Y.; Bai, Y.; Furuuchi, M. Characteristics of the nanoparticles in a road tunnel. Aerosol Air Qual. Res. 2013, 13, 194–200. [Google Scholar] [CrossRef] [Green Version]
- Wessels, A.; Birmili, W.; Albrecht, C.; Hellack, B.; Jermann, E.; Wick, G.; Harrison, R.M.; Schins, R.P.F. Oxidant generation and toxicity of size-fractionated ambient particles in human lung epithelial cells. Environ. Sci. Technol. 2010, 44, 3539–3545. [Google Scholar] [CrossRef]
- Carex Canada. Priority Carcinogens; Faculty of Health Sciences, Simon Fraser University: Vancouver, BC, Canada, 2020; Available online: https://www.carexcanada.ca (accessed on 15 October 2020).
- Zhang, H.; Ji, Z.; Xia, T.; Meng, H.; Low-Kam, C.; Liu, R.; Pokhrei, S.; Lin, S.; Wang, X.; Liao, Y.-P.; et al. Use of metal oxide nanoparticle band gap to develop a predictive paradigm for oxidative stress and acute pulmonary inflammation. ACS Nano 2012, 6, 4349–4368. [Google Scholar] [CrossRef]
- Jin, C.; Tang, Y.; Yang, F.G.; Li, X.L.; Xu, S.; Fan, X.Y.; Huang, Y.Y.; Yang, Y.J. Cellular toxicity of TiO2 nanoparticles in anatase and rutile crystal phase. Biol. Trace Elem. Res. 2011, 141, 3–15. [Google Scholar] [CrossRef] [PubMed]
- Bushell, M.; Beauchemin, S.; Kunc, F.; Gardner, D.; Ovens, J.; Toll, F.; Kennedy, D.; Nguyen, K.; Vladisavljevic, D.; Rasmussen, P.; et al. Characterization of commercial metal oxide nanomaterials: Crystalline phase, particle size and specific surface area. Nanomaterials 2020, 10, 1812. [Google Scholar] [CrossRef]
- Boyadzhiev, A.; Avramescu, M.-L.; Wu, D.; Williams, A.; Rasmussen, P.; Halappanavar, S. Impact of copper oxide particle solubility on lung epithelial cell toxicity: Response characterization using global transcriptional analysis. Nanotoxicology 2021, 15, 380–399. [Google Scholar] [CrossRef]
- Rasmussen, P.E.; Beauchemin, S.; Nugent, M.; Dugandzic, R.; Lanouette, M.; Chénier, M. Influence of matrix composition on the bioaccessibility of copper, zinc, and nickel in urban residential dust and soil. Hum. Ecol. Risk Assess. 2008, 14, 351–371. [Google Scholar] [CrossRef]
- Barrett, J.E.S.; Taylor, K.G.; Hudson-Edwards, K.A.; Charnock, J.M. Solid-phase speciation of Zn in road dust sediment. Mineral. Mag. 2011, 75, 2611–2629. [Google Scholar] [CrossRef]
- Beauchemin, S.; Rasmussen, P.E.; Mackinnon, T.; Chénier, M.; Boros, K. Zinc in house dust: Speciation, bioaccessibility, and impact of humidity. Environ. Sci. Technol. 2014, 48, 9022–9029. [Google Scholar] [CrossRef] [PubMed]
- Gonet, T.; Maher, B.A. Airborne, vehicle-derived Fe-bearing nanoparticles in the urban environment: A review. Environ. Sci. Technol. 2019, 53, 9970–9991. [Google Scholar] [CrossRef] [PubMed]
- Silva, L.F.O.; Pinto, D.; Neckel, A.; Oliveira, M.L.S. An analysis of vehicular exhaust derived nanoparticles and historial Belgium fortress building interfaces. Geosci. Front. 2020, 11, 2053–2060. [Google Scholar] [CrossRef]
Figure 1.
Distribution of the mass collected among the nano, sub-micron and micron classes of filters for each resuspended dust box sample, expressed as median % of the total resuspended PM10 (total mass recovered on filters < 10 µm >10 nm); inset overall median % of the total resuspended PM10 for all 6 samples, and inter quantile range (IQR.).
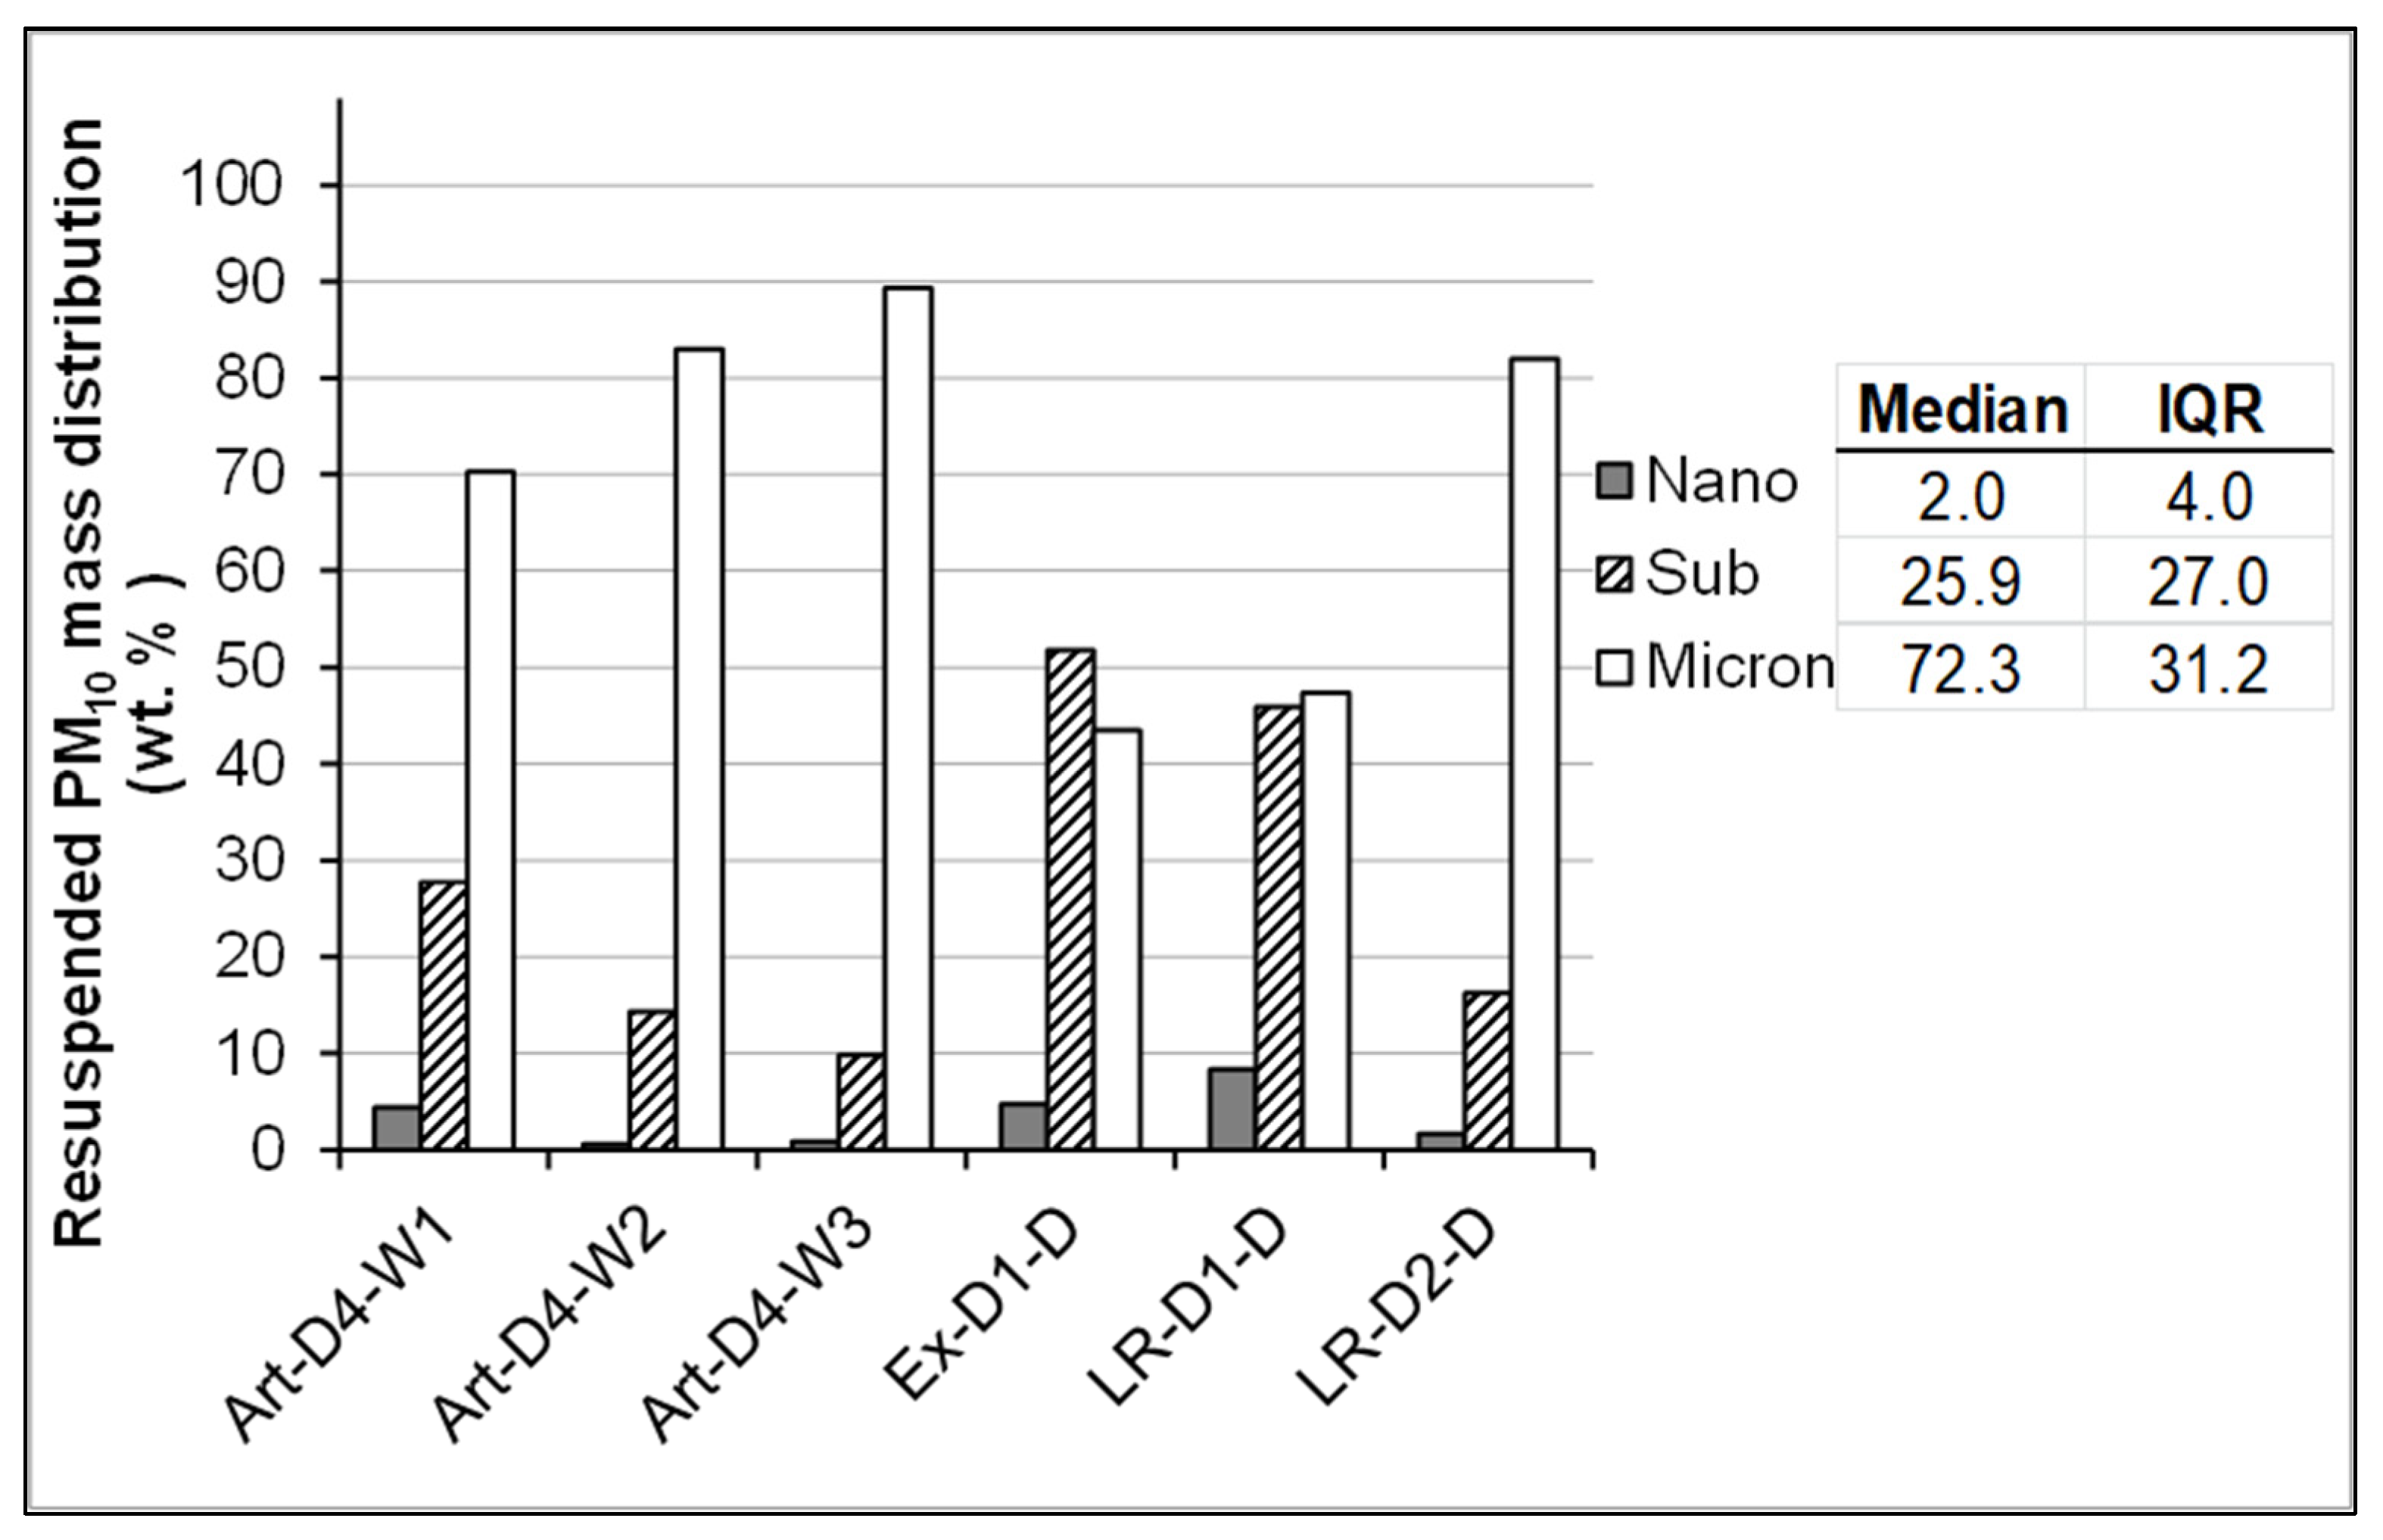
Figure 2.
Ratios of element concentrations in the aerosolized nano fractions compared to the dust box considering all six road dust samples (nano/dust box ratio); each box plot shows the median within the 25th and 75th percentile box, dispersion extending 1.5 × IQR from each quartile, as well as near (>1.5 IQR) and far (>3 IQR) outliers. The 95% confidence interval for the median is plotted as a notch on the box. Elements circled in gray: not considered because >50% values < LOD; plain and dotted lines at nano/dust box ratio = 1 or 2 respectively: visual guidelines.
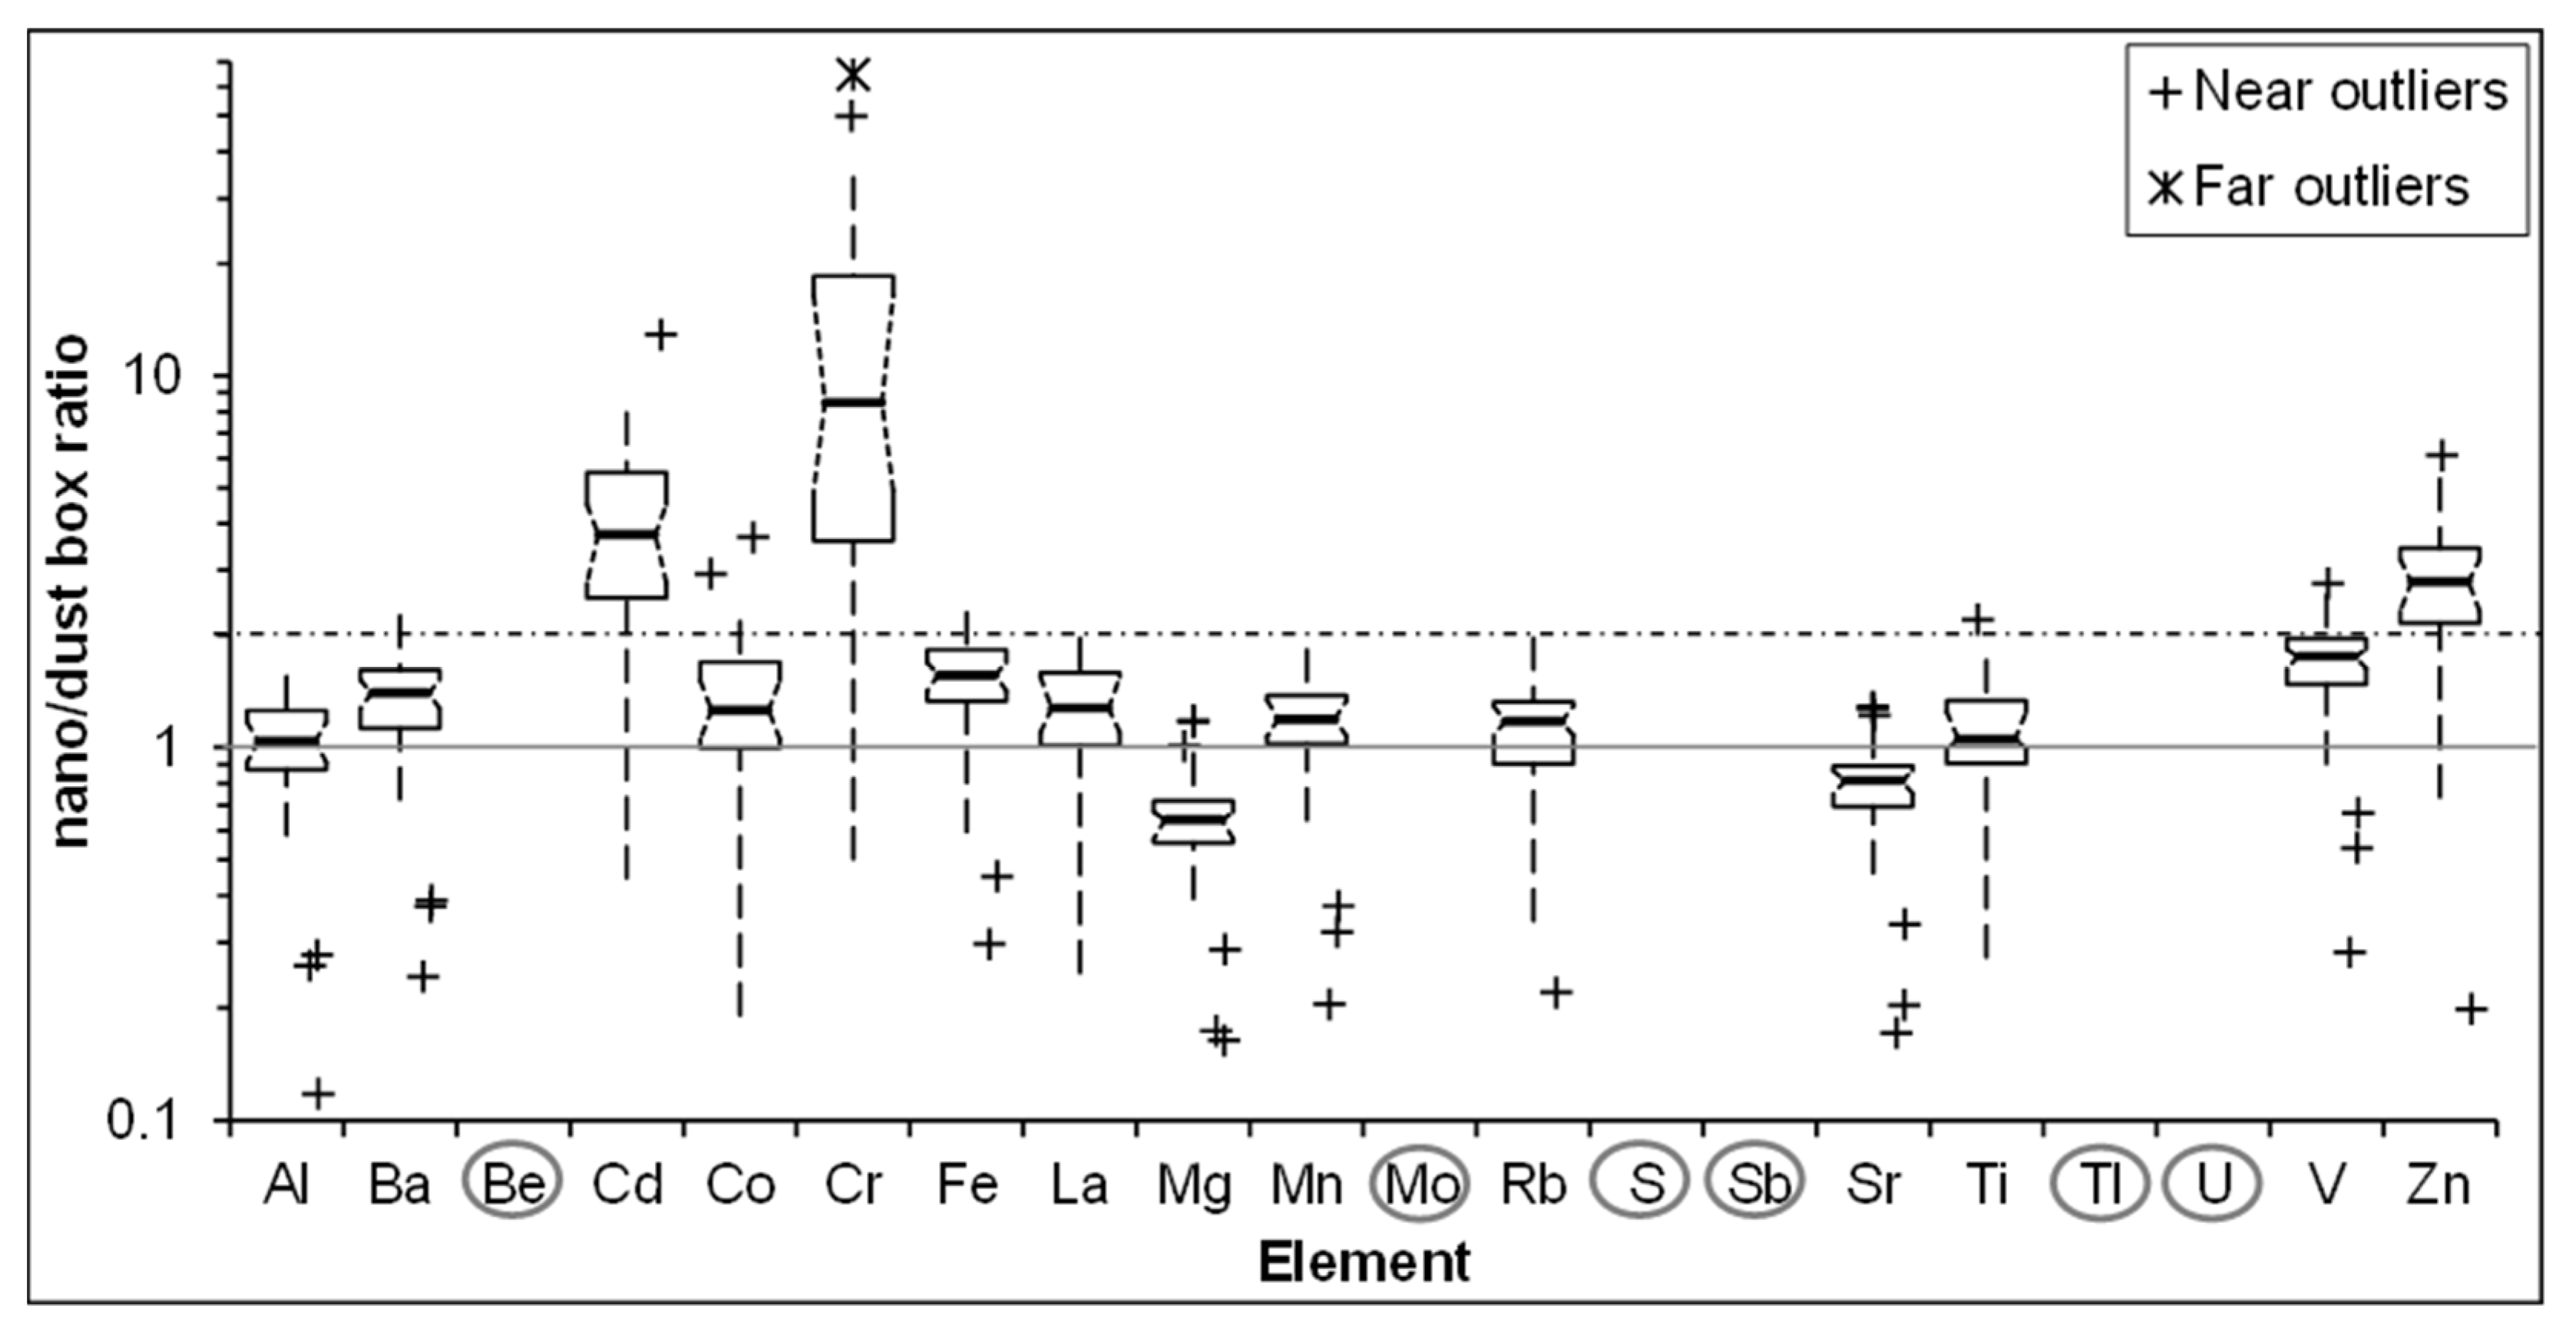
Figure 3.
Dendrogram obtained by Spearman’s correlation matrix-based HAC on the data set composed of key elements in all nano-scale dust fractions (n = 35).
Figure 3.
Dendrogram obtained by Spearman’s correlation matrix-based HAC on the data set composed of key elements in all nano-scale dust fractions (n = 35).
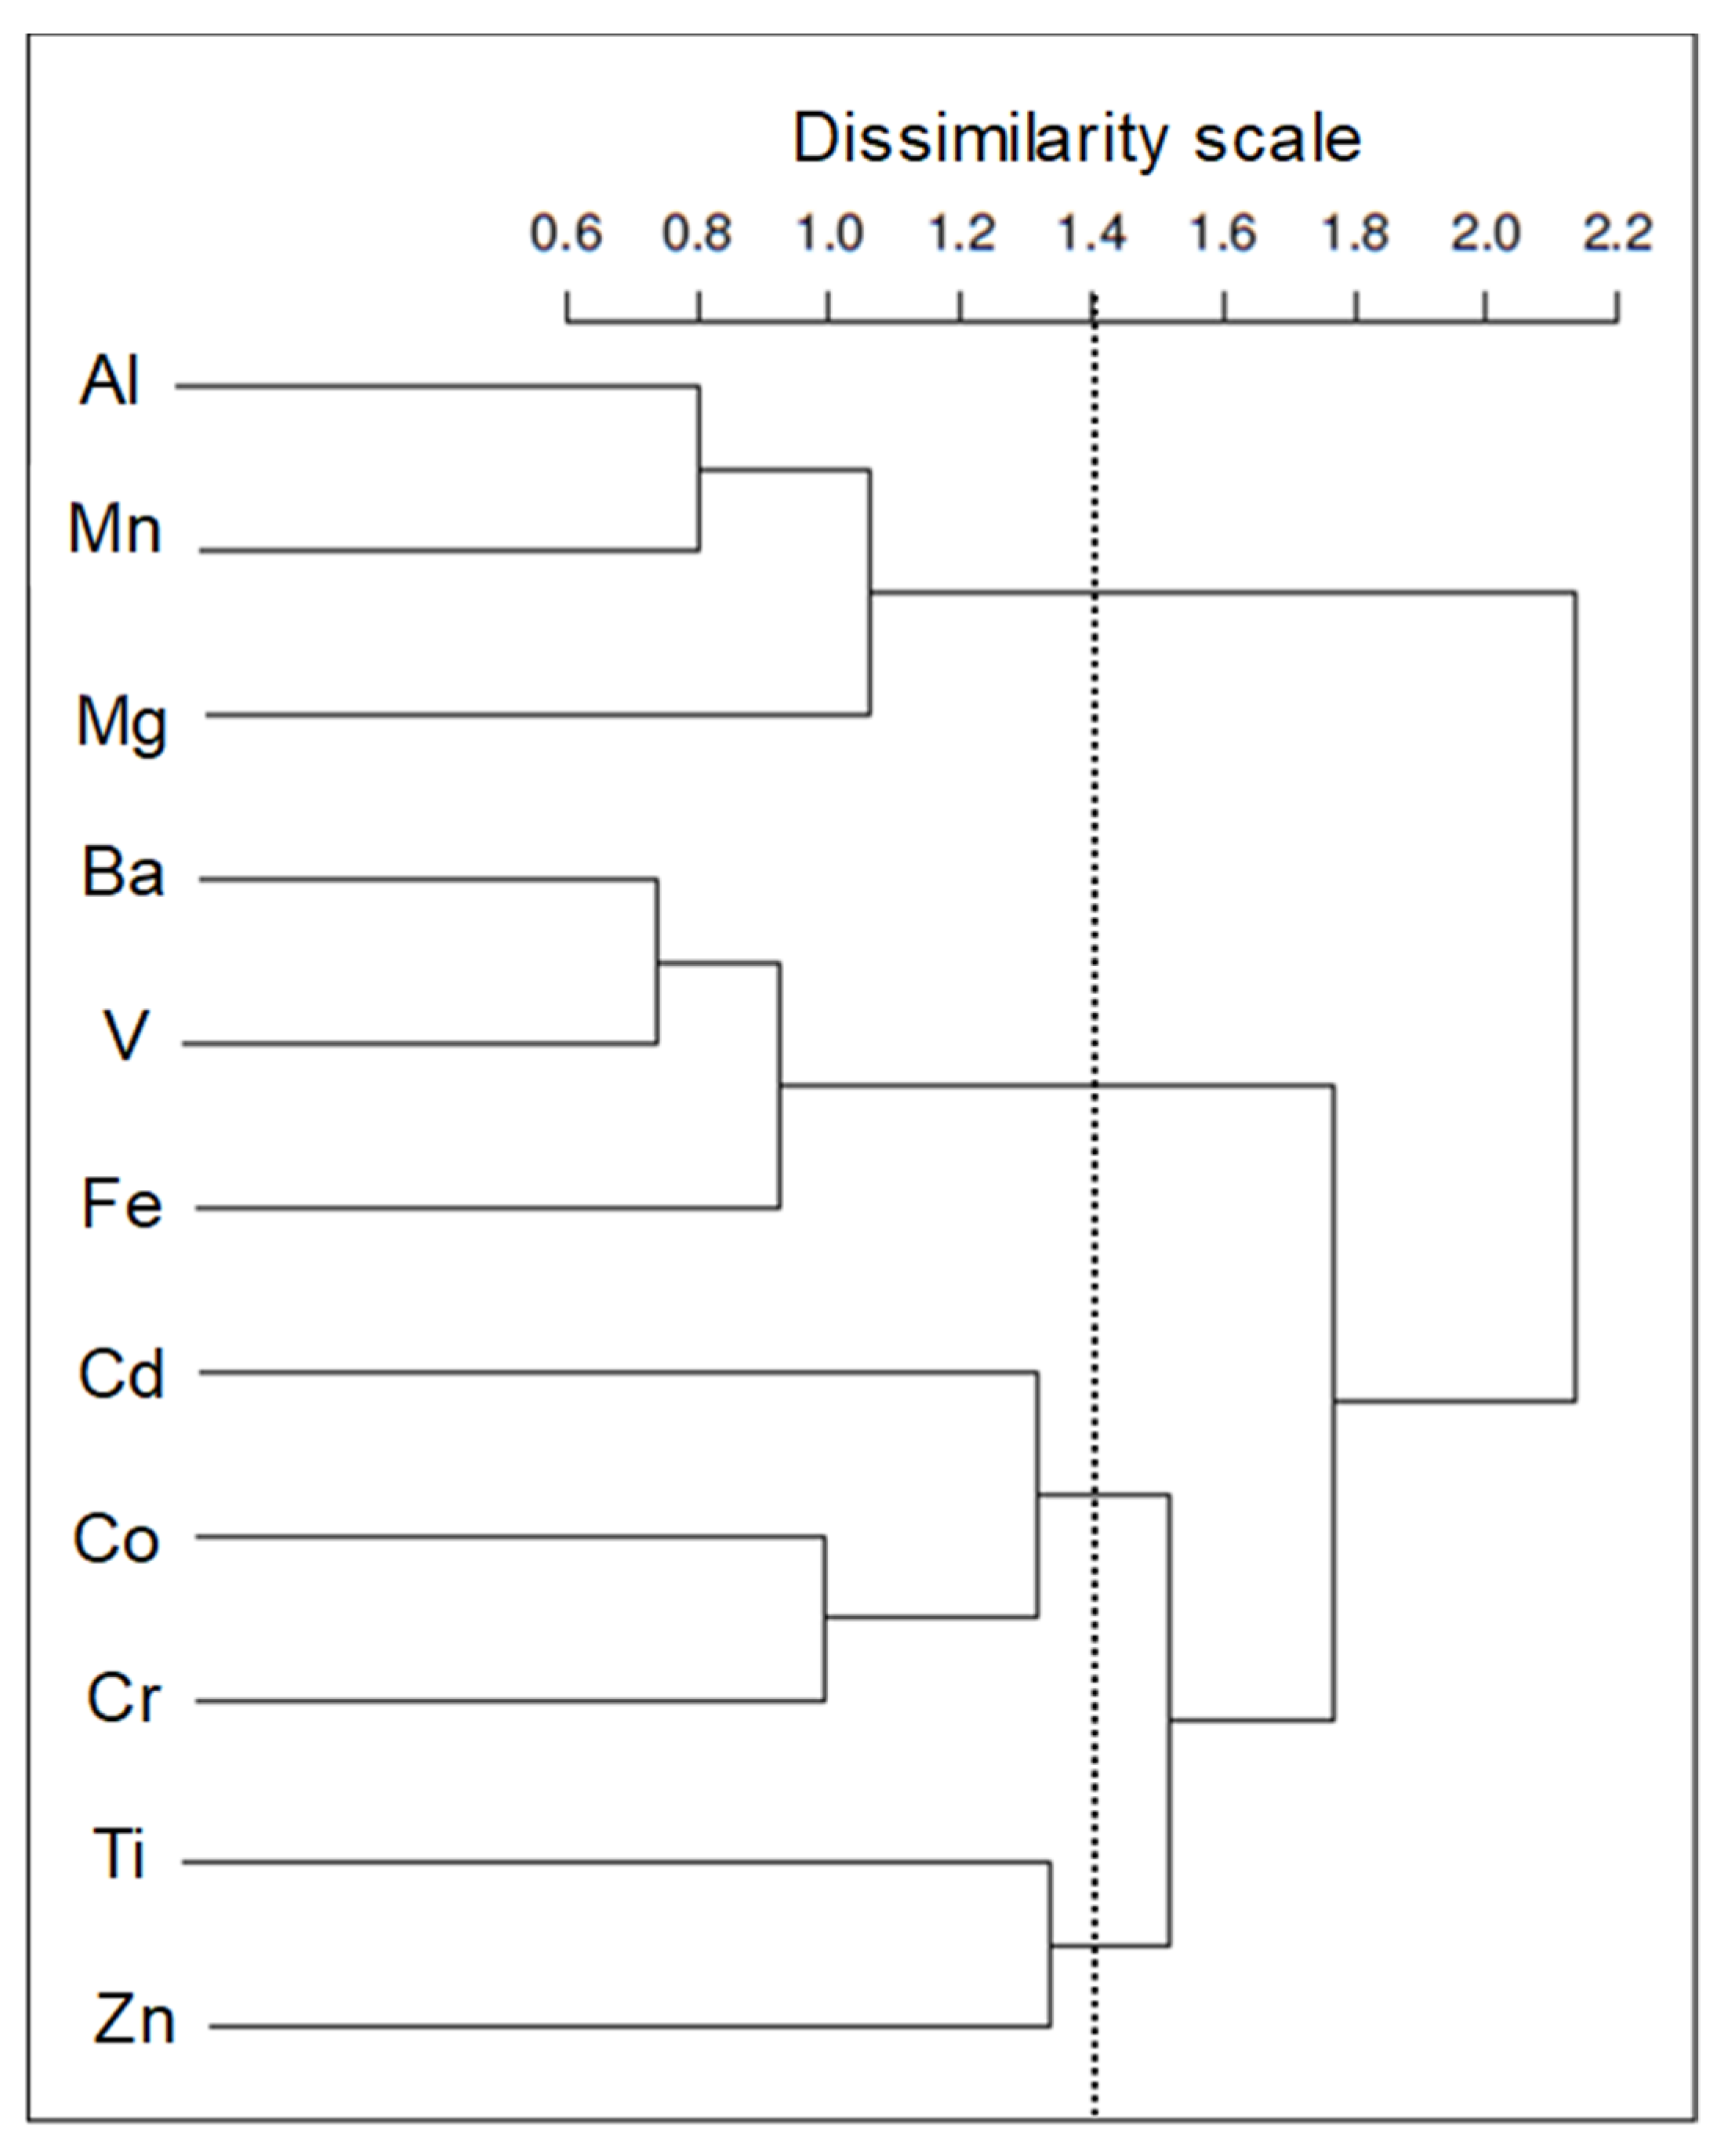
Figure 4.
Concentrations of Cd, Cr, Zn and V in the nano fractions for each road type; each box plot shows the median within the 25th and 75th percentile box, dispersion from 5th to 95th percentile. The 95% confidence interval for the median is plotted as a notch on the box. For a given element, median concentrations labeled with the same letter are not statistically different based on Wilcoxon-Mann-Whitney rank test (p > 0.05). Fractionation was conducted in two to three replicates on each dust box and each replicate had 4 nano fractions (Art: n = 31; Ex: n = 5; LR: n = 11).

Table 1.
Impaction stages of the MOUDI II impactor, corresponding particle sizes collected on the filters and classes defined for the current study.
Table 1.
Impaction stages of the MOUDI II impactor, corresponding particle sizes collected on the filters and classes defined for the current study.
| Nano MOUDI Nominal Cut-Point | Particle Size on Filter | Classes |
|---|---|---|
| nm | nm | |
| 10,000 | >10,000 | - |
| 5600 | <10,000 >5600 | Micron 1–10 µm (PM10-1) |
| 3200 | <5600 >3200 | |
| 1800 | <3200 >1800 | |
| 1000 | <1800 >1000 | |
| 560 | <1000 >560 | Sub-micron 0.1–1 µm (PM1-0.1) |
| 320 | <560 >320 | |
| 180 | <320 >180 | |
| 100 | <180 >100 | |
| 56 | <100 >56 | Nano <100 nm (PM0.1 or UFP) |
| 32 | <56 >32 | |
| 18 | <32 >18 | |
| 10 | <18 >10 |
Table 2.
Mean pH, organic carbon content (OC) and concentrations (n = 3) of the main a elements in the six dust box samples analyzed in the present study, with comparative data from literature.
Table 2.
Mean pH, organic carbon content (OC) and concentrations (n = 3) of the main a elements in the six dust box samples analyzed in the present study, with comparative data from literature.
| Units | Art-D4-W1 | Art-D4-W2 | Art-D4-W3 | Ex-D1-D | LR-D1-D | LR-D2-D | Soil b | Ottawa Dust c | |
|---|---|---|---|---|---|---|---|---|---|
| pH | 7.94 | 7.55 | 7.90 | 8.08 | 8.01 | 8.58 | n.d. d | n.d. | |
| OC e | wt.% | 7.5 | 4.8 | 8.6 | 8.7 | 3.8 | n.d. | n.d. | n.d. |
| Si | wt.% | 7.23 | 7.84 | 8.97 | 12.02 | 8.05 | 9.45 | n.d. | n.d. |
| Fe | wt.% | 3.07 | 3.15 | 3.58 | 3.69 | 2.37 | 3.10 | 2.4 | 1.89 |
| Ca | wt.% | n.d. | n.d. | n.d. | n.d. | n.d. | n.d. | 1.5 | 9.68 |
| Mg | wt.% | 2.99 | 2.96 | 3.36 | 2.93 | 2.82 | 3.98 | 0.70 | 1.58 |
| Al | wt.% | 2.67 | 2.85 | 3.30 | 4.24 | 2.86 | 3.36 | 6.1 | 4.75 |
| S | wt.% | 1.17 | 1.33 | 1.09 | 0.32 | 0.38 | 0.39 | n.d. | n.d. |
| Ti | mg kg−1 | 1279 | 1437 | 1781 | 2045 | 1111 | 1332 | 4400 | n.d. |
| Zn | mg kg−1 | 1258 | 1112 | 1310 | 881 | 597 | 1051 | 41 | 112 |
| Mn | mg kg−1 | 1017 | 1113 | 1016 | 931 | 1183 | 1120 | 636 | 431 |
| Sr | mg kg−1 | 530 | 538 | 522 | 485 | 289 | 332 | 283 | 459 |
| Ba | mg kg−1 | 466 | 483 | 527 | 575 | 335 | 499 | n.d. | 576 |
| Cu | mg kg−1 | 235 | 219 | 254 | 235 | 129 | 194 | 16 | 66 |
| Pb | mg kg−1 | 192 | 227 | 171 | 107 | 156 | 131 | 23 | 39 |
| Cr | mg kg−1 | 168 | 173 | 173 | 221 | 120 | 223 | 48 | 43 |
a Other elements (As, B, Be, Bi, Cd, Ce, Co, La, Mo, Ni, Rb, Sb, Se, U, Tl, V, Zr) < 100 mg kg−1; Ag < LOD of 2.12 mg kg−1. b Element contents in surficial soils (A horizon) from the same physiographic region as Toronto (St. Lawrence lowlands) [45]. c Mean concentrations in street dust collected in Ottawa residential areas (dust fraction 100–250 µm; n = 45) [46]. d n.d.: not determined. e Organic carbon content estimated as loss on ignition (LOI)/1.724 [28].
Table 3.
Distribution of the recovered particle mass within the nano fractions and variability between replicates for each sample.
Table 3.
Distribution of the recovered particle mass within the nano fractions and variability between replicates for each sample.
| Sample | Size Fraction | Replicate 1 | Replicate 2 | Replicate 3 | Median | Mean | ±SD a | Fractions | Sum of Means |
|---|---|---|---|---|---|---|---|---|---|
| nm | __________________% of total nano mass_______________ | nm | % of total nano mass | ||||||
| Art-D4-W1 | <18 >10 | 13 | 15 | 26 | 15 | 18 | 7 | ||
| <32 >18 | 18 | 32 | 0 | 18 | 17 | 16 | <32 >10 | 35 | |
| <56 >32 | 25 | 39 | 28 | 28 | 30 | 8 | |||
| <100 >56 | 44 | 14 | 46 | 44 | 35 | 18 | <100 >32 | 65 | |
| Art-D4-W2 | <18 >10 | 9 | . b | 6 | 6 | 7 | 4 | ||
| <32 >18 | 8 | . | 13 | 13 | 11 | 10 | <32 >10 | 18 | |
| <56 >32 | 48 | . | 34 | 48 | 41 | 19 | |||
| <100 >56 | 36 | . | 46 | 41 | 41 | 7 | <100 >32 | 82 | |
| Art-D4-W3 | <18 >10 | 2 | 2 | 28 | 2 | 11 | 15 | ||
| <32 >18 | 9 | 18 | 0 | 9 | 9 | 9 | <32 >10 | 20 | |
| <56 >32 | 36 | 43 | 21 | 36 | 33 | 11 | |||
| <100 >56 | 53 | 38 | 51 | 51 | 47 | 8 | <100 >32 | 80 | |
| Ex-D1-D | <18 >10 | 9 | 0 | 26 | 9 | 11 | 13 | ||
| <32 >18 | 0 | 0 | 28 | 0 | 9 | 16 | <32 >10 | 21 | |
| <56 >32 | 46 | 7 | 23 | 23 | 25 | 20 | |||
| <100 >56 | 45 | 93 | 23 | 45 | 54 | 36 | <100 >32 | 79 | |
| LR-D1-D | <18 >10 | 29 | 0 | 9 | 9 | 13 | 15 | ||
| <32 >18 | 12 | 21 | 3 | 12 | 12 | 9 | <32 >10 | 25 | |
| <56 >32 | 38 | 37 | 62 | 38 | 46 | 14 | |||
| <100 >56 | 21 | 42 | 25 | 25 | 29 | 11 | <100 >32 | 75 | |
| LR-D2-D | <18 >10 | 15 | 0 | . | 8 | 8 | 11 | ||
| <32 >18 | 6 | 5 | . | 5 | 5 | 1 | <32 >10 | 13 | |
| <56 >32 | 62 | 41 | . | 52 | 52 | 15 | |||
| <100 >56 | 17 | 53 | . | 35 | 35 | 26 | <100 >32 | 87 | |
a SD: standard deviation; b “.”: missing data.
Table 4.
Anthropogenic sources for selected elements, other than mining, smelting and ore processing.
Table 4.
Anthropogenic sources for selected elements, other than mining, smelting and ore processing.
| Sources a | Cd | Cr | Zn | V | Co | Ti | Ba | Fe | Al | Mg | Mn |
|---|---|---|---|---|---|---|---|---|---|---|---|
| brakes | x | x | x | x | x | ||||||
| tires, rubber | x | x | x | x | x | ||||||
| fossil fuel combustion (industrial, vehicle exhaust) | x | x | x | x | x | x | |||||
| pigments, paints, plastic | x | x | x | x | x | x | |||||
| automobile parts, steel and alloys in transport | x | x | x | x | x | x | x | x | |||
| galvanic protection | x | x | |||||||||
| cement | x | x | x | ||||||||
| asphalt (bitumen) | x | x |
a References—Cd: fossil fuel combustion, cement manufacture [51]; galvanic protection; and pigments in plastic, glass, ceramic [47]; metal sheets for automobile radiators, curing agent in rubber, production PVC [52]; Cr: brakes [9]; older pigments [47]; steel shiny plating, fossil fuel combustion, cement production [53]; Zn: galvanic protection [47]; Zn oxide as filler in tires [9,22,47]; fossil fuel combustion [54]; brake wear and burning of zinc thiophosphate stabilizer in motors and lubricating oils [55]; V: Alloy steel, combustion of crude oil residues in power plants and community-heating systems [51]; asphalt (bitumen) [8,56]; structural steel used in transport and manufacture of Ti-Al alloys for aerospace industry, catalyst for plastic production, use in lacquers and paints [57]; Co: electronic and electrical equipment, batteries, manufacturing rechargeable batteries, fossil fuel combustion, paints and primers, magnets, rubber and tire manufacturing, adhesives and sealants, alloys in automobile motor parts, plastic [58]; Ti: Fe, Ti, Cu and Ba measured in brake pads [8,22]; pigments in paint, plastic, glass [47]; Ti oxide as filler in rubber-based composites (tires) [59]; Ba: filler and extender in paints, plastics and rubber, heavy concrete production, use as alloy for iron production and as reducing agent during production of steel [60]; BaSO4 is an abrasive and filler of the friction material in brake pads [9,22,61]; Fe, Al, Mg: Basic metal components in vehicles: frame, engines, body; lighter Al and Mg alloys often replacing steel in many components now (https://itstillruns.com/how-electric-cars-made-5006993.html; accessed on 18 June 2020); iron powder contained in brake pads [61]; Mn: used in some countries as a fuel additive [51].
Publisher’s Note: MDPI stays neutral with regard to jurisdictional claims in published maps and institutional affiliations. |
© 2021 by the authors. Licensee MDPI, Basel, Switzerland. This article is an open access article distributed under the terms and conditions of the Creative Commons Attribution (CC BY) license (https://creativecommons.org/licenses/by/4.0/).
Share and Cite
MDPI and ACS Style
Beauchemin, S.; Levesque, C.; Wiseman, C.L.S.; Rasmussen, P.E. Quantification and Characterization of Metals in Ultrafine Road Dust Particles. Atmosphere 2021, 12, 1564. https://doi.org/10.3390/atmos12121564
AMA Style
Beauchemin S, Levesque C, Wiseman CLS, Rasmussen PE. Quantification and Characterization of Metals in Ultrafine Road Dust Particles. Atmosphere. 2021; 12(12):1564. https://doi.org/10.3390/atmos12121564
Chicago/Turabian StyleBeauchemin, Suzanne, Christine Levesque, Clare L. S. Wiseman, and Pat E. Rasmussen. 2021. "Quantification and Characterization of Metals in Ultrafine Road Dust Particles" Atmosphere 12, no. 12: 1564. https://doi.org/10.3390/atmos12121564
Note that from the first issue of 2016, this journal uses article numbers instead of page numbers. See further details here.