Article

Characteristics and Risk Assessment of 16 Metals in Street Dust Collected from a Highway in a Densely Populated Metropolitan Area of Vietnam

1
Department of Environmental Sciences, Saigon University, Ho Chi Minh City 700000, Vietnam
2
Faculty of Chemical & Food Technology, Ho Chi Minh City University of Technology and Education, Ho Chi Minh City 700000, Vietnam
3
Faculty of Environmental and Food Engineering, Nguyen Tat Thanh University, Ho Chi Minh City 700000, Vietnam
4
College of Maritime, National Kaohsiung University of Science and Technology, Kaohsiung City 81157, Taiwan
5
Department of Marine Environmental Engineering, National Kaohsiung University of Science and Technology, Kaohsiung City 81157, Taiwan
6
Faculty of Environment, University of Science, Ho Chi Minh City 700000, Vietnam
7
Vietnam National University, Ho Chi Minh City 700000, Vietnam
8
Center for Advanced Chemistry, Institute of Research and Development, Duy Tan University, Da Nang 550000, Vietnam
9
Faculty of Environmental Chemical Engineering, Duy Tan University, Da Nang 550000, Vietnam
10
Faculty of Environmental Engineering, Hanoi University of Civil Engineering, 55 Giai Phong, Hai Ba Trung, Hanoi 100000, Vietnam
11
Department of Civil Engineering, Vietnam Maritime University, Hai Phong 180000, Vietnam
12
Graduate Institute of Applied Geology, National Central University, Taoyuan 32000, Taiwan
13
Faculty of Health Sciences and Finance-Accounting, Dong Nai Technology University, Bien Hoa 810000, Vietnam
14
Key Laboratory of Advanced Waste Treatment Technology, Vietnam National University Ho Chi Minh (VNU-HCM), Linh Trung Ward, Ho Chi Minh City 700000, Vietnam
15
Faculty of Environment and Natural Resources, Ho Chi Minh City University of Technology (HCMUT), Ho Chi Minh City 700000, Vietnam
*
Authors to whom correspondence should be addressed.
Atmosphere 2021, 12(12), 1548; https://doi.org/10.3390/atmos12121548
Submission received: 24 October 2021 / Revised: 14 November 2021 / Accepted: 17 November 2021 / Published: 24 November 2021

Abstract

:
The present study focused on investigating the contamination and risk assessment for 16 metals in street dust from Ha Noi highway, Ho Chi Minh City. The results indicated that the concentrations of metals (mg/kg) were found, in decreasing order, to be Ti (676.3 ± 155.4) > Zn (519.2 ± 318.9) > Mn (426.6 ±113.1) > Cu (144.7 ± 61.5) > Cr (81.4 ± 22.6) > Pb (52.2 ± 22.9) > V (35.5 ± 5.6) > Ni (30.9 ± 9.5) > Co (8.3 ± 1.2) > As (8.3 ± 2.5) > Sn (7.0 ± 3.6) > B (5.7 ± 0.9) > Mo (4.1 ± 1.7) > Sb (0.8 ± 0.3) > Cd (0.6 ± 0.2) > Se (0.4 ± 0.1). The geo-accumulation index (Igeo) showed moderate contamination levels for Pb, Cd, Cu, Sn, Mo, and Zn. The enrichment factor (EF) values revealed moderate levels for Cd, Cu, Mo, and Sn but moderate–severe levels for Zn. The pollution load index of the heavy metals was moderate. The potential ecological risk (207.43) showed a high potential. Notably, 40.7% and 33.5% of the ecological risks were contributed by Zn and Mn, respectively. These findings are expected to provide useful information to decision-makers about environmental quality control strategies.

1. Introduction

Street dust, road dust, or urban street dust are names for dust on road surfaces. Street dust contains various metals deriving from many different sources, such as vehicle emissions, residential combustion, solid waste combustion, power plants, industrial activities, and city construction [1]. The presence of metals in the street dust may cause both adverse environmental effects and human health issues [2]. Metals associated with street dust are a current concern of scientists around the world. Many researchers have evaluated the levels of metals in street dust collected from various countries, for example China, Colombia, Iran, Jordan, Turkey, United Arab Emirates (UAE), Vietnam, etc. Most of these studies focused mainly on six to eight metals [3,4,5,6,7,8,9,10,11,12]. Some studies extended the list to more than eight metals [13,14,15,16,17]. The results showed that the concentration of metals fluctuates widely up to 8430 mg/kg [6]. Various methods were employed to determine the level of metal pollution in dust, for example the enrichment factor (EF) [4], geo-accumulation index (Igeo) [18,19,20], pollution load index (PLI) [3,21], and ecological risk assessment (ERA) [4,5,22,23,24,25,26]. The results all indicated significant potential risks of metals for human health as well as ecosystems.
The characteristics of street-dust metals and the related emission sources and risks have not received much attention in Vietnam, where there are many cities with high traffic density, dense population, and interwoven industrial zones. To the best of our knowledge, only three studies have been conducted to determine the street-dust metal levels in Vietnam. Firstly, Phi et al. [27] conducted monitoring of the concentration of six metals in street dust sampled at 163 locations from Hanoi, Vietnam. Secondly, the concentration of eight metals (Pb, Cu, Cr, Zn, Fe, Mn, K, and Ca), and the risk assessment for five metals (Cu, Pb, Cr, Zn, and Mn) from exposure to street dust from Highway No. 5 and Highway No. 18 in Northeast Vietnam were investigated by Phi et al. [28]. Thirdly, Dat et al. [12] measured the concentrations of eight metals (Pb, Cu, Cr, Zn, Mn, Ni, Cd, and Co) in street dust in Southern Vietnam. Information on the spatial distribution, potential emission sources, and risk assessments for multiple metals associated with the rapid urbanization and industrialization in Ho Chi Minh City is limited.
From the literature review, it was found that most studies focused on common metals (Cd, Co, Ni, Pb, Cr, Cu, Mn, and Zn). Recently, survey studies have been undertaken in cities with high traffic density and industrial development areas, such as Ho Chi Minh City [13,14]. The results showed that in addition to the metals mentioned above, many other metals were detected (Se, Sb, Mo, B, Sn, As, V, Ti, etc.) with relatively high concentrations. Measuring more elements results in a more complete assessment of pollution levels. Therefore, with the desire to provide a comprehensive view for policymakers on environmental pollution control strategies, this study investigated the spatial distribution and potential emission sources of 16 metals (Se, Cd, Sb, Mo, B, Sn, As, Co, Ni, V, Pb, Cr, Mn, Cu, Zn, and Ti) in the street dust collected from one of the main routes entering Ho Chi Minh City (Ha Noi highway). Possible sources and relationships between the metals were interpreted using multiple statistical analysis methods such as Pearson’s correlation coefficient, principal component analysis (PCA), and hierarchical cluster analysis (HCA). In addition, we calculated the geo-accumulation index (Igeo), pollution load index (PLI), and enrichment factor (EF), to evaluate the levels of anthropogenic enrichment by metals. Finally, the potential ecological risk index (PER) was calculated.

2. Materials and Methods
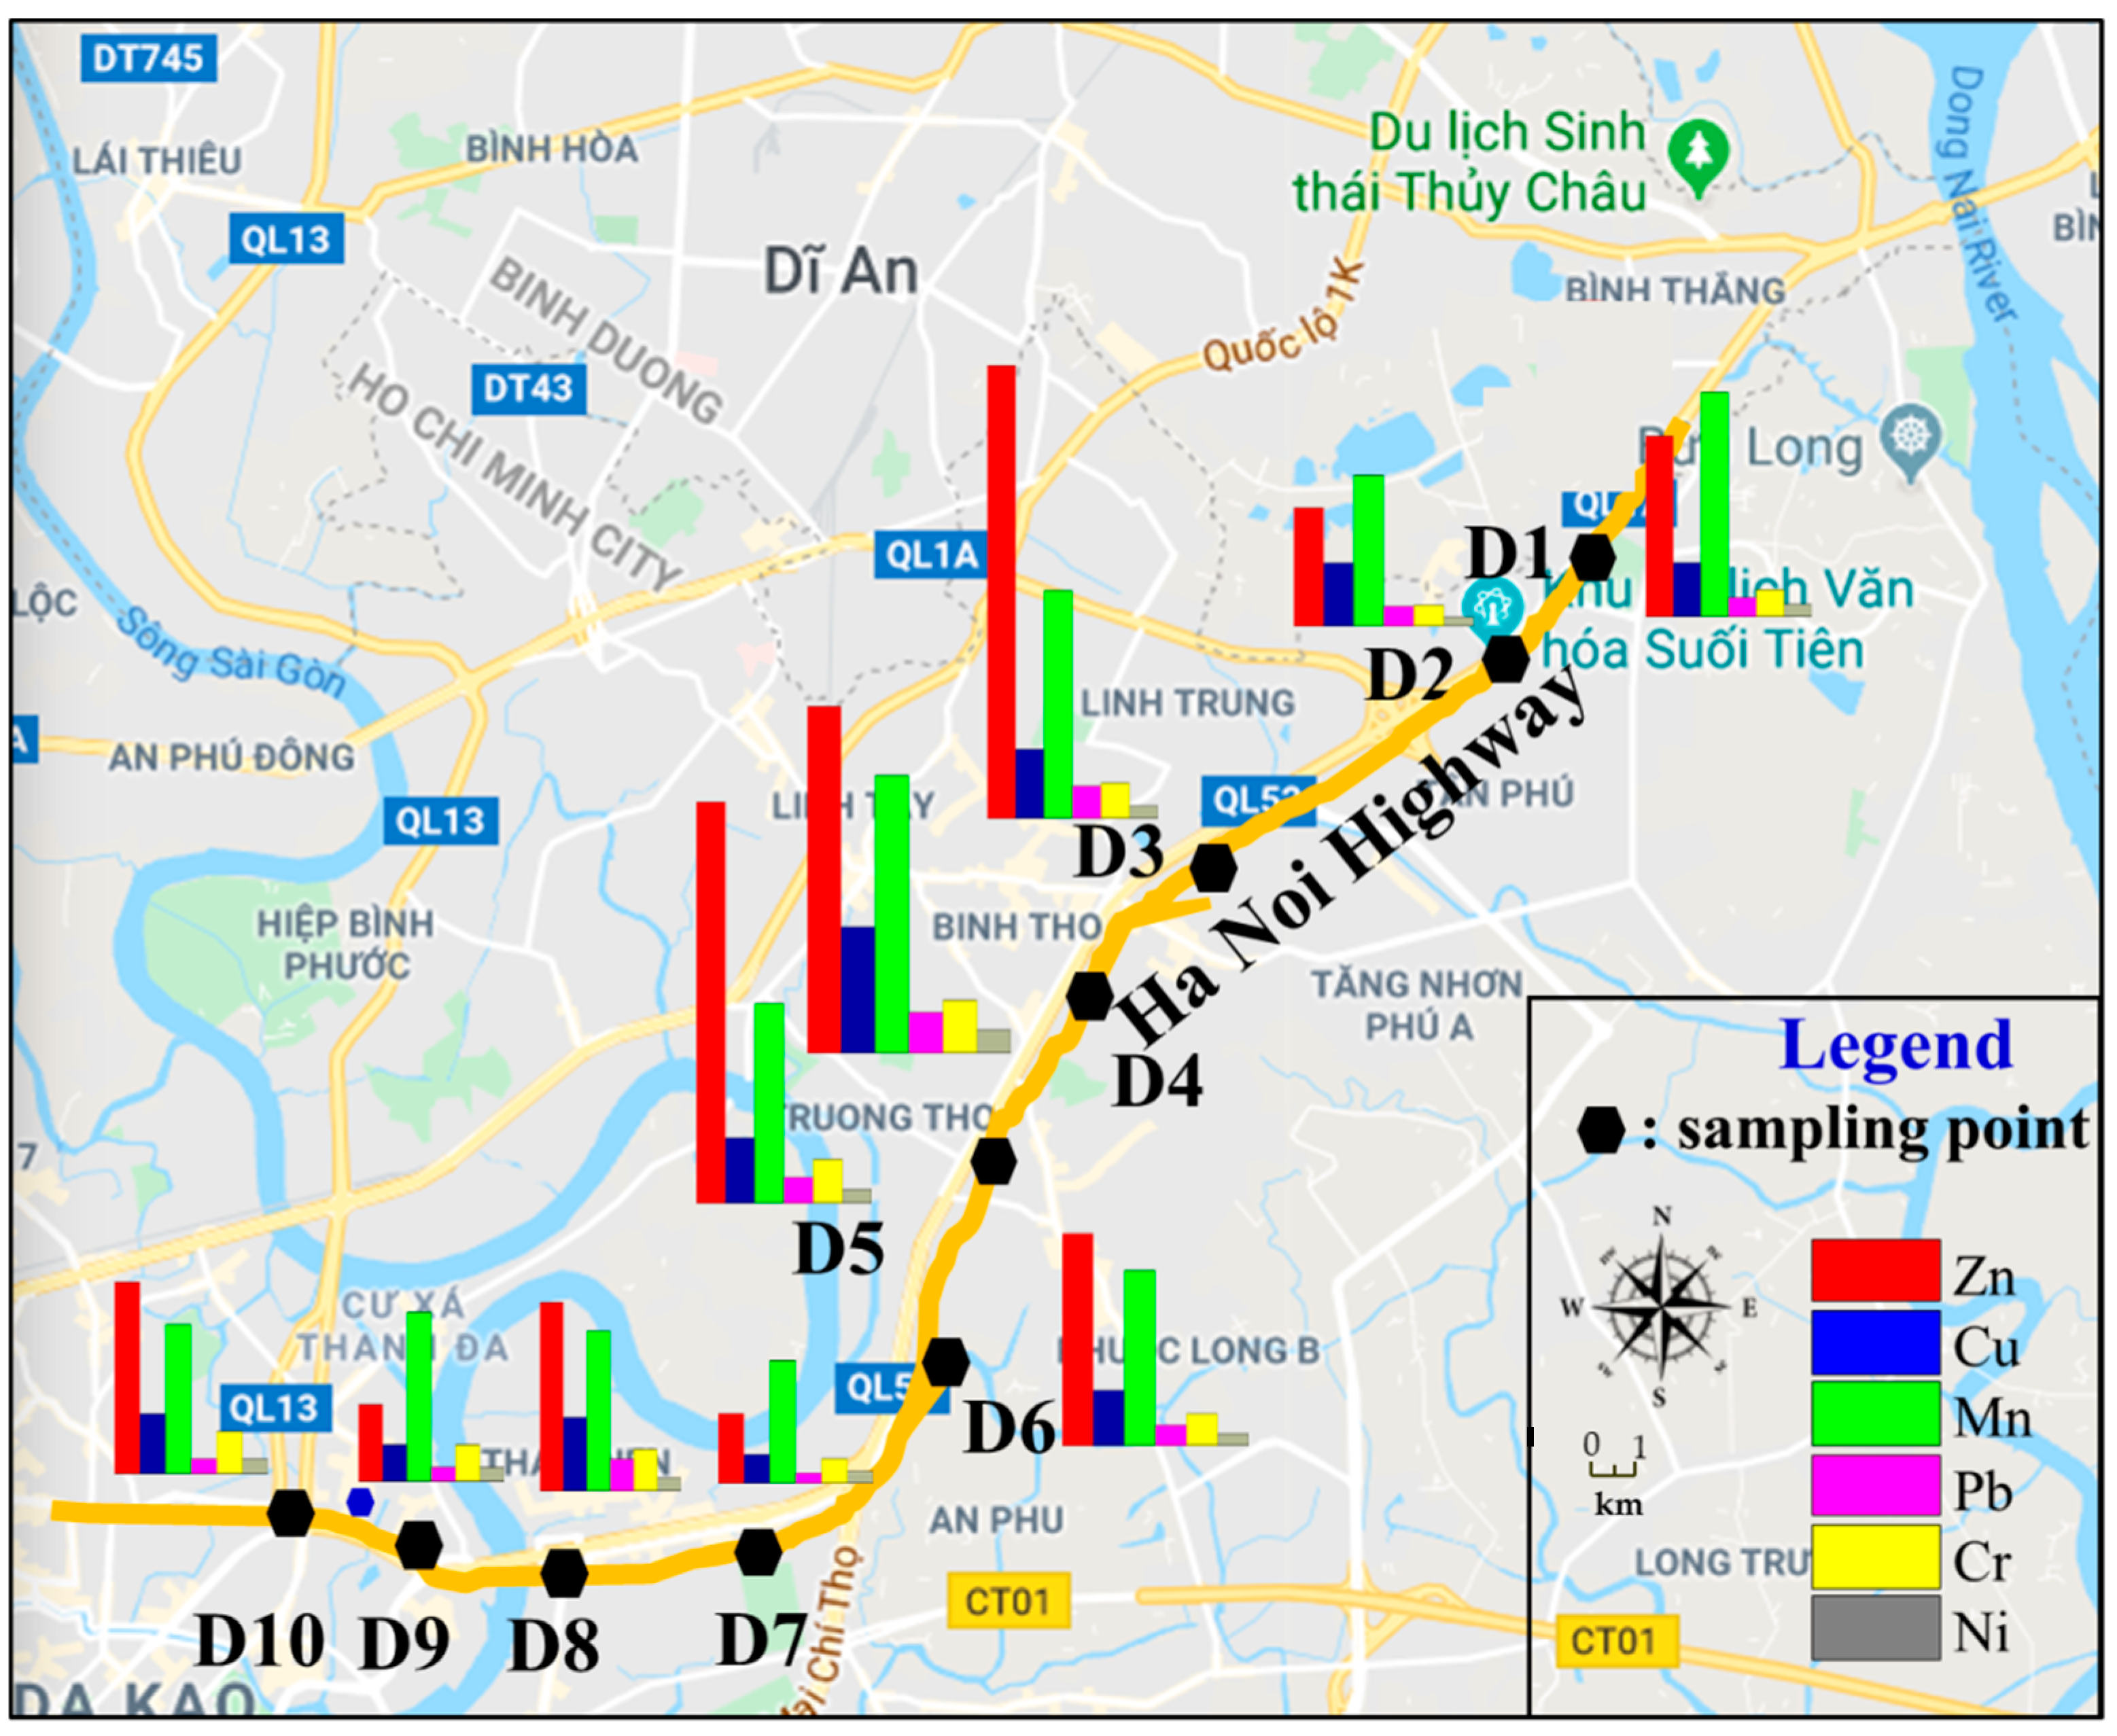
2.1. Sampling Site

Ho Chi Minh (HCM) City is the biggest city in the Southeast of Vietnam (Figure 1a,b), with an area of 2095 km2. It has a tropical climate (average annual precipitation of 1800 mm and temperature of 28 °C). There are two main seasons: the dry (December–April) and wet (May–November) seasons [29]. In recent years, Ha Noi highway has been the main thoroughfare (Figure 1c) connecting HCM city with Binh Duong and Dong Nai provinces, where there are many industrial zones.

2.2. Sample Collection, Preparation, and Analytical Methods

A total of 13 samples were collected in this study, of which 10 were street-dust samples from Ha Noi highway (Figure 1c) and 3 were background soil samples from Rung Sac Street, Can Gio District (Figure 1d). Samples were collected during February 2020 using brushes, dustpans, and clean plastic. Each sample was collected over an approximate area of 2 m2 adjacent to the street curb, and 500 g of the dust sample was collected into a polyethylene bag before shipping it to the lab for treatment and metals analysis [30]. In this study, background samples were collected in Can Gio District because no industrial zones are located in this area, and the population and traffic densities are low (Figure 1d). The samples were dried in ambient conditions to stabilize moisture and then sieved through a nylon sieve of 149 µm diameter. Finally, the samples were stored in a desiccator until further treatment for metals analysis. The locations of the sampling sites and the GPS coordinates are shown in Table S1.
In this study, the extraction procedures strictly followed those reported by Dat et al. (2021), which are presented in detail in the Supplementary Materials. Briefly, the dust samples were analyzed for extractable metals according to EPA Method 3051A [31] and Method 200.8, Revision 5.4 [32]. All reagents were of analytical grade (Merck) and purification was needed before digestion. Sixteen metals (Se, Cd, Sb, Mo, B, Sn, As, Co, Ni, V, Pb, Cr, Cu, Mn, Zn, and Ti) were quantified using inductively coupled plasma mass spectrometry (ICP-MS; model 7700x, Agilent, Santa Clara, CA, USA) with an ICP-MS-grade standard. The metals were measured in triplicate for each sample and a blank test was conducted for every 10 samples. Blank samples were prepared and analyzed using the same procedure, showing concentrations below the method detection limit (MDL). QA/QC of the analytical method was ensured by analyzing the certificate reference material for urban particulates (SRM-1648a). The results indicated that the recoveries ranged from 90 to 120% for all metals. The MDLs of Se (20 µg/L), Cd (20 µg/L), Sb (20 µg/L), Mo (2 mg/L), B (2 mg/L), Sn (0.2 mg/L), As (20 µg/L), Co (0.2 mg/L), Ni (0.2 mg/L), V (2 mg/L), Pb (20 µg/L), Cr (0.2 mg/L), Cu (2 mg/L), Mn (2 mg/L), Zn (5 mg/L), and Ti (2 mg/L) were significantly lower than the concentrations of metals found in this study.

2.3. Degree of Contamination and Pollution Load Index

2.3.1. Geo-Accumulation Index (Igeo)

We investigated the Igeo values to evaluate the contamination levels of the metals, computed according to Equation (1).
I geo = log 2 ( C n 1.5 B n )
where Cn and Bn are the street-dust metal concentration of sample n and the background sample, respectively. The factor of 1.5 was applied to correct for potential background variation [12]. The risk was evaluated based on the criteria of seven grades, as presented in Table S2.

2.3.2. Enrichment Factor (EF)

The EF was computed to assess the degree of contamination. This was first carried out by Buat-Menard and Chesselet [33] for oceanic suspended matter, and then for heavy metals in street dust [19,25,34]. Table S2 shows the standard criteria for EFs, employed to evaluate the metals contamination. The EF was estimated based on Equation (2). The elements Fe [25,34,35,36], Al [37,38], and Mn [39,40] are common references (ref) when computing the EFs of toxic metals in environmental samples. In this study, we selected Fe to represent the reference element.
EF = ( C i / C Fe ) Sample ( C i / C Fe ) Background
where EF is the enrichment factor and (Ci/CFe)Sample and (Ci/CFe)Background are the ratios of the metal concentration (Ci) to the concentration of Fe (CFe) in the street dust and background samples, respectively.

2.3.3. Pollution Load Index (PLI)

The pollution level of metals in street dust was evaluated via the PLI value calculated using Equations (3) and (4):
P i = C i C b
PLI = P 1 × P 2 × P 3 × . P n n
where Pi is the pollution index for element i, Ci and Cb are the concentrations of element i and the background for element i, PLI is the pollution load index, and n is the number of metals analyzed in this study. The five categories of Pi and the four categories of PLI [41] are shown in Table S2.

2.4. Potential Ecological Risk (PER)

The PER index was first defined by Hakanson [42]. The PER represents the potential ecological risk factor of multiple metals, calculated [25,26,42] according to Equations (5) and (6):
E i = T i × C f i
PER = E i
where Ei is the potential ecological risk index of metal i, Ti is the toxic response factor of each metal (i.e., Cu = Ni = Co = Pb = 5; Mn = Zn = Cr = 2; Cd = 30) [43], and C f i is the contamination factor of metal i. Detailed information on the five categories of Ei and four categories of PER can found in Table S3.

2.5. Data Analysis

Statistical analysis was carried out using OriginPro 2021 software (OriginLab Corporation, Northampton, MA, USA). Multivariate statistical analyses (i.e., Pearson’s correlation, principal component analysis (PCA), and cluster analysis) were conducted to identify the potential sources of metals.

3. Results and Discussion

3.1. Basic Statistics of Metals Concentration

Figure 2a shows the box plot of the concentrations of the 16 metals from different sampling sites. In general, the metal concentrations (mg/kg) decreased in the order Ti (676.3 ± 155.4) > Zn (519.2 ± 318.9) > Mn (426.6 ±113.1) > Cu (144.7 ± 61.5) > Cr (81.4 ± 22.6) > Pb (52.2 ± 22.9) > V (35.5 ± 5.6) > Ni (30.9 ± 9.5) > Co (8.3 ± 1.2) > As (8.3 ± 2.5) > Sn (7.0 ± 3.6) > B (5.7 ± 0.9) > Mo (4.1 ± 1.7) > Sb (0.8 ± 0.3) > Cd (0.6 ± 0.2) > Se (0.4 ± 0.1). Figure 2b shows the percentage contribution of the metals at different sampling points. Ti, Zn, and Mn were major contributors to the total metal concentration, accounting for about 35%, 23%, and 21%, respectively, while minor contributions were obtained from Se (0.02%), Cd (0.03%), and Sb (0.04%). In total, 93% of the samples collected on the highway had heavy metal concentrations in excess of their background concentrations. This result suggests a significant influence of anthropogenic sources on the concentrations of these metals [4,44].
In this study, Zn, Cu, Mn, Pb, Cr, and Ni contributed the most to the total metal concentration in the street-dust samples. The spatial distributions of six selected metals are shown in Figure 3. High values for Ni (55.7 mg/kg), Pb (93.5 mg/kg), Cr (123.6 mg/kg), Cu (289.4 mg/kg), and Mn (642.7 mg/kg) were also recorded at D4, and a high value for Zn (1062.7 mg/kg) was recorded at D3, a location close to high traffic density, a residential area, the university, and a supermarket. The highest value for heavy metals was recorded at locations D3 (Zn) and D4 (Ni, Pb, Cr, Cu, and Mn), while the minimum values for those metals were detected at D2 (Ni and Cr), and D9 (Pb, Cu, Mn, and Zn). At D4, high concentrations of metals were obtained because it is located near Thu Duc crossroads on Ha Noi highway, with high traffic density.
In this study, the coefficients of variation (CV = S.D/mean value) were determined for 16 metals (Se, Cd, Sb, Mo, B, Sn, As, Co, Ni, V, Pb, Cr, Cu, Mn, Zn, and Ti). The CV values can be classified as low variability for CV < 0.2, moderate variability for 0.2 ≤ CV < 0.5, high variability for 0.5 ≤ CV < 1.0, and extremely high variability for CV ≥ 1.0 [45]. In this study, the CV of Cd was 1.1, suggesting extremely high concentration variability. Relatively high CV values were also obtained for Zn and Sn (0.6 and 0.5). The CV values of Cu, Pb, Sb, Mo, Se, As, Ni, Cr, Mn, B, V, and Ti showed moderate variability, while the CV value of Co showed low variability. The high CV values of some of the elements showed a strong anthropogenic influence [4,41,46,47]. Detailed information on the mean, standard deviation, min, max, CV, and background concentrations of the 16 metals studied can be found in Table S4 in the Supplementary Materials.
In a comparison among the metals, high concentrations of Ti, Zn, Mn, Cu, Cr, and Pb and low concentrations of Sb, Cd, and Se were observed in this study (Table 1). The mean concentration of Ti (676.3 ± 155.4 mg/kg) in this study was significantly higher than that of 158.4 mg/kg reported from Asaluyeh County, Iran [17], but the value was significantly lower than those reported from Hefei, China (1522 mg/kg) [15], Xining City, China (1977.9 mg/kg) [14], and Nanchang City, China (3277.9 mg/kg) [4].
The average Zn concentration was 519.2 ± 318.9 mg/kg, with the highest Zn concentration found in sample D3 (1062.7 mg/kg), while the lowest level was measured in sample D9 (136.1 mg/kg). A high Zn level in street dust was also recorded by Shabbaj et al. [46] (487.5 mg/kg) and Bartholomew et al. [6] (8430.3 mg/kg). Bourliva et al. [47] and Idris et al. [48] showed that tire wear, brake wear, brake pads, lubricating oils, engine tires, diesel exhaust, and wear of machine parts were the potential emission origins of Zn in street dust. The Zn concentration (519 mg/kg) obtained in urban street dust was over 7.9-fold higher than the background level (71.27 mg/kg). A similar Zn level was found by Shabbaj et al. [46] in Jeddah (Saudi Arabia) (487.5 mg/kg). In addition, the Zn value reported in this study was much higher than those reported from Hanoi, Vietnam (369 mg/kg) [27], Urumqi, China (224.5 mg/kg) [49], the Petra region, Jordan (129 mg/kg) [9], and Lahore, Pakistan (67.9 mg/kg) [50]. On the other hand, our value was significantly lower than that from Jinhua, China (8430.3 mg/kg) [6].
The concentration of Cu (144.7 ±   61 .5 mg/kg) was over 5.3-fold higher than the background level (27.1 mg/kg). The highest Cu concentration was observed in sample D4 (289.4 mg/kg) and the lowest level was reported in sample D9 (64.7 mg/kg). The mean value of the Cu concentration was higher than those previously reported from various sites worldwide. For instance, Cu concentrations of 51, 54.8, 64.9, 97.4, and 133.7 mg/kg were determined in street dust from Dezful, Iran [16], Xi’an China [3], Highway No. 5, Vietnam [28], Beijing, China [5], and Jinhua, China [6], respectively. This study found a Cu concentration lower than those documented in other sites, e.g., Ho Chi Minh, Vietnam (153.7 mg/kg) [12], and Tianjin, China (527.5 mg/kg) [13]. Copper in street dust may also originate from exhaust gases and lubricating oils [51], or be released from manhole cover metal, wear of tires and brake pads, and emissions from engine parts [21,52].
The Cr mean concentration (81.4 mg/kg) exceeded the background level (27.1 mg/kg) by over 3.0 times. The highest Cr concentration was obtained in sample D4 (123.6 mg/kg), while the lowest value was observed in sample D2 (51.3 mg/kg). These values were higher than those previously reported from Asaluyeh County, Iran (37.3 mg/kg) [17], the Lagos metropolis, Southwestern Nigeria (41.3 mg/kg) [53], and Dezful, Iran (44 mg/kg) [16].
The value of the Pb concentration in street dust (52.2 mg/kg) was similar to the values reported by previous studies from Dezful, Iran (54 mg/kg) [16], Abu Dhabi–Al Ain National highway, UAE (50.1 mg/kg) [11], and Beijing, China (62.3 mg/kg) [5]. On the other hand, higher levels of Pb were also found in other studies, for instance, in Nanchang, China (89.5 mg/kg) [4], Xi’an, China (94.5 mg/kg) [3], Jinhua, China (110.6 mg/kg) [6], and Tianjin, China (120.7 mg/kg) [13].
The results of this study revealed that the mean Cd concentration (0.6 ± 0.2 mg/kg) in street dust was higher than for the background site (0.1 mg/kg). However, more than a few times higher Cd concentration was found in street dust samples in previous studies documented by Bartholomew et al. [6], Zhang et al. [13], and Alsbou and Al-Khashman [9]. The previous studies indicated that leakage of diesel fuel and lubricating oil were potential sources of Cd in street dust [54], and Wahab et al. [21] also revealed that Cd is one of the trace components in diesel fuel, car paints, and brake pads.

3.2. Heavy Metals Identification Resource

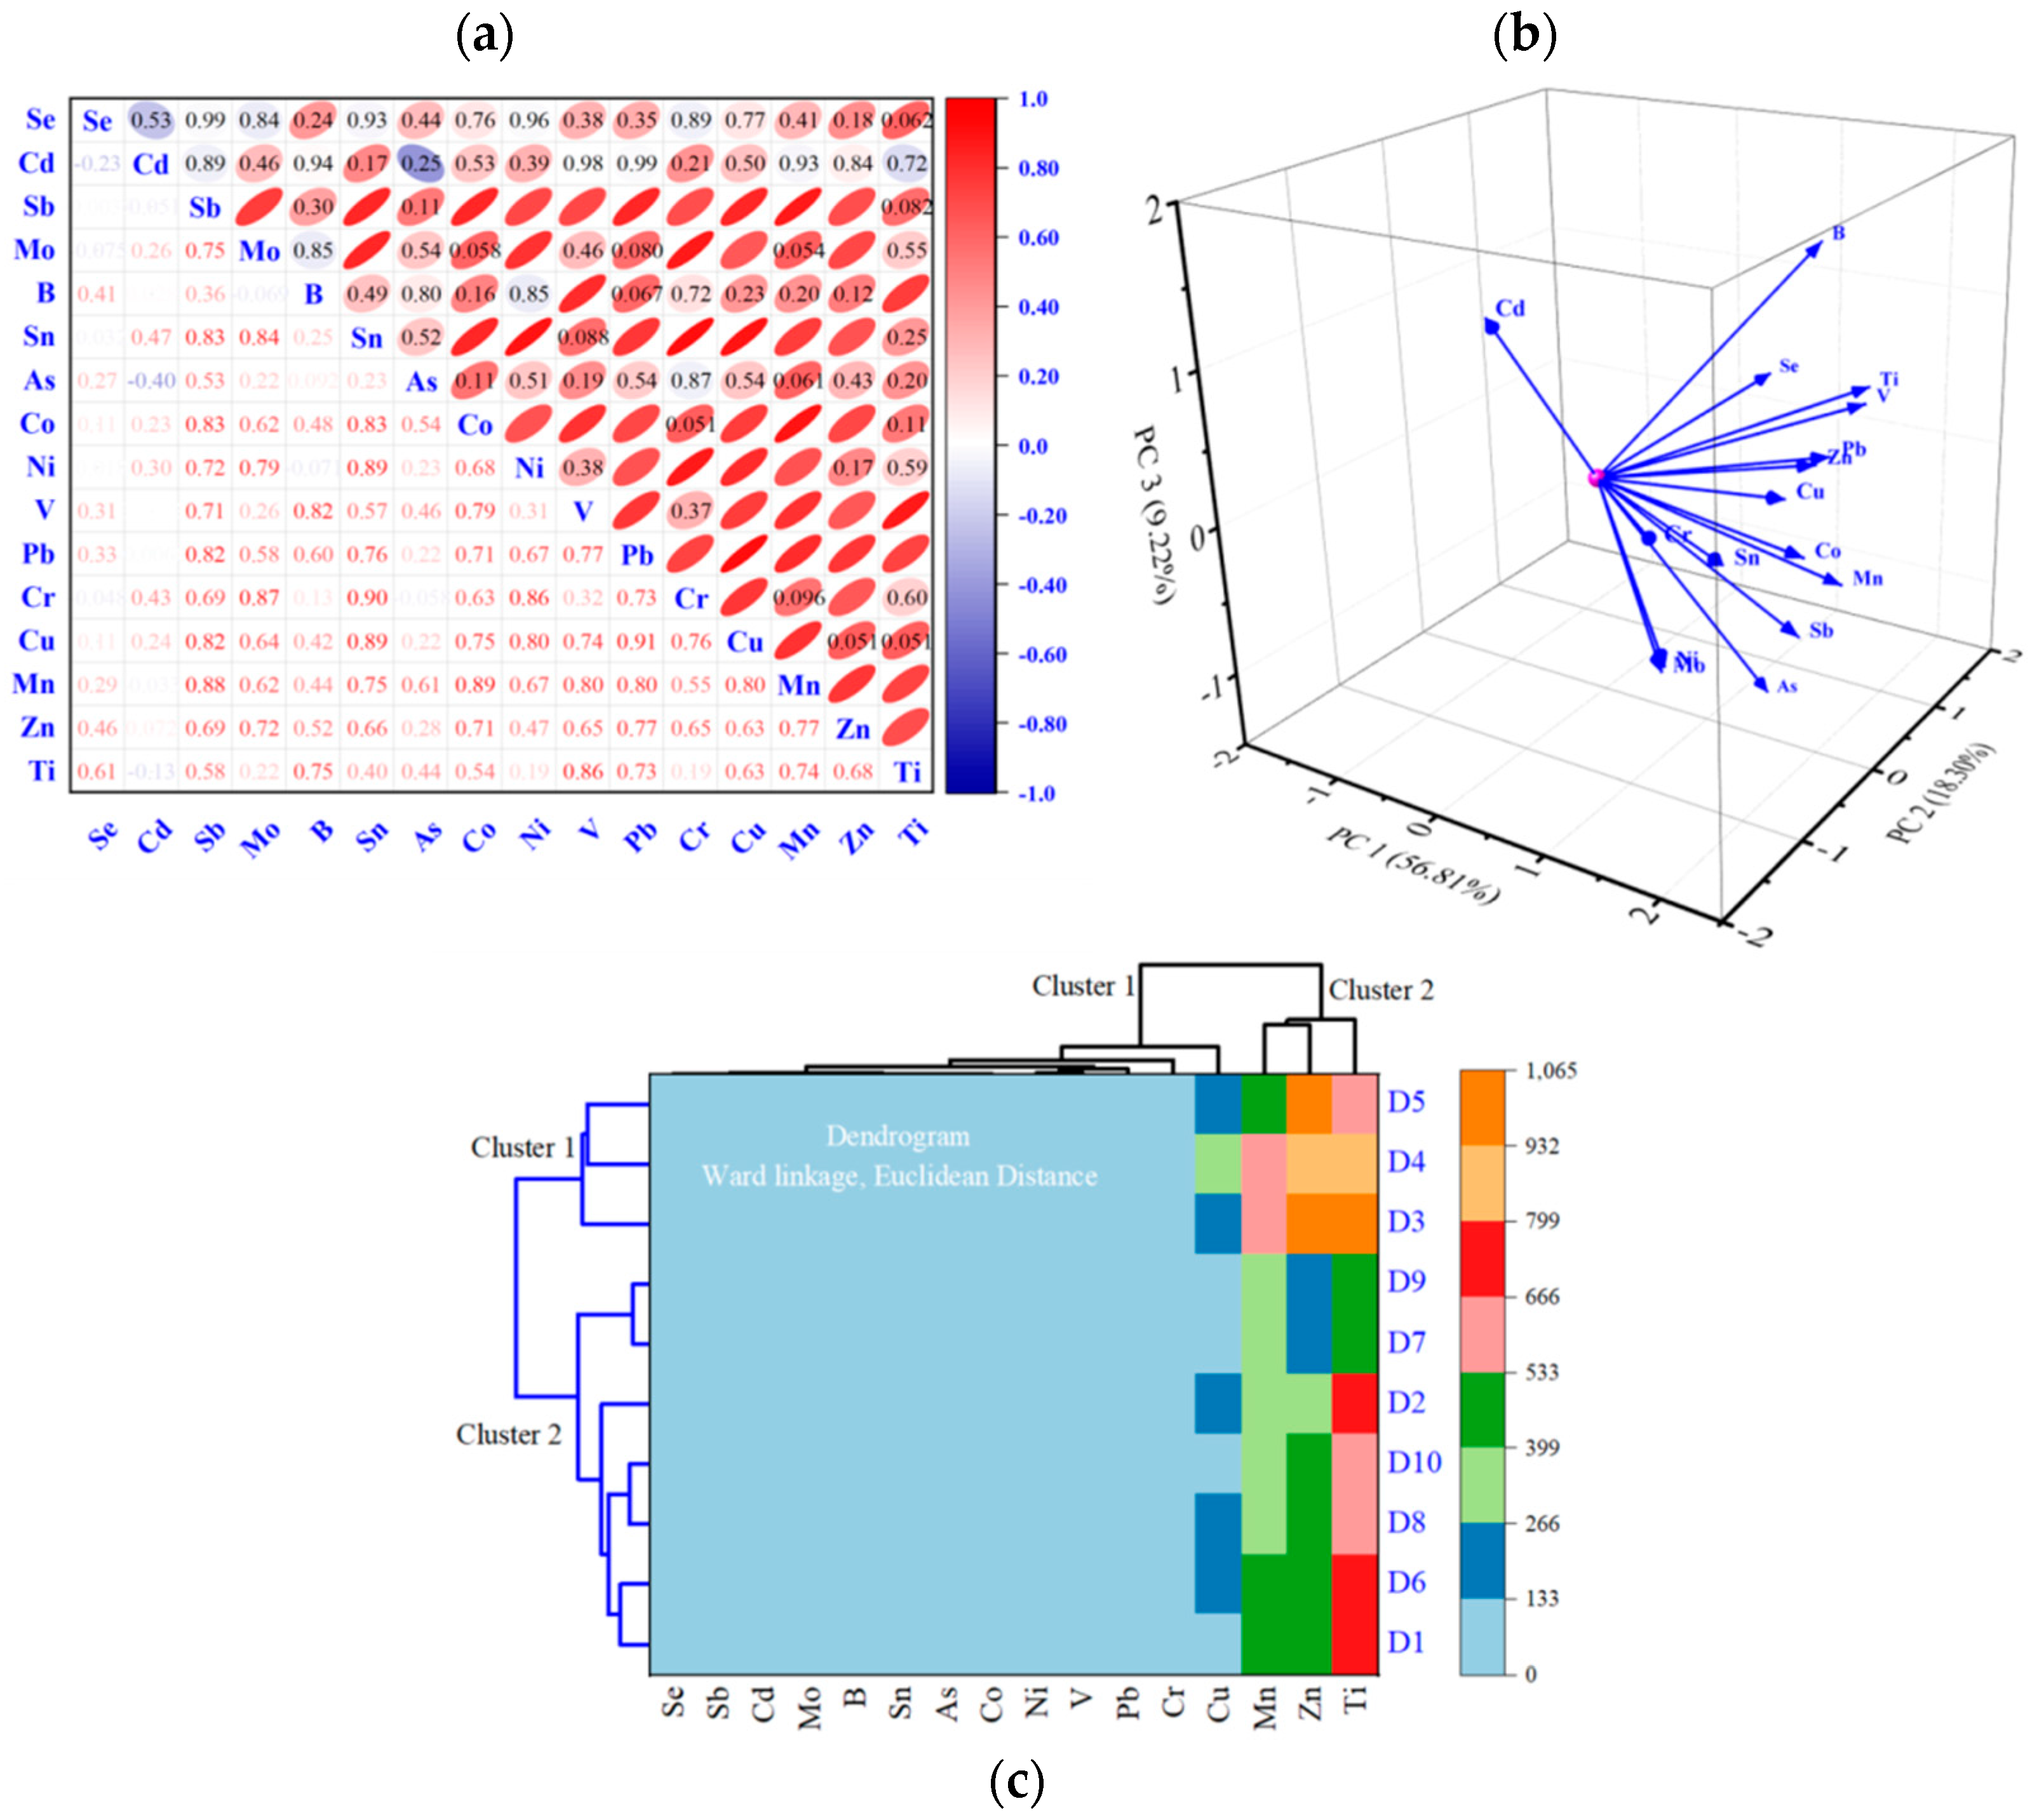
3.2.1. The Correlation Coefficient among the Heavy Metals in This Study

The Pearson’s correlation coefficient could reveal the inter-element relationships that help to understand the transformation pathways of metals and their sources [25]. Egbueri et al. [24] suggested correlation coefficients in the range of 0.0–0.3 for poor, 0.4–0.6 for moderate, and 0.7–1.0 for strong correlations. A strong correlation between metal pairs would reveal a similar origin, such as the same sources [26]. The coefficients for inter-element correlation in street dust are presented in Figure 4a. Strong and significant (p < 0.05) correlations were obtained for various metal pairs, including: (a) Ti-V (r = 0.86), Ti-B (0.75), Ti-Mn (0.74), Ti-Pb (0.73); (b) Zn-Pb (0.77), Zn-Mn (0.77), Zn-Mo (0.72), Zn-Co (0.71); (c) Cu-Pb (0.91), Cu-Sn (0.89), Cu-Ni (0.8), Cu-Sb (0.82), Cu-Cr (0.76), Cu-Co (0.75), Cu-V (0.74); (d) Cr-Sn (0.9), Cr-Mo (0.87), Cr-Ni (0.86), Cr-Pb (0.73); (e) Pb-Sb (0.82), Pb-V (0.77), Pb-Sn (0.76), Pb-Co (0.71); (f) V-B (0.82), V-Co (0.79), V-Sb (0.71); (g) Ni-Sn (0.89), Ni-Mo (0.79), Ni-Sb (0.72); (h) Co-Sb (0.83), Co-Sn (0.83); (i) Sn-Mo (0.84), Sn-Sb (0.83); (j) Mo-Sb (0.75). Anthropogenic activities are well known as potential sources of metals in street-dust samples [23,55]. Processes including tire wear, brake wear, brake pads, diesel exhaust, lubricating oils, engine tires and wear of machine parts are possible sources of Zn, Pb, Ni, and Cr [47,48], while industrial processes, gas refineries, fuel combustion [56,57], and car paints are possible sources of Ni [21]. Lau et al. [58] showed that smelting industries produce a large number of heavy metals (e.g., Fe, Co, Mn, and V), and e-waste recycling could contribute large amounts of trace elements such as Pb and Cd to street dust.

3.2.2. Principal Component Analysis (PCA)

PCA is a widely applied multivariable statistical method to identify the potential sources of street-dust metals [26,59]. Figure 4b shows the rotated component matrix results for metals in street dust. Detailed information on the scree plot of the PCA and the results of the PCA for 16 metals in street dust from Ha Noi highway, HCM City, can be found in Figure S1 and Table S3. The Kaiser–Meyer–Olkin (KMO) value was 0.72, suggesting the suitability of the PCA method for this study. The PCA data displayed three main components with eigenvalues >1. The three principal components (PCs) obtained explained more than 84% of the variance of the data.
The component PC1 was dominated by Sb, Mo, Sn, As, Co, Ni, V, Pb, Cr, and Cu, accounting for 56.8% of the total variance. Sources of Cu, Pb, and Zn could be various anthropogenic activities (e.g., tire wear, brake wear, diesel exhaust, and wear of machine parts) [49,60,61]. Nickel (Ni) is used in battery and electronic manufacturing [2]. In addition, Hini et al. [49] indicated that Cr can be derived from the wearing and aging of tires and from tool manufacturing. The EF values of V (1.1), As (1.3), Ni (1.4), Sb (2.17), Cr (2.2), and Pb (2.8) were between 1 and 3, suggesting less enrichment of these metals. On the other hand, the EF values of Cu (3.9), Mo (4.2), and Sn (4.3) ranged between 3 and 5, suggesting a moderate enrichment level. Therefore, it is suggested that these metals (Sb, Mo, Sn, As, Ni, V, Pb, Cr, and Cu) might originate from vehicular and industrial activities. The result of the enrichment factor analysis showed that the EF value of Co (0.8 < 1) indicated a limited influence of human activity (i.e., no enrichment). The results of the PCA and the EF indicated that Co was of lithological (natural) origin, while other metals (i.e., Sb, Mo, As, Ni, Sn, V, Pb, Cr, and Cu) in street dust were of mixed origins (lithological and anthropogenic origins).
The PC2 component was characterized by high loading of Se, B, Mn, Ti, and Zn, contributing 18.3% to the total variance. The EF values of Se (0.95) and Mn (0.7) were lower than 1, thereby indicating that these metals showed limited enrichment and less impact from human activity. The EF values of B (2.02) and Ti (1.05) were between 1 and 3, demonstrating minor enrichment, and the EF value of Zn (5.28) ranged between 5 and 10, suggesting a moderate–severe level of enrichment. This means that Zn was caused by vehicular activities. The results of the PCA and the EF indicated that Se and Mn were of lithological (natural) origin, while the elements B, Ti, and Zn in street dust were of vehicular origin.
The PC3 component was dominated by Cd, and this factor contributed 9.2% to the total variance. Sources of Cd in street dust could be from diesel fuel, brake pads, and car paints [21]. In addition, the EF value of Cd (3.85) revealed moderate enrichment. This suggested that human activities may have influenced the concentration of Cd in street dust.

3.2.3. Cluster Analysis

Cluster analysis was used to reveal the differences between the potentially toxic elements and the differences among sampling sites for street-dust samples from the study area. The Euclidean distance method was used in the clustering of variables and row dendrograms. The results are represented as a heat map in Figure 4c. The top dendrogram shows the similarity between potentially toxic elements while the left dendrogram shows the clustering of the sampling sites. Two clusters of elements were identified: Mn, Zn, and Ti in cluster 1 and Se, Sb, Cd, Mo, B, Sn, As, Co, Ni, V, Pb, Cr, and Cu in cluster 2 (Figure 4c). The left dendrogram provides detailed information about the street-dust samples from which spatial differences were inferred. The cluster analysis results indicate two clusters of sampling sites: (1) D3, D4, and D5; (2) D1, D6, D8, D10, D2, D7, and D9, in terms of similarities (Figure 4c).

3.3. Pollution Indices

3.3.1. The Geo-Accumulation Index (Igeo)

Igeo values were computed to assess the levels of accumulation of the metals in street dust (Figure 5a). The results show that Co, Se, Mn, Ti, and V were classified as uncontaminated, as the Igeo values of Co (−0.39 ± 0.22), Se (−0.25 ± 0.4), Mn (−0.1± 0.37), Ti (−0.08 ± 0.34), and V (−0.07 ± 0.25) were less than 0. The mean values of Igeo computed for As (0.15 ± 0.19), Ni (0.34 ± 0.38), B (0.87± 0.24), Sb (0.89 ± 0.59), and Cr (0.95 ± 0.4) belong to the uncontaminated-to-moderately-contaminated class. For Pb, Cd, Cu, Sn, Mo, and Zn, the Igeo values ranged from 1 to 2 (Pb (1.21 ± 0.67), Cd (1.37 ± 1.07), Cu (1.72 ± 0.61), Sn (1.79 ± 0.81), Mo (1.85 ± 0.56), and Zn (2 ± 0.99)), indicating a moderately contaminated level. Similar Igeo results for Pb, Cu, and Zn have been reported by Shahab et al. [18]. The mean Igeo value was the highest for Zn (2 ± 0.99) and increased in the following order: Co (−0.39 ± 0.22) < Se (−0.25 ± 0.4) < Mn (−0.1± 0.37) < Ti (−0.08 ± 0.34) < V (−0.07 ± 0.25) < As (0.15 ± 0.19) < Ni (0.34 ± 0.38) < B (0.87± 0.24) < Sb (0.89 ± 0.59) < Cr (0.95 ± 0.4) < Pb (1.21 ± 0.67) < Cd (1.37 ± 1.07) < Cu (1.72 ± 0.61) < Sn (1.79 ± 0.81) < Mo (1.85 ± 0.56) < Zn (2 ± 0.99), with higher Igeo values indicating greater levels of contamination. High Igeo values for Zn and Pb in the study can be linked to traffic activities. Among the 16 target metals, Zn was the biggest contributor to the potential ecological risk. The location exposed to the highest potential risk was D3.

3.3.2. Enrichment Factor (EF)

The EF values for each metal were determined to distinguish anthropogenic from natural sources and to evaluate the contamination level [62]. From Figure 5b, the mean values of the EF were ranked in the order Zn (5.28 ± 3.24) > Sn (4.27 ± 2.21) > Mo (4.21 ± 1.70) > Cu (3.86 ± 1.64) > Cd (3.85 ± 2.17) > Pb (2.75 >1.21) > Cr (2.18 ± 0.60) > Sb (2.17 ± 0.86) > B (2.02 ± 0.32) > Ni (1.42 ± 0.44) > As (1.27 ± 0.39) > V (1.05 ± 0.17) > Ti (1.05 ± 0.24) > Se (0.95 ± 0.32) > Co (0.84 ± 0.13) > Mn (0.70 ± 0.18). The mean values of the EF index of Mn (0.7), Co (0.84), and Se (0.95) were below 1, indicating that these elements were categorized as showing no enrichment. The EF values of Ti (1.05), V (1.05), As (1.27), Ni (1.42), B (2.02), Sb (2.17), Cr (2.18), and Pb (2.75) were between 1 and 3, thereby demonstrating minor enrichment. The EF values of Cd (3.85), Cu (3.86), Mo (4.21), and Sn (4.27) were between 3 and 5, revealing moderate enrichment by these elements. The EF value of Zn (5.28) ranged between 5 and 10, suggesting moderate–severe enrichment levels. This suggests that in our sampling area, Cd, Cu, and Zn might be affected by anthropogenic activity. This indicates that human sources are very important [39].

3.3.3. Pollution Load Index (PLI)

A summary of the Pi and PLI values of the 16 target metals is shown in Figure 5c. The street-dust samples showed low pollution by Co (PCo = 1.2), Se (PSe = 1.3), V (PV = 1.4), Mn (PMn = 1.4), Ti (PTi = 1.5), As (PAs = 1.7), and Ni (PNi = 2.0) and moderate pollution by B (PB = 2.8), Sb (PSb = 3.0), and Cr (PCr = 3.0). The remaining elements, Pb (PPb = 3.8), Cd (PCd = 5.3), Cu (PCu = 5.3), Mo (PMo = 5.8), Sn (PSn = 5.9), and Zn (PZn = 7.3) were found to show heavy pollution. Kamani et al. [63] calculated the values of Pi for heavy metals in street dust in Tehran, Iran, obtaining values for Cd (PCd = 4.77), Pb (PPb = 4.78), Cu (PCu = 10.22), and Zn (PZn = 10.37), that indicated heavy pollution. Hayrat and Eziz [41] also revealed that dust samples from Korla, China were heavily polluted by Cr (PCr = 3.33), Cu (PCu = 5.81), Pb (PPb = 7.32), and Cd (PCd = 35.0), with the degree of pollution associated with anthropogenic activity. Another study conducted by Wahab et al. [21] in Malaysia presented the Pi values of metals in street dust in the Tunku Abdul Rahman road, Kuala Lumpur, where Zn (PZn = 3.94), Pb (PPb = 4.20), Cr (PCr = 5.78), and Cu (PCu = 8.43) showed high levels of pollution. The PLI values of metals in street dust fluctuate from 1.6 to 4.0, and an average value of 2.6 indicates moderate pollution (Figure 5c). Similar results have been reported by Dytłow and Górka-Kostrubiec [60] and Kabir et al. [22], who studied the toxic metals in street dust in Poland and Bangladesh.

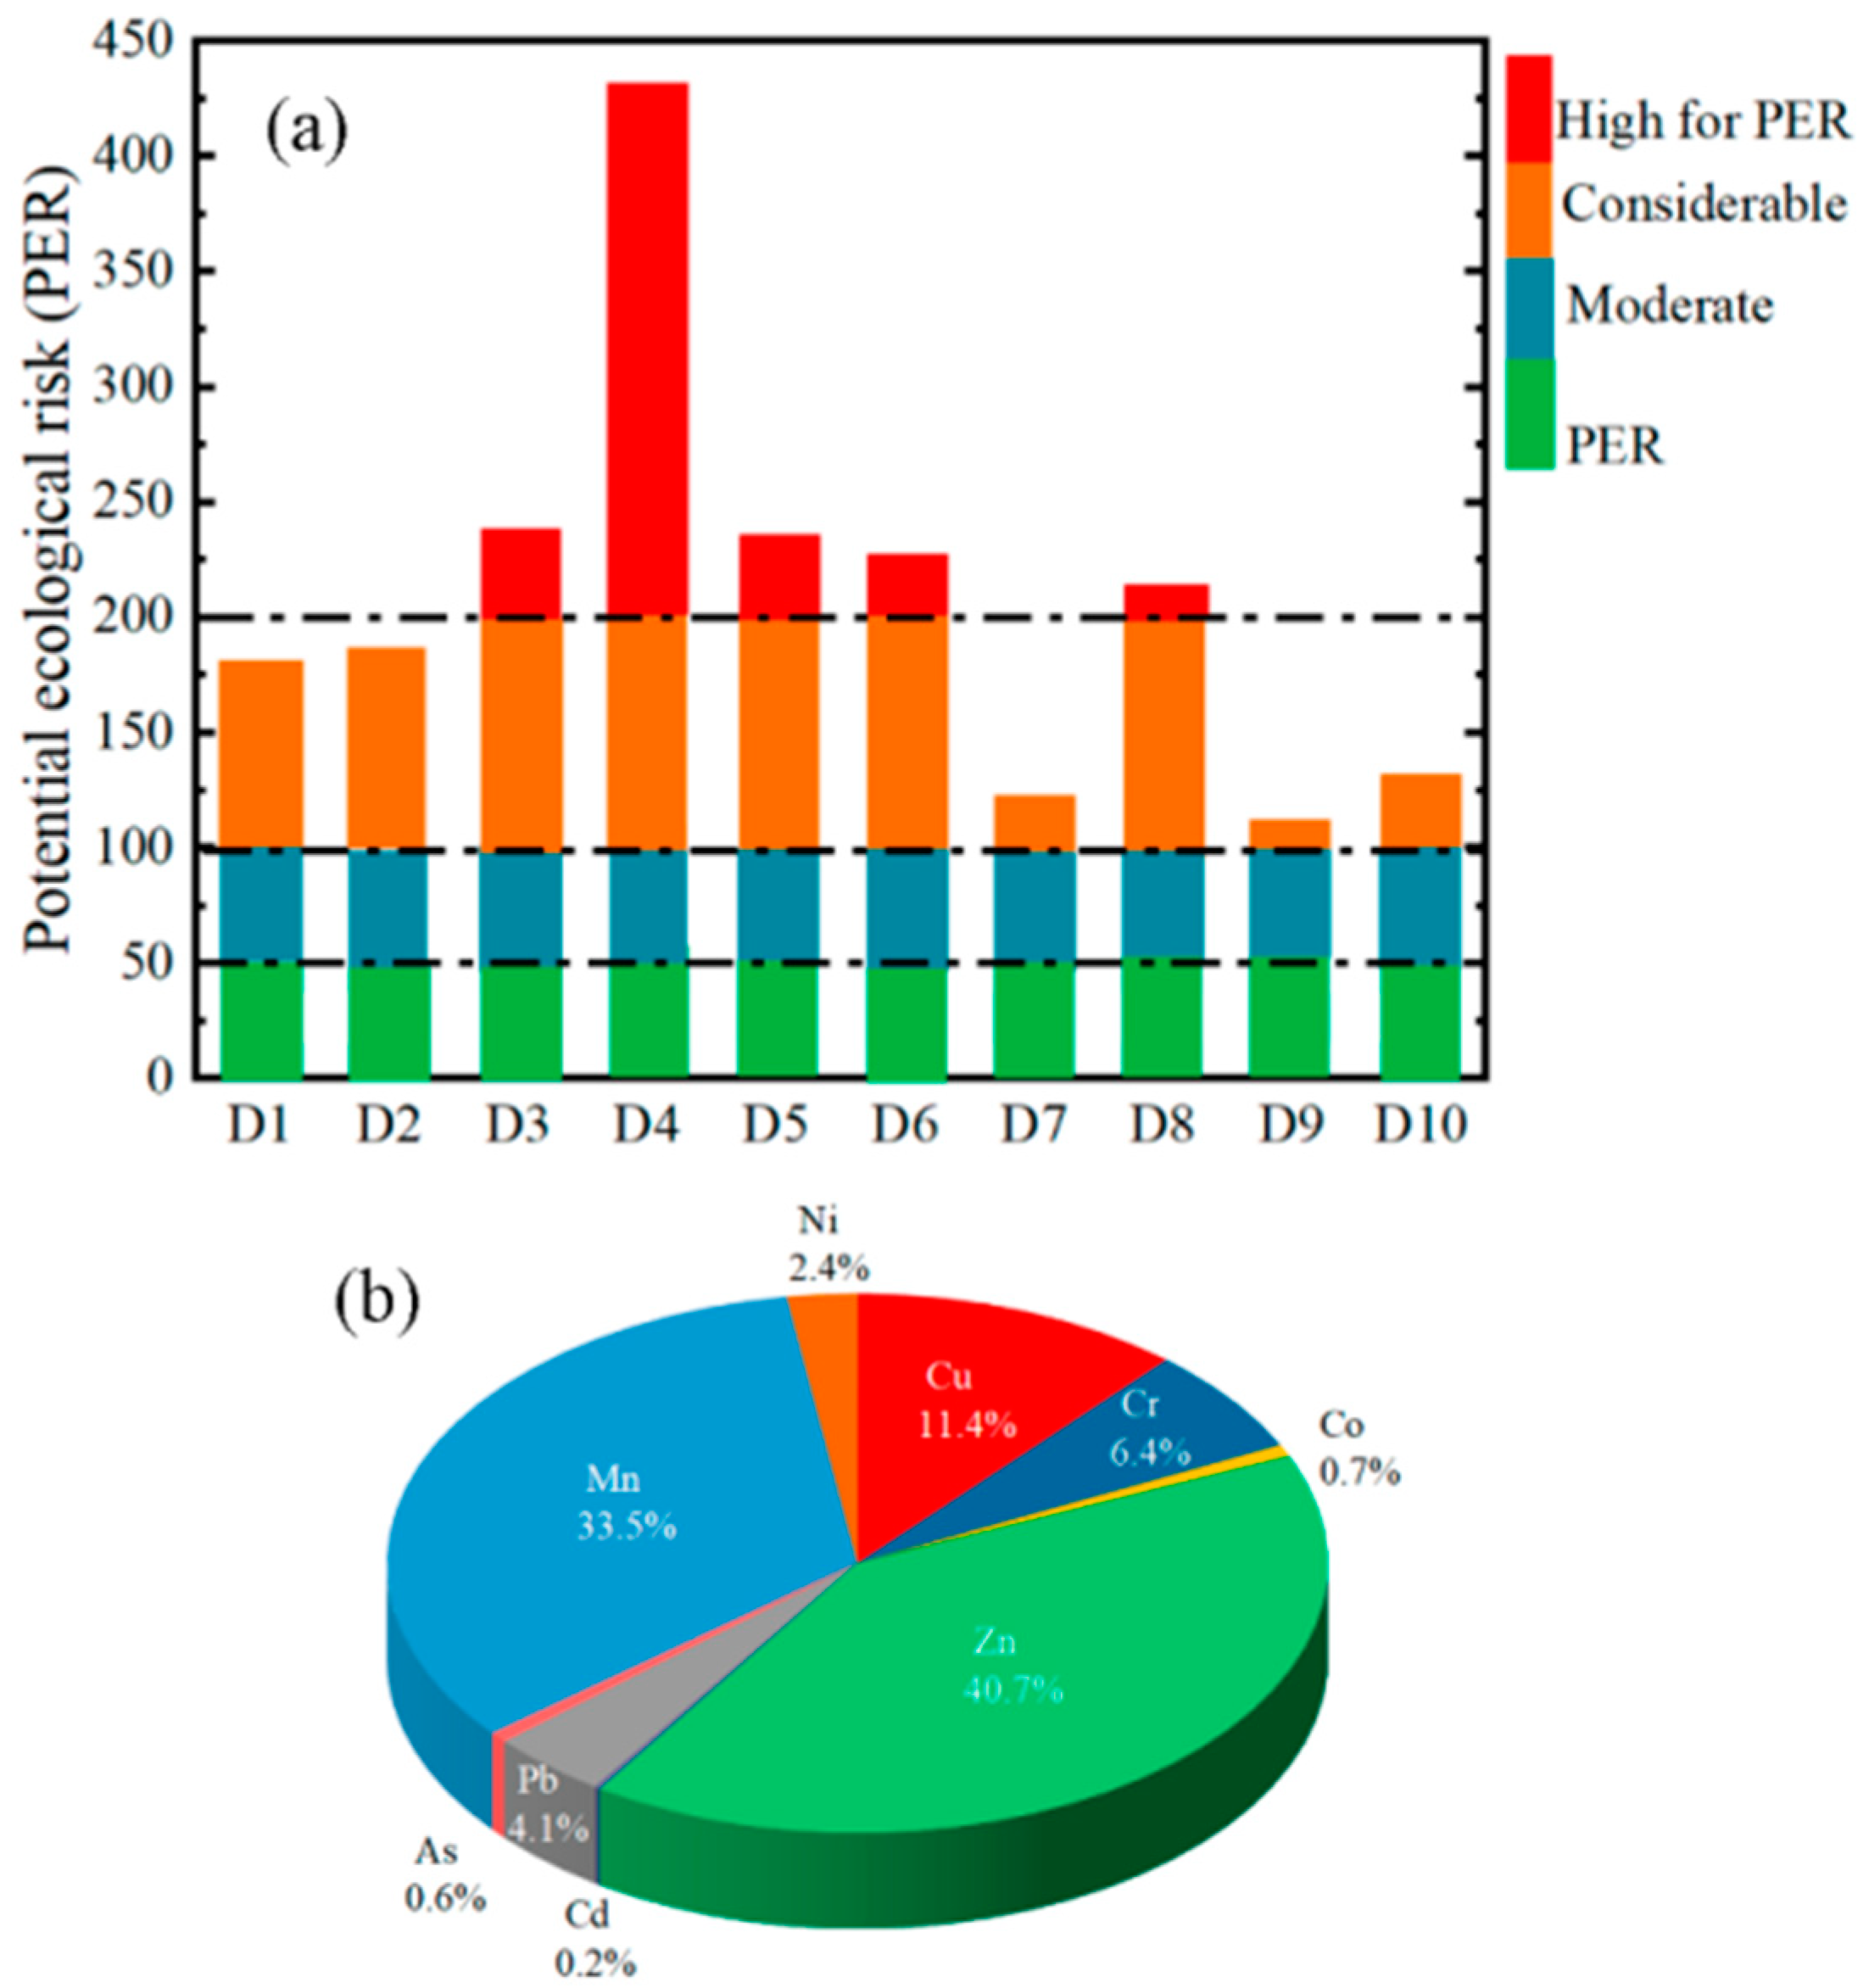
3.4. Potential Ecological Risk (PER)

The PER data were calculated by summing the cumulative effects of all metals. The PER results for different locations are presented in Figure 6a. The mean level of the PER for the calculated metals in the street-dust samples was 207.43, and the values ranged from 111.17 to 431.53, suggesting a high potential ecological risk. Similarly, Kormoker et al. [61] found that the level of ecological risk from heavy metals (i.e., Cd, As, Pb, Cu, Ni, and Cr) in Lokhikol, Bangladesh was very high (PER = 270). Kamani et al. [63] conducted their study in the center of Tehran and revealed that the highest PER values were associated with bad traffic jams. The PER ranged from 81.93 to 508.2 with a mean value of 234.0, indicating a high level of potential ecological risk. Comparing the sampling sites, the highest PER value was at D4 and the lowest value was at D9. In this study, the average contribution of individual metals to the PER (Figure 6b) decreased in the following order for the elements: Zn (40.7%) > Mn (33.5%) > Cu (11.4%) > Cr (6.4%) > Pb > (4.1%) > Ni (2.4%) > Co (0.7%) > As (0.6%) > Cd (0.2%). The results suggest that Zn and Mn could be the main contributors to the ecological risk in our sampling area. Since Zn and Mn are known to be released from anthropogenic sources [48], it is necessary to control their emission to limit any threats to the ecosystem.
Figure 7 shows the relationship between the PER and the EF of nine metals (Cd, Co, Cr, Ni, Cu, Pb, As, Mn, and Zn). The R2 values of Cu, Zn, and Mn were 0.9098, 0.8208, and 0.7563, respectively. This suggests that the EF values of Cu, Zn, and Mn were closely related to the PER. In contrast, no obvious correlation was found for Cd, Cr, Co, Ni, As, and Pb with regard to PER.

4. Conclusions

This study was conducted to evaluate the concentration of 16 metals (Se, Cd, Sb, Mo, B, Sn, As, Co, Ni, V, Pb, Cr, Cu, Mn, Zn, and Ti) in street dust from Ha Noi highway, HCM City. The mean concentrations of all metals were higher than the background values. Compared to the other metals, the highest concentration was observed for Ti (676.3 ± 155.4 mg/kg) and the lowest concentration for Se (0.4 ± 0.1 mg/kg). The metal concentrations decreased in the following order: Ti > Zn > Mn > Cu > Cr > Pb > V > Ni > Co > As > Sn > B > Mo > Sb > Cd > Se. The PCA and EF results revealed that Se, Mn, and Co were derived from a lithological (natural) origin, while most of the metals were significantly affected by anthropogenic activities, including industrial and vehicular sources. The PLI values of metals in street dust range from 1.6 to 4.0 and an average value of 2.6 indicates moderate pollution. We found that the value of PER (207.43) showed a high potential ecological risk. The results suggested that Zn (40.7%) and Mn (33.5%) could be the major contributors to the ecological risk. Although only a small number of samples were collected, the outcomes of this study will be useful for scientists to fill the information gap on the pollution of various metals in street dust from Vietnam, where there is a lack of available observational data. Furthermore, a large-scale survey including various areas with different characteristics is needed, as a future study, to better understand the pollution levels and emission sources of heavy metals in street dust.

Supplementary Materials

The following are available online at https://www.mdpi.com/article/10.3390/atmos12121548/s1, Figure S1: The scree plot of PCA; Table S1: Location and GPS coordinates of sampling (D) and background sites (BG); Table S2: The geo-accumulation index classification, standard criteria of enrichment factors, and pollution load index classification for the assessment of the pollution status of sampling sites; Table S3: The potential ecological risk index (Ei) and the potential ecological risk (PER) classification for ecological risk assessment; Table S4: Concentrations (mg/kg) of metals in street dust for the different sampling sites; Table S5: Results of principal component analysis for 16 heavy metals in street dust from Ha Noi highway, Ho Chi Minh City.

Author Contributions

Sampling, sample analysis, investigation, software, writing—original draft, writing—review and editing, V.-T.N.; data curation, conceptualization, methodology, writing—review and editing, D.-H.N., T.-B.N., L.-S.P.N., X.C.N., V.-C.D., T.-H.-H.N., T.-M.-T.H., H.-G.H., and T.-G.H.D.; supervision, conception, design of the methodology, writing—review and editing, N.D.D., T.-D.-H.V., M.-H.B., and X.-T.B. All authors have read and agreed to the published version of the manuscript.

Funding

This research was funded by Saigon University grant number [TĐ2020-57].

Institutional Review Board Statement

Not applicable.

Informed Consent Statement

Not applicable.

Data Availability Statement

The data presented in this study are available on request from the corresponding author.

Conflicts of Interest

The authors declare no conflict of interest. The funders had no role in the design of the study, in the collection, analyses, or interpretation of data, in the writing of the manuscript, or in the decision to publish the results.

References

  1. Wei, X.; Gao, B.; Wang, P.; Zhou, H.; Lu, J. Pollution characteristics and health risk assessment of heavy metals in street dusts from different functional areas in Beijing, China. Ecotoxicol. Environ. Saf. 2015, 112, 186–192. [Google Scholar] [CrossRef] [PubMed]
  2. Kabadayi, F.; Cesur, H. Determination of Cu, Pb, Zn, Ni, Co, Cd, and Mn in road dusts of Samsun City. Environ. Monit. Assess. 2010, 168, 241–253. [Google Scholar] [CrossRef] [PubMed]
  3. Yu, B.; Lu, X.; Fan, X.; Fan, P.; Zuo, L.; Yang, Y.; Wang, L. Analyzing environmental risk, source and spatial distribution of potentially toxic elements in dust of residential area in Xi’an urban area, China. Ecotoxicol. Environ. Saf. 2021, 208, 111679. [Google Scholar] [CrossRef] [PubMed]
  4. Chen, L.; Zhang, H.; Ding, M.; Devlin, A.T.; Wang, P.; Nie, M.; Xie, K. Exploration of the variations and relationships between trace metal enrichment in dust and ecological risks associated with rapid urban expansion. Ecotoxicol. Environ. Saf. 2021, 212, 111944. [Google Scholar] [CrossRef]
  5. Men, C.; Liu, R.; Xu, L.; Wang, Q.; Guo, L.; Miao, Y.; Shen, Z. Source-specific ecological risk analysis and critical source identification of heavy metals in road dust in Beijing, China. J. Hazard. Mater. 2020, 388, 121763. [Google Scholar] [CrossRef] [PubMed]
  6. Bartholomew, C.J.; Li, N.; Li, Y.; Dai, W.; Nibagwire, D.; Guo, T. Characteristics and health risk assessment of heavy metals in street dust for children in Jinhua, China. Environ. Sci. Pollut. Res. 2020, 27, 5042–5055. [Google Scholar] [CrossRef] [PubMed]
  7. Wei, B.; Jiang, F.; Li, X.; Mu, S. Heavy metal induced ecological risk in the city of Urumqi, NW China. Environ. Monit. Assess 2010, 160, 33–45. [Google Scholar] [CrossRef]
  8. Trujillo-González, J.M.; Torres-Mora, M.A.; Jiménez-Ballesta, R.; Zhang, J. Land-use-dependent spatial variation and exposure risk of heavy metals in road-deposited sediment in Villavicencio, Colombia. Environ. Geochem. Health 2019, 41, 667–679. [Google Scholar] [CrossRef]
  9. Alsbou, E.M.E.; Al-Khashman, O.A. Heavy metal concentrations in roadside soil and street dust from Petra region, Jordan. Environ. Monit. Assess. 2018, 190, 48. [Google Scholar] [CrossRef]
  10. Kariper, İ.A.; Üstündağ, İ.; Deniz, K.; Mülazımoğlu, İ.E.; Erdoğan, M.S.; Kadıoğlu, Y.K. Elemental monitoring of street dusts in Konya in Turkey. Microchem. J. 2019, 148, 338–345. [Google Scholar] [CrossRef]
  11. Al-Taani, A.A.; Nazzal, Y.; Howari, F.M. Assessment of heavy metals in roadside dust along the Abu Dhabi–Al Ain National Highway, UAE. Environ. Earth Sci. 2019, 78, 1–13. [Google Scholar] [CrossRef]
  12. Dat, N.D.; Nguyen, V.T.; Bui, X.T.; Bui, M.H.; Nguyen, L.S.P.; Nguyen, X.C.; Tran, A.T.K.; Ju, Y.R.; Nguyen, D.H.; Bui, H.N. Contamination, source attribution, and potential health risks of heavy metals in street dust of a metropolitan area in Southern Vietnam. Environ. Sci. Pollut. Res. 2021, 28, 50405–50419. [Google Scholar] [CrossRef]
  13. Zhang, J.; Wu, L.; Zhang, Y.; Li, F.; Fang, X.; Mao, H. Elemental composition and risk assessment of heavy metals in the PM10 fractions of road dust and roadside soil. Particuology 2019, 44, 146–152. [Google Scholar] [CrossRef]
  14. Zhang, M.; Li, X.; Yang, R.; Wang, J.; Ai, Y.; Gao, Y.; Zhang, Y.; Zhang, X.; Yan, X.; Liu, B. Multipotential toxic metals accumulated in urban soil and street dust from Xining City, NW China: Spatial occurrences, sources, and health risks. Arch. Environ. Contam. Toxicol. 2019, 76, 308–330. [Google Scholar] [CrossRef] [PubMed]
  15. Ali, M.U.; Liu, G.; Yousaf, B.; Abbas, Q.; Ullah, H.; Munir, M.A.M.; Fu, B. Pollution characteristics and human health risks of potentially (eco) toxic elements (PTEs) in road dust from metropolitan area of Hefei, China. Chemosphere 2017, 181, 111–121. [Google Scholar] [CrossRef] [PubMed]
  16. Sadeghdoust, F.; Ghanavati, N.; Nazarpour, A.; Babaenejad, T.; Watts, M.J. Hazard, ecological, and human health risk assessment of heavy metals in street dust in Dezful, Iran. Arab. J. Geosci. 2020, 13, 1–14. [Google Scholar] [CrossRef]
  17. Abbasi, S.; Keshavarzi, B.; Moore, F.; Mahmoudi, M.R. Fractionation, source identification and risk assessment of potentially toxic elements in street dust of the most important center for petrochemical products, Asaluyeh County, Iran. Environ. Earth Sci. 2018, 77, 1–19. [Google Scholar] [CrossRef]
  18. Shahab, A.; Zhang, H.; Ullah, H.; Rashid, A.; Rad, S.; Li, J.; Xiao, H. Pollution characteristics and toxicity of potentially toxic elements in road dust of a tourist city, Guilin, China: Ecological and health risk assessment. Environ. Pollut. 2020, 266, 115419. [Google Scholar] [CrossRef] [PubMed]
  19. Alharbi, B.H.; Pasha, M.J.; Alotaibi, M.D.; Alduwais, A.K.; Al-Shamsi, M.A.S. Contamination and risk levels of metals associated with urban street dust in Riyadh, Saudi Arabia. Environ. Sci. Pollut. Res. 2020, 27, 18475–18487. [Google Scholar] [CrossRef]
  20. Musa, A.; Hamza, S.; Kidak, R. Street dust heavy metal pollution implication on human health in Nicosia, North Cyprus. Environ. Sci. Pollut. Res. 2019, 26, 28993–29002. [Google Scholar] [CrossRef] [PubMed]
  21. Wahab, M.I.A.; Abd Razak, W.M.A.; Sahani, M.; Khan, M.F. Characteristics and health effect of heavy metals on non-exhaust road dusts in Kuala Lumpur. Sci. Total Environ. 2020, 703, 135535. [Google Scholar] [CrossRef] [PubMed]
  22. Kabir, M.H.; Kormoker, T.; Islam, M.S.; Khan, R.; Shammi, R.S.; Tusher, T.R.; Proshad, R.; Islam, M.S.; Idris, A.M. Potentially toxic elements in street dust from an urban city of a developing country: Ecological and probabilistic health risks assessment. Environ. Sci. Pollut. Res. 2021, 28, 57126–57148. [Google Scholar] [CrossRef]
  23. Kabir, M.H.; Kormoker, T.; Shammi, R.S.; Tusher, T.R.; Islam, M.S.; Khan, R.; Omor, M.Z.U.; Sarker, M.E.; Yeasmin, M.; Idris, A.M. A comprehensive assessment of heavy metal contamination in road dusts along a hectic national highway of Bangladesh: Spatial distribution, sources of contamination, ecological and human health risks. Toxin Rev. 2021, 1–20. Available online: https://www.tandfonline.com/doi/abs/10.1080/15569543.2021.1952436 (accessed on 16 November 2021). [CrossRef]
  24. Egbueri, J.C.; Ukah, B.U.; Ubido, O.E.; Unigwe, C.O. A chemometric approach to source apportionment, ecological and health risk assessment of heavy metals in industrial soils from southwestern Nigeria. Int. J. Environ. Anal. Chem. 2020, 1–19. Available online: https://www.tandfonline.com/doi/abs/10.1080/03067319.2020.1769615?journalCode=geac20 (accessed on 16 November 2021). [CrossRef]
  25. Ghanavati, N.; Nazarpour, A.; De Vivo, B. Ecological and human health risk assessment of toxic metals in street dusts and surface soils in Ahvaz, Iran. Environ. Geochem. Health 2019, 41, 875–891. [Google Scholar] [CrossRef] [PubMed]
  26. Roy, S.; Gupta, S.K.; Prakash, J.; Habib, G.; Baudh, K.; Nasr, M. Ecological and human health risk assessment of heavy metal contamination in road dust in the National Capital Territory (NCT) of Delhi, India. Environ. Sci. Pollut. Res. 2019, 26, 30413–30425. [Google Scholar] [CrossRef]
  27. Phi, T.H.; Chinh, P.M.; Ly, L.T.M.; Thai, P.K. Spatial distribution of elemental concentrations in street dust of Hanoi, Vietnam. Bull. Environ. Contam. Toxicol. 2017, 98, 277–282. [Google Scholar] [CrossRef] [PubMed]
  28. Phi, T.H.; Chinh, P.M.; Cuong, D.D.; Ly, L.T.M.; Van Thinh, N.; Thai, P.K. Elemental concentrations in roadside dust along two national highways in northern Vietnam and the health-risk implication. Arch. Environ. Contam. Toxicol. 2018, 74, 46–55. [Google Scholar] [CrossRef] [PubMed]
  29. GSOVietnam. General Statistics Office of Vietnam, Statistical Yearbook of Vietnam, Statistical Publishing House; General Statistics Office of Vietnam: Hanoi, Vietnam, 2019.
  30. Trojanowska, M.; Świetlik, R. Investigations of the chemical distribution of heavy metals in street dust and its impact on risk assessment for human health, case study of Radom (Poland). Hum. Ecol. Risk. Assess. 2019, 26, 1–20. [Google Scholar] [CrossRef]
  31. USEPA. SW-846 Test. Method 3051A: Microwave Assisted Acid Digestion of Sediments, Sludges, Soils, and Oils; United States Environmental Protection Agency: Washington, DC, USA, 2007.
  32. USEPA. Method 200.8, Revision 5.4: Determination of Trace Elements in Waters and Wastes by Inductively Coupled Plasma—Mass Spectrometry; United States Environmental Protection Agency: Washington, DC, USA, 1994.
  33. Buat-Menard, P.; Chesselet, R. Variable influence of the atmospheric flux on the trace metal chemistry of oceanic suspended matter. Earth Planet. Sci. Lett. 1979, 42, 399–411. [Google Scholar] [CrossRef]
  34. Khademi, H.; Gabarrón, M.; Abbaspour, A.; Martínez-Martínez, S.; Faz, A.; Acosta, J. Distribution of metal (loid) s in particle size fraction in urban soil and street dust: Influence of population density. Environ. Geochem. Health 2020, 42, 4341–4354. [Google Scholar] [CrossRef] [PubMed]
  35. Fang, G.C.; Wu, Y.S.; Chang, S.Y.; Huang, S.H.; Rau, J.Y. Size distributions of ambient air particles and enrichment factor analyses of metallic elements at Taichung Harbor near the Taiwan Strait. Atmos. Res. 2006, 81, 320–333. [Google Scholar] [CrossRef]
  36. Li, F.; Zhang, J.; Huang, J.; Huang, D.; Yang, J.; Song, Y.; Zeng, G. Heavy metals in road dust from Xiandao District, Changsha City, China: Characteristics, health risk assessment, and integrated source identification. Environ. Sci. Pollut. Res. 2016, 23, 13100–13113. [Google Scholar] [CrossRef] [PubMed]
  37. Joshi, U.M.; Vijayaraghavan, K.; Balasubramanian, R. Elemental composition of urban street dusts and their dissolution characteristics in various aqueous media. Chemosphere 2009, 77, 526–533. [Google Scholar] [CrossRef]
  38. Liu, E.; Yan, T.; Birch, G.; Zhu, Y. Pollution and health risk of potentially toxic metals in urban road dust in Nanjing, a mega-city of China. Sci. Total Environ. 2014, 476, 522–531. [Google Scholar] [CrossRef]
  39. Zhou, L.; Liu, G.; Shen, M.; Hu, R.; Sun, M.; Liu, Y. Characteristics and health risk assessment of heavy metals in indoor dust from different functional areas in Hefei, China. Environ. Pollut. 2019, 251, 839–849. [Google Scholar] [CrossRef]
  40. Cheng, Z.; Chen, L.-J.; Li, H.-H.; Lin, J.-Q.; Yang, Z.-B.; Yang, Y.-X.; Xu, X.-X.; Xian, J.-R.; Shao, J.-R.; Zhu, X.-M. Characteristics and health risk assessment of heavy metals exposure via household dust from urban area in Chengdu, China. Sci. Total Environ. 2018, 619, 621–629. [Google Scholar] [CrossRef]
  41. Hayrat, A.; Eziz, M. Identification of the spatial distributions, pollution levels, sources, and health risk of heavy metals in surface dusts from Korla, NW China. Open Geosci. 2020, 12, 1338–1349. [Google Scholar] [CrossRef]
  42. Hakanson, L. An ecological risk index for aquatic pollution control. A sedimentological approach. Water Res. 1980, 14, 975–1001. [Google Scholar] [CrossRef]
  43. Vu, C.T.; Lin, C.; Nguyen, K.A.; Shern, C.-C.; Kuo, Y.-M. Ecological risk assessment of heavy metals sampled in sediments and water of the Houjing River, Taiwan. Environ. Earth Sci. 2018, 77, 388. [Google Scholar] [CrossRef]
  44. Wang, G.; Xia, D.; Liu, X.; Chen, F.; Yu, Y.; Yang, L.; Chen, J.; Zhou, A. Spatial and temporal variation in magnetic properties of street dust in Lanzhou City, China. Chin. Sci. Bull. 2008, 53, 1913–1923. [Google Scholar] [CrossRef] [Green Version]
  45. Pan, H.; Lu, X.; Lei, K. A comprehensive analysis of heavy metals in urban road dust of Xi’an, China: Contamination, source apportionment and spatial distribution. Sci. Total Environ. 2017, 609, 1361–1369. [Google Scholar] [CrossRef] [PubMed]
  46. Shabbaj, I.I.; Alghamdi, M.A.; Shamy, M.; Hassan, S.K.; Alsharif, M.M.; Khoder, M.I. Risk assessment and implication of human exposure to road dust heavy metals in Jeddah, Saudi Arabia. Int. J. Environ. Res. Public Health 2018, 15, 36. [Google Scholar] [CrossRef] [Green Version]
  47. Bourliva, A.; Christophoridis, C.; Papadopoulou, L.; Giouri, K.; Papadopoulos, A.; Mitsika, E.; Fytianos, K. Characterization, heavy metal content and health risk assessment of urban road dusts from the historic center of the city of Thessaloniki, Greece. Environ. Geochem. Health 2017, 39, 611–634. [Google Scholar] [CrossRef]
  48. Idris, A.M.; Alqahtani, F.M.; Said, T.O.; Fawy, K.F. Contamination level and risk assessment of heavy metal deposited in street dusts in Khamees-Mushait city, Saudi Arabia. Hum. Ecol. Risk Assess 2020, 26, 495–511. [Google Scholar] [CrossRef]
  49. Hini, G.; Eziz, M.; Wang, W.; Ili, A.; Li, X. Spatial distribution, contamination levels, sources, and potential health risk assessment of trace elements in street dusts of Urumqi city, NW China. Hum. Ecol. Risk Assess. 2019, 26, 2112–2128. [Google Scholar] [CrossRef]
  50. Qadeer, A.; Saqib, Z.A.; Ajmal, Z.; Xing, C.; Khalil, S.K.; Usman, M.; Huang, Y.; Bashir, S.; Ahmad, Z.; Ahmed, S. Concentrations, pollution indices and health risk assessment of heavy metals in road dust from two urbanized cities of Pakistan: Comparing two sampling methods for heavy metals concentration. Sustain. Cities Soc. 2020, 53, 101959. [Google Scholar] [CrossRef]
  51. Duong, T.T.T.; Lee, B.K. Determining contamination level of heavy metals in road dust from busy traffic areas with different characteristics. J. Environ. Manag. 2011, 92, 554–562. [Google Scholar] [CrossRef]
  52. Dong, S.; Gonzalez, R.O.; Harrison, R.M.; Green, D.; North, R.; Fowler, G.; Weiss, D. Isotopic signatures in atmospheric particulate matter suggest important contributions from recycled gasoline for lead and non-exhaust traffic sources for copper and zinc in aerosols in London, United Kingdom. Atmos Environ. 2017. Available online: https://kclpure.kcl.ac.uk/portal/en/publications/isotopic-signatures-in-atmospheric-particulate-matter-suggest-important-contribu-tions-from-recycled-gasoline-for-lead-and-nonexhaust-traffic-sources-for-copper-and-zinc-in-aerosols-in-london-united-kingdom(447f5aeb-b0b0-445b-b525-96602a3866fa).html (accessed on 16 November 2021). [CrossRef] [Green Version]
  53. Taiwo, A.; Musa, M.; Oguntoke, O.; Afolabi, T.; Sadiq, A.; Akanji, M.; Shehu, M. Spatial distribution, pollution index, receptor modelling and health risk assessment of metals in road dust from Lagos metropolis, Southwestern Nigeria. Adv. Environ. 2020, 2, 100012. [Google Scholar] [CrossRef]
  54. Men, C.; Liu, R.; Xu, F.; Wang, Q.; Guo, L.; Shen, Z. Pollution characteristics, risk assessment, and source apportionment of heavy metals in road dust in Beijing, China. Sci. Total Environ. 2018, 612, 138–147. [Google Scholar] [CrossRef] [PubMed]
  55. Rahman, M.S.; Khan, M.D.H.; Jolly, Y.N.; Kabir, J.; Akter, S.; Salam, A. Assessing risk to human health for heavy metal contamination through street dust in the Southeast Asian Megacity: Dhaka, Bangladesh. Sci. Total Environ. 2019, 660, 1610–1622. [Google Scholar] [CrossRef] [PubMed]
  56. Duong, T.T.; Lee, B.-K. Partitioning and mobility behavior of metals in road dusts from national-scale industrial areas in Korea. Atmos Environ. 2009, 43, 3502–3509. [Google Scholar] [CrossRef]
  57. Peltier, R.E.; Lippmann, M. Residual oil combustion: Distributions of airborne nickel and vanadium within New York City. J. Expo. Sci. Environ. Epidemiol. 2010, 20, 342–350. [Google Scholar] [CrossRef] [PubMed]
  58. Lau, W.K.Y.; Liang, P.; Man, Y.B.; Chung, S.S.; Wong, M.H. Human health risk assessment based on trace metals in suspended air particulates, surface dust, and floor dust from e-waste recycling workshops in Hong Kong, China. Environ. Sci. Pollut. Res. 2014, 21, 3813–3825. [Google Scholar] [CrossRef] [PubMed]
  59. Shabanda, I.S.; Koki, I.B.; Low, K.H.; Zain, S.M.; Khor, S.M.; Bakar, N.K.A. Daily exposure to toxic metals through urban road dust from industrial, commercial, heavy traffic, and residential areas in Petaling Jaya, Malaysia: A health risk assessment. Environ. Sci. Pollut. Res. 2019, 26, 37193–37211. [Google Scholar] [CrossRef]
  60. Dytłow, S.; Górka-Kostrubiec, B. Concentration of heavy metals in street dust: An implication of using different geochemical background data in estimating the level of heavy metal pollution. Environ. Geochem. Health 2021, 43, 521–535. [Google Scholar] [CrossRef] [PubMed]
  61. Kormoker, T.; Proshad, R.; Islam, S.; Ahmed, S.; Chandra, K.; Uddin, M.; Rahman, M. Toxic metals in agricultural soils near the industrial areas of Bangladesh: Ecological and human health risk assessment. Toxin Rev. 2019, 1–20. Available online: https://www.tandfonline.com/doi/abs/10.1080/15569543.2019.1650777 (accessed on 16 November 2021). [CrossRef]
  62. Malakootian, M.; Mohammadi, A.; Nasiri, A.; Asadi, A.M.S.; Conti, G.O.; Faraji, M. Spatial distribution and correlations among elements in smaller than 75 μm street dust: Ecological and probabilistic health risk assessment. Environ. Geochem. Health 2021, 43, 567–583. [Google Scholar] [CrossRef] [PubMed]
  63. Kamani, H.; Mahvi, A.H.; Seyedsalehi, M.; Jaafari, J.; Hoseini, M.; Safari, G.H.; Dalvand, A.; Aslani, H.; Mirzaei, N.; Ashrafi, S.D. Contamination and ecological risk assessment of heavy metals in street dust of Tehran, Iran. Int. J. Environ. Sci. Technol. 2017, 14, 2675–2682. [Google Scholar] [CrossRef]
Figure 1. A regional map of Vietnam (a); Ho Chi Minh City (b); sampling sites on Ha Noi highway (c); background sampling sites in Can Gio District (d).
Atmosphere 12 01548 g001
Figure 2. Average Concentrations of the metals (Se, Cd, Sb, Mo, B, Sn, As, Co, Ni, V, Pb, Cr, Mn, Cu, Zn, and Ti) in the sampling sites (black dots present the concentration values of metals at different sampling sites) (a) and the contributions of heavy metals at the sampling point (b).
Atmosphere 12 01548 g002
Figure 3. Spatial distribution of Zn, Cu, Mn, Pb, Cr, and Ni at sampling sites.
Atmosphere 12 01548 g003
Figure 4. Analysis of sixteen metals in Ha Noi highway street dust: (a) Pearson correlation coefficients among the heavy metals; (b) results from PCA in 3-D space; (c) dendrogram results calculated using the Ward’s method for cluster analysis.
Atmosphere 12 01548 g004
Figure 5. Box plots of enrichment factors (a), Igeo index values of heavy metals (b), and pollution levels of heavy metals (c) in this study (black dots present the outlier values).
Atmosphere 12 01548 g005
Figure 6. Spatial distribution of the potential ecological risk index: low (PER < 50), moderate (PER = 50–100), considerable (PER = 100–200), and high (PER > 200) (a) and percentage contribution of metals to ecological risk (b).
Atmosphere 12 01548 g006
Figure 7. The relationship between the potential ecological risk index and enrichment factors: (ai) show Cd, Co, Cr, Ni, Cu, Zn, As, Mn, and Pb results, respectively.
Atmosphere 12 01548 g007
Table 1. Comparison of potentially toxic elements (mg/kg) in street dust from different sites worldwide.
Sampling SitesSeCdSbMoBSnAsCoNiVPbCrCuMnZnTiReferences
Xi’an, China *--------26.456.894.5251.854.8406377-[3]
Nanchang City, China **-1.0----10.1-28.1-89.5112.5101.3-277.23277.9[4]
Beijing, China *-0.5----4.1-40.8-62.399.597.4536.3255.9-[5]
Jinhua, China **-4.9----8.7-76.3-110.6105.3133.74518430.3-[6]
Tianjin, China **-2.121.812.8-82.929.510.577.9100.2120.7-527.5670.6983.20.7[13]
Xining City, China *--8.9--22.86.024.623.551.862.8507.830.3377.7104.81977.9[14]
Hefei, China **--1.6--1.22.07.228.631.40.9139.341.6240.5130.11522[15]
Urumqi, China ** -1.2-----10.943.3-53.554.394.5926.6294.5-[7]
Villavicencio, Colombia ***-0.04------1.3-20.718.747.7164.1118.1-[8]
Dezful, Iran ***-0.4----384638544451-224-[16]
Asaluyeh County, Iran **-0.32.214.2--4.96.535.1-50.37.3121.3252.7518.5158.4[17]
Irbid-North Shooneh,
Jordan ***
-11.0-----36.060.0-79.016.04.0-122.0-[9]
Konya, Turkey *-------71068192216-68-[10]
Abu Dhabi, UAE ***-0.5----0.2-0.3-50.1306.3--173.0-[11]
Ho Chi Minh City, Vietnam **-0.5-----7.936.2-49.6102.4153.7393.9466.4-[12]
Ho Chi Minh City, Vietnam **0.40.60.84.15.77.08.38.330.935.552.281.4144.7426.6519.2676.3This study
Note: “-” indicates data not available. The dust samples were analyzed by X–ray fluorescence spectrometry (*), ICP-MS (**), and atomic absorption spectroscopy (***).
Publisher’s Note: MDPI stays neutral with regard to jurisdictional claims in published maps and institutional affiliations.

