Article

Sensitivity of Surface Fluxes in the ECMWF Land Surface Model to the Remotely Sensed Leaf Area Index and Root Distribution: Evaluation with Tower Flux Data

1
Instituto Dom Luiz, IDL, Faculty of Sciences, University of Lisbon, 1749-016 Lisbon, Portugal
2
Department for Biogeochemical Integration, Max Planck Institute for Biogeochemistry, 07743 Jena, Germany
3
European Centre for Medium-Range Weather Forecasts, Shinfield Park, Reading RG2 9AX, UK
4
Instituto Português do Mar e Atmosfera, IPMA, 1749-077 Lisbon, Portugal
*
Author to whom correspondence should be addressed.
Atmosphere 2020, 11(12), 1362; https://doi.org/10.3390/atmos11121362
Submission received: 11 November 2020 / Revised: 8 December 2020 / Accepted: 12 December 2020 / Published: 16 December 2020

Abstract

:
The surface-atmosphere turbulent exchanges couple the water, energy and carbon budgets in the Earth system. The biosphere plays an important role in the evaporation process, and vegetation related parameters such as the leaf area index (LAI), vertical root distribution and stomatal resistance are poorly constrained due to sparse observations at the spatio-temporal scales at which land surface models (LSMs) operate. In this study, we use the Carbon Hydrology Tiled European Center for Medium-Range Weather Forecasts (ECMWF) Scheme for Surface Exchanges over Land (CHTESSEL) model and investigate the sensitivity of the simulated turbulent fluxes to these vegetation related parameters. Observed data from 17 FLUXNET towers were used to force and evaluate model simulations with different vegetation parameter configurations. The replacement of the current LAI climatology used by CHTESSEL, by a new high-resolution climatology, representative of the station’s location, has a small impact on the simulated fluxes. Instead, a revision of the root profile considering a uniform root distribution reduces the underestimation of evaporation during water stress conditions. Despite the limitations of using only one model and a limited number of stations, our results highlight the relevance of root distribution in controlling soil moisture stress, which is likely to be applicable to other LSMs.

1. Introduction

The water, energy, and carbon exchanges between the land surface and the atmosphere are key components of the Earth system. These exchanges are crucial for the understanding of the Earth system’ response to the increase in greenhouse gas concentration and climate change. The variety and complexity of the underlying processes driving these exchanges (from boundary layer turbulence to plant physiology) are challenging both to observe and to model. From a modelling perspective, these fluxes provide boundary conditions to numerical weather prediction models (NWP) and earth system models (ESM). The longer time scales of some of the land surface processes [1,2], when compared with the atmosphere, are crucial for sub-seasonal to seasonal predictability [3,4,5] and to represent climate feedbacks [6,7].
The turbulent exchanges of latent heat flux (Qle), or evaporation, couples the surface water, energy and carbon budgets. Evaporation requires available water and energy [8]. Additionally, a significant part of evaporation is due to plant transpiration [9,10,11], which is coupled with vegetation photosynthesis and carbon exchanges, with a key role for soil moisture [12]. From an atmospheric perspective, the partition of the net surface energy into Qle and sensible heat flux (Qh) modulates the atmospheric boundary layer evolution with implications ranging from convection and cloud evolution [13] to the amplification of extremes [14,15]. Vegetation transpiration and carbon uptake for photosynthesis are mediated by stomatal opening. Therefore, stomatal conductance is an essential component in the representation of evaporation in land surface models (LSMs). Stomatal conductance is modulated by environmental factors (e.g., water stress) [16], and the leaf-to-canopy upscaling, dependent on the vegetation characteristics [17].
In this study, we focus on the impact of the representation of canopy resistance on the Qle and Qh fluxes in the European Center for Medium-Range Weather Forecasts (ECMWF) land surface model (LSM) Carbon Hydrology Tiled ECMWF Scheme for Surface Exchanges over Land (CHTESSEL) [18,19]. This study is motivated by the results of the Land Surface Model Benchmarking Evaluation Project (PLUMBER [20]), in which CHTESSEL participated, and by Ukkola et al. [21], which focused on seasonal-scale evaporative droughts. These studies compared the performance of several LSMs using atmospheric forcing from several FLUXNET towers. Best et al. [20] benchmarked the LSMs against simple physically based models and empirical relationships. The striking results showed that all participating LSMs were outperformed by an out-of-sample linear regression against downward shortwave radiation for the simulation of sensible heat flux and by a three-variable nonlinear regression that uses instantaneous atmospheric humidity and temperature in addition to downward shortwave radiation for the simulation of latent heat flux. Another key finding in PLUMBER was that LSMs had difficulties in simulating latent heat flux at sites with low annual precipitation, suggesting that this could be associated with the representation of water stress conditions in the models. The follow-up study of Ukkola et al. [21] found systematic biases across the LSMs, including CHTESSEL, in the simulation of energy and water fluxes under water-stressed conditions. Despite these limitations, Best et al. [20] also found that LSMs performed well, compared with the empirical benchmarks, when considering metrics for the extremes of the distributions. Therefore, the physical constraints in the LSMs and their continued development are paramount to simulate conditions outside of training conditions, as is the case for climate change scenarios [22].
Canopy resistance in CHTESSEL follows an empirical multiplicative formulation describing the effects of different environmental variables [23], which is a common approach in several LSMs. Another approach is to couple net photosynthesis with canopy resistance [24]. CHTESSEL also has a module to compute natural land carbon exchanges, but the carbon exchanges are decoupled from evaporation due to conflicting results in NWP [25], justifying the focus on Qle and Qh in this study. In the resistance approach used by CHTESSEL, vegetation characteristics are considered via the use of the leaf area index (LAI). The environmental factors account for water stress, which is dependent on soil moisture content varying linearly between unstressed vegetation and the wilting point. In this study, we address these two components of the canopy resistance formulation in CHTESSEL: (i) vegetation characteristics and (ii) water stress.
Vegetation characteristics are investigated by testing the use of a high-resolution LAI climatology based on the Moderate Resolution Imaging Spectroradiometer (MODIS) product. The impact of a high-resolution albedo climatology is also investigated. The use of this high-resolution data is motivated by the increased quality and amount of available Earth observations (EO) [26]. Here, we aim at evaluating the impact of using location specific LAI data when compared with the common LAI data that have been spatially aggregated to a coarse grid for NWP applications. The water stress representation is investigated by testing a uniform root distribution with an associated maximum rooting depth. This is compared with the current formulation in CHTESSEL that assumes an exponential root distribution [27]. The root distribution defines the maximum amount of water that is reachable by the plants, modulating the response of transpiration to moisture stress [12,28].
As in Best et al. [20], observed data from 17 stations of the FLUXNET global network of micrometeorological flux measurements are used to carry out offline simulations with CHTESSEL and evaluate sensible and latent heat fluxes, with particular emphasis on the representation of evaporation and its relation with water stressed conditions. The main objective of the study is to evaluate the representation of canopy resistance by testing (i) the added value of the high-resolution LAI and albedo to represent local station conditions and (ii) the impact of root distribution on soil moisture stress. The data and methods are described in the next section, followed by the presentation of the results. The results are discussed in Section 4 followed by the main conclusion of this study in Section 5.

2. Data and Methods

2.1. Data

2.1.1. Tower Flux Data

Observed data from 20 FLUXNET towers were initially considered in this study as in Best et al. [20]. These stations are widely used since they present a variety of vegetation types and climates [20,29,30]. The Spanish stations of ElSaler and ElSaler2 were removed due to the presence of large water bodies nearby and irrigated agricultural fields. The Canadian station of Merbleue was also problematic and thus removed since this tower is in the middle of a wetland, which is difficult to correctly model. This corroborates Haverd et al. [31], who also removed these three stations from their study, resulting in the 17 stations described in Table 1. The data include gap-filled half-hourly driving data for the LSM (air temperature and humidity, surface pressure, wind speed, precipitation and downward solar and thermal radiation) and surface sensible and latent heat flux used for model evaluation.

2.1.2. Satellite Albedo and Leaf Area Index

In this study, we use the combined Moderate Resolution Imaging Spectroradiometer (MODIS) LAI and fraction of photosynthetically active radiation (FPAR) product (MCD15A3H.006). This is a 4 day composite dataset with a spatial resolution of 500 m available since July 2002 to the present. This MODIS product has been validated in different studies [32,33] reporting uncertainties in the order of 1 m 2 /m 2 . In addition to the MODIS LAI product, the Copernicus Global Land Service (CGLS) LAI was also used in this study. The product was obtained from SPOT-VGT and PROBA-V satellite observations with 1 km resolution using a neural network algorithm [34] and has been available since 1999. A comparison between MODIS and CGLS (a new version with a 300 m resolution) LAI products with ground based observations over North America reported root mean squared differences of 0.57 for the CGLS product and 0.81 to 0.89 for MODIS [35].
In addition to the LAI product, we also use the Combined MODIS bidirectional reflectance distribution function (BRDF) and Albedo products (MCD43A4.006) [36]. This product has been available since February 2000 with a 500 m resolution. Wang et al. [37] reported root mean squared errors ranging between 0.02 for forest regions and 0.03 for agricultural/grassland regions.
In this study, we apply the most restrictive quality control (QC) criteria in order to select only the best quality data. In the case of the albedo product, the model requires snow-free albedo. Therefore, the MODIS snow products (MOD10A1.006 and MYD10A1.006) were used to mask the albedo data when snow was present. A less restrictive quality filtering was applied for LAI [32], and good quality data were also selected (QC < 64—highest and good quality). A similar quality control data filtering was also applied to the CGLS data (only QC = 0 (land pixel clear observations) or QC = 512 (high latitude (lat) > 55 ° and solar zenith angle > 70)).
MODIS LAI and albedo, as well as the CGLS LAI were extracted for the 17 FLUXNET stations (see Table 1) by averaging the data of the central pixel with the four other pixels in the direct vicinity. Monthly means were first computed and the monthly climatology computed excluding months with more than 50% of missing data, for the full available period until 2018 (since 1999 for the CGLS LAI, since 2003 for the MODIS LAI and since 2000 for the MODIS albedo).
The quality based data screening was too restrictive for the northern latitude stations, especially during the winter when satellite products are subjected to cloud contamination. In Hyytiala, Loobos and Palang, the MODIS albedo product has a large amount of cloud contamination, and not enough data are available to calculate the monthly climatology. The quality control data filtering was therefore relaxed and changed not only to the best quality data, but also to good quality data (QC <= 1). After this processing, Hyytiala presented high albedo values in January, associated with snow contamination. January’s albedo was replaced by a linear interpolation between December and February. This shows the difficulty in generating snow-free albedo data [38], particularly in regions and during seasons that are predominantly snow (and cloud) covered. However, this is not expected to influence the model simulations as during January, the surface albedo has a small impact due to the reduced amount of available solar radiation in Hyytiala.

2.2. CHTESSEL Model

CHTESSEL is the land surface scheme of the ECMWF model [18,25]. In CHTESSEL, each grid-box is divided into up to 6 land fractions representing vegetation, soil, snow and interception. Surface fluxes are calculated separately for the different subgrid surface fraction (or “tile”), leading to a separate solution of the surface energy balance and skin temperature for each of these tiles, which are then aggregated in each grid-box. In each grid-box, two vegetation types can coexist (high and low vegetation) controlled by four parameters: dominant high and low vegetation type and the area fraction for the high and low vegetation. Each vegetation type is characterized by a series of fixed parameters: (i) minimum canopy resistance r s m i n , (ii) vegetation coverage density C v e g , (iii) coefficient G D , for the dependence of the canopy resistance on water vapour pressure deficit, and (iv) the root distribution over the soil layers, specified by an exponential profile modulated by the coefficients a r and b r . The numerical values for the parameters (see Table S1 in the Supplementary Material) are based on the literature [27,39,40,41,42,43,44] and on expert decisions in the context of the performance of the model in NWP. For example, the introduction of a seasonally variable LAI was accompanied with a revision of the minimum canopy resistance [25]. A detailed description of CHTESSEL can be found in the Integrated Forecasting System (IFS) documentation [45] and here, the details of the evaporation calculation are presented due to its relevance in the results’ interpretation and discussion.
For high and low vegetation, the turbulent flux of water is given by:
E = ρ a r a + r c ( q L q s a t ( T s k ) ) , r a = | U L | C H 1
where ρ a is the air density, U L and q L are the wind speed and humidity at the lowest atmospheric model level, q s a t ( T s k ) the saturation humidity at skin temperature ( T s k ) and C H the turbulent exchange coefficient (depending on the atmospheric stability). In addition to the aerodynamic resistance ( r a ), the canopy resistance ( r c ) [23] is calculated as:
r c = r s m i n L A I × f 1 ( R s ) × f 2 ( θ ) × f 3 ( D a )
where r s m i n is the minimum stomatal resistance (see Table S1), f 1 is a function of downward short-wave radiation ( R s ), f 3 a function of the atmospheric water vapour deficit ( D a ) and f 2 the soil moisture resistance given by:
1 / f 2 ( θ ¯ ) = 0 θ ¯ < θ p w p ( θ ¯ θ p w p ) / ( θ c a p θ p w p ) θ p w p θ ¯ θ c a p 1 θ ¯ > θ c a p
where θ p w p and θ c a p are the soil moisture at the permanent wilting point and at field capacity, respectively, and θ ¯ is a weighted average of the unfrozen soil water computed using the fraction of roots in each layer ( R k ) [27] using the a r and b r coefficients (in Table S1):
R k = 0.5 e x p a r z k 1 / 2 + e x p b r z k 1 / 2 e x p a r z k + 1 / 2 e x p b r z k + 1 / 2
where z k + 1 / 2 is the depth of the bottom layer k in m and z 1 / 2 is = 0 . In CHTESSEL, the soil is discretized into four layers with thicknesses of 0.07 , 0.21 , 0.72 and 1.89 m, with lower bounds at 0.07 , 0.28 , 1 and 2.89 m.
In CHTESSEL, the state of vegetation is given by the LAI, entering the canopy resistance calculation normalizing r s m i n (Equation (2)). In the current operational NWP configuration, a satellite observation based climatology is considered for the representation of LAI. It is based on Collection 5 of MODIS (product MOD15A2). The climatology was derived from 9 years of data (2000 to 2008) and rescaled to a previous LAI static field used at ECMWF before 2012 [19].

2.3. Simulation Setup

Offline point simulations were performed using CHTESSEL driven by the meteorological data observed at the towers. The model is initialized with soil moisture at field capacity and runs once for the full length of the available forcing period for each station. The state at the end of the simulation is then used to provide initial conditions to start the main simulation. For most sites, this procedure guarantees enough time for spin-up, in particular for the deeper soil moisture. The exceptions are Palang and Kruger with only two years. In both cases, the top meter soil moisture in the two years of simulation does not show a significant drift. In Palang, there is an increase of the deep soil moisture during the simulation (see Figure S1 in the Supplementary Material), but still within the inter-annual variability. At each site, only one dominant high or low vegetation type is allowed, defined according to the plant functional type (PFT). Howard, Kruger and Mopane stations report PFTs that are not available in CHTESSEL (woody savannah and savannah). These stations were set as tall grass vegetation type (see Table 2), as this is the closest vegetation type in the vicinity of the stations in the global land cover dataset used by the model.
Several model configurations were tested and are resumed in Table 3. These configurations aim at investigating the role of (i) high-resolution remote sensing LAI and albedo and (ii) model formulation and parameters. The first configuration, labelled as “CTR” for control, used CHTESSEL original input data with the ECMWF Integrated Forecasting System (IFS). The monthly climatologies of snow-free albedo and LAI were extracted from the nearest grid-point of operational NWP fields with a 9 km resolution. This model configuration serves as a reference against which other model configurations will be compared and was the same as used in [20]. The second experiment, labelled as “MALB ”, uses the MODIS extracted high-resolution albedo monthly climatology over the stations. The third configuration, labelled as “MLAI” uses the MODIS extracted high-resolution LAI monthly climatology over the station. In both cases, the albedo and LAI data represent the nearest five MODIS pixels from the station (as described in Section 2.1.2).
Two additional model configurations were tested to investigate the role of r s m i n and root distribution, both using the MODIS LAI high-resolution data. For r s m i n , a set of simulations varying r s m i n between 25 and 500 with a step of 25 was performed for each site. For the root distribution, a uniform root distribution was adopted up to a maximum rooting depth ( R D M A X m) by changing the computation of the root fraction in each layer in Equation (4) to:
R k = m a x 0 , m i n R D M A X , z k + 1 / 2 z k 1 / 2 R D M A X
In this configuration, four maximum rooting depths were tested: 0.5, 1, 2 and 3 m. The CTR root distribution for each vegetation type and for the tested uniform rooting depths are given in Table S1 (in Supplementary Material). The root density distribution and root depth are poorly constrained at large spatial scales as they vary between individual species and climate factors [46,47,48]. Therefore, in this study, a uniform distribution is a simple and straightforward first-order assumption.
An optimal model simulation for each site was then selected and labelled MLAI_RSMINfor the optimal simulations with varying r s m i n and MLAI_ROOT for the optimal simulations with varying the maximum rooting depth R D M A X . The selection of the optimal configuration is described in the following section. Finally, an idealized experiment removing the soil moisture stress function from the canopy resistance (MLAI_NOSMS, setting f 2 = 1 in Equation (2) when soil moisture is above the wilting point) was performed. This idealized experiment provides an estimate of evaporation in a situation of soil moisture at field capacity.

2.4. Evaluation

The simulated Qle and Qh are compared with the tower measurements using 4 metrics (i) the mean bias error (MBE), standard deviation difference (SD), correlation coefficient r, and normalized mean error (NME). The SD is computed as the absolute difference between 1.0 and the ratio between the simulated and observed standard deviation. The NME is the mean absolute error normalized by the mean absolute observed deviations from the mean. These metrics follow Best et al. [20] and are detailed in Appendix A. The calculations were performed on daily simulated and measured fluxes.
For the selection of the optimal simulations with varying r s m i n or maximum rooting depth, a ranking approach considering the four metrics for both Qh and Qle was considered. For each metric and flux, each simulation was ranked in ascending order from 1 to 20 in the case of r s m i n and 1 to 4 in the case of R D M A X . This resulted in rankings that were then added, and the simulation with the lowest rank was selected as the optimal simulation. This process was performed independently for each site and assumed that the metrics for Qle and Qh were of equal weight, and it did not distinguish between larger or smaller differences between metrics in the ranking. The use of the rankings of each metric without considering the actual metric value or the differences between simulations is a limitation as simulations ranked differently can be actually very close. This approach can be interpreted as a simple optimization strategy to select the optimal r s m i n or R D M A X for each site. However, it is not intended to be a proper model calibration as it is site specific and considers the entire set of observations. The search for the optimal simulations at each site by changing r s m i n or R D M A X was designed to provide an estimate of the upper bound on the best achievable performance of the model. It is a benchmark to determine if the model could be improved just by changing the particular parameter. The reduced number of stations (only 17) and sampling of vegetation types imposed limitations in performing a proper out-of-sample calibration to provide estimates of r s m i n and R D M A X for each of the vegetation types.

3. Results

3.1. Comparison of LAI and Albedo

In this section, we compare the LAI and high-resolution albedo (station) with the original CHTESSEL input data. The high-resolution MODIS data for each tower are compared with the original CHTESSEL input data in terms of the mean and root mean squared differences (RMSD), which are computed for the mean annual cycle. The MODIS albedo is very close to CTR in all stations (see Table 4) with most of the stations with RMSD around 0.03. There are two exceptions, Fort Peck and Loobos with an RMSD of 0.07 mostly due to lower values in ALB when compared with CTR during winter, which are associated with snow contamination. Despite the importance of albedo in the surface energy balance, these results suggest that for these 17 stations, we should expect a small impact on the CHTESSEL simulation due to the update of the CTR albedo by the high-resolution MODIS albedo.
The comparison of CTR and MLAI in Table 5 depicts comparatively large differences in several stations with the RMSD above one in Bugac, Hesse, Howland and Palang. The time series of the climatological LAI of CTR, MODIS and CGLS are shown for all stations in the Supplementary Material (Figures S1–S17). The large differences in the climatology are mostly in the seasonal cycle amplitude, with MLAI presenting a more pronounced seasonal phenology. These results show some uncertainty in mapping LAI between the different earth observation products. Despite the differences between MODIS and CGLS, our results show a larger discrepancy between the products and the CTR climatology used in CHTESSEL with a median RMSD of 0.86 between CTR and MLAI when compared with a median RMDS of 0.43 between MODIS and CGLS LAI. While the CTR LAI is also based on MODIS data, it was derived from a shorter time period (2000–2008) and was rescaled to match a previous LAI field used at ECMWF [19]. These LAI differences, both in the mean and in the annual cycle, are expected to impact the model simulations, which are investigated in the following section.

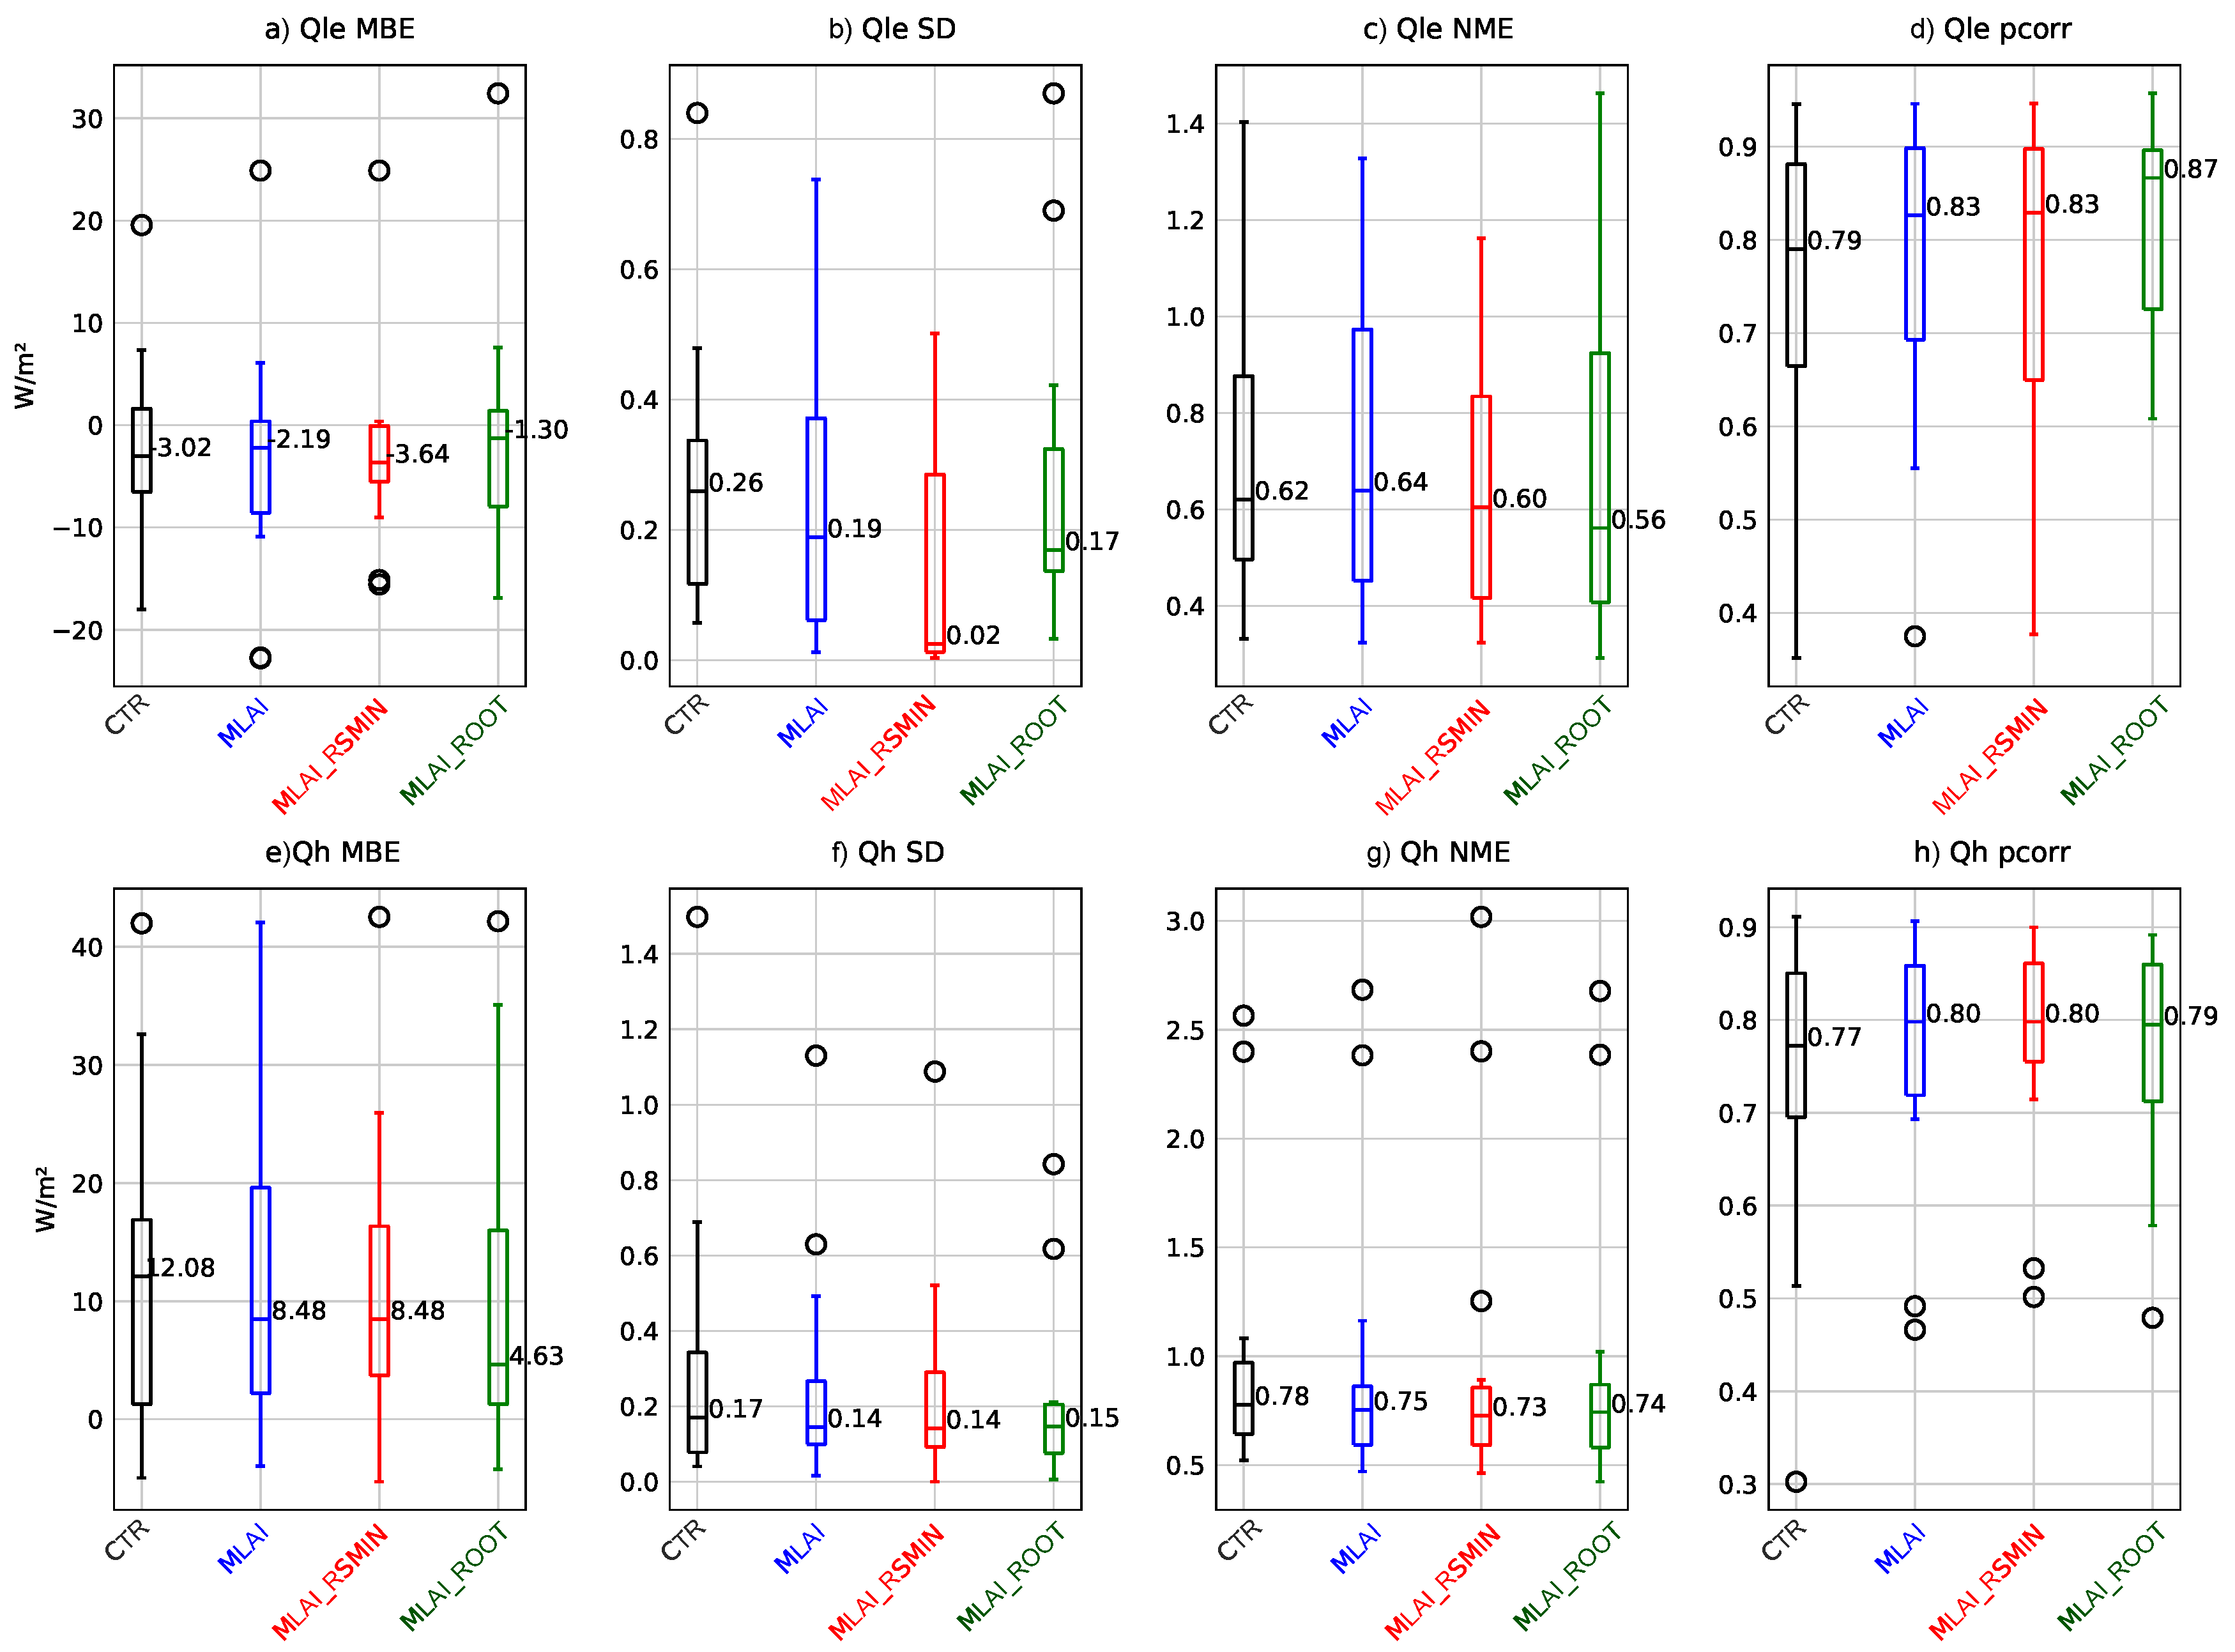
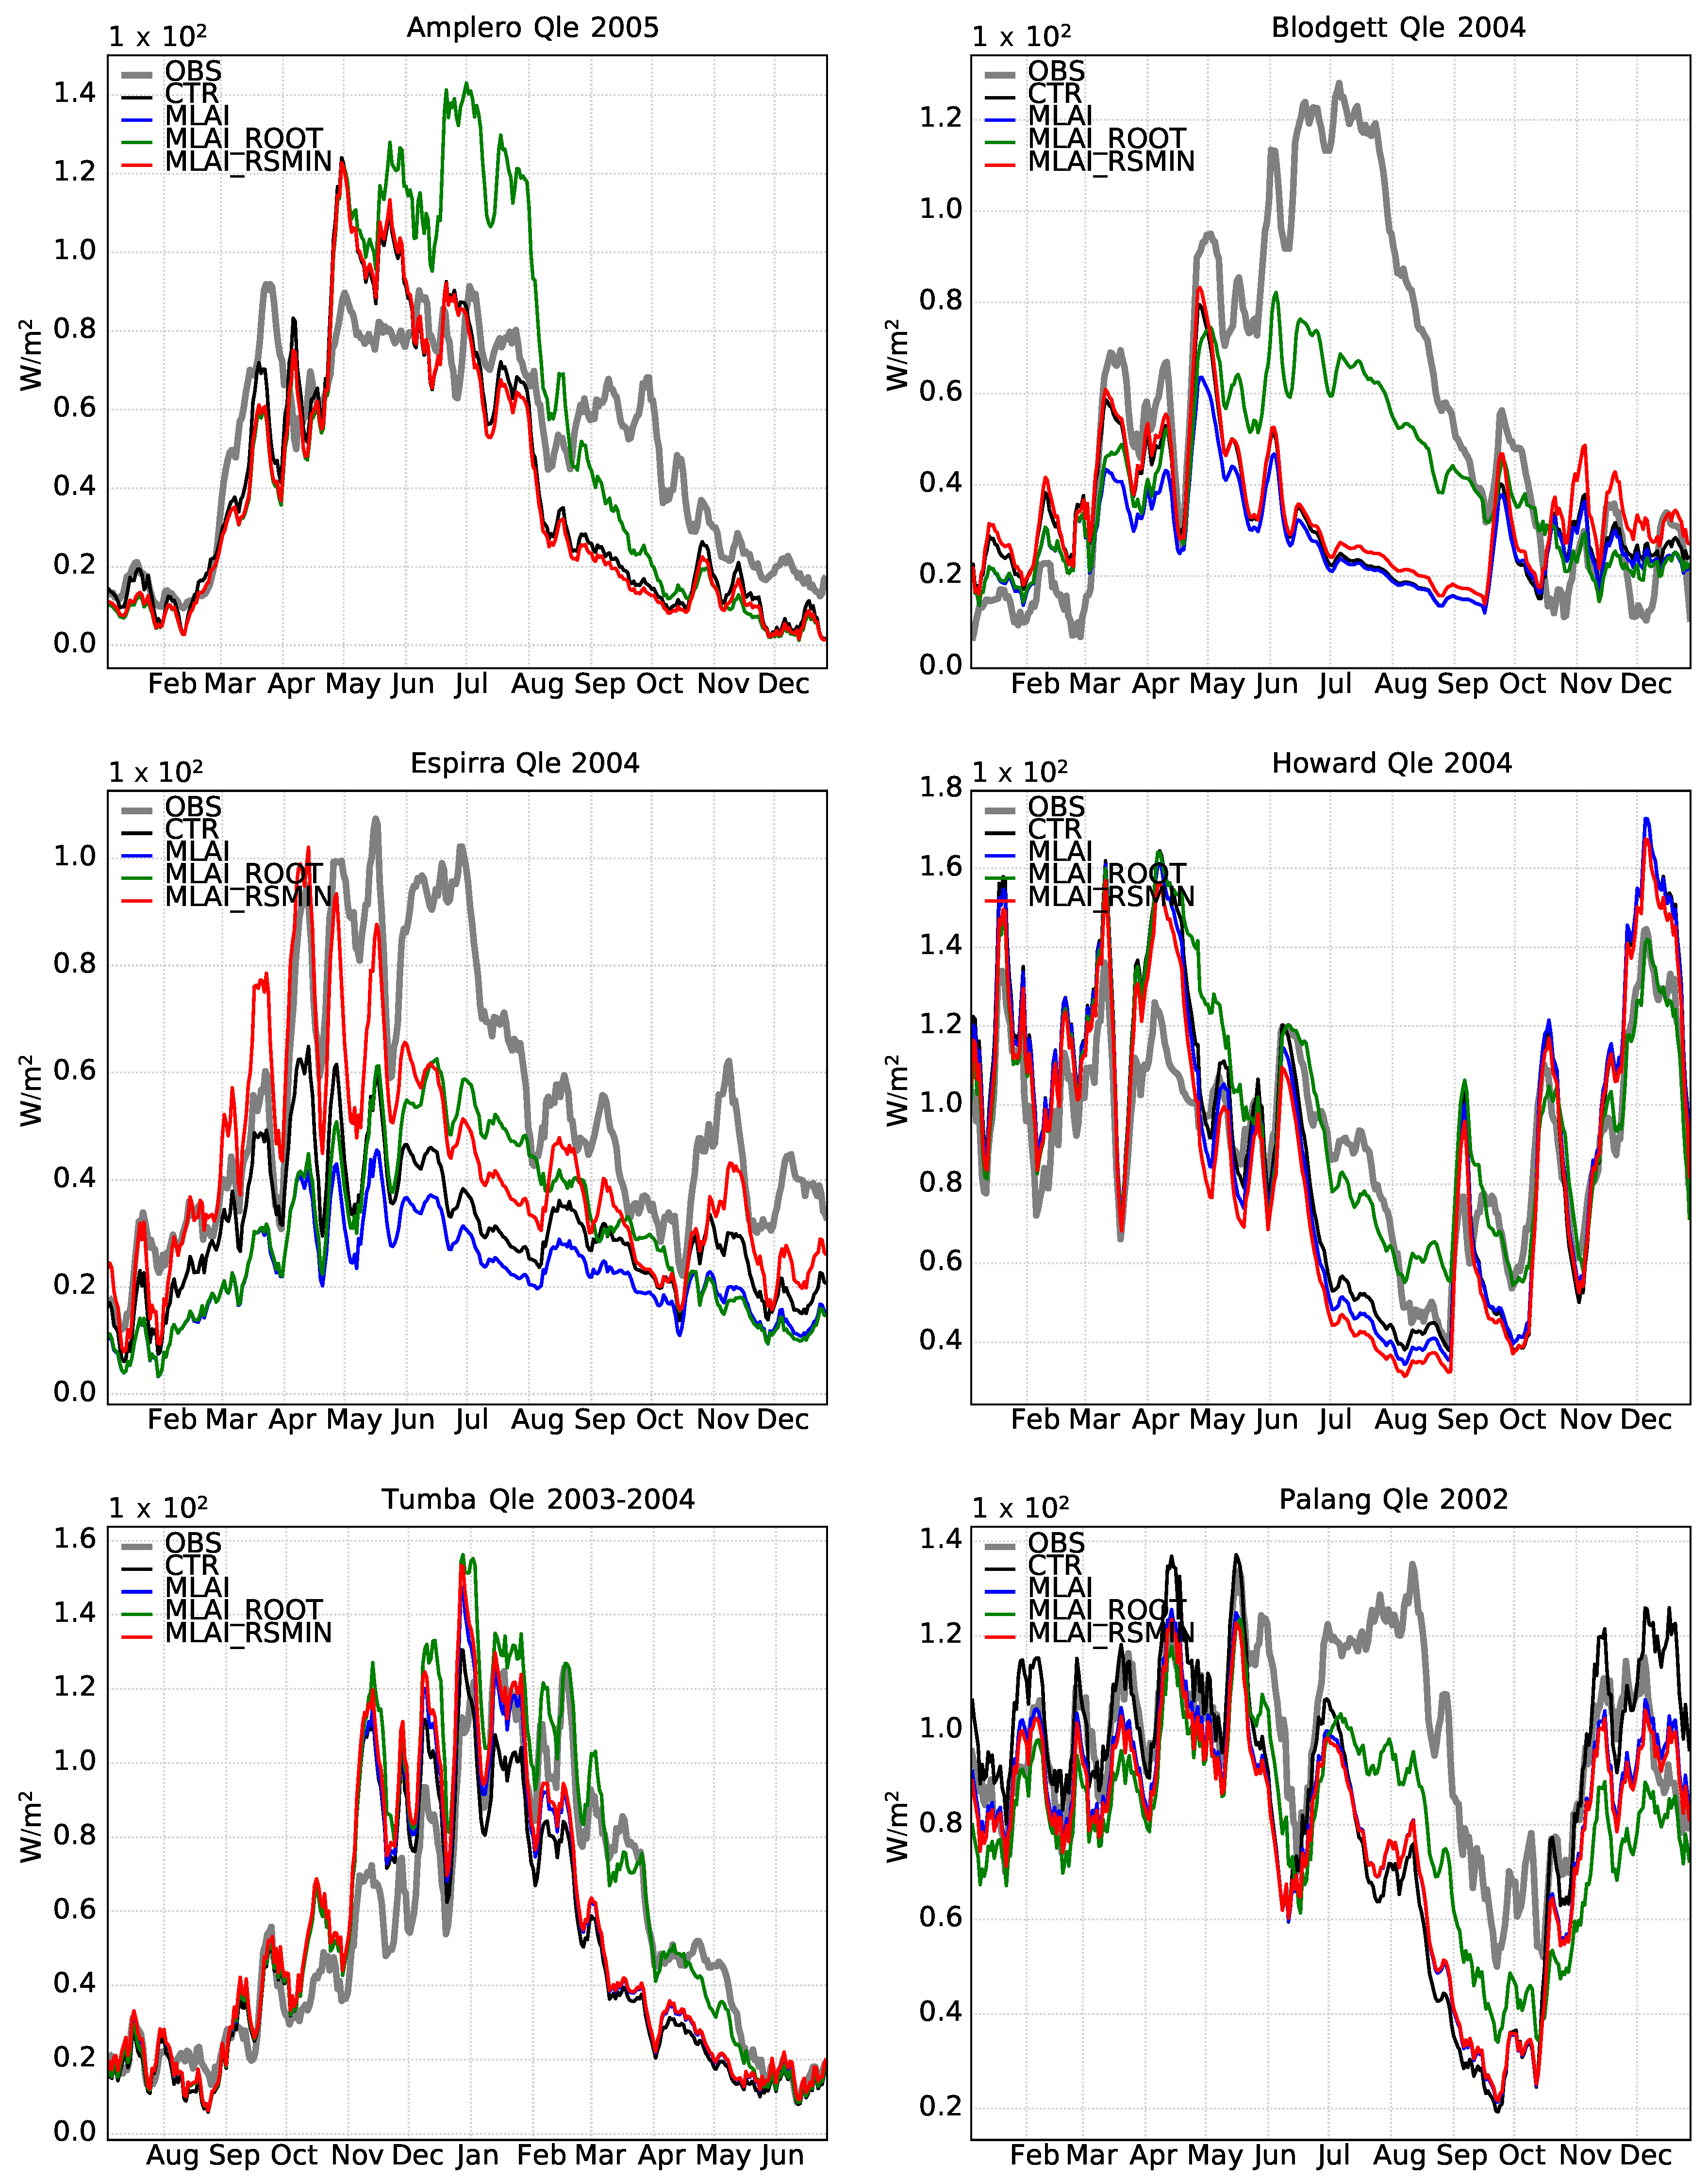
3.2. Fluxes Evaluation

The use of the high-resolution MODIS albedo had a negligible impact on model performance (not shown). This was expected due to the similarity between the albedo climatologies. Therefore, the MALB simulations are not shown nor further explored in this study. Figure 1 shows the distribution of the different metrics for Qh and Qle comparing the CTR and MLAI simulations (among other model configurations to be discussed in the next section). In the MLAI simulation, the Qle MBE is reduced from a median value of −3.02 W/m 2 in CTR to −2.19. Similarly, the Qh MBE is reduced from 12.08 W/m 2 in CTR to 8.48 W/m 2 in MLAI. The standard deviation ratio (SD) is also improved with a reduction from 0.26 and 0.17 for Qle and Qh, respectively, in CTR to 0.19 and 0.14 in MLAI. This improved variability is also seen in the temporal correlation with an increase from 0.79 to 0.83 in the Qle from CTR to MLAI and from 0.77 to 0.80 in Qh. Finally, the normalized mean error (NME) has a slight reduction in Qh from 0.78 in CTR to 0.75 in MLAI and slightly increases for Qle (0.62 in CTR and 0.64 in MLAI). We note that the statistical significance of the changes in the model performance were not assessed because of the small sample size. Despite the small sample, only 17 stations, these results suggest a modest, but positive impact of replacing CTR LAI by the high-resolution MODIS data for the station.
It was not possible to identify a systematic improvement in model performance associated with the use of the high-resolution LAI dataset. Each station reacts differently, depending on the time period considered. Some stations in some years benefit from the MODIS product, while other stations or time periods show a deterioration of model performance. Moreover, the impacts of the high-resolution LAI dataset on model performance could not be generalized or classified by plant functional type (PFT) as stations within the same PFT do not react similarly to LAI changes. Stations with a good performance in CTR (Fort Peck, Harvard, Howard, Howlandm, Hyytiala, Loobos, University of Michigan) are not impacted by the LAI changes. Additionally, the large differences between the CTR and LAI climatologies are not reflected in the changes in model performance in some stations like Hesse or Howlandm. However, some stations suffering from poorer performances in CTR benefit from MLAI as for example Bugac, Espirra, Palang, Sylvania and Tumba. Considering the four metrics used to characterise model performance, the temporal correlation benefits the most from the use of the high-resolution LAI since this product has a larger inter-seasonal variability than CTR.
LAI enters the canopy resistance formulation normalizing the minimum stomatal resistance ( r s m i n in Equation (2)). It is therefore expected that changes in the LAI climatology would benefit from an adjustment of the r s m i n parameter. Such an adjustment could be achieved by constraining r s m i n so that the ratio r s m i n /LAI would stay unchanged for each PFT. However, due to the small sample of stations for each PFT, such an approach is not feasible. A set of simulations with varying r s m i n was performed to select an optimal r s m i n with the best model performance for each station, as described in Section 2.4. The optimal r s m i n for each site is presented in Table 2. The simulations with the optimal r s m i n (MLAI_RSMIN) have a negligible impact on model performance (see Figure 1, comparing MLAI and MLAI_RSMIN). The only noteworthy impact is a clear reduction of the SD for Qle (see Figure 1 and Figure S2), with the remaining performance metrics unchanged when compared with MLAI. These results show that r s m i n acts primarily on the seasonal amplitude of Qle, explaining the large impact on SD, but neutral in the remaining performance metrics for Qle and Qh. In particular, the neutral impact on Qh SD highlights that the improved seasonal variability in Qle does not necessarily lead to an improved Qh seasonality.
There are three sites with a large increase of r s m i n from CTR to MLAI_RSMIN: Kruger (100 to 300), Mopane (175 to 300) and Sylvania (175 to 400). In all three cases, the mean LAI decreases from CTR to MLAI (see Table 2). This suggests that an adjustment that would keep the ratio r s m i n /LAI unchanged with changes in LAI would not be optimal or an indication that the default r s m i n parameters are not optimal. At these three stations, the increased r s m i n results in a reduction of evaporation, as expected, which is clearly seen in Sylvania (see Figure S3). However, the Qle reduction in Sylvania is associated with an unusually large r s m i n of 400 sm 1 , suggesting that this might be compensating missing processes in the model and/or errors in the driving/observations data (Ukkola et al. [21] reported that Sylvania was excluded from their study due to precipitation problems). There are three sites with a large decrease of r s m i n : Fort Peck (100 to 25), Blodgett (250 to 150) and Espirra (240 to 75). At these stations, there is also a reduction of the LAI from CTR to MLAI. From these three stations, Espirra stands out with the largest reduction of r s m i n , resulting in an increase of Qle and a decrease of Qh, particularly during spring (see Figure S4). We note that Qle in Espirra was underestimated in CTR and was further reduced in MLAI due to the reduction of the LAI (mean LAI changed from 2.38 in CTR to 1.42 in MLAI). The optimal r s m i n change from 240 to 75 acts to reduce the r s m i n /LAI ratio from 100 sm 1 to 52 sm 1 . We also note that the other two evergreen broadleaf tree stations, Palang and Tumba, have a mean LAI of about 4.4 m 2 /m 2 with an r s m i n /LAI ratio of 54 sm 1 . These results suggest that the high-resolution MODIS LAI extracted for Espirra station underestimates the station vegetation LAI [49].
The metric distributions in Figure 1 show some dispersion, associated with the occurrence of a few outliers. The detailed results for each station and score are presented in the Supplementary Material, in Figures S18–S25. It is possible to identify five stations with recurrent problematic results for Qh/Qle in different metrics: Blodgett, Espirra, Mopane, Palang and Kruger. In Kruger, CHTESSEL overestimates substantially the Qle after rainfall events, followed by an underestimation of the Qle and an overestimation of the Qh (see Figure S5). Kruger is a very dry station with soil moisture below the wilting point, and the peak evaporation following rainfall events is mainly driven by bare soil evaporation. The remaining four stations, Blodget, Espirra, Mopane and Palang, share a similar problem of an early evaporative reduction associated with dry soil moisture conditions resulting in the overestimation of Qh. Although not seen clearly in the evaluation metrics, Amplero and Tumba also show similar Qle temporal error patterns. This early evaporation reduction, or evaporative droughts, as proposed by Ukkola et al. [21], is further investigated in the following section.

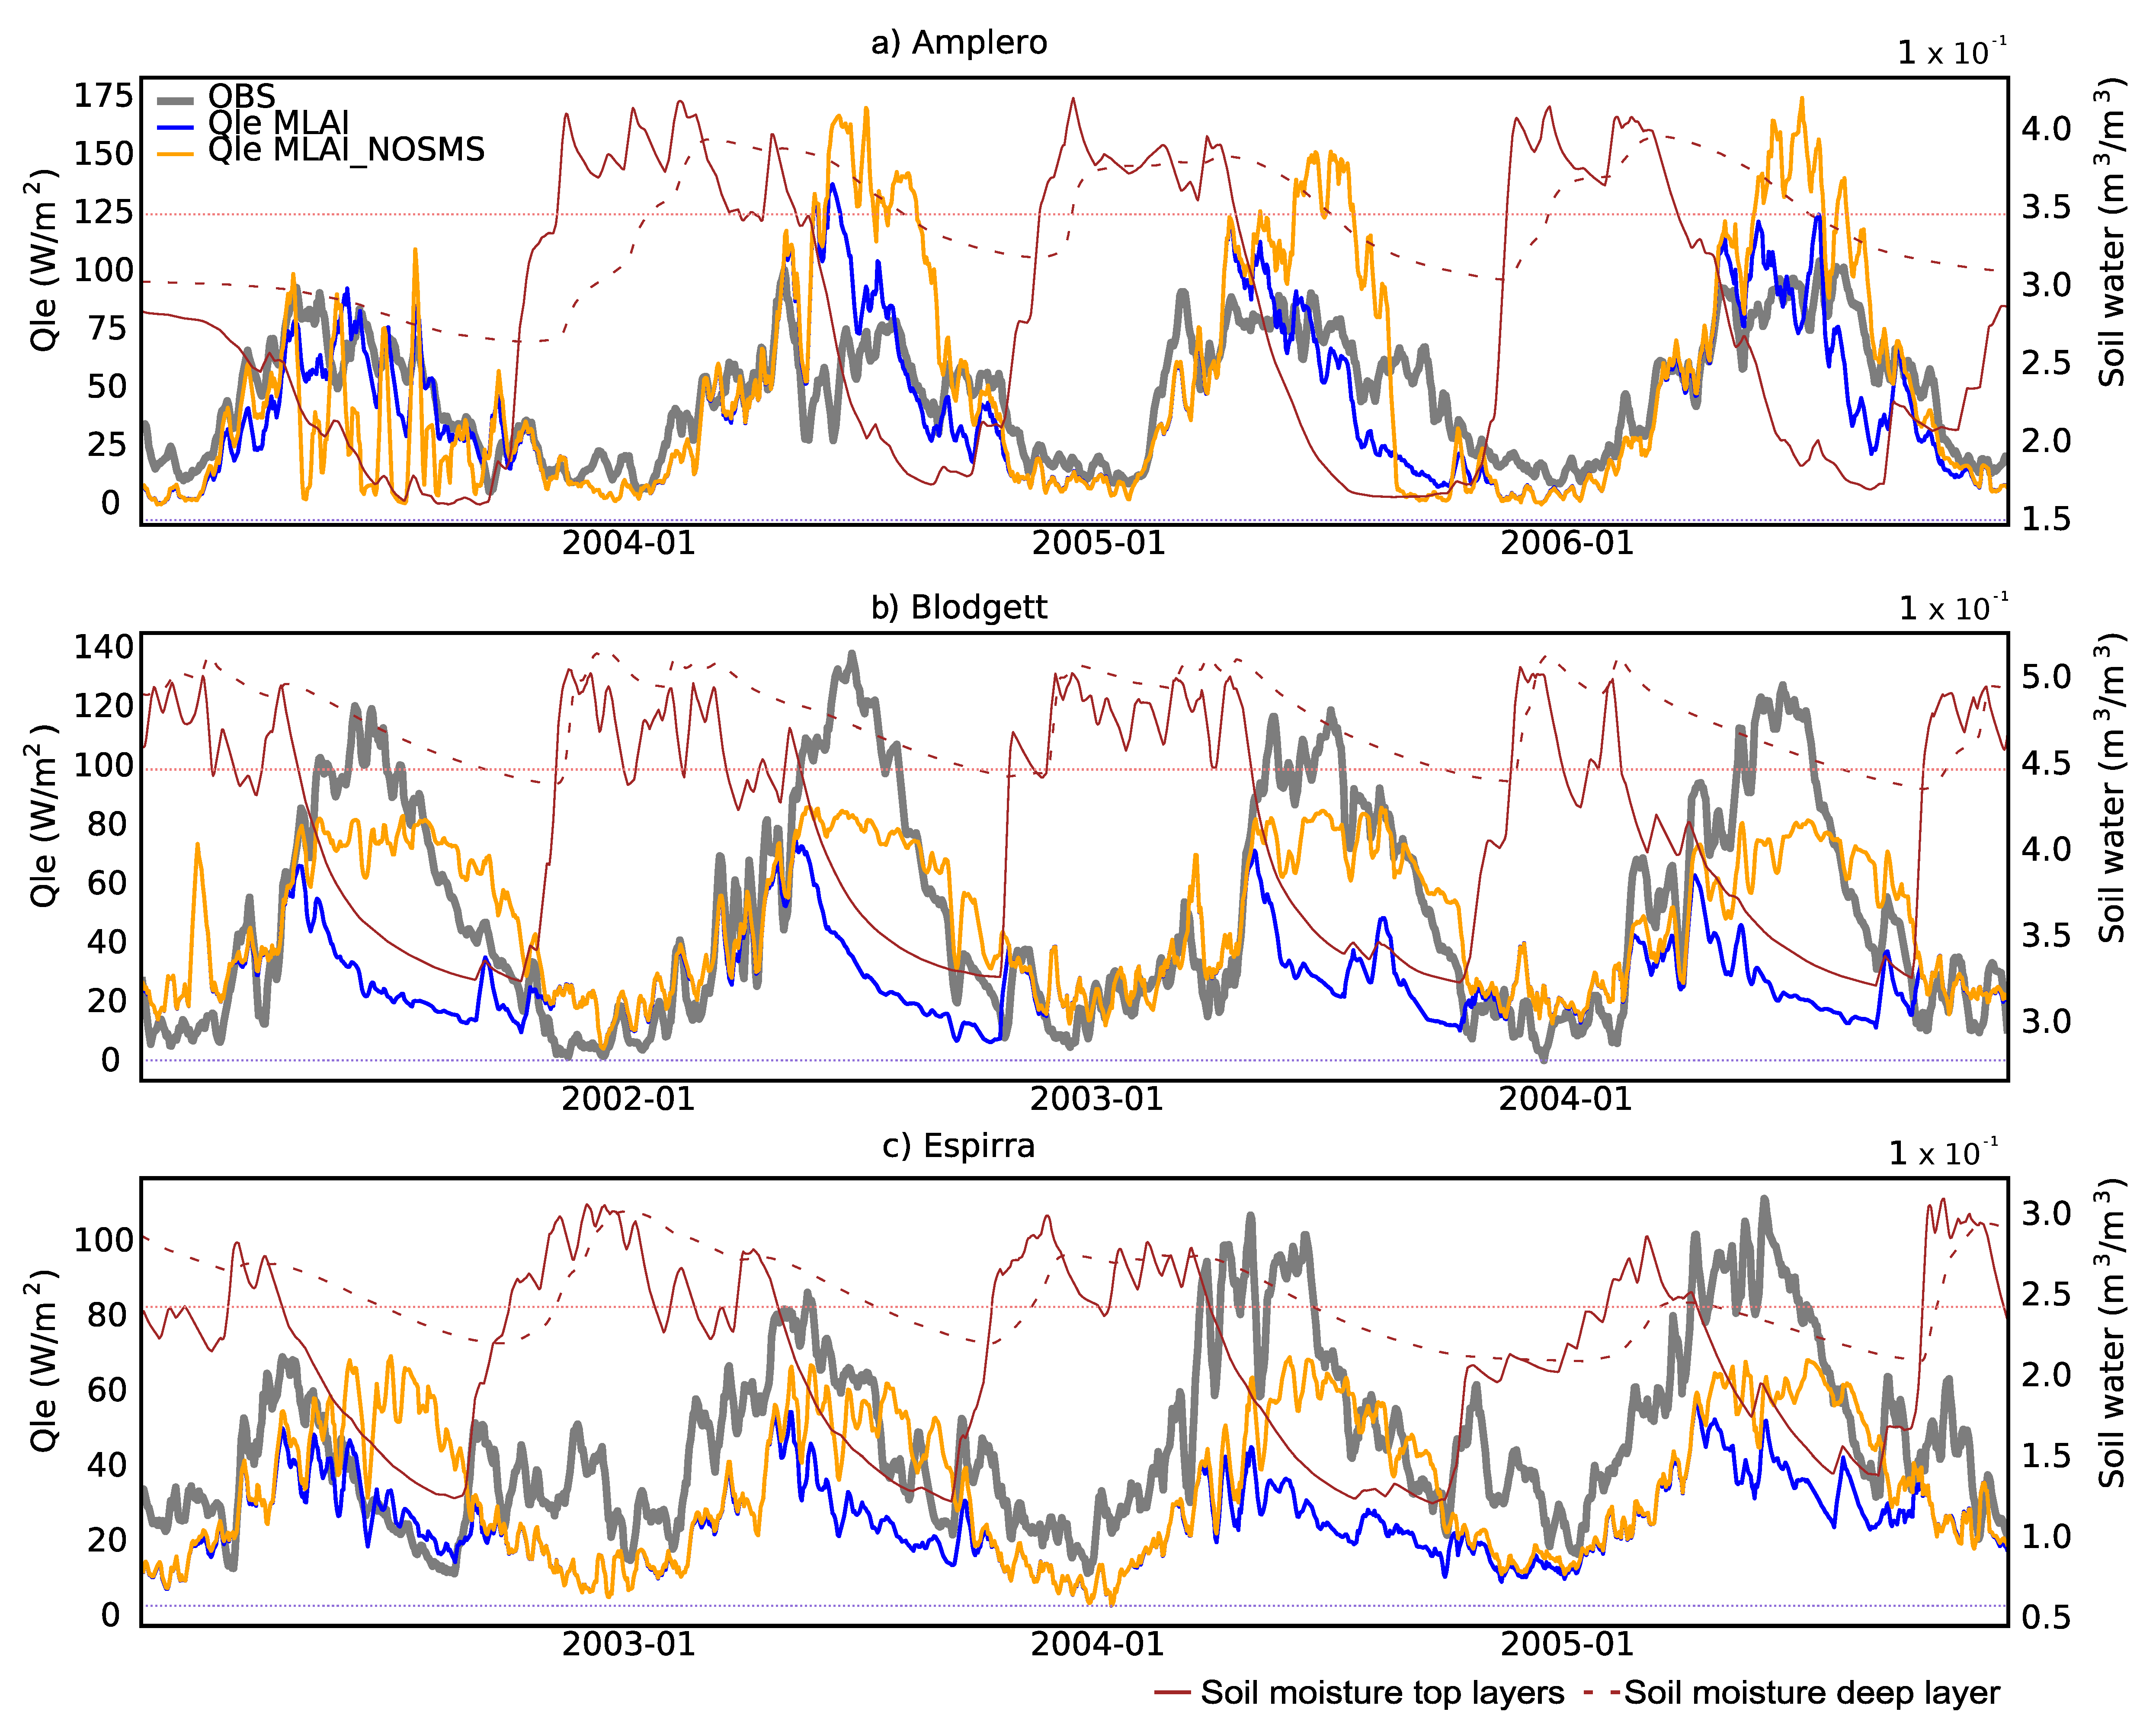
3.3. Soil Moisture Stress

Ukkola et al. [21] identified a systematic overestimation of evaporative droughts in several LSMs, including CHTESSEL, which is consistent with the results in this study mainly in Amplero, Blodget, Espirra, Howard, Mopane, Palang and Tumba. In this study, evaporative drought refers to the regular dry season evaporation reduction, as well as anomalous dry periods as defined by Ukkola et al. [21]. Figure 2 shows the time series of Qle and soil moisture for Amplero, Blodgett and Espirra (time series for all stations are provided in the Supplementary Material). In these three examples, it is possible to identify the early reduction of evaporation associated with the drop of soil moisture (Figure 2: compare Qle reduction in blue with top soil moisture reduction in red). At these stations, the evaporation starts to diverge from the observations when soil moisture in the top meter (where most of the roots are present in CTR; Table S1) falls below field capacity and approaches the wilting point. During this period, the deep layer soil moisture (dashed red line in Figure 2) is above or close to field capacity. This is further illustrated by comparing the MLAI Qle simulations with LAI_NOSMS in Figure 2 (blue vs. dashed-blue line). These idealized simulations, without soil moisture stress, differ from MLAI exactly during the dry-down period, being closer to the observed Qle. The LAI_NOSMS simulations present some unrealistic Qle variations (see for example 2003 in Amplero in Figure 2) associated with the drop of soil moisture below the wilting point that stops evaporation to avoid water conservation problems that could result in numerical instabilities. Despite this limitation, the LAI_NOSMS simulations suggest that the evaporative drought in CHTESSEL is tightly associated with the soil moisture stress formulation. The discrepancy between soil moisture conditions in the top meter versus the bottom layer during the dry-down and associated evaporative drought (Figure 2) motivated the exploratory revision of the root distribution.
The root distribution with the uniform formulation (Equation (5)) for the different maximum rooting depths (0.5, 1, 2 and 3 m) is presented in Table S1, allowing the comparison with the CTR root fraction for each layer and vegetation type. The main changes of the uniform rooting depth are a decrease of the roots fraction in the top layer(s) and an increase of root fraction in the deeper layers. This will give more weight to the deeper layers when computing the root zone soil moisture. The optimal maximum rooting depth for each station (see Section 2.4) in MLAI_ROOT is shown in Table 2.
Of the three short grass stations, Bugac and Fort Peck show an optimal R D M A X of 0.5 m with negligible differences for MLAI, while Amplero shows a R D M A X of 2 m with an increase of the Qle in late spring and summer. The increased Qle in Amplero in August/September 2005 (Figure 3) partially reduces the evaporative drought in MLAI, but results is an overestimation of the Qle in June/July. A closer investigation of the full time series of simulated fluxes and the high-resolution MODIS LAI (Figure S6) identifies an LAI drop during the 2005 summer, which cannot be represented when using a climatology. A similar behaviour is also seen in the 2004 summer. Despite the reduction of the evaporative drought in late summer in Amplero with the uniform root distribution, other factors influence the inter-annual and inter-seasonal variability of the Qle and Qh, which are not captured by CHTESSEL, as well as observational errors and scale mismatches. Inter-annual variability is also seen in Howard with a negligible impact of the uniform root distribution in 2005, but with a positive impact in 2002, 2003 and 2004 (see Figure 3 for 2004 and Figure S7 for the full time series). Mopane also displays evaporative drought events, but with very dry soil moisture conditions (see Figure S8), the impact of the uniform root distribution is negligible.
In the forest sites, all R D M A X are between 2 and 3 m, with the exception of Harvard with 1 m and Howland and Hyytiala with 0.5 m. These three forest sites, plus Loobos and University of Michigan, are among the best performing in CTR and MLAI. The impact of the uniform root distribution is small since all five sites have abundant precipitation and soil moisture conditions that are close to field capacity. Hesse station is the only case of a consistent deterioration of Qle with the uniform rooting depth and R D M A X of 2 m, mainly due to a considerable overestimation, contrasting with a reduction of the Qh bias. This mixed effect in the Qh and Qle justifies the use of several metrics and joint Qh and Qle in the model evaluation. Other processes and/or driving/observation limitations are likely responsible for the errors. The remaining four forest sites Blodget, Espirra, Palang and Tumba (see Figure 3) all display excessive evaporative drought associated with soil moisture dry-down. At these sites, the experimental formulation of uniform rooting depth with the optimal R D M A X partially reduces the excessive evaporative drought. The largest impact is seen in Palang and Blodgett, which are among the sites with the worst Qle and Qh correlations. From these sites shown in Figure 3, the uniform root distribution has the largest impact on Qle, while r s m i n and MLAI changes only show minor differences for CTR in Espirra.

4. Discussion

The systematic underestimation of the Qle and overestimation of the Qh for CTR (see Figure 1) is opposite the findings of Martens et al. (2020) [50], who compared ERA5 data against observations from 143 FLUXNET sites. Similar biases in CHTESSEL considering a subset of 51 FLUXNET stations were also found [51]. The differences of these studies compared to our results are likely associated with the different sampling of stations. It is also worth noting that the energy budget closure of eddy covariance sites can induce systematic errors [52,53]. Therefore, the interpretation of the systematic biases in the simulated Qle and Qh must be cautious. In this study, the use of several evaluation metrics that account for both mean biases and variability, with equal weights, partially mitigates the problems that could arise from systematic observation errors.
Despite the availability of long-term EO records of LAI, in this study, we considered only the high-resolution LAI climatology. This was driven by two reasons: (i) several stations encompass periods before the EO record were available (before 1999 in the case of CGLS or 2002 in the case of MODIS), and (ii) we considered that the first step was to evaluate the impact of the high-resolution station location conditions, neglecting inter-annual variability. However, our results suggest that the lack of inter-annual variability in the vegetation state might be responsible for some of the model problems. Amplero station is an example where we observed some relation between the time-varying high-resolution LAI (see Figure S6, bottom panel, dotted blue line) and the Qle inter-annual variability. There is robust evidence of the added value of assimilating LAI in land-surface models, enhancing their capabilities to monitor vegetation phenology and fluxes [54,55,56,57]. This is particularly relevant in models that have a prognostic evolution of vegetation phenology.
The soil moisture resistance, or water stress factor, in CHTESSEL has two components: (i) the derivation of the root zone soil moisture content (using an exponential root distribution) and (ii) a linear transformation between field capacity (unstressed vegetation) and the wilting point. In this study, we focused only on the derivation of the root zone soil moisture content, testing a new uniform root distribution and the associated maximum rooting depth. There are different approaches to relate root zone soil moisture and the water stress factor, such as curvilinear relationships or the use of soil matric potential [58,59]. Such approaches, combined with the rooting depth distribution, are likely to further enhance the model capability to represent root water uptake. Moreover, Liu et al. [12] reported that a dynamical rooting depth evolution improved the performance of the Noah-MP-Crop model under drought-like situations. Additionally, vapour pressure deficit and stem xylem conductance are also known to influence stomatal regulation [60,61], but were not considered in this study. The presence of a shallow water table could also influence latent heat flux during drought periods [62]. The water table is not represented in CHTESSEL, and we are not aware of such effects at the 17 sites considered.
Finally, the metrics distribution for MLAI_ROOT (in Figure 1) showed more potential to reduce the Qle and Qh bias and NME and increase the correlation than the calibration of r s m i n alone. This is achieved by partially addressing the excessive evaporative drought at Blodget, Espirra, Palang and Tumba stations. A joint optimization of both r s m i n and maximum rooting depth is likely to further improve the model simulations. However, it was not the aim of this study to optimize/calibrate CHTESSEL for these stations, but to investigate in the current model formulation which aspects require further attention. The use of the subset of FLUXNET stations to evaluate land surface models’ performance is a common practice [20,21,31,63,64].

5. Conclusions

This study focused on the impact of the representation of canopy resistance on the simulations of latent and sensible heat fluxes by the CHTESSEL model. Observed data from 17 FLUXNET towers were used to carry out offline simulations with a particular emphasis on the representation of evaporation and its relationship with water stress conditions. Three constraints of canopy resistance were evaluated: (i) the role of vegetation characteristics via the use of high spatial resolution LAI representing local station conditions; (ii) the impact of the minimum canopy resistance; and (iii) the impact of a uniform root distribution on soil moisture stress. The replacement of the current LAI climatology used by CHTESSEL, based on an older MODIS climatology with a coarse resolution, by a new high-resolution climatology representative of the stations locations did not significantly affect the simulated surface fluxes. The close relationship between LAI and the minimum canopy resistance was investigated showing some potential to improve the latent heat flux variability via an adjustment of this parameter. However, these changes did not impact the excessive evaporative drought at several stations, as reported by Ukkola et al. [21]. In CHTESSEL, we found that this limitation was tightly associated with the depletion of the top meter soil moisture, while water was still available at deeper layers. However, the current model formulation for root distribution was not capable of reaching this deeper reservoir, resulting in an early reduction of evaporation, when compared with the observations. The replacement of the current exponential roots’ profile by a uniform root distribution and associated maximum rooting depth reduced the underestimation of evaporation during water stress conditions. Despite the limitations associated with a reduced number of stations, our results highlight the importance of root distribution in controlling soil moisture resistance in water stress conditions. However, root distributions are weakly constrained observationally on the global scale. Therefore, research is necessary to understand the implications of these changes on the global water and energy budgets, as well as in the coupling with the atmosphere. The proposed uniform root distribution with a single associated parameter, the maximum rooting depth, is also appealing for a parameter optimization. These could be further addressed along with the revision of land cover and vegetation recently proposed for CHTESSEL [65], which identified the necessity to calibrate vegetation related parameters [51]. Considering the coupled nature of the surface water and energy cycles and the relevance of land-atmosphere coupling, a calibration methodology considering multiple observational datasets, covering different water/energy components and temporal time-scales, should be favoured [66], also to possibly include some indirect information of poorly constrained parameters through variables coupled with them.

Supplementary Materials

The following are available online at https://www.mdpi.com/2073-4433/11/12/1362/s1, Table S1: CHTESSEL vegetation types and associated parameters. R 1 to R 4 denote the root fraction in Layers 1 to 4. The final 4 lines indicate the root fraction when considering a uniform rooting depth with a maximum rooting depth R D M A X of 0.5, 1, 2 and 2.89 m. Figure S1: Time series of Sensible heat flux, latent heat flux, soil moisture and LAI in Palang. The turbulent fluxes’ time series compare the observations (grey) with the simulations: CTR (black), LAI (blue), LAI_RSMIN (red), LAI_ROOT (green) and LAI_NOSMS (dashed blue). The soil moisture time series shows the CTR the top 3 layers’ meter soil moisture (top meter, solid back) and the bottom layer soil moisture (dashed black), as well as the soil moisture at the wilting point (blue) and field capacity (red). The LAI time series compares CTR (black) with the high-resolution MODIS LAI time series (dotted blue), the high-resolution MODIS climatology (blue), the climatology of MODIS considering the 0.25 ° bounding box (dashed blue) and the CGLS LAI climatology (grey). Figure S2: Latent heat flux SD at the 17 stations for each simulation: CTR, MLAI, MLAI_RSMIN and MLAI_ROOT. Figure S3: Same as Figure S1, but for Sylvania station. Figure S4: Same as Figure S1, but for Espirra station. Figure S5: Same as Figure S1, but for Kruger station. Figure S6: Same as Figure S1, but for Amplero station. Figure S7: Same as Figure S1, but for Howard station. Figure S8: Same as Figure S1, but for Mopane station. Figure S9: Same as Figure S1, but for Blodgett station. Figure S10: Same as Figure S1, but for Bugac station. Figure s11: Same as Figure S1, but for Fort Peck station. Figure S12: Same as Figure S1, but for Harvard station. Figure S13: Same as Figure S1, but for Hesse station. Figure S14: Same as Figure S1, but for Howlandm station. Figure S15: Same as Figure S1, but for Hyytiala station. Figure S16: Same as Figure S1, but for Loobos station. Figure S17: Same as Figure S1, but for Tumbarumba station. Figure S18: Same as Figure S1, but for University of Michigan station. Figure S19: Sensible heat flux MBE at the 17 stations for each simulation: CTR, MLAI, MLAI_RSMIN and MLAI_ROOT. Figure S20: Latent heat flux MBE at the 17 stations for each simulation: CTR, MLAI, MLAI_RSMIN and MLAI_ROOT. Figure S21: Sensible heat flux NME at the 17 stations for each simulation: CTR, MLAI, MLAI_RSMIN and MLAI_ROOT. Figure S22: Latent heat flux NME at the 17 stations for each simulation: CTR, MLAI, MLAI_RSMIN and MLAI_ROOT. Figure S23: Sensible heat flux SD at the 17 stations for each simulation: CTR, MLAI, MLAI_RSMIN and MLAI_ROOT. Figure S24: Sensible heat flux correlation at the 17 stations for each simulation: CTR, MLAI, MLAI_RSMIN and MLAI_ROOT. Figure S25: Latent heat flux correlation at the 17 stations for each simulation: CTR, MLAI, MLAI_RSMIN and MLAI_ROOT.

Author Contributions

Conceptualization, D.S., E.D. and P.M.A.M.; formal analysis, D.S.; funding acquisition, E.D.; writing, original draft preparation, all authors; writing, review and editing, all authors. All authors read and agreed to the published version of the manuscript.

Funding

This research was funded by Fundação para a Ciência e a Tecnologia (FCT) Grant Number PTDC/CTA-MET/28946/2017 (CONTROL). David Stevens was funded by the FCT Grant PD/BD/135250/2017. The authors would like to acknowledge the financial support of the FCT through project UIDB/50019/2020—IDL. René Orth acknowledges the funding from the German Research Foundation (Emmy Noether Grant 391059971).

Acknowledgments

This work used eddy covariance data acquired by the FLUXNET community for the La Thuile FLUXNET release, supported by the following networks: AmeriFlux (US Department of Energy, Biological and Environmental Research, Terrestrial Carbon Program (DE-FG02-04ER63917 and DE-FG02-04ER63911)), AfriFlux, AsiaFlux, CarboAfrica, CarboEuropeIP, CarboItaly, CarboMont, ChinaFlux, Fluxnet-Canada (supported by CFCAS, NSERC, BIOCAP, Environment Canada, and NRCan), GreenGrass, KoFlux, LBA, NECC, OzFlux, TCOS-Siberia, USCCC. We acknowledge the financial support to the eddy covariance data harmonisation provided by CarboEuropeIP, FAO-GTOS-TCO, iLEAPS, Max Planck Institute for Biogeochemistry, National Science Foundation, University of Tuscia, Université Laval and Environment Canada and US Department of Energy and the database development and technical support from Berkeley Water Center, Lawrence Berkeley National Laboratory, Microsoft Research eScience, Oak Ridge National Laboratory, University of California—Berkeley, University of Virginia.

Conflicts of Interest

The authors declare no conflict of interest. The funders had no role in the design of the study; in the collection, analyses or interpretation of data; in the writing of the manuscript; nor in the decision to publish the results.

Appendix A

The statistical metrics used in this study follow [20]: the mean bias error (MBE), normalized mean error (NME), standard deviation difference (SD) and correlation coefficient (r) were computed using daily values with M, O and n representing the model data, observed flux tower data and the number of days, respectively.
M B E = i = 1 n ( M i O i ) n
N M E = | M i O i | | O ¯ O i |
S D = | 1 M i M 2 ¯ n 1 O i O 2 ¯ n 1 |
r = i = 1 n ( M i M ¯ ) ( O i O ¯ ) i = 1 n ( M i M ¯ ) 2 i = 1 n ( O i O ¯ ) 2

References

  1. Carvalhais, N.; Forkel, M.; Khomik, M.; Bellarby, J.; Jung, M.; Migliavacca, M.; Mu, M.; Saatchi, S.; Santoro, M.; Thurner, M.; et al. Global covariation of carbon turnover times with climate in terrestrial ecosystems. Nature 2014, 514, 213–217. [Google Scholar] [CrossRef] [PubMed] [Green Version]
  2. Orth, R.; Seneviratne, S.I. Analysis of soil moisture memory from observations in Europe. J. Geophys. Res. Atmos. 2012, 117, 1–19. [Google Scholar] [CrossRef]
  3. Koster, R.D.; Mahanama, S.P.; Yamada, T.J.; Balsamo, G.; Berg, A.A.; Boisserie, M.; Dirmeyer, P.A.; Doblas-Reyes, F.J.; Drewitt, G.; Gordon, C.T.; et al. Contribution of land surface initialization to subseasonal forecast skill: First results from a multi-model experiment. Geophys. Res. Lett. 2010, 37, 1–6. [Google Scholar] [CrossRef] [Green Version]
  4. Koster, R.D.; Mahanama, S.P.; Yamada, T.J.; Balsamo, G.; Berg, A.A.; Boisserie, M.; Dirmeyer, P.A.; Doblas-Reyes, F.J.; Drewitt, G.; Gordon, C.T.; et al. The second phase of the global land-atmosphere coupling experiment: Soil moisture contributions to subseasonal forecast skill. J. Hydrometeorol. 2011, 12, 805–822. [Google Scholar] [CrossRef]
  5. Koster, R.D.; Walker, G.K. Interactive vegetation phenology, soil moisture, and monthly temperature forecasts. J. Hydrometeorol. 2015, 16, 1456–1465. [Google Scholar] [CrossRef]
  6. Seneviratne, S.I.; Corti, T.; Davin, E.L.; Hirschi, M.; Jaeger, E.B.; Lehner, I.; Orlowsky, B.; Teuling, A.J. Investigating soil moisture-climate interactions in a changing climate: A review. Earth-Sci. Rev. 2010, 99, 125–161. [Google Scholar] [CrossRef]
  7. Woodward, F.I. Vegetation-climate feedbacks in a greenhouse world. Philos. Trans. R. Soc. B Biol. Sci. 1998, 353, 29–39. [Google Scholar] [CrossRef]
  8. Denissen, J.M.; Teuling, A.J.; Reichstein, M.; Orth, R. Critical Soil Moisture Derived From Satellite Observations Over Europe. J. Geophys. Res. Atmos. 2020, 125, e2019JD031672. [Google Scholar] [CrossRef] [Green Version]
  9. Coenders-Gerrits, A.M.; Van Der Ent, R.J.; Bogaard, T.A.; Wang-Erlandsson, L.; Hrachowitz, M.; Savenije, H.H. Uncertainties in transpiration estimates. Nature 2014, 506, E1–E2. [Google Scholar] [CrossRef]
  10. Lawrence, D.M.; Thornton, P.E.; Oleson, K.W.; Bonan, G.B. The partitioning of evapotranspiration into transpiration, soil evaporation, and canopy evaporation in a GCM: Impacts on land-atmosphere interaction. J. Hydrometeorol. 2007, 8, 862–880. [Google Scholar] [CrossRef]
  11. Schlesinger, W.H.; Jasechko, S. Transpiration in the global water cycle. Agric. For. Meteorol. 2014, 189–190, 115–117. [Google Scholar] [CrossRef]
  12. Liu, X.; Chen, F.; Barlage, M.; Niyogi, D. Implementing Dynamic Rooting Depth for Improved Simulation of Soil Moisture and Land Surface Feedbacks in Noah-MP-Crop. J. Adv. Model. Earth Syst. 2020, 12, 1–15. [Google Scholar] [CrossRef] [Green Version]
  13. Gentine, P.; Holtslag, A.A.; D’Andrea, F.; Ek, M. Surface and atmospheric controls on the onset of moist convection over land. J. Hydrometeorol. 2013, 14, 1443–1462. [Google Scholar] [CrossRef]
  14. Teuling, A.J.; Van Loon, A.F.; Seneviratne, S.I.; Lehner, I.; Aubinet, M.; Heinesch, B.; Bernhofer, C.; Grünwald, T.; Prasse, H.; Spank, U. Evapotranspiration amplifies European summer drought. Geophys. Res. Lett. 2013, 40, 2071–2075. [Google Scholar] [CrossRef]
  15. Vogel, M.M.; Orth, R.; Cheruy, F.; Hagemann, S.; Lorenz, R.; van den Hurk, B.J.; Seneviratne, S.I. Regional amplification of projected changes in extreme temperatures strongly controlled by soil moisture-temperature feedbacks. Geophys. Res. Lett. 2017, 44, 1511–1519. [Google Scholar] [CrossRef]
  16. Damour, G.; Simonneau, T.; Cochard, H.; Urban, L. An overview of models of stomatal conductance at the leaf level. Plant Cell Environ. 2010, 33, 1419–1438. [Google Scholar] [CrossRef] [PubMed]
  17. Sprintsin, M.; Chen, J.M.; Desai, A.; Gough, C.M. Evaluation of leaf-to-canopy upscaling methodologies against carbon flux data in North America. J. Geophys. Res. Biogeosci. 2012, 117, 1–17. [Google Scholar] [CrossRef] [Green Version]
  18. Balsamo, G.; Viterbo, P.; Beijaars, A.; van den Hurk, B.; Hirschi, M.; Betts, A.K.; Scipal, K. A revised hydrology for the ECMWF model: Verification from field site to terrestrial water storage and impact in the integrated forecast system. J. Hydrometeorol. 2009, 10, 623–643. [Google Scholar] [CrossRef]
  19. Boussetta, S.; Balsamo, G.; Beljaars, A.; Kral, T.; Jarlan, L. Impact of a satellite-derived leaf area index monthly climatology in a global numerical weather prediction model. Int. J. Remote Sens. 2013, 34, 3520–3542. [Google Scholar] [CrossRef]
  20. Best, M.J.; Abramowitz, G.; Johnson, H.R.; Pitman, A.J.; Balsamo, G.; Boone, A.; Cuntz, M.; Decharme, B.; Dirmeyer, P.A.; Dong, J.; et al. The plumbing of land surface models: Benchmarking model performance. J. Hydrometeorol. 2015, 16, 1425–1442. [Google Scholar] [CrossRef] [Green Version]
  21. Ukkola, A.M.; De Kauwe, M.G.; Pitman, A.J.; Best, M.J.; Abramowitz, G.; Haverd, V.; Decker, M.; Haughton, N. Land surface models systematically overestimate the intensity, duration and magnitude of seasonal-scale evaporative droughts. Environ. Res. Lett. 2016, 11. [Google Scholar] [CrossRef]
  22. Sungmin, O.; Dutra, E.; Orth, R. Robustness of process-based versus data-driven modeling in changing climatic conditions. J. Hydrometeorol. 2020, 21, 1929–1944. [Google Scholar] [CrossRef]
  23. Jarvis, P.G. The interpretation of the variations in leaf water potential and stomatal conductance found in canopies in the field. Philos. Trans. R. Soc. Lond. B Biol. Sci. 1976, 273, 593–610. [Google Scholar] [CrossRef]
  24. Jacobs, C.M.; Van Den Hurk, B.J.; De Bruin, H.A. Stomatal behaviour and photosynthetic rate of unstressed grapevines in semi-arid conditions. Agric. For. Meteorol. 1996, 80, 111–134. [Google Scholar] [CrossRef]
  25. Boussetta, S.; Balsamo, G.; Beljaars, A.; Panareda, A.A.; Calvet, J.C.; Jacobs, C.; Van Den Hurk, B.; Viterbo, P.; Lafont, S.; Dutra, E.; et al. Natural land carbon dioxide exchanges in the ECMWF integrated forecasting system: Implementation and offline validation. J. Geophys. Res. Atmos. 2013, 118, 5923–5946. [Google Scholar] [CrossRef]
  26. Balsamo, G.; Agusti-Panareda, A.; Albergel, C.; Arduini, G.; Beljaars, A.; Bidlot, J.; Bousserez, N.; Boussetta, S.; Brown, A.; Buizza, R.; et al. Satellite and in situ observations for advancing global earth surface modelling: A review. Remote Sens. 2018, 10, 2038. [Google Scholar] [CrossRef] [Green Version]
  27. Zeng, X.; Dai, Y.J.; Dickinson, R.E.; Shaikh, M. The role of root distribution for climate simulation over land. Geophys. Res. Lett. 1998, 25, 4533–4536. [Google Scholar] [CrossRef]
  28. Desborough, C.E. The impact of root weighting on the response of transpiration to moisture stress in land surface schemes. Mon. Weather Rev. 1997, 125, 1920–1930. [Google Scholar] [CrossRef]
  29. Cescatti, A.; Marcolla, B.; Santhana Vannan, S.K.; Pan, J.Y.; Román, M.O.; Yang, X.; Ciais, P.; Cook, R.B.; Law, B.E.; Matteucci, G.; et al. Intercomparison of MODIS albedo retrievals and in situ measurements across the global FLUXNET network. Remote Sens. Environ. 2012, 121, 323–334. [Google Scholar] [CrossRef] [Green Version]
  30. Haughton, N.; Abramowitz, G.; Pitman, A.J.; Or, D.; Best, M.J.; Johnson, H.R.; Balsamo, G.; Boone, A.; Cuntz, M.; Decharme, B.; et al. The plumbing of land surface models: Is poor performance a result of methodology or data quality? J. Hydrometeorol. 2016, 17, 1705–1723. [Google Scholar] [CrossRef]
  31. Haverd, V.; Cuntz, M.; Nieradzik, L.P.; Harman, I.N. Improved representations of coupled soil-canopy processes in the CABLE land surface model (Subversion revision 3432). Geosci. Model Dev. 2016, 9, 3111–3122. [Google Scholar] [CrossRef] [Green Version]
  32. Fang, H.; Wei, S.; Jiang, C.; Scipal, K. Theoretical uncertainty analysis of global MODIS, CYCLOPES, and GLOBCARBON LAI products using a triple collocation method. Remote Sens. Environ. 2012, 124, 610–621. [Google Scholar] [CrossRef]
  33. Sea, W.B.; Choler, P.; Beringer, J.; Weinmann, R.A.; Hutley, L.B.; Leuning, R. Documenting improvement in leaf area index estimates from MODIS using hemispherical photos for Australian savannas. Agric. For. Meteorol. 2011, 151, 1453–1461. [Google Scholar] [CrossRef]
  34. Verger, A.; Baret, F.; Weiss, M. Near real-time vegetation monitoring at global scale. IEEE J. Sel. Top. Appl. Earth Obs. Remote Sens. 2014, 7, 3473–3481. [Google Scholar] [CrossRef]
  35. Brown, L.A.; Meier, C.; Morris, H.; Pastor-Guzman, J.; Bai, G.; Lerebourg, C.; Gobron, N.; Lanconelli, C.; Clerici, M.; Dash, J. Evaluation of global leaf area index and fraction of absorbed photosynthetically active radiation products over North America using Copernicus Ground Based Observations for Validation data. Remote Sens. Environ. 2020, 247, 111935. [Google Scholar] [CrossRef]
  36. Schaaf, C.B.; Gao, F.; Strahler, A.H.; Lucht, W.; Li, X.; Tsang, T.; Strugnell, N.C.; Zhang, X.; Jin, Y.; Muller, J.P.; et al. First operational BRDF, albedo nadir reflectance products from MODIS. Remote Sens. Environ. 2002, 83, 135–148. [Google Scholar] [CrossRef] [Green Version]
  37. Wang, Z.; Schaaf, C.B.; Strahler, A.H.; Chopping, M.J.; Román, M.O.; Shuai, Y.; Woodcock, C.E.; Hollinger, D.Y.; Fitzjarrald, D.R. Evaluation of MODIS albedo product (MCD43A) over grassland, agriculture and forest surface types during dormant and snow-covered periods. Remote Sens. Environ. 2014, 140, 60–77. [Google Scholar] [CrossRef] [Green Version]
  38. Sun, Q.; Wang, Z.; Li, Z.; Erb, A.; Schaaf, C.B. Evaluation of the global MODIS 30 arc-second spatially and temporally complete snow-free land surface albedo and reflectance anisotropy dataset. Int. J. Appl. Earth Obs. Geoinf. 2017, 58, 36–49. [Google Scholar] [CrossRef]
  39. Mahfouf, J.F. The Land Surface Scheme ISBA within the Meteo-France Climate Model ARPEGE. Part 1: Implementation and Preliminary Results. J. Clim. 1995, 8, 2039–2057. [Google Scholar] [CrossRef]
  40. Manzi, A.O.; Planton, S. Implementation of the ISBA parametrization scheme for land surface processes in a GCM - an annual cycle experiment. J. Hydrol. 1994, 155, 353–387. [Google Scholar] [CrossRef]
  41. Giard, D.; Bazile, E. Implementation of a new assimilation scheme for soil and surface variables in a global NWP model. Mon. Weather Rev. 2000, 128, 997–1015. [Google Scholar] [CrossRef]
  42. Dorman, J.L.; Sellers, P.J. A Global CLimatology of Albedo, Roughness Length and Stomatal Resistance for Atmospheric General Circulation Models as Represented by the Simple Biosphere Model (SiB). J. Appl. Meteorol. 1989, 28, 833–855. [Google Scholar] [CrossRef] [Green Version]
  43. Bonan, G.B. Comparison of two land surface process models using prescribed forcings. J. Geophys. Res. 1994, 99, 25803–25818. [Google Scholar] [CrossRef]
  44. Pitman, A. Description of the bare essentials of Surface transfer. Annu. Rev. Mater. Res. 1991, 32, 77–111. [Google Scholar]
  45. European Center for Medium range Weather Forecasts. IFS documentation CY46R1—Part IV: Physical Processes. 2019. Available online: https://www.ecmwf.int/en/elibrary/19308-part-iv-physical-processes (accessed on 15 December 2020).
  46. Cabelguenne, M.; Debaeke, P. Experimental determination and modelling of the soil water extraction capacities of crops of maize, sunflower, soya bean, sorghum and wheat. Plant Soil 1998, 202, 175–192. [Google Scholar] [CrossRef]
  47. Guswa, A.J. The influence of climate on root depth: A carbon cost-benefit analysis. Water Resour. Res. 2008, 44, 1–11. [Google Scholar] [CrossRef] [Green Version]
  48. Nielsen, D.C.; Vigil, M.F. Soil water extraction for several dryland crops. Agron. J. 2018, 110, 2447–2455. [Google Scholar] [CrossRef] [Green Version]
  49. Rodrigues, A.; Pita, G.; Mateus, J.; Kurz-Besson, C.; Casquilho, M.; Cerasoli, S.; Gomes, A.; Pereira, J. Eight years of continuous carbon fluxes measurements in a Portuguese eucalypt stand under two main events: Drought and felling. Agric. For. Meteorol. 2011, 151, 493–507. [Google Scholar] [CrossRef]
  50. Martens, B.; Schumacher, D.L.; Wouters, H.; Muñoz-Sabater, J.; Verhoest, N.E.; Miralles, D.G. Evaluating the land-surface energy partitioning in ERA5. Geosci. Model Dev. 2020, 13, 4159–4181. [Google Scholar] [CrossRef]
  51. Nogueira, M.; Boussetta, S.; Balsamo, G.; Albergel, C.; Trigo, I.F.; Johannsen, F.; Miralles, D.; Dutra, E. Upgrading land-cover and vegetation seasonality in the ECMWF coupled system: Verification with FLUXNET sites, METEOSAT satellite land surface temperatures and ERA5 atmospheric reanalysis. J. Geophys. Res. Atmos. 2020. in review. [Google Scholar]
  52. Ershadi, A.; McCabe, M.F.; Evans, J.P.; Chaney, N.W.; Wood, E.F. Multi-site evaluation of terrestrial evaporation models using FLUXNET data. Agric. For. Meteorol. 2014, 187, 46–61. [Google Scholar] [CrossRef]
  53. Wilson, K.; Goldstein, A.; Falge, E.; Aubinet, M.; Baldocchi, D.; Berbigier, P.; Bernhofer, C.; Dolman, H.; Field, C.; Grelle, A.; et al. Energy balance closure at FLUXNET sites. Agric. For. Meteorol. 2002, 113, 223–243. [Google Scholar] [CrossRef] [Green Version]
  54. Albergel, C.; Dutra, E.; Bonan, B.; Zheng, Y.; Munier, S.; Balsamo, G.; de Rosnay, P.; Muñoz-Sabater, J.; Calvet, J.C. Monitoring and forecasting the impact of the 2018 summer heatwave on vegetation. Remote Sens. 2019, 11, 520. [Google Scholar] [CrossRef] [Green Version]
  55. Albergel, C.; Zheng, Y.; Bonan, B.; Dutra, E.; Rodríguez-Fernández, N.; Munier, S.; Draper, C.; De Rosnay, P.; Muñoz-Sabater, J.; Balsamo, G.; et al. Data assimilation for continuous global assessment of severe conditions over terrestrial surfaces. Hydrol. Earth Syst. Sci. 2020, 24, 4291–4316. [Google Scholar] [CrossRef]
  56. Boussetta, S.; Balsamo, G.; Dutra, E.; Beljaars, A.; Albergel, C. Assimilation of surface albedo and vegetation states from satellite observations and their impact on numerical weather prediction. Remote Sens. Environ. 2015, 163, 111–126. [Google Scholar] [CrossRef] [Green Version]
  57. Stöckli, R.; Rutishauser, T.; Dragoni, D.; O’Keefe, J.; Thornton, P.E.; Jolly, M.; Lu, L.; Denning, A.S. Remote sensing data assimilation for a prognostic phenology model. J. Geophys. Res. Biogeosci. 2008, 113, 1–19. [Google Scholar] [CrossRef]
  58. Egea, G.; Verhoef, A.; Vidale, P.L. Towards an improved and more flexible representation of water stress in coupled photosynthesis-stomatal conductance models. Agric. For. Meteorol. 2011, 151, 1370–1384. [Google Scholar] [CrossRef]
  59. Verhoef, A.; Egea, G. Modeling plant transpiration under limited soil water: Comparison of different plant and soil hydraulic parameterizations and preliminary implications for their use in land surface models. Agric. For. Meteorol. 2014, 191, 22–32. [Google Scholar] [CrossRef] [Green Version]
  60. Konings, A.G.; Williams, A.P.; Gentine, P. Sensitivity of grassland productivity to aridity controlled by stomatal and xylem regulation. Nat. Geosci. 2017, 10, 284–288. [Google Scholar] [CrossRef]
  61. Massmann, A.; Gentine, P.; Lin, C. When Does Vapor Pressure Deficit Drive or Reduce Evapotranspiration? J. Adv. Model. Earth Syst. 2019, 11, 3305–3320. [Google Scholar] [CrossRef] [Green Version]
  62. Pinto, C.A.; Nadezhdina, N.; David, J.S.; Kurz-Besson, C.; Caldeira, M.C.; Henriques, M.O.; Monteiro, F.G.; Pereira, J.S.; David, T.S. Transpiration in Quercus suber trees under shallow water table conditions: The role of soil and groundwater. Hydrol. Process. 2014, 28, 6067–6079. [Google Scholar] [CrossRef]
  63. Leonardini, G.; Anctil, F.; Abrahamowicz, M.; Gaborit, É.; Vionnet, V.; Nadeau, D.F.; Fortin, V. Evaluation of the Soil, Vegetation, and Snow (SVS) Land Surface Model for the Simulation of Surface Energy Fluxes and Soil Moisture under Snow-Free Conditions. Atmosphere 2020, 11, 278. [Google Scholar] [CrossRef] [Green Version]
  64. Stöckli, R.; Lawrence, D.M.; Niu, G.Y.; Oleson, K.W.; Thornton, P.E.; Yang, Z.L.; Bonan, G.B.; Denning, A.S.; Running, S.W. Use of FLUXNET in the Community Land Model development. J. Geophys. Res. Biogeosci. 2008, 113. [Google Scholar] [CrossRef] [Green Version]
  65. Nogueira, M.; Albergel, C.; Boussetta, S.; Johannsen, F.; Trigo, I.F.; Ermida, S.L.; Martins, J.P.A.; Dutra, E. Role of vegetation in representing land surface temperature in the CHTESSEL (CY45R1) and SURFEX-ISBA (v8.1) land surface models: A case study over Iberia. Geosci. Model Dev. 2020, 13. [Google Scholar] [CrossRef]
  66. Orth, R.; Dutra, E.; Trigo, I.F.; Balsamo, G. Advancing land surface model development with satellite-based Earth observations. Hydrol. Earth Syst. Sci. 2017, 21, 2483–2495. [Google Scholar] [CrossRef] [Green Version]
Figure 1. Latent (ad, top panels) and sensible (eh, bottom panels) heat flux evaluation in terms of mean bias error (MBE), SD, normalized mean error (NME) and r for CTR, LAI, LAI_RSMIN and LAI_ROOT. The boxplots represent each metric’s distribution for the 17 towers showing the percentiles of 25, 50 and 75. Symbols denote outliers for values greater than 1.5 times the interquartile range from the nearest 25th or 75th percentile.
Atmosphere 11 01362 g001
Figure 2. Latent heat flux (Qle) and soil moisture in Amplero (a), Blodgett (b) and Espirra (c). For the Qle (left axis), the observations are in grey and the simulations from MLAI in blue and from MLAI_NOSM in orange. The soil moisture (right axis) for MLAI simulation is shown for the top 3 layers (red solid) and deep layers (red dashed). The light dotted red and blue lines represent soil moisture at field capacity and the wilting point, respectively.
Atmosphere 11 01362 g002
Figure 3. Simulated and observed latent heat flux during one example year with a 14 day running mean smoothing. Observations are in grey, CTR in black, MLAI in blue, MLAI_ROOT in green and MLAI_RSMIN in red.
Atmosphere 11 01362 g003
Table 1. FLUXNET tower flux stations used in this study.
StationCountryLatitudeLongitudePlant Functional TypeTime Period
AmpleroItaly41.904113.6052Grassland2003–2006
BlodgettU.S.38.8953−120.633Evergreen needleleaf2000–2006
BugacHungary46.691719.6017Grassland2002–2006
EspirraPortugal38.6394−8.6018Evergreen broadleaf2001–2006
Fort PeckU.S.48.3077−105.102Grassland2000–2006
HarvardU.S.42.5378−72.1715Deciduous broadleaf1994–2001
HesseFrance48.67427.0656Deciduous broadleaf1999–2006
HowardAustralia−12.4943131.152Woody savannah2002–2005
HowlandmU.S.45.2041−68.7402Evergreen needleleaf1996–2004
HyytialaFinland61.847424.2948Evergreen needleleaf2001–2004
KrugerSouth Africa−25.019731.4969Savannah2002–2003
LoobosThe Netherlands52.16795.744Evergreen needleleaf1997–2006
MopaneBotswana−19.916523.5603Woody savannah1999–2001
PalangIndonesia−2.345114.036Evergreen broadleaf2002–2003
SylvaniaU.S.46.242−89.3477Mixed forest2002–2005
TumbarumbaAustralia−35.6557148.152Evergreen broadleaf2002–2005
University of MichiganU.S.45.5598−84.7138Deciduous broadleaf1999–2003
Table 2. Control (CTR) r s m i n and optimal r s m i n and R D M A X used in MLAI_RSMINand MLAI_ROOT, respectively (L defines low and H high vegetation types).
StationVegetation Type r smin CTR r smin Optimal R DMAX Optimal
AmpleroL, short grass1001002
BugacL, short grass1001750.5
Fort PeckL, short grass100250.5
HowardL, tall grass1751252
KrugerL, tall grass1003002
MopaneL, tall grass1753001
BlodgettH, Evergreen needleleaf2501503
EspirraH, evergreen broadleaf240753
HarvardH, deciduous broadleaf1752501
HesseH, deciduous broadleaf1751752
HowlandmH, evergreen needleleaf2502750.5
HyytialaH, evergreen needleleaf2502250.5
LoobosH, evergreen needleleaf2501502
PalangH, evergreen broadleaf2402752
SylvaniaH, interrupted forest1754003
TumbarumbaH, evergreen broadleaf2402252
University of MichiganH, deciduous broadleaf1754003
Table 3. Model simulations acronyms and detailed configuration. CHTESSEL.
SimulationDetails
CTRControl simulation with default CHTESSEL parametersand input LAI and Albedo
MALBSame as CTR, but replacing the input albedo climatologywith the new high-resolution MODIS climatology
MLAISame as CTR, but replacing the input LAI climatologywith the new high-resolution MODIS climatology
MLAI_NOSMSSame as MLAI, but removing the soil moisture stress function from the canopy resistance (setting f 2 = 1 ) when the soil moisture is above the wilting point in Equation (3)
MLAI_RSMINSame as MLAI, but selecting the optimal r s m i n for each station from a set ofsimulations with varying r s m i n between 25 and 500.
MLAI_ROOTSame as MLAI, but using a uniform root distribution (Equation (5)) and selecting the optimal R D M A X for each station from a set of simulations with R D M A X of 0.5, 1, 2, and 3 m.
Table 4. Comparison between the CTR and MODIS ALB (MALB) for each tower. The root mean squared difference is computed for the mean annual cycle.
StationMean CTRMean MALBRMSD MALB vs. CTR
Amplero0.160.150.03
Blodgett0.130.10.02
Bugac0.180.160.03
Espirra0.160.140.02
Fort Peck0.250.180.07
Harvard0.110.130.03
Hesse0.130.150.03
Howard0.150.130.02
Howlandm0.110.120.01
Hyytiala0.120.110.02
Kruger0.170.160.03
Loobos0.170.110.07
Mopane0.160.170.01
Palang0.140.130.01
Sylvania0.110.130.04
Tumbarumba0.160.120.04
University of Michigan0.110.130.03
Median0.150.130.03
Table 5. Comparison between CTR and MODIS LAI (MLAI) for each tower. The root mean squared difference is computed for the mean annual cycle. CGLS, Copernicus Global Land Service.
StationMean CTRMean MLAIMean CGLSRMSD MLAI vs. CTRRMSD MODIS vs. CGLS
Amplero2.431.71.510.90.29
Blodgett3.082.282.980.870.47
Bugac1.930.921.041.040.17
Espirra2.381.421.130.970.20
Fort Peck0.890.350.340.540.08
Harvard3.142.452.780.750.58
Hesse2.352.662.271.650.52
Howard1.761.551.580.280.47
Howlandm3.082.402.831.040.82
Hyytiala2.121.691.730.500.51
Kruger1.760.980.930.800.16
Loobos2.211.871.870.530.43
Mopane1.590.870.650.730.25
Palang5.594.424.011.200.40
Sylvania2.631.732.240.910.62
Tumbarumba3.604.313.090.830.72
University of Michigan2.422.111.760.860.25
Median2.381.731.760.860.43
Publisher’s Note: MDPI stays neutral with regard to jurisdictional claims in published maps and institutional affiliations.

