Article

A Numerical Study of Aerosol Effects on Electrification with Different Intensity Thunderclouds

Key Laboratory of Meteorological Disaster, Ministry of Education (KLME)/Joint International Research Laboratory of Climate and Environment Change (ILCEC)/Collaborative Innovation Center on Forecast and Evaluation of Meteorological Disasters (CIC-FEMD), Nanjing 210044, China
*
Author to whom correspondence should be addressed.
Atmosphere 2019, 10(9), 508; https://doi.org/10.3390/atmos10090508
Submission received: 22 August 2019 / Revised: 22 August 2019 / Accepted: 27 August 2019 / Published: 30 August 2019
(This article belongs to the Special Issue Simulation and Visualization of Severe Weather)

Abstract

:
Numerical simulations are performed to investigate the effect of varying CCN (cloud condensation nuclei) concentration on dynamic, microphysics, electrification, and charge structure in weak, moderate, and severe thunderstorms. The results show that the response of electrification to the increase of CCN concentration is a nonlinear relationship in different types of thunderclouds. The increase in CCN concentration leads to a significant enhancement of updraft in the weak thunderclouds, while the high CCN concentration in moderate and severe thunderclouds leads to a slight reduction in maximum updraft speed. The increase of the convection promotes the lift of more small cloud droplets, which leads to a faster and stronger production of ice crystals. The production of graupel is insensitive to the CCN concentration. The content of graupel increases from low CCN concentration to moderate CCN concentration, and slightly decreases at high CCN concentration, which arises from the profound enhancement of small ice crystals production. When the intensity of thundercloud increases, the reduction of graupel production will arise in advance as the CCN concentration increases. Charge production tends to increase as the aerosol concentration rises from low to high in weak and moderate thundercloud cases. However, the magnitude of charging rates in the severe thundercloud cases keeps roughly stable under the high CCN concentration condition, which can be attributed to the profound reduction of graupel content. The charge structure in the weak thundercloud at low CCN concentrations keeps as a dipole, while the weak thunderclouds in the other cases (the CCN concentration above 100 cm−3) change from a dipole charge structure to a tripole charge structure, and finally disappear with a dipole. In cases of moderate and severe intensity thunderclouds, the charge structure depicts a relatively complex structure that includes a multilayer charge region.

1. Introduction

In recent years, considerable progress has been made in understanding the interaction between aerosol and lighting. Forest fires inject aerosol particles into the troposphere, allowing an investigation of the response of lightning activities on aerosol. It has been found that smoke aerosol released from fire likely led to the noticeable increasing percentage of positive cloud to ground (CG) lightning [1,2,3,4,5,6,7]. The thermodynamic and dynamic contrast between continental and maritime can be largely traced to the difference of lightning production between maritime and continental thunderclouds, and the CCN is also hypothesized to be an important factor [7,8]. The CCN hypothesized for the land-ocean lightning contrast has been developed by a well-established contrast in boundary layer aerosol concentration [9]. However, Williams and Standfill [8] suggested that the surface Bowen ratio is responsible for the land-ocean lightning contrast. Recent observations and theoretical studies have found better evidence for the Bowen ratio [9,10,11]. Even so, several studies have revealed the important role of aerosol in the land-ocean lightning contrast [12,13,14]. In addition, some observations suggested that the intensity of lightning activity in the urban areas and downwind areas is stronger than that in suburban areas [15,16,17,18]. For example, Stallins et al. [16] found a higher flash density over the urban center of Atlanta, and their results showed that the content of aerosol in urban areas is more than in suburban areas. Conversely, recent results presented by Tan et al. [19] using lightning and aerosol data on summers showed a negative correlation (R = −0.634) between lightning flash density and AOD (Aerosol Optical Depth) over Nanjing city in China. They explained that the convection activities could be weaker by the radiative effect of not only aerosols but also clouds. Similarly, Wang et al. [20] founded that the lightning density increased significantly with AOD in low aerosol concentration, while the aerosol-cloud interaction may play a dominant role. However, in high aerosol concentration, lightning activity is restrained in low humidity areas.
It is worthy to note that a host of model studies have been established to investigate the effects of CCN on electrification in thunderclouds. The 1-D model simulation results of Mitzeva et al. [13] revealed that updraft enhancement, more cloud droplets and ice particles appeared, and a stronger electrification process in the continental thundercloud compared to the maritime thundercloud. Similarly, Shi et al. [14] used a 2-D cloud model to investigate the difference of the electrification and lightning processes between continental and maritime thunderclouds. They found that the continental thundercloud produces lightning frequency 1.5 times higher than maritime thundercloud by estimating the lightning flash rate based on ice mass flux. Several studies also have compared the dynamics, microphysics, and electrical processes between polluted thunderclouds and clean thunderclouds. It has been found that convection development is even more vigorous in polluted thunderclouds than that in clean thunderclouds. Meanwhile, the updraft, the content of ice particles, and the electrification processes also show a significant enhancement in high aerosol concentration [20,21,22]. Mansell and Ziegler [21] demonstrated that the CCN concentrations have a great effect on the microphysical and electrical evolution in storms. They also noted that the lightning activity is highly sensitive to CCN concentration when the CCN concentration increases from low to intermediate (not exceeding 2000 cm−3), and the response of lightning production to CCN concentration shows an obvious difference at very high CCN concentration (above 2000 cm−3), which is mainly sensitive to ice multiplication scheme. However, a recent study by Tan et al. [23] indicated that the response of charge separation rate to the increase of aerosol concentration is non-monotonic, and the vapor competition leads to the magnitude of charge separation rate remaining steady when the CCN concentration is above 3000 cm−3.
All these have suggested a complicated relationship involving initial aerosol concentration and dynamics, microphysics, and electrification in thunderclouds. Closely linked to electrification is the dynamics and microphysics, which may be influenced by the aerosol concentration [24,25,26]. However, the intensity of thunderclouds is another key factor affecting the development of microphysics, and electrification. The effects of aerosols on electrification likely behave distinctly in different intensity thunderclouds. Similarly, some sensitive tests have been conducted to investigate the role of relative humidity in the effect of aerosol on cloud microphysics, dynamics, and precipitation. They suggested that the aerosol effects on cloud microphysical properties and precipitation are negligible in dry air, while much more significant in humid air [24,27,28,29,30]. Additionally, Zhao et al. [22] revealed the role that cloud base humidity plays in the response of electrification to increased cloud condensation nuclei (CCN), and they suggested that the low water vapor content reduced the activating rate of aerosol, leading to a weakening in electrification in thunderclouds.
From those studies, one can conclude that the influence of aerosol on electrification in thunderclouds has been studied with various numerical models in recent years. The interaction between CCN and electrification perhaps behave significantly different in different thunderclouds types, while few studies have modeled the CCN effects in different convection intensities. In this paper, we present sensitivity studies of the CCN concentration and convection intensity on thunderclouds using a 2-D cumulus model with electrification and lightning discharges processes. Based on the cumulus model, the impacts of CCN concentration on dynamics, microphysics, and electrification in the severe thundercloud, medium thundercloud, and weak thundercloud are evaluated.

2. Model Description

2.1. Cloud Model

The non-hydrostatic two-dimensional (2-D) cumulus model with an electrification scheme including non-inductive and inductive charge separation in this study was developed by Hu and He [31]. As described in Shi et al. [14], the five hydrometeor categories with a gamma function distribution of microphysics scheme are cloud droplets, rain, ice crystal, graupel, and hail.
Cloud droplets are formed through activation of CCN, and CCN concentrations decrease with the increasing height that due to the effects of Brownian motion and gravity sedimentation [32], this study also assumes that the concentration of CCN in the horizontal direction is the same. Therefore, the concentration can be expressed as:
N CCN ( z ) = N 0 × exp ( Z / Z s ) ,
where N0 is the initial CCN concentrations on the ground, Nccn (z) is the CCN concentration at a different height, zs (CCN elevation) is set to 2 km in this study [32]. In addition, we assume that the CCN concentration at some height layer is uniformly distributed when CCN concentrations are initialized in each grid point. Therefore, the CCN concentrations’ distribution for the whole space can be calculated by given CCN concentrations on the ground. Soluble CCN particles (sulfates, etc.) can grow into cloud droplets, which affects the microphysical development of thundercloud. This paper couples a classical CCN activation parameterization in the improved 2D cloud model:
N a = C 0 S k ,
where Na represents activated CCN number concentration and S represents the water vapor supersaturation within the cloud. k of Equation (2) is related to the chemical composition and physical properties of aerosols, where k is 0.7 [25]. C0 is used to represent the initial CCN concentrations [26]. Thus, it can be found that the number of cloud droplets activated by CCN is not only related to the initial concentration of CCN but also depends on the water vapor supersaturation within the cloud. On this basis, we add a diagnostic procedure given by Tan et al. [23] to determine whether there are new cloud droplet generations.
N C = max [ ( N c new N c old ) / Δ t , 0 ] ,
where Nc represents the activation rate of cloud droplets, Ncold is cloud droplets concentration at the former time step, Ncnew represents activated cloud droplets calculated within a new time step ( Δ t ). Therefore, new cloud droplets are generated when Ncnew > Ncold in this study.
Nucleation of ice crystals occurs both through homogeneous-freezing of cloud droplets and by heterogeneous nucleation caused by IN (ice nuclei). However, it must be clarified that an empirical formula of ice nucleation based on Fletcher [33] is considered in the original model, while the freezing process of cloud droplets is not be included. Therefore, this work makes an improvement for the existing model, and the process of cloud droplets freezing into ice crystals is added into the model. The freezing scheme of cloud droplets developed by Sun et al. [34] is expressed as:
Q cif = { pc Q c / 2 Δ t 20 ° C < T < 40 ° C Q c / 2 Δ t T 40 ° C ,
where Qcif represents the nucleation rate of cloud droplets, that is the mixing ratio of ice crystals formed by cloud droplets freezing, Qc is the cloud-water mixture ratio, the parameter of pc is the percentage of frozen droplets, and pc varies by temperature, pc = 0.008 × ( 1.274 ) T 0 T . T is the temperature within the cloud, and T0 (−20 °C) is the temperature at which the water droplets begin to freeze. The water droplets have partially frozen from −20 °C and completely frozen at −40 °C.
The heterogeneous nucleation scheme is based on Cooper [35]:
N in = 0.005 × exp ( 0 . 304 × T )   40 ° C T 0 ° C ,
where Nin is the heterogeneous nucleation rate, and the number of ice crystals formed by heterogeneous nucleation is only related to temperature. This study also considered the influence of water vapor supersaturation referring to Hu et al. [31]. Therefore, Equation (5) is rewritten as:
N in = { 0 . 304 × 0.005 × exp ( 0 . 304 × T ) ρ 0 S i k d T d t When d T d t < 0 and   Q v > Q si 0 When d T d t 0 and   Q v Q si ,
where k = 5, d T d t w T t , w represents wind speed, and Si is for the water vapor supersaturation on the ice surface. Therefore, the heterogeneous nucleation rate is determined by both temperature and water vapor supersaturation.
Raindrops can be produced from auto-conversion of cloud droplets or the melting of ice particles. The microphysical conversions include condensation and evaporation of five types of particles. The secondary ice multiplication depends on the number of cloud droplets with a diameter greater than 24 μm, which is based on Mossop [36]. Since a large amount of supercooled water resides in cumulus cloud, ice crystals with the diameter over the critical value (0.03 cm) will grow up quickly during colliding with supercooled water, and the growth speed is larger than that in the process of sublimation. Under this condition, as soon as the diameter of ice crystal exceeds 0.03, ice crystal should become graupel. Similarly, after a significant growth of graupel (the diameter exceeds 0.5 cm), the graupel should be assigned to hail. In addition, the microphysical processes include various collisions between two types of particles (the collision between cloud droplet and ice crystal, rain, graupel, and hail; the collision between rain and ice crystal; the collision between rain and graupel, and hail; the collision between ice crystal and graupel, and hail).
The initial perturbation on the convective cloud simulation that is with a horizontal uniform horizontal flow is used to start the convection. In this article, the way to onset convection is setting temperature and specific humidity perturbations. This setup adds a limited range of warm-wet bubble perturbation in the lower layer of the model domain, as a result, the humidity and temperature of this warm-wet bubble are higher than that of the surround. Then the buoyancy in the atmospheric equation of vertical motion is used to start the initial convection. Perturbation function is as follows:
θ = θ 0 + Δ θ cos 2 ( π 2 β ) ,
Q v = Q v 0 + ( Q vn Q v ) cos 2 ( π 2 β ) ,
β = [ ( x x c x r ) 2 + ( y y c y r ) 2 ] ,
here, (xc, yc) is the central coordinate of perturbation, xr, yr is the radius of two coordinate directions on the warm-wet bubble. Δθ is the central maximum disturbance potential temperature. Qvn is saturation specific humidity under the condition of temperature perturbation. Therefore, we modulate the intensity of the convective system by changing center potential temperature and saturation specific humidity on disturbance.
Electrification via induction in the model occurs when graupel collides with cloud droplets/ice crystals. Inductive collision charging parameterization is based on Ziegler et al. [37]. The inductive graupel-cloud droplet charging rate can be given by:
( Q eg t ) p = ( π 3 8 ) [ 6.0 V g Γ ( 4.5 ) ] E gcli E rcli N cli N 0 g D cli 2 [ π Γ ( 3.5 ) ε ( cos θ ) cos E z D g 2 Γ ( 1.5 ) Q eg / ( 3 N g ) ] ,
where Qeg is the individual charge from graupel, Dc/i and Dg are the diameter of cloud droplets and graupel, respectively. Vg is the falling speed of graupel, Nc/i and Ng are the cloud droplet/ice crystal and graupel concentrations, respectively. N0g is the number concentration intercept for graupel. C is the complete gamma function, and Ez is the vertical electric field. The symbols Egc/i and Erc/i denote graupel-cloud droplet/ice crystal collision efficiency and rebound probability, respectively. It is the polar collision angle. According to Mansell et al. [38], coefficients for inductive graupel cloud droplet charging (Erc = 0.01 and cos θ = 0.4) in this study are between the moderate to strong values which range from Erc = 0.007 to 0.015 and cos θ = 0.2 to 0.5. In addition, coefficients for inductive graupel-ice crystal charging Eri = 0.7 and cos θ = 0.2.
The non-inductive graupel charging rate takes the form:
( Q eg t ) np = β δ q E r ( 1 E r ) 1 × 1 ρ 0 | V i ¯ V ¯ g | 0 0 π 4 E gi ( D g + D i ) 2 N g N i d D g d D i ,
where Dg and Di are diameters of the colliding particles (graupel and ice crystal). Er abounds probability, which is assumed to be 0.2, while Egi is graupel-ice crystal collision efficiency (set to be 0.8). N is the number concentration. Vi and Vg are the mass-weighted mean terminal speeds for ice crystal and graupel. An arbitrary factor β is used to limit charging at low temperature and given is similar to Mansell et al. [38] by:
β = { 1 T > 30 ° C 1 [ ( T + 30 ) / 13 ] 2 43 ° C < T < 30 ° C 0 T < 43 ° C ,
The scheme of individual graupel charging rate (δq) we adopted is modified from the scheme of Gardiner et al. [39] based on the experiment results of Pereyra et al. [40]. The reversal temperature in the modified parameterization scheme, replacing the original fixed value, considers the functional dependence on cloud water content (CWC), so not only positive charges but also negative charges may be acquired by graupel when CWC is less than 1 g m−3. The modified parameterization scheme is denoted as follows.
The expression of δq following Gardiner et al. [39] is approximated as:
δ q = 7.3 D i 4 | V ¯ i | V ¯ g | 3 δ L f ( τ ) ,
where Di is the diameter for ice, δL is a parameter related to CWC, modified as:
f ( τ ) = 1.7 × 10 5 τ 3 0.05 τ + 0.13 ,
where τ = (−21/Tr) (T − 273.16) is the scaled temperature used by Ziegler et al. [37] to allow the reversal temperature Tr to be varied. It must be stated that Tr (−15 °C) is in °C and T is in K.
Electrification parameterizations follow Tan et al. [23,41] including non-inductive and inductive charge separation processes. The non-inductive charging parameterization is modified from Gardiner et al. [39]. It mainly takes into account the collision between graupel and ice crystals, which is related to the size of ice crystals and graupel, drops velocity, relative collision rate, and the coefficient of the inversion temperature. Lightning discharges are parameterized based on Tan et al. [42]. Lightning initiation uses the runaway electron threshold for break-even field and thereafter bidirectional channels are propagated in a stochastic step-by-step fashion. The leaders of IC (intracloud) lightning do not reach the ground, and a height threshold (1.5 km or six grid points above ground) is used to define a flash to be a CG (cloud to ground) lightning (includes +CG and −CG).

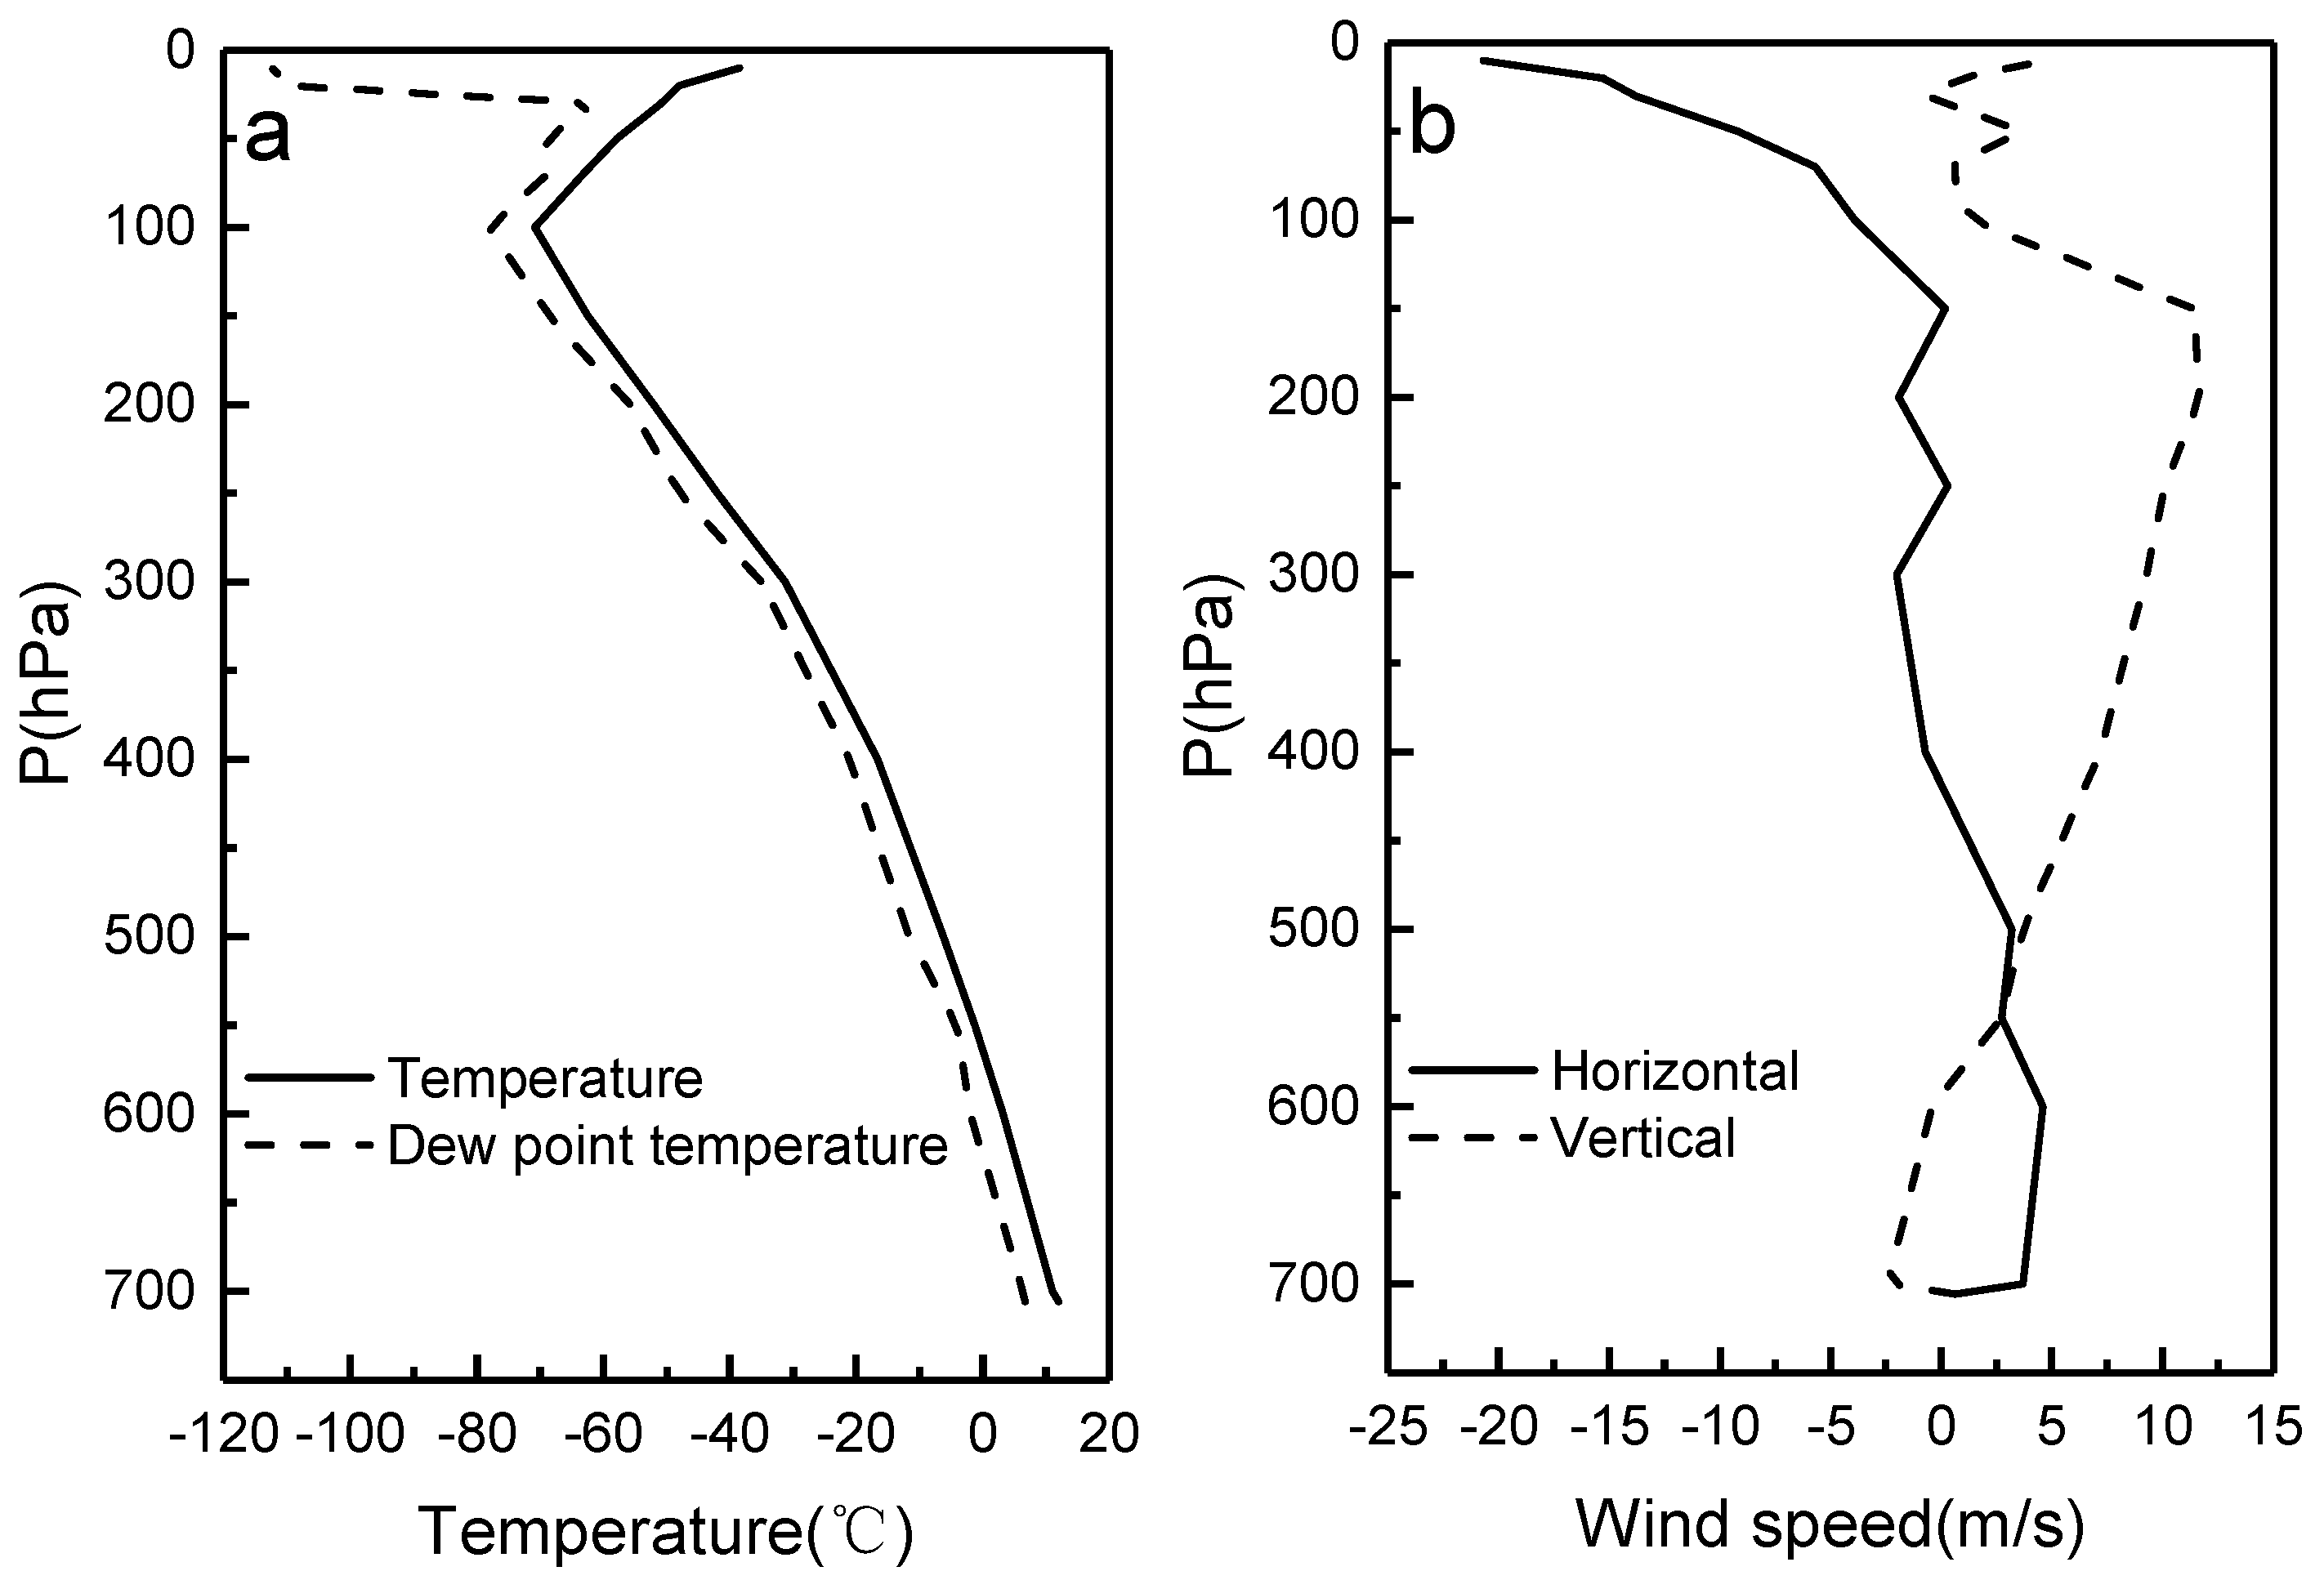
2.2. Model Initialization and Method in Numerical Experiments

A mountain thundercloud SEET (Studies of Electrical Evolution in thunderclouds) case occurred on 31 July 1999 and was used for numerical simulation in this study. The environmental temperature, humidity stratification, and vertical wind profile at the corresponding time are shown in Figure 1. A humid and warm bubble of horizontal radius 5 km and vertical radius 1 km was given at the grid point with a height of 1 km. Three kinds of thunderclouds were set by changing the environmental humidity and temperature stratification of the SEET case at an initial time. The temperature disturbance and humidity disturbance of weak thundercloud were set as 2.5 k and 60%, that of moderate thundercloud were set as 4.5 k and 80%, and 6 k and 100% in Equations (7) and (8). The different CCN concentrations were characterized by changing N0 in Equation (4). Four numerical simulation experiments (N0 was 100, 500, 1000, and 3000 cm−3 respectively) were conducted. Simulations were performed in a 76 km × 20 km domain with a constant grid spacing of 250 m in the horizontal and 250 m in the vertical from the surface to 20 km. Moreover, all simulations were carried out for 80 min, and the time step was 2 s.

3. Results

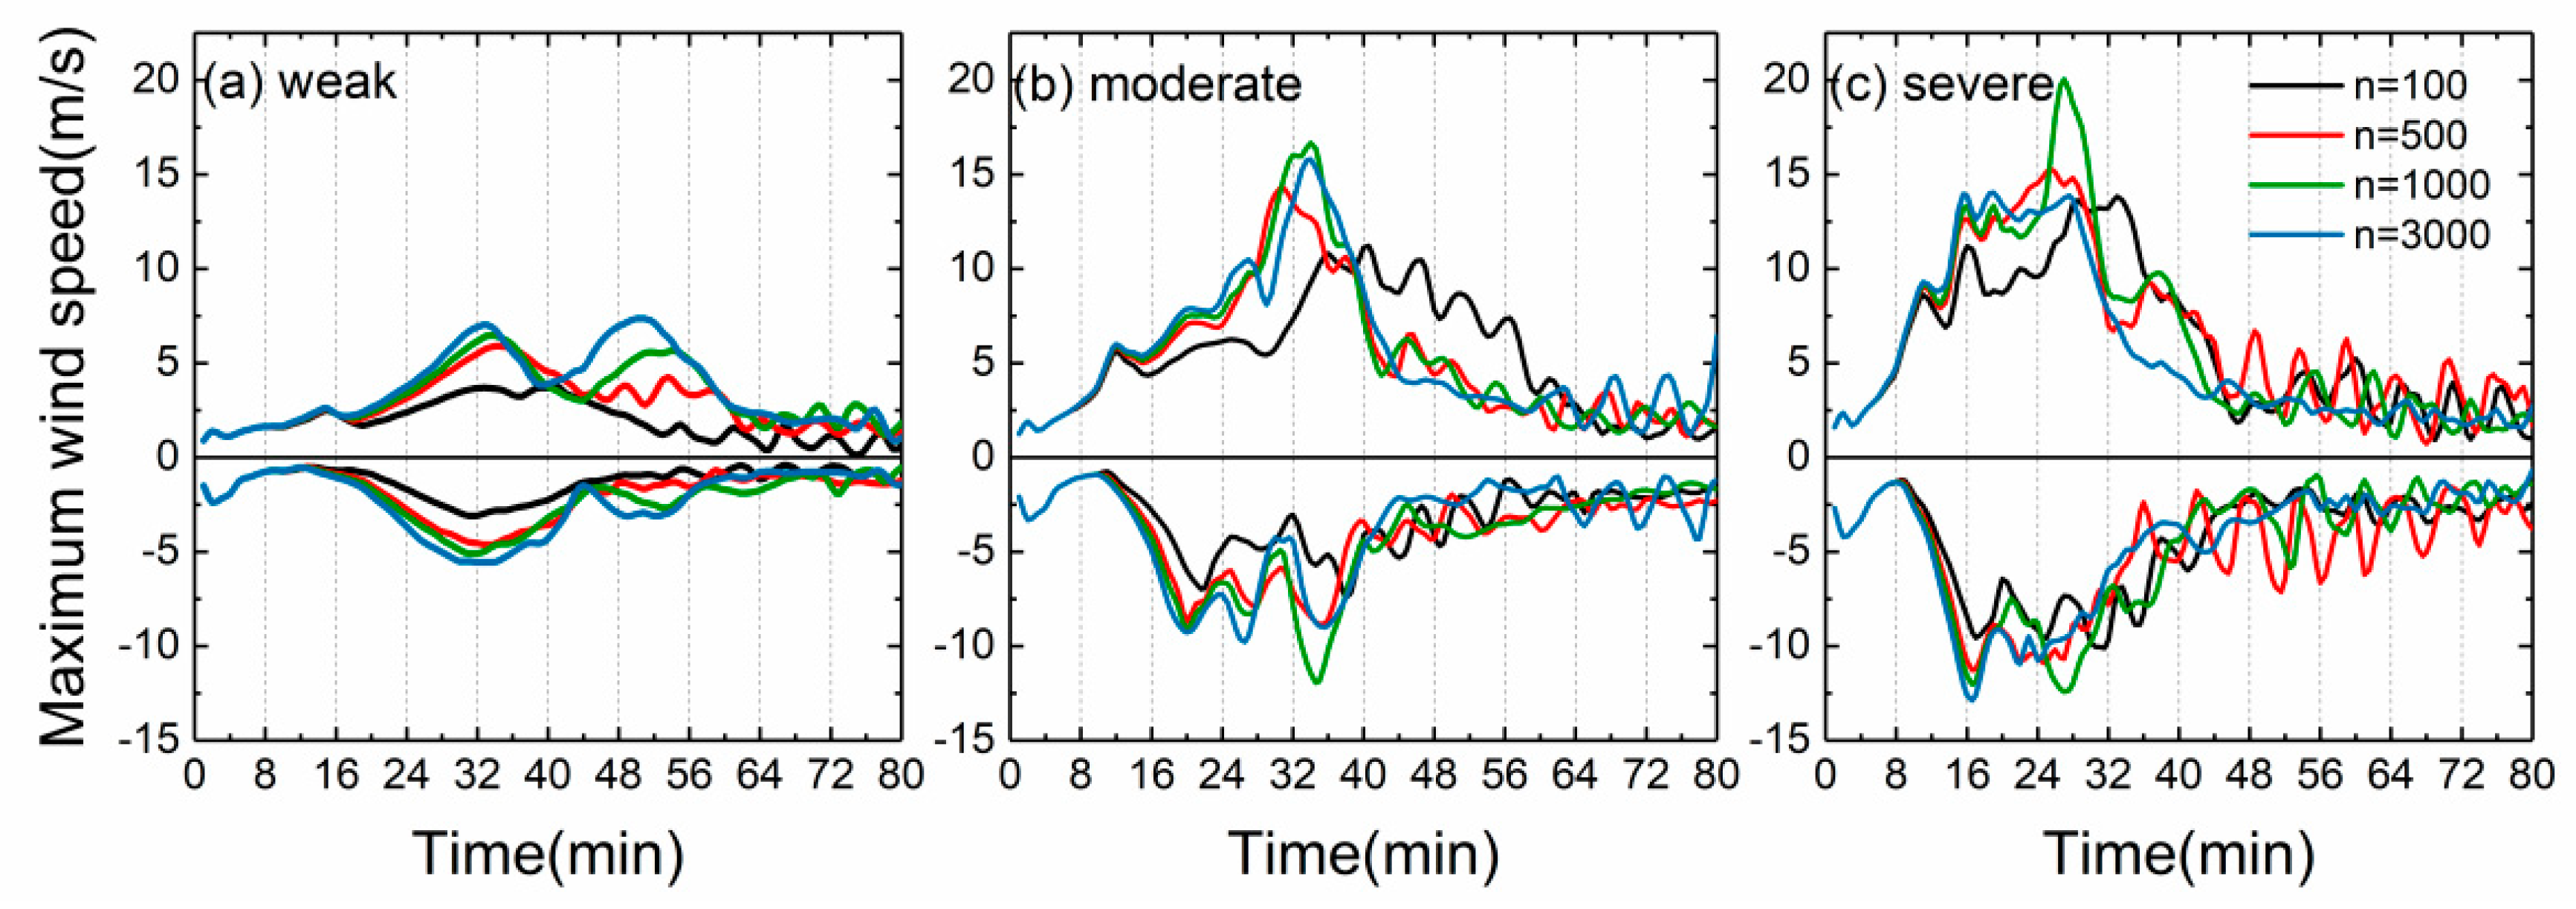
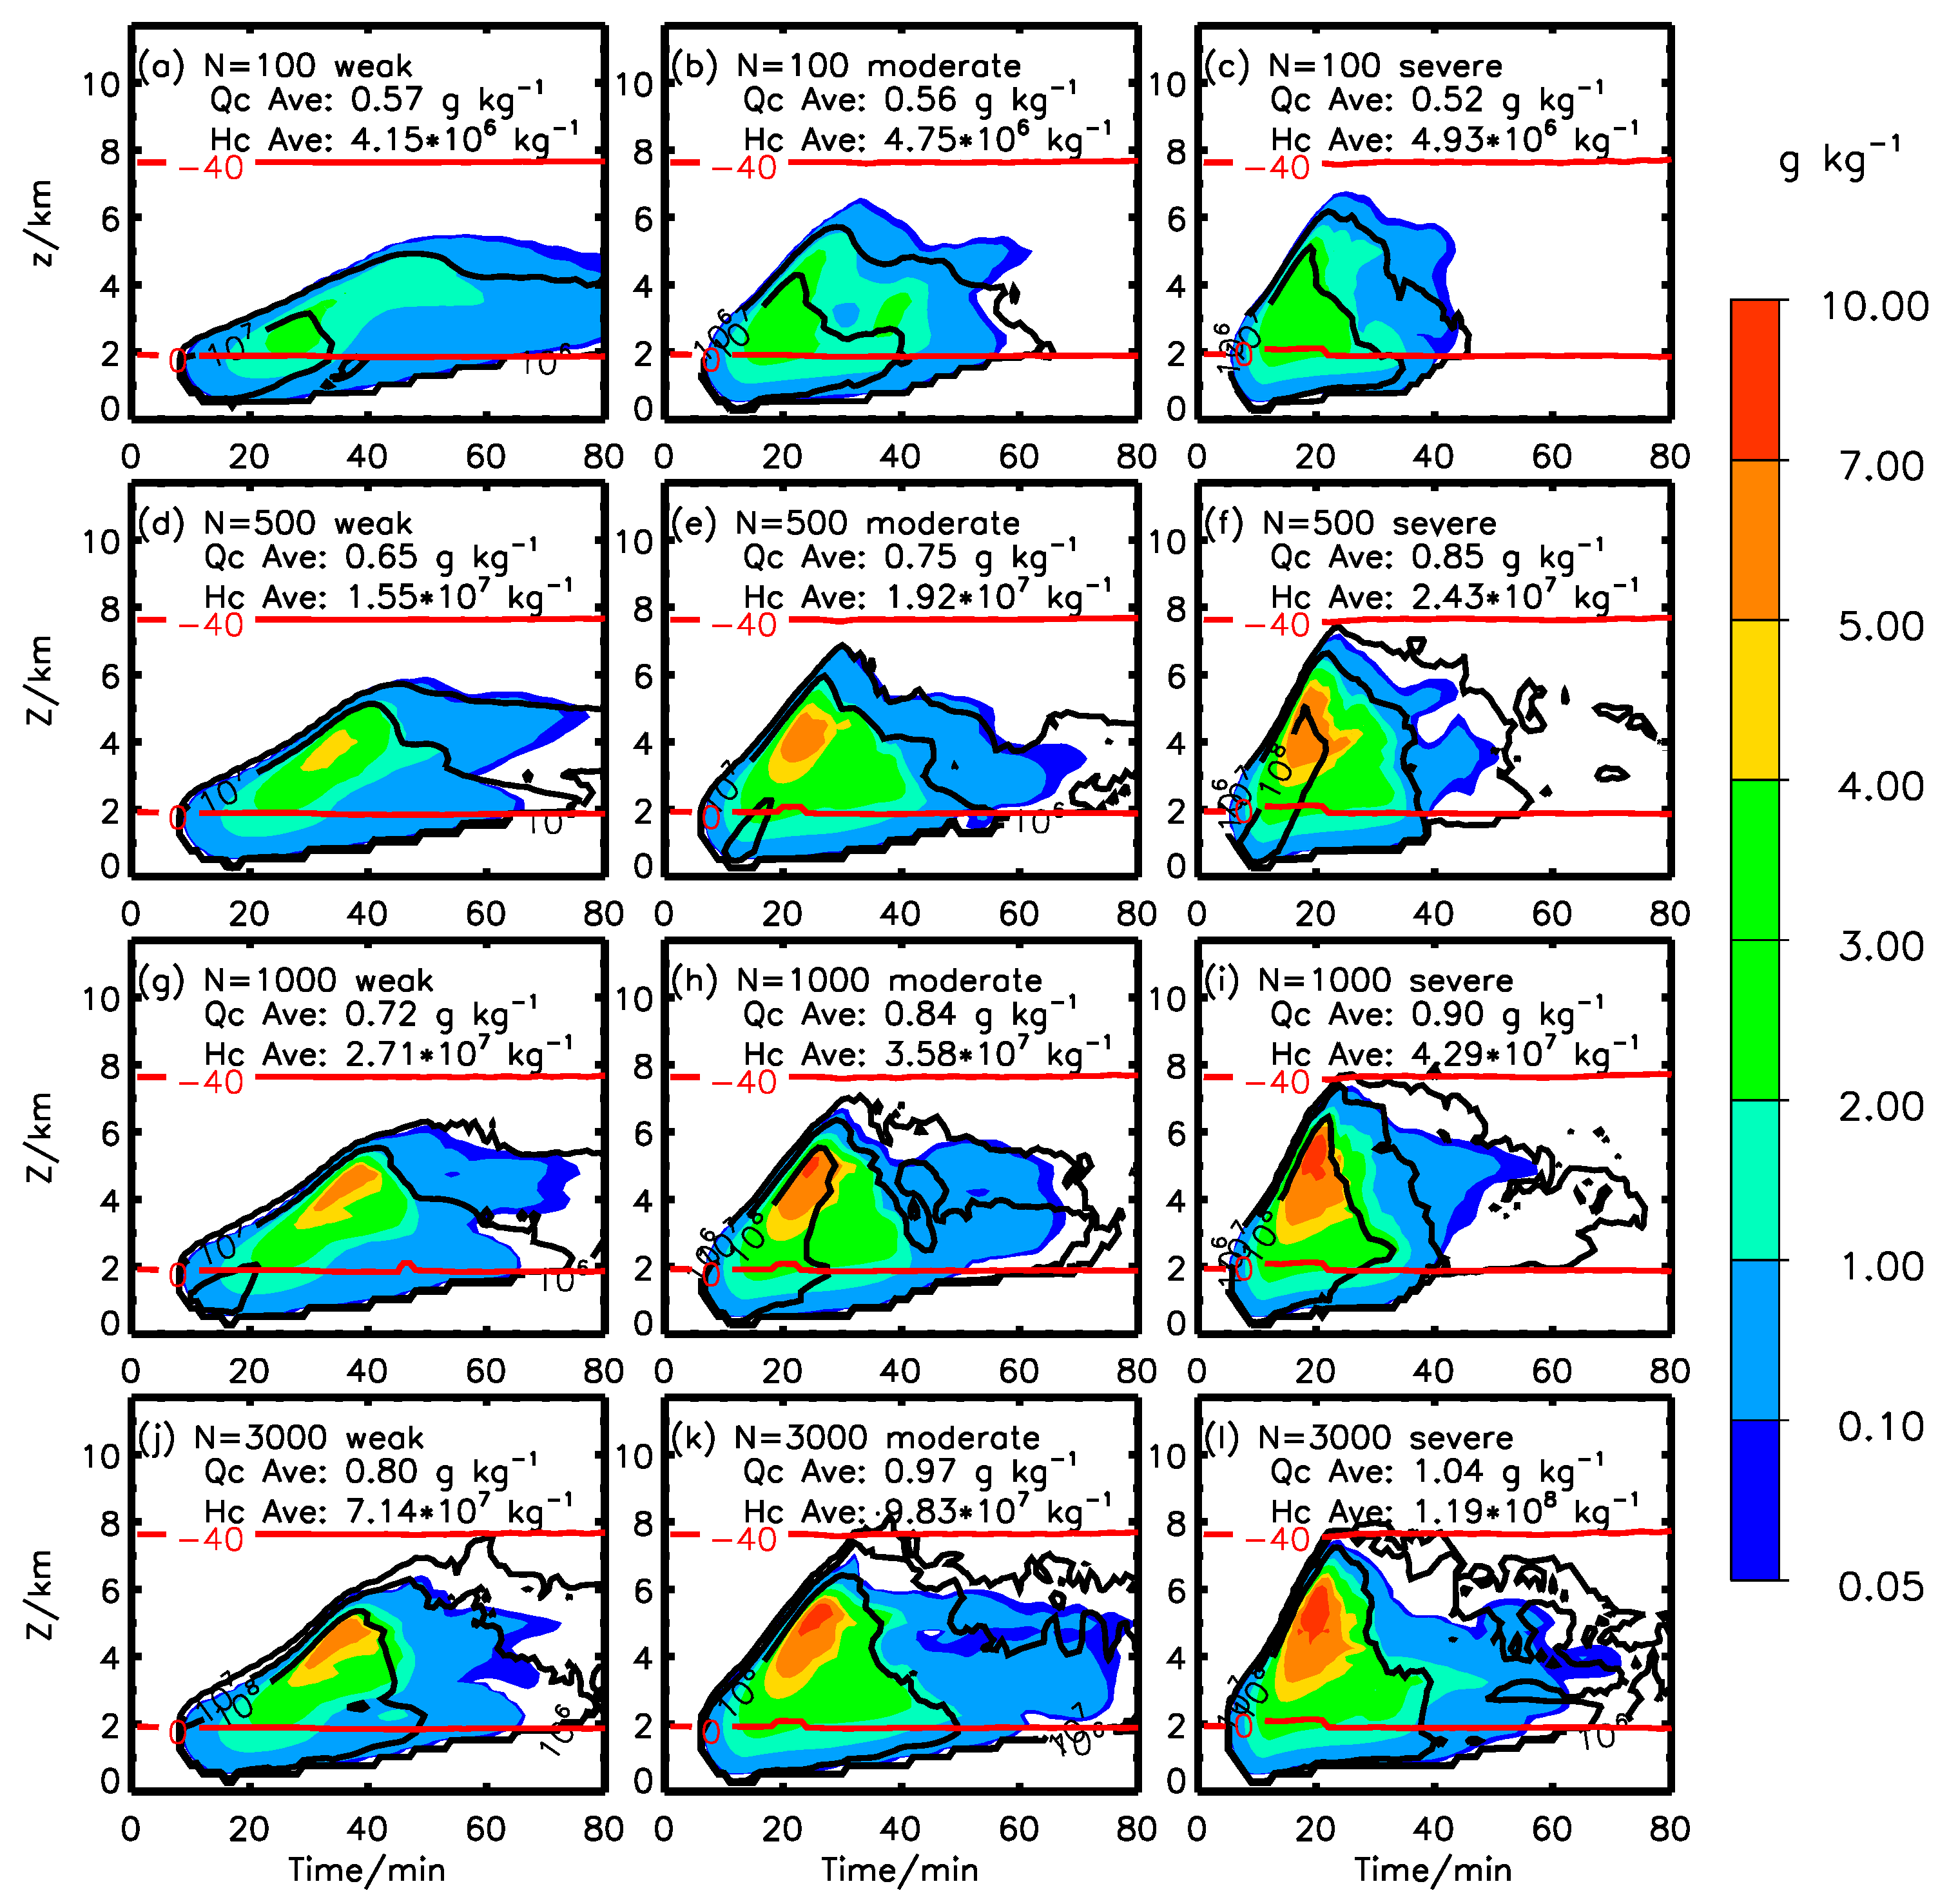
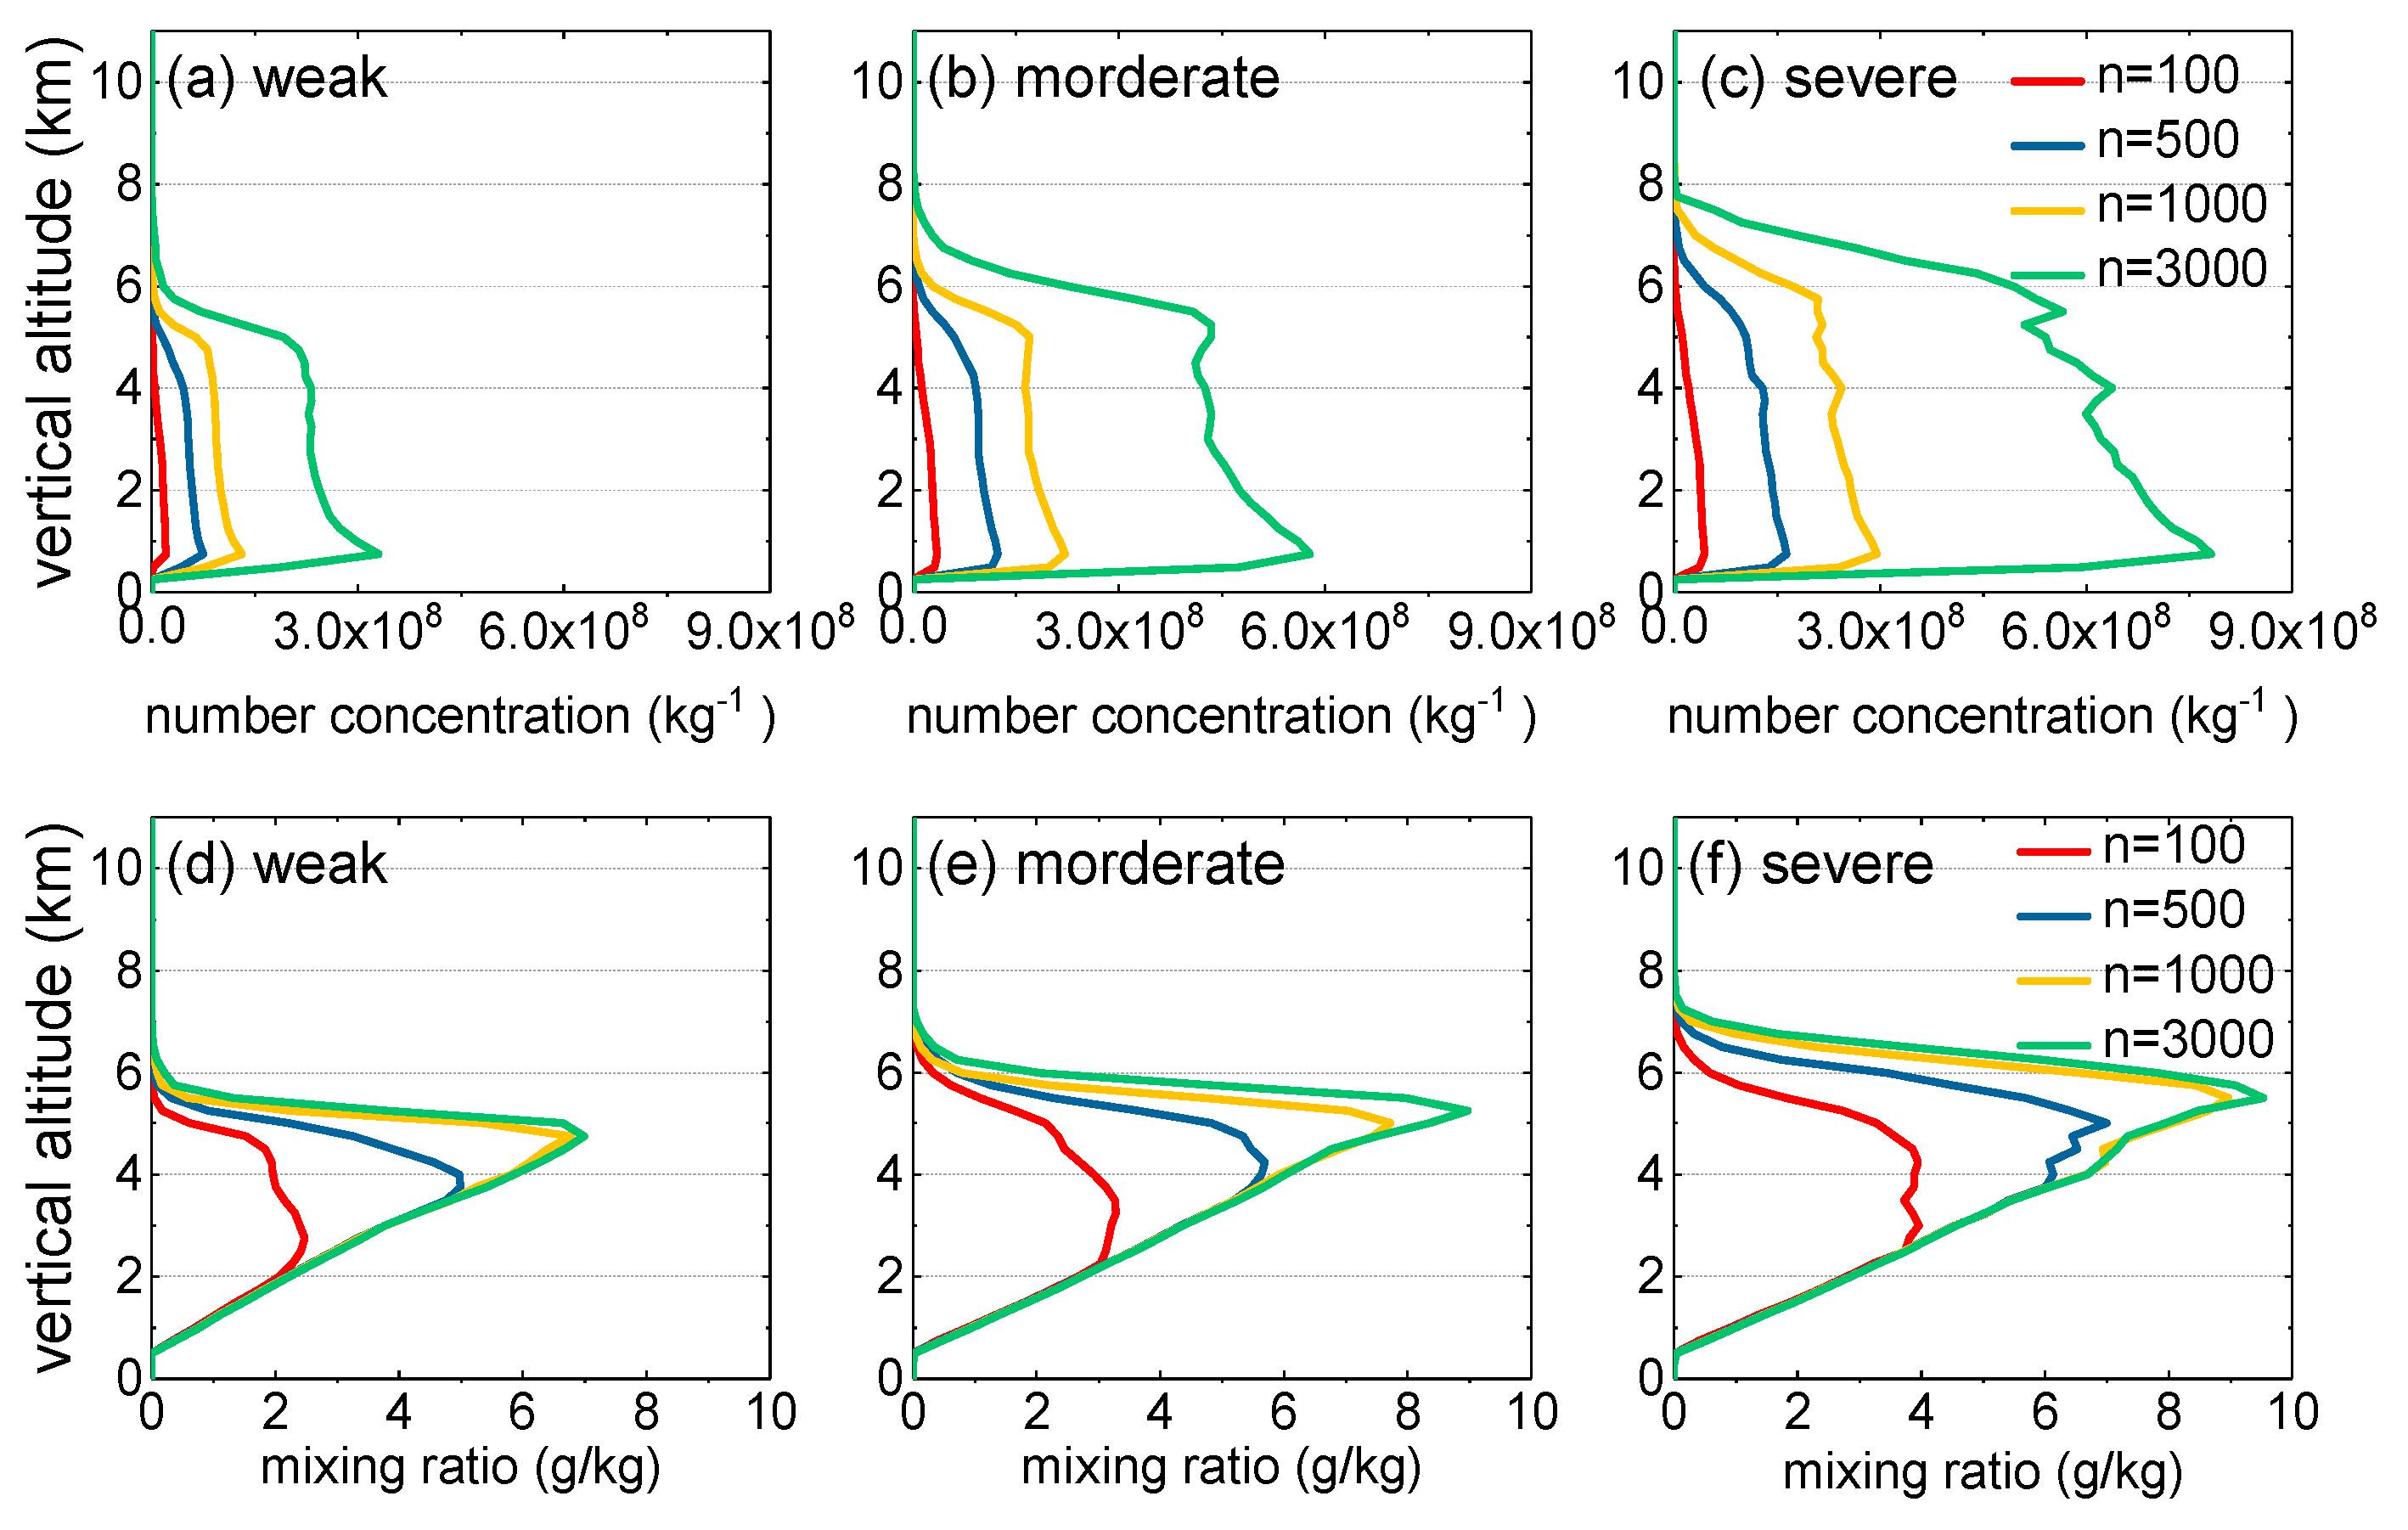
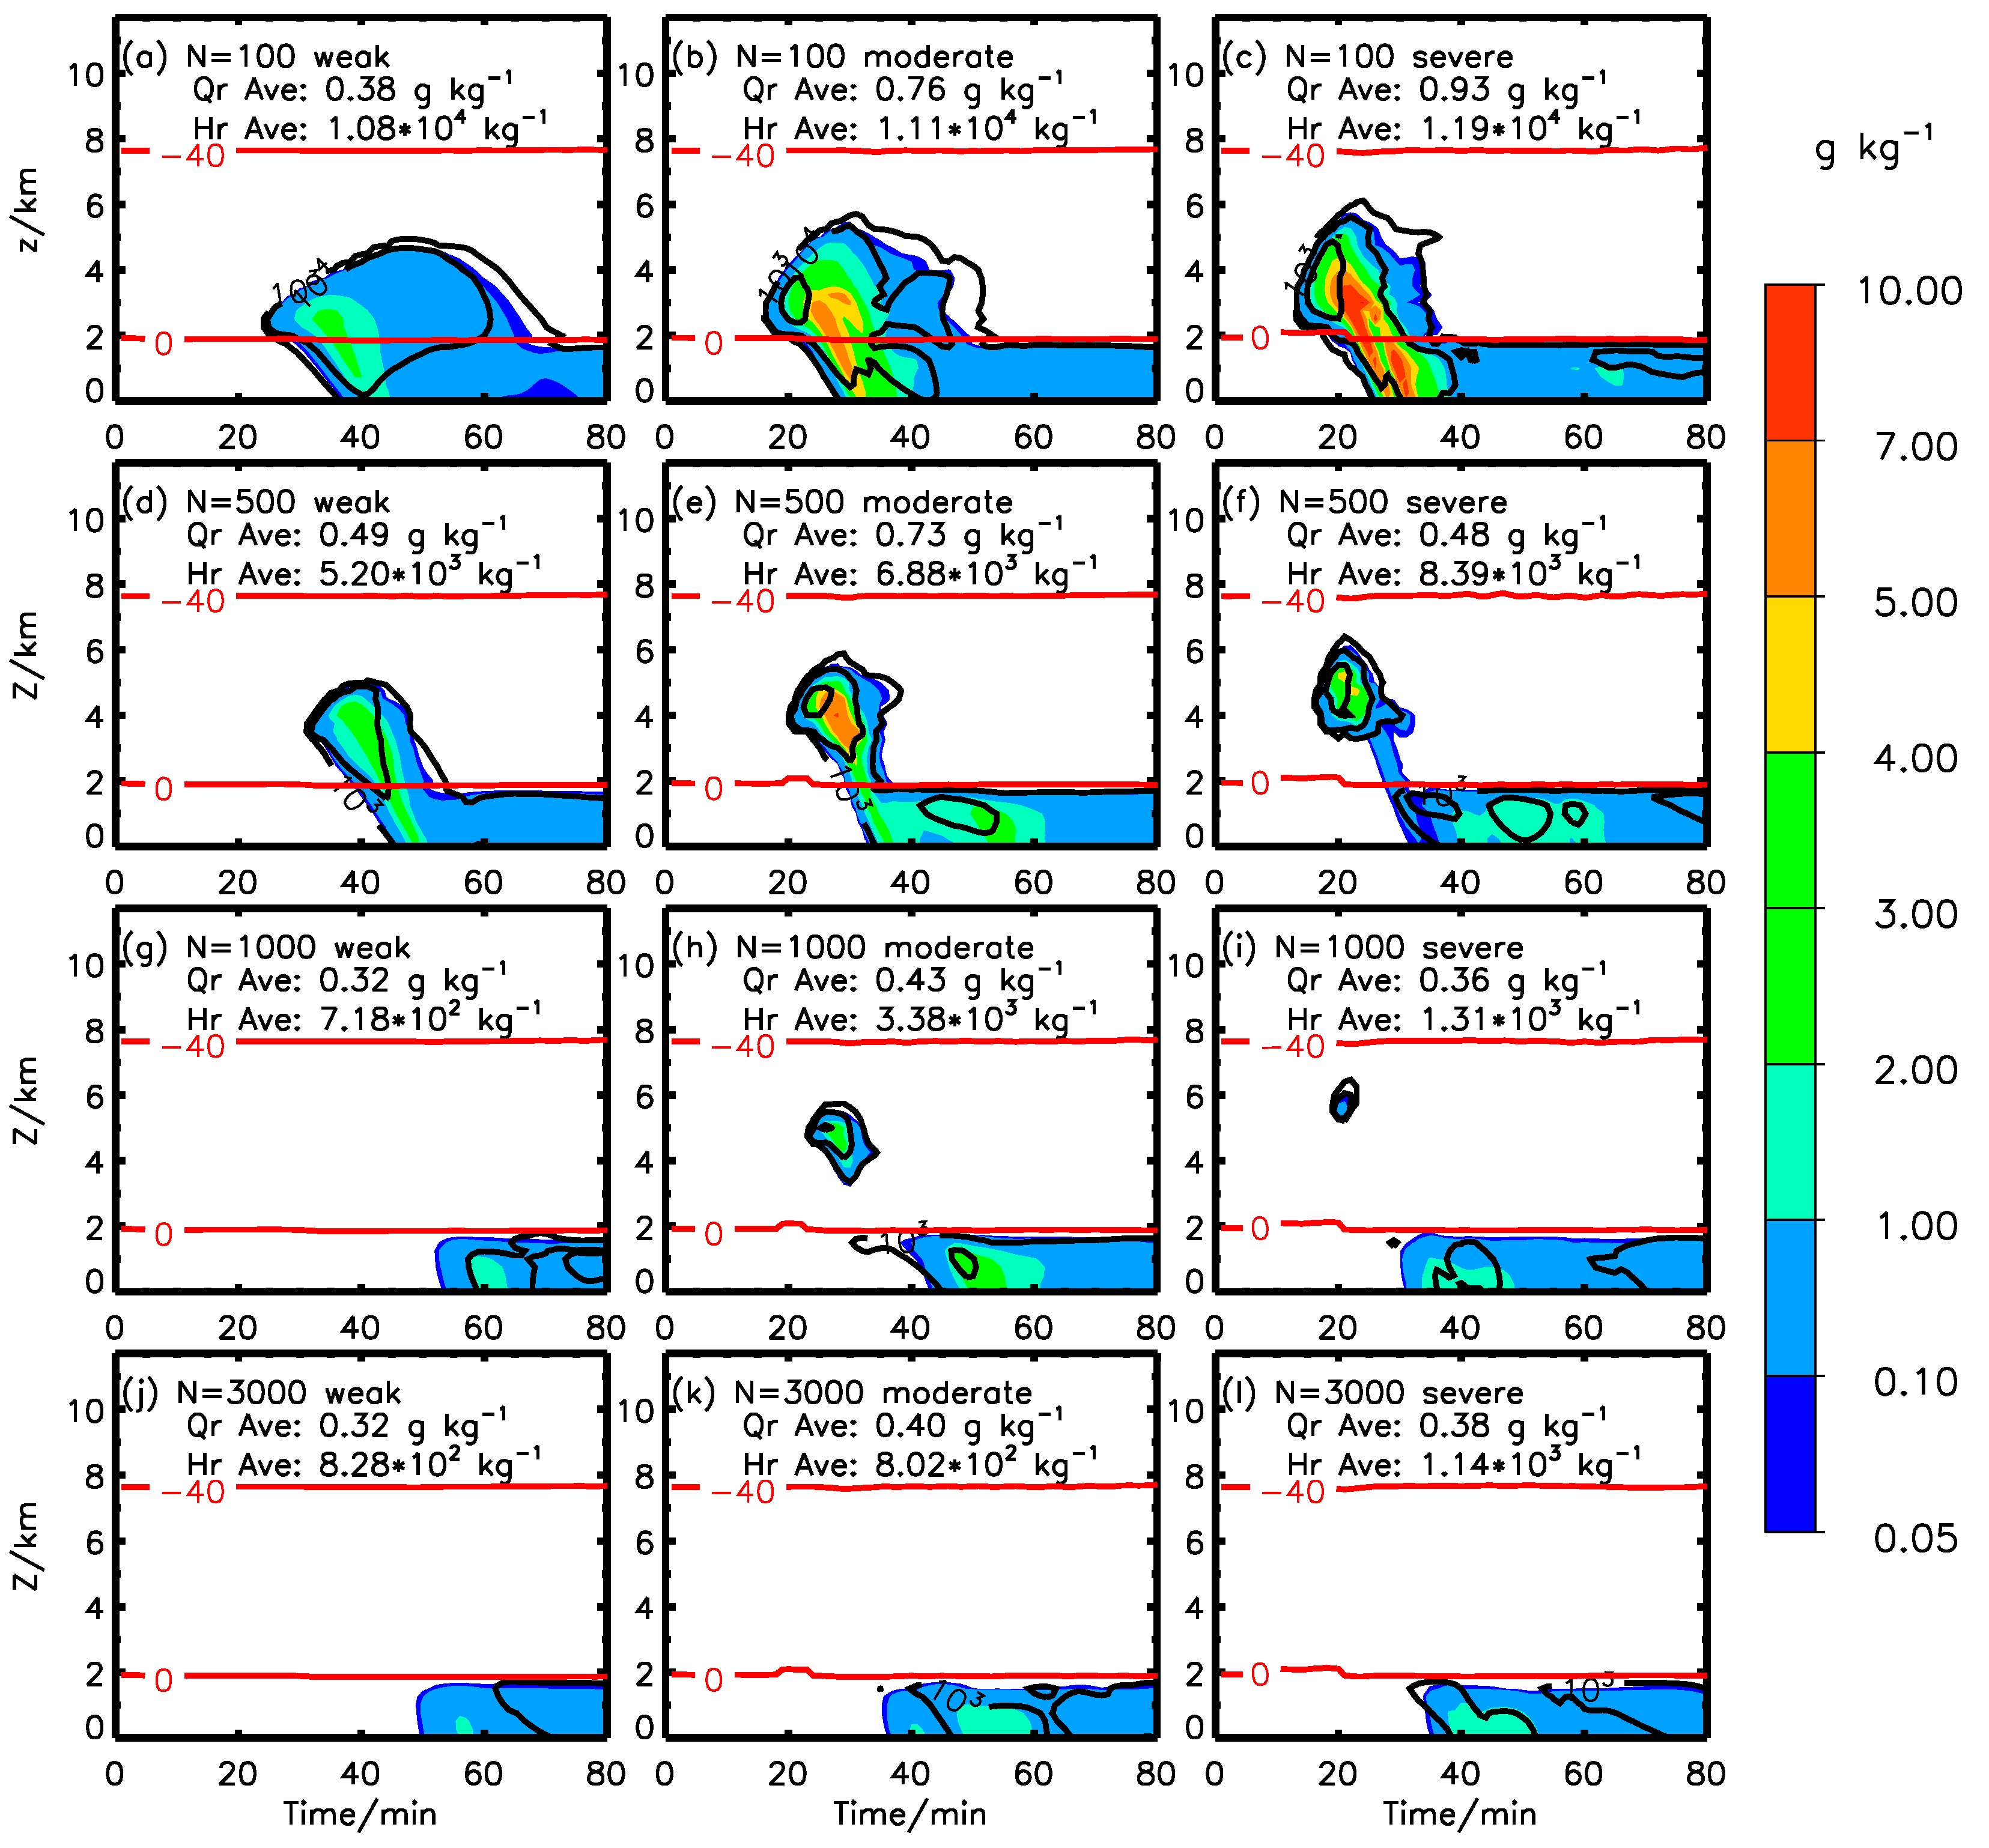
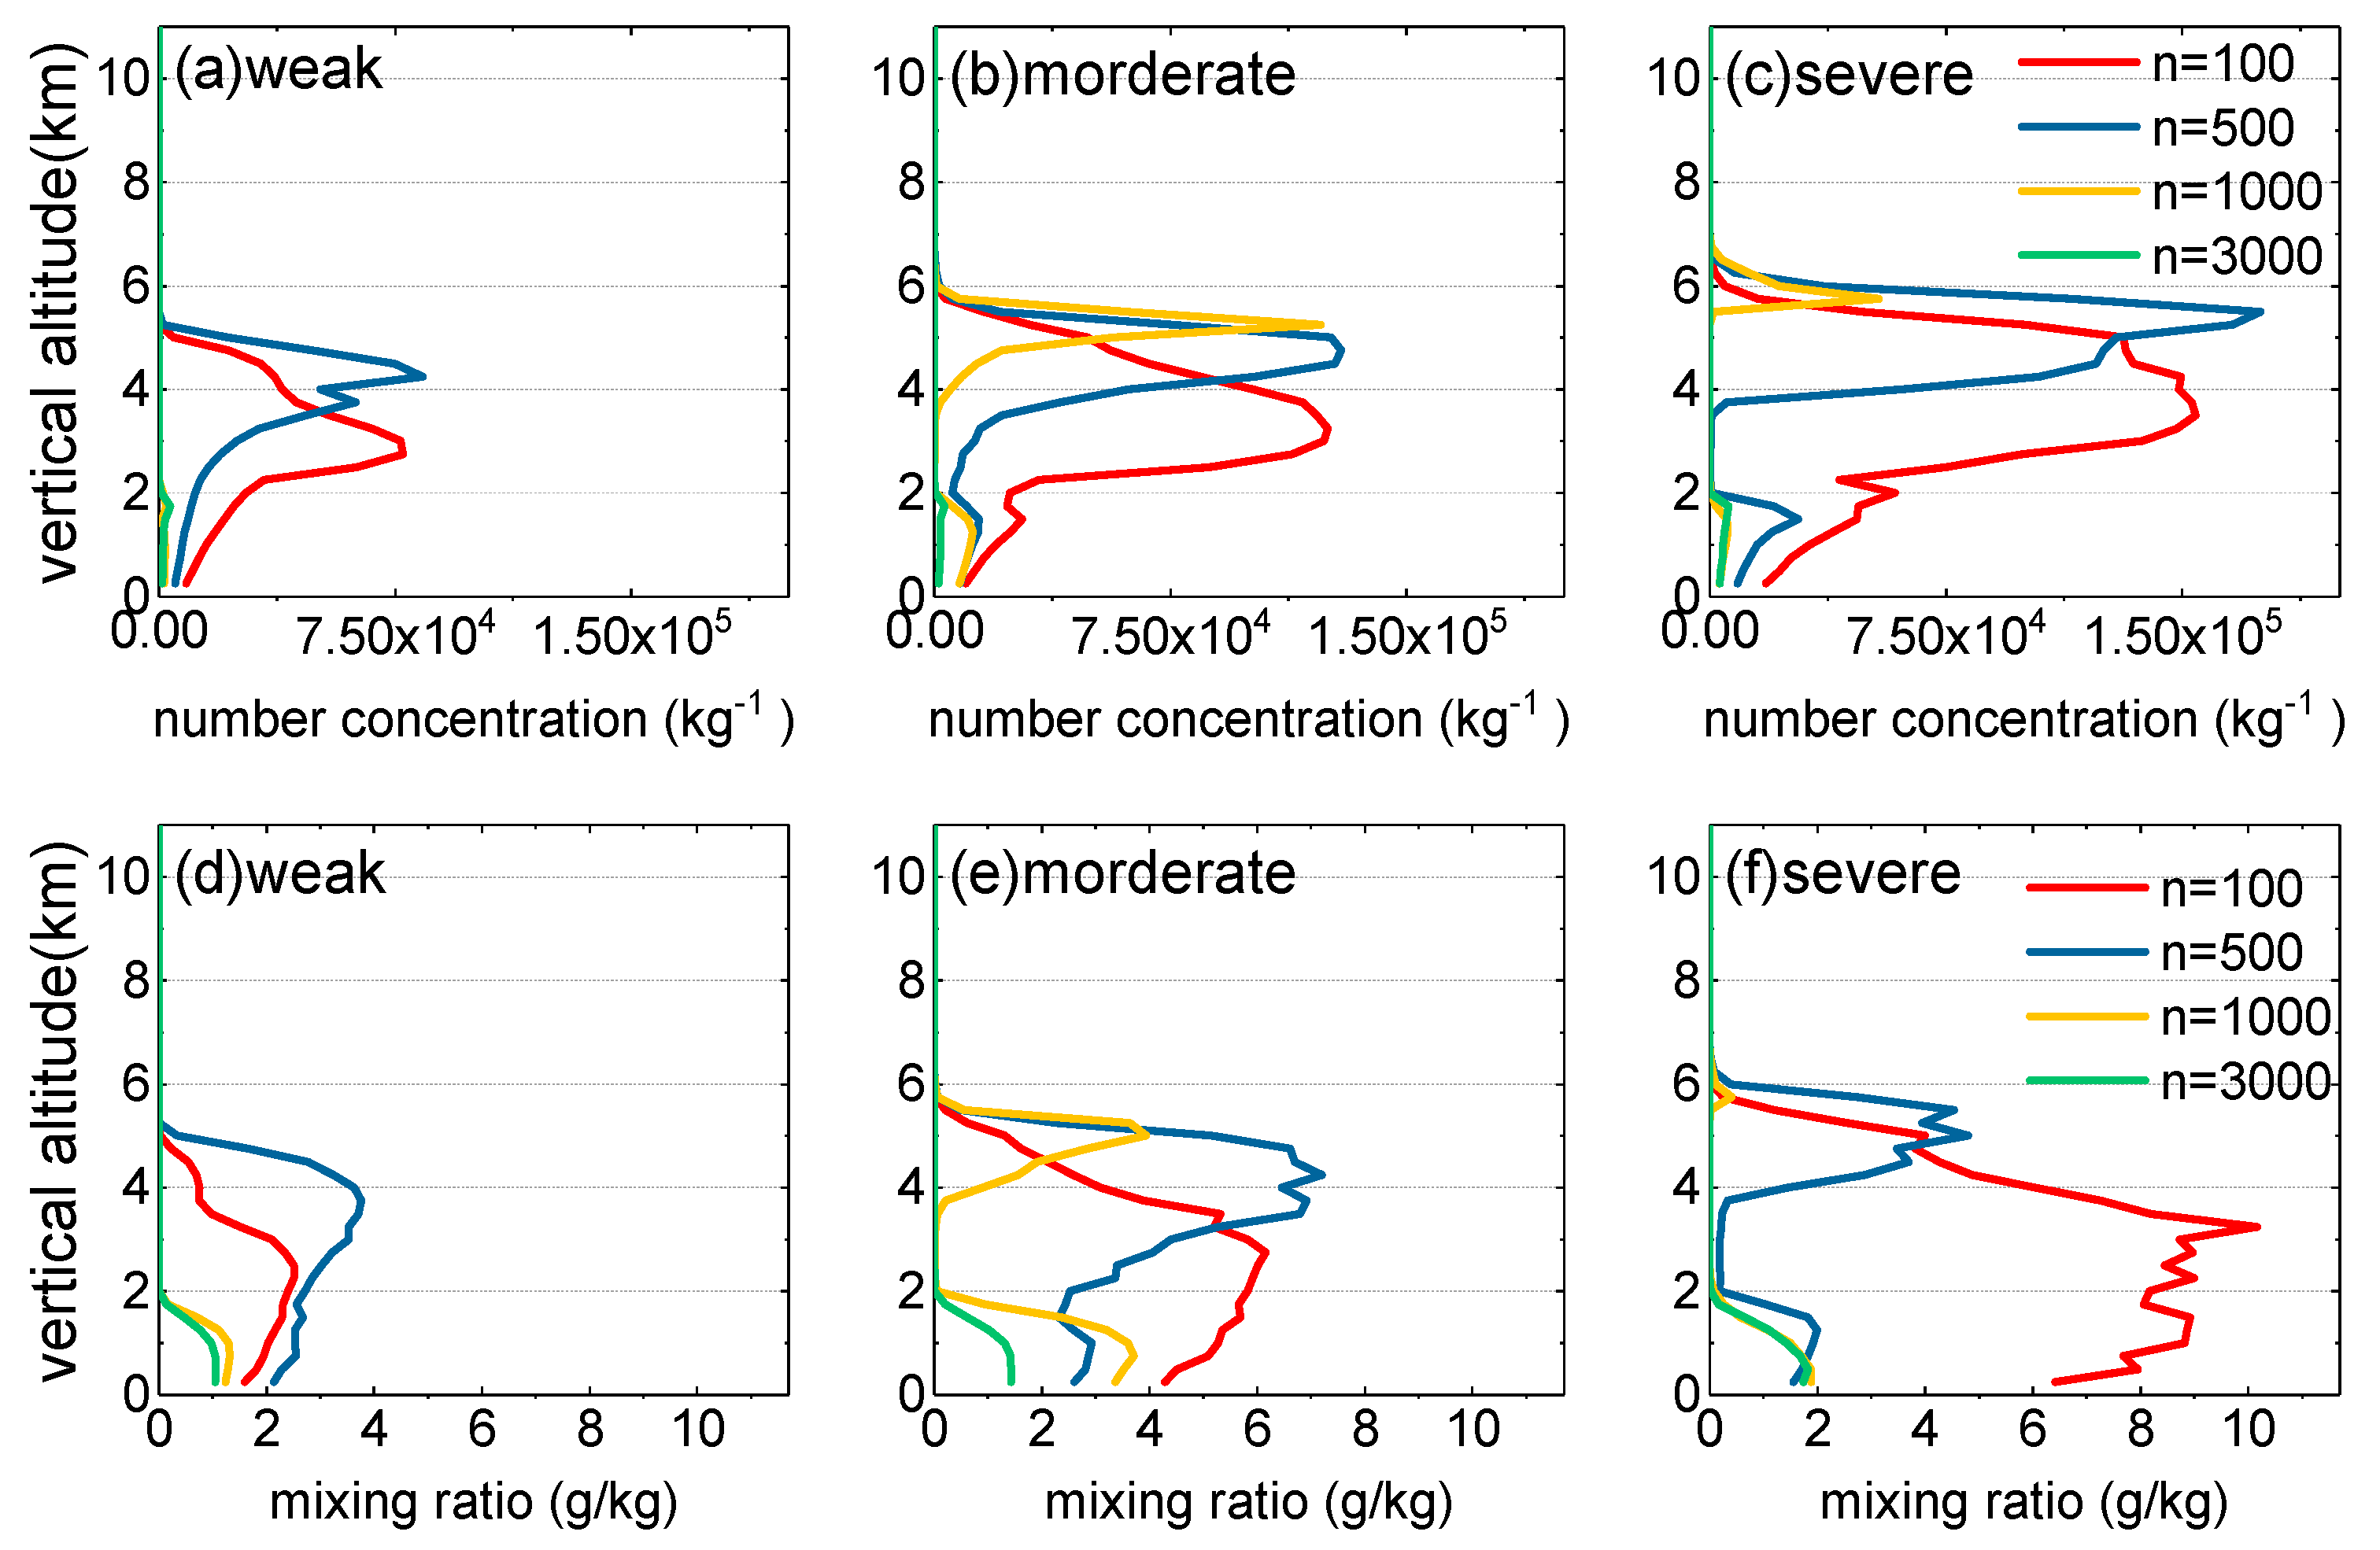
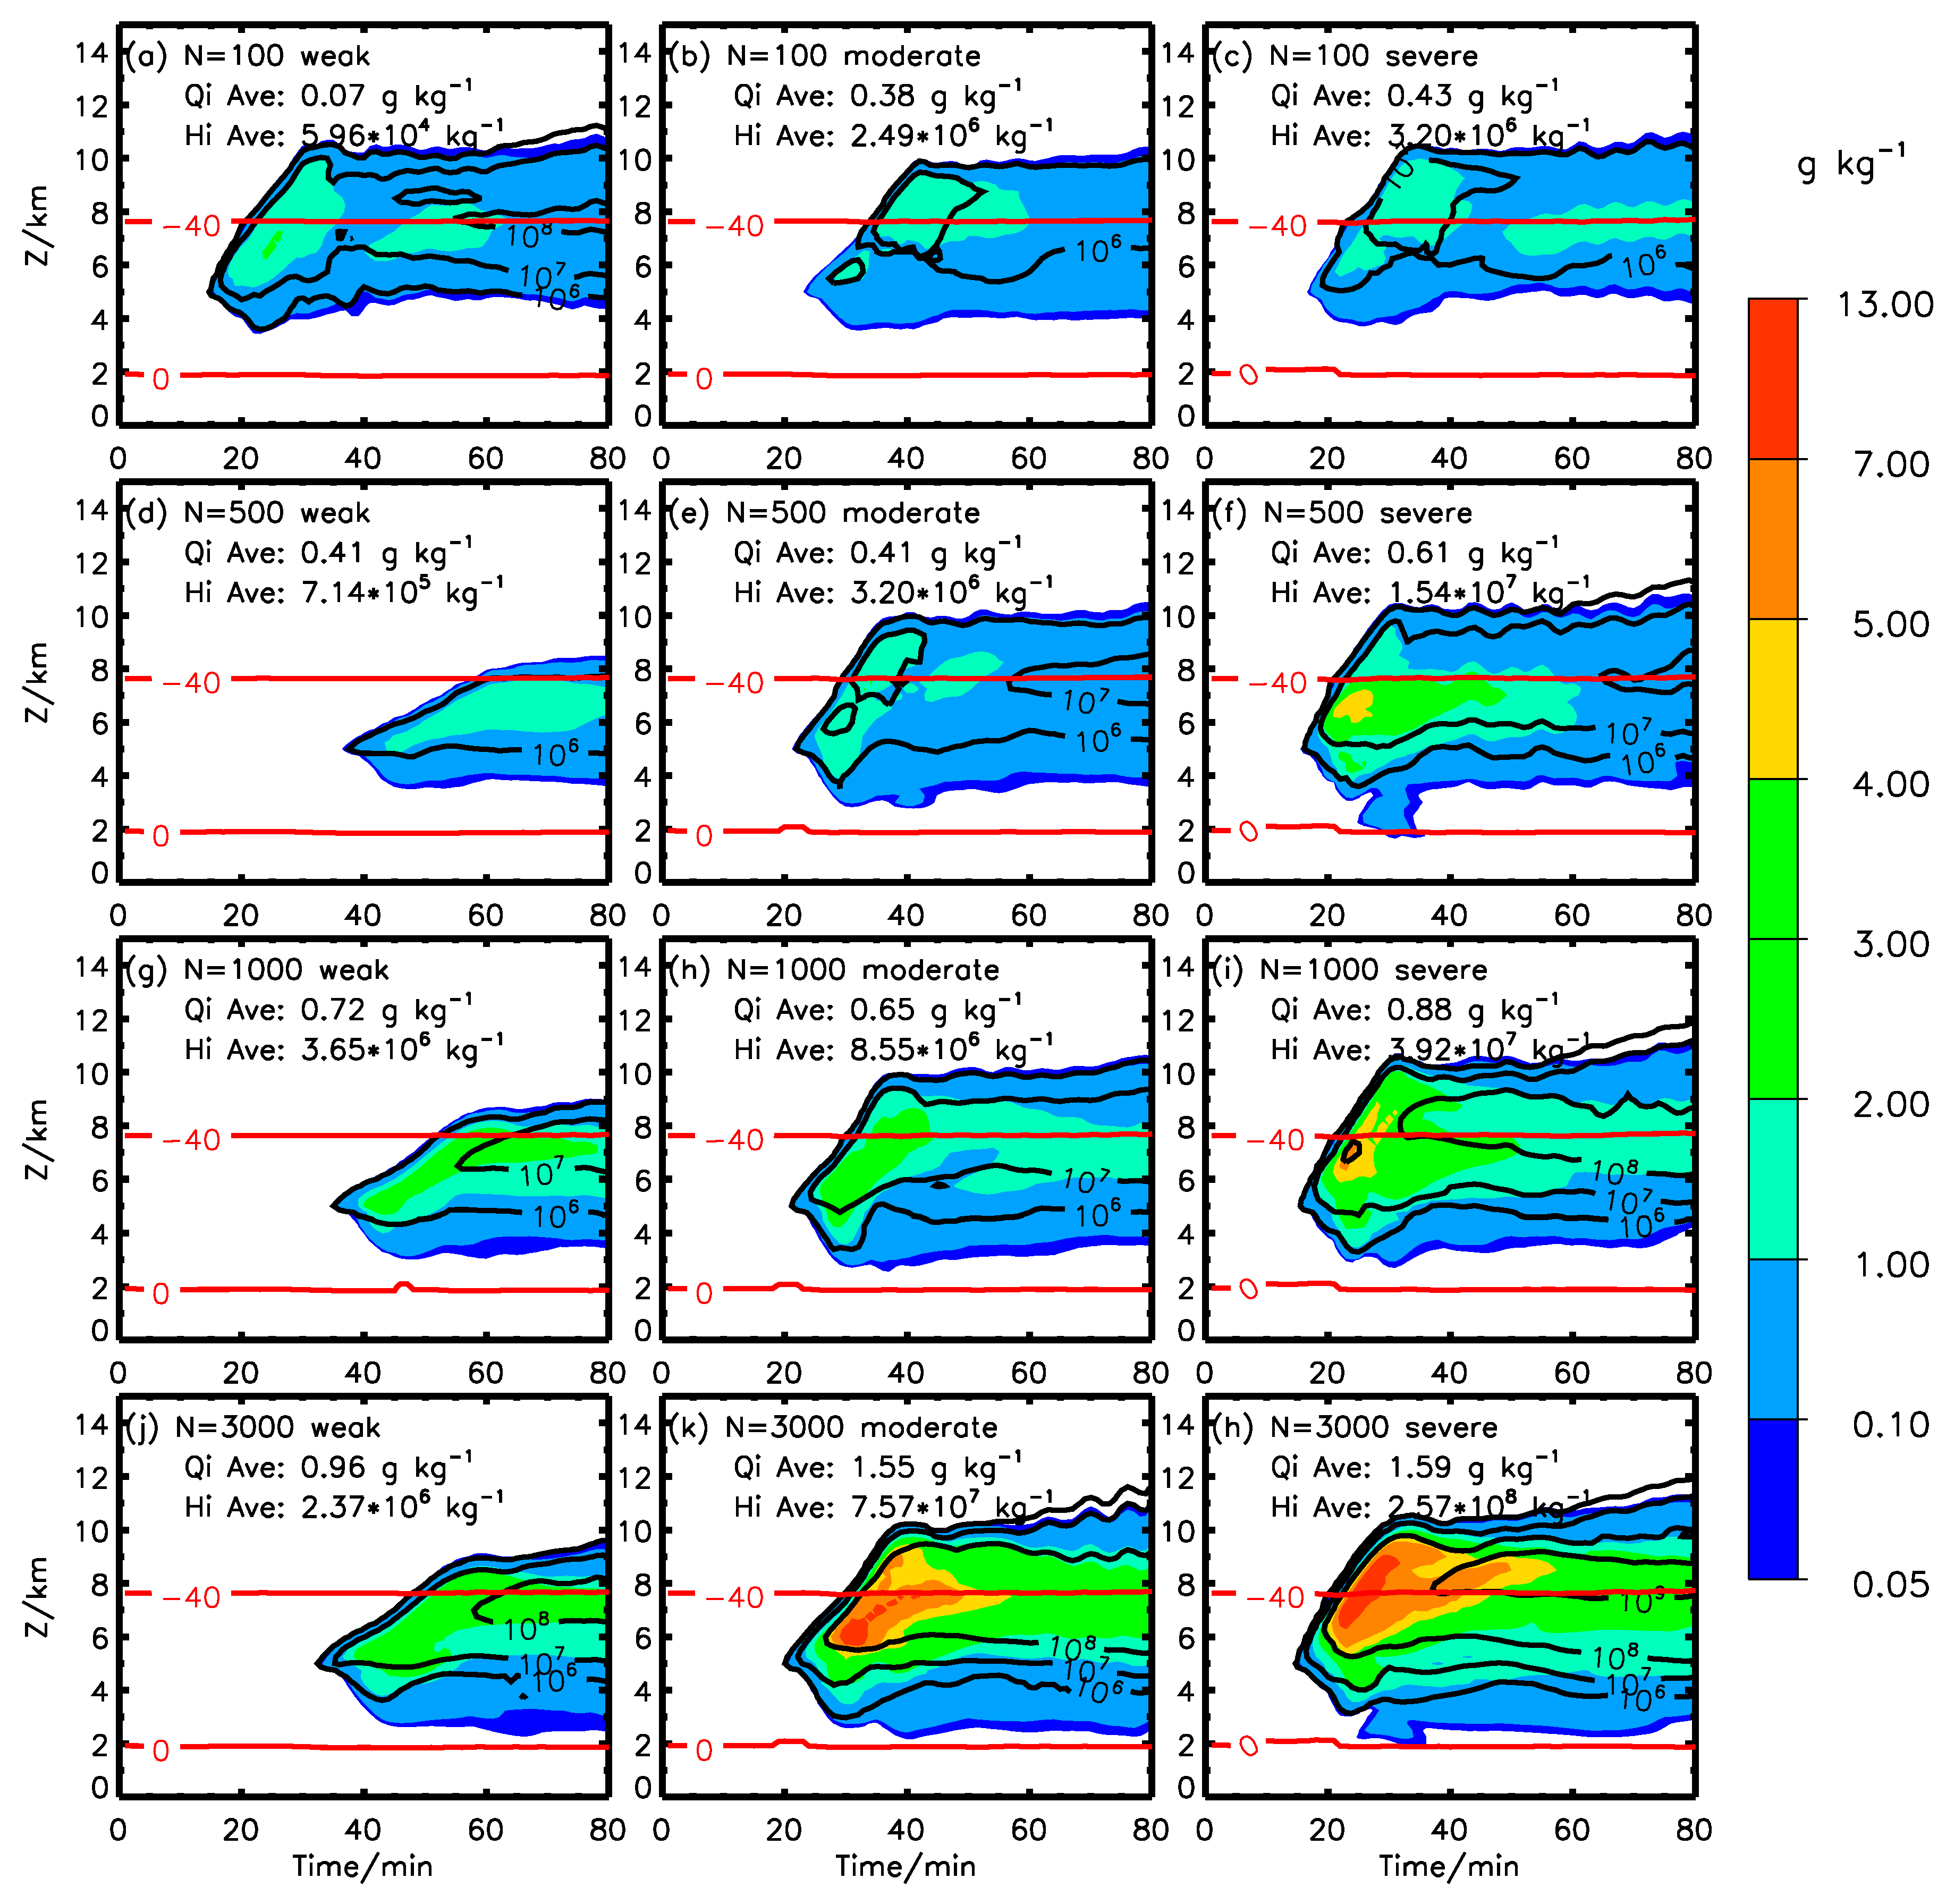
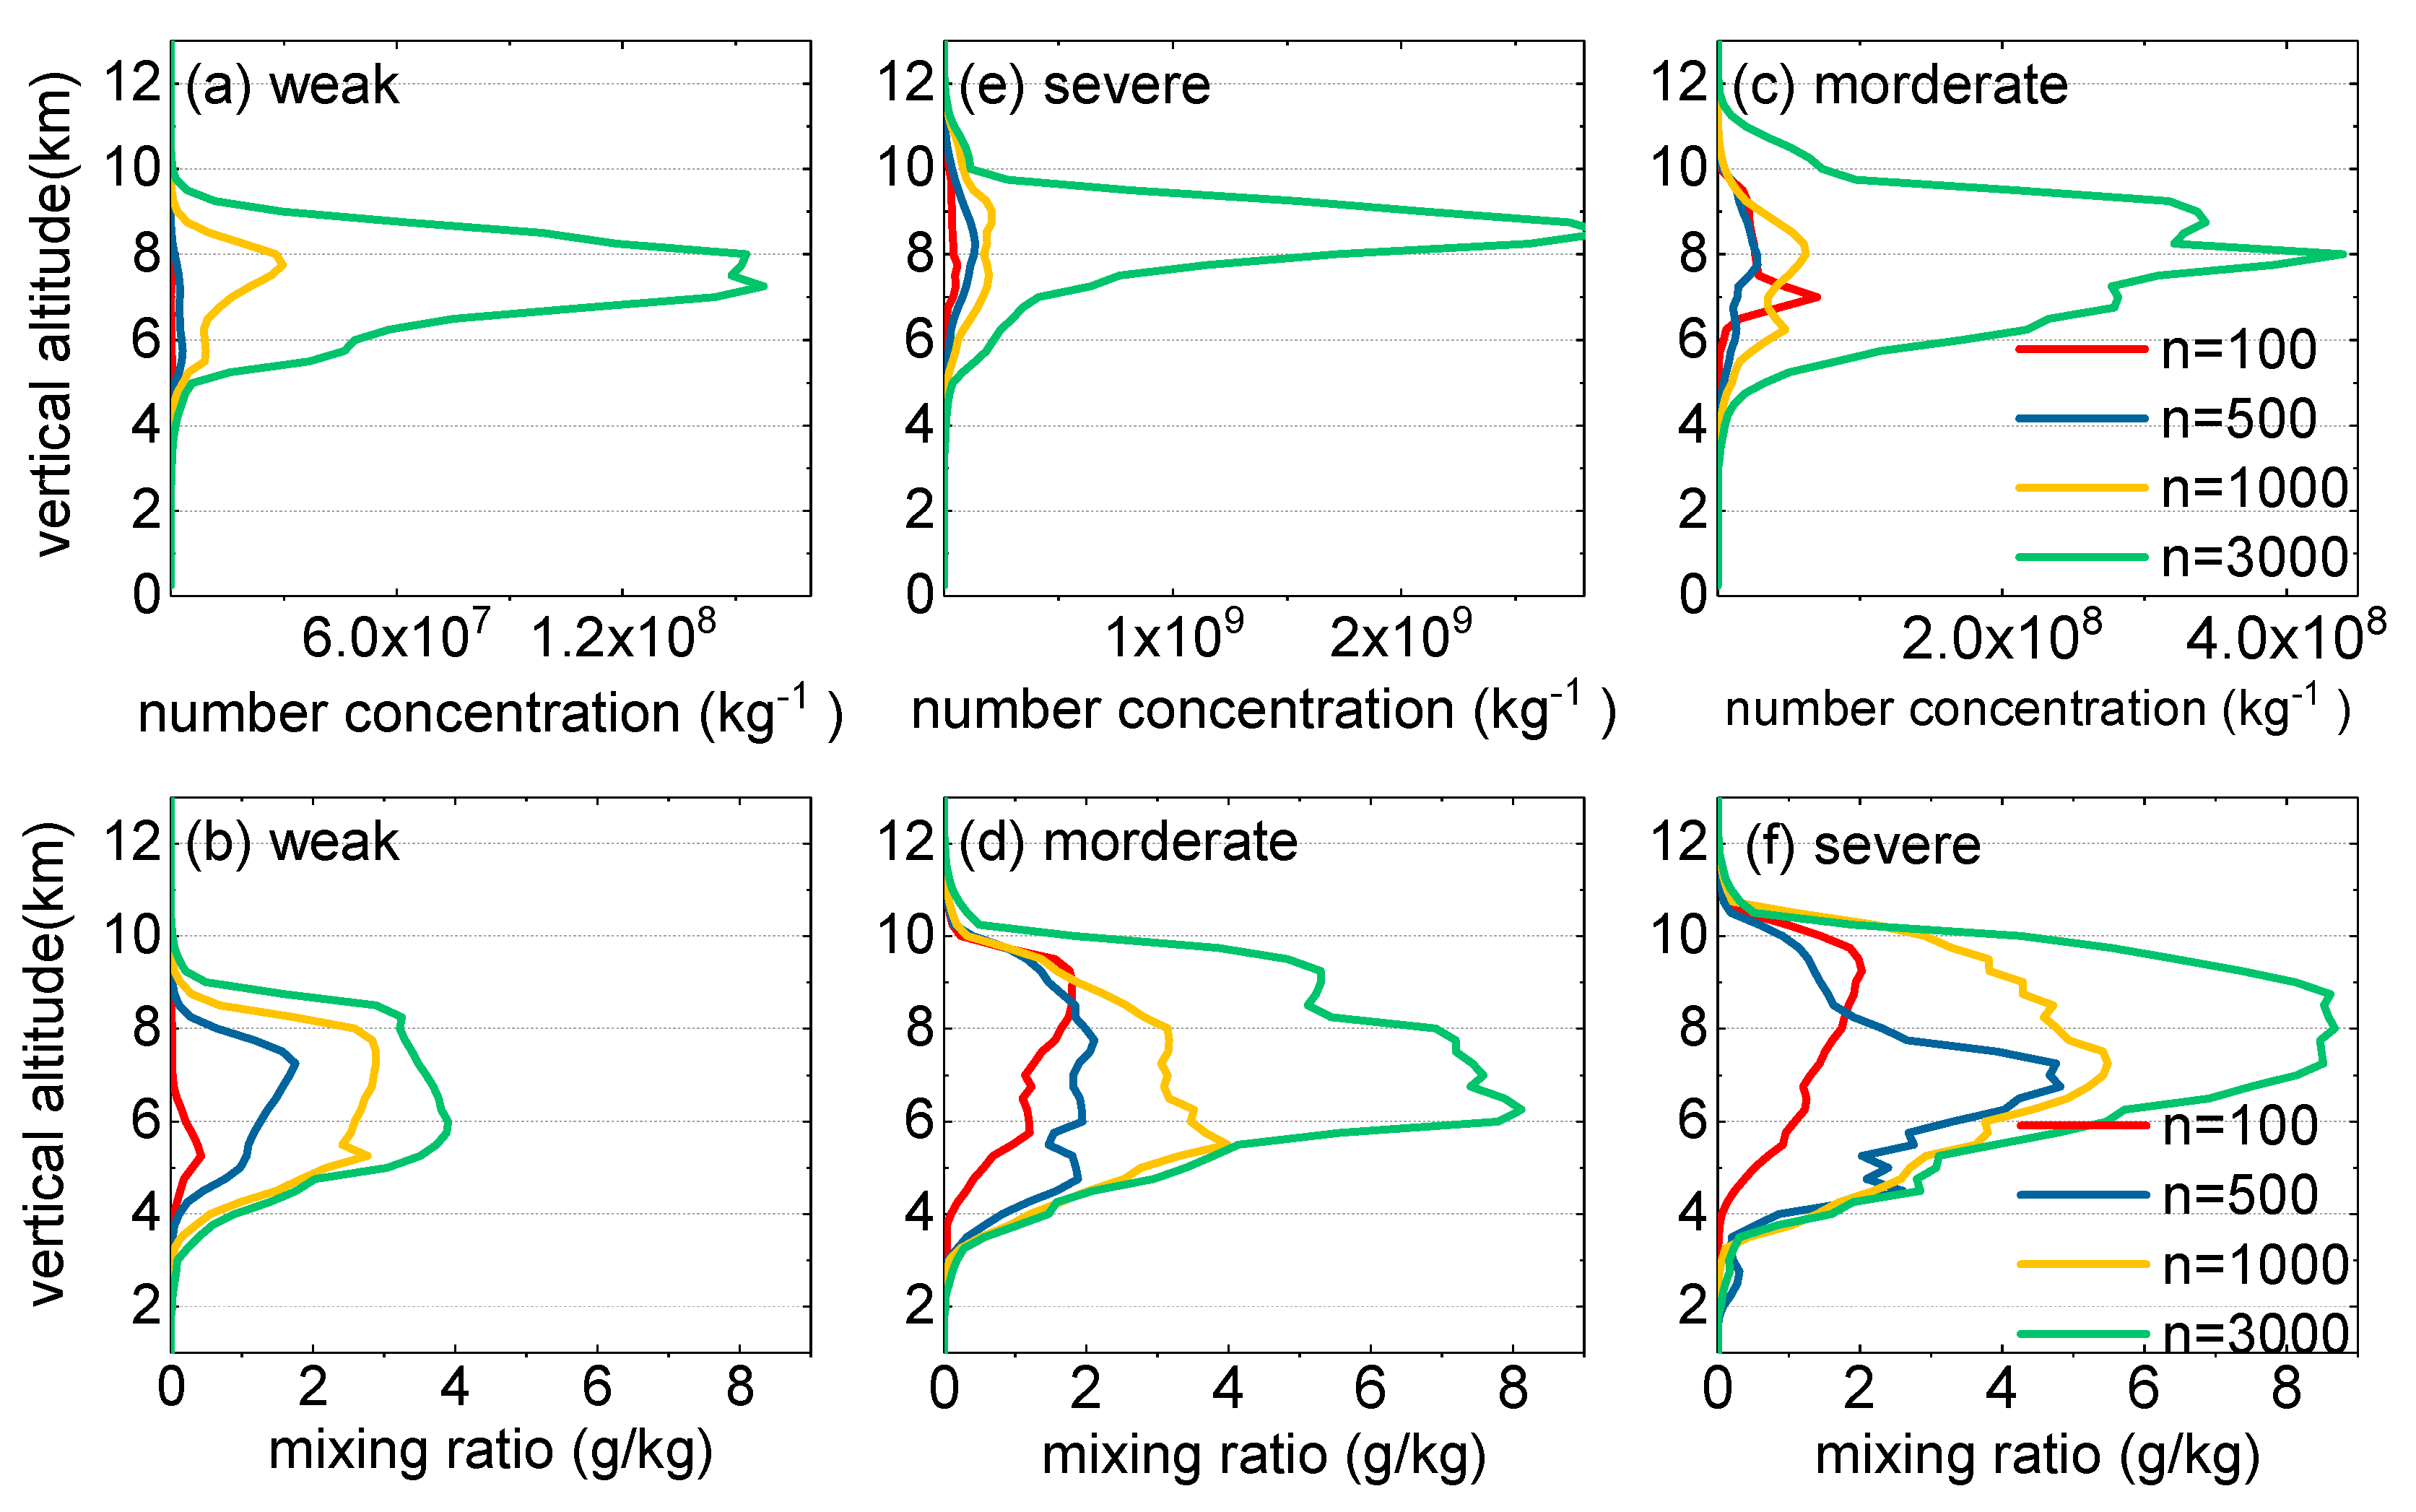
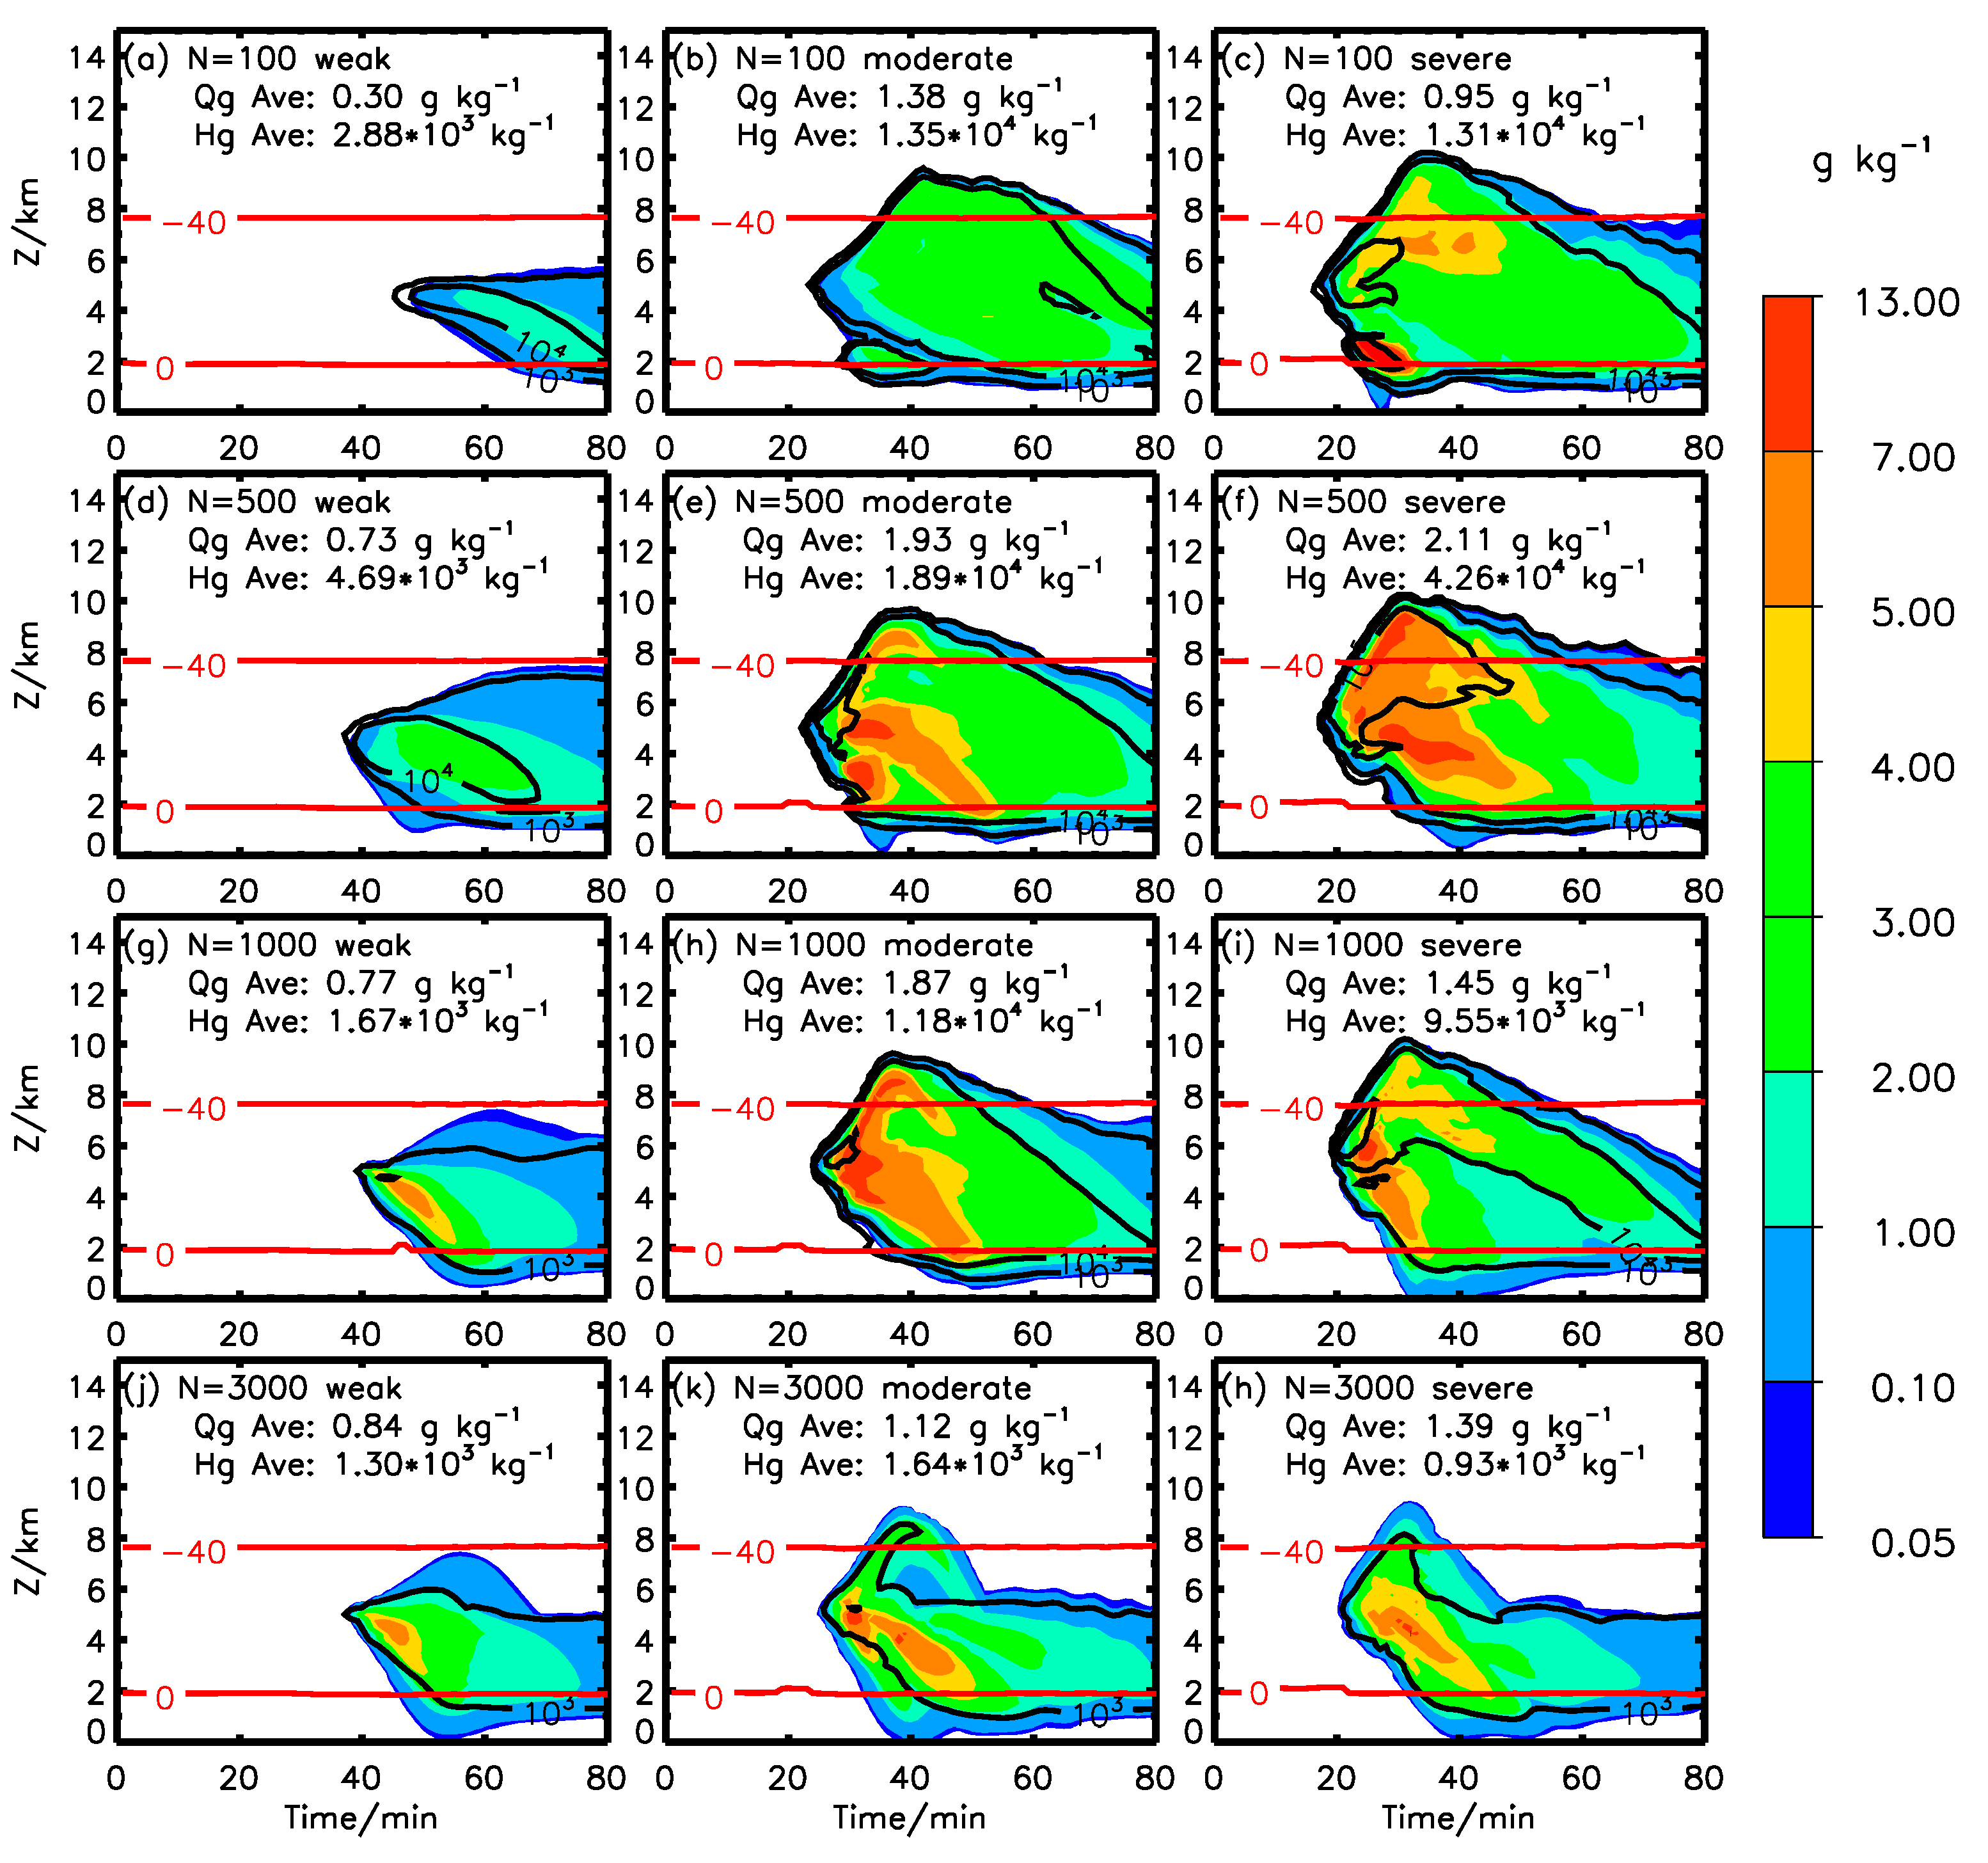
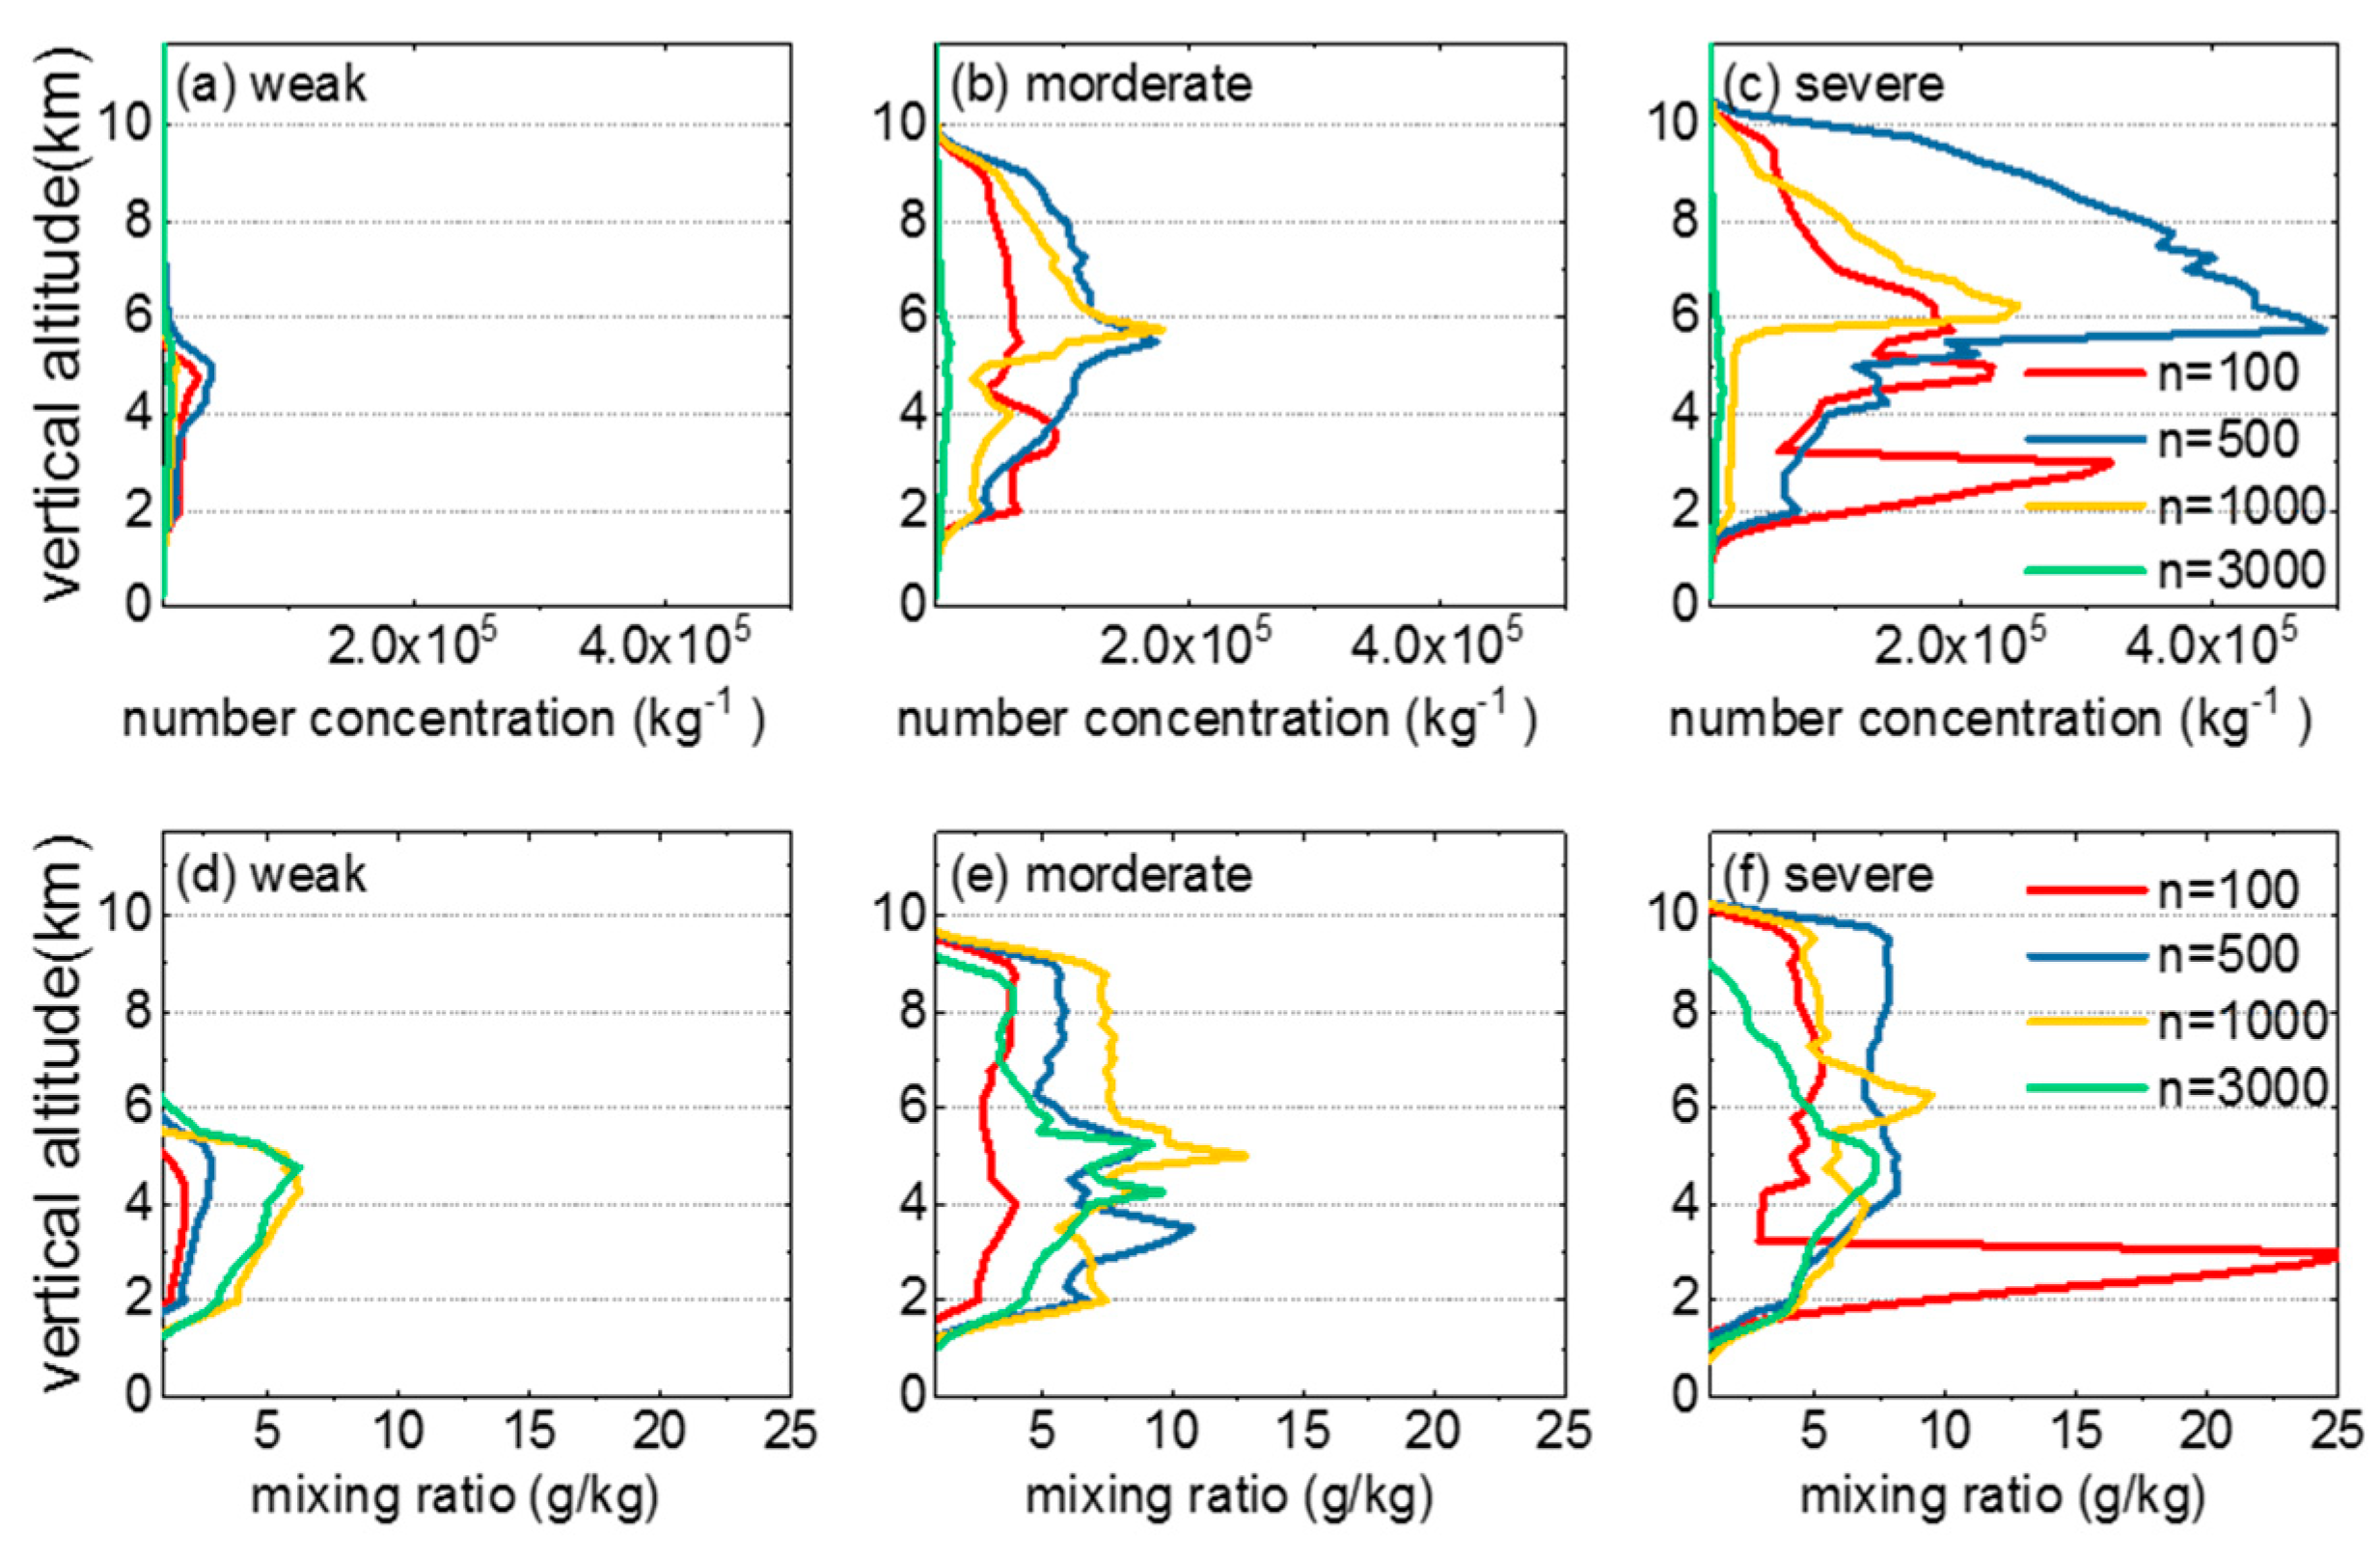
3.1. Dynamic and Microphysical Processes
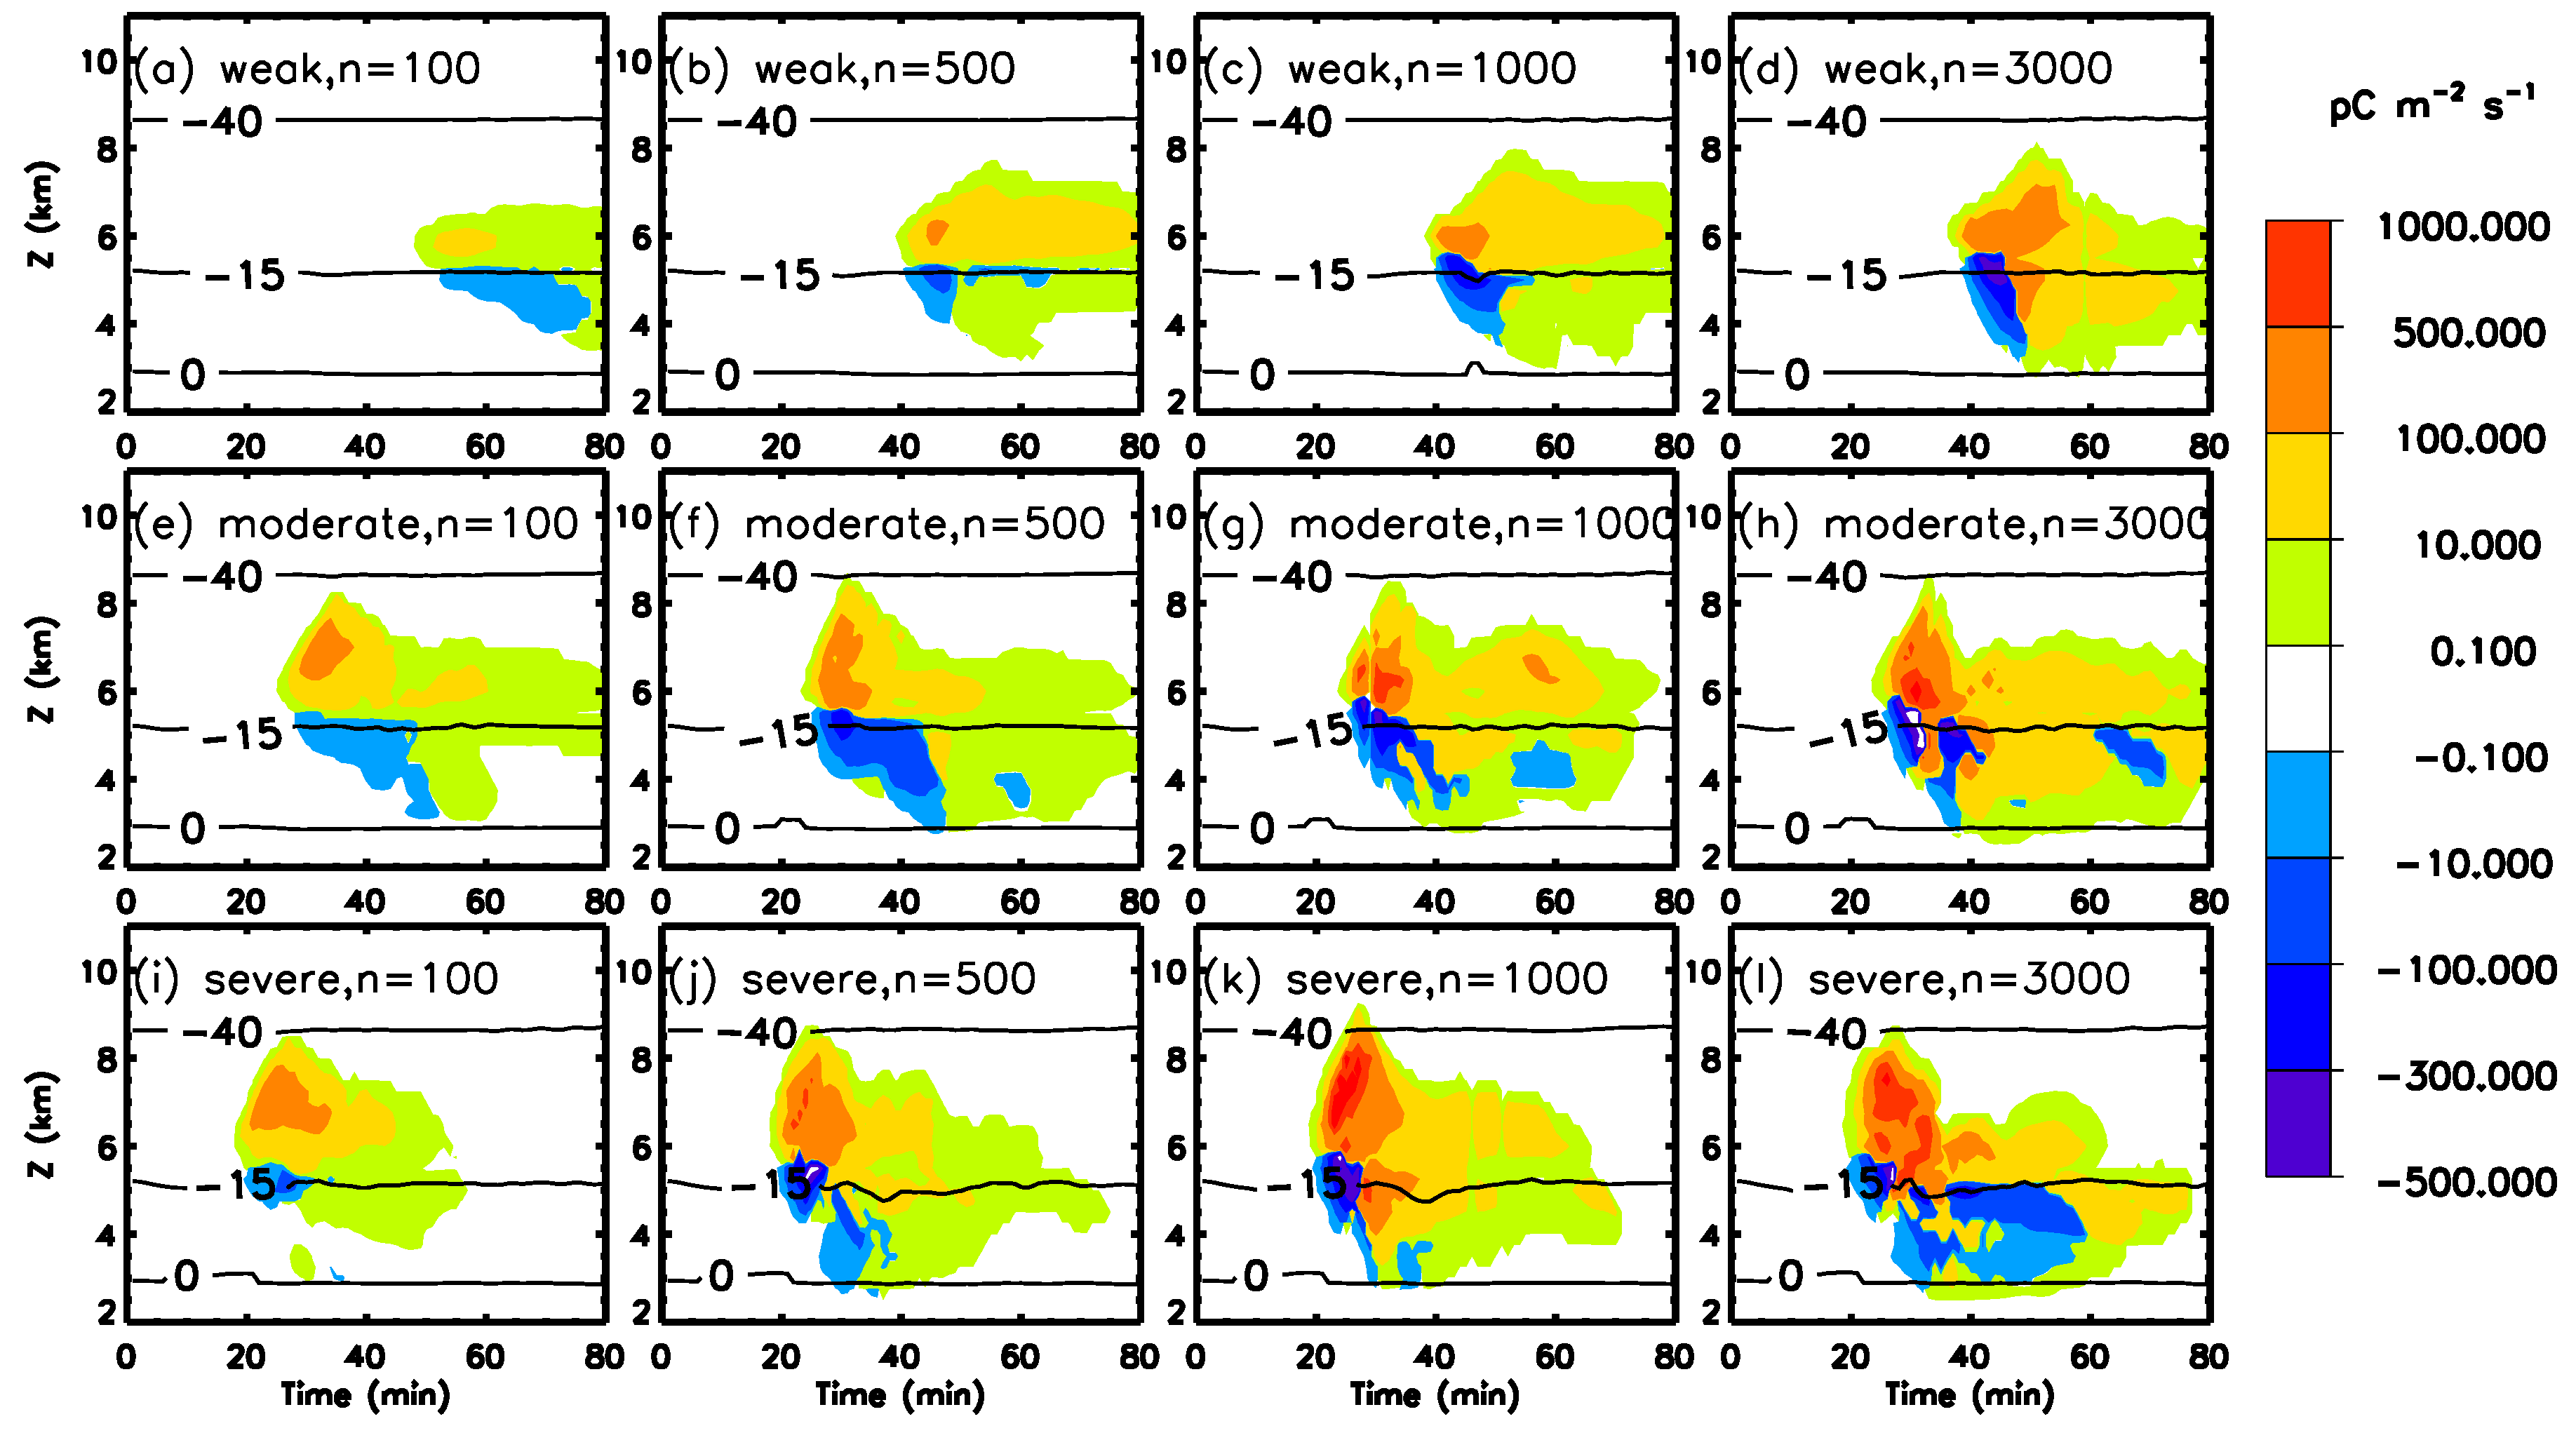
Three types of thunderclouds with 12 cases were carried out until the thundercloud dissipated (usually 80 min). The time evolution of maximum and minimum vertical velocities (see Figure 2) in 12 cases is roughly similar, and the variations in updraft and downdraft experience from quick enhancement to slow reduction. The maximum updraft velocity increases greatly when the intensity of thunderclouds increases from weak to severe (see Figure 2), primarily because of the dramatic convection activities. Similarly, the downdraft speed increases with thundercloud intensity increasing because of a larger mass loading of hydrometeors to decrease buoyancy in the stronger intensity thundercloud case [26,43,44]. In addition, in the weak thundercloud, the peak of updraft velocity arises in advance when CCN concentration is increasing (Figure 2a). With more latent heat released by the process of cloud droplets condensation, the maximum updraft speed increases from low CCN concentration to high CCN concentration, and similar characterization also can be found in the maximum downdraft speed. However, in moderate and severe cases, the updraft velocities in the case of N0 = 1000 cm−3 is stronger than that in the other cases. As the CCN concentration further increases to 3000 cm−3, the maximum updraft velocity keeps stable. This unusual instance only occurs in the condition of high CCN concentration and strong convolution, which is primarily because of the extreme conditions that are closely related to less latent heat released by different microphysical processes [14].
Figure 3 presents the variation of cloud droplet number concentration and mixing ratio with time in weak, moderate, and severe thunderclouds, respectively. With the increase of CCN concentration, the cloud droplet mixing ratio and number concentration both increase. Especially in the cases of 3000 cm−3 (see Figure 4a–c), the cloud droplets are produced in a large amount at the lower layer. The increase in cloud droplets number concentration is much stronger than the enhancement of the mixing ratio. For example, in the moderate thundercloud, when N0 = 100 cm−3, the average mixing ratio of cloud droplet is 0.56 g kg−1, the mean number concentration only reaches 4.75 × 10⁶ kg−1, but when N0 = 3000 cm−3, the average mixing ratio of cloud droplet is 0.97 g kg−1, and the mean number concentration is 9.83 × 10⁷ kg−1. In other words, a higher concentration of CCN will lead to a smaller scale of cloud droplets. This is consistent with previous research [21,23,45,46,47,48]. When the thundercloud development becomes more intense, the cloud droplet begins to decrease and disappears significantly in advance. In a weak thundercloud (Figure 3a,d,g,j), cloud top height is low and the cloud dissipates after 70 min, while in a severe thundercloud (Figure 3c,f,i,l and Figure 4c,f), the cloud top height is about 8 km and the cloud droplets dissipate after 45 min. The primary cause is that the stronger convective can lift the small cloud droplets to the colder region, promoting the conversion of cloud droplets to ice phase particles. Therefore, cloud droplets will be consumed during this process.
It can be found from Figure 5 that the thundercloud with strong violent activity promotes the formation of raindrops significantly, and the precipitation formation also arises in advance. In the case of 100 cm−3, the formation time of raindrops advances from 24 min in the weak thundercloud to 18 min in the severe thundercloud. This is explained by a stronger convection intensity that leads to a quicker warm rain production by auto-conversion of cloud droplet-rain and the collection of cloud droplets by raindrops [47,49,50,51,52]. Additionally, a higher concentration of CCN reduces raindrop number concentration and mixing ratio, and stronger thundercloud leads to a more obvious reduction (see Figure 5g,j–l). In high CCN cases, raindrops are mainly distributed below the melting layer. Most of the raindrops are produced in the mature phase of the thundercloud, which is caused by the melting of ice particles. The high concentration of CCN reduces the collision efficiency of cloud droplets, the automatic conversion rate of cloud to rain decreases, and reduces warm rain coalescence. Therefore, most of the precipitation comes from the later melting of ice particles. It also can be seen from Figure 6 that the production of the raindrop is reduced with increasing CCN, and especially the raindrops residing in the high region are hindered by the inefficiency conversion of cloud droplets to raindrops. Many studies have shown that the decreased precipitation of warm clouds with increasing CCN support this idea [22,47,48].
As illustrated in Figure 7, the thundercloud in three types with higher CCN concentration produced a larger ice crystals content, which increases from the low-intensity case to the strong-intensity case. From Figure 8c,f it can be seen that the convective intensity increases the number concentration of ice crystals, and the high concentration center rises from 6 km in the weak thundercloud to 8 km in the severe thundercloud. Some ice crystals are initiated from vapor deposition onto ice nuclei, and some ice crystals are produced during graupel riming collection of cloud droplets with a diameter greater than 24 μm. The homogenous droplet freezing is also a major contributor to ice crystal production. The high CCN concentration case is associated with more cloud water content lifted by stronger updrafts, and thus it is favorable for ice nucleation, droplet freezing, and the collision between ice crystals and cloud droplets. Therefore, the content of ice crystals increases significantly with increasing CCN concentration. In addition, the reduction of ice crystals’ size in high CCN cases is primarily associated with the process that a host of small cloud droplets can be frozen to ice crystal, thus significant cloud water competition hiders the growth of ice crystals. It should be borne in mind that the response of ice crystals’ microphysical characteristics to CCN concentrations is similar in the different intensity thunderclouds, as found Khain et al. [53] and Yang et al. [54].
Since the liquid water lifted by strong updraft led to the rapid growth of ice crystals, graupel is firstly produced by the auto-conversion of ice-graupel. Thereafter, the collisions between the liquid droplets and ice particles play a signification role in the development of graupel growth [21,22]. It can be seen from Figure 9 that the graupel particles are produced in advance with increasing thundercloud intensity. For example, the occurrence time of graupel in the cases (the CCN concentration is 100 cm−3) is from 48 min in weak thundercloud to 18 min in severe thundercloud (Figure 9a–c). When the CCN concentration increases, the production of graupel is strong at first and then tends to become weak. For example, the peak content of graupel arises at about 42 min in the case of 1000 cm−3 (weak thunderclouds) (Figure 9g,j), and the vertical distribution of maximum mixing ratio and number concentration is similar to those in the case of 1000 and 3000 cm−3 (Figure 10a,d). While in moderate thunderclouds, the average concentration (1.89 × 10⁴ kg−1) and the average mixing ratio (1.93 g kg−1) of graupel reach a peak in the case of 500 cm−3 (Figure 9e) which is similar to the case with CCN concentration of 1000 cm−3 (Figure 9h). From Figure 10b,e, it also can be found that the production of graupel in the case of 500 and 1000 cm−3 is significantly larger than that in the other cases. In severe thunderclouds, the content of graupel reaches a peak in the case of 500 cm−3 (Figure 9f) and it is obvious that the residence area of graupel in the severe case of 500 cm−3 is much larger than that in other cases. Overall, deeper convection and less CCN concentration can accelerate the development of graupel, but an extremely high concentration of CCN would result in weakening the formation of graupel. In the initial state, the CCN particles are fully activated under the sufficient water vapor condition, and a large number of ice crystals are formed through vapor deposition and condensation freezing. This promotes the auto-conversion of ice crystal to graupel and the collision coalescence between the liquid droplets and ice particles, leading to more graupel produced. However, when the concentration of CCN reaches a certain extent, due to the consumption of water vapor by precipitation, the water vapor supply is reduced, which drives the competition between ice crystal and graupel to available water vapor. Therefore, a high concentration of CCN reduces the size of ice crystals, hindering the conversion of ice crystals to graupel. In addition, the variation of graupel is very similar to that of the maximum updraft. The development is the most vigorous among three cases, where the CCN concentration of weak thundercloud is 3000 cm−3, the CCN concentration of moderate thundercloud and severe thundercloud is 500–1000 cm−3. Therefore, the process that leads to the decrease of maximum updraft is likely to be the microphysical development of graupel. The formation of graupel is reduced by high concentration CCN and deep convection so that the latent heat released decreases and the maximum updraft becomes weaker.

3.2. Charging Rate

The electrification process of the thundercloud is based on the non-inductive electrification mechanism of ice crystals and graupel particles and the inductive charging between graupel and cloud droplets [42]. Therefore, the concentration of graupel is one of the key factors affecting the electrification process [55]. From the analysis in the previous section, we know that the cloud droplets, ice crystals, and graupel are sensitive to CCN concentration, so the change of those hydrometer particles should lead to a different electrification process with different CCN concentrations. The time evolution of the non-inductive charging rate is given in Figure 11. The negative non-inductive charging rate of all cases roughly resides between 3 and 5 km (0 to −15 °C), while the stronger production of ice particles makes a greater contribution to actively positive non-inductive charging. Non-inductive charge separation in the weak-case starts at 40 min, while in the severe-case charge separation occurs at an earlier time of 18 min, implying the great electrification is closely connected with heavy convection. In addition, the non-inductive charging rate demonstrates a complex trend with CCN concentration increasing. In four cases of the weak thundercloud, higher CCN concentration makes the vertical distribution of non-induced electricity wider, while in the moderate thundercloud and severe thundercloud, the time evolution of the non-inductive charging rate in the case of 3000 cm−3 shows the complex trend, which is roughly similar to that in the 1000 cm−3 case. The complicated evolution of the charging process is because of the distribution of mixed-phase hydrometer particles produced from strong convection.
To further show the characteristics of induction and non-induction charging rates, the induction and non-induction charging rates of the 12 cases are listed in Table 1. The increase non-inductive charging rate with CCN concentration increases is well correlated to the stronger convection. The charge separation parameterization depends on graupel–ice collisions in mixed-phase updrafts [22]. Therefore, the change in charging rate means that stronger production of small ice crystal and graupel related to CCN concentrations ranging from 100 to 1000 cm−3 and deep convection can enhance non-induction electrification and lightning processes. Note that under extreme conditions (3000 cm−3 cases of severe thunderclouds), the positive non-inductive charging keeps steady, but the negative non-inductive charging rate is reduced from −1724.95 to −1289.69 pC m−2 s−1. From the analysis in the previous section, it can be found that the production of graupel particles at higher CCN concentration (1000−3000 cm−3) and deep convection is reduced by vapor competition, but more ice crystals are still able to improve the collision efficiency, thus the non-induction charging process is gradually enhanced. When the CCN concentration is over 3000 cm−3, the decrease in ice crystals’ size and the small supply of graupel is likely to hold the answer to the decrease of the non-induction charging rate. This also shows that the amount of charge separated is associated with ice crystals’ concentration and size spectrum, which means stronger particle formation led to a higher non-induction charging rate [22,33,56].
The collision of the non-induction electrification process between ice particles enhances the environmental electric field, and induction electrification begins to occur with strong electric fields. Figure 12 shows the time evolution of inductive charging rates by graupel. The inductive charging rate is smaller than the non-induction charging rate, and greater production of cloud droplet and graupel below the attitude of 6 km leads to stronger inductive charge separation in higher CCN cases. The maximum positive and negative inductive charging rates in Table 1 depends on the amount of charge acquired from graupel. From the table and Figure 12, one can conclude that the charge separation reduces sharply from 100 to 1000 cm−3 and then increases in the moderate and severe thundercloud. As we all know, the charge transfer processes caused by the collision of graupel and cloud droplets can be significantly influenced by the non-induction electric field. With CCN concentration increasing from 100 to 500 cm−3 (four cases in moderate and severe thundercloud), the production of cloud droplet and graupel is increased, and the enhanced electric field is explained by the stronger non-induction electrification process, which causes the steady increases of inductive charging rates. However, the supply of graupel is restricted at higher CCN concentration (1000 cm−3), resulting in the weak inductive charge separation. Figure 12g,k shows a smaller distribution of positive inductive charging rate. The studies on the electrification mechanism point out that the inductive charging process is weak, and the non-induction charging process plays a major role in the whole electrification process [22,37]. Therefore, when the concentration of CCN increases to 3000 cm−3, the influence of the vertical electric field from non-inductive charge enhancement is dominant, implying that the inductive charge separation process exhibits an obvious enhancement.

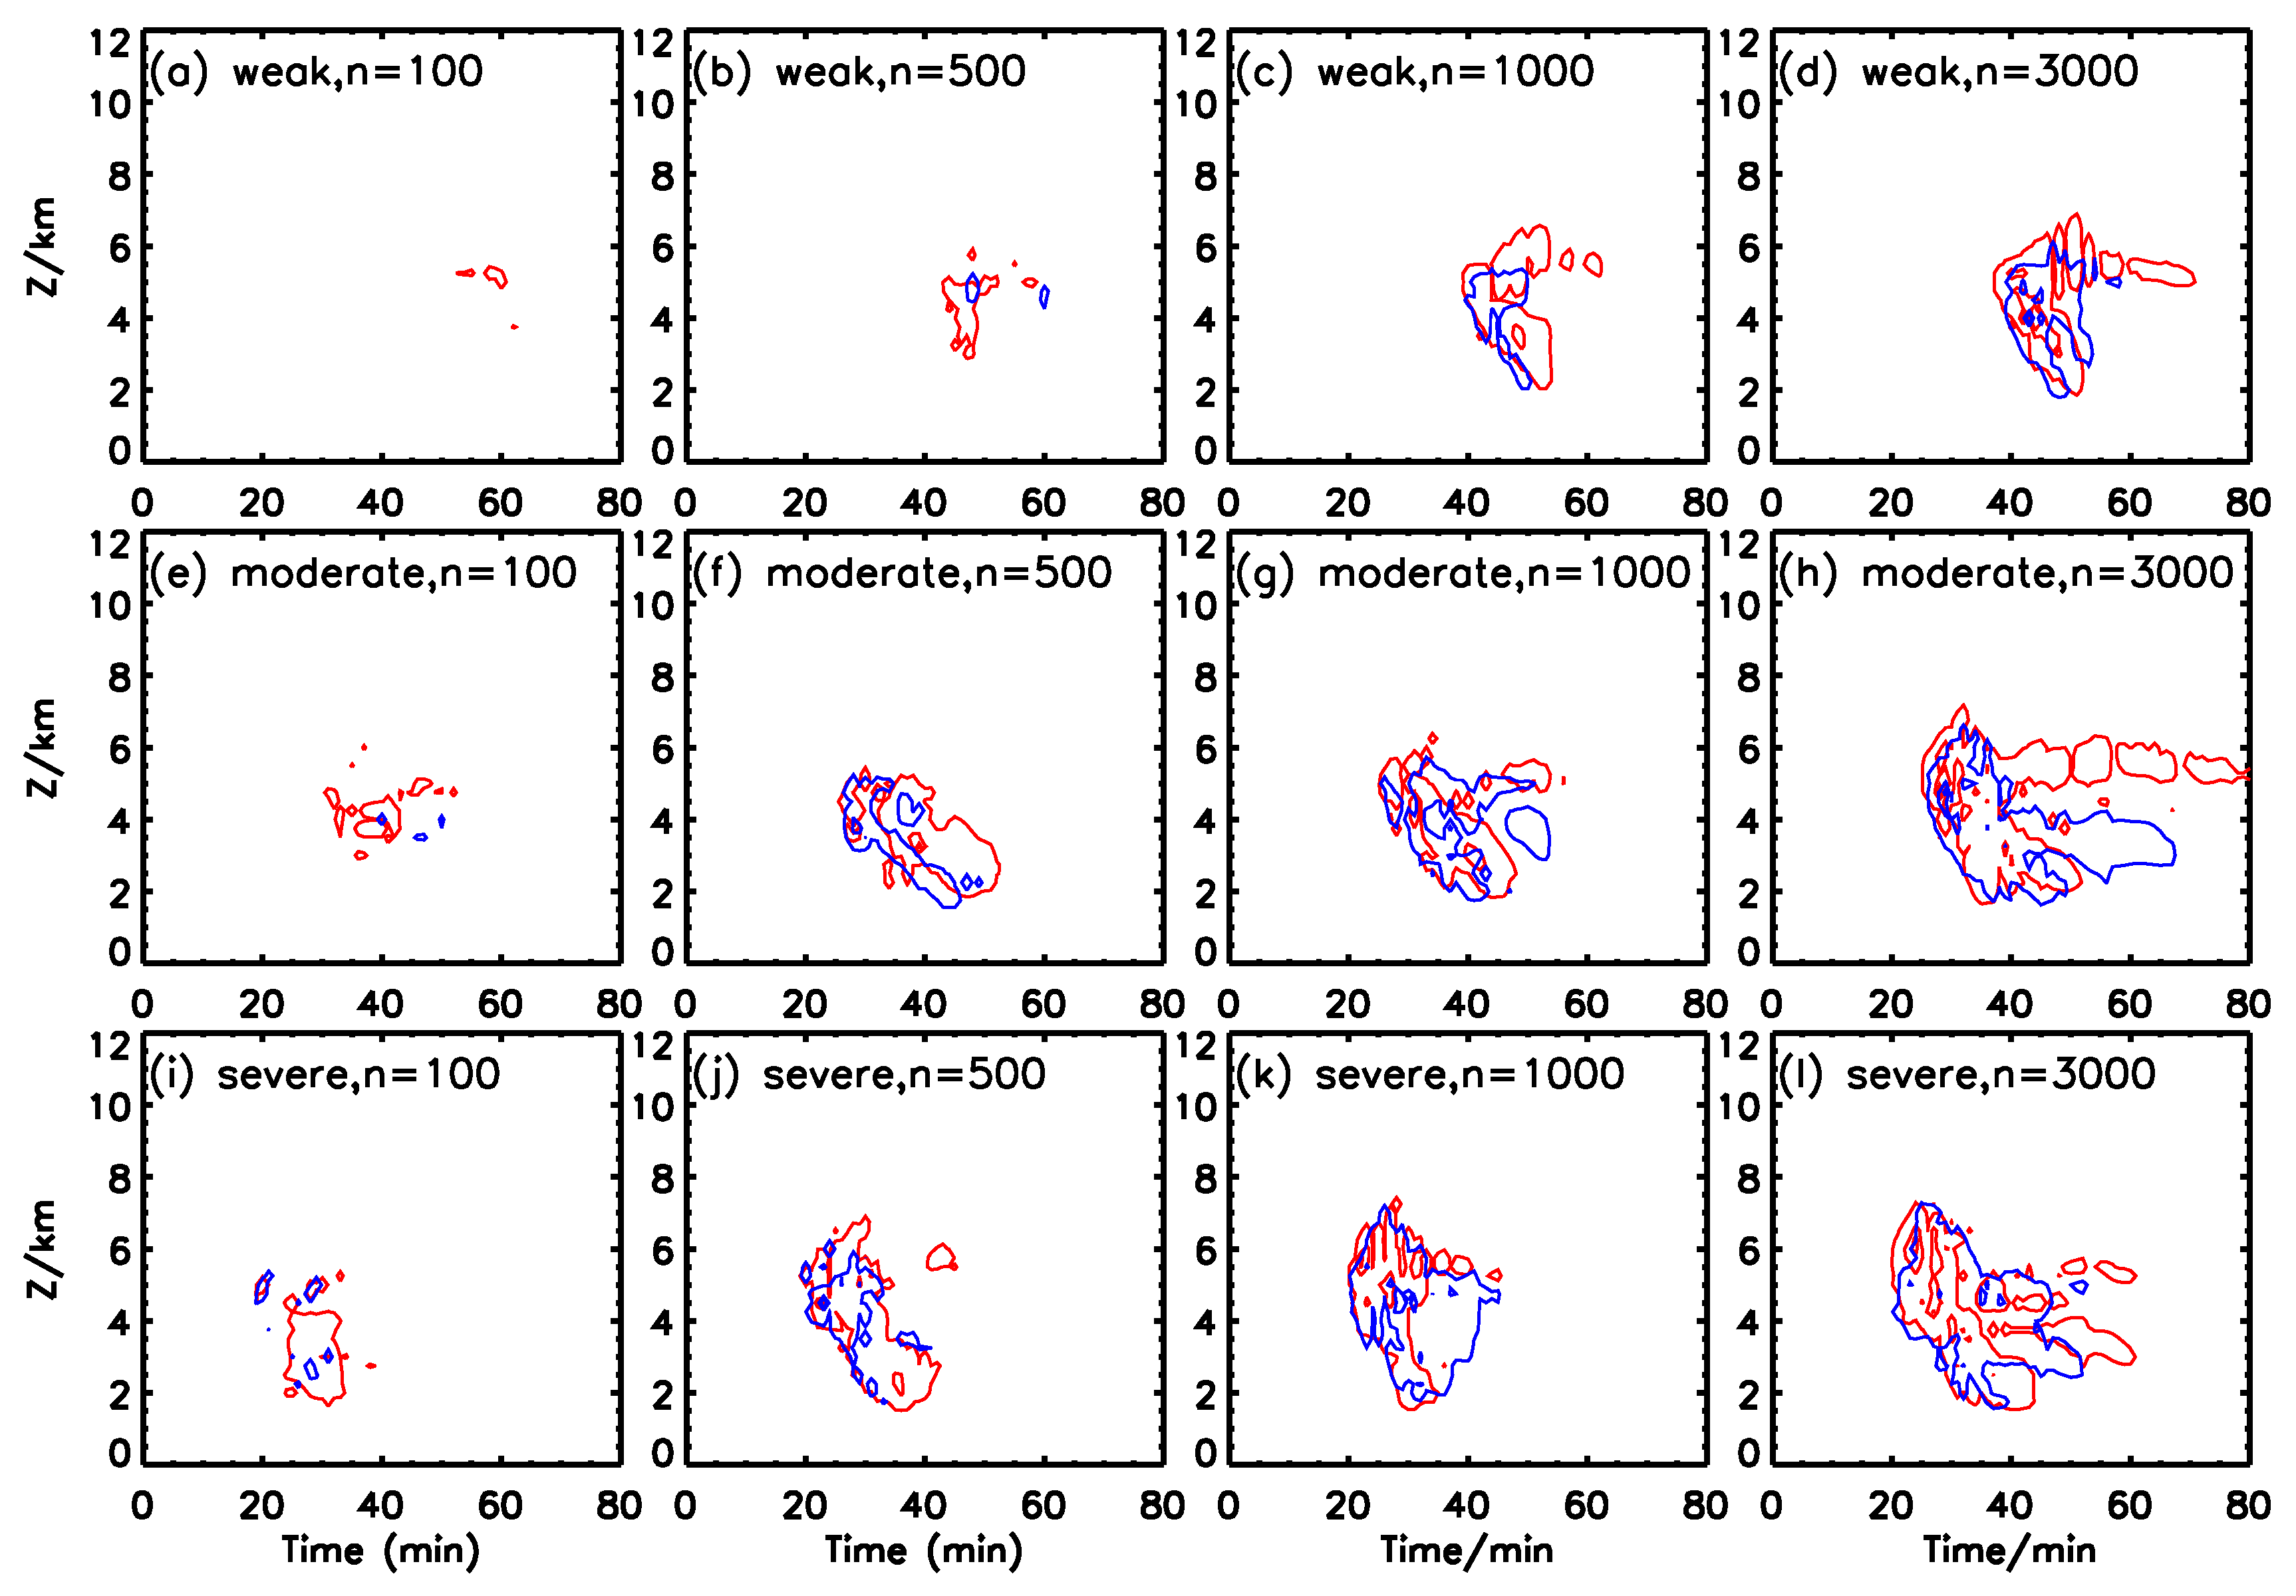
3.3. Electrification Charge Structure

The evolution of charge structure that depends only on charge separation at each minute is shown in Figure 13. In the very early electrical development stage, all storms depict a dipole charge structure (positive charge above negative), which maintains a positive charge at higher altitudes (5–8 km), with negative charge raised by enhancement of convection at 4–5 km. However, with the increase of CCN concentration, the enhancement of convective intensity and the process of lightning, the charge structure becomes more and more complex. The weak thundercloud with no lightning and low CCN (100 cm−3) shows a stable normal dipole structure (Figure 13a). As shown in Figure 2, the maximum updraft speed in the weak thundercloud is less than 10 m s−1, so the cloud height is limited, and the positive charge region is corresponding to ice crystals which are charged positively during the non-inductive electrification process. The negative charge region of a weak storm is composed of graupel that is negatively charged above the anti-rotation temperature layer and ice crystal which is negatively charged under the anti-rotation temperature layer. However, other cases depict a tripole structure with a relatively weak lower positive charge before first lightning. The bottom secondary positive charge region is coincident with the non-inductive graupel carrying positive charge below the inversion temperature layer. In these cases, the secondary positive charge region at the bottom of the thundercloud with low CCN concentration and shallow convective (Figure 13b–d,g) gradually disappears, and then the charge structure tends to be dipole, in which the main positive charge region is larger than the main negative charge region. It is such a difference that the positive charge can get freedom from the bondage of the negative charge region and reach the ground, thus causing triggering the positive CG lightning [52,57].
For higher CCN concentration and deeper convective (weak thundercloud of 3000 cm−3 and 500–3000 cm−3 cases in moderate thundercloud and severe thundercloud), with the development of thunderclouds turning to maturity, the development of multipolarity charge structure shows a characteristic as follows: (1) the main negative charge resides in the lower region where the temperature is higher. (2) In addition to the three middle charge regions formed by the non-induction mechanism, the secondary positive charge region contains some small negative charge regions, which can be found in weak thunderclouds at N0 = 3000 cm−3 and moderate or severe thunderclouds at N0 ≥ 500 cm−3. (3) The increasing CCN concentration leads to more negative charge production on a small scale. For example, in moderate storms of 3000 cm−3 cases, charge structure with six layers appears in 40−50 min. This feature is highly similar to non-inductive charge separation and inductive charge separation. Our results are consistent with the studies that are conducted to simulate severe thunderclouds, as they found that the charge generation is dominated by non-inductive charge separation between graupel-ice crystals on the updraft region and inductive charging processes on the periphery of updraft region [57,58]. The non-inductive electrification was mainly produced in the altitude of 3−8 km, and the negative non-inductive charging rate decreases with the development of storm. At the highest CCN concentration (3000 cm−3), the non-inductive process remains stable, while the inductive charging rate tends to increase, so it is an obvious contribution to the local area showing a small range of negative charge region. In addition, compared with the variation of graupel in Figure 9, it can be seen that the content of graupel above the inversion temperature layer in weak thundercloud rises slightly with the increase of CCN concentration. However, in moderate and severe thunderclouds, high CCN concentrations result in a decreasing range of graupel center. For example, in severe thundercloud of the 500 cm−3 case (Figure 9f), the graupel center is located from 6 to 8km, but the center of graupel in the 3000 cm−3 case (Figure 9h) was reduced to 4−6 km, and the distribution was greatly reduced, which is quite consistent with the evolution of the main negative charge region.

4. Conclusions

The influences of aerosol concentration on dynamics, microphysics, and electrification of different intensity thunderclouds were evaluated by using a two-dimensional thundercloud model. Due to the significant difference in the production and development of graupel caused by different CCN concentrations in different intensity thunderclouds, the response of dynamics, electrification, and charge structures is a nonlinear relationship. Our results demonstrate that the pronounced increase in CCN concentration leads to a significant enhancement of updraft in the weak thunderclouds. At high CCN concentration in the moderate and severe thundercloud cases, however, it can be found that a slight reduction in maximum updraft is closely connected with the microphysics of graupel. In addition, the most noticeable effect of increasing aerosol in three types of the thundercloud is the increase of cloud droplet number concentration and mixing ratio, but a decrease in the size of cloud droplets. The increase of the convection promotes the lift of small cloud droplets, which leads to a faster and stronger production of ice crystals. Additionally, small cloud droplets reduce the auto-conversion rate of cloud droplets and raindrops so that the formation of raindrops is suppressed. Since the raindrops are produced from the cloud-rain auto-conversion to the melting of the ice-phase particles, the formation of the raindrops is delayed, and raindrop production decreases very rapidly in the case of high-intensity thunderclouds. The production of graupel is insensitive to the CCN concentration. The content of graupel increases from low CCN concentration to moderate CCN concentration and slightly decreases at high CCN concentration. The production graupel in high CCN concentration cases is hindered by the formation of large amounts of small ice crystals, which enhance the competition of available water vapor. When the intensity of thundercloud increases, the reduction of graupel production will arise in advance as the CCN concentration increasing.
Charge separation tends to increase as the aerosol concentration rises from low to high in the weak and moderate thundercloud cases. Although a slight reduction of graupel production in the high CCN concentration case was observed, the enhancement of ice crystal and cloud droplet formation still arises in the increase of non-inductive and inductive charge separation rates. However, the magnitude of charging rates in the severe thundercloud cases remain roughly stable under high CCN concentration condition, which can be attributed to the profound reduction of graupel content. The charge structure in the weak thundercloud at low CCN concentrations (100 cm−3) remains as a dipole, while the weak thunderclouds in the other cases (the CCN concentration above 100 cm−3) experience change from a dipole charge structure to a tripole charge structure, and finally disappear with a dipole. The time evolution of charge structure under the low CCN concentration condition in the moderate and severe thunderclouds is roughly similar to that in the weak thunderclouds with high CCN condition. In cases of strong intensity thunderclouds, the charge structure depicts a relatively complex structure that includes a multilayer charge region with alternating polarity. Those small-range and short-lived weak negative charge regions under the lower positive charge region are formed by graupel charging during the inductive charge separation process.
It is believed that aerosol can act as ice nuclei (IN). As cloud-ice nuclei (IN) interaction is increasingly recognized as one of the factors influencing the microphysical structure of clouds, and ice crystal (nucleation of IN) is of crucial importance in thundercloud electrification, this process may have an important impact on electrification properties in thunderclouds [59,60,61]. The coalescence between water drops is enhanced due to the inclusion of giant CCN, resulting in the early development of raindrops. Therefore, the giant CCN perhaps has a profound influence on microphysics and electrification in thunderstorms. Further aspects of this problem will be addressed in forthcoming studies. Due to the limitations of the 2D model, the frequency of lightning obtained from the 2D cloud model is relatively small as compared to some observations. The influence of aerosol on the lightning discharges process in thunderclouds will be presented by a 3D model in the future, but we still believe that the inherent physical mechanisms and lightning discharge characteristics in the two model categories are similar.

Author Contributions

Software, Y.T.; investigation, Z.S., L.Y.L. and C.S.L.; resources, Y.B.T.; data curation, H.C.W.; writing—original draft, Z.S. and L.Y.L.; writing—review and editing, Z.S.

Funding

This research was funded by National Natural Science Foundation of China, grant number “41805002”; Natural Science Foundation of Jiangsu Province, grant number “BK20180808”; Natural Science Fundamental Research Project of Jiangsu Colleges and Universities, grant number “18KJB170010”; and the Startup Foundation for Introducing Talent of NUIST, grant number “2016r042”.

Conflicts of Interest

The authors declare no conflict of interest.

References

  1. Latham, D. Lightning flashes from a prescribed fire-induced cloud. J. Geophys. Res. Atmos. 1991, 96, 17151–17157. [Google Scholar] [CrossRef]
  2. Lyons, W.A.; Uliasz, M.; Nelson, T.E. Large Peak Current Cloud-to-Ground Lightning Flashes during the Summer Months in the Contiguous United States. Mon. Weather Rev. 1998, 126, 2217–2233. [Google Scholar] [CrossRef]
  3. Murray, N.D.; Orville, R.E.; Huffines, G.R. Effect of pollution from Central American fires on cloud-to-ground lightning in May 1998. Geophys. Res. Lett. 2000, 27, 2249–2252. [Google Scholar] [CrossRef]
  4. Lang, T.J.; Rutledge, S.A. Cloud-to-ground lightning downwind of the 2002 Hayman forest fire in Colorado. Geophys. Res. Lett. 2006, 33, L03804. [Google Scholar] [CrossRef]
  5. Altaratz, O.; Koren, I.; Yair, Y.; Price, C. Lightning response to smoke from Amazonian fires. Geophys. Res. Lett. 2010, 37, 363–372. [Google Scholar] [CrossRef]
  6. Logan, T. Anomalous Lightning Behavior during the 26–27 August 2007 Northern Great Plains Severe Weather Event. J. Geophys. Res. Atmos. 2018, 123, 1771–1784. [Google Scholar] [CrossRef]
  7. Williams, E.; Rosenfeld, D.; Madden, N.; Gerlach, J.; Gears, N.; Atkinson, L.; Dunnermann, N.; Frostom, G.; Antonio, M.; Biazon, B. Contrasting convective regimes over the Amazon: Implications for cloud electrification. J. Geophys. Res. 2002, 107, 1–19. [Google Scholar] [CrossRef]
  8. Williams, E.; Stanfill, S. The physical origin of the land–ocean contrast in lightning activity. Comptes Rendus Phys. 2002, 3, 1277–1292. [Google Scholar] [CrossRef]
  9. Rosenfeld., D.; Lensky., I.M. Satellite–Based Insights into Precipitation Formation Processes in Continental and Maritime Convective Clouds. Bull. Am. Meteorol. Soc. 1998, 79, 2457–2476. [Google Scholar] [CrossRef]
  10. Zheng, Y.; Rosenfeld, D. Linear relation between convective cloud base height and updrafts and application to satellite retrievals. Geophys. Res. Lett. 2015, 42, 6485–6491. [Google Scholar] [CrossRef]
  11. Zheng, Y. The oretical understanding of the linear relationship between convective updrafts and cloud-base height for shallow cumulus clouds. Part I: Maritime conditions. J. Atmos. Sci. 2019, 76, 2539–2558. [Google Scholar] [CrossRef]
  12. Rosenfeld, D.; Lohmann, U.; Raga, G.B.; O’Dowd, C.D.; Kulmala, M.; Fuzzi, S.; Andreae, M.O. Flood or drought: how do aerosols affect precipitation? Science 2008, 321, 1309–1313. [Google Scholar] [CrossRef] [PubMed]
  13. Mitzeva, R.; Saunders, C.; Tsenova, B. Parameterisation of non-inductive charging in thundercloud regions free of cloud droplets. Atmos. Res. 2006, 82, 102–111. [Google Scholar] [CrossRef]
  14. Shi, Z.; Tan, Y.B.; Tang, H.Q.; Sun, J.; Yang, Y.; Peng, L.; Guo, X.F. Aerosol effect on the land-ocean contrast in thundercloud electrification and lightning frequency. Atmos. Res. 2015, 164, 131–141. [Google Scholar] [CrossRef]
  15. Kar, S.K.; Liou, Y.A.; Ha, K.J. Aerosol effects on the enhancement of cloud-to-ground lightning over major urban areas of South Korea. Atmos. Res. 2009, 92, 80–87. [Google Scholar] [CrossRef]
  16. Stallins, J.A.; Bentley, M.L.; Ashley, W.S.; Mulholland, J.A. Weekend–weekday aerosols and geographic variability in cloud-to-ground lightning for the urban region of Atlanta, Georgia, USA. Reg. Environ. Chang. 2013, 13, 137–151. [Google Scholar] [CrossRef]
  17. Naccarato, K.P.; Jr, O.P.; Pinto, I.R.C.A. Evidence of thermal and aerosol effects on the cloud-to-ground lightning density and polarity over large urban areas of Southeastern Brazil. Geophys. Res. Lett. 2003, 30, 1–3. [Google Scholar] [CrossRef]
  18. Pinto, I.R.C.A.; Jr, O.P.; Gomes, M.A.S.S.; Ferreira, N.J. Urban effect on the characteristics of cloud-to-ground lightning over Belo Horizonte-Brazil. Ann. Geophys. 2004, 22, 697–700. [Google Scholar] [CrossRef]
  19. Tan, Y.B.; Peng, L.; Shi, Z.; Chen, H.R. Lightning flash density in relation to aerosol over Nanjing (China). Atmos. Res. 2016, 174, 1–8. [Google Scholar]
  20. Wang, Q.; Li, Z.; Guo, J.; Zhao, C.; Cribb, M. The climate impact of aerosols on the lightning flash rate: is it detectable from long-term measurements? Atmos. Chem. Physic 2018, 18, 12797–12816. [Google Scholar] [CrossRef] [Green Version]
  21. Mansell, E.R.; Ziegler, C.L. Aerosol Effects on Simulated Storm Electrification and Precipitation in a Two-Moment Bulk Microphysics Model. J. Atmos. Sci. 2013, 70, 2032–2050. [Google Scholar] [CrossRef]
  22. Zhao, P.; Yan, Y.; Hui, X. The effects of aerosol on development of thundercloud electrification: A simulation study in Weather Research and Forecasting (WRF) model. Atmos. Res. 2015, 153, 376–391. [Google Scholar] [CrossRef]
  23. Zhao, P.; Yin, Y.; Xiao, H. The effects of aerosol on development of thundercloud electrification: A electrification and lightning discharges during thunderclouds. J. Geophys. 2017, 60, 3041–3050. [Google Scholar]
  24. Fan, J.; Zhang, R.; Li, G.; Tao, W.K.; Li, X. Simulations of cumulus clouds using a spectral microphysics cloud-resolving model. J. Geophys. Res. Atmos. 2007, 112, 1–14. [Google Scholar] [CrossRef]
  25. Wang, C. A modeling study of the response of tropical deep convection to the increase of cloud condensation nuclei concentration: 1. Dynamics and microphysics. J. Geophys. Res. Atmos. 2005, 110, D21211. [Google Scholar] [CrossRef]
  26. Li, G.; Yuan, W.; Zhang, R. Incorporation of a two-moment bulk microphysics scheme to the WRF model to investigate aerosol-cloud interaction. J. Geophys. Res. Atmos. 2008, 113, D15. [Google Scholar] [CrossRef]
  27. Tao, W.K.; Li, X.; Khain, A.; Matsui, T.; Lang, S.; Simpson, J. Role of atmospheric aerosol concentration on deep convective precipitation: Cloud-resolving model simulations. J. Geophys. Res. Atmos. 2007, 112, 24. [Google Scholar] [CrossRef]
  28. Bjorn, S.; Graham, F. Untangling aerosol effects on clouds and precipitation in a buffered system. Nature 2009, 461, 607–613. [Google Scholar]
  29. Shi, Z.; Tan, Y.; Liu, Y.; Liu, J.; Luan, J. Effects of relative humidity on electrification and lightning discharges in thunderclouds. Terr. Atmos. Ocean. Sci. 2018, 29, 695–708. [Google Scholar] [CrossRef]
  30. Carrió, G.G.; Cotton, W.R. On the buffering of CCN impacts on wintertime orographic clouds: An idealized examination. Atmos. Res. 2014, 137, 136–144. [Google Scholar] [CrossRef]
  31. Hu, Z. Numerical simulation of microprocesses in cumulonimbus clouds (I) microphysical model. Acta Meteorol. Sin. 1987, 45, 467–484. [Google Scholar]
  32. Yin, Y.; Levin, Z.; Reisin, T.G.; Tzivion, S. The effects of giant cloud condensation nuclei on the development of precipitation in convective clouds—a numerical study. Atmos. Res. 2000, 53, 91–116. [Google Scholar] [CrossRef]
  33. Fletcher, N.H. The Physics of Rainclouds; Cambridge University Press: Cambridge, UK, 1962. [Google Scholar]
  34. Sun, A.; Chun, H.Y.; Baik, J.J.; Yan, M. Influence of Electrification on Microphysical and Dynamical Processes in a Numerically Simulated thundercloud. J. Appl. Meteorol. 2002, 41, 1112–1127. [Google Scholar] [CrossRef]
  35. Cooper, W.A. A method of detecting contact ice nuclei using filter samples. In Proceedings of the Cloud Physics Conference preprints, Clermont-Ferrand, France, 15–19 July 1980; pp. 665–668. [Google Scholar]
  36. Mossop, S.C. Production of secondary ice particles during the growth of graupel by riming. Q. J. R. Meteorol. Soc. 1976, 102, 45–57. [Google Scholar] [CrossRef]
  37. Ziegler, C.L.; Macgorman, D.R.; Dye, J.E.; Ray, P.S. A model evaluation of noninductive graupel-ice charging in the early electrification of a mountain thundercloud. J. Geophys. Res. Atmos. 1991, 96, 12833–12855. [Google Scholar] [CrossRef]
  38. Mansell, E.R.; Macgorman, D.R.; Ziegler, C.L.; Straka, J.M. Charge structure and lightning sensitivity in a simulated multicell thundercloud. J. Geophys. Res. Atmos. 2005, 110, D12. [Google Scholar] [CrossRef]
  39. Gardiner, B.; Lamb, D.; Pitter, R.L.; Hallett, J.; Saunders, C.P.R. Measurements of initial potential gradient and particle charges in a Montana summer thundercloud. J. Geophys. Res. Atmos. 1985, 90, 6079–6086. [Google Scholar] [CrossRef]
  40. Pereyra, R.G.; Avila, E.E.; Castellano, N.E.; Saunders, C.P. A laboratory study of graupel charging. J. Geophys. 2000, 105, 20803–20812. [Google Scholar] [CrossRef]
  41. Tan, Y.; Tao, S.; Liang, Z.; Zhu, B. Numerical study on relationship between lightning types and distribution of space charge and electric potential. J. Geophys. Res. Atmos. 2014, 119, 1003–1014. [Google Scholar] [CrossRef]
  42. Tan, Y.; Tao, S.; Zhu, B. Fine-resolution simulation of the channel structures and propagation features of intracloud lightning. Geophys. Res. Lett. 2006, 33, L09809. [Google Scholar] [CrossRef]
  43. Marwitz, J.D. The Structure and Motion of Severe Hailstorms. Part III: Severely Sheared Storms. J. Appl. Meteorol. 1972, 11, 189–201. [Google Scholar] [CrossRef]
  44. Williams, E.R.; Zhang, R.; Rydock, J. Mixed-Phase Microphysics and Cloud Electrification. J. Atmos. Sci. 1991, 48, 2195–2203. [Google Scholar] [CrossRef] [Green Version]
  45. Deng, M.; Yin, Y.; Zhao, P. Effects of cloud condensation nuclei concentration on the electrification of thundercloud: A numerical simulation. Chin. J. Atmos. Sci. 2017, 41, 106–120. [Google Scholar]
  46. Rosenfeld, D. TRMM observed first direct evidence of smoke from forest fires inhibiting rainfall. Geophys. Res. Lett. 1999, 26, 3105–3108. [Google Scholar] [CrossRef]
  47. Lynn, B.; Khain, A.; Rosenfeld, D.; Woodley, W.L. Effects of aerosols on precipitation from orographic clouds. J. Geophys. Res. Atmos. 2007, 112, D10. [Google Scholar] [CrossRef]
  48. Liu, J.; Tan, Y.; Shi, Z.; Wang, M.; Yu, M.; Zheng, T. A numerical study of the effects of aerosol on microphysical process and electrification in thunderclouds. Clim. Environ. Res. 2018, 23, 758–768. [Google Scholar]
  49. Muhlbauer, A.; Lohmann, U. Sensitivity Studies of the Role of Aerosols in Warm-Phase Orographic Precipitation in Different Dynamical Flow Regimes. J. Atmos. Sci. 2008, 65, 2522–2542. [Google Scholar] [CrossRef]
  50. Rosenfeld, D.; L Woodley, W. Closing the 50-year circle: From cloud seeding to space and back to climate change through precipitation physics. Cloud Syst. Hurric. Trop. Rainfall Meas. Mission (Trmm), Meteor. Monogr 2003, 51, 59–80. [Google Scholar]
  51. Andreae, M.O.; Rosenfeld, D.; Artaxo, P.; Costa, A.A.; Frank, G.P.; Longo, K.M.; Silva-Dias, M.A.F. Smoking Rain Clouds over the Amazon. Science 2004, 303, 1337–1342. [Google Scholar] [CrossRef] [PubMed] [Green Version]
  52. Tan, Y.B.; Ma, X.; Xiang, C.Y.; Xia, Y.L.; Zhang, X. A numerical study of the effects of aerosol on electrification and lightning discharges during thunderclouds. Chin. J. Geophys. 2017, 60, 431–442. [Google Scholar]
  53. Khain, A.; Rosenfeld, D.; Pokrovsky, A. Simulating convective clouds with sustained supercooled liquid water down to −37.5 °C using a spectral microphysics model. Geophys. Res. Lett 2001, 28, 3887–3890. [Google Scholar] [CrossRef]
  54. Yang, H.; Xiao, H.; Hong, Y.C. A numerical study of aerosol effects on cloud microphysical processes of hailstorm clouds. Atmosphere. 2011, 102, 432–443. [Google Scholar] [CrossRef]
  55. Miller, K.; Gadian, A.; Saunders, C.; Latham, J.; Christian, H. Modelling and observations of thundercloud electrification and lightning. Atmos. Res. 2001, 58, 89–115. [Google Scholar] [CrossRef]
  56. Tan, Y.B.; Shi, Z.; Chen, Z.L.; Peng, L.; Yang, Y.; Guo, X.F.; Chen, H.R. A numerical study of aerosol effects on electrification of thunderclouds. J. Atmos. Sol. Terr. Phys. 2015, 154, 210–214. [Google Scholar]
  57. Macgorman, D.R.; Rust, W.D.; Krehbiel, P.; Rison, W.; Bruning, E.; Wiens, K. The electrical structure of two supercell storms during steps. Mon. Wea. Rev 2005, 133, 2583–2607. [Google Scholar] [CrossRef]
  58. Kuhlman, K.M.; Ziegler, C.L.; Mansell, E.R.; Macgorman, D.R.; Straka, J.M. Numerically simulated electrification and lightning of the 29 June 2000 steps supercell storm. Mon. Weather Rev. 2006, 134, 85–121. [Google Scholar] [CrossRef]
  59. Teller, A.; Levin, Z. The effects of aerosols on precipitation and dimensions of subtropical clouds: a sensitivity study using a numerical cloud model. Atmos. Chem. Phys. 2006, 6, 67–80. [Google Scholar] [CrossRef] [Green Version]
  60. Barahona, D.; Nenes, A. Parameterization of cirrus cloud formation in large-scale models: Homogeneous nucleation. J. Geophys. Res. Atmos. 2008, 113, D11. [Google Scholar] [CrossRef]
  61. Demott, P.J.; Mccluskey, C.S.; Petters, M.; Suski, K.J.; Levin, E.J.; Hill, T.C.J.; Atwood, S.A.; Schill, G.P.; Rocci, K.; Boose, Y. Aerosol and Cloud-Nucleating Particle Observations during an Atmospheric River Event. In Proceedings of the AGU Fall Meeting Abstracts, San Francisco, CA, USA, 14–18 December 2015. [Google Scholar]
Figure 1. Environment temperature and humidity stratification (a) and vertical wind profile (b); (a) the black solid line represents the environment temperature, the dashed line represents the dew point; (b) the black solid line represents horizontal wind, and the dashed line represents vertical wind.
Atmosphere 10 00508 g001
Figure 2. The time evolution of maximum and minimum vertical velocities present: (a) in weak thundercloud, (b) in moderate thundercloud, (c) in severe thundercloud.
Atmosphere 10 00508 g002
Figure 3. Spatial and temporal distribution of the mixing ratio and the number concentration of cloud droplet for initial aerosol concentrations: (ac) 100 cm−3, (df) 500 cm−3, (gi) 1000 cm−3, (jl) 3000 cm−3; the number represents the average mixing ratio (Qc Ave) and the average number concentration (Hc Ave), and below is the same; the red solid line represents the isotherm (−40 and 0 °C); the black contour respectively represents: 106, 107, 108, and 109 kg−1.
Atmosphere 10 00508 g003
Figure 4. Vertical profiles of the maximum mixing ratio of cloud droplets in (a) weak thundercloud, (b) moderate thundercloud, (c) severe thundercloud; the maximum number concentration of cloud droplets in (d) weak thundercloud, (e) moderate thundercloud, (f) severe thundercloud; the initial aerosol concentrations are: 100 cm−3 (red line), 500 cm−3 (blue line), 1000 cm−3 (yellow line), 3000 cm−3 (green line), below is the same.
Atmosphere 10 00508 g004
Figure 5. Spatial and temporal distribution of the mixing ratio and the number concentration of raindrop for initial aerosol concentrations: (ac) 100 cm−3, (df) 500 cm−3, (gi) 1000 cm−3, (jl) 3000 cm−3; the red solid line represents the isotherm (−40 and 0 °C); the black contour respectively represents: 103, 104, 105, and 106 kg−1.
Atmosphere 10 00508 g005
Figure 6. Vertical profiles of the maximum mixing ratio and the maximum number concentration of raindrops in (a) weak thundercloud, (b) moderate thundercloud, (c) severe thundercloud; the maximum number concentration of raindrop in (d) weak thundercloud, (e) moderate thundercloud, (f) severe thundercloud.
Atmosphere 10 00508 g006
Figure 7. Spatial and temporal distribution of the mixing ratio and the number concentration of ice crystals for initial aerosol concentrations: (ac) 100 cm−3, (df) 500 cm−3, (gi) 1000 cm−3, (jl) 3000 cm−3; the red solid line represents the isotherm (−40 and 0 °C); the black contour respectively represents: 106, 107, 108, and 109 kg−1.
Atmosphere 10 00508 g007
Figure 8. Vertical profiles of the maximum mixing ratio and the maximum number concentration of ice crystals in (a) weak thundercloud, (b) moderate thundercloud, (c) severe thundercloud; the maximum number concentration of ice crystals in (d) weak thundercloud, (e) moderate thundercloud, (f) severe thundercloud.
Atmosphere 10 00508 g008
Figure 9. Spatial and temporal distribution of the mixing ratio and the number concentration of graupel for initial aerosol concentrations: (ac) 100 cm−3, (df) 500 cm−3, (gi) 1000 cm−3, (jl) 3000 cm−3; the red solid line represents the isotherm (−40 and 0 °C); the black contour respectively represents: 103, 104, 105, and 106 kg−1.
Atmosphere 10 00508 g009
Figure 10. Vertical profiles of the maximum mixing ratio and the maximum number concentration of graupel in (a) weak thundercloud, (b) moderate thundercloud, (c) severe thundercloud; the maximum number concentration of ice crystals in (d) weak thundercloud, (e) moderate thundercloud, (f) severe thundercloud.
Atmosphere 10 00508 g010
Figure 11. The evolution of the non-inductive charging rate; black solid line represents the isotherm (−40 and −15 °C, and to 0 °C); (ad) in weak thundercloud ((a) N0 = 100 cm−3; (b) N0 = 500 cm−3; (c) N0 = 1000 cm−3; (d) N0 = 3000 cm−3); (eh) in moderate thundercloud; (il) in severe thundercloud.
Atmosphere 10 00508 g011
Figure 12. The inductive (by graupel) charging rate evolution (ad) in weak thundercloud ((a) N0 = 100 cm−3; (b) N0 = 500 cm−3; (c) N0 = 1000 cm−3; (d) N0 = 3000 cm−3); (eh) in moderate thundercloud; (il) in severe thundercloud. Positive (red) and negative (blue) charging rates with contour intervals of ±1, ±50, ±100, ±300, and ±600 pC m−3 s−1.
Atmosphere 10 00508 g012
Figure 13. The evolution of charge structure; red solid line represents the isotherm (−40 and −15 °C and to 0 °C; (ac) N0 = 100 cm −3; (df) N0 = 500 cm−3; (gi) N0 = 1000 cm−3; (jl) N0 = 3000 cm−3.
Atmosphere 10 00508 g013
Table 1. The non-inductive charging rate and inductive charging rate.
Thundercloud IntensityN0 (cm−3)Non-Inductive Charging Rate
(pC m−2 s−1)
Inductive Charging Rate
(pC m−2 s−1)
MaxMinMaxMin
Weak1003.10−20.792.37−0.56
50043.48−155.316.83−25.13
1000297.19−374.7775.56−44.80
3000481.56−464.36224.40−198.30
Moderate1008.94−240.229.12−2.15
500261.38−438.90121.72−29.56
1000481.86−923.6677.80−62.35
3000715.30−1397.86225.38−117.65
Severe10026.94−468.0310.13−14.63
500561.99−738.28114.41−193.66
1000595.90−1724.95110.53−58.34
3000597.50−1289.69121.72−37.67

