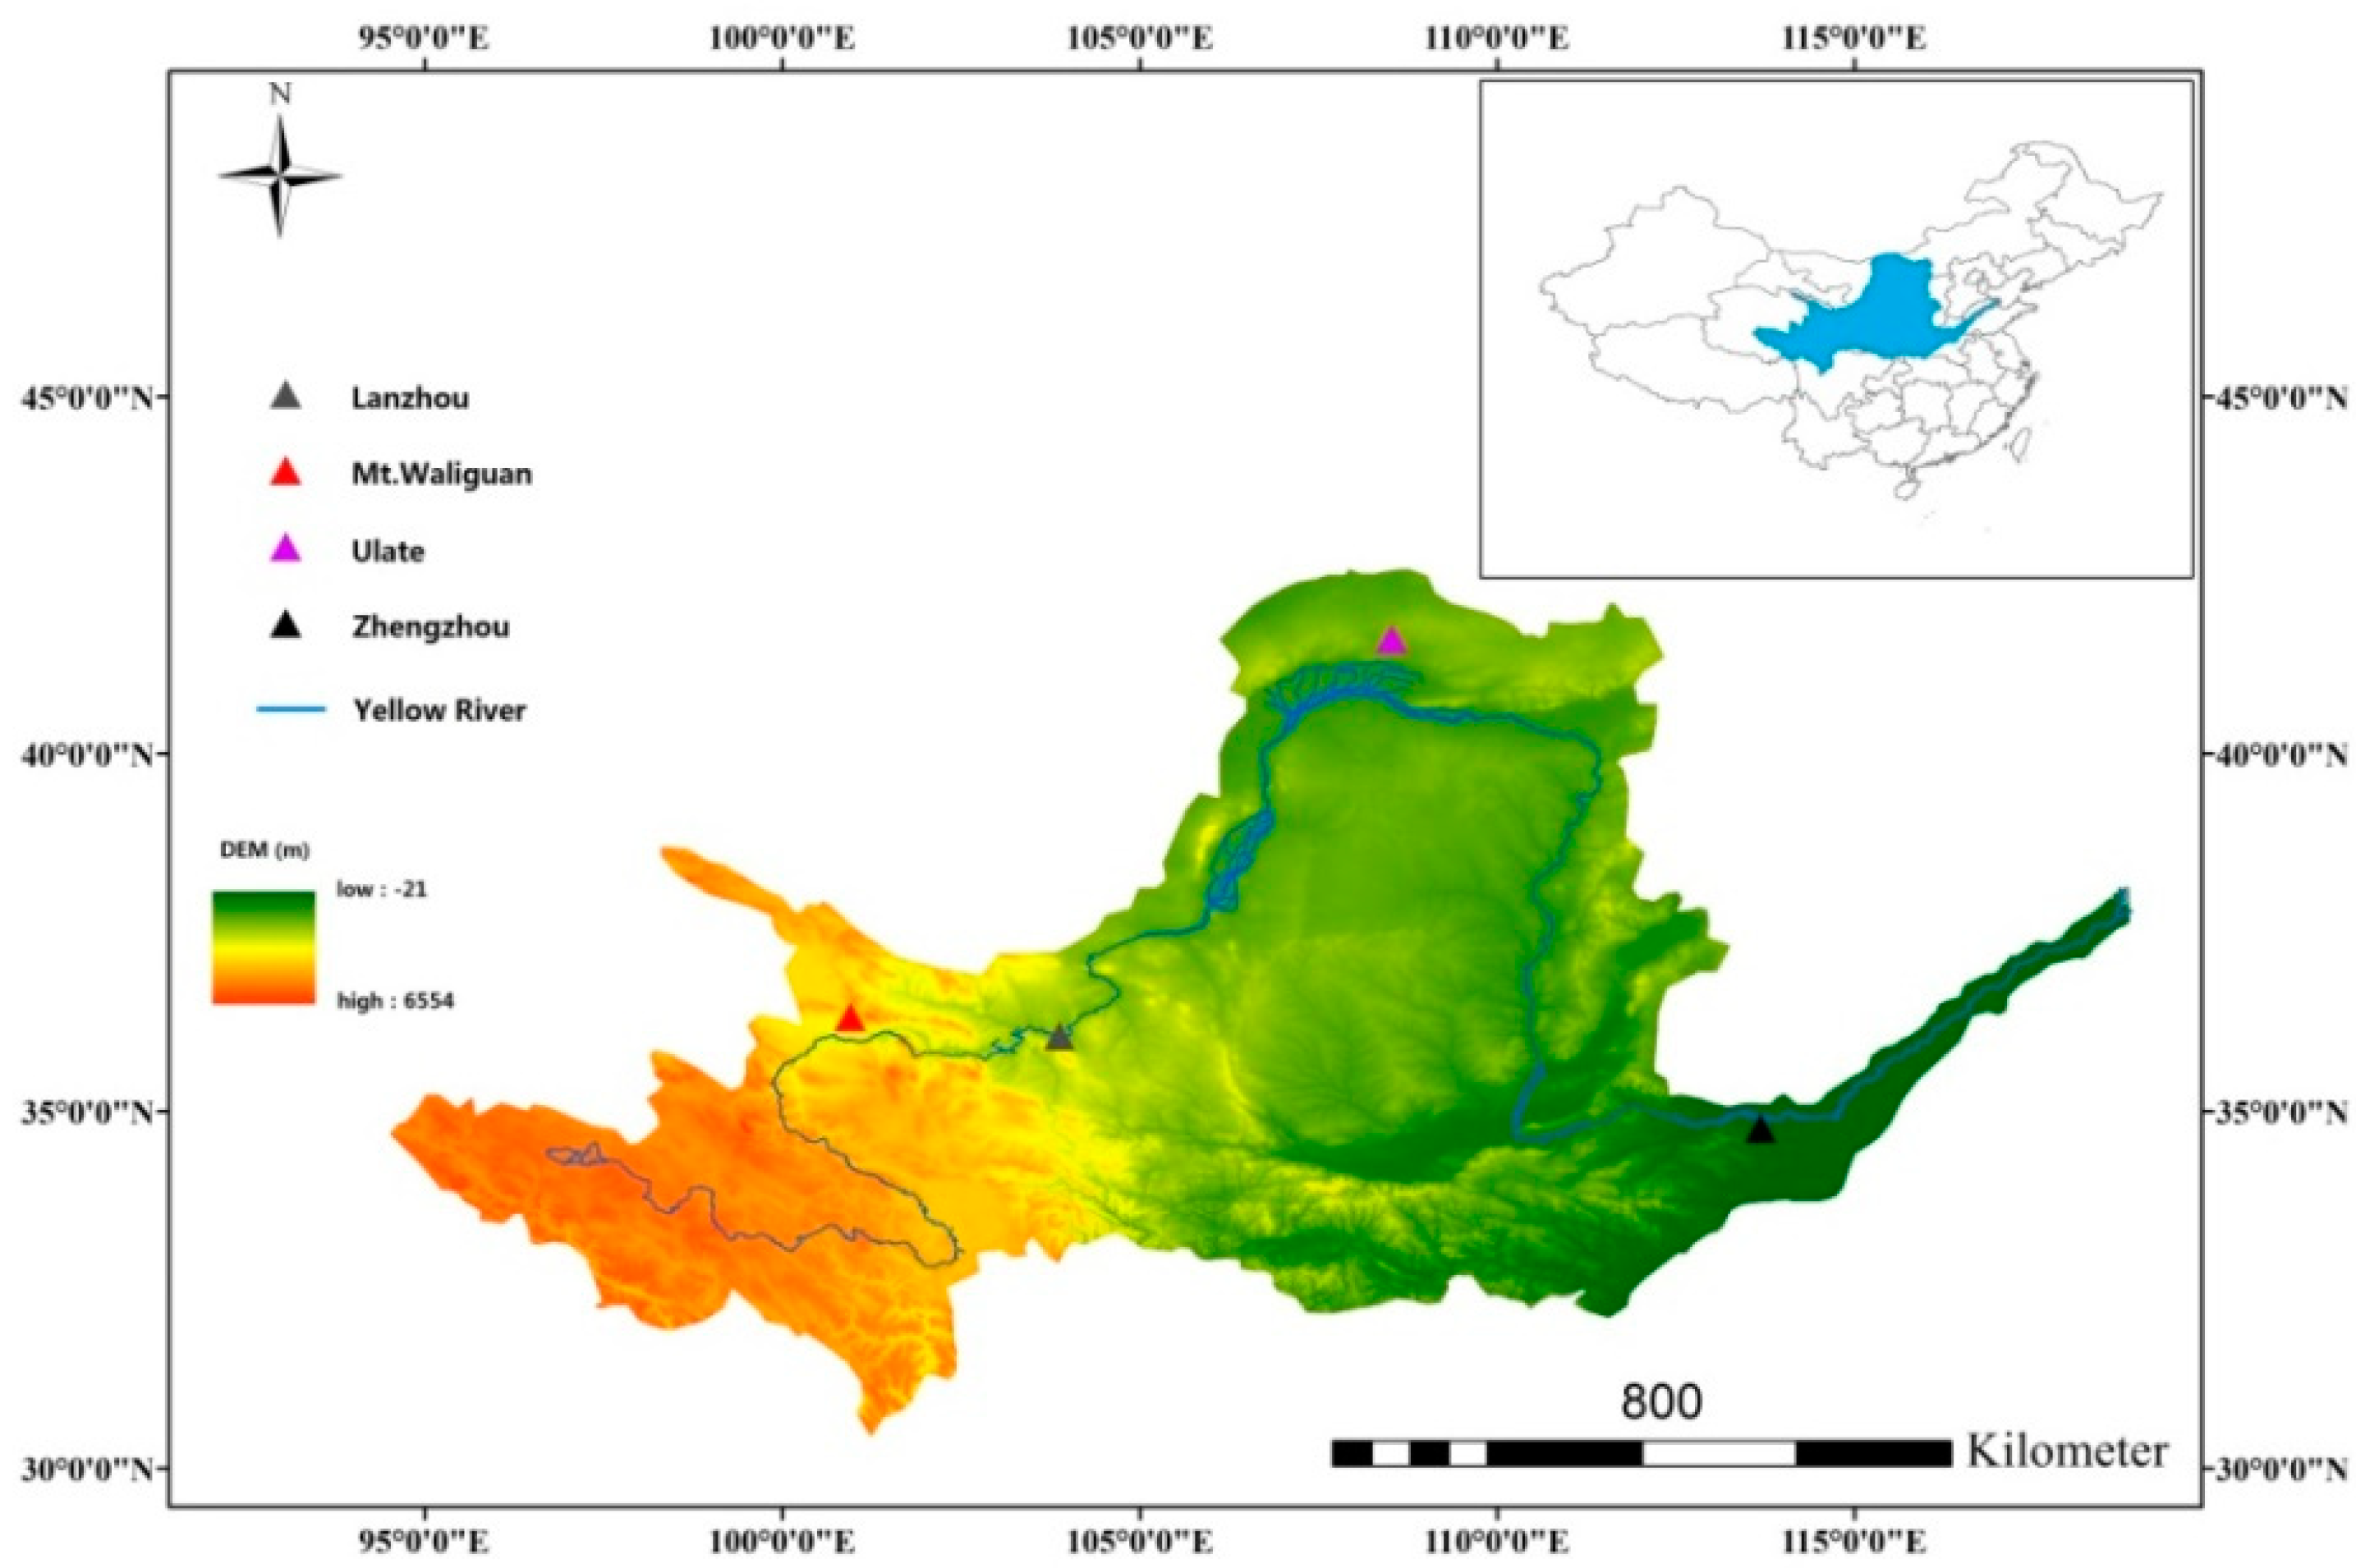
Figure 1.
Location of the ground stations (triangle symbols) over the Yellow River basin (YERB).
Figure 1.
Location of the ground stations (triangle symbols) over the Yellow River basin (YERB).
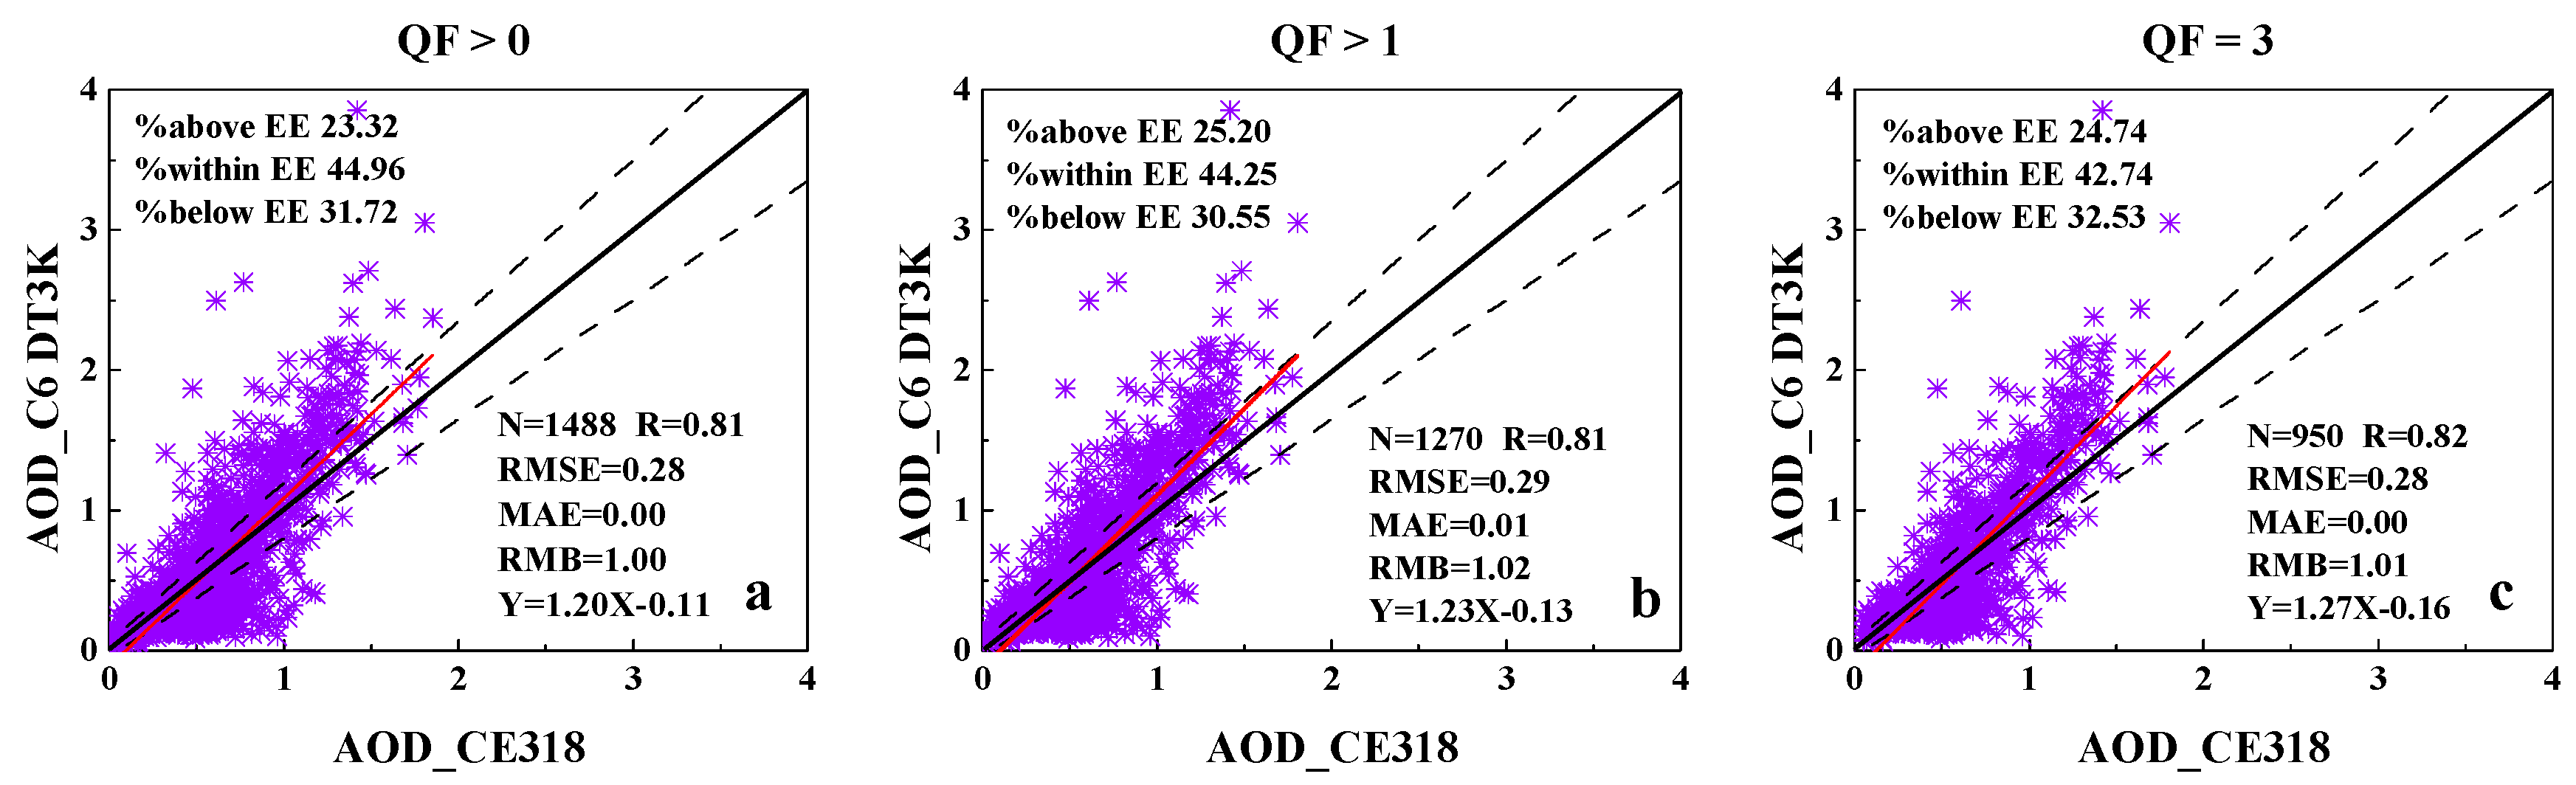
Figure 2.
Comparison of the C6 DT AOD retrievals at 3 km (DT3K) with CE318 AOD observations at 550 nm over the YERB for the period of July 1, 2002 to December 31, 2014. The DT3K AOD retrievals are classified by all (QF > 0, (a)), medium (QF > 1, (b)), and high (QF = 3, (c)) quality flags. The black straight line is the 1:1 line, the red straight line is the regression line, and the expected error (EE) envelope is within the dashed lines.
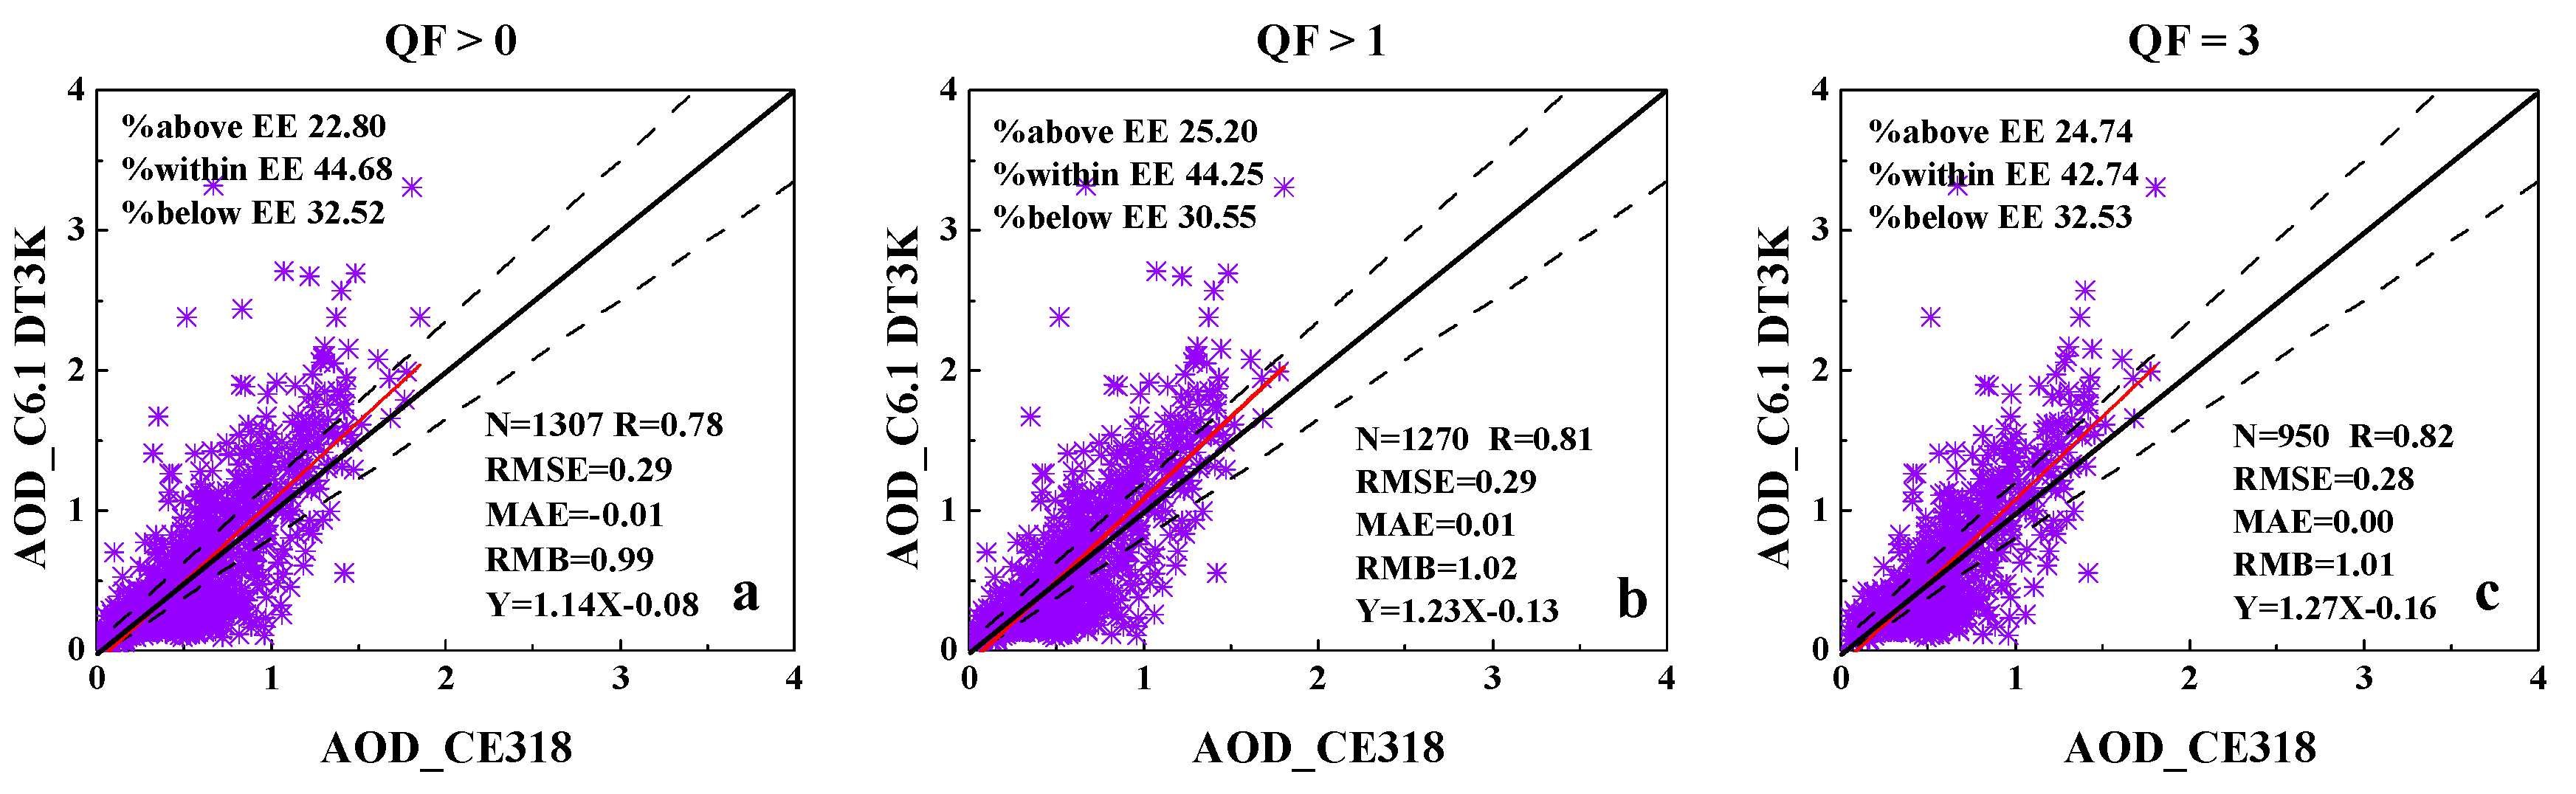
Figure 3.
Comparison between the C6.1 DT3K AOD product at 550 nm and the CE318 AOD observations at 550 nm over the YERB for the period of July 1, 2002 to December 31, 2014. The DT3K AOD retrievals were classified by all (QF > 0, (a)), medium (QF > 1, (b)), and high (QF = 3, (c)) quality flags. The black straight line is the 1:1 line, the red straight line is the regression line, and the EE envelope is within the dashed lines.
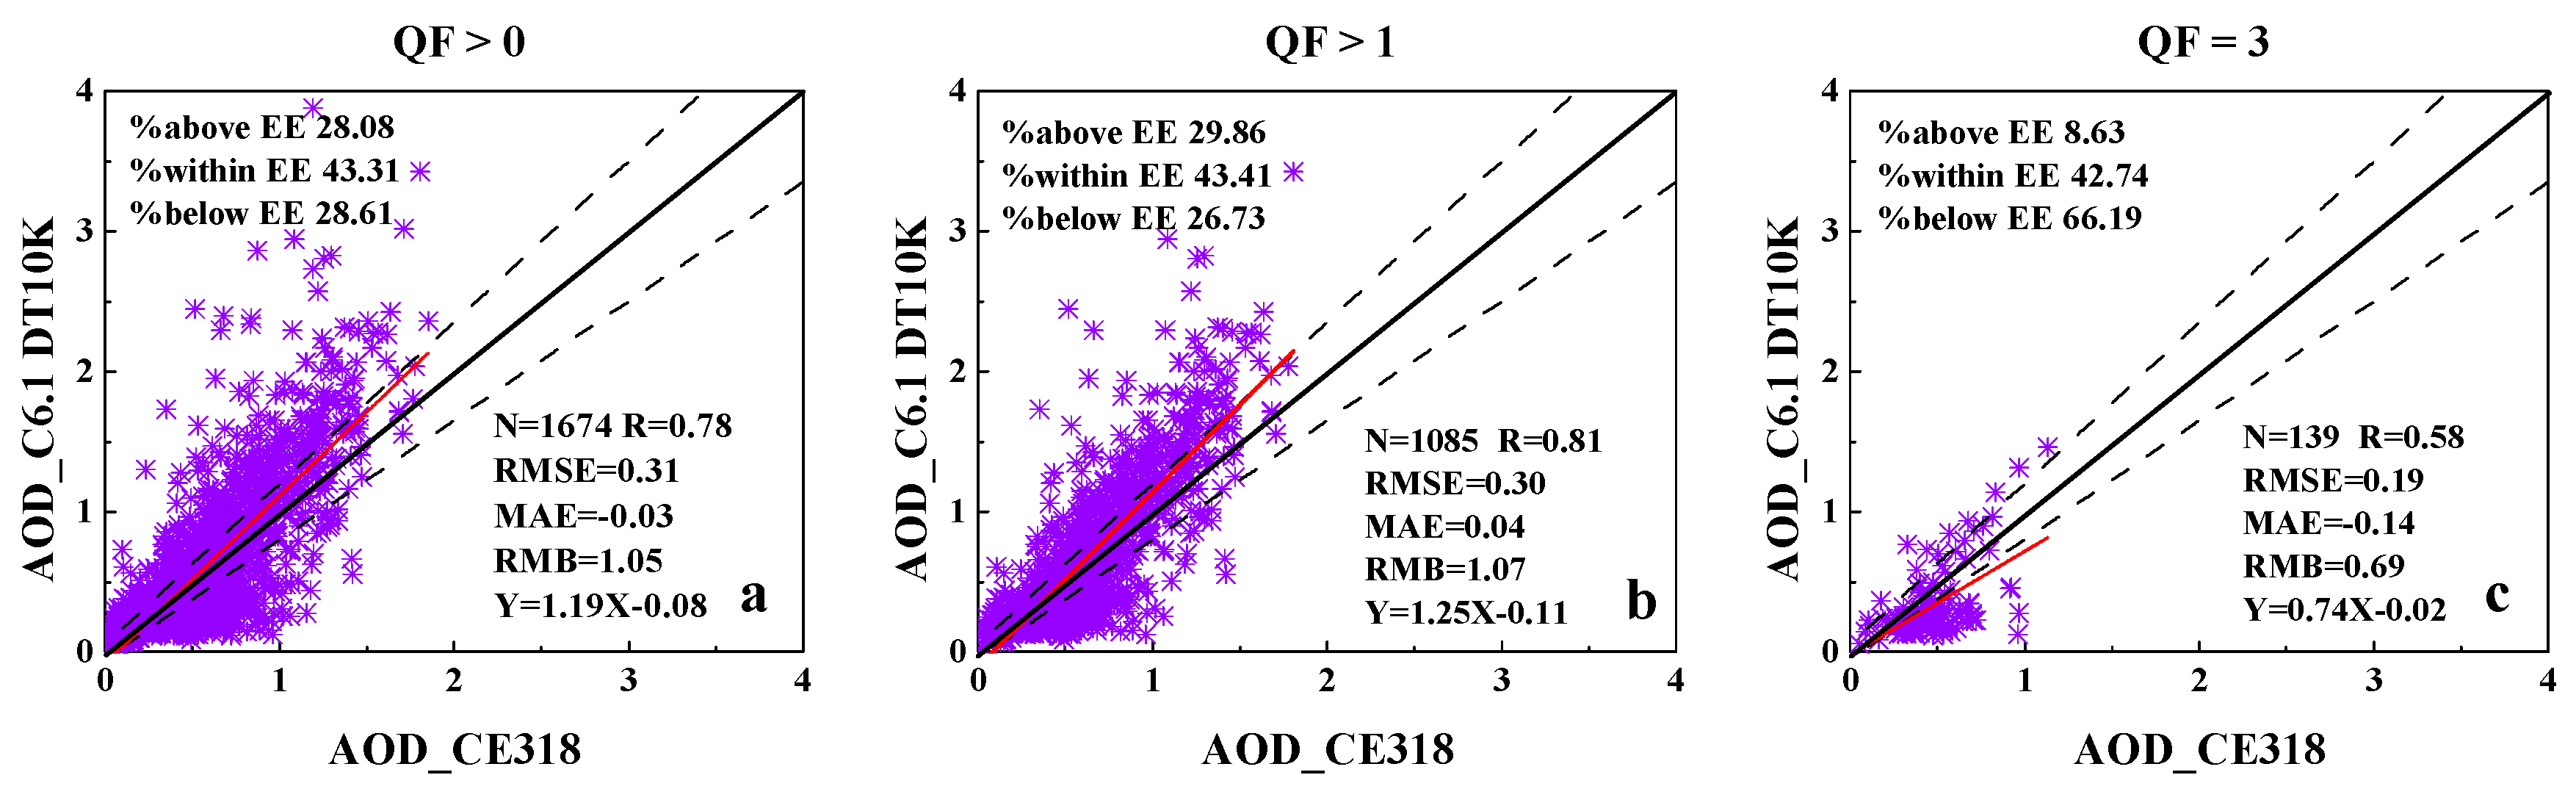
Figure 4.
Validation of the C6.1 DT10K AOD product at 550 nm against the CE318 AOD observations at 550 nm over the YERB for the period of July 1, 2002 to December 31, 2014. The DT3K AOD retrievals are classified by all (QF > 0, (a)), medium (QF > 1, (b)), and high (QF = 3, (c)) quality flags. The black straight line is the 1:1 line, the red straight line is the regression line, and the EE envelope is within the dashed lines.
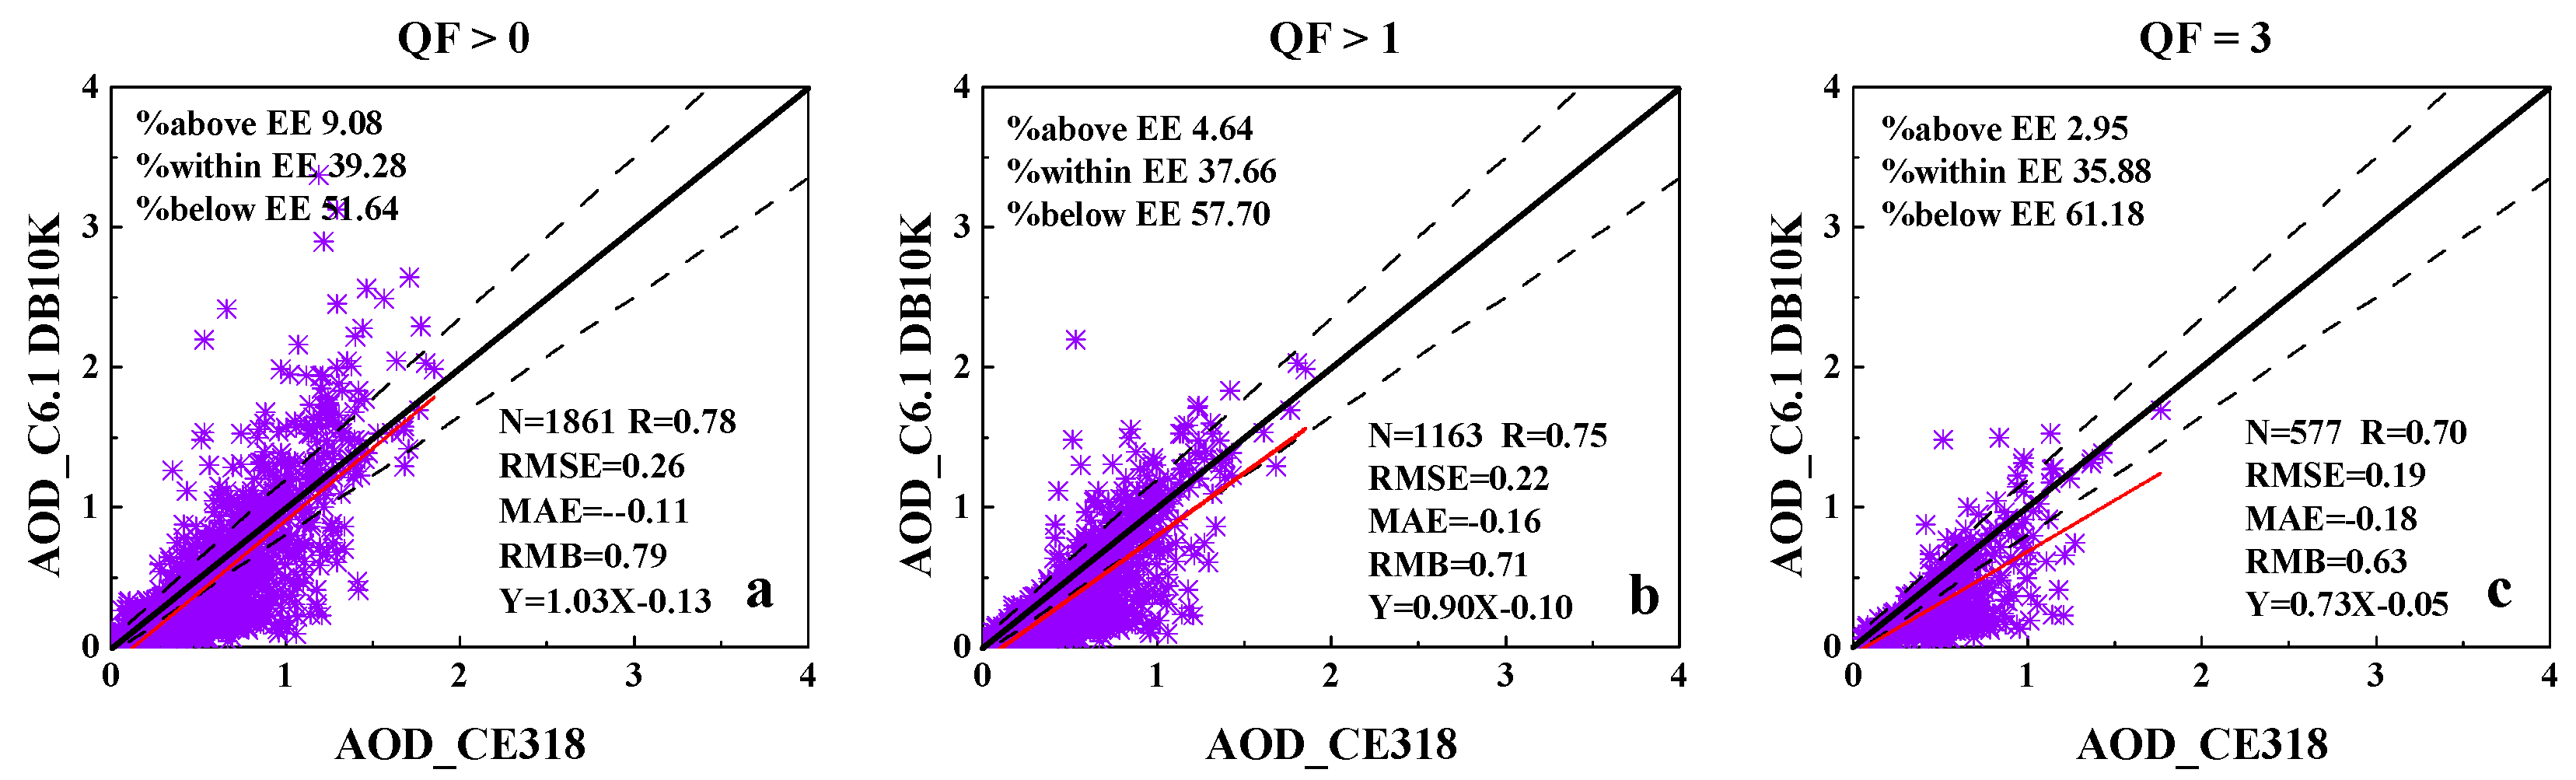
Figure 5.
Validation of the C6.1 Deep Blue AOD retrievals at 10 km resolution (DB10K) against the CE318 AOD observations at 550 nm over the YERB for the period of July 1, 2002 to December 31, 2014. The DT3K AOD retrievals are classified by all (QF > 0, (a)), medium (QF > 1, (b)), and high (QF = 3, (c)) quality flags. The black straight line is the 1:1 line, the red straight line is the regression line, and the EE envelope is within the dashed lines.
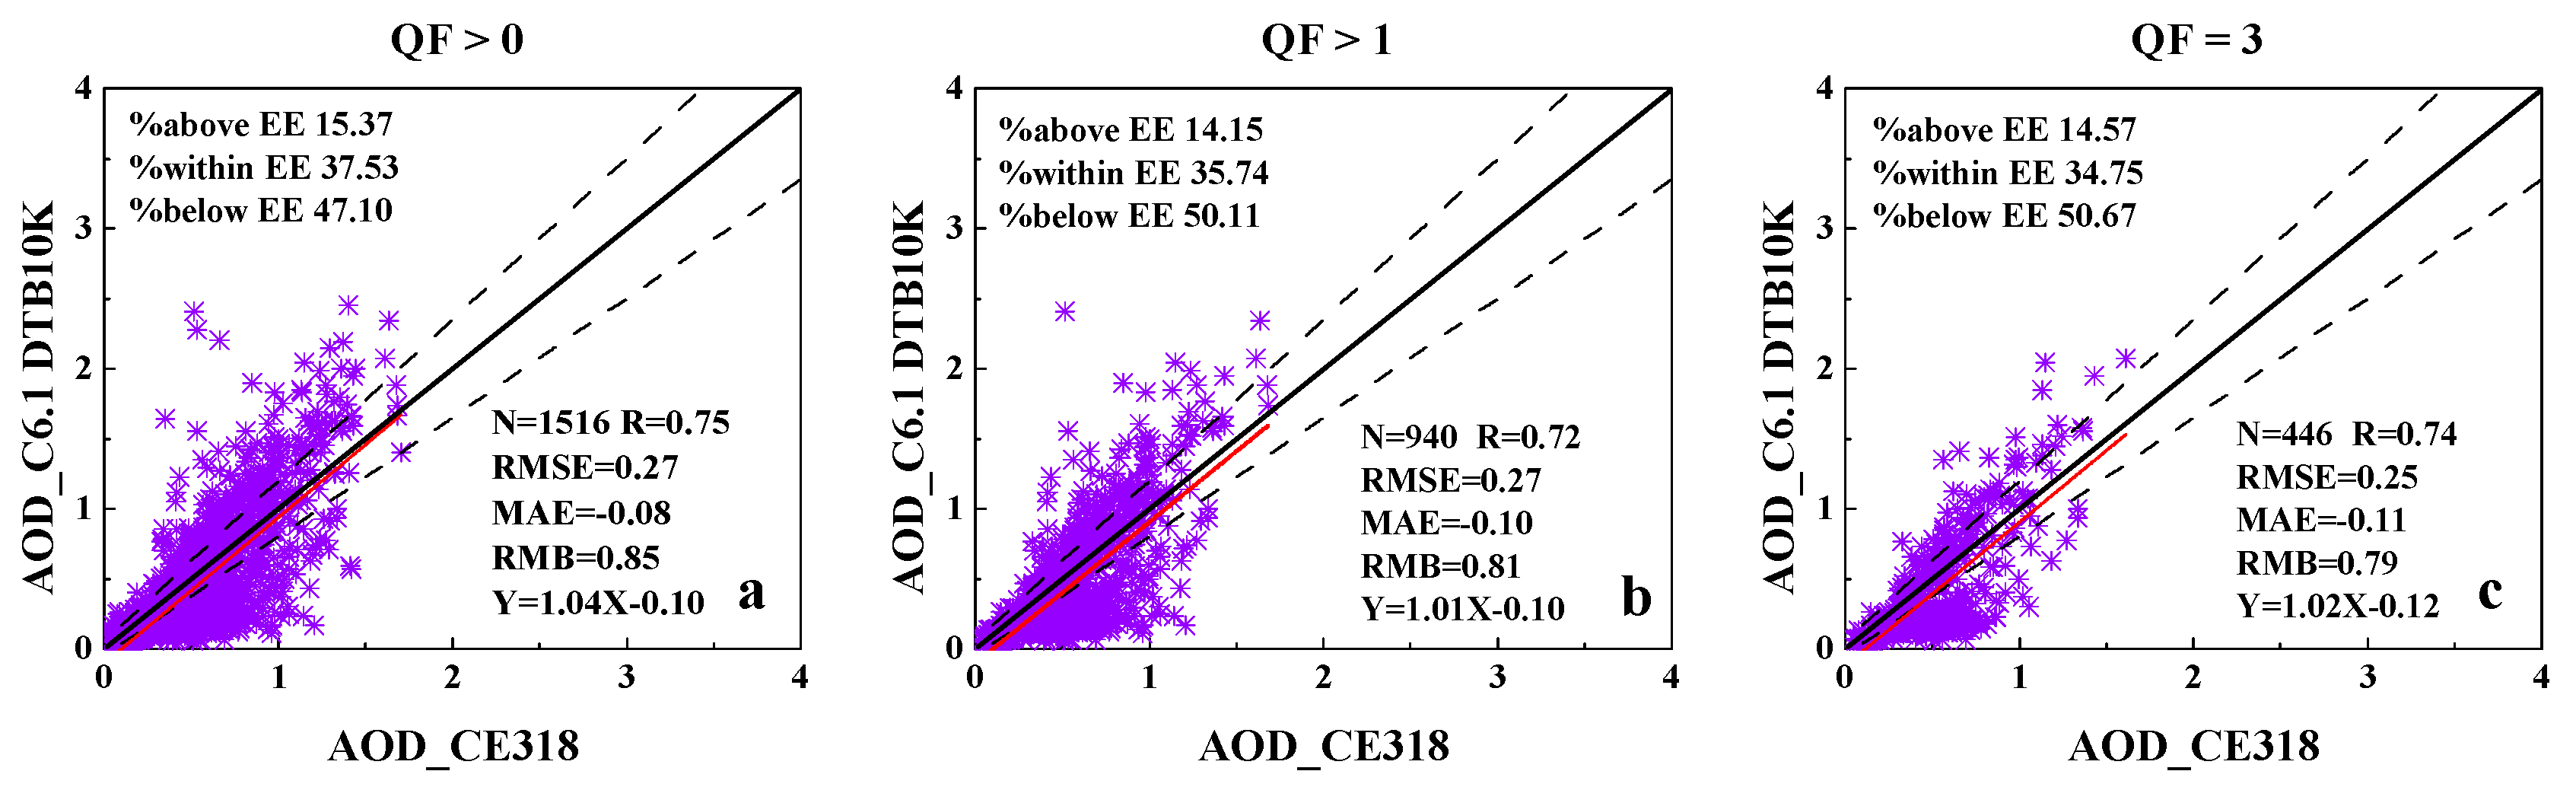
Figure 6.
Validation of the C6.1 DTB10K AOD product at 550 nm against the CE318 AOD observations at 550 nm over the YERB for the period of July 1, 2002 to December 31, 2014. The DT3K AOD retrievals were classified by all (QF > 0, (a)), medium (QF > 1, (b)), and high (QF = 3, (c)) quality flags. The black straight line is the 1:1 line, the red straight line is the regression line, and the EE envelope is within the dashed lines.
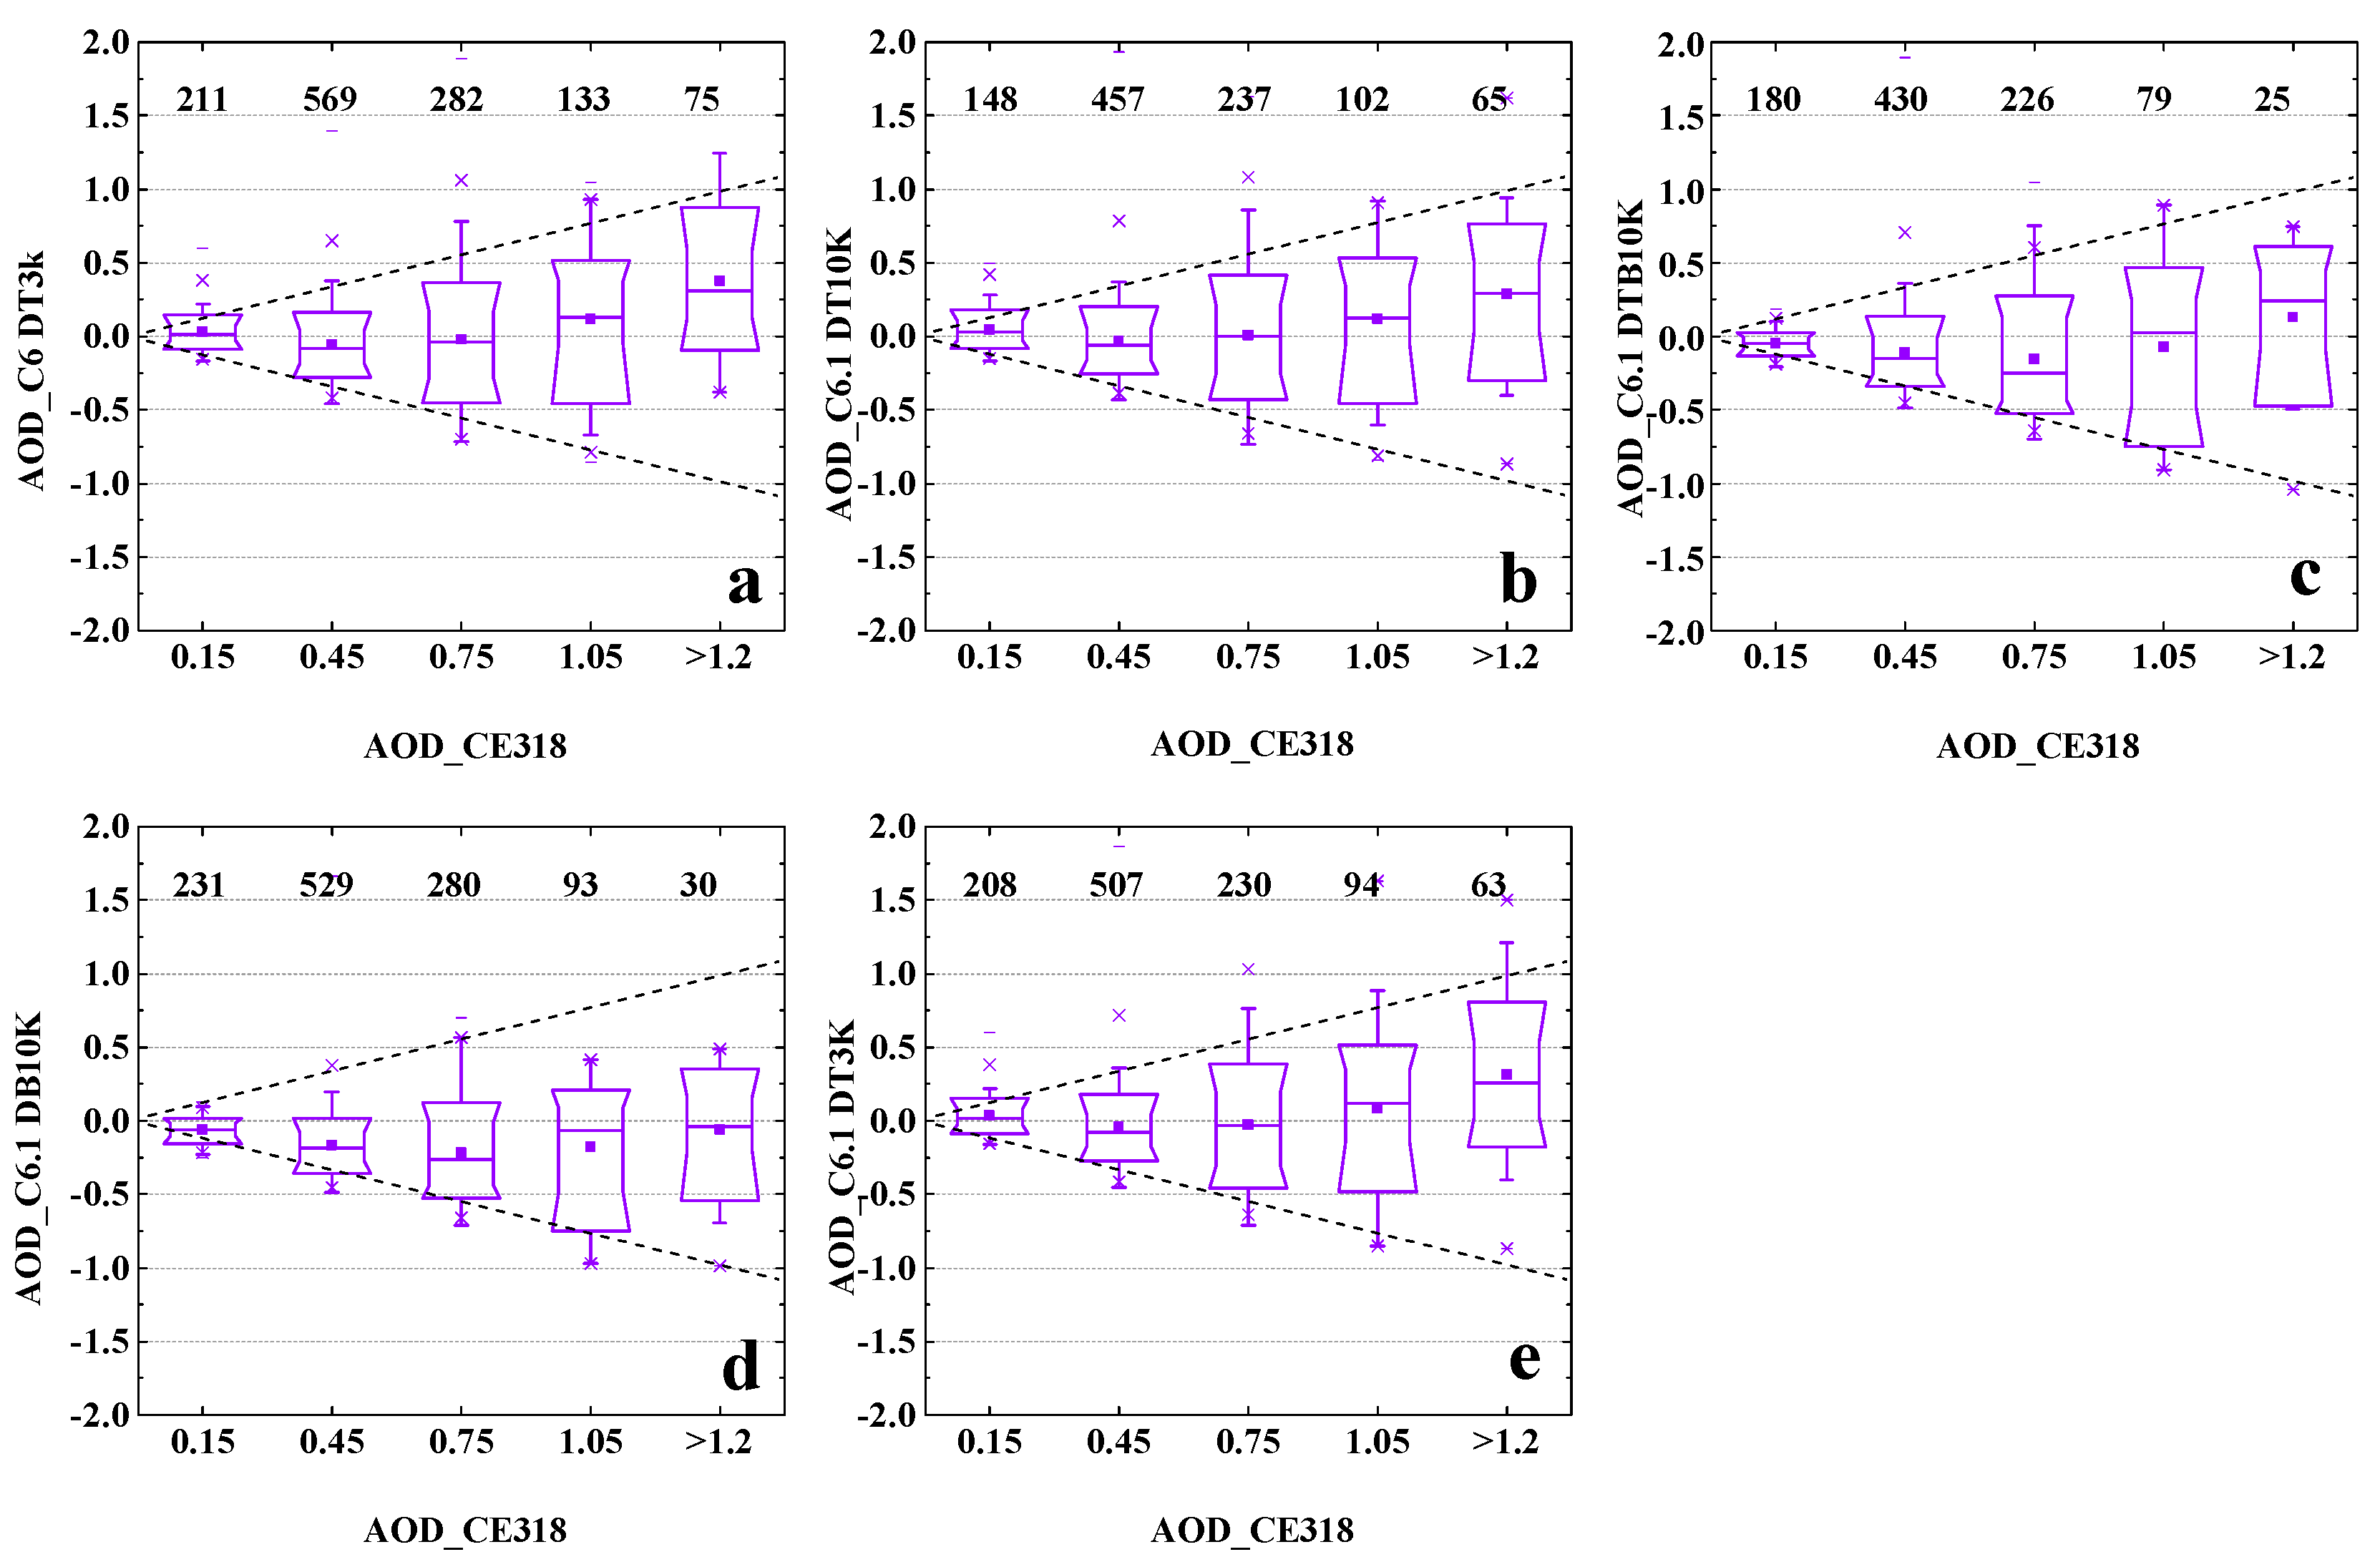
Figure 7.
Box plots of the high-quality (QF = 2, 3) Aqua-MODIS C6 and C6.1 retrieval biases at 550 nm (AOD satellite–AOD CE318) against the CE318 AOD observations at 550 nm over the YERB for the period of July 1, 2002 to December 31, 2014. The EE envelopes are within the dashed lines. The number above each box refers to the corresponding matchups in the different intervals of the CE318 AOD (0–0.3, 0.3–0.6, 0.6–0.9, 0.9–1.2, and >1.2). The C6 DT3K, C6.1 DT10K, C6.1 DTB10K, C6.1 DB10K, and C6.1 DT3K retrieval biases are presented in (a)–(e), respectively.
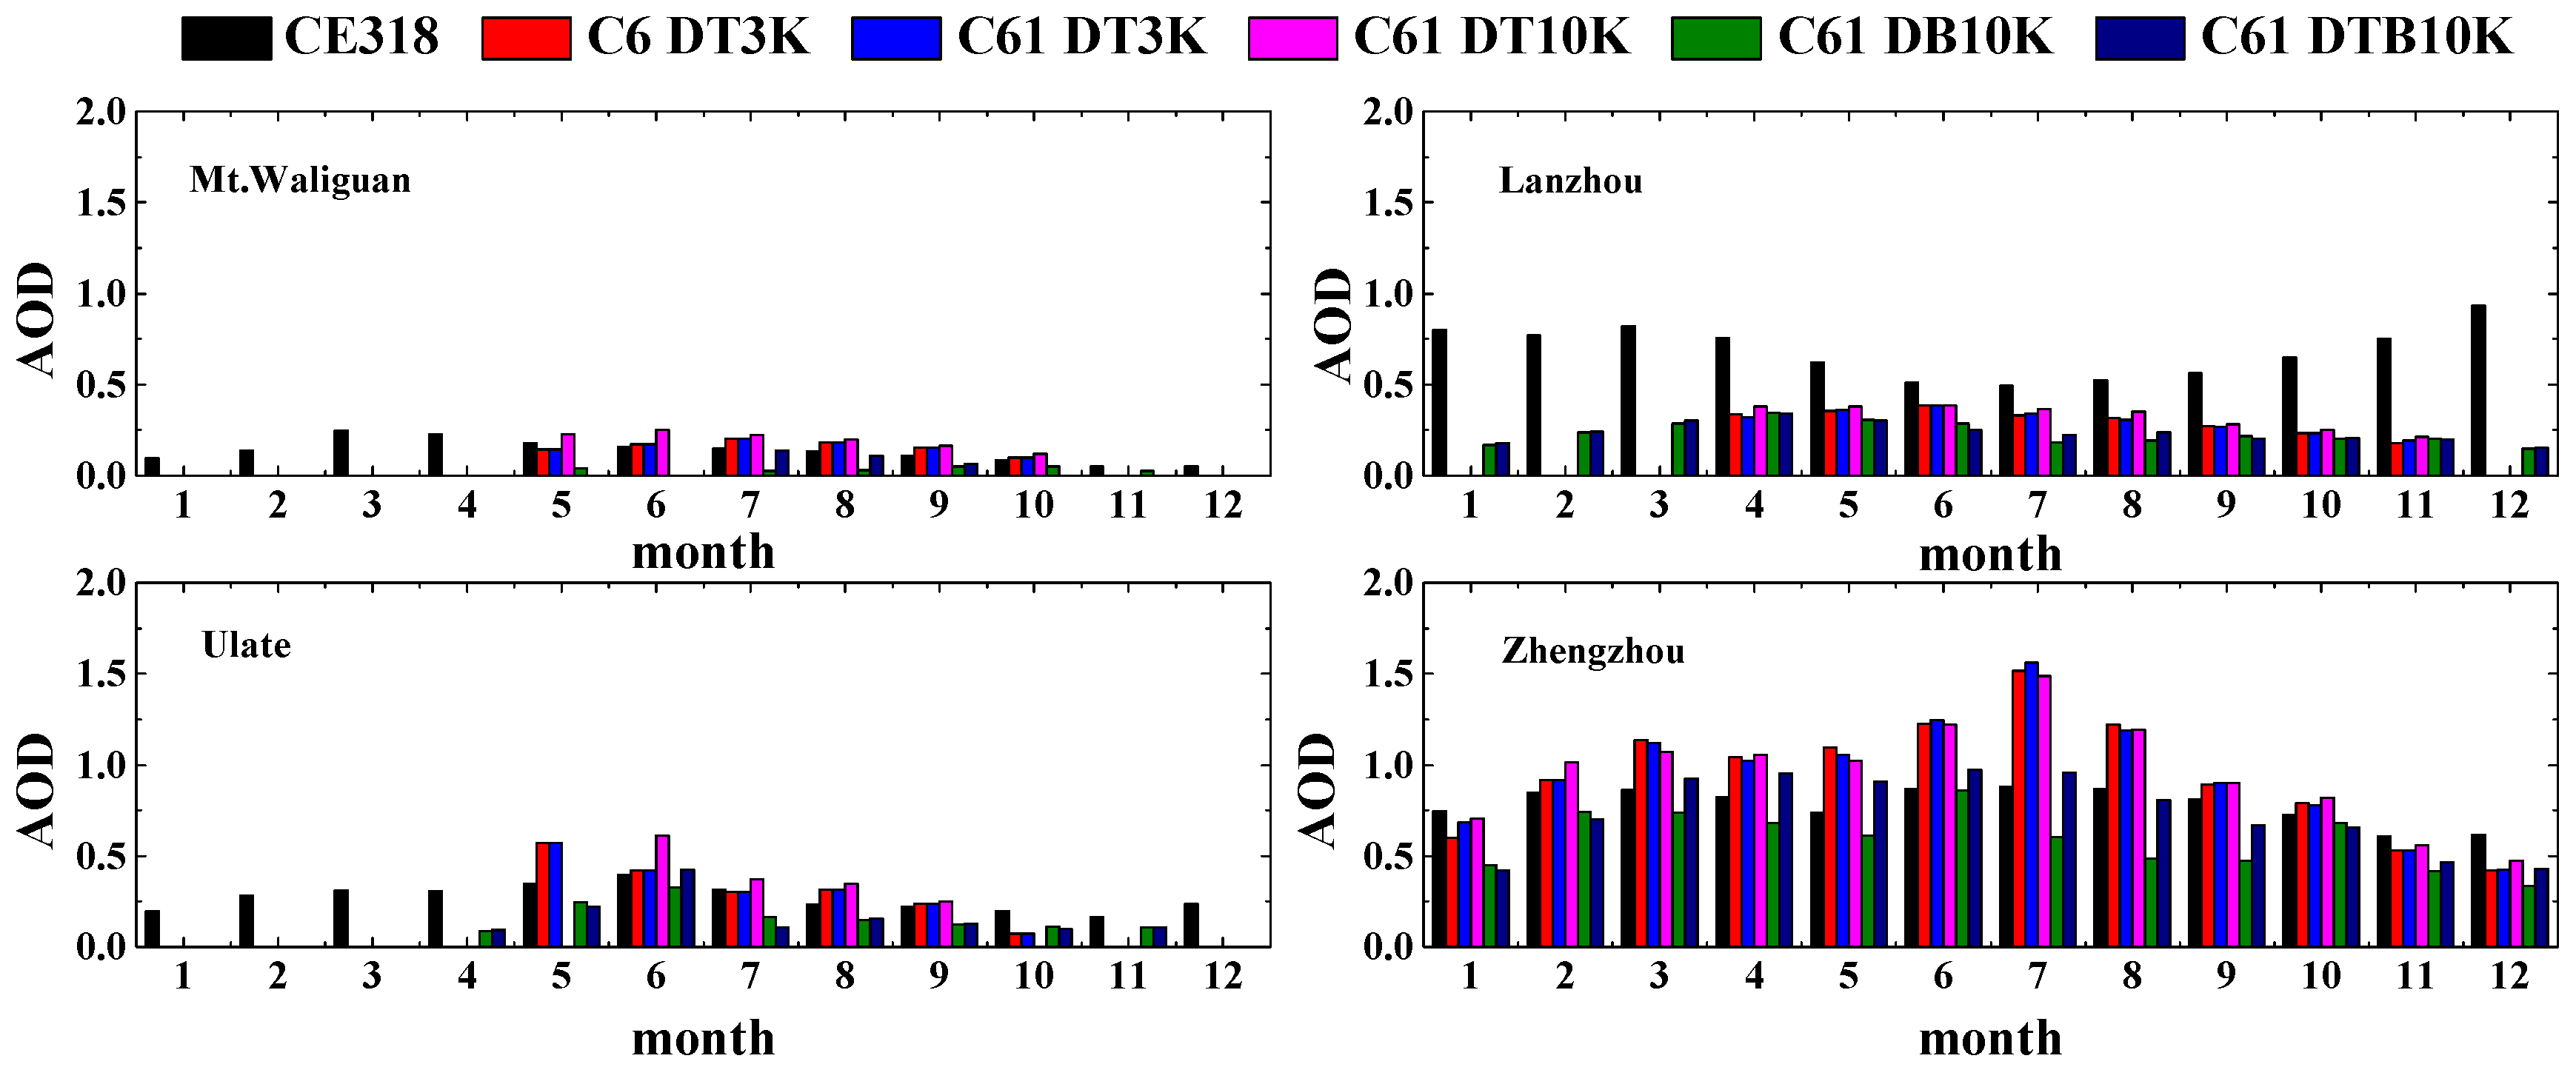
Figure 8.
Seasonal and annual variation of the Aqua-MODIS C6 and C6.1 AOD retrievals (QF = 2, 3) at 550 nm and the CE318 AOD observations at 550 nm, respectively, at MW, LZ, UL, and ZZ for the period of 1 July, 2002 to 31 December, 2014.
Figure 8.
Seasonal and annual variation of the Aqua-MODIS C6 and C6.1 AOD retrievals (QF = 2, 3) at 550 nm and the CE318 AOD observations at 550 nm, respectively, at MW, LZ, UL, and ZZ for the period of 1 July, 2002 to 31 December, 2014.
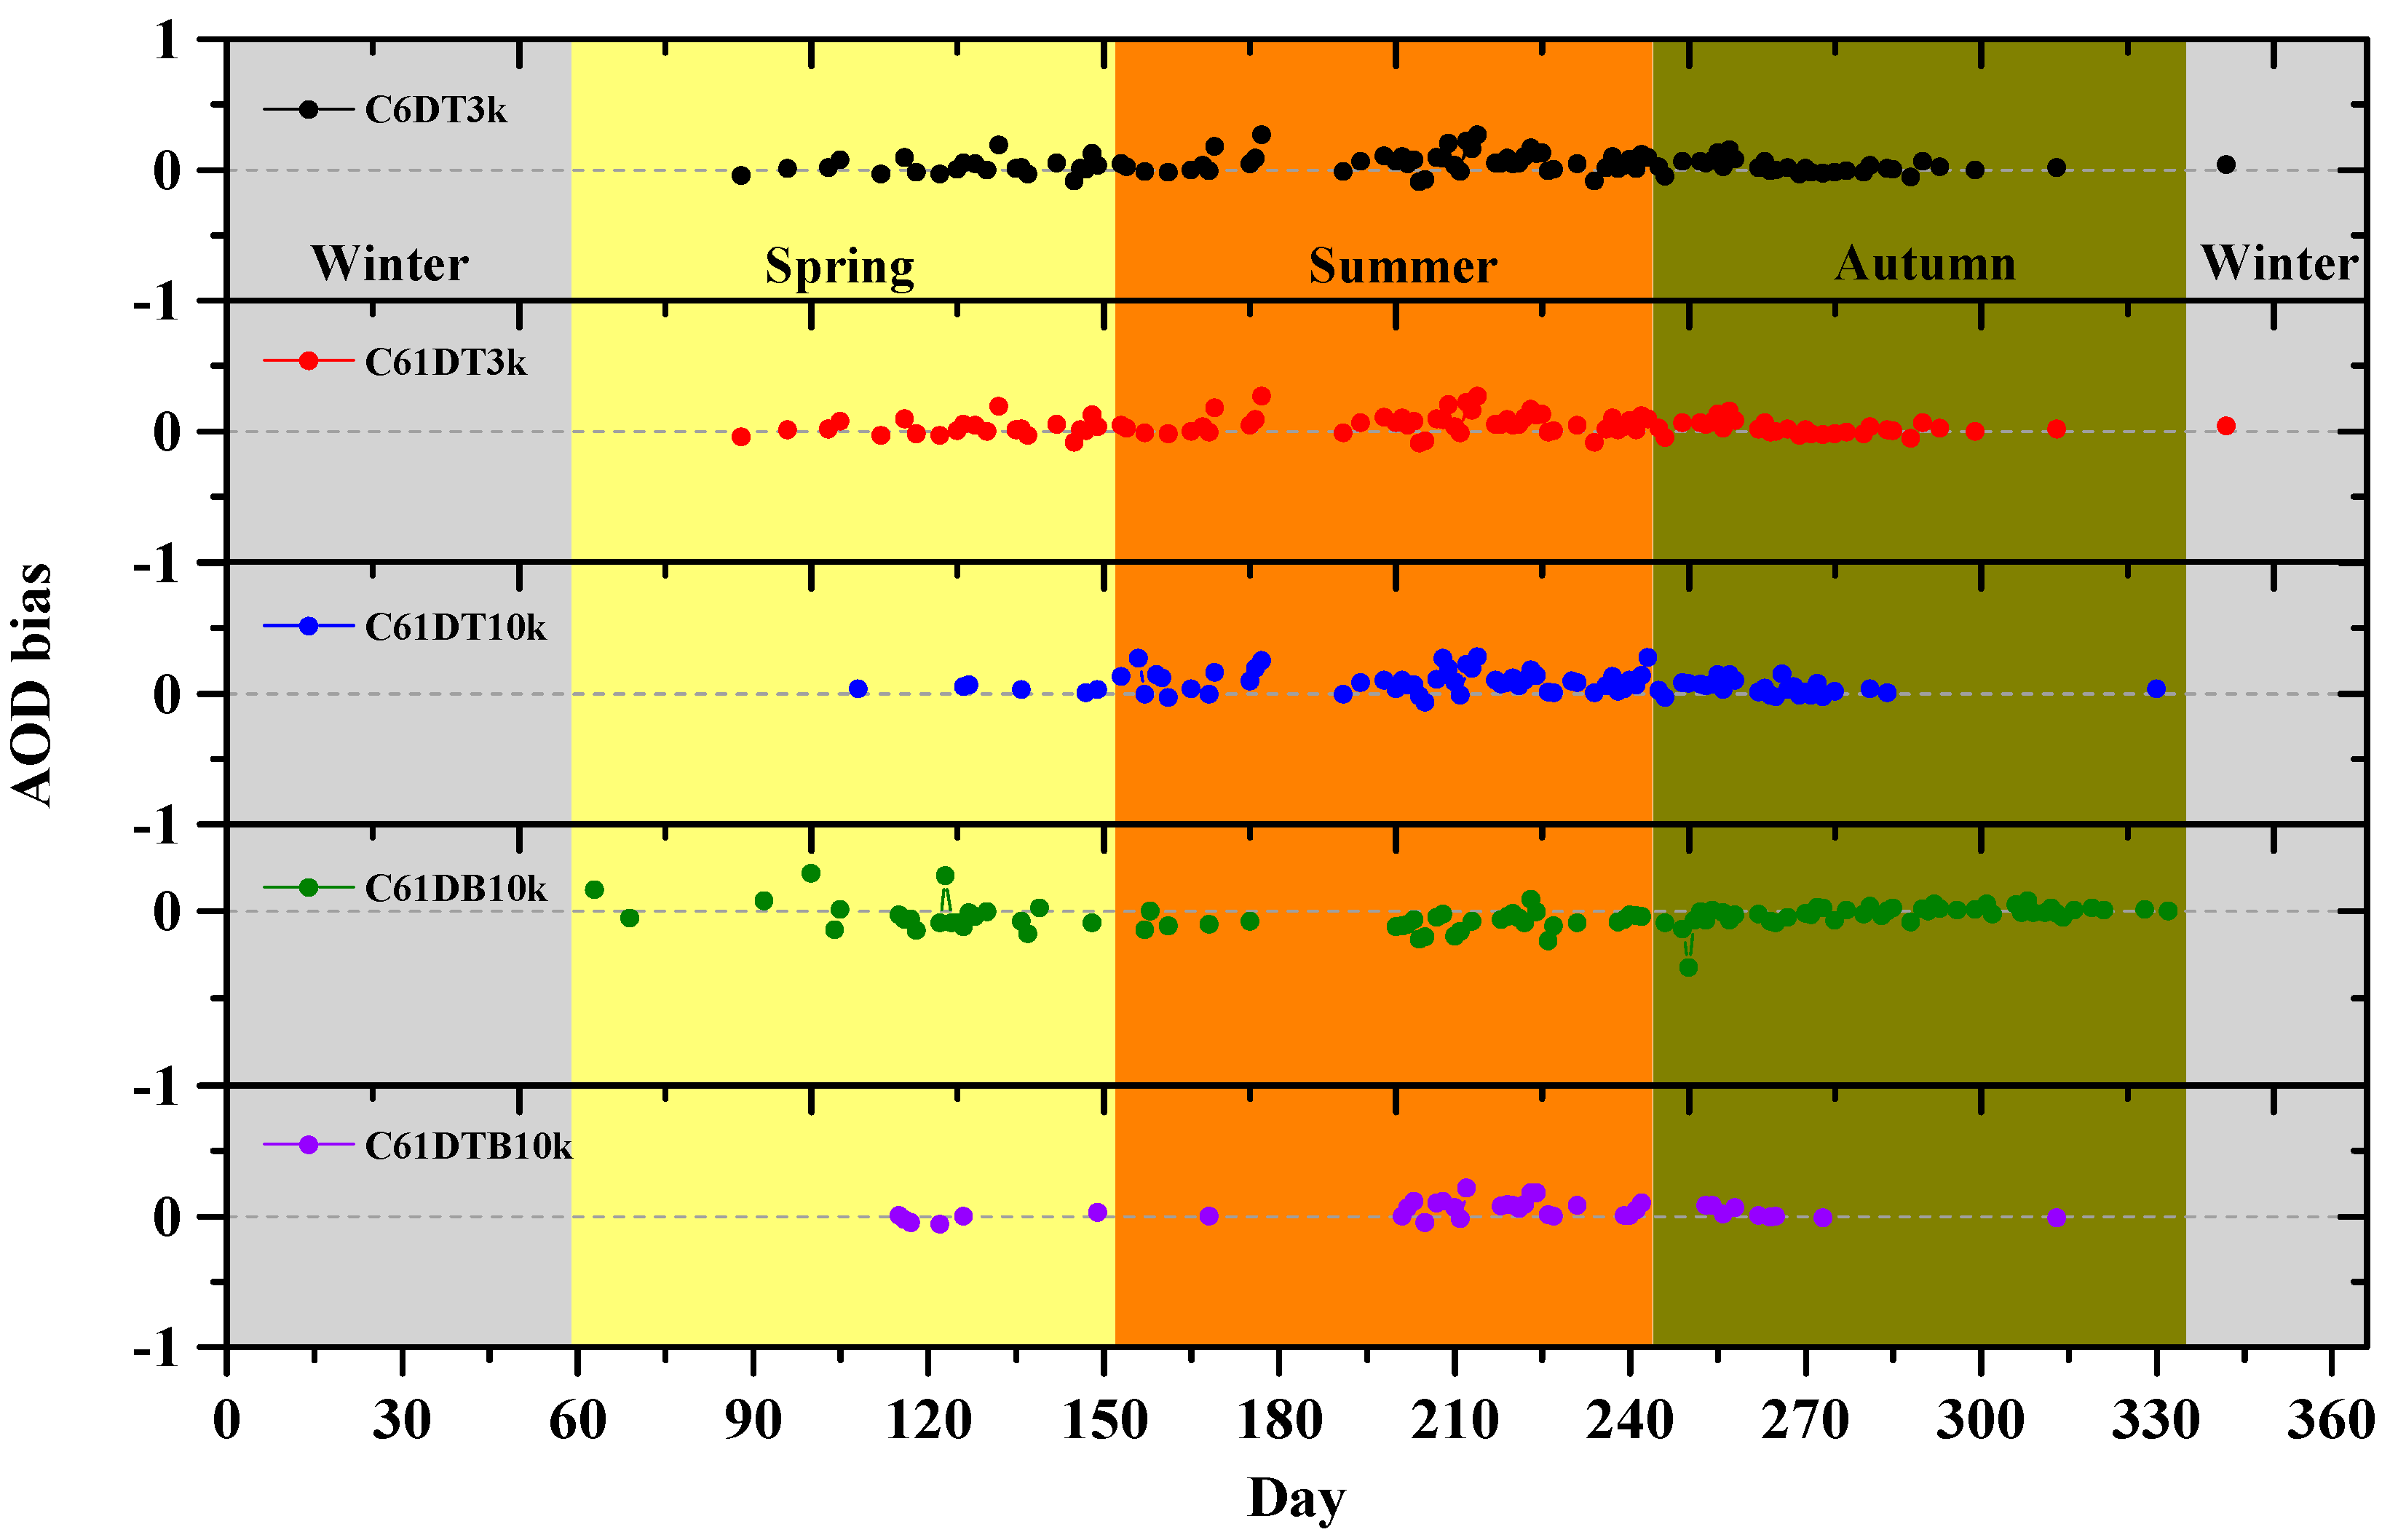
Figure 9.
Seasonal variation of the Aqua-MODIS C6 and C6.1 AOD retrieval biases (QF > 0) of the CE318 AOD observations at 550 nm at the MW site. Note that the y-axis refers to the multi-year daily mean AOD bias values for the period of 1 July, 2002 to 31 December, 2014.
Figure 9.
Seasonal variation of the Aqua-MODIS C6 and C6.1 AOD retrieval biases (QF > 0) of the CE318 AOD observations at 550 nm at the MW site. Note that the y-axis refers to the multi-year daily mean AOD bias values for the period of 1 July, 2002 to 31 December, 2014.
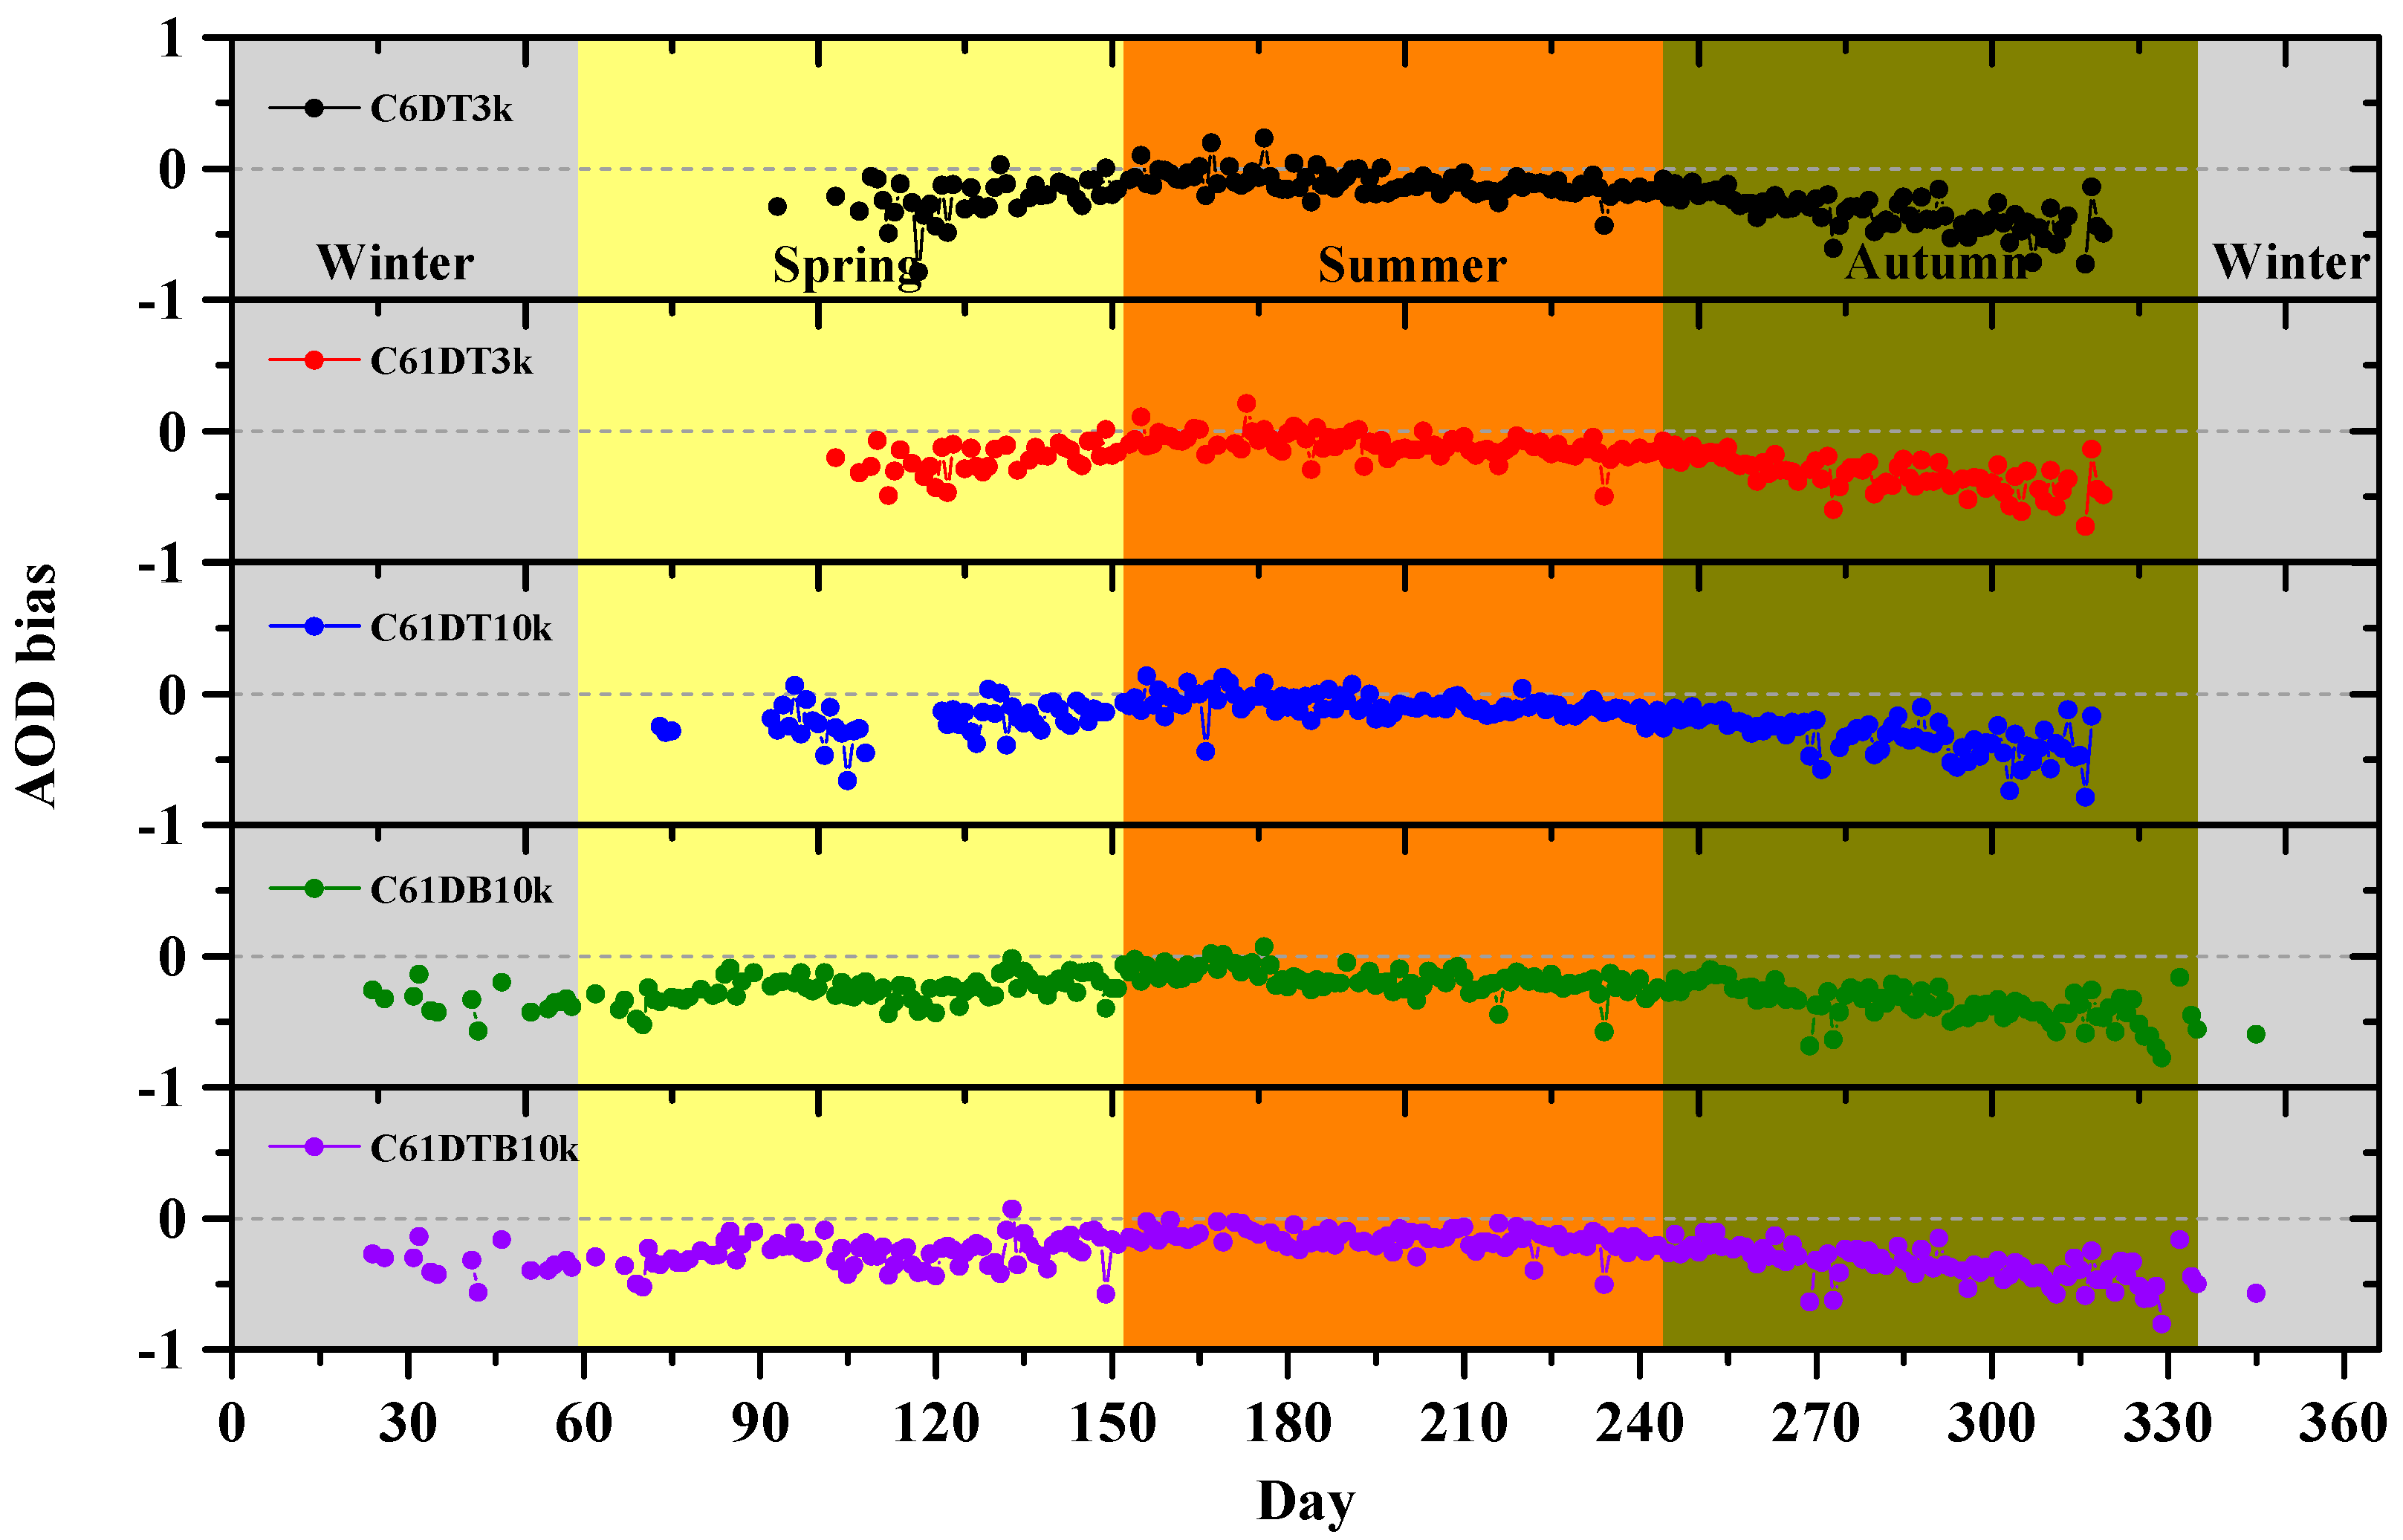
Figure 10.
Seasonal variation of the Aqua-MODIS C6 and C6.1 AOD retrieval biases (QF > 0) of the CE318 AOD observations at 550 nm at the LZ site. Note that the y-axis refers to the multi-year daily mean AOD bias values for the period of 1 July, 2002 to 31 December, 2014.
Figure 10.
Seasonal variation of the Aqua-MODIS C6 and C6.1 AOD retrieval biases (QF > 0) of the CE318 AOD observations at 550 nm at the LZ site. Note that the y-axis refers to the multi-year daily mean AOD bias values for the period of 1 July, 2002 to 31 December, 2014.
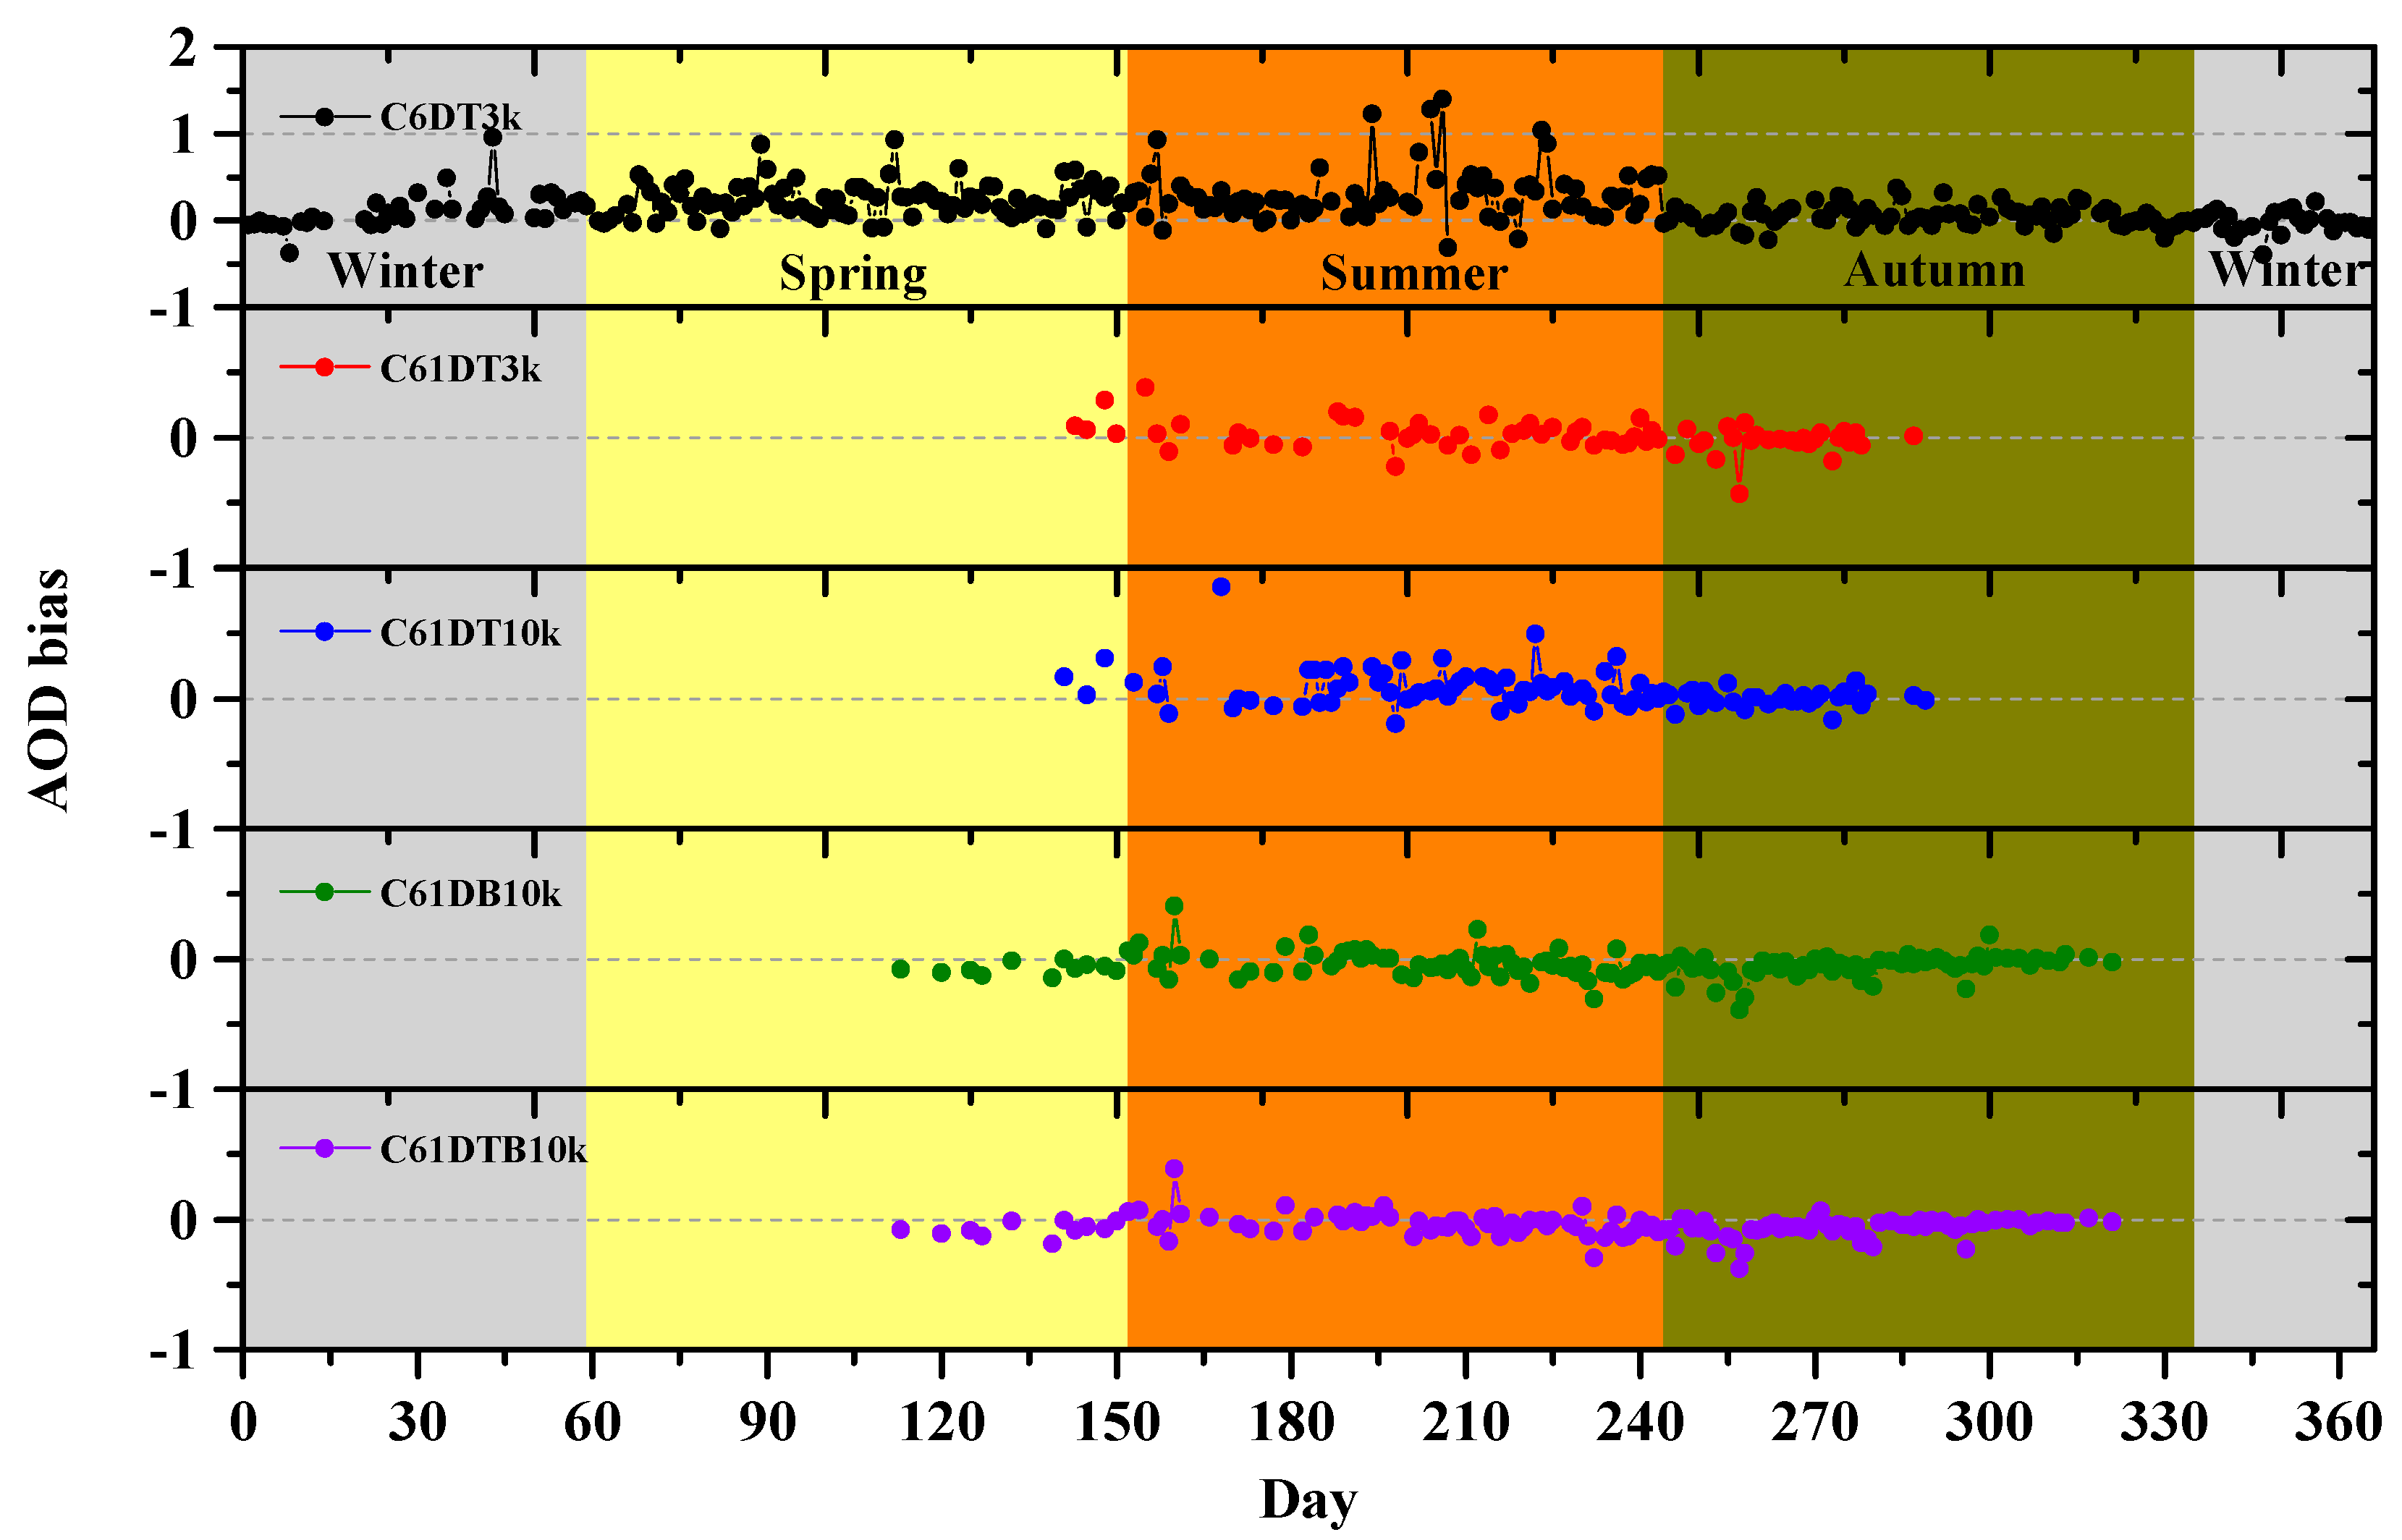
Figure 11.
Seasonal variation of the Aqua-MODIS C6 and C6.1 AOD retrieval biases (QF > 0) of the CE318 AOD observations at 550 nm at the UL site. Note that the y-axis refers to the multi-year daily mean AOD bias values for the period of 1 July, 2002 to 31 December, 2014.
Figure 11.
Seasonal variation of the Aqua-MODIS C6 and C6.1 AOD retrieval biases (QF > 0) of the CE318 AOD observations at 550 nm at the UL site. Note that the y-axis refers to the multi-year daily mean AOD bias values for the period of 1 July, 2002 to 31 December, 2014.
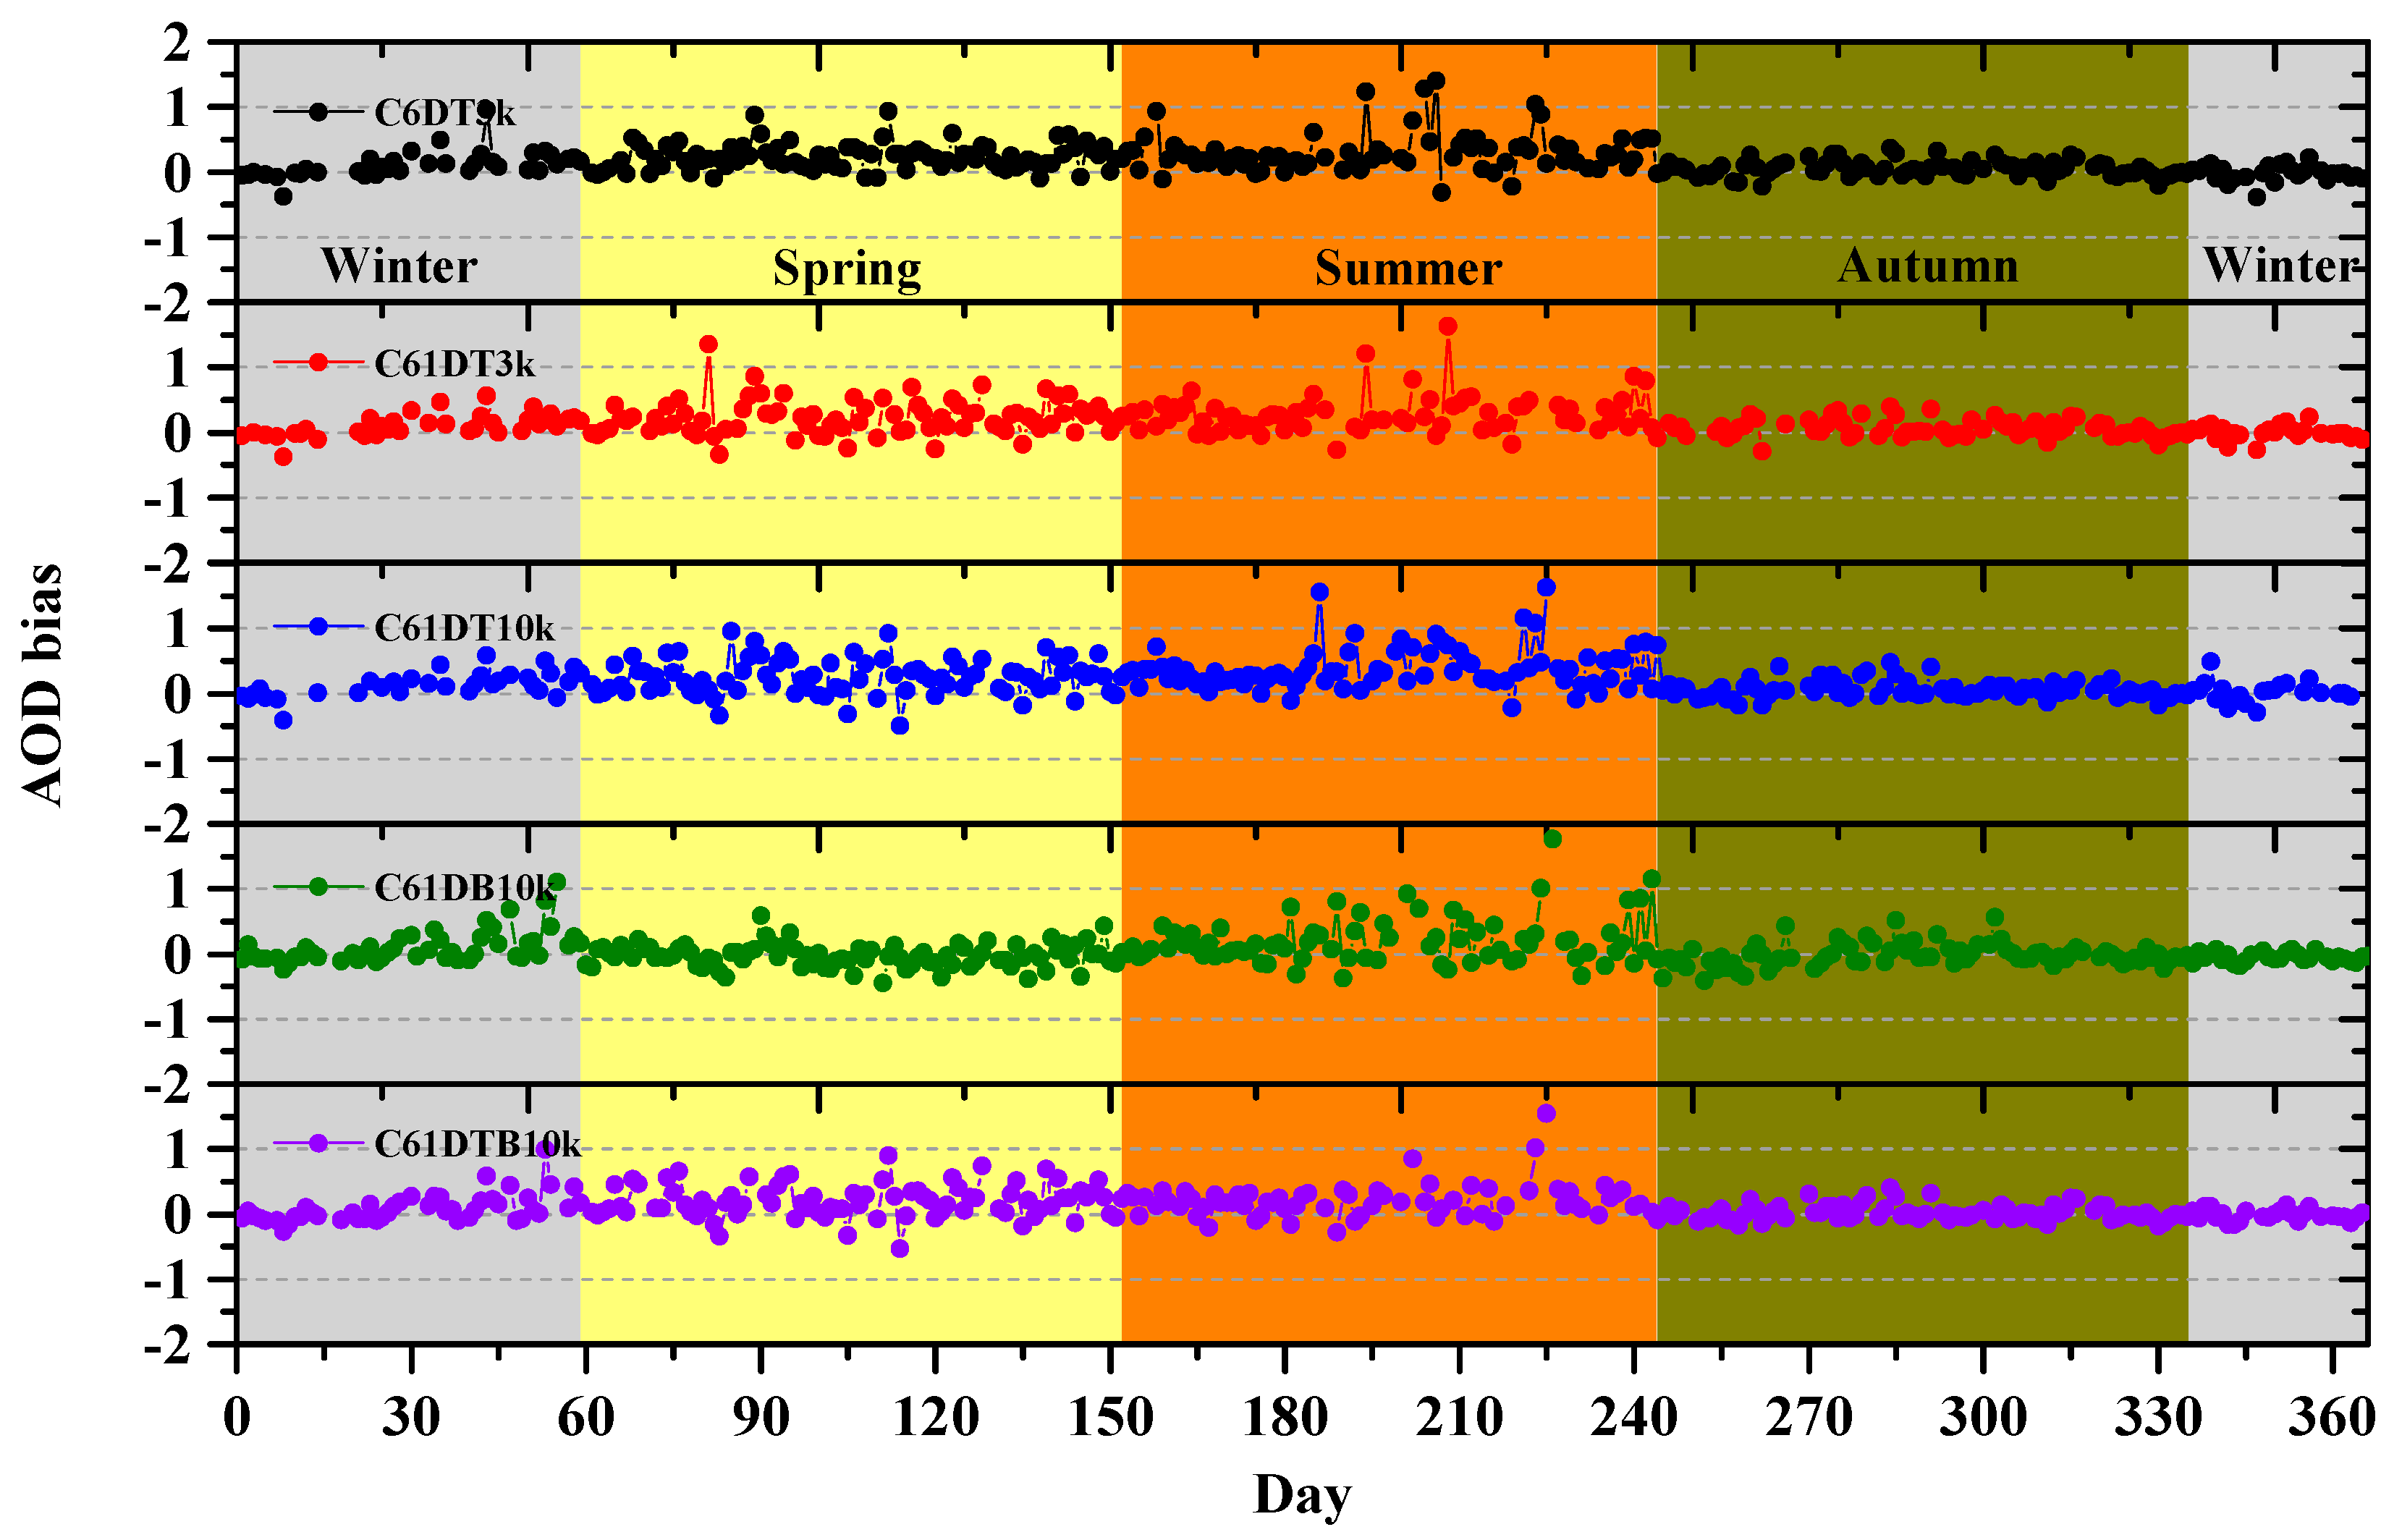
Figure 12.
Seasonal variation of the Aqua-MODIS C6 and C6.1 AOD retrieval biases (QF > 0) of the CE318 AOD observations at 550 nm at the ZZ site. Note that the y-axis refers to the multi-year daily mean AOD bias values for the period of 1 July, 2002 to 31 December, 2014.
Figure 12.
Seasonal variation of the Aqua-MODIS C6 and C6.1 AOD retrieval biases (QF > 0) of the CE318 AOD observations at 550 nm at the ZZ site. Note that the y-axis refers to the multi-year daily mean AOD bias values for the period of 1 July, 2002 to 31 December, 2014.
Figure 13.
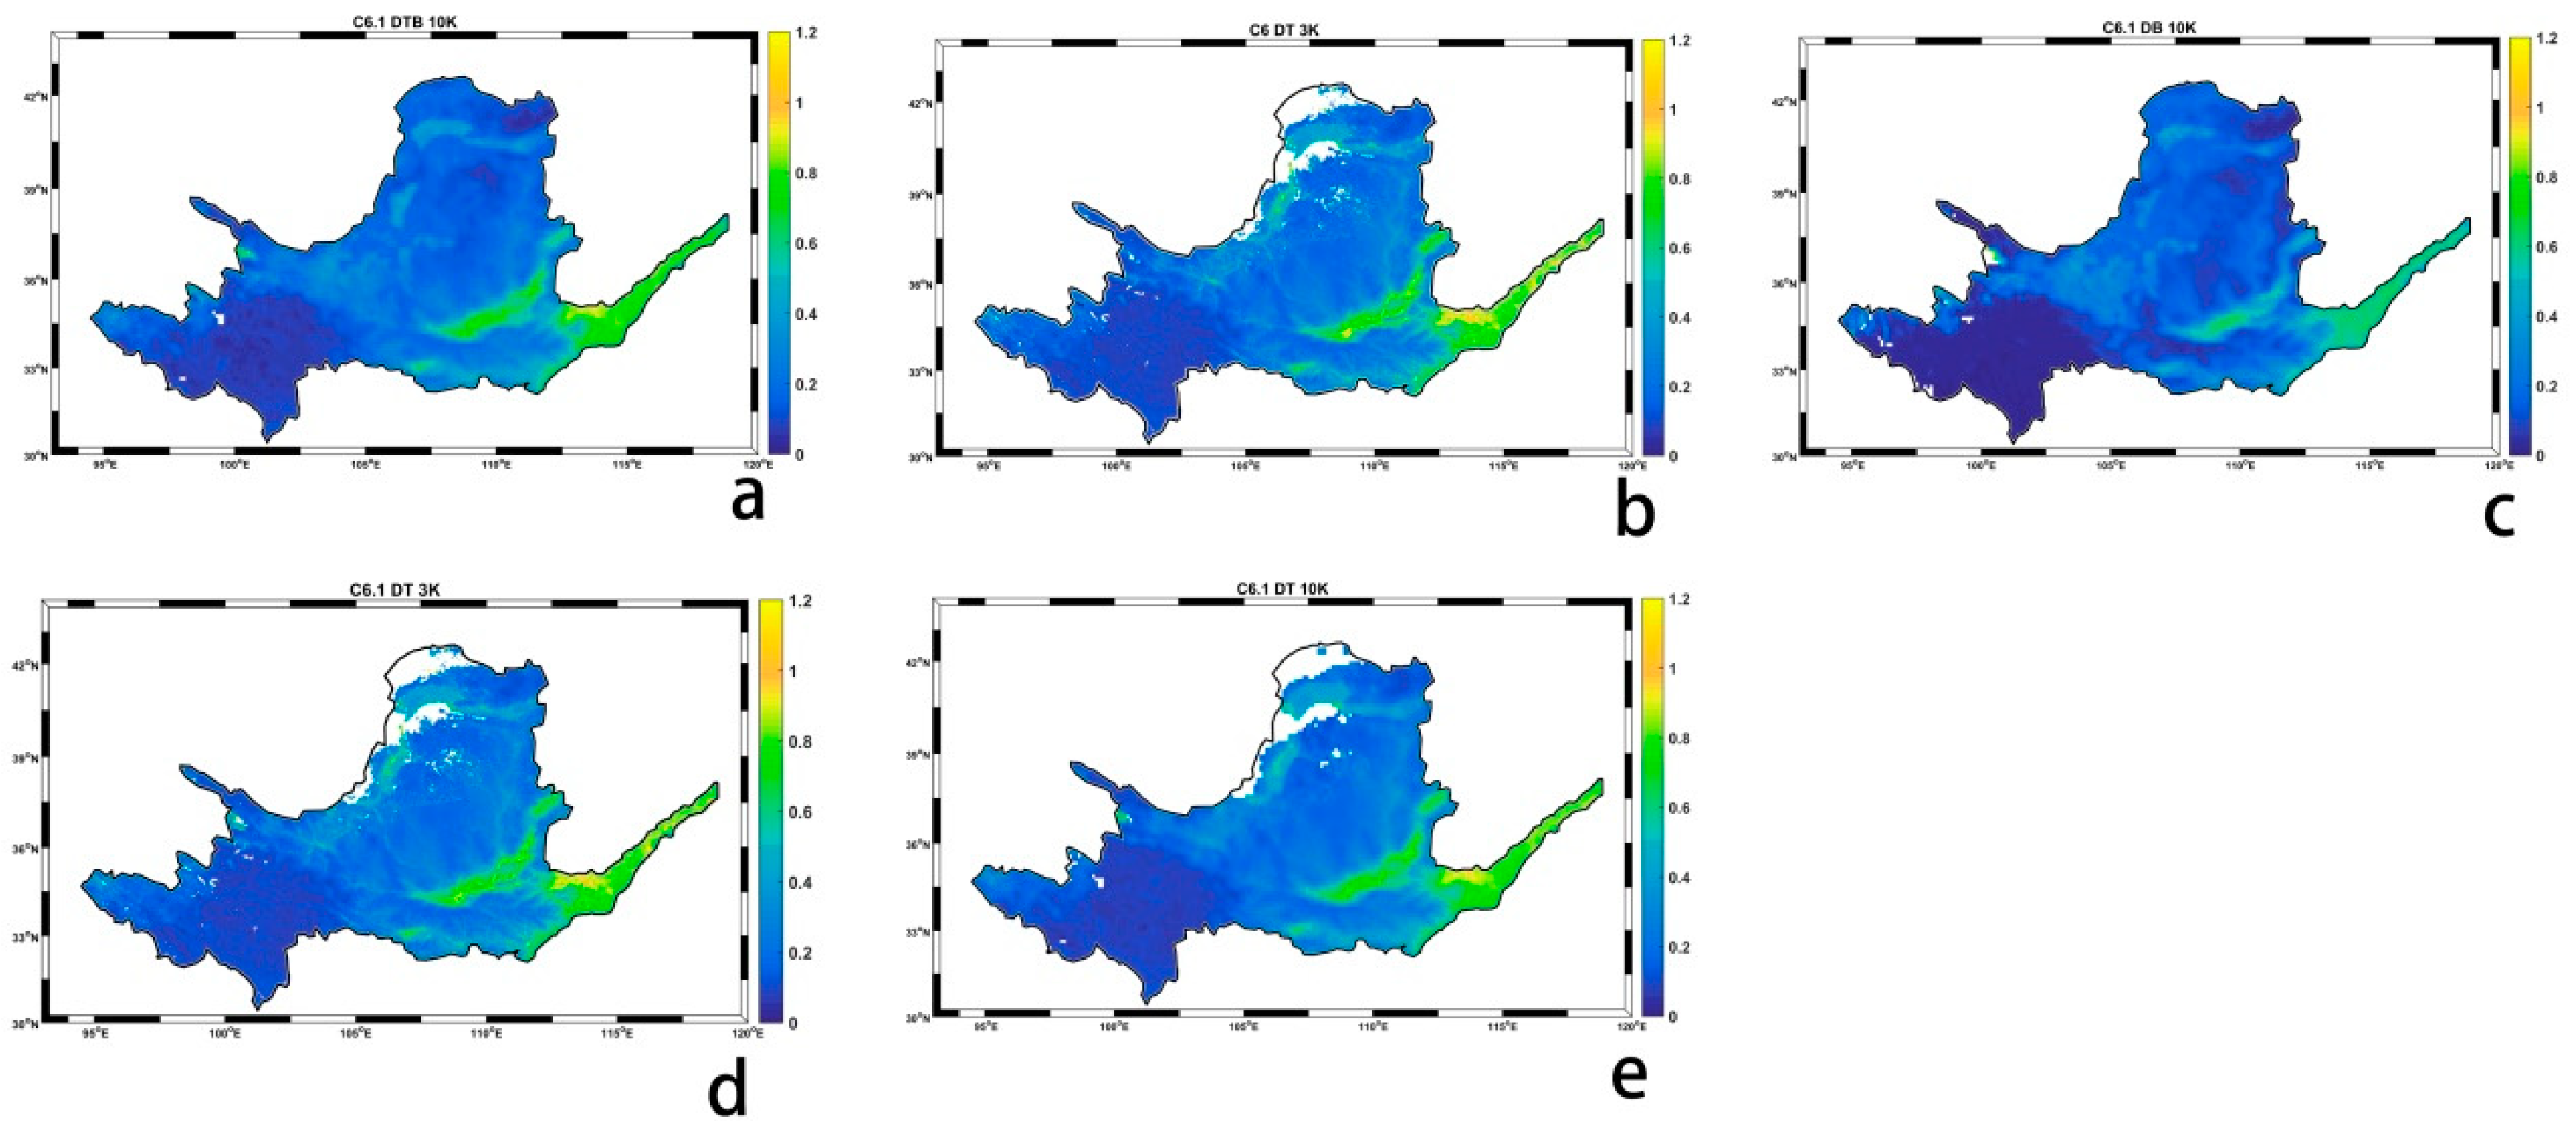
Spatial distribution of the annual high-quality Aqua-MODIS AOD at 550 nm: (a) C6.1 DTB10K AOD, (b) C6 DT3K AOD, (c) C6.1 DB10K AOD, (d) C6.1 DT3K AOD, and (e) C6.1 DT10K AOD retrievals (QF = 3) over the YERB for the period of 1 July, 2002 to 31 December, 2014. The color scale refers to the AOD values.
Figure 13.
Spatial distribution of the annual high-quality Aqua-MODIS AOD at 550 nm: (a) C6.1 DTB10K AOD, (b) C6 DT3K AOD, (c) C6.1 DB10K AOD, (d) C6.1 DT3K AOD, and (e) C6.1 DT10K AOD retrievals (QF = 3) over the YERB for the period of 1 July, 2002 to 31 December, 2014. The color scale refers to the AOD values.
Table 1.
Scientific Data Set (SDS) of the Aqua-MODIS (Moderate Resolution Imaging Spectrometer) Collection (C6) and C61 aerosol optical depth (AOD) products at 550 nm used in this study from April 1, 2002 to December 31, 2014.
Table 1.
Scientific Data Set (SDS) of the Aqua-MODIS (Moderate Resolution Imaging Spectrometer) Collection (C6) and C61 aerosol optical depth (AOD) products at 550 nm used in this study from April 1, 2002 to December 31, 2014.
| Satellite | Product | Aerosol Optical Depth | Quality Flag |
|---|
| Aqua C6 | DT3K | Optical_Depth_Land_And_Ocean | Land_Ocean_Quality_Flag |
| Aqua C6.1 | DT10K | Optical_Depth_Land_And_Ocean | Land_Ocean_Quality_Flag |
| DTB10K | AOD_550_Dark_Target_Deep_Blue_Combined | AOD_550_Dark_Target_Deep_Blue_Combined_QA_Flag |
| DB10K | Deep_Blue_Aerosol_Optical_Depth_550_Land | Deep_Blue_Aerosol_Optical_Depth_550_Land_QA_Flag |
| DT3K | Optical_Depth_Land_And_Ocean | Land_Ocean_Quality_Flag |
Table 2.
Statistics of the Chinese aerosol remote sensing network (CARSNET) CIMEL sunphotometers CE318 ground sites over the YERB from 2002 to 2014 used in this study.
Table 2.
Statistics of the Chinese aerosol remote sensing network (CARSNET) CIMEL sunphotometers CE318 ground sites over the YERB from 2002 to 2014 used in this study.
| Region | CE318 Site | Lon (E) | Lat (N) | Station Type | Quality Flag | Time |
|---|
| Upstream | Mt. Waliguan (MW) | 100.92 | 36.28 | Rural | Level 1.5 | 2009.3–2012.4 |
| Upper and middle reach | Lanzhou (LZ) | 103.88 | 36.05 | Urban | Level 1.5 | 2002.7–2014.1 |
| Midstream | Ulate (UL) | 108.52 | 41.57 | Rural | Level 1.5 | 2002.4–2005.2 |
| Downstream | Zhengzhou (ZZ) | 113.68 | 34.78 | Urban | Level 1.5 | 2007.2–2014.1 |
Table 3.
Comparison of the C6 DT3K AOD products at 550 nm (QF > 0, QF > 1, and QF = 3) with CE318 AOD observations at 550 nm at Mt. Waliguan (MW), Lanzhou (LZ), Ulate (UL), and Zhengzhou (ZZ) for the period of July 1, 2002 to December 31, 2014, where ALL represents all stations’ data.
Table 3.
Comparison of the C6 DT3K AOD products at 550 nm (QF > 0, QF > 1, and QF = 3) with CE318 AOD observations at 550 nm at Mt. Waliguan (MW), Lanzhou (LZ), Ulate (UL), and Zhengzhou (ZZ) for the period of July 1, 2002 to December 31, 2014, where ALL represents all stations’ data.
| Station | QF | N | Slope | Y-int | R | MAE | RMB | RMSE | Within EE% |
|---|
| MW | QF > 0 | 127 | 0.84 | 0.07 | 0.62 | 0.05 | 1.36 | 0.07 | 65.35 |
| QF > 1 | 88 | 0.70 | 0.10 | 0.45 | 0.06 | 1.48 | 0.08 | 57.95 |
| QF = 3 | 41 | 0.86 | 0.10 | 0.43 | 0.08 | 1.64 | 0.09 | 53.66 |
| LZ | QF > 0 | 603 | 0.40 | 0.11 | 0.43 | −0.20 | 0.61 | 0.15 | 28.69 |
| QF > 1 | 508 | 0.38 | 0.12 | 0.45 | –0.20 | 0.61 | 0.13 | 30.12 |
| QF = 3 | 410 | 0.42 | 0.10 | 0.48 | –0.19 | 0.62 | 0.13 | 30.49 |
| UL | QF > 0 | 94 | 0.87 | 0.04 | 0.78 | 0.00 | 1.02 | 0.12 | 70.21 |
| QF > 1 | 42 | 0.94 | 0.05 | 0.76 | 0.03 | 1.14 | 0.13 | 66.67 |
| QF = 3 | -- | -- | -- | -- | -- | -- | -- | -- |
| ZZ | QF > 0 | 664 | 1.27 | –0.03 | 0.85 | 0.17 | 1.23 | 0.28 | 52.26 |
| QF > 1 | 632 | 1.28 | –0.03 | 0.84 | 0.17 | 1.23 | 0.28 | 52.22 |
| QF = 3 | 490 | 1.26 | –0.03 | 0.85 | 0.16 | 1.21 | 0.28 | 51.63 |
| ALL | QF > 0 | 1488 | 1.20 | –0.11 | 0.81 | 0.00 | 1.00 | 0.28 | 44.96 |
| QF > 1 | 1270 | 1.23 | –0.13 | 0.81 | 0.01 | 1.02 | 0.29 | 44.25 |
| QF = 3 | 950 | 1.27 | –0.16 | 0.82 | 0.00 | 1.01 | 0.28 | 42.74 |
Table 4.
Comparison of the C6.1 DT3K AOD product at 550 nm (QF > 0, QF > 1, and QF = 3) against the CE318 AOD observations at 550 nm at MW, LZ, UL, and ZZ for the period of July 1, 2002 to December 31, 2014, where ALL represents all stations’ data.
Table 4.
Comparison of the C6.1 DT3K AOD product at 550 nm (QF > 0, QF > 1, and QF = 3) against the CE318 AOD observations at 550 nm at MW, LZ, UL, and ZZ for the period of July 1, 2002 to December 31, 2014, where ALL represents all stations’ data.
| Station | QF | N | Slope | Y-int | R | MAE | RMB | RMSE | Within EE% |
|---|
| MW | QF > 0 | 127 | 0.84 | 0.07 | 0.62 | 0.05 | 1.36 | 0.07 | 65.35 |
| QF > 1 | 88 | 0.70 | 0.10 | 0.45 | 0.06 | 1.48 | 0.08 | 57.95 |
| QF = 3 | 41 | 0.86 | 0.10 | 0.43 | 0.08 | 1.64 | 0.09 | 53.66 |
| LZ | QF > 0 | 532 | 0.39 | 0.11 | 0.44 | –0.20 | 0.61 | 0.14 | 29.32 |
| QF > 1 | 451 | 0.37 | 0.12 | 0.45 | –0.19 | 0.62 | 0.13 | 30.82 |
| QF = 3 | 365 | 0.39 | 0.11 | 0.48 | –0.19 | 0.62 | 0.12 | 32.05 |
| UL | QF > 0 | 94 | 0.87 | 0.04 | 0.78 | 0.00 | 1.02 | 0.12 | 70.21 |
| QF > 1 | 42 | 0.94 | 0.05 | 0.76 | 0.03 | 1.14 | 0.13 | 66.67 |
| QF = 3 | 9 | 1.24 | 0.02 | 0.77 | 0.09 | 1.32 | 0.13 | 66.67 |
| ZZ | QF > 0 | 554 | 1.21 | 0.02 | 0.81 | 0.16 | 1.23 | 0.31 | 50.36 |
| QF > 1 | 521 | 1.21 | 0.02 | 0.81 | 0.16 | 1.23 | 0.31 | 50.29 |
| QF = 3 | 402 | 1.17 | 0.03 | 0.80 | 0.16 | 1.22 | 0.30 | 50.25 |
| ALL | QF > 0 | 1307 | 1.14 | –0.08 | 0.78 | –0.01 | 0.99 | 0.29 | 44.68 |
| QF > 1 | 1270 | 1.23 | –0.13 | 0.81 | 0.01 | 1.02 | 0.29 | 44.25 |
| QF = 3 | 950 | 1.27 | –0.16 | 0.82 | 0.00 | 1.01 | 0.28 | 42.74 |
Table 5.
Comparison of the C6.1 DT10K AOD product (QF > 0, QF > 1, and QF = 3) against the CE318 AOD observations at 550 nm at MW, LZ, UL, and ZZ for the period of July 1, 2002 to December 31, 2014, where ALL represents all stations’ data.
Table 5.
Comparison of the C6.1 DT10K AOD product (QF > 0, QF > 1, and QF = 3) against the CE318 AOD observations at 550 nm at MW, LZ, UL, and ZZ for the period of July 1, 2002 to December 31, 2014, where ALL represents all stations’ data.
| Station | QF | N | Slope | Y-int | R | MAE | RMB | RMSE | Within EE% |
|---|
| MW | QF > 0 | 111 | 0.91 | 0.09 | 0.54 | 0.08 | 1.62 | 0.08 | 50.45 |
| QF > 1 | 53 | 0.66 | 0.14 | 0.38 | 0.10 | 1.78 | 0.09 | 37.74 |
| QF = 3 | 6 | 1.36 | 0.02 | 0.81 | 0.07 | 1.50 | 0.07 | 66.67 |
| LZ | QF > 0 | 721 | 0.43 | 0.13 | 0.46 | –0.17 | 0.68 | 0.15 | 35.92 |
| QF > 1 | 410 | 0.52 | 0.07 | 0.54 | –0.18 | 0.66 | 0.14 | 36.34 |
| QF = 3 | 108 | 0.21 | 0.15 | 0.34 | –0.21 | 0.53 | 0.09 | 18.52 |
| UL | QF > 0 | 145 | 1.12 | 0.03 | 0.77 | 0.06 | 1.25 | 0.14 | 58.62 |
| QF > 1 | 39 | 1.29 | 0.03 | 0.73 | 0.10 | 1.42 | 0.17 | 46.15 |
| QF = 3 | 2 | 0.23 | 0.20 | 1.00 | –0.01 | 0.95 | 0.00 | 0.00 |
| ZZ | QF > 0 | 697 | 1.25 | 0.02 | 0.79 | 0.21 | 1.28 | 0.35 | 46.63 |
| QF > 1 | 583 | 1.23 | 0.01 | 0.82 | 0.19 | 1.25 | 0.31 | 48.71 |
| QF = 3 | 23 | 1.30 | –0.05 | 0.90 | 0.13 | 1.22 | 0.16 | 47.83 |
| ALL | QF > 0 | 1674 | 1.19 | –0.08 | 0.78 | 0.03 | 1.05 | 0.31 | 43.31 |
| QF > 1 | 1085 | 1.25 | –0.11 | 0.81 | 0.04 | 1.07 | 0.30 | 43.41 |
| QF = 3 | 139 | 0.74 | –0.02 | 0.58 | –0.14 | 0.69 | 0.19 | 25.18 |
Table 6.
Comparison of the C6.1 DB10K AOD products at 550 nm (QF > 0, QF > 1, and QF = 3) against the CE318 AOD observations at 550 nm at MW, LZ, UL, and ZZ for the period of July 1, 2002 to December 31, 2014, where ALL represents all stations’ data.
Table 6.
Comparison of the C6.1 DB10K AOD products at 550 nm (QF > 0, QF > 1, and QF = 3) against the CE318 AOD observations at 550 nm at MW, LZ, UL, and ZZ for the period of July 1, 2002 to December 31, 2014, where ALL represents all stations’ data.
| Station | QF | N | Slope | Y-int | R | MAE | RMB | RMSE | Within EE% |
|---|
| MW | QF > 0 | 111 | 0.59 | 0.02 | 0.66 | –0.03 | 0.73 | 0.06 | 74.77 |
| QF > 1 | 6 | –0.12 | 0.04 | 0.31 | –0.02 | 0.60 | 0.01 | 83.33 |
| QF = 3 | -- | -- | -- | -- | -- | -- | -- | -- |
| LZ | QF > 0 | 843 | 0.35 | 0.09 | 0.46 | –0.26 | 0.52 | 0.13 | 16.49 |
| QF > 1 | 511 | 0.34 | 0.06 | 0.49 | –0.30 | 0.45 | 0.11 | 9.20 |
| QF = 3 | 231 | 0.33 | 0.03 | 0.59 | –0.35 | 0.38 | 0.09 | 1.73 |
| UL | QF > 0 | 221 | 0.77 | 0.00 | 0.77 | –0.05 | 0.77 | 0.09 | 55.66 |
| QF > 1 | 151 | 0.71 | 0.00 | 0.72 | –0.06 | 0.70 | 0.09 | 53.64 |
| QF = 3 | 79 | 0.42 | 0.02 | 0.69 | –0.09 | 0.54 | 0.06 | 48.10 |
| ZZ | QF > 0 | 686 | 1.20 | –0.11 | 0.82 | 0.03 | 1.05 | 0.30 | 56.27 |
| QF > 1 | 495 | 1.06 | –0.07 | 0.85 | –0.04 | 0.94 | 0.21 | 61.62 |
| QF = 3 | 267 | 1.06 | –0.09 | 0.89 | –0.06 | 0.89 | 0.15 | 61.80 |
| ALL | QF > 0 | 1861 | 1.03 | –0.13 | 0.78 | –0.11 | 0.79 | 0.26 | 39.28 |
| QF > 1 | 1163 | 0.90 | –0.10 | 0.75 | –0.16 | 0.71 | 0.22 | 37.66 |
| QF = 3 | 577 | 0.73 | –0.05 | 0.70 | –0.18 | 0.63 | 0.19 | 35.88 |
Table 7.
Validation of the C6.1 DTB10K AOD product at 550 nm (QF > 0, QF > 1, and QF = 3) against the CE318 AOD observations at 550 nm at MW, LZ, UL, and ZZ for the period of 1 July, 2002 to 31 December, 2014, where ALL represents all stations’ data.
Table 7.
Validation of the C6.1 DTB10K AOD product at 550 nm (QF > 0, QF > 1, and QF = 3) against the CE318 AOD observations at 550 nm at MW, LZ, UL, and ZZ for the period of 1 July, 2002 to 31 December, 2014, where ALL represents all stations’ data.
| Station | QF | N | Slope | Y-int | R | MAE | RMB | RMSE | Within EE% |
|---|
| MW | QF > 0 | 40 | 0.81 | 0.07 | 0.82 | 0.04 | 1.32 | 0.06 | 62.50 |
| QF > 1 | 7 | 0.94 | 0.02 | 0.89 | 0.01 | 1.12 | 0.03 | 100.00 |
| QF = 3 | -- | -- | -- | -- | -- | -- | -- | -- |
| LZ | QF > 0 | 707 | 0.37 | 0.09 | 0.48 | –0.26 | 0.53 | 0.12 | 16.83 |
| QF > 1 | 419 | 0.30 | 0.08 | 0.49 | –0.30 | 0.45 | 0.10 | 7.40 |
| QF = 3 | 180 | 0.30 | 0.05 | 0.54 | –0.33 | 0.39 | 0.08 | 3.33 |
| UL | QF > 0 | 199 | 0.81 | –0.01 | 0.80 | –0.06 | 0.74 | 0.09 | 57.29 |
| QF > 1 | 126 | 0.71 | –0.01 | 0.74 | –0.06 | 0.68 | 0.08 | 57.94 |
| QF = 3 | 70 | 0.48 | 0.01 | 0.72 | –0.08 | 0.55 | 0.05 | 50.00 |
| ZZ | QF > 0 | 570 | 1.16 | 0.01 | 0.82 | 0.12 | 1.17 | 0.27 | 54.56 |
| QF > 1 | 388 | 1.17 | 0.00 | 0.83 | 0.11 | 1.16 | 0.24 | 57.99 |
| QF = 3 | 196 | 1.17 | –0.01 | 0.87 | 0.09 | 1.15 | 0.20 | 58.16 |
| ALL | QF > 0 | 1516 | 1.04 | –0.10 | 0.75 | –0.08 | 0.85 | 0.27 | 37.53 |
| QF > 1 | 940 | 1.01 | –0.10 | 0.72 | –0.10 | 0.81 | 0.27 | 35.74 |
| QF = 3 | 446 | 1.02 | –0.12 | 0.74 | –0.11 | 0.79 | 0.25 | 34.75 |
Table 8.
Relative mean bias (RMB) values of MODIS-CE318 coincident retrievals at 550 nm at MW, LZ, UL, and ZZ for the period of July 1, 2002 to December 31, 2014, where ALL represents all stations’ data.
Table 8.
Relative mean bias (RMB) values of MODIS-CE318 coincident retrievals at 550 nm at MW, LZ, UL, and ZZ for the period of July 1, 2002 to December 31, 2014, where ALL represents all stations’ data.
| Aqua-MODIS Level 2 Aerosol Products (MYD04_L2/MYD04_3K) |
|---|
| Sites | DT3K C6 | DT3K C6.1 | DT10K C6.1 | DB10K C6.1 | DTB10K C6.1 |
|---|
| MW | -- | -- | -- | -- | -- |
| LZ | 0.61 | 0.62 | 0.67 | 0.45 | 0.46 |
| UL | -- | -- | -- | -- | -- |
| ZZ | 1.22 | 1.22 | 1.27 | 0.96 | 1.16 |
| ALL | 1.01 | 1.00 | 0.94 | 0.71 | 0.82 |


 ,
, 


