Quantification of Evaporative Sources of Precipitation and Its Changes in the Southeastern Tibetan Plateau and Middle Yangtze River Basin


1
Key Laboratory of Land Surface Process and Climate Change in Cold and Arid Regions, Northwest Institute of Eco-Environment and Resources, Chinese Academy of Sciences, Lanzhou 730000, China
2
University of Chinese Academy of Sciences, Beijing 100049, China
*
Author to whom correspondence should be addressed.
Atmosphere 2019, 10(8), 428; https://doi.org/10.3390/atmos10080428
Submission received: 10 June 2019
/
Revised: 19 July 2019
/
Accepted: 23 July 2019
/
Published: 25 July 2019
(This article belongs to the Special Issue Analysis of Oceanic and Terrestrial Atmospheric Moisture Sources)
Abstract
:The Southeastern Tibetan Plateau (SETP) and the Middle Yangtze River Basin (MYRB) show a large difference in their levels of precipitation, despite the fact that they are located within the same latitude band. The annual precipitation in the MYRB is much higher than in the SETP. Precipitation has decreased in the past three decades in both regions. To clarify the difference in precipitation and its changes between these two regions in recent decades, a quasi-isentropic backward trajectory (QIBT) model is used to track the evaporative source with the ERA-Interim reanalysis as the baseline. The wet seasons (from April to September) over the period of 1982–2011 were analyzed. Evaporative sources were divided into an oceanic portion and a terrestrial portion, in which local recycling was included. Our conclusions are as follows. A terrestrial evaporative source, including a neighboring terrestrial land source and local source, dominates both regions, although the summer monsoon regulates precipitation in the wet season. The local precipitation recycling ratio is 35% in the SETP and 29% in the MYRB. The oceanic evaporative source in the MYRB is five times larger than that in the SETP. The decrease in the oceanic evaporative source in the Indian Ocean is responsible for the decrease in precipitation in the SETP. In the MYRB, decreases in neighboring terrestrial sources dominate the precipitation decline. Regardless of the decreases in the remote oceanic or neighboring terrestrial evaporative sources, the local recycling ratio increased in both regions.
1. Introduction
The Asian summer monsoon system brings strong moisture advection and results in heavy precipitation in the summer rainy season [1,2,3]. As one of the world’s most densely populated and economically fast-growing regions [4,5], the Middle Yangtze River Basin (MYRB) and how it is influenced by the monsoon have been investigated in many studies [3,6]. At the same latitude as the MYRB and influenced by the Indian summer monsoon, and as the richest region in terms of precipitation over the Tibetan Plateau (TP) [7,8,9,10,11,12], the Southeast of the TP (SETP) experiences much less precipitation than the MYRB [1,13]. How is this the case? Is it because of the distance from the ocean? In addition, precipitation has decreased for both the SETP and the MYRB. Moreover, the Asian summer monsoon has been reported to show a decreasing trend. It is queried whether the precipitation has decreased due to the weakening of the Asian summer monsoon and, if so, how did the large-scale weakening of the monsoon influence the precipitation in different longitudinal regions? All of these questions pose interesting research objectives.
Besides the moisture from the ocean, terrestrial evaporation is also a source for moisture in the atmosphere, which eventually precipitates. The evaporative source is the evaporation that contributes as a moisture source in the atmosphere for precipitation [14,15,16]. The local evaporative source over the precipitation in a given area is named as precipitation recycling [17,18,19,20]. Contributions of evaporation or evapotranspiration from the land and ocean to precipitation in the continents have been named as terrestrial and oceanic evaporative sources [14,15,21]. The average altitude is 4000 m for the SETP and 400 m for the MYRB. Besides the topography, the heterogeneity of the terrain and the land surface characteristics in the SETP are very different from those in the MYRB. How does the land surface contribute to the precipitation difference in the two regions? What is the role of the Himalayas in the lower level of precipitation in the SETP compared to the MYRB?
Terrestrial and oceanic evaporative sources in the SETP and MYRB have been investigated separately in previous studies. Zhang et al. found more evaporative sources from land than ocean in the Southern TP, and found that 69% of the precipitation over the TP comes from terrestrial evaporation [22,23]. Curio et al. claimed that around 63% of the precipitation comes from the local terrestrial source in the TP [24]. However, Chen et al. and Drumond et al. concluded that, instead of land, oceans are the major moisture source for precipitation over the TP [25,26]. Chen et al. found that the dominant origin of the moisture supplied to the TP is from the Arabian Sea and Bay of Bengal [25]. Drumond et al. also claimed the same result of a dominant oceanic evaporative source of precipitation in the Southeastern TP [26].
For the MYRB, many studies stated that the largest source was from the oceans. However, a dominant contribution of either a land or ocean source is still under debate. For instance, Wang et al. showed that the Indian Ocean and the Pacific Ocean together contributes to 60% of the precipitation in the MYRB, using the 2D dynamic recycling model (DRM) [27]. The sources from the Indian Ocean and the Pacific Ocean, separately, account for 30% each. Using a FLEXible PARTicle dispersion model (FLEXPART), Chen et al. assessed that the oceanic source is even larger than 60% [28]. The East China Sea, South China Sea, Arabian Sea, and the Bay of Bengal contribute around 70% of the precipitation in the Yangtze River Basin. On the contrary, Wei et al. found that local and land moisture contributions are the major source of precipitation in Yangtze River Valley; ocean is important only in initiating the moisture transfer.
From the above literature survey, we found that arguments differ with regard to the dominant evaporative sources for the two regions. Moreover, none of the previous literature compared the evaporative sources of precipitation between the SETP and the MYRB. Quantifying and comparing the terrestrial and oceanic sources for the SETP and MYRB can help our understanding of the difference in precipitation between these two same-latitude regions, and help us to explore the abovementioned unsolved questions.
Several recycling models have been used to quantify the evaporative source. For instance, the early-generation box models [16,29,30,31], DRM [21,32], water accounting model (WAM) [14,33] and FLEXPART [34,35] have been built and developed. The early one-dimensional box models were designed based on the equation of balance of atmospheric water. Huge uncertainties were found in these models due to three assumptions: time-averaged data are used to estimate moisture flux, the change in the atmosphere storage term is neglected, and finally, there is the well-mixed assumption [32,36,37,38]. Monthly mean datasets were used due to these assumptions in early-generation models. Later on, two- and three-dimensional models were developed. Some of these box models were improved to run at a daily time scale. For instance, the moisture storage term and time-accumulated data were taken into account in WAM for moisture tracing [14]. The model was able to quantify the source and sink of evaporation and precipitation [22,23,36]. The change in moisture storage was incorporated into DRM [21], which can be used to analyze moisture transport from daily to monthly and longer temporal scales. In DRM, the balancing equation of water vapor is solved in a Lagrangian framework. Apart from the box models, numerical water vapor tracing models are also applied in moisture tracing. These models make use of tagged tracers to trace water vapor by applying a Eulerian or Lagrangian framework. FLEXPART, a Lagrangian particle dispersion model, simulates the long-range mesoscale transport, diffusion, and dry and wet deposition of tracers [34]. Its application fields have been extended to global and regional water cycles [25,28]. The quasi-isentropic backward trajectory (QIBT) model was developed and used in moisture tracing for exploring the sink of irrigated fields and the source of monsoon precipitation, in which a back-trajectory Lagrangian algorithm was implemented [39,40,41]. QIBT was designed to run on high temporal and spatial resolutions. Therefore, it has the advantage of tracing a real-time source of precipitation [42]. The results of the QIBT model have been validated in many previous studies. Van der Ent et al. have made a validation of QIBT in their studies by comparing three different moisture tracing models [36]. In the Yangtze River Bain, Wei et al. estimated the water vapor sources using QIBT [41].
Our aims are three-fold: (1) To quantify the terrestrial and oceanic evaporative sources of precipitation for the SETP and MYRB by using the evaporative source tracing model QIBT; (2) to ascertain the dominant evaporative source for each of the two regions; (3) to explore the evaporative source contributing to precipitation change over the period of 1982–2011, for the two regions. The paper proceeds as follows. Section 2 introduces the study and source regions, the model, and the datasets used, and the methodology is also described. Section 3 illustrates the climatology, seasonal variability, and inter-annual change of evaporative source for the two regions. Section 4 presents the discussions and conclusions.
2. Model, Dataset, Study Regions, and Methodology
2.1. Model
The QIBT model [39,43] is a 3D moisture tracing method. Backward tracing is calculated for each pentad. In each pentad, precipitation in the grid cell of the target region is divided into parcels for Lagrangian tracing within a pentad time. The number of launching parcels for each grid is 100. The initial vertical positions of the 100 launch parcels are located randomly using water-mass-weighted sampling. Parcels are traced backward using the technique described by Merrill et al. [44]. When backward trajectories pass through grids, the evaporative source for explaining the precipitation is provided by evapotranspiration over these grids. The evaporative source is based on the total precipitable water of the atmosphere column and the latent heat within the grid that the parcel passes through. If the trajectories of the parcels are near the surface, parcels are fixed to the boundary layer in the next step. A parcel stops being traced under three conditions: (1) The evaporative source gathered along the trajectory exceeds the precipitation which the parcel contained before launching; (2) the trajectory touches the boundary of the study region; (3) the track time exceeds 7 days. Most trajectories stop when the parcel touches the boundary of the study region before 7 days. By collecting the evaporative sources within the grids that trajectories have passed over, the evaporative source pattern for the target region emerges.
2.2. Dataset Used
In previous studies, ERA-Interim [45,46] reanalysis better captured the spatial pattern and temporal trends of moisture flux variation than the other three widely used reanalyses—NCEP-NCAR, NCEP-DOE, and ERA-40—over the TP [47]. For the Yangtze River Basin, ERA-Interim had good agreement with station observation data [11]. Therefore, ERA-Interim was chosen to drive the QIBT model. Specific humidity, temperature, zonal and meridional wind speed at 60 model levels, surface pressure, geopotential, precipitation, boundary layer height, and surface latent heat flux are used as inputs. It is important to note that precipitation is a forecast field in ERA-Interim. The resolution of variables is at 0.75° latitude–longitude grids and at 6-h intervals.
Precipitation observation data from Chinese Meteorological Administration stations in the two target regions are also used. The observation data are used to analyze the annual mean, monthly variation and the trend of precipitation. April to September is the study period, and this includes the whole evolution of the monsoon system.
2.3. Study Region and Methodology
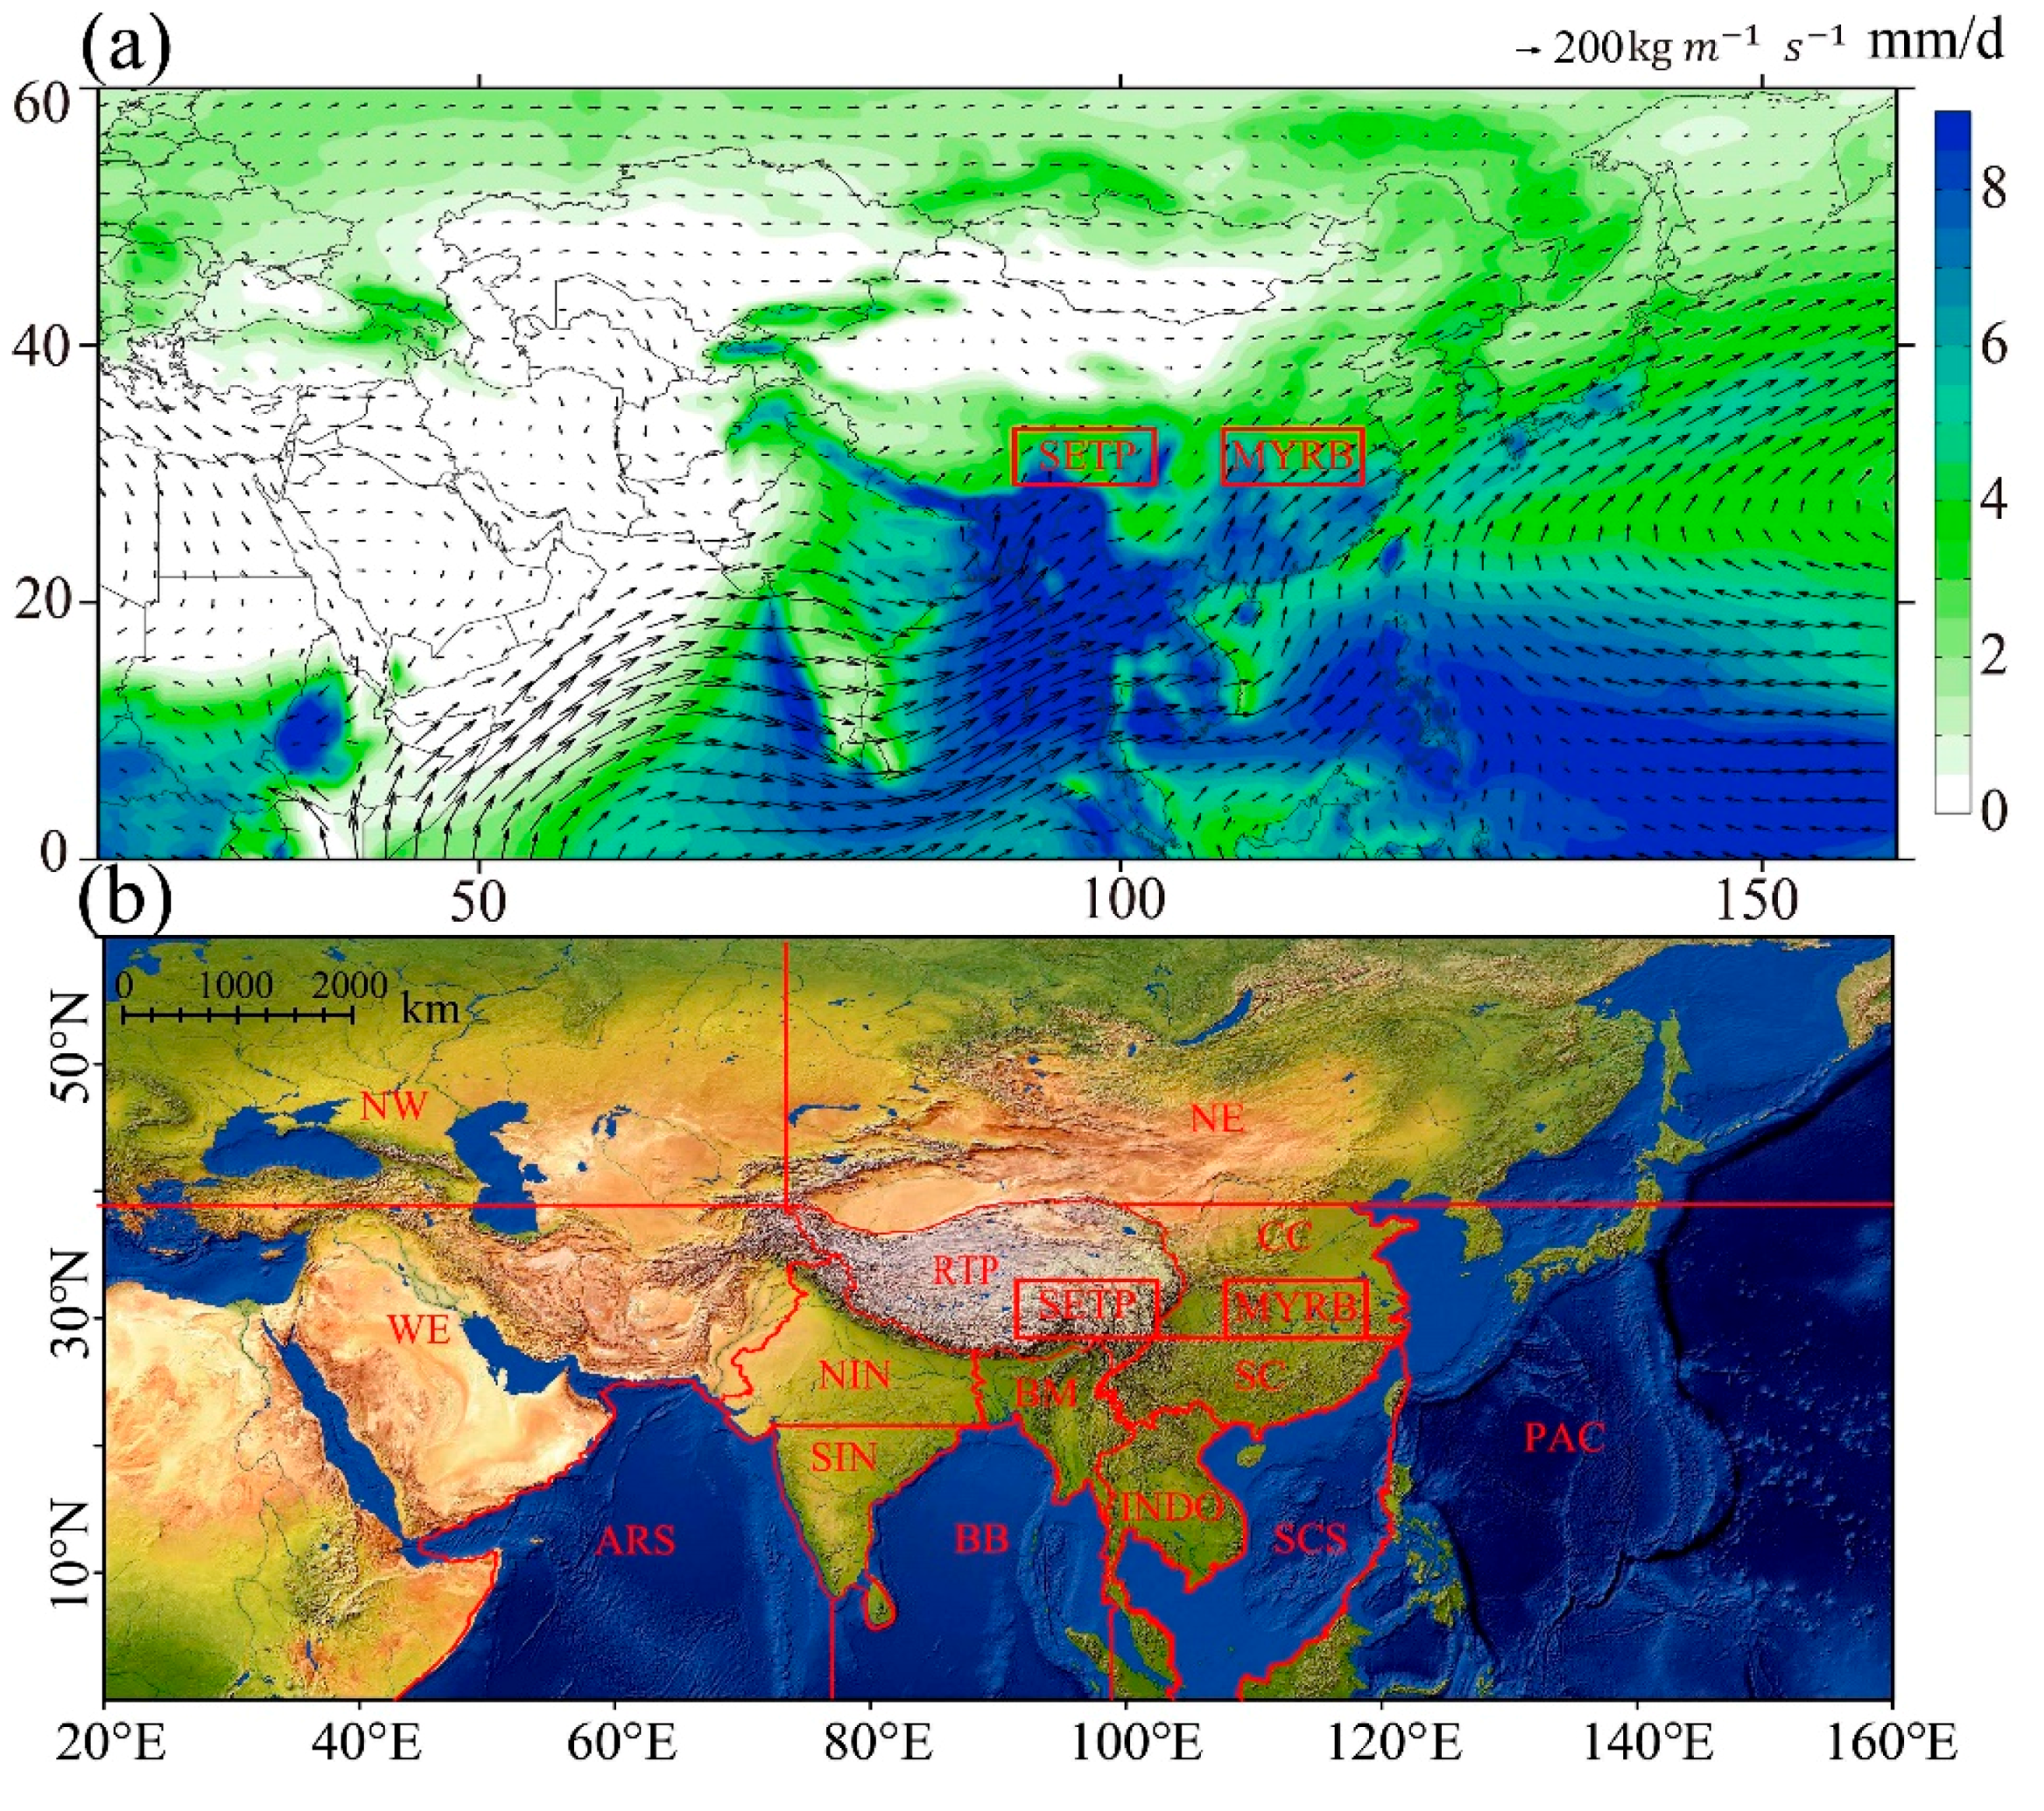
The study region covers the majority of Eurasia, the Northwestern Pacific Ocean, the Northern Indian Ocean and Northeastern Africa. The SETP and MYRB are the two target regions. Figure 1a displays the annual mean precipitation and column integrated moisture flux in the study region, in the wet season, from the year 1982 to the year 2011. Precipitation is high in the south and low in the north, for both target regions. The total precipitation amount is less in the SETP than in the MYRB. Moisture flux comes in from the west and south boundary and goes out from east and north, for both target regions. The moisture fluxes in the MYRB are stronger than those in the SETP, which indicates stronger moisture advection in the MYRB.
To avoid uncertainty arising from the scale and shape of the target regions, the SETP and MYRB were selected with the same latitude from 29° N to 34° N and with the same longitude length—the SETP at 93–103° E and the MYRB at 107–117° E. To specify the quantity of the evaporative source for the target regions, the study region is divided into sixteen sub-regions (Figure 1b). Except for the two target regions, sub-regions were divided based on the boundaries of landmass and countries, as well as the latitude and the longitude lines. The moisture flux of the study region shows that the south and the southwest are the main directions from which moisture flows into the target regions (Figure 1a). Toward these directions, the study region is separated into smaller and more detailed divisions—Southern China (SC), the South China Sea (SCS), Indochina (INDO), Bangladesh and Myanmar (BM), Northern India (NIN), Southern India (SIN) and the Bay of Bengal (BB). In addition to the sub-regions in the south, a northwestern area (NW) and northeastern area (NE) exist in the far north, and the rest of the Tibetan Plateau except for the SETP (RTP), and Central China (CC) at the near north. The Western area (WE) and the Arabian Sea (ARS) are in the west, and the Pacific Ocean (PAC) is in the east. The sea areas (ARS, BB, SCS, and PAC) are separated from the land areas. ARS and BB represent the Indian Ocean, and SCS and PAC represent the Pacific Ocean.
Two ranking approaches were used: average and the three-sigma rule. The three-sigma rule is a statistical rule that refers to data within three standard deviations from the mean. The three-sigma rule uses three standard deviations, which is stricter than using one or two standard deviations. The rule is used to select the main source sub-regions and the dominant changes in evaporative source in the 16 sub-regions. In determining the main source, the maximum evaporative source minus three times the standard deviation of the evaporative sources in the 16 sub-regions is set as the criterion. To determine the dominant changes in evaporative source for precipitation, the maximum absolute change minus three times the standard deviation of absolute changes in the 16 sub-regions is set as the criterion. The absolute values for evaporative source vary widely. Normalization helps to discern the difference in monthly variations among different regions. In this study, the normalization of evaporative source is calculated by dividing monthly evaporative sources by the maximum.
3. Results
3.1. Mean Evaporative Source in the Two Regions
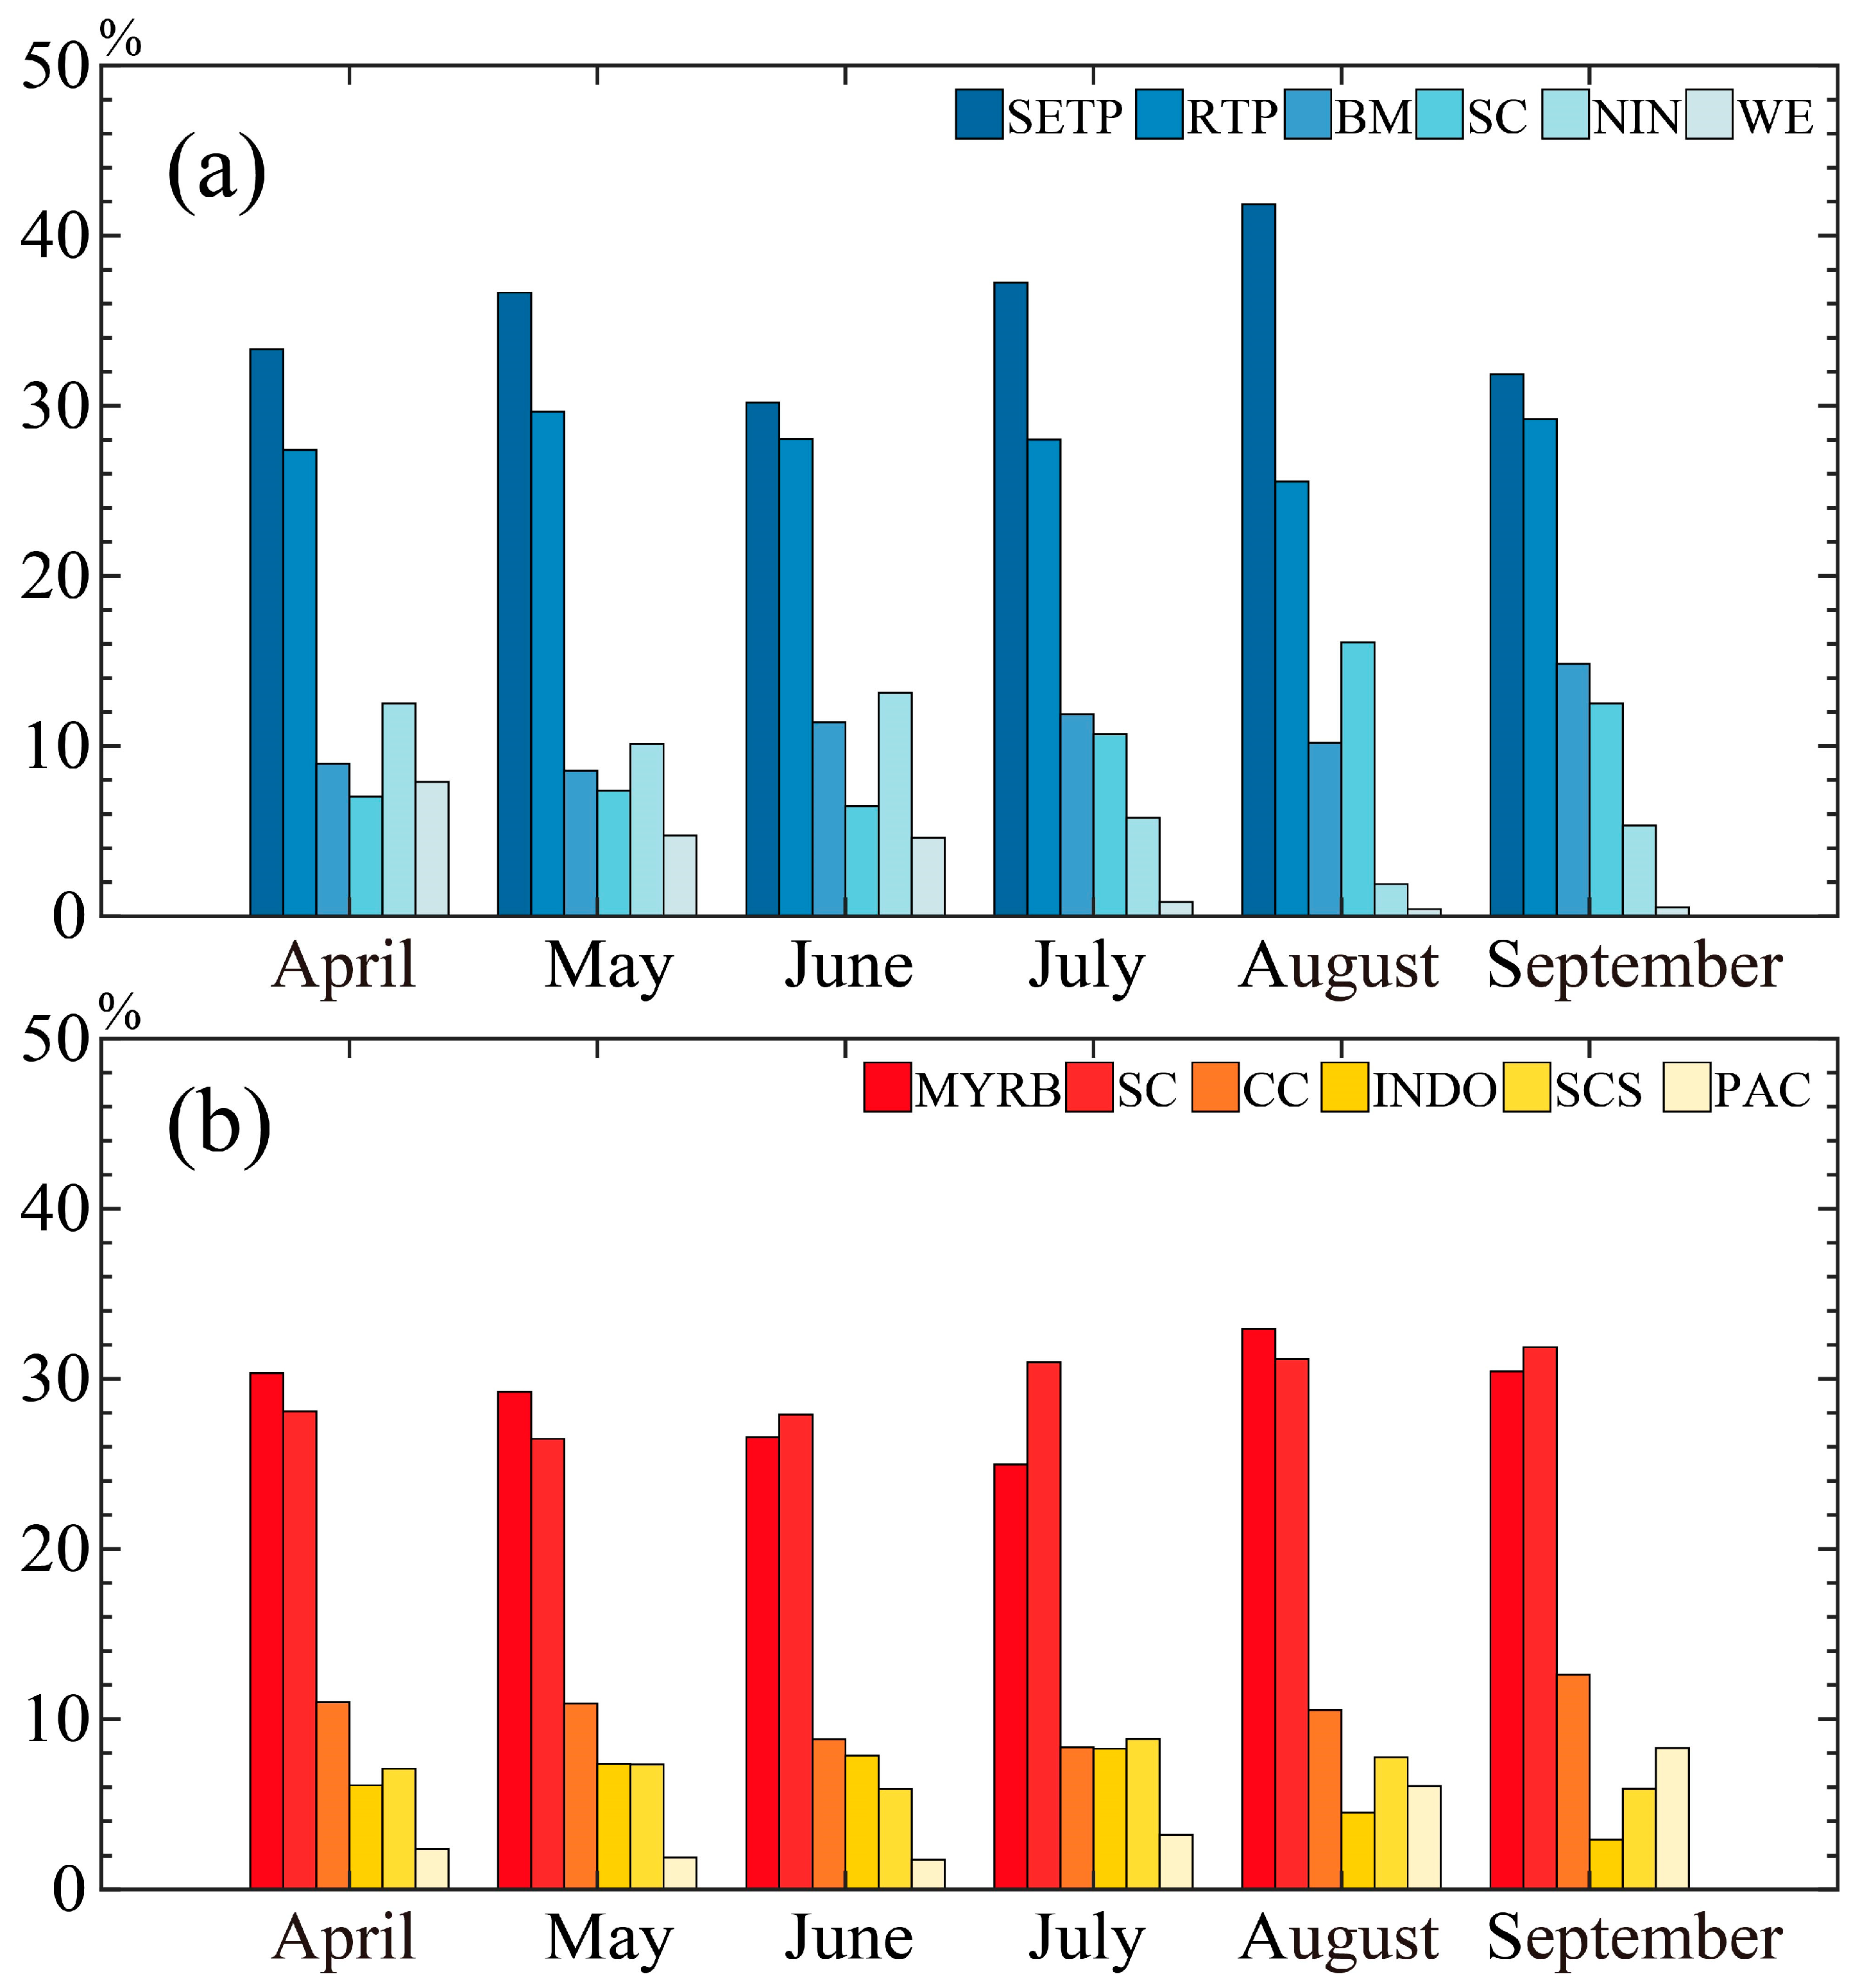
Table 1 lists the evaporative sources in each sub-region, which contribute to precipitation in the two target regions. On average, each sub-region contributes to 6.25%, if the total precipitation amount is taken as 1. The sub-regions which have an above average contribution are regarded as major contributors. The major contributors are distributed in the south and west for the SETP, but mainly in the south for the MYRB. They are the SETP, RTP, BM, NIN, and SC for the SETP, and the MYRB, SC, CC, SCS and INDO for the MYRB. The local evaporative source ranks the highest for both target regions. Except for the local source, Southern China (SC) is also a major source for both target regions, which is located to the southwest of the MYRB and southeast of the SETP. Differences exist in the ranking of its contribution for the MYRB and SETP, it ranks second for the MYRB; however, it ranks fourth for the SETP. These different magnitudes of the evaporation contribution of SC to the two target regions are related to the direction of the moisture flux.
In the SETP, the second largest evaporative source is the RTP to the northwest of the SETP (Figure 2a). BM in the south ranks third. BM in the south possess more moisture flux than the RTP in the northwest but ranks lower than it, which demonstrates how the Himalayas hamper warm and wet moisture transportation. Except for the above average contributors, the WE in the west also has an above average contribution in April but decreases later on. In the MYRB, besides the local sub-region and SC; CC, SCS, and INDO rank sequentially. These dominant sub-regions are all located to the south of the MYRB, except for the Central China (CC) sub-region, which is located nearby. It is necessary to note that the contribution from the Indochina (INDO) sub-region is above average from April to July, and below average after. The contribution from the Pacific Ocean (PAC) is above average in August and September. This indicates the seasonal transition of the evaporative source from the Indian summer monsoon to the East Asian summer monsoon.
The three-sigma rule reveals the same top evaporative sources. The top six sub-regions are shown in Figure 2. Evapotranspiration from the top six sub-regions contributes 96% to the total precipitation in the SETP and 86% in the MYRB. The high contribution of the RTP indicated a large contribution from evaporative sources in neighboring sub-regions for the SETP. The SETP has no oceanic source in the top six sources; however, the MYRB has two oceanic source sub-regions, the SCS and the PAC. Overall, more evaporative sources in the SETP originate from the west (RTP and WE) (Figure 3 and Table 1); however, the MYRB has more evaporative sources from the south, southeast and southwest.
To compare the oceanic and terrestrial contributions for the two regions, the evaporative sources in Table 1 are summarized, as shown in Table 2. Terrestrial evaporative sources contribute 98% to the total precipitation in the SETP and 86% in the MYRB. The oceanic evaporative source only contributes 2% in the SETP and 14% in the MYRB. This demonstrates two points: (1) The terrestrial evaporative source dominates the precipitations in both regions; (2) the SETP possesses a stronger land–atmosphere hydrological interaction strength than the MYRB.
The terrestrial evaporative source consists of evapotranspiration from the target region itself and outside terrestrial land. The portion from the target region is named the precipitation recycling ratio. A recycling ratio of 35% is found in the SETP, which is larger than that of the MYRB (29%). The high recycling ratio persists for the whole wet season, with the maximum in August, and minimum in June for the SETP and July for the MYRB. Besides the recycling ratio, 63% of precipitation in the SETP and 57% in the MYRB comes from outside terrestrial land (Table 2 and Figure 3), which is mainly distributed to the south of the target regions.
Only 2% of the total precipitation in the SETP and 14% in the MYRB originates from an oceanic evaporative source. This is substantially different from the previous studies carried out with FLEXPART. Wang et al. and Chen et al. [27,28] showed that the sources from the Indian Ocean and Pacific Ocean contribute to 60%–70% of the precipitation in the Yangtze River Basin. Others found that most of the evaporative sources originate from the Arabian Sea and Bay of Bengal for the TP [25]. The differences between our results and previous studies are discussed in Section 4. For the SETP, almost all the oceanic evaporative sources come from the Indian Ocean. For the MYRB, however, 11% of the 14% oceanic evaporative source is from the Pacific Ocean and 3% from the Indian Ocean.
3.2. Linear Trend of the Evaporative Source over the Past Three Decades
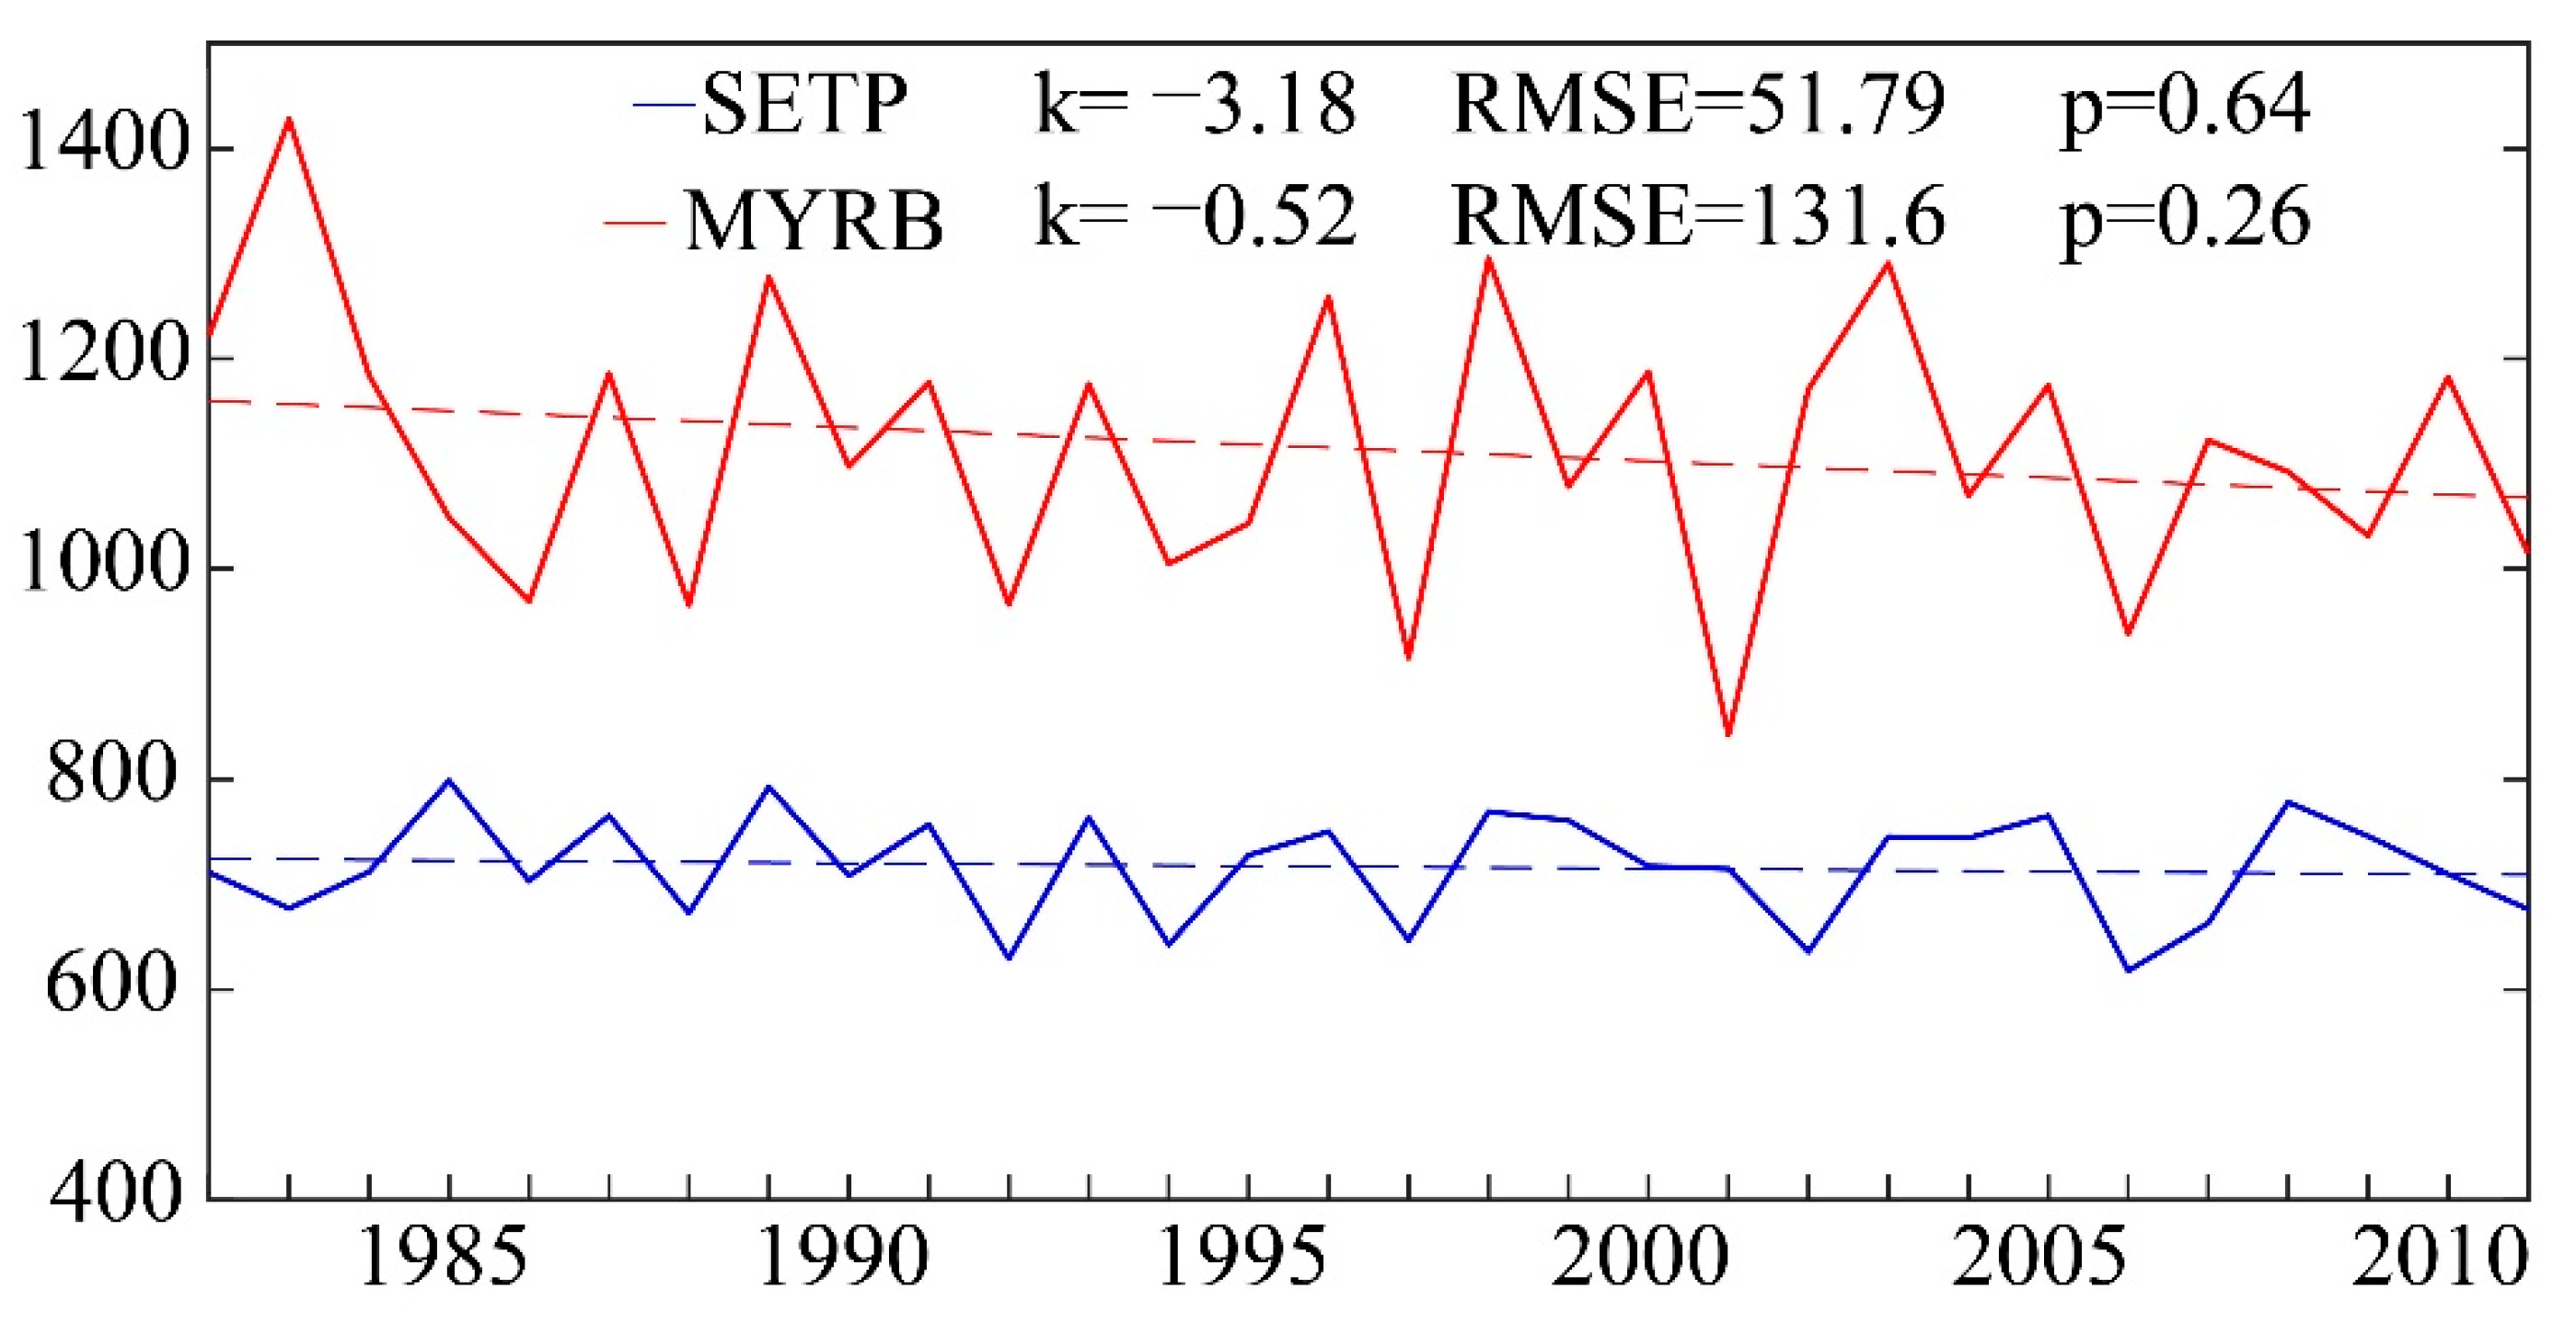
Precipitation decreases were observed in both target regions over 1982–2011, based on the station observations of the Chinese Meteorology Administration (Figure 4), with a faster decrease observed in the MYRB. The annual mean precipitation in the MYRB shows a larger variability and twice the magnitude of that in the SETP (Figure 4). Given the fact that precipitation during the wet season dominates the annual precipitation in both target regions, changes in the evaporative source in relation to the 16 sub-regions considering the wet season are examined. The results are listed in Table 3. The three-sigma rule is used to highlight the significant trends of sub-regions, and thresholds of 0.16 mm d−1 a−1 for the SETP and 0.08 mm d−1 a−1 for the MYRB are set. For the SETP, six of the 16 sub-regions show linear trends over the threshold, in which two (SC and SETP) show positive trends and four (BM, BB, NIN, and RTP) show negative trends. Changes in the evaporative source contribution in the Tibetan Plateau, Northern India, Bangladesh, Myanmar, and Bay of Bengal involving negative trends dominate the precipitation decrease in the SETP. The largest negative trend exists in the Northern India (NIN) sub-region (−0.55 mm d−1 a−1).
For the MYRB, 7 of the 16 sub-regions show absolute linear trends larger than the threshold. Among them, only one shows a positive trend. Six of them show negative trends, with the largest decrease of −0.63 mm d−1 a−1 in the Southern China (SC). In contrast with the MYRB, the Northern India (NIN), Bangladesh and Myanmar (BM) to the south of the SETP are sub-regions which predominantly show a decrease. The evaporative source decreases more in the MYRB than the SETP. However, evaporative source changes show a slightly smaller range among the sub-regions in the MYRB than they do in the SETP.
Similarly to Table 2, Table 4 summarizes Table 3 into terrestrial and oceanic evaporative sources. The terrestrial evaporative source for the SETP shows almost no change; whereas the oceanic evaporative source exhibits a 0.30 mm d−1 a−1 decrease. This change of oceanic source is mainly because of a change from the Indian Ocean. It demonstrates that the decrease in the evaporative source from the Indian Ocean dominates the precipitation decrease in the SETP. However, in the MYRB, a larger decrease occurs for the terrestrial evaporative source. The oceanic source also decreases, but less so than the terrestrial source. The major change comes from the Pacific Ocean and South China Sea. Although the precipitation and terrestrial evaporative source both decrease for both target regions, the trends of local evaporative sources are positive for both regions, which implies a huge decrease in the evaporative contribution from the land outside the target regions.
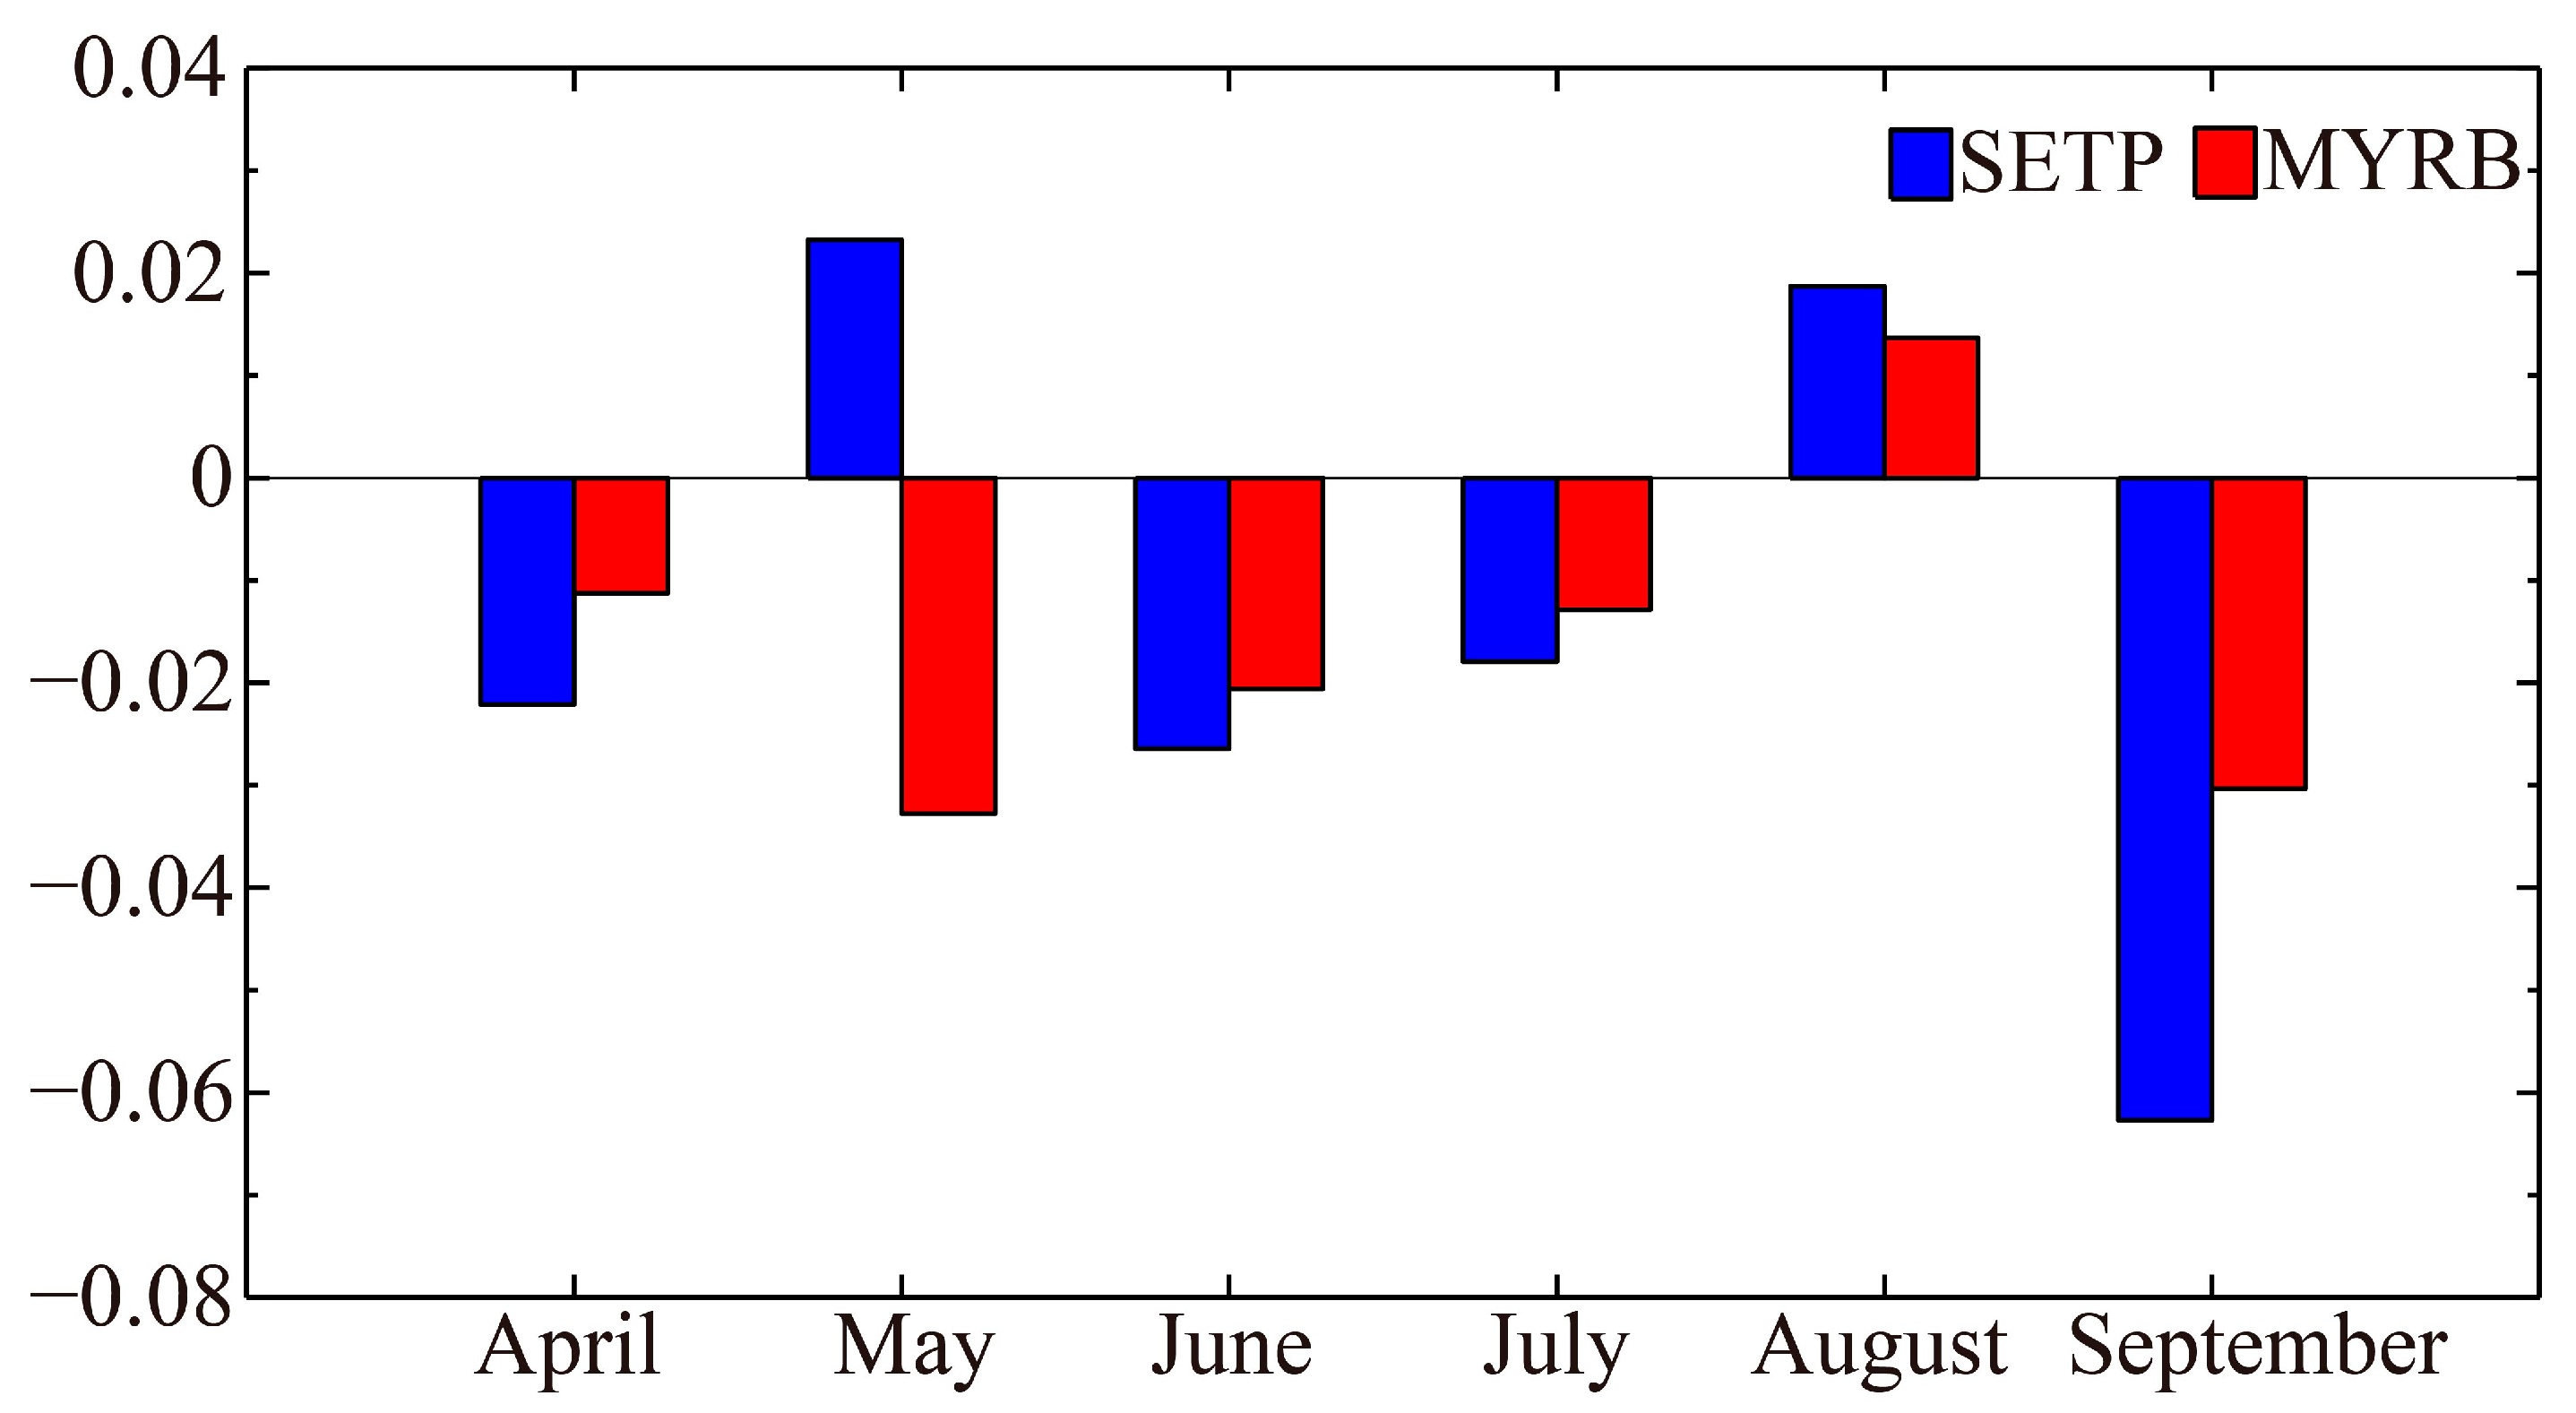
Seasonally, the precipitation decreases in the wet season, except for in August and May in the SETP (Figure 5). The largest decreases in precipitation are observed in September, which is mainly because of the decreases in the terrestrial evaporative source, especially in the SETP (Table 4). In the SETP, the sub-region with the dominant decreased evaporative source in September is the RTP, followed by the NIN, BM, and BB (Table 3). In the MYRB, the South China Sea (SCS) and Southern China (SC) to the south are the sub-regions that experience decreased precipitation in September, which is different from the SETP (Table 3). Given the dominance of the terrestrial evaporative source (Table 4), decreases in the evaporative source in the RTP, NIN, and BM are more responsible for the decreases in precipitation in the SETP. For the MYRB, evaporation decreases in Southern China (SC) are the most crucial, except for the INDO and BM.
In May, precipitation increases in the SETP and decreases in the MYRB (Figure 5). The reason for this inconsistency is that the evaporative source increases in the Southern Himalayas (BM, NIN, SC) for the SETP and decreases in the Southern China (INDO, SC, SCS) for the MYRB (Table 3). The NIN and SC are both dominant sub-regions for precipitation change, but with an increasing contribution for the SETP and decreasing contribution for the MYRB (Figure 6).
Although the annual mean precipitation decreases, precipitation increases in August were observed for both target regions (Figure 5). The dominant evaporative source differs in the two regions. The terrestrial source dominates in the SETP. The top three increased evaporative sources, SC, RTP, and BM (Table 3), are all land areas which results in the domination of the terrestrial evaporative source. In the MYRB, despite the increase in the oceanic source, a decreased terrestrial source compensates for the increases in the oceanic source (Table 4). PAC and SCS are the top two increasing contributors for the MYRB. The battle between land and ocean contribution changes implies that the oceanic source plays a more important role in the precipitation change in the MYRB than it does for that in the SETP, in August.
It is interesting to note that the largest increase in local evaporative sources occurs in July for both target regions, with 1.67 mm d−1 a−1 for the SETP and 2.20 mm d−1 a−1 for the MYRB (Table 4). However, precipitation decreases in July for both target regions, which means the local evaporative source changes do not contribute to precipitation changes in July.
3.3. Relationship of the Seasonal and Inter-Annual Variability of Evaporative Source with the Large-Scale Climate Systems
The two target regions are under the control of three dominant climate systems during wet seasons: the westerly, Indian summer monsoon and East Asian summer monsoon. As we found above, the top six sub-regions of evaporative sources for the SETP are the local, RTP, BM, SC, NIN, and WE. For the MYRB, they are the local, SC, CC, INDO, SCS, and PAC (Figure 2). The evaporative source in the WE and the RTP to the west indicates the influence of westerlies. The evaporative source in BM and NIN to the south and southwest implicates the dominance of the Indian summer monsoon. For the MYRB, SCS, and PAC are listed in the top six sub-regions, which indicates the influence of the East Asian summer monsoon on oceanic sources.
Seasonal variations of the evaporative sources imply the influence of large-scale climatology system transitions on the two target regions. Figure 7 shows the monthly variations of common evaporative sources for the SETP and MYRB. Shaded areas in Figure 7 show the evaporative sources contributing to both the SETP and MYRB with a magnitude larger than 0.01 mm d−1, which are named common evaporative sources. In Figure 7, common evaporative source areas are west–east oriented in the early monsoon season (April and May), southwest–northeast oriented in the middle monsoon season (June and July), and south–north oriented in the later monsoon season (August and September). The orientation change of the common evaporative sources reveals the shift of the climate system from the westerly direction in pre-monsoon, to the Indian monsoon in mid-season, and finally to the East Asian summer monsoon in the late season.
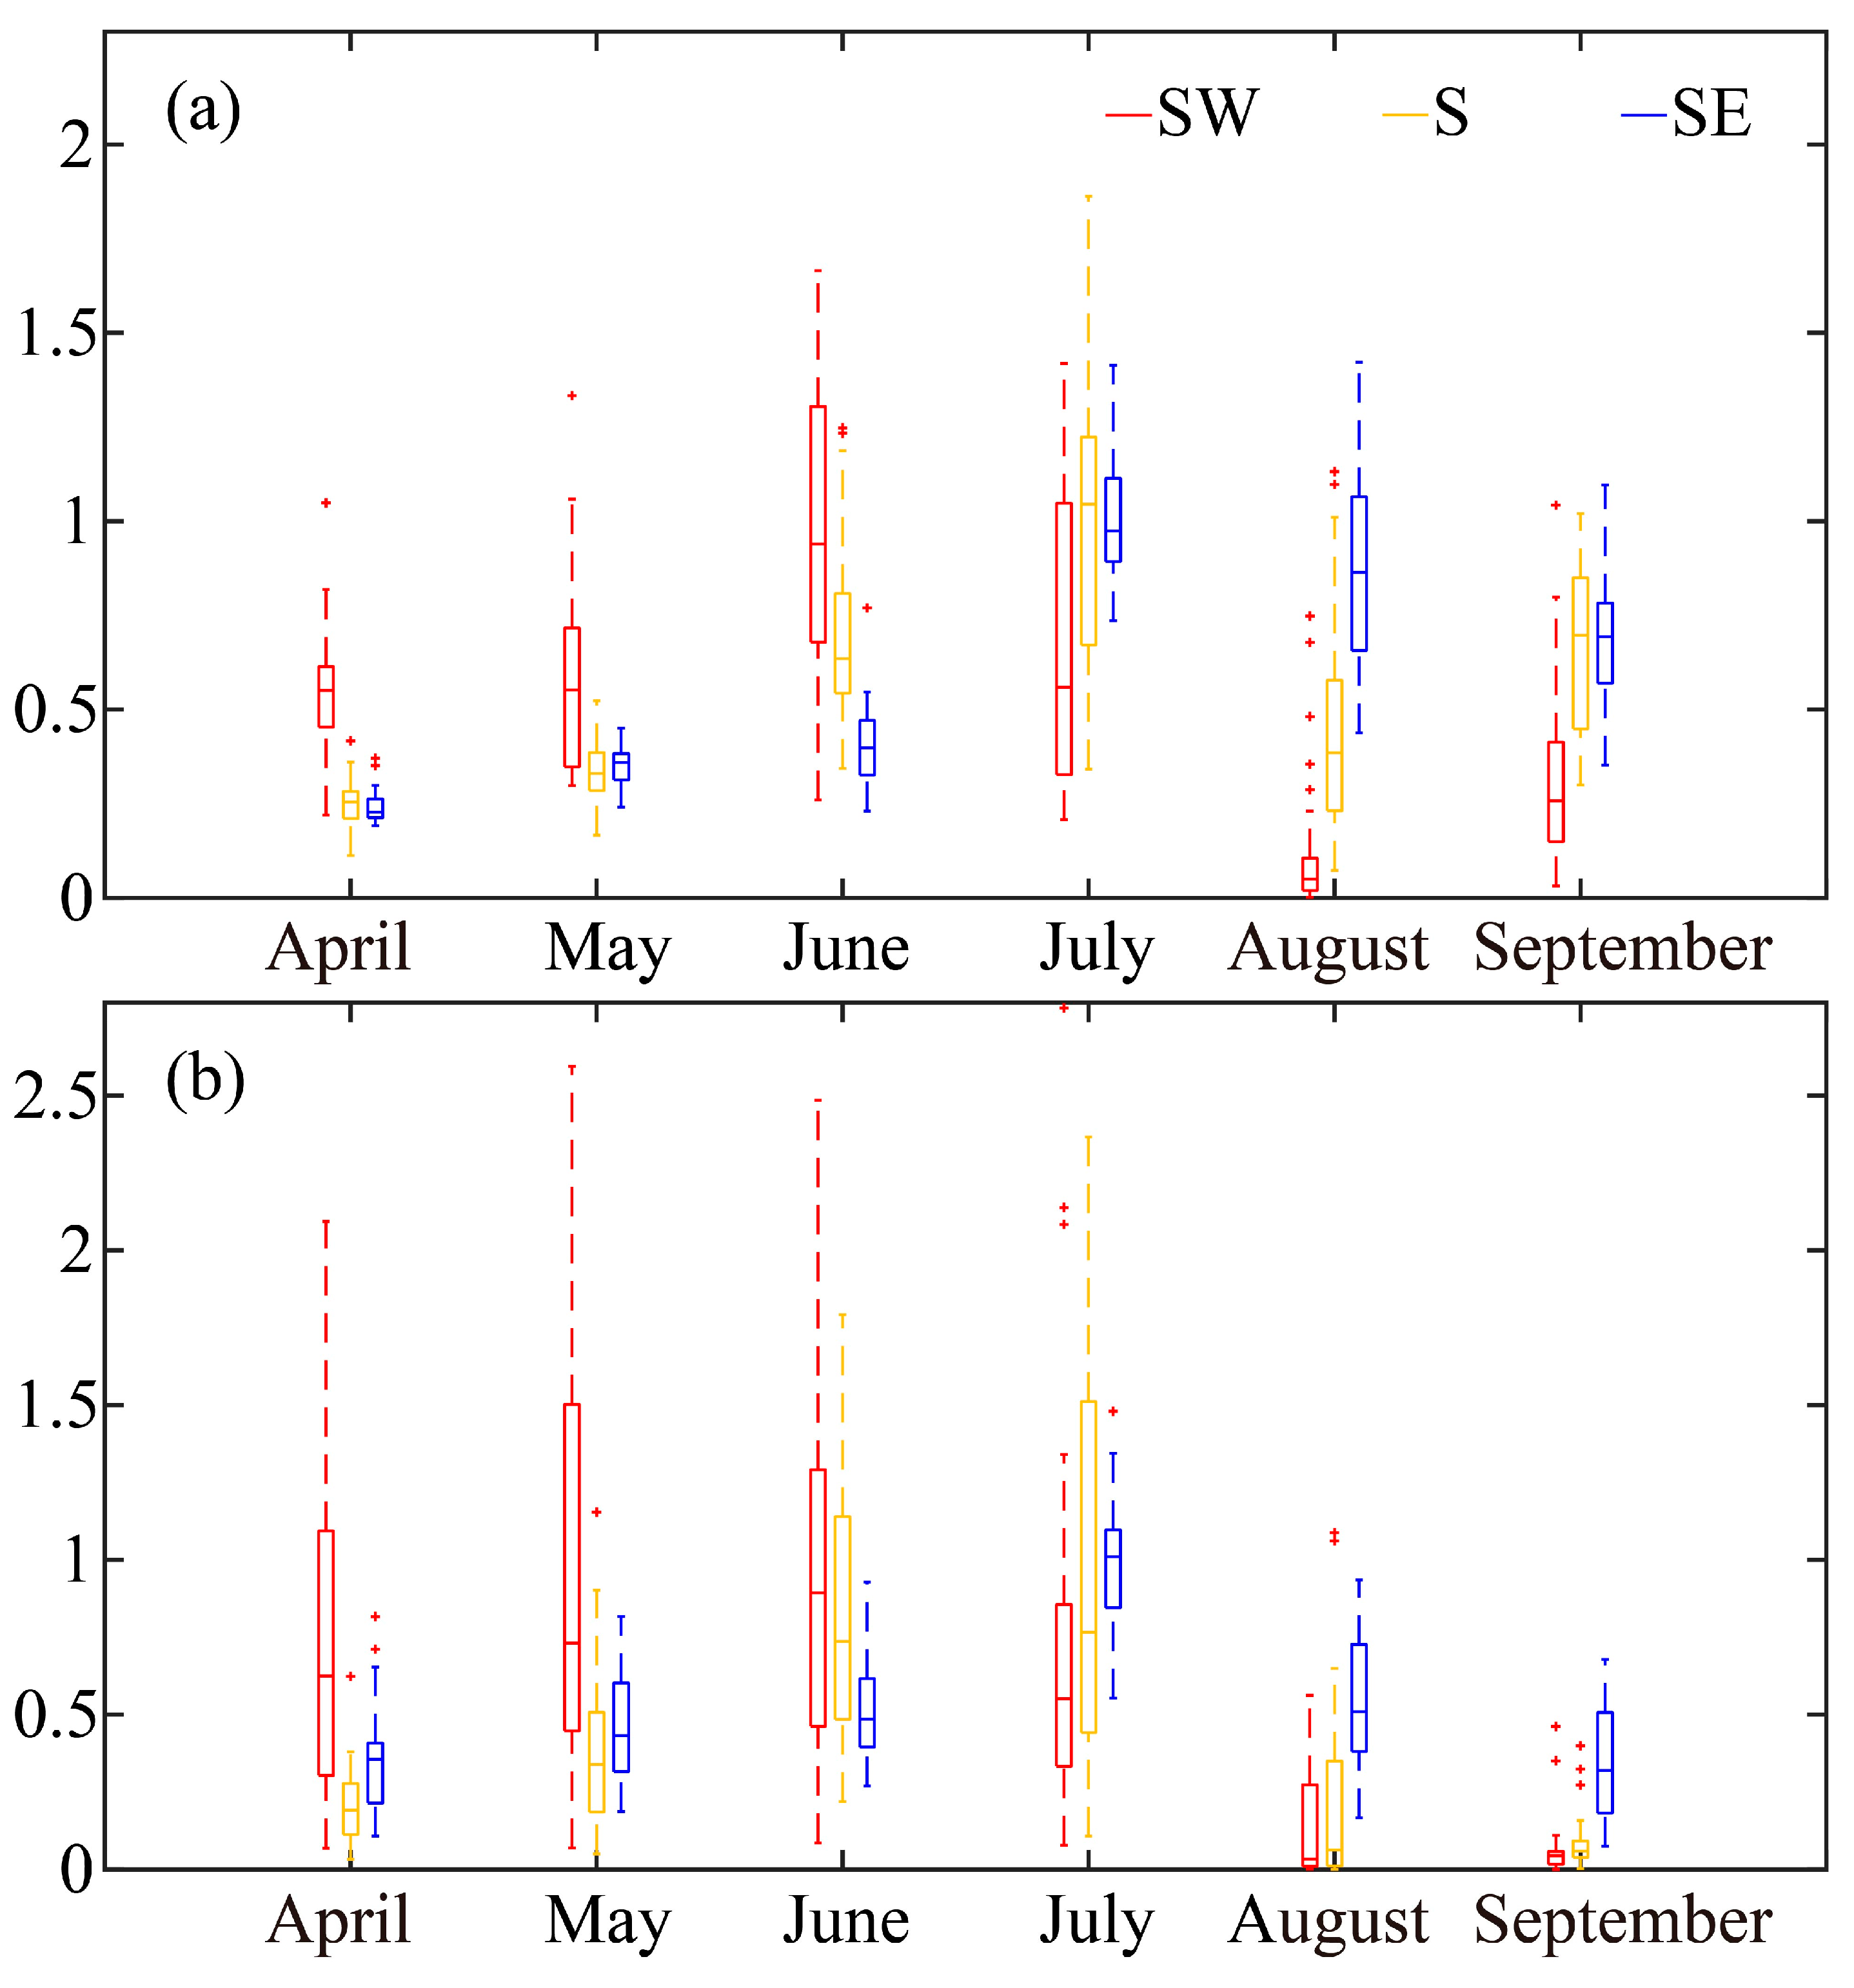
To clarify the influences of the Indian monsoon and East Asian summer monsoon variation in the shift of the evaporative sources, the Indian sub-regions and Arabian Sea (ARS, NIN and SIN) are grouped as the southwest area (SW), which is controlled by the Indian monsoon. Bangladesh, Northeastern India, Myanmar, and the Bay of Bengal (BM and BB) are grouped as the south area (S), which is influenced by both the Indian monsoon and East Asian summer monsoon. Southern China, Indochina, and the South China Sea (SC, INDO, and SCS) are grouped as the southeast area (SE), which is controlled by the East Asian summer monsoon. Figure 8 shows the variation of the normalized evaporative source for three directions (SW, S, and SE) in the wet season. June and July are the turning points of the evaporative sources from being Indian monsoon dominant to East Asian summer monsoon dominant for the SETP and the MYRB. The evaporative source in SW associated with the Indian monsoon is maximized in June for both regions. The evaporative source in the SW is large from April to July and small from July to September. Correspondingly, the evaporative source in SE associated with the East Asian summer monsoon becomes strong after June for the SETP and the MYRB. It reveals the nature of the East Asian summer monsoon. The anticyclonic moisture advection along the northwest edge of the West Pacific dominates the evaporative source, rather than the evaporative source from the Indian Ocean.
In addition to regulating the monthly variation of evaporative sources, the Indian monsoon and East Asian summer monsoon are relevant to the decadal decline of the oceanic evaporative sources. We found a decrease in precipitation and oceanic evaporative sources for both regions from 1982 to 2011. This is consistent with previous studies. For instance, for the Indian monsoon, Zhang et al. found that the Indian monsoon contributes to the precipitation decrease in the Southern TP [23]. Roxy et al. found a decrease in the land–sea thermal gradient over South Asia [48], which indicates weak moisture transport to South Asia from the sea. For the East Asian summer monsoon, Song et al. found weakened low-level monsoon circulation [49]. Zhu et al. also claimed that climatological southwesterly flow is weak between 20° and 35° N [50]. The abovementioned weakening of moisture transport by the Indian monsoon and East Asian summer monsoon supports our results showing a decrease in the oceanic evaporative source in the Indian Ocean and Pacific Ocean.
Besides the decrease in oceanic sources, the terrestrial sources show a decrease and the local evaporative sources show increases for both target regions (Table 4). For the terrestrial portion, evaporative sources from the west of the SETP decrease. In the west of the MYRB, evaporative sources in NIN, WE, RTP, and NW also slightly decrease. The decrease in the western sub-regions may relate to the decrease in westerlies over the TP [47]. For the local evaporative source, the recycling ratio increases for both the SETP and MYRB, which indicates an intensification of the local hydrological recycling. Accompanied by the decrease in oceanic sources and neighboring terrestrial evaporative sources, precipitation variations highly depend on changes in the large-scale circulations and monsoon systems [41].
4. Discussions and Conclusions
4.1. Discussions
As mentioned above, early-generation recycling models suffer from certain assumptions which may overestimate or underestimate the land–atmosphere interaction strength. The QIBT method also assumes a well-mixed atmosphere [36]. Van der Ent et al. pointed out that the vertical layer of the launch of the precipitation parcels is the key to the overestimation [36]. They discussed that the results are close to those of the evaporative source obtained by a realistic model when vertical locations of the launch points are chosen near the land surface and evaporative source contribution is determined based on the cloud fraction. Another assumption is that water vapor within the tropospheric column is equally likely to precipitate [15]. This is a proper assumption for enhancing the efficiency of the model calculation but leaves certain processes in the atmosphere unsettled, especially in the boundary layer.
It must be noted that there are some differences between our results and previous studies. For instance, the Indian Ocean and Pacific Ocean together contribute 14% to precipitation in the MYRB as the oceanic source in our study. Bangladesh and Northeast India make positive contributions as evaporative sources of precipitation to the SETP. However, Wang et al. showed that the source from the Indian Ocean is equivalent to the source from the Pacific Ocean, at around 30% for the Mid-Lower Yangtze River Basin [27]. The moisture source from either the South China Sea, Arabian Sea or Bay of Bengal contributes over 15% of the precipitation in the Yangtze River Basin [28]. Chen et al. claimed that the southern neighboring lands of the SETP are a negative evaporation−precipitation (E−P) contributor to the SETP, based on using the FLEXPART model [25]. These differences are related to three aspects. Firstly, the moisture includes not only evaporation from the land surface but also water vapor in the atmospheric column. The QIBT model focuses on evaporation from the land surface as the evaporative source. Meanwhile, the FLEXPART model unifies the evaporation and precipitation together (E−P) and uses change in specific humidity as the change in the moisture. This is the reason for the difference between our findings, with a high terrestrial evaporative source with the QIBT model used in our study and previous moisture advection studies indicating more moisture transportation from the ocean, based on FLEXPART. In the DRM model, however, the contribution of evaporation to moisture is based on an exponential solution [21,51]. Secondly, the vertical layer of models and the initial release height of parcels might cause the differing results. We used 60 model layers, whereas no more than two vertical layers are used in previous studies. Van der Ent et al. claimed that the number of vertical layers and the initial release height of tagged water in the model are found to have the most significant influences on the results [36]. Differences between our results and previous studies highlight that the evaporated moisture and water vapor in the atmospheric column are not well-mixed. Thirdly, the calculating technique differs among models. The QIBT and DRM models both use a simple iterative technique by Merril et al. [44]. The FLEXPART model uses a “zero acceleration” scheme and one iteration of the Petterssen scheme [52]. Although with different techniques, all of them belong to the Lagrangian method; in contrast, the WAM model uses the Eulerian method for moisture tracing.
Besides the choice of model, input datasets also result in uncertainties. The ERA-Interim reanalysis outperforms the other three reanalyses over the TP with regard to the surface air temperature and hydrological cycle. Gao et al. found that ERA-Interim better depicted the pattern of the observed precipitation; however, it overestimates the precipitation as well as the evapotranspiration in both regions, especially in the SETP [47]. These overestimations will leave uncertainties in the evaporative source estimation. More accurate datasets are expected in future works.
The SETP has a higher altitude and more mountainous terrain than the MYRB. These terrestrial characteristic differences induce different quantities and dominant directions of evaporative sources for the two target regions. WE and RTP to the west of the SETP are listed in the top six evaporative source sub-regions for the SETP, which indicates a strong evaporative source from the west. For the MYRB, SCS and PAC are listed in the top six sub-regions, which indicates strong oceanic sources from the south. In addition, oceanic evaporative sources contribute 2% to the precipitation in the SETP and 14% in the MYRB. The smaller oceanic source portion but stronger terrestrial source from the west in the SETP implies the interference of the Himalayas in the northward moisture transport from the Indian Ocean.
4.2. Conclusions
Evaporative sources are quantified by using the advanced QIBT tracing model to illuminate the precipitation and its changes in the SETP and MYRB. The study region is divided into 16 sub-regions. Evaporative sources in the 16 sub-regions are combined into the terrestrial and oceanic portions. Dominant evaporative sources for the two target regions are revealed. The seasonal and inter-annual changes of the evaporative sources are investigated. Relationships between evaporative source changes and monsoon system evolutions are analyzed. The following findings are obtained.
The terrestrial evaporative sources dominate the precipitation in both regions, with 98% for the SETP and 86% for the MYRB. Oceanic evaporative sources contribute only 2% to the precipitation in the SETP and 14% in the MYRB. The Indian Ocean contributes 2.09%, and the Pacific Ocean contributes only 0.24% to the precipitation in the SETP. However, in the MYRB, sources from the Pacific Ocean and South China Sea contribute up to 11%, whereas the Indian Ocean contributes 3%. This difference in the oceanic source is highly related to the distance from the oceans. In addition, the smaller oceanic source portion in the SETP implies the interference of the Himalayas in the northward moisture transport from the Indian Ocean.
The top six evaporative sources of precipitation in the two target regions are found through two ranking approaches. The whole TP contributes 63% to the precipitation in the SETP, with 35% from a local source. The MYRB shows a local evaporative source of 29%, and 29% from its neighboring sub-region of Southern China. The recycling ratio reaches the highest in August for both regions. The higher local evaporative source in the SETP compared to the MYRB implies a stronger land–atmosphere interaction.
Monthly variations of the evaporative source pattern show that the SETP and the MYRB are controlled by the transition of the Indian monsoon and East Asian summer monsoon systems. In the early monsoon season (April and May), the common evaporative source area for the SETP and MYRB is west–east oriented. In the mid-monsoon season (June and July), it is southwest–northeast oriented. In the later monsoon season (August and September), it is south–north oriented. This seasonal variation implies the transition of the climate system over China from the westerly to the monsoon system. July is the turning point of the evaporative source from being Indian monsoon dominated to East Asian summer monsoon dominated.
The annual mean precipitation decreases from 1982 to 2011, in both target regions. In the SETP, the evaporative source decreases slightly in the terrestrial portion and heavily in the oceanic portion. However, in the MYRB, the evaporative source decreases heavily in the terrestrial portion and slightly in the oceanic portion. The precipitation recycling ratio increases in both regions despite the decrease in the terrestrial and oceanic sources. This indicates that the decreased advection from outside terrestrial sources and oceans is responsible for the decrease in precipitation in both regions. Temporally, the decrease in precipitation reaches its greatest point in September. Spatially, the evaporative source in the Bay of Bengal decreases the most among the 16 sub-regions.
Author Contributions
Conceptualization, Y.G.; Data curation, Y.X.; Formal analysis, Y.X.; Funding acquisition, Y.G.; Methodology, Y.X.; Project administration, Y.G.; Supervision, Y.G.; Visualization, Y.X.; Writing—original draft, Y.X.; Writing—review & editing, Y.X. and Y.G.
Funding
This research was funded by the National Key Research and Development Program of China (2017YFC1502101), Strategic Priority Research Program of Chinese Academy of Sciences (XDA2006010202) and the National Natural Science Foundation of China (91537105, 91537211).
Acknowledgments
We thank the ECMWF for the ERA-Interim Reanalysis dataset and the Super-Computing Center of the Chinese Academy of Science for computational resources.
Conflicts of Interest
The authors declare no conflict of interest.
References
- Zhisheng, A.; Guoxiong, W.; Jianping, L.; Youbin, S.; Yimin, L.; Weijian, Z.; Yanjun, C.; Anmin, D.; Li, L.; Jiangyu, M. Global monsoon dynamics and climate change. Annu. Rev. Earth Planet. Sci. 2015, 43, 29–77. [Google Scholar] [CrossRef]
- Gadgil, S. The Indian monsoon and its variability. Annu. Rev. Earth Planet. Sci. 2003, 31, 429–467. [Google Scholar] [CrossRef]
- Wang, B. Rainy season of the asian–pacific summer monsoon. J. Clim. 2002, 15, 386–398. [Google Scholar] [CrossRef]
- Ge, M.; Feng, Z. Classification of densities and characteristics of curve of population centers in china by GIS. J. Geogr. Sci. 2010, 20, 628–640. [Google Scholar] [CrossRef]
- Huang, X.F.; Xue, L.; Tian, X.D.; Shao, W.W.; Sun, T.L.; Gong, Z.H.; Ju, W.W.; Jiang, B.; Hu, M.; He, L.Y. Highly time-resolved carbonaceous aerosol characterization in yangtze river delta of china: Composition, mixing state and secondary formation. Atmos. Environ. 2013, 64, 200–207. [Google Scholar] [CrossRef]
- Ding, Y. The variability of the asian summer monsoon. J. Meteorol. Soc. Jpn. Ser. II 2007, 85, 21–54. [Google Scholar] [CrossRef]
- Adrien, F.; Martin, P.C.; Pauls, S.U.; JäHnig, S.C.; Dieter, U.; Ingo, M.; Muellner-Riehl, A.N. The role of the uplift of the Qinghai-Tibetan Plateau for the evolution of Tibetan biotas. Biol. Rev. Camb. Philos. Soc. 2015, 90, 236–253. [Google Scholar]
- Hou, J.; D’Andrea, W.J.; Wang, M.; He, Y.; Liang, J. Influence of the indian monsoon and the subtropical jet on climate change on the Tibetan Plateau since the late pleistocene. Quat. Sci. Rev. 2017, 163, 84–94. [Google Scholar] [CrossRef]
- Hren, M.T.; Bookhagen, B.; Blisniuk, P.M.; Booth, A.L.; Chamberlain, C.P. Δ18o and δd of streamwaters across the himalaya and Tibetan Plateau: Implications for moisture sources and paleoelevation reconstructions. Earth Planet. Sci. Lett. 2009, 288, 20–32. [Google Scholar] [CrossRef]
- Wernicke, J.; Hochreuther, P.; Grießinger, J.; Zhu, H.; Wang, L.; Bräuning, A. Multi-century humidity reconstructions from the southeastern Tibetan Plateau inferred from tree-ring δ18o. Glob. Planet. Chang. 2017, 149, 26–35. [Google Scholar] [CrossRef]
- Liu, Z.; Liu, Y.; Wang, S.; Yang, X.; Wang, Z. Evaluation of spatial and temporal performances of era-interim precipitation and temperature in mainland china. J. Clim. 2018, 31, 4347–4365. [Google Scholar] [CrossRef]
- Li, K.; Liu, X.; Wang, Y.; Herzschuh, U.; Ni, J.; Liao, M.; Xiao, X. Late holocene vegetation and climate change on the southeastern Tibetan Plateau: Implications for the indian summer monsoon and links to the indian ocean dipole. Quat. Sci. Rev. 2017, 177, 235–245. [Google Scholar] [CrossRef]
- Gao, X.; Shi, Y.; Song, R.; Giorgi, F.; Wang, Y.; Zhang, D. Reduction of future monsoon precipitation over china: Comparison between a high resolution rcm simulation and the driving gcm. Meteorol. Atmos. Phys. 2008, 100, 73–86. [Google Scholar] [CrossRef]
- Van der Ent, R.J.; Savenije, H.H.; Schaefli, B.; Steele-Dunne, S.C. Origin and fate of atmospheric moisture over continents. Water Resour. Res. 2010, 46, W09525. [Google Scholar] [CrossRef]
- Dirmeyer, P.A.; Brubaker, K.L. Characterization of the global hydrologic cycle from a back-trajectory analysis of atmospheric water vapor. J. Hydrometeorol. 2007, 8, 20–37. [Google Scholar] [CrossRef]
- Trenberth, K.E. Atmospheric moisture residence times and cycling: Implications for rainfall rates and climate change. Clim. Chang. 1998, 39, 667–694. [Google Scholar] [CrossRef]
- McDonald, J.E. The evaporation-precipitation fallacy. Weather 1962, 17, 168–177. [Google Scholar] [CrossRef]
- Budyko, M.; Drozdov, O. Characteristics of the moisture circulation in the atmosphere. Izv. Akad. Nauk SSSR Ser. Geogr. Geofiz 1953, 4, 5–14. [Google Scholar]
- Dirmeyer, P.A.; Brubaker, K.L.; DelSole, T. Import and export of atmospheric water vapor between nations. J. Hydrol. 2009, 365, 11–22. [Google Scholar] [CrossRef]
- Trenberth, K.E. Atmospheric moisture recycling: Role of advection and local evaporation. J. Clim. 1999, 12, 1368–1381. [Google Scholar] [CrossRef]
- Dominguez, F.; Kumar, P.; Liang, X.Z.; Ting, M. Impact of atmospheric moisture storage on precipitation recycling. J. Clim. 2006, 19, 1513–1530. [Google Scholar] [CrossRef]
- Zhang, C.; Tang, Q.; Chen, D. Recent changes in the moisture source of precipitation over the Tibetan Plateau. J. Clim. 2017, 30, 1807–1819. [Google Scholar] [CrossRef]
- Zhang, C.; Tang, Q.; Chen, D.; van der Ent, R.J.; Liu, X.; Li, W.; Gebremeskel Haile, G. Moisture source changes contributed to different precipitation changes over the northern and southern Tibetan Plateau. J. Hydrometeorol. 2019, 20, 217–229. [Google Scholar] [CrossRef]
- Curio, J.; Maussion, F.; Scherer, D. A 12-year high-resolution climatology of atmospheric water transport over the Tibetan Plateau. Earth Syst. Dyn. 2015, 6, 109–124. [Google Scholar] [CrossRef] [Green Version]
- Chen, B.; Xu, X.D.; Yang, S.; Zhang, W. On the origin and destination of atmospheric moisture and air mass over the Tibetan Plateau. Theor. Appl. Climatol. 2012, 110, 423–435. [Google Scholar] [CrossRef]
- Drumond, A.; Nieto, R.; Gimeno, L. Sources of moisture for china and their variations during drier and wetter conditions in 2000–2004: A lagrangian approach. Clim. Res. 2011, 50, 215–225. [Google Scholar] [CrossRef]
- Wang, N.; Zeng, X.M.; Guo, W.D.; Chen, C.; Wei, Y.; Zheng, Y.; Jian, Z. Quantitative diagnosis of moisture sources and transport pathways for summer precipitation over the mid-lower yangtze river basin. J. Hydrol. 2018, 559, 252–265. [Google Scholar] [CrossRef]
- Chen, B.; Xu, X.D.; Zhao, T. Main moisture sources affecting lower yangtze river basin in boreal summers during 2004–2009. Int. J. Climatol. 2013, 33, 1035–1046. [Google Scholar]
- Budyko, M. Climate and Life; Academic Press: New York, NY, USA, 1974; Volume 508. [Google Scholar]
- Eltahir, E.A.; Bras, R.L. Precipitation recycling. Rev. Geophys. 1996, 34, 367–378. [Google Scholar] [CrossRef]
- Brubaker, K.L.; Entekhabi, D.; Eagleson, P. Estimation of continental precipitation recycling. J. Clim. 1993, 6, 1077–1089. [Google Scholar] [CrossRef]
- Dominguez, F.; Kumar, P.; Vivoni, E.R. Precipitation recycling variability and ecoclimatological stability—A study using narr data. Part ii: North American monsoon region. J. Clim. 2008, 21, 5187–5203. [Google Scholar] [CrossRef]
- Van der Ent, R.J.; Savenije, H. Length and time scales of atmospheric moisture recycling. Atmos. Chem. Phys. 2011, 11, 1853–1863. [Google Scholar] [CrossRef] [Green Version]
- Stohl, A.; Forster, C.; Frank, A.; Seibert, P.; Wotawa, G. The lagrangian particle dispersion model flexpart version 6.2. Atmos. Chem. Phys. 2005, 5, 2461–2474. [Google Scholar] [CrossRef]
- Brioude, J.; Arnold, D.; Stohl, A. The lagrangian particle dispersion model flexpart-wrf version 3.1. Geosci. Model Dev. 2013, 6, 1889–1904. [Google Scholar] [CrossRef]
- Van der Ent, R.J.; Tuinenburg, O.; Knoche, H.R.; Kunstmann, H.; Savenije, H. Should we use a simple or complex model for moisture recycling and atmospheric moisture tracking? Hydrol. Earth Syst. Sci. 2013, 17, 4869–4884. [Google Scholar] [CrossRef] [Green Version]
- Fitzmaurice, J.A. A Critical Analysis of Bulk Precipitation Recycling Models. Ph.D. Thesis, Massachusetts Institute of Technology, Cambridge, MA, USA, 2007. [Google Scholar]
- Burde, G.I. Bulk recycling models with incomplete vertical mixing. Part i: Conceptual framework and models. J. Clim. 2006, 19, 1461–1472. [Google Scholar] [CrossRef]
- Harding, K.J.; Snyder, P.K. Modeling the atmospheric response to irrigation in the great plains. Part ii: The precipitation of irrigated water and changes in precipitation recycling. J. Hydrometeorol. 2012, 13, 1687–1703. [Google Scholar] [CrossRef]
- Tuinenburg, O.; Hutjes, R.; Kabat, P. The fate of evaporated water from the Ganges basin. J. Geophys. Res. Atmos. 2012, 117, D01107. [Google Scholar] [CrossRef]
- Wei, J.F.; Dirmeyer, P.A.; Bosilovich, M.G.; Wu, R.G. Water vapor sources for yangtze river valley rainfall: Climatology, variability, and implications for rainfall forecasting. J. Geophys. Res. Atmos. 2012, 117, D05126. [Google Scholar] [CrossRef]
- Brubaker, K.L.; Dirmeyer, P.A.; Sudradjat, A.; Levy, B.S.; Bernal, F. A 36-yr climatological description of the evaporative sources of warm-season precipitation in the mississippi river basin. J. Hydrometeorol. 2001, 2, 537–557. [Google Scholar] [CrossRef]
- Dirmeyer, P.A.; Brubaker, K.L. Contrasting evaporative moisture sources during the drought of 1988 and the flood of 1993. J. Geophys. Res. Atmos. 1999, 104, 19383–19397. [Google Scholar] [CrossRef]
- Merrill, J.T.; Bleck, R.; Boudra, D. Techniques of lagrangian trajectory analysis in isentropic coordinates. Mon. Weather Rev. 1986, 114, 571–581. [Google Scholar] [CrossRef]
- Dee, D.P.; Uppala, S. Variational bias correction of satellite radiance data in the era-interim reanalysis. Q. J. R. Meteorol. Soc. 2009, 135, 1830–1841. [Google Scholar] [CrossRef]
- Dee, D.P.; Uppala, S.; Simmons, A.; Berrisford, P.; Poli, P.; Kobayashi, S.; Andrae, U.; Balmaseda, M.; Balsamo, G.; Bauer, P. The era-interim reanalysis: Configuration and performance of the data assimilation system. Q. J. R. Meteorol. Soc. 2011, 137, 553–597. [Google Scholar] [CrossRef]
- Gao, Y.; Cuo, L.; Zhang, Y. Changes in moisture flux over the Tibetan Plateau during 1979–2011 and possible mechanisms. J. Clim. 2014, 27, 1876–1893. [Google Scholar] [CrossRef]
- Roxy, M.K.; Ritika, K.; Terray, P.; Murtugudde, R.; Ashok, K.; Goswami, B. Drying of indian subcontinent by rapid indian ocean warming and a weakening land-sea thermal gradient. Nat. Commun. 2015, 6, 7423. [Google Scholar] [CrossRef] [PubMed]
- Song, F.; Zhou, T.; Qian, Y. Responses of East Asian summer monsoon to natural and anthropogenic forcings in the 17 latest cmip5 models. Geophys. Res. Lett. 2014, 41, 596–603. [Google Scholar] [CrossRef]
- Zhu, C.; Wang, B.; Qian, W.; Zhang, B. Recent weakening of northern East Asian summer monsoon: A possible response to global warming. Geophys. Res. Lett. 2012, 39, L09701. [Google Scholar] [CrossRef]
- Martinez, J.A.; Dominguez, F. Sources of atmospheric moisture for the la plata river basin. J. Climate 2014, 27, 6737–6753. [Google Scholar] [CrossRef]
- Petterssen, S. Weather Analysis and Forecasting; McGraw-Hill Book Company: New York, NY, USA, 1940; pp. 221–223. [Google Scholar]
Figure 1.
(a) Annual mean precipitation (shades) and column integrated moisture flux from surface to 50 hPa (arrows) in the wet season (April–September) in the study region, over 1982–2011. (b) Sixteen sub-regions of the evaporative source of precipitation in the two target regions. The Southeast Tibetan Plateau (SETP) and the Middle Yangtze River Basin (MYRB) are the two target regions, indicated with red rectangles. In addition to the two target regions, 14 sub-regions in Figure 1b include the rest of the Tibetan Plateau except for the SETP (RTP), the Bay of Bengal (BB), Northern India (NIN), Southern India (SIN), Central China (CC), Bangladesh and Myanmar (BM), the Arabian Sea (ARS), Southern China (SC), the South China Sea (SCS), Indochina (INDO), the Pacific Ocean (PAC), the western area (WE), the northwestern area (NW) and the northeastern area (NE).

Figure 2.
Monthly variations of the top six evaporative sources of precipitation in the (a) SETP and the (b) MYRB in the wet season, averaged over 1982–2011. The monthly evaporative source percentage for each sub-region is the contribution of the evaporative source in the sub-region to the precipitation in the target region.

Figure 3.
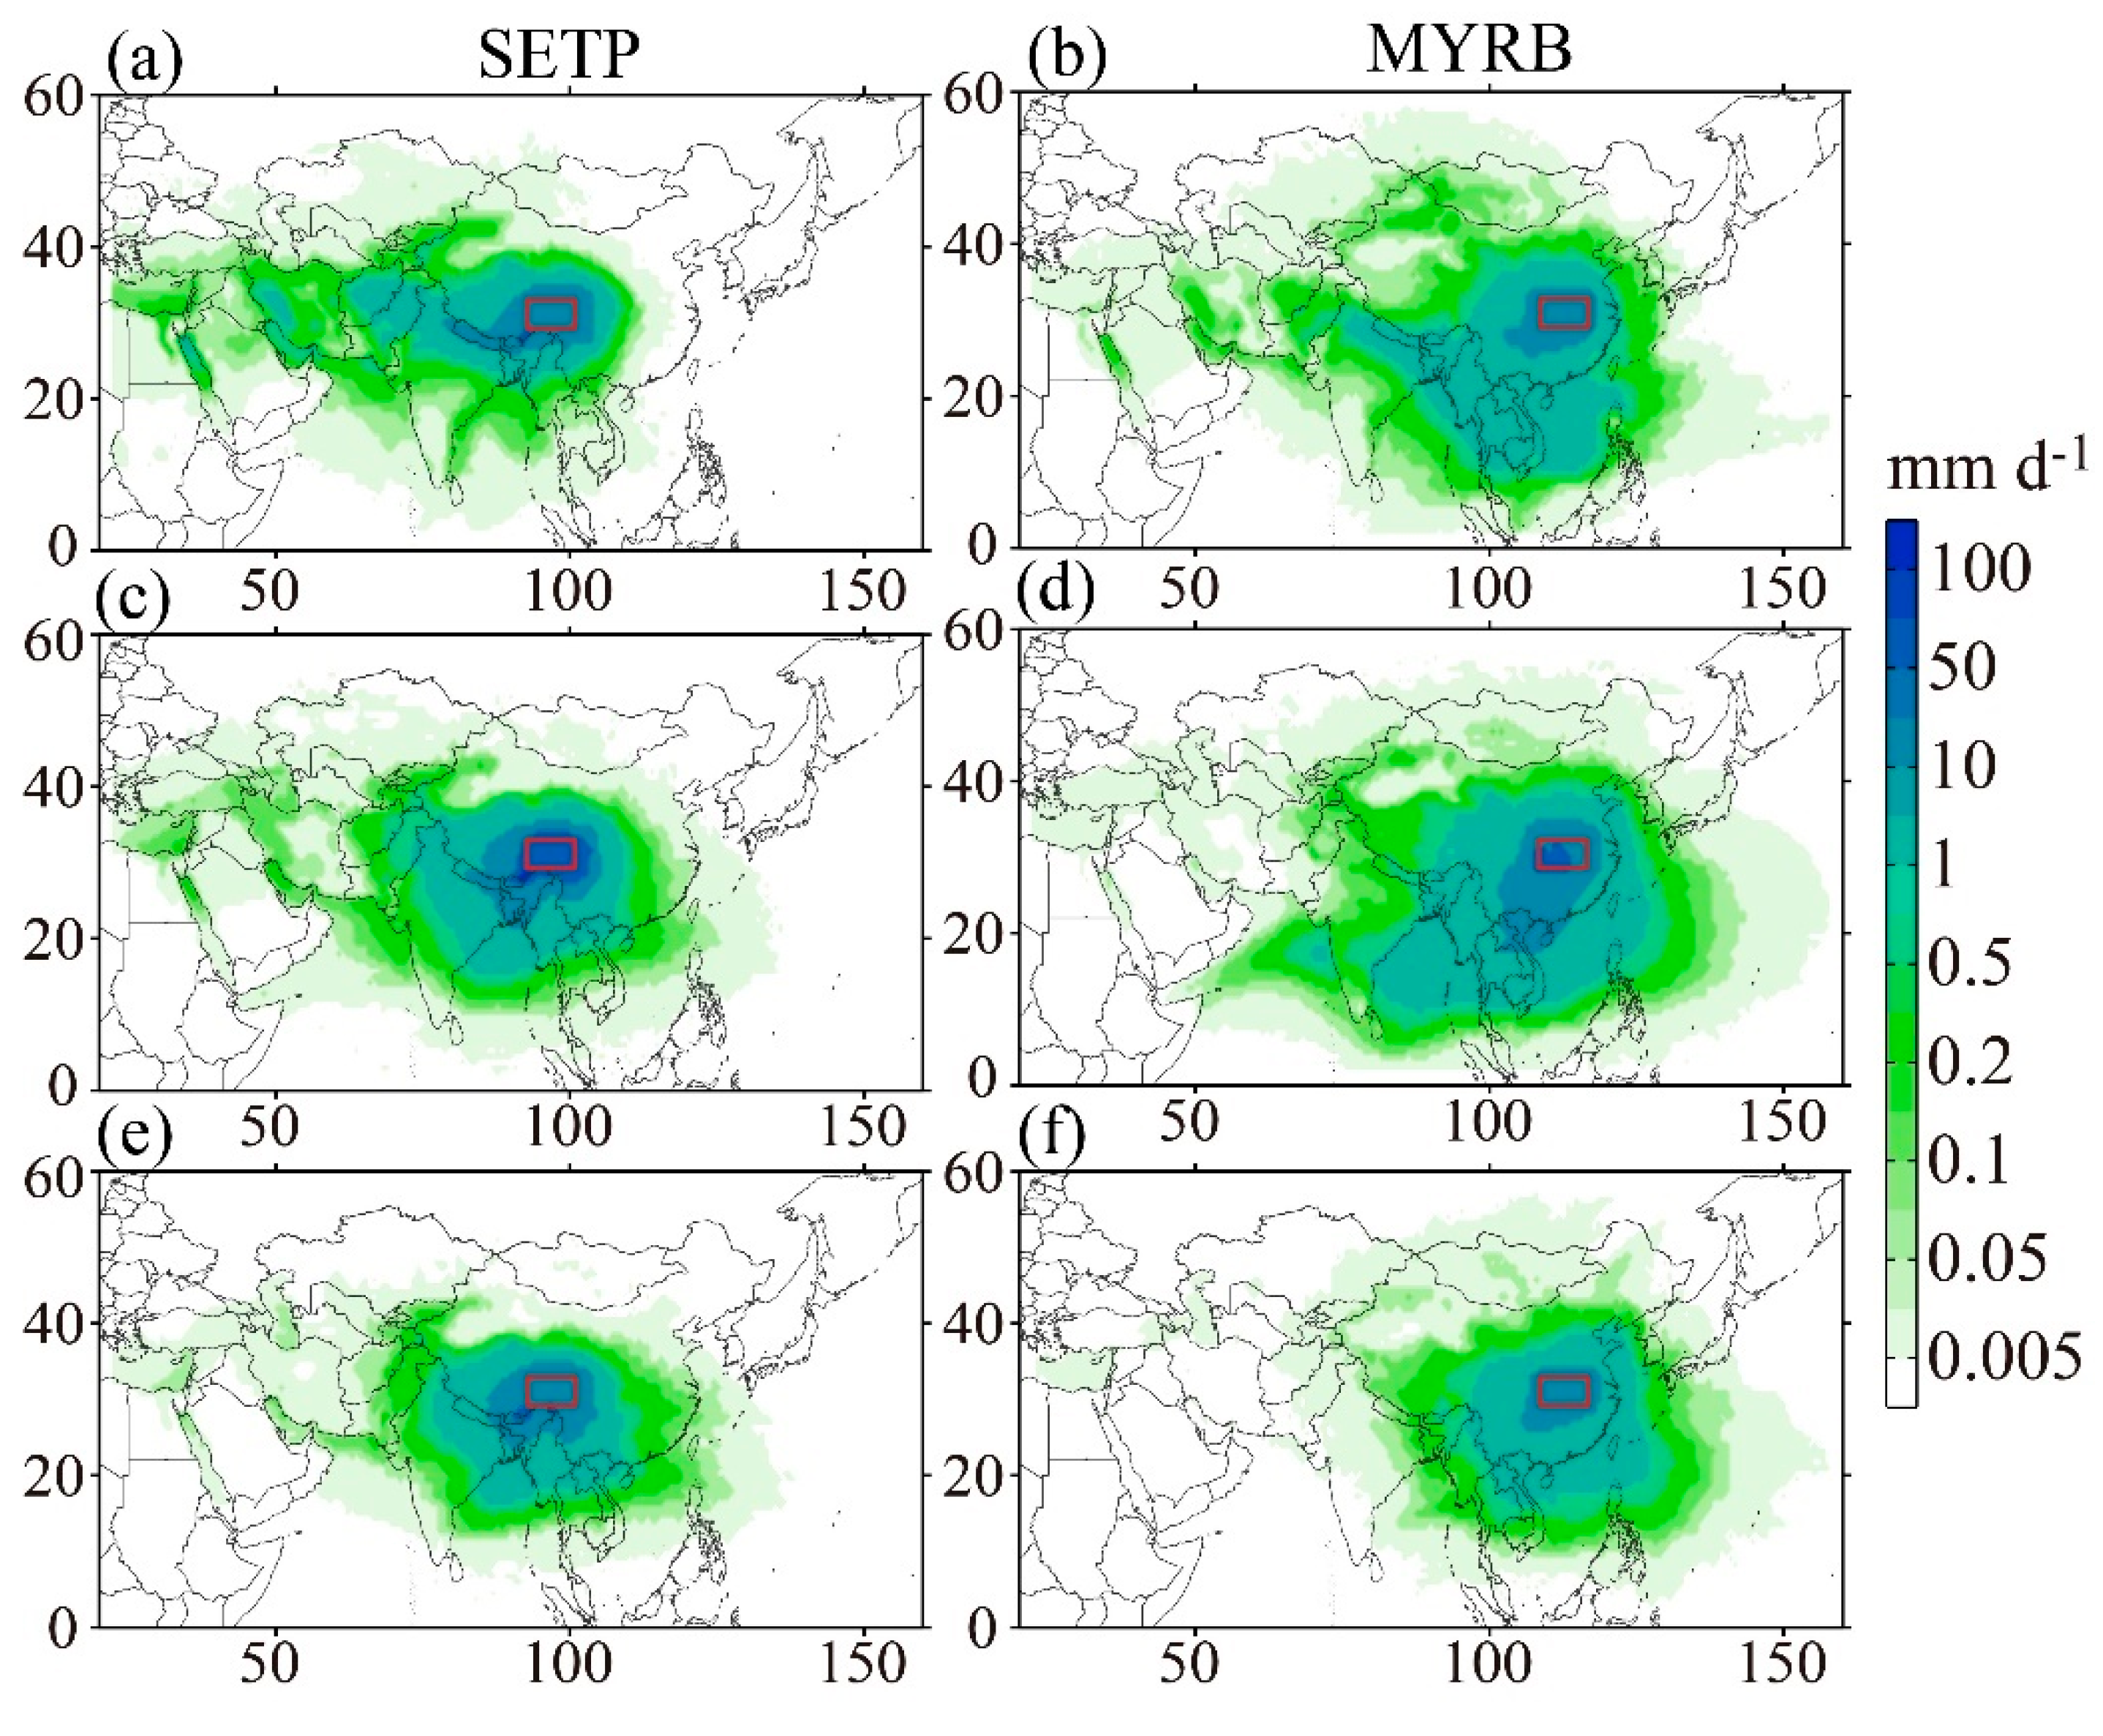
Monthly variations of evaporative sources (unit: mm d−1) for the SETP (left) and the MYRB (right) in the wet season (a,b) April–May, (c,d) June–July, (e,f) August–September over 1982–2011. Red boxes represent the target regions.
Figure 3.
Monthly variations of evaporative sources (unit: mm d−1) for the SETP (left) and the MYRB (right) in the wet season (a,b) April–May, (c,d) June–July, (e,f) August–September over 1982–2011. Red boxes represent the target regions.

Figure 4.
Variations and linear trends of annual mean precipitation (unit: mm) over 1982–2011 in the SETP and the MYRB, based on the station observations of the Chinese Meteorology Administration. K represents the slope of the linear regression lines (unit: mm d−1 a−1), RMSE represents the root mean square error of the linear regression (unit: mm). The p value is also represented.

Figure 5.
Linear trends of monthly mean precipitation (unit: mm d−1 a−1) for the SETP and the MYRB in the wet season over 1982–2011.
Figure 5.
Linear trends of monthly mean precipitation (unit: mm d−1 a−1) for the SETP and the MYRB in the wet season over 1982–2011.

Figure 6.
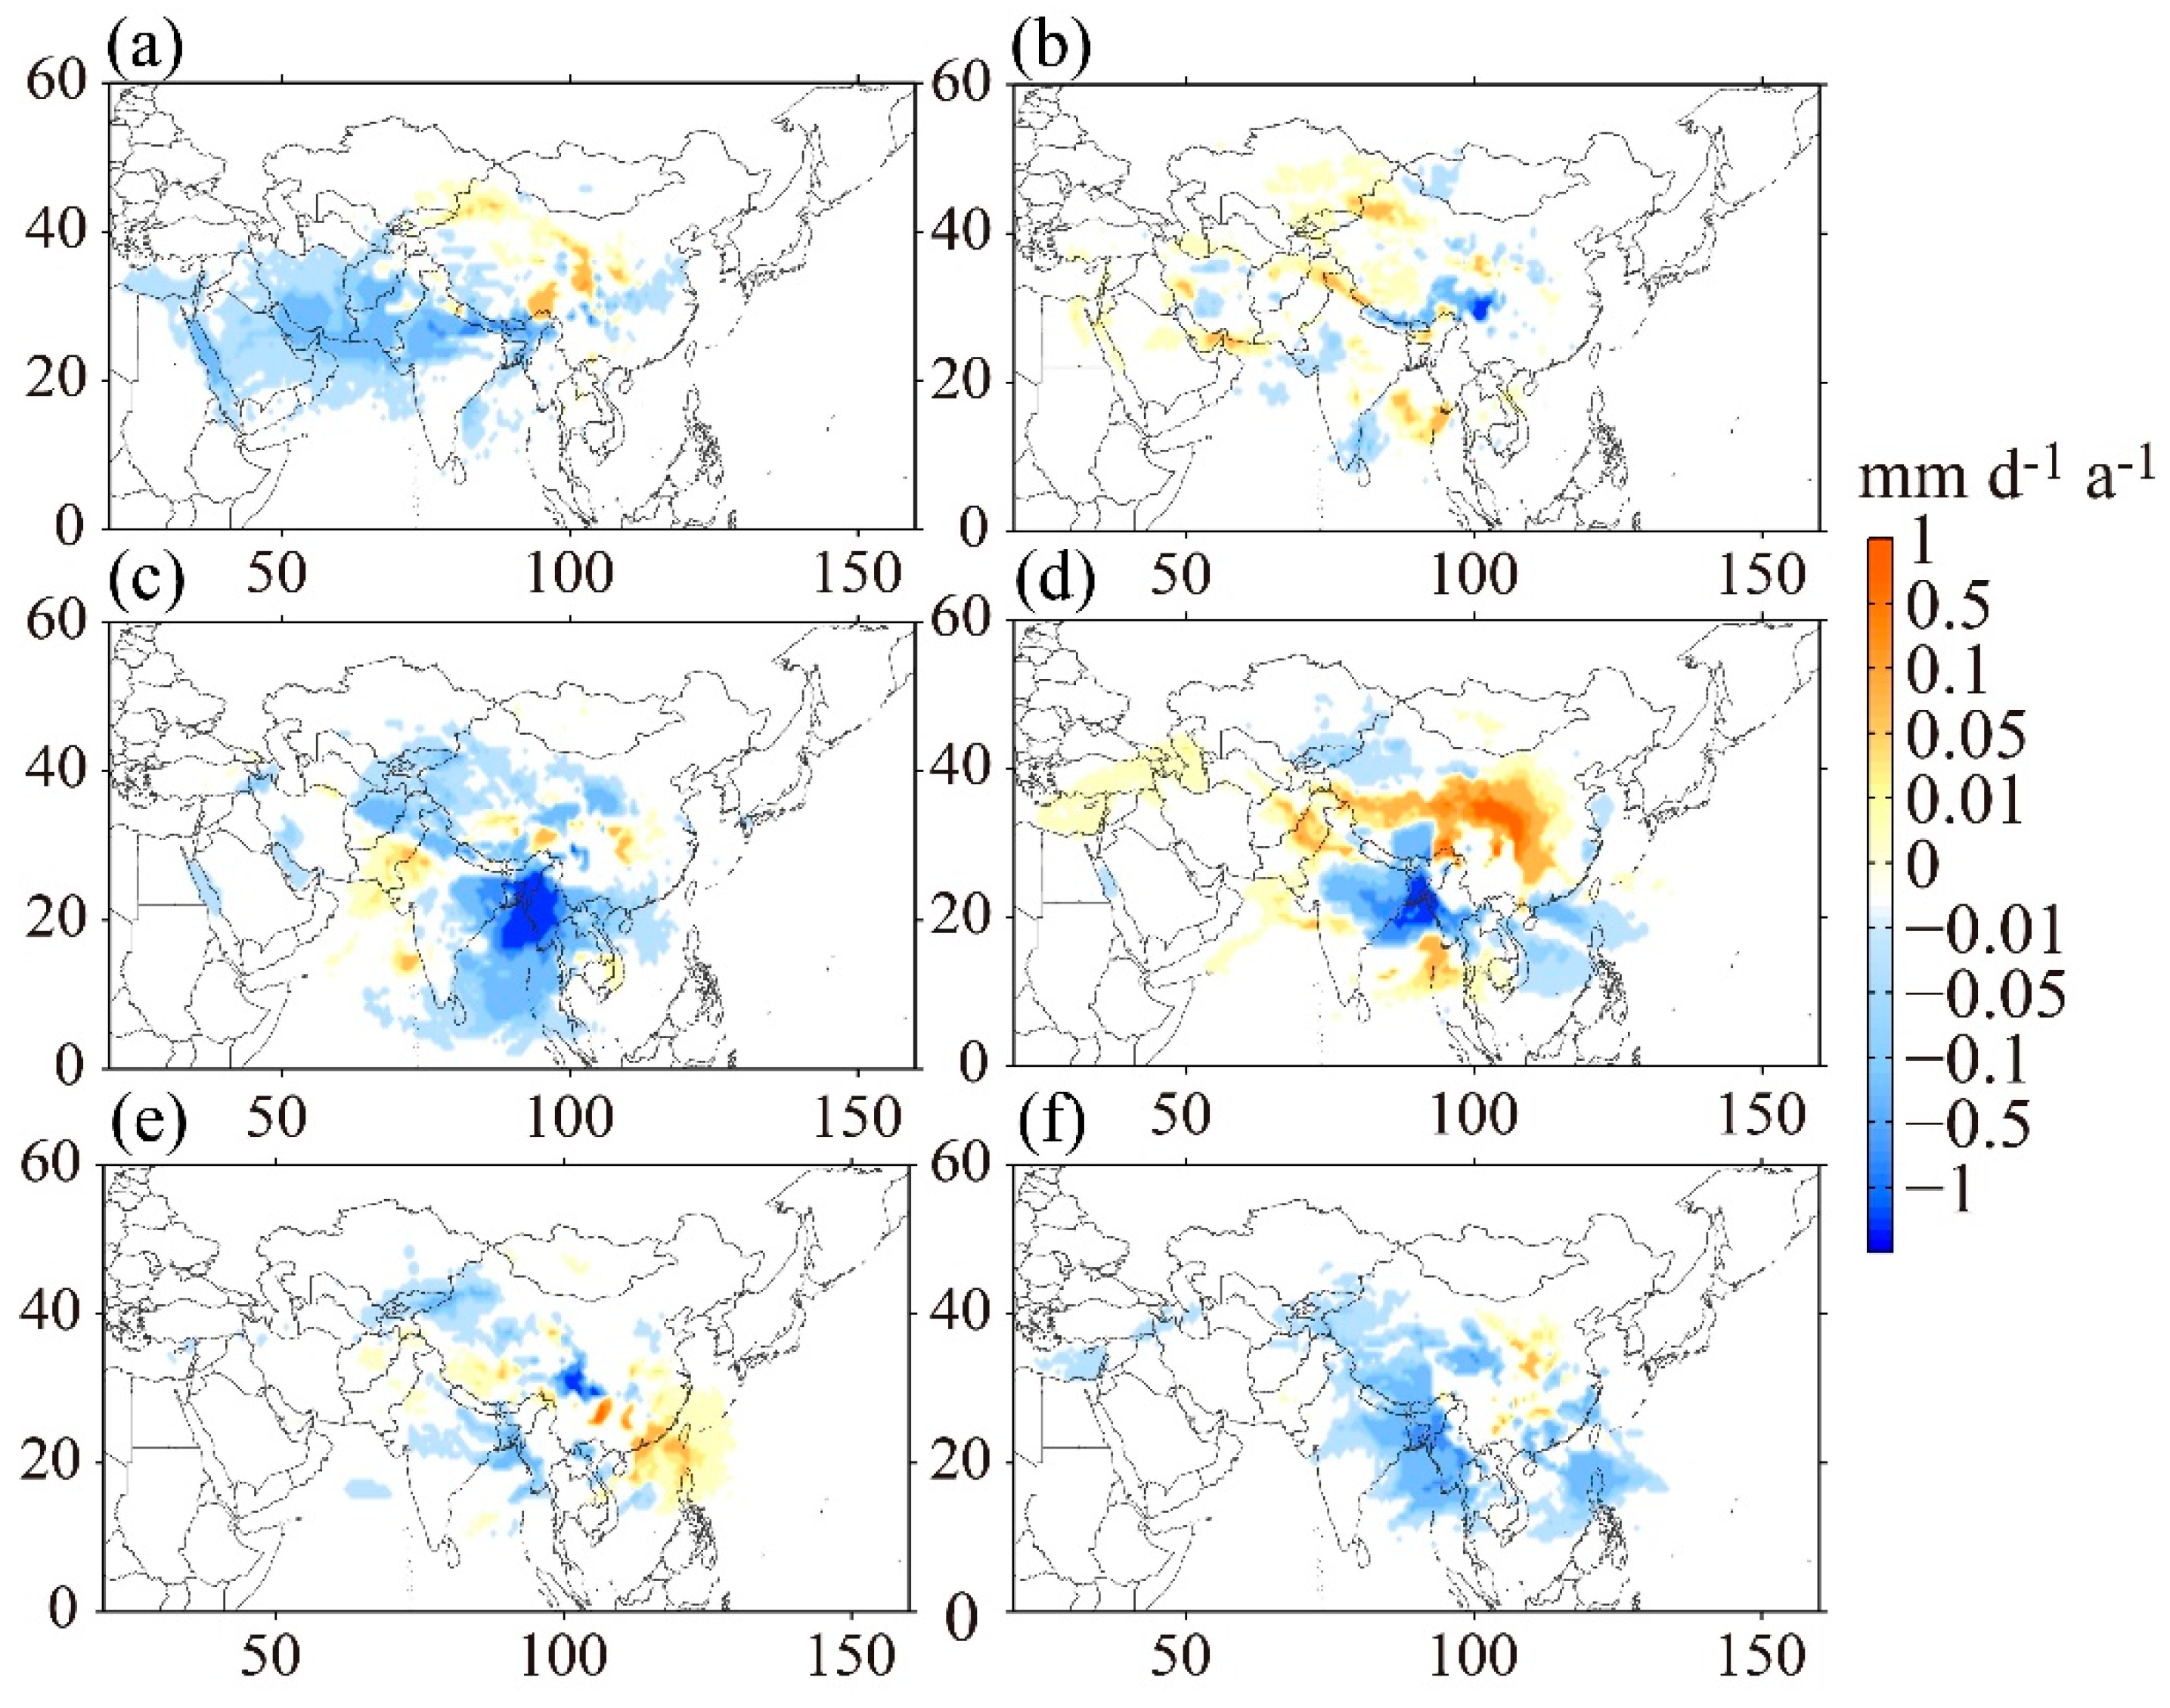
Linear trends of monthly common evaporative sources (unit: mm d−1 a−1) for the SETP and MYRB in the wet season (a) April, (b) May, (c) June, (d) July, (e) August, (f) September over 1982–2011. Common areas are defined as areas with the same positive or negative trends in terms of evaporative source for both target regions.
Figure 6.
Linear trends of monthly common evaporative sources (unit: mm d−1 a−1) for the SETP and MYRB in the wet season (a) April, (b) May, (c) June, (d) July, (e) August, (f) September over 1982–2011. Common areas are defined as areas with the same positive or negative trends in terms of evaporative source for both target regions.

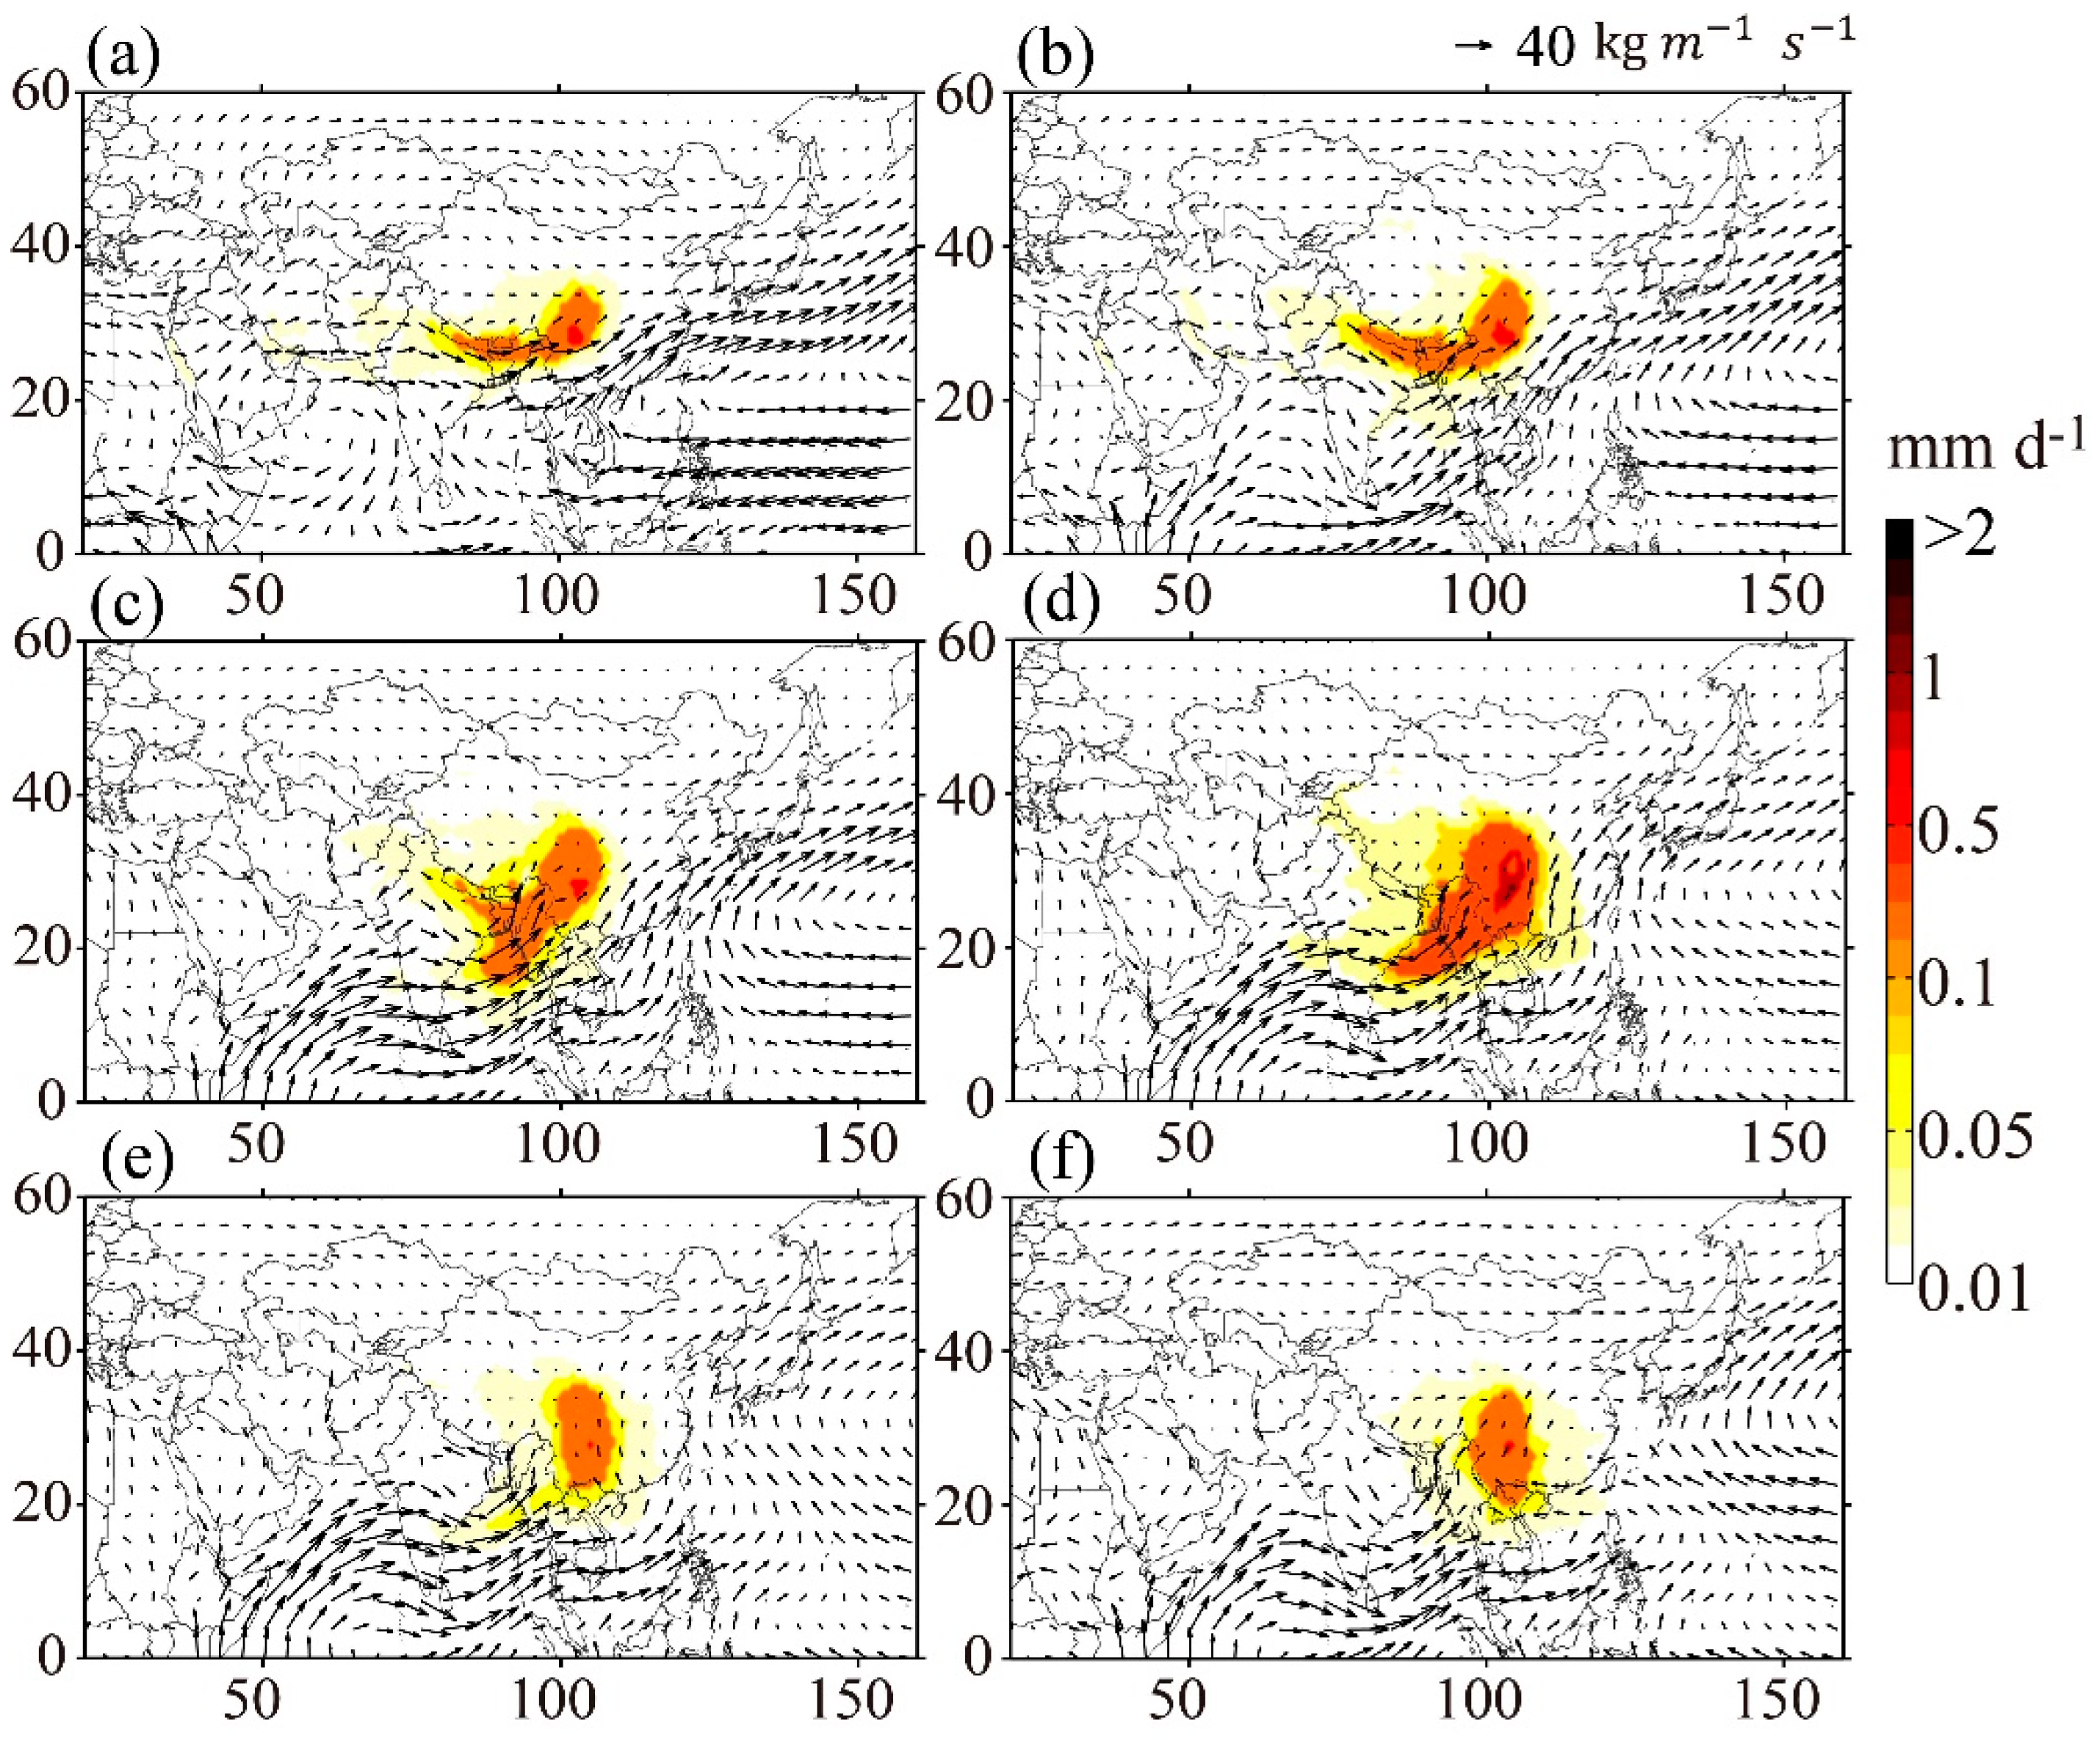
Figure 7.
Monthly mean common evaporative sources change larger than 0.01mm d−1 (shades) for both target regions, and monthly integrated moisture fluxes (unit: kg m−1 s−1) from surface to 50 hPa (arrows) in the wet season (a) April, (b) May, (c) June, (d) July, (e) August, (f) September over 1982–2011.

Figure 8.
Box-whispers of the normalized evaporative sources for three groups of featured sub-regions (southwest area (SW), south area (S) and southeast area (SE)) from April to September over 1982–2011 for (a) the SETP and (b) the MYRB.
Figure 8.
Box-whispers of the normalized evaporative sources for three groups of featured sub-regions (southwest area (SW), south area (S) and southeast area (SE)) from April to September over 1982–2011 for (a) the SETP and (b) the MYRB.


Table 1.
Monthly and wet season (April–September) average evaporative sources in the 16 sub-regions, contributing to precipitation (unit: %) in the SETP and MYRB in 1982–2011. Contributions above the average threshold (6%) are marked in bold.
Table 1.
Monthly and wet season (April–September) average evaporative sources in the 16 sub-regions, contributing to precipitation (unit: %) in the SETP and MYRB in 1982–2011. Contributions above the average threshold (6%) are marked in bold.
| SETP | MYRB | |||||||||||||
|---|---|---|---|---|---|---|---|---|---|---|---|---|---|---|
| April | May | June | July | August | September | Average | April | May | June | July | August | September | Average | |
| ARS | 0.85 | 0.46 | 0.75 | 0.21 | 0.08 | 0.12 | 0.41 | 0.34 | 0.19 | 0.37 | 0.71 | 0.10 | 0.01 | 0.29 |
| BM | 8.97 | 8.57 | 11.41 | 11.87 | 10.18 | 14.85 | 10.97 | 3.80 | 4.53 | 5.17 | 3.42 | 1.00 | 1.47 | 3.23 |
| BB | 0.44 | 0.48 | 3.23 | 2.62 | 1.12 | 2.20 | 1.68 | 0.75 | 2.06 | 7.04 | 5.51 | 2.17 | 0.43 | 2.99 |
| INDO | 0.06 | 0.12 | 0.35 | 0.46 | 0.50 | 1.22 | 0.45 | 6.11 | 7.37 | 7.85 | 8.26 | 4.50 | 2.91 | 6.17 |
| CC | 0.74 | 0.78 | 0.63 | 0.89 | 1.02 | 0.57 | 0.77 | 10.99 | 10.92 | 8.81 | 8.33 | 10.54 | 12.61 | 10.37 |
| NE | 0.01 | 0.01 | 0.01 | 0.01 | 0.02 | 0.01 | 0.01 | 0.51 | 0.34 | 0.27 | 0.29 | 0.34 | 0.76 | 0.42 |
| NIN | 12.51 | 10.14 | 13.12 | 5.78 | 1.88 | 5.34 | 8.13 | 2.66 | 2.80 | 1.86 | 0.48 | 0.13 | 0.25 | 1.36 |
| NW | 0.40 | 0.64 | 0.45 | 0.31 | 0.28 | 0.27 | 0.39 | 0.87 | 0.99 | 0.54 | 0.36 | 0.27 | 0.40 | 0.57 |
| PAC | 0.01 | 0.01 | 0.01 | 0.06 | 0.06 | 0.16 | 0.05 | 2.40 | 1.89 | 1.76 | 3.20 | 6.06 | 8.31 | 3.94 |
| SC | 7.03 | 7.38 | 6.46 | 10.69 | 16.11 | 12.51 | 10.03 | 28.10 | 26.47 | 27.90 | 30.96 | 31.16 | 31.87 | 29.41 |
| SCS | 0.02 | 0.03 | 0.06 | 0.23 | 0.28 | 0.54 | 0.19 | 7.08 | 7.34 | 5.91 | 8.83 | 7.75 | 5.92 | 7.14 |
| SIN | 0.17 | 0.18 | 0.56 | 0.57 | 0.24 | 0.36 | 0.35 | 0.14 | 0.20 | 0.42 | 0.58 | 0.18 | 0.03 | 0.26 |
| RTP | 27.41 | 29.66 | 28.04 | 28.01 | 25.55 | 29.23 | 27.98 | 2.01 | 1.93 | 2.37 | 1.91 | 1.38 | 1.91 | 1.92 |
| SETP | 33.32 | 36.66 | 30.20 | 37.23 | 41.86 | 31.85 | 35.19 | 2.57 | 2.49 | 2.52 | 2.01 | 1.33 | 2.57 | 2.25 |
| WE | 7.90 | 4.76 | 4.60 | 0.84 | 0.41 | 0.53 | 3.17 | 1.34 | 1.22 | 0.65 | 0.20 | 0.13 | 0.09 | 0.62 |
| MYRB | 0.16 | 0.12 | 0.12 | 0.21 | 0.42 | 0.25 | 0.21 | 30.34 | 29.25 | 26.58 | 24.97 | 32.95 | 30.44 | 29.09 |
Table 2.
Monthly and wet season (April–September) average terrestrial and oceanic evaporative sources contributing to precipitation (unit: %) in the SETP and MYRB over 1982–2011. The terrestrial source represents the evaporative source from the land area, which includes the local contribution from the target region (SETP or MYRB). The local contribution represents the local (SETP or MYRB) evaporative source contribution from the target region itself. The oceanic source contains evaporative sources from the Indian Ocean and Pacific Ocean. The contribution of the Indian Ocean consists of evaporative sources from BB and ARS, and the contribution of the Pacific Ocean consists of evaporative sources from SCS and PAC.
| April | May | June | July | August | September | Average | |||
|---|---|---|---|---|---|---|---|---|---|
| SETP | Terrestrial | 98.67 | 99.02 | 95.95 | 96.88 | 98.46 | 96.99 | 97.66 | |
| Local | 33.32 | 36.66 | 30.20 | 37.23 | 41.86 | 31.85 | 35.19 | ||
| Oceanic | 1.33 | 0.98 | 4.05 | 3.12 | 1.54 | 3.01 | 2.34 | ||
| Indian Ocean | 1.29 | 0.95 | 3.98 | 2.83 | 1.20 | 2.31 | 2.09 | ||
| Pacific Ocean | 0.04 | 0.03 | 0.07 | 0.29 | 0.34 | 0.70 | 0.24 | ||
| MYRB | Terrestrial | 89.43 | 88.53 | 84.92 | 81.76 | 83.91 | 85.33 | 85.65 | |
| Local | 30.34 | 29.25 | 26.58 | 24.97 | 32.95 | 30.44 | 29.09 | ||
| Oceanic | 10.57 | 11.47 | 15.08 | 18.24 | 16.09 | 14.67 | 14.35 | ||
| Indian Ocean | 1.08 | 2.25 | 7.41 | 6.22 | 2.28 | 0.44 | 3.28 | ||
| Pacific Ocean | 9.48 | 9.22 | 7.67 | 12.02 | 13.81 | 14.23 | 11.07 | ||
Table 3.
Linear trends of the monthly and wet season (April–September) average of evaporative sources (unit: mm d−1 a−1) in the 16 sub-regions, contributing to precipitation in the SETP and MYRB over 1982–2011. Absolute changes larger than the threshold of 0.16 mm d−1 a−1 for SETP and 0.08 mm d−1 a−1 for MYRB (this criterion is based on the three-sigma rule) are marked in bold.
| SETP | MYRB | |||||||||||||
|---|---|---|---|---|---|---|---|---|---|---|---|---|---|---|
| April | May | June | July | August | September | Average | April | May | June | July | August | September | Average | |
| ARS | −0.12 | 0.00 | 0.15 | 0.08 | 0.02 | 0.01 | 0.02 | −0.07 | 0.00 | 0.04 | 0.01 | −0.02 | 0.00 | −0.01 |
| BM | −0.44 | 0.41 | −0.51 | −0.60 | 0.40 | −1.24 | −0.33 | −0.23 | −0.34 | −0.67 | −0.51 | −0.17 | −0.29 | −0.37 |
| BB | −0.02 | 0.07 | −1.04 | −0.24 | 0.02 | −0.61 | −0.30 | −0.11 | 0.02 | −0.64 | −0.25 | −0.25 | −0.16 | −0.23 |
| INDO | 0.00 | 0.02 | −0.05 | 0.02 | 0.04 | 0.08 | 0.02 | −0.23 | −0.36 | −0.27 | −0.56 | −0.36 | −0.57 | −0.39 |
| CC | 0.01 | 0.03 | −0.02 | 0.34 | 0.14 | 0.04 | 0.09 | −0.15 | −0.16 | −0.16 | 0.89 | −0.54 | 0.29 | 0.03 |
| NE | 0.00 | 0.00 | 0.00 | 0.00 | 0.00 | 0.00 | 0.00 | −0.10 | −0.05 | −0.11 | 0.05 | −0.10 | 0.10 | −0.03 |
| NIN | −0.33 | 0.53 | −0.15 | −1.86 | −0.21 | −1.29 | −0.55 | −0.29 | −0.18 | −0.18 | −0.11 | −0.01 | −0.06 | −0.14 |
| NW | 0.02 | 0.07 | −0.04 | −0.07 | −0.09 | −0.04 | −0.02 | −0.01 | 0.08 | −0.05 | 0.01 | −0.03 | −0.03 | 0.00 |
| PAC | 0.00 | 0.00 | 0.00 | −0.01 | 0.02 | −0.08 | −0.01 | −0.54 | 0.00 | −0.53 | −0.12 | 0.59 | 0.34 | −0.04 |
| SC | 0.05 | 0.25 | 0.20 | 1.41 | 1.17 | 0.94 | 0.67 | −0.39 | −1.15 | −1.67 | −0.18 | −0.26 | −0.14 | −0.63 |
| SCS | 0.00 | 0.00 | −0.01 | −0.01 | 0.03 | −0.06 | −0.01 | −0.51 | −0.22 | −0.77 | −1.22 | 0.31 | −0.32 | −0.46 |
| SIN | 0.01 | 0.02 | −0.07 | −0.08 | 0.03 | −0.04 | −0.02 | −0.03 | −0.02 | −0.03 | −0.10 | −0.04 | 0.00 | −0.04 |
| RTP | −0.62 | 0.47 | −0.29 | 0.02 | 0.58 | −1.58 | −0.24 | 0.02 | −0.03 | −0.10 | 0.25 | −0.05 | −0.14 | −0.01 |
| SETP | 0.18 | −0.03 | 0.26 | 1.67 | −0.41 | 0.52 | 0.36 | 0.06 | −0.14 | −0.10 | 0.04 | −0.11 | −0.10 | −0.06 |
| WE | −0.90 | 0.43 | 0.06 | 0.09 | 0.04 | −0.03 | −0.05 | −0.26 | −0.03 | −0.07 | 0.07 | 0.00 | −0.02 | −0.05 |
| MYRB | 0.00 | 0.02 | 0.01 | 0.07 | 0.04 | 0.01 | 0.02 | −0.43 | −0.28 | 0.75 | 2.20 | 0.02 | 0.03 | 0.38 |
Table 4.
Linear trends of monthly and wet season (April–September) averaged terrestrial and oceanic evaporative sources (unit: mm d−1 a−1) for the SETP and MYRB over 1982–2011. The terrestrial source represents the evaporative source from the land area, which includes the local contribution from the target region (SETP or MYRB). The local contribution represents the local (SETP or MYRB) evaporative source contribution from the target region itself. The oceanic source contains the evaporative source from the Indian Ocean and Pacific Ocean. Contributions from the Indian Ocean consist of evaporative sources from BB and ARS, and the contribution from the Pacific Ocean consists of evaporative sources from SCS and PAC.
| April | May | June | July | August | September | Average | |||
|---|---|---|---|---|---|---|---|---|---|
| SETP | Terrestrial | −2.02 | 2.23 | −0.60 | 1.01 | 1.74 | −2.63 | −0.05 | |
| Local | 0.18 | −0.03 | 0.26 | 1.67 | −0.41 | 0.52 | 0.36 | ||
| Oceanic | −0.14 | 0.08 | −0.91 | −0.18 | 0.09 | −0.74 | −0.30 | ||
| Indian Ocean | −0.14 | 0.07 | −0.89 | −0.16 | 0.04 | −0.61 | −0.28 | ||
| Pacific Ocean | 0.00 | 0.00 | −0.02 | −0.03 | 0.05 | −0.14 | −0.02 | ||
| MYRB | Terrestrial | −2.03 | −2.67 | −2.66 | 2.05 | −1.64 | −0.93 | −1.31 | |
| Local | −0.43 | −0.28 | 0.75 | 2.20 | 0.02 | 0.03 | 2.28 | ||
| Oceanic | −1.23 | −0.21 | −1.90 | −1.58 | 0.63 | −0.15 | −0.74 | ||
| Indian Ocean | −0.18 | 0.01 | −0.60 | −0.25 | −0.27 | −0.16 | −0.24 | ||
| Pacific Ocean | −1.05 | −0.22 | −1.31 | −1.34 | 0.90 | 0.01 | −0.50 | ||
© 2019 by the authors. Licensee MDPI, Basel, Switzerland. This article is an open access article distributed under the terms and conditions of the Creative Commons Attribution (CC BY) license (http://creativecommons.org/licenses/by/4.0/).
Share and Cite
MDPI and ACS Style
Xu, Y.; Gao, Y. Quantification of Evaporative Sources of Precipitation and Its Changes in the Southeastern Tibetan Plateau and Middle Yangtze River Basin. Atmosphere 2019, 10, 428. https://doi.org/10.3390/atmos10080428
AMA Style
Xu Y, Gao Y. Quantification of Evaporative Sources of Precipitation and Its Changes in the Southeastern Tibetan Plateau and Middle Yangtze River Basin. Atmosphere. 2019; 10(8):428. https://doi.org/10.3390/atmos10080428
Chicago/Turabian StyleXu, Yu, and Yanhong Gao. 2019. "Quantification of Evaporative Sources of Precipitation and Its Changes in the Southeastern Tibetan Plateau and Middle Yangtze River Basin" Atmosphere 10, no. 8: 428. https://doi.org/10.3390/atmos10080428
Note that from the first issue of 2016, this journal uses article numbers instead of page numbers. See further details here.