Spatial and Temporal Variations of Compound Droughts and Hot Extremes in China


Beijing Key Laboratory of Urban Hydrological Cycle and Sponge City Technology, College of Water Sciences, Beijing Normal University, Beijing 100875, China
*
Author to whom correspondence should be addressed.
Atmosphere 2019, 10(2), 95; https://doi.org/10.3390/atmos10020095
Submission received: 14 January 2019
/
Revised: 16 February 2019
/
Accepted: 18 February 2019
/
Published: 21 February 2019
(This article belongs to the Special Issue Weather and Climate Extremes: Current Developments)
Abstract
:Droughts and hot extremes may lead to tremendous impacts on the ecosystem and different sectors of the society. A variety of studies have been conducted on the variability of the individual drought or hot extreme in China. However, the evaluation of compound droughts and hot extremes, which may induce even larger impacts than the individual drought or hot extreme, is still lacking. The aim of this study is to investigate changes in the frequency and spatial extent of compound droughts and hot extremes during summer in China using monthly precipitation and daily temperature data from 1953 to 2012. Results show that a high frequency of compound droughts and hot extremes mostly occur in the regions stretching from northeast to southwest of China. There is an overall increase in the frequency of co-occurrence of droughts and hot extremes across most parts of China with distinct regional patterns. In addition, an increasing trend in the areas covered by compound extremes has been observed, especially after the 1990s. At regional scales, the increase of the frequency and spatial extent of compound extremes has been shown to be most profound in North China (NC), South China (SC), and Southwest China (SWC), while the decrease of compound extremes was found in Central China (CC). These results show the variability of compound droughts and hot extremes and could provide useful insights into the mitigation efforts of extreme events in China.
1. Introduction
The past several decades have witnessed large environmental and societal impacts induced by droughts and heatwave extremes globally, including human health, agriculture, ecosystem, and so on [1,2]. According to previous studies, the annual global economic loss caused by droughts is about US$6–8 billion [3], and heat waves have led to significant loss of life in many cities around the world (e.g., the European summer heat wave of 2003) [4]. Thus, it is of particular importance to improve our understanding of the variability of droughts and heat waves (or hot extremes) to reduce the potential impact to the society and ecosystem.
Droughts may occur in virtually all climate regimes around the globe. They can be grouped into four types including meteorological drought (deficiencies of precipitation), agricultural drought (lack of soil moisture affecting crop development or plant growth), hydrological drought (shortfall on water, such as decreased streamflow or low levels in lakes or reservoirs) and socioeconomic drought (impacts of drought on the supply and demand of certain economic goods) [3]. Due to their high frequency and tremendous damage, evaluations of drought variabilities have attracted increasing attentions in recent studies [1,2,5,6,7,8]. A multitude of studies have been devoted to the historical assessment of droughts based on different indices and showed the increased risk of droughts under global warming [5,9]. For example, the proportion of dry areas has increased by about 1.74% per decade over the period 1950–2008 across the globe [5]. Meanwhile, with global warming, the occurrence of heat related extremes has been shown to increase at both regional and global scales [10,11,12,13,14]. For instance, Meehl and Tebaldi [10] modeled the future occurrence of heat waves and presented a positive anomaly over North America and Europe. Seneviratne et al. [13] showed that hot temperature extremes were still on the rise globally based on the observational evidence and analysis. These studies highlighted that more severe droughts and more frequent hot extremes may occur in many regions of the world in the future.
As a joint occurrence of climate events, such as low precipitation and high temperature, may have more severe impacts on the environment and society [15,16] than the occurrence in isolation, an increase of studies has been conducted to analyze the combination of droughts and heatwaves [16,17,18,19,20]. For example, Hao et al. [17] investigated the simultaneous occurrence of dry and warm conditions and showed an obvious increase in the frequency in most regions over global land areas. Similarly, Sharma and Mujumdar [19] evaluated changes of the compound droughts and heat wave in India and showed a substantial increase in compound extremes. Under the global warming with potentially increased droughts and hot related extremes in the future, improved understanding of the variability of compound extremes has been highlighted [21].
In China, the occurrence of droughts or hot extreme events has been particularly pronounced for the past few decades. Examples of severe droughts include the 2006 drought in Sichuan and Chongqing, 2009–2010 drought in Southwestern and Northern China [22], and 2014 drought in Northern China [23]. For example, Liu et al. [24] detected spatiotemporal characteristics of dryness in Qinghai province of Northwest China and showed a dry tendency in most areas over the past decades. Yu et al. [25] estimated drought conditions over China and revealed a marked upward trend in most regions based on the Standardized Precipitation Evapotranspiration Index (SPEI). A multitude of hot extreme events also struck China in the past several decades, such as the 2003 heat wave in Shanghai [26] and 2005 heat wave in Guangzhou [27]. Ding et al. [28] explored the variation of both hot extremes and heat waves in China over the period 1961–2007 and showed a sharp increase in hot days and heatwaves in northwestern and eastern regions in the last decade. Sun et al. [29] examined summer hot extremes in Eastern China and presented an increase in the frequency. These droughts or hot extremes have led to enormous economic loss and negative impacts on human and natural systems [29,30]. For instance, the 2010 drought in Yunnan resulted in more than 20 billion RMB agricultural loss and the 1998 and 2003 heat waves in Shanghai led to hundreds of people’s deaths [30]. Apart from the frequent occurrence of droughts or hot extremes, recent decades also witnessed their concurrence. For instance, the drought in Sichuan and Chongqing provinces in 2006 was also accompanied by extreme hot conditions. The drought in Southern China in 2013 occurred with heatwaves simultaneously [31]. Despite extensive studies on the individual drought or heatwave in China, the evaluation of compound droughts and hot extremes is still lacking.
The objective of this study therefore is to investigate the spatiotemporal variability of compound droughts and hot extremes in China during the summer time (June, July, and August, JJA) over the period from 1953 to 2012. The monthly precipitation data were used to compute the drought indicator Standardized Precipitation Index (SPI). The hot extreme is defined as hot days based on a higher threshold (i.e., 90th percentile) of the daily maximum temperature. Results show a significant increase in the frequency and spatial extent of compound droughts and hot extremes in China with regional differences. These results could provide useful insights for mitigating negative effects of compound droughts and hot extremes in China.
2. Study Area and Data
The climate across China is complex and diverse due to its complicated topography and large latitude span. For the convenience, the study area in China was divided into seven regions [32,33]: Central China, Eastern China, Northern China, Northeast China, Northwest China, Southern China, and Southwest China (Figure 1). The gridded monthly precipitation data and daily maximum temperature data during the period 1953–2012 in China from the Institute of Geographical Sciences and Natural Resources Research (0.25°) were used in this study, which covered 756 Meteorological Administration stations across the whole China [34]. The commonly used SPI [35] was employed as the drought indicator to track meteorological drought. The Weibull plotting position formula [36] was used to estimate the empirical probability to compute the SPI. Here we calculated SPI for three- and six-month time scales (SPI3, SPI6). A meteorological drought event is defined based on SPI < −0.8 (and SPI < −0.5). Daily maximum temperature data were used to obtain the extreme temperature events (e.g., hot days) during the summer season [37]. In this study, the hot day is defined as the days with the maximum temperature higher than the 90th percentile of the daily maximum temperature during summer, which was computed using the daily maximum temperature data of JJA for the whole study period 1953–2012. The compound droughts and hot extremes are represented by the number of hot days (NHD) during the month with drought conditions. To show the uncertainty of results, we used different time scales (three-month and six-month) and thresholds (−0.8 and −0.5) of SPI.
3. Results and Discussion
3.1. Frequency of Compound Droughts and Hot Extremes
We first evaluated the frequency of compound droughts and hot extremes, which is defined as the NHD in the month with drought indicator (SPI3 and SPI6) lower than −0.8 during JJA for the period 1953–2012. As shown in Figure 2A,B, the occurrence frequency of compound droughts and hot extremes mostly resided in the strip from Northeast to Southwest China. The potential reason of this pattern is the land atmospheric interaction during the warm season. Specifically, dry conditions (e.g., precipitation deficits) may lead to less evaporative cooling and thus result in the increase of surface temperature during summer [38,39,40,41]. This is partly shown from the correlation between the NHD and SPI (Figure 2C,D). It can be seen that the negative correlation was particularly high in the regions from Northeast to Southwest China. This pattern of correlation between the drought and hot extreme in summer is consistent with the result of He et al. [42] and Zhang et al. [43]. The relatively high negative correlation in these regions partly explains the high probability of the co-occurrence of droughts (represented by SPI) and hot extremes (represented by NHD).
3.2. Changes in the Frequency of Compound Droughts and Hot Extremes
To assess changes in the frequency of compound droughts and hot extremes, the data were divided into two equal periods: 1953–1982 and 1983–2012. We then evaluated the changes based on the difference of NHD in drought months during 1983–2012 relative to the baseline period 1953–1982, which are displayed in Figure 3. Significant increase in compound droughts and hot extremes mainly occurred in Northern China, Southern China, and Southwest China, while a decrease of compound extremes was shown in Central China, parts of Northeast China (i.e., Most of Heilongjiang and South Jilin provinces), and some regions in Eastern China. This phenomenon may be partly dominated by regional variations in precipitation and/or temperature. For example, the increase in the frequency of compound droughts and hot extremes for Northern China (e.g., the whole Inner Mongolia) may be related to the decrease in precipitation and increase in temperature to some degree in parts of this regions [25,44]. Meanwhile, the decrease of compound extremes for Central China may be partly due to the increase in precipitation during summer in parts of this region [45] as well as the decrease in summer mean maximum temperature [46]. For example, it has been shown in previous studies that the cooling trend coexists with wetting trend in Central China (especially in the middle/lower reaches of the Yangtze River Valley) during summer, which may be linked to the warming trend in the sea surface temperature (SST) of the Indian Ocean that affects the interdecadal variability of the summer climate in China by changes in the Hadley circulation and subtropical high over the northwest Pacific [47,48,49]. Parts of Northeast China (i.e., Heilongjiang and Jilin province) also showed a decrease of compound extremes, which may partly result from the increase in precipitation (and the decrease in potential evaporation) and the cooling effect of agricultural irrigation [50,51] that affects the land atmospheric interaction. In general, Figure 3 shows increased compound droughts and hot extremes over most parts of China, highlighting the increased risk of extremes in these regions under global warming.
3.3. Changes in the Spatial Extent of Compound Droughts and Hot Extreme
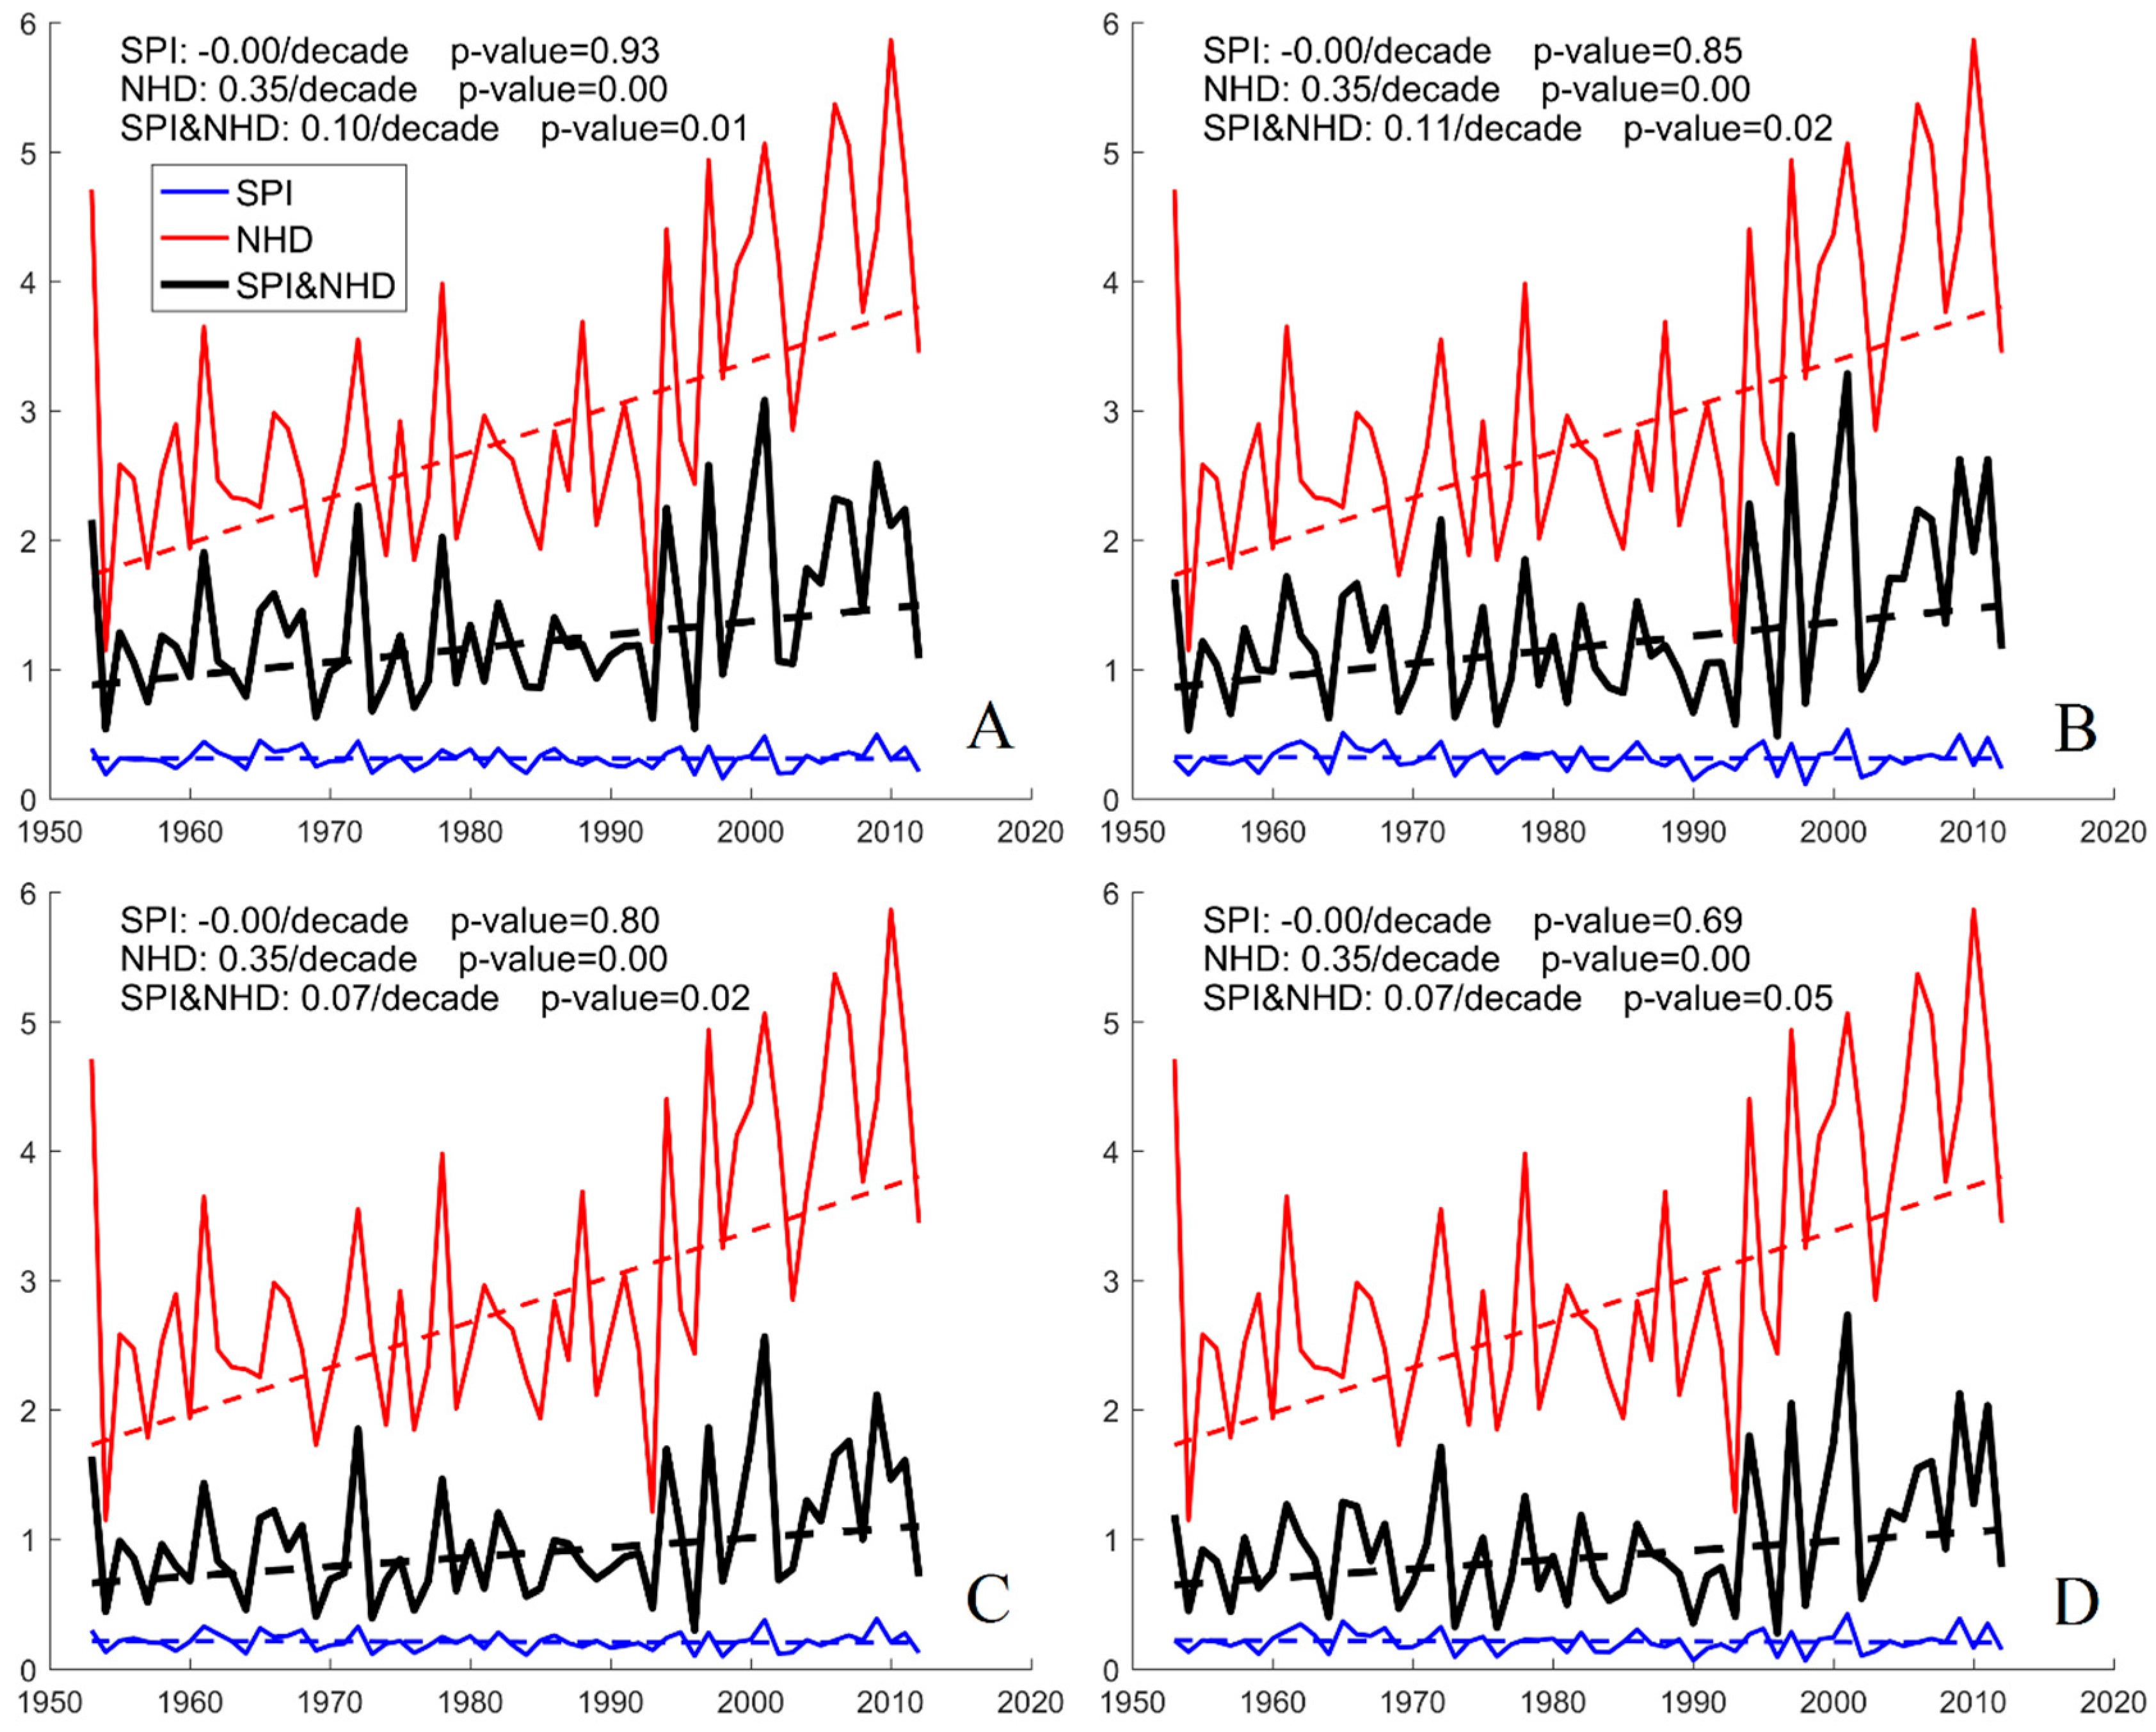
Changes in the annual spatial extent of compound droughts and hot extremes for the period from 1953 to 2012 were then investigated based on the number of grid points with the compound extremes during JJA of each year divided by the total number of grid points over China, as shown in Figure 4. The trend analysis of the spatial extent was conducted based on nonparametric Mann-Kendall test. The null hypothesis of no trend is rejected if the p-value is lower than 0.05 (at the significance level α = 0.05). The p-value and the slope value of trend test results are also presented in Figure 4.
A significant increase in the spatial extent of compound droughts and hot extremes during summer was observed with the slope ranging from 0.07 to 0.11 per decade in China. After the 1990s, a relatively steep upward trend in the spatial extent was shown, indicating a possible change point in the spatial extent of compound droughts and hot extremes during the 1990s. This is partly consistent with previous studies based on individual extremes [25,28,52], which showed drought areas increased more rapidly after the 1990s [25], and the number of hot days (or temperature) increased in most regions since the 1990s [28,52,53]. In terms of individual extremes, a significantly increased trend in the spatial extent was shown for NHD (at the 0.05 significance level), while non-significant trend in the spatial extent of SPI was observed. The positive trend of NHD is consistent with the result of Ding et al. [28] for the increase in hot days in most of China during recent several decades. Meanwhile, the finding of the non-significant trend of the spatial extent of drought is also consistent with previous studies [54,55]. These patterns indicate that the increase in the spatial extent of compound droughts and hot extremes may be due to the significant increase in NHD. Generally, similar patterns were shown for different time scales and thresholds of SPI for all the scenarios. The high consistency between SPI3 and SPI6 and the thresholds of −0.8 and −0.5 indicates the robustness of the results.
3.4. Regional Variability of the Frequency and Spatial Extent
We further assessed changes in the frequency of compound droughts and hot extremes in the seven regions (CC, EC, NC, NEC, NWC, SC and SWC) of China for the two periods 1953–1982 and 1983–2012, as shown in Figure 5. The frequency of compound droughts and hot extremes showed a decrease in Central China while that of Northern China, Southern China, and Southwest China presented an increase for both SPI3 and SPI6 (with both thresholds of −0.5 and −0.8 to define the drought). According to previous studies, droughts have become more frequent in Southwest China [56], and dry conditions as well as the frequency of heat wave in Northern China increased during the past several decades [25,43], which are in general agreement with the increased compound extremes in these regions. For other regions, the change in the frequency of compound droughts and hot extremes may not be consistent (or differ substantially). For example, an increased frequency of compound extremes was shown in Northeast China for SPI3 while a slightly decreased frequency was shown in this region based on SPI6.
In addition, changes in the spatial extent of compound droughts and hot extremes for the seven regions during 1953–2012 were also assessed and shown in Table 1. Generally, there was an increase in the spatial extent in most regions across China (except for Central China for SPI3 and Northwest China for SPI3 < −0.8). Changes of areas affected by compound droughts and hot extremes in Northern China were significant for the two thresholds based on both SPI3 and SPI6. In addition, a significant trend in the spatial extent was also shown in Southwest China for SPI3. For the other regions, changes of the spatial extent were not significant.
4. Conclusions
We investigated changes in the frequency and spatial extent of compound droughts and hot extremes during summer over the period 1953–2012 in China. The high frequency of the occurrence of compound droughts and hot extremes mostly occurred in the regions stretching from Northeast to Southwest China, which is mainly due to the land surface interaction during the summer season in these regions. An increase in the frequency of compound extremes was found in most regions of China. In addition, areas affected by compound extremes showed an increasing trend at a rate ranging from 0.07 to 0.11 per decade. Noticeably, regional discrepancies were also observed in the variability of the frequency and spatial extent of compound extremes. An increase (decrease) in the frequency and spatial extent was mainly shown in North China, South China, and Southwest China (Central China). In summary, our results showed that there was an obvious increase in the frequency and spatial extent of compound droughts and hot extremes during summer from 1953 to 2012 in large areas across China (except for Central China). Results from this study could provide useful insights for mitigation efforts of extremes under global warming.
In this study, the 3-month SPI may reflect moisture conditions during reproductive and early grainfilling stages for certain crops (related to agricultural impacts) while the 6-month SPI may be associated with anomalous streamflows and reservoir levels (related to hydrological impacts) [57,58]. The potential limitation of this study is that we only used the SPI as the drought indicator, which is based only on precipitation. However, droughts are likely triggered by multiple factors, such as evapotranspiration or temperature. Therefore, multiple variables should be taken into consideration in the variability assessment of compound droughts and hot extremes. With the global warming, increased heat records have been shown to increase in different regions of China. This study further emphasized the increased risk of compound droughts and hot extremes posed by the global warming, which may result from a variety of factors, including the climate variability, or the trend in precipitation or temperature. The cause of changes in the compound extremes needs more efforts and will be explored further in the future. Note that variations of the compound extreme were assessed based on the period from 1953 to 2012 and the result may vary with different periods for the analysis. For example, though no significant trend of spatial extent of droughts was found for the period 1953–2012, certain studies have shown significant increase in the spatial extent of droughts (depending on the indicator and severity level) [8,59]. Due to the even large impacts of compound extremes, more efforts are needed in assessing the physical mechanism of the occurrence and variability of compound droughts and hot extremes, which will be assessed in our future study.
Author Contributions
Z.H. and X.W. designed the research presented in this paper and wrote the original draft; Z.H., X.W., F.H., C.L., and X.Z. revised the paper.
Funding
This research was supported by National Natural Science Foundation of China (grant number 41601014) and the 111 Project (B18006).
Acknowledgments
The IGSNRR data used in this study are available at http://hydro.igsnrr.ac.cn. Finally, we thank the editors, anonymous reviewers, and all of the study participants who have taken time to provide the information analyzed in this study.
Conflicts of Interest
The authors declare no conflict of interest.
References
- Lesk, C.; Rowhani, P.; Ramankutty, N. Influence of extreme weather disasters on global crop production. Nature 2016, 529, 84–87. [Google Scholar] [CrossRef] [PubMed]
- Frank, D.; Reichstein, M.; Bahn, M.; Thonicke, K.; Frank, D.; Mahecha, M.D.; Smith, P.; van der Velde, M.; Vicca, S.; Babst, F.; et al. Effects of climate extremes on the terrestrial carbon cycle: Concepts, processes and potential future impacts. Glob. Chang. Biol. 2015, 21, 2861–2880. [Google Scholar] [CrossRef] [PubMed]
- Wilhite, D.A. Drought as a natural hazard: Concepts and definitions. In Drought: A Global Assessment, 1st ed.; Wilhite, D.A., Ed.; Routledge: New York, NY, USA, 2000; pp. 3–18. [Google Scholar]
- Guo, Y.M.; Gasparrini, A.; Armstrong, B.; Li, S.S.; Tawatsupa, B.; Tobias, A.; Lavigne, E.; de Sousa Zanotti Stagliorio Coelho, M.; Leone, M.; Pan, X.C.; et al. Global variation in the effects of ambient temperature on mortality: A systematic evaluation. Epidemiology 2014, 25, 781–789. [Google Scholar] [CrossRef] [PubMed]
- Dai, A. Characteristics and trends in various forms of the Palmer Drought Severity Index during 1900–2008. J. Geophys. Res. 2011, 116, D12115. [Google Scholar] [CrossRef]
- Sheffield, J.; Wood, E.F.; Roderick, M.L. Little change in global drought over the past 60 years. Nature 2012, 491, 435–438. [Google Scholar] [CrossRef] [PubMed]
- Chen, H.P.; Sun, J.Q. Changes in drought characteristics over China using the Standardized Precipitation Evapotranspiration Index. J. Clim. 2015, 28, 5430–5447. [Google Scholar] [CrossRef]
- Shao, D.G.; Chen, S.; Tan, X.Z.; Gu, W.Q. Drought characteristics over China during 1980–2015. Int. J. Climatol. 2018, 38, 3532–3545. [Google Scholar] [CrossRef]
- Vicente-Serrano, S.M.; Beguería, S.; López-Moreno, J.I. A multiscalar drought index sensitive to global warming: The Standardized Precipitation Evapotranspiration Index. J. Clim. 2010, 23, 1696–1718. [Google Scholar] [CrossRef]
- Meehl, G.A.; Tebaldi, C. More intense, more frequent, and longer lasting heat waves in the 21st century. Science 2004, 305, 994–997. [Google Scholar] [CrossRef] [PubMed]
- Alexander, L.V.; Zhang, X.; Peterson, T.C.; Caesar, J.; Gleason, B.; Tank, A.; Haylock, M.; Collins, D.; Trewin, B.; Rahimzadeh, F.; et al. Global observed changes in daily climate extremes of temperature and precipitation. J. Geophys. Res. 2006, 111, D05109. [Google Scholar] [CrossRef]
- Perkins, S.E.; Alexander, L.V.; Nairn, J.R. Increasing frequency, intensity and duration of observed global heatwaves and warm spells. Geophys. Res. Lett. 2012, 39, L20714. [Google Scholar] [CrossRef]
- Seneviratne, S.I.; Donat, M.G.; Mueller, B.; Alexander, L.V. No pause in the increase of hot temperature extremes. Nat. Clim. Chang. 2014, 4, 161–163. [Google Scholar] [CrossRef]
- Leng, G.Y.; Tang, Q.H.; Huang, S.Z.; Zhang, X.J. Extreme hot summers in China in the CMIP5 climate models. Clim. Chang. 2016, 135, 669–681. [Google Scholar] [CrossRef]
- Ciais, P.; Reichstein, M.; Viovy, N.; Granier, A.; Ogee, J.; Allard, V.; Aubinet, M.; Buchmann, N.; Bernhofer, C.; Carrara, A.; et al. Europe-wide reduction in primary productivity caused by the heat and drought in 2003. Nature 2005, 437, 529–533. [Google Scholar] [CrossRef] [PubMed]
- Leonard, M.; Westra, S.; Phatak, A.; Lambert, M.; van den Hurk, B.; McInnes, K.; Risbey, J.; Schuster, S.; Jakob, D.; Stafford-Smith, M. A compound event framework for understanding extreme impacts. Wiley Interdiscip. Rev. Clim. Chang. 2014, 5, 113–128. [Google Scholar] [CrossRef]
- Hao, Z.C.; AghaKouchak, A.; Phillips, T.J. Changes in concurrent monthly precipitation and temperature extremes. Environ. Res. Lett. 2013, 8, 034014. [Google Scholar] [CrossRef] [Green Version]
- Mazdiyasni, O.; AghaKouchak, A. Substantial increase in concurrent droughts and heatwaves in the United States. Proc. Natl. Acad. Sci. USA 2015, 112, 11484–11489. [Google Scholar] [CrossRef] [PubMed]
- Sharma, S.; Mujumdar, P. Increasing frequency and spatial extent of concurrent meteorological droughts and heatwaves in India. Sci. Rep. 2017, 7, 15582. [Google Scholar] [CrossRef] [PubMed] [Green Version]
- Zscheischler, J.; Seneviratne, S.I. Dependence of drivers affects risks associated with compound events. Sci. Adv. 2017, 3, e1700263. [Google Scholar] [CrossRef]
- Zscheischler, J.; Westra, S.; van den Hurk, B.J.J.M.; Seneviratne, S.I.; Ward, P.J.; Pitman, A.; AghaKouchak, A.; Bresch, D.N.; Leonard, M.; Wahl, T.; et al. Future climate risk from compound events. Nat. Clim. Chang. 2018, 8, 469–477. [Google Scholar] [CrossRef]
- Barriopedro, D.; Gouveia, C.M.; Trigo, R.M.; Wang, L. The 2009/10 drought in China: Possible causes and impacts on vegetation. J. Hydrometeorol. 2012, 13, 1251–1267. [Google Scholar] [CrossRef]
- Wang, H.J.; He, S.P. The North China/Northeastern Asia severe summer drought in 2014. J. Clim. 2015, 28, 6667–6681. [Google Scholar] [CrossRef]
- Liu, Z.Y.; Zhou, P.; Zhang, F.Q.; Liu, X.D.; Chen, G. Spatiotemporal characteristics of dryness/wetness conditions across Qinghai Province, Northwest China. Agric. For. Meteorol. 2013, 182, 101–108. [Google Scholar] [CrossRef]
- Yu, M.X.; Li, Q.F.; Hayes, M.J.; Svoboda, M.D.; Heim, R.R. Are droughts becoming more frequent or severe in China based on the Standardized Precipitation Evapotranspiration Index: 1951–2010? Int. J. Climatol. 2014, 34, 545–558. [Google Scholar] [CrossRef]
- Huang, W.; Kan, H.D.; Kovats, S. The impact of the 2003 heat wave on mortality in Shanghai, China. Sci. Total Environ. 2010, 408, 2418–2420. [Google Scholar] [CrossRef] [PubMed]
- Yang, J.; Liu, H.Z.; Ou, C.Q.; Lin, G.Z.; Ding, Y.; Zhou, Q.; Shen, J.C.; Chen, P.Y. Impact of heat wave in 2005 on mortality in Guangzhou, China. Biomed. Environ. Sci. 2013, 26, 647–654. [Google Scholar] [CrossRef] [PubMed]
- Ding, T.; Qian, W.H.; Yan, Z.W. Changes in hot days and heat waves in China during 1961–2007. Int. J. Climatol. 2010, 30, 1452–1462. [Google Scholar] [CrossRef]
- Sun, Y.; Zhang, X.B.; Zwiers, F.W.; Song, L.C.; Wan, H.; Hu, T.; Yin, H.; Ren, G.Y. Rapid increase in the risk of extreme summer heat in Eastern China. Nat. Clim. Chang. 2014, 4, 1082–1085. [Google Scholar] [CrossRef]
- Tan, J.G.; Zheng, Y.F.; Song, G.X.; Kalkstein, L.S.; Kalkstein, A.J.; Tang, X. Heat wave impacts on mortality in Shanghai, 1998 and 2003. Int. J. Biometeorol. 2007, 51, 193–200. [Google Scholar] [CrossRef] [PubMed]
- Yuan, W.P.; Cai, W.W.; Chen, Y.; Liu, S.G.; Dong, W.J.; Zhang, H.C.; Yu, G.R.; Chen, Z.Q.; He, H.L.; Guo, W.D.; et al. Severe summer heatwave and drought strongly reduced carbon uptake in Southern China. Sci. Rep. 2016, 6, 18813. [Google Scholar] [CrossRef] [PubMed] [Green Version]
- Qiu, X.H.; Duan, L.; Chai, F.H.; Wang, S.X.; Yu, Q.; Wang, S.L. Deriving high-resolution emission inventory of open biomass burning in China based on satellite observations. Environ. Sci. Technol. 2016, 50, 11779–11786. [Google Scholar] [CrossRef] [PubMed]
- Zhuang, Y.; Li, R.Y.; Yang, H.; Chen, D.L.; Chen, Z.Y.; Gao, B.B.; He, B. Understanding temporal and spatial distribution of crop residue burning in China from 2003 to 2017 using MODIS data. Remote Sens. 2018, 10, 390. [Google Scholar] [CrossRef]
- Zhang, X.J.; Tang, Q.H.; Pan, M.; Tang, Y. A long-term land surface hydrologic fluxes and states dataset for China. J. Hydrometeorol. 2014, 15, 2067–2084. [Google Scholar] [CrossRef]
- McKee, T.B.; Doesken, N.J.; Kleist, J. The Relationship of Drought Frequency and Duration to Time Scales. In Proceedings of the Eighth Conference on Applied Climatology, Anaheim, CA, USA, 17–22 January 1993; pp. 179–184. [Google Scholar]
- Stagge, J.H.; Tallaksen, L.M.; Gudmundsson, L.; Van Loon, A.F.; Stahl, K. Candidate distributions for climatological drought indices (SPI and SPEI). Int. J. Climatol. 2015, 35, 4027–4040. [Google Scholar] [CrossRef]
- Mueller, B.; Seneviratne, S.I. Hot days induced by precipitation deficits at the global scale. Proc. Natl. Acad. Sci. USA 2012, 109, 12398–12403. [Google Scholar] [CrossRef] [PubMed] [Green Version]
- Hao, Z.C.; Hao, F.H.; Singh, V.P.; Ouyang, W. Quantitative risk assessment of the effects of drought on extreme temperature in eastern China. J. Geophys. Res. D Atmos. 2017, 122, 9050–9059. [Google Scholar] [CrossRef]
- Seneviratne, S.I.; Corti, T.; Davin, E.L.; Hirschi, M.; Jaeger, E.B.; Lehner, I.; Orlowsky, B.; Teuling, A.J. Investigating soil moisture–climate interactions in a changing climate: A review. Earth Sci. Rev. 2010, 99, 125–161. [Google Scholar] [CrossRef]
- Zhang, Q.; Xiao, M.Z.; Singh, V.P.; Liu, L.; Xu, C.Y. Observational evidence of summer precipitation deficit-temperature coupling in China. J. Geophys. Res. D Atmos. 2015, 120, 10040–10049. [Google Scholar] [CrossRef]
- Zhang, J.Y.; Wu, L.Y. Land-atmosphere coupling amplifies hot extremes over China. Chin. Sci. Bull. 2011, 56, 3328–3332. [Google Scholar] [CrossRef] [Green Version]
- He, B.; Wang, H.L.; Wang, Q.F.; Di, Z.H. A quantitative assessment of the relationship between precipitation deficits and air temperature variations. J. Geophys. Res. D Atmos. 2015, 120, 5951–5961. [Google Scholar] [CrossRef] [Green Version]
- Zhang, J.; Liu, Z.Y.; Chen, L. Reduced soil moisture contributes to more intense and more frequent heat waves in northern China. Adv. Atmos. Sci. 2015, 32, 1197–1207. [Google Scholar] [CrossRef]
- Ma, Z.G.; Fu, C.B. Some evidence of drying trend over northern China from 1951 to 2004. Chin. Sci. Bull. 2006, 51, 2913–2925. [Google Scholar] [CrossRef]
- Liu, B.H.; Xu, M.; Henderson, M.; Qi, Y. Observed trends of precipitation amount, frequency, and intensity in China, 1960–2000. J. Geophys. Res. D Atmos. 2005, 110, D08103. [Google Scholar] [CrossRef]
- Zhai, P.M.; Sun, A.J.; Ren, F.M.; Liu, X.N.; Gao, B.; Zhang, Q. Changes of climate extremes in China. Clim. Chang. 1999, 42, 203–218. [Google Scholar] [CrossRef]
- Hu, Z.Z.; Yang, S.; Wu, R.G. Long-term climate variations in China and global warming signals. J. Geophys. Res. 2003, 108, 4614. [Google Scholar] [CrossRef]
- Zhai, P.M.; Zhang, X.B.; Wan, H.; Pan, X.H. Trends in total precipitation and frequency of daily precipitation extremes over China. J. Clim. 2005, 18, 1096–1108. [Google Scholar] [CrossRef]
- Sun, J.; Zhang, F.Q. Daily extreme precipitation and trends over China. Sci. China Earth Sci. 2017, 60, 2190–2203. [Google Scholar] [CrossRef]
- Zhu, X.F.; Liang, S.L.; Pan, Y.Z. Observational evidence of the cooling effect of agricultural irrigation in Jilin, China. Clim. Chang. 2012, 114, 799–811. [Google Scholar] [CrossRef]
- Zhao, N.N.; Han, S.J.; Xu, D.; Wang, J.D.; Yu, H.J. Cooling and wetting effects of agricultural development on near-surface atmosphere over Northeast China. Adv. Meteorol. 2016, 6439276. [Google Scholar] [CrossRef]
- Wang, H.J.; Sun, J.Q.; Chen, H.P.; Zhu, Y.L.; Zhang, Y.; Jiang, D.B.; Lang, X.M.; Fan, K.; Yu, E.T.; Yang, S. Extreme climate in China: Facts, simulation and projection. Meteorol. Z. 2012, 21, 279–304. [Google Scholar] [CrossRef]
- Qi, L.; Wang, Y.Q. Changes in the observed trends in extreme temperatures over China around 1990. J. Clim. 2012, 25, 5208–5222. [Google Scholar] [CrossRef]
- Zou, X.K.; Zhai, P.M.; Zhang, Q. Variations in droughts over China: 1951–2003. Geophys. Res. Lett. 2005, 32, L04707. [Google Scholar] [CrossRef]
- Zhang, D.; Feng, G. The relationship between spatial extent and duration of severe droughts in china over the last 50 years. In Proceedings of the 2010 Second IITA International Conference on Geoscience and Remote Sensing, Qingdao, China, 28–31 August 2010; pp. 345–348. [Google Scholar]
- Wang, L.; Chen, W.; Zhou, W.; Huang, G. Drought in Southwest China: A Review. Atmos. Ocean. Sci. Lett. 2015, 8, 339–344. [Google Scholar] [CrossRef]
- Stojanovic, M.; Drumond, A.; Nieto, R.; Gimeno, L. Moisture transport anomalies over the Danube river basin during two drought events: A lagrangian analysis. Atmosphere 2017, 8, 193. [Google Scholar] [CrossRef]
- World Meteorological Organization. Standardized Precipitation Index User Guide. 2012. Available online: http://www.wamis.org/agm/pubs/SPI/WMO_1090_EN.pdf (accessed on 15 February 2019).
- Zhang, L.; Xiao, J.F.; Zhou, Y.; Zheng, Y.; Li, J.; Xiao, H. Drought events and their effects on vegetation productivity in China. Ecosphere 2016, 7, e01591. [Google Scholar] [CrossRef] [Green Version]
Figure 1.
The study area of seven regions in China.

Figure 2.
The frequency (days) of compound droughts (SPI) and hot extremes (NHD) based on the threshold SPI < −0.8 ((A): SPI3, (B): SPI6) and the correlation between SPI and NHD (C): SPI3, (D): SPI6) over the period 1953–2012 in China.
Figure 2.
The frequency (days) of compound droughts (SPI) and hot extremes (NHD) based on the threshold SPI < −0.8 ((A): SPI3, (B): SPI6) and the correlation between SPI and NHD (C): SPI3, (D): SPI6) over the period 1953–2012 in China.

Figure 3.
Changes in the frequency (days) of compound droughts and hot extremes for the period 1983–2012 relative to 1953–1982 based on SPI3 and SPI6 using two thresholds −0.5 and −0.8. (A): SPI3 < −0.5, (B): SPI6 < −0.5, (C): SPI3 < −0.8, (D): SPI6 < −0.8.
Figure 3.
Changes in the frequency (days) of compound droughts and hot extremes for the period 1983–2012 relative to 1953–1982 based on SPI3 and SPI6 using two thresholds −0.5 and −0.8. (A): SPI3 < −0.5, (B): SPI6 < −0.5, (C): SPI3 < −0.8, (D): SPI6 < −0.8.

Figure 4.
Changes in the spatial extent of drought (SPI), hot extreme (NHD) and compound droughts and hot extremes (SPI&NHD) during 1953–2012 in China based on different time scales and thresholds of SPI. (A): SPI3 < −0.5; (B): SPI6 < −0.5; (C): SPI3 < −0.8; (D): SPI6 < −0.8.
Figure 4.
Changes in the spatial extent of drought (SPI), hot extreme (NHD) and compound droughts and hot extremes (SPI&NHD) during 1953–2012 in China based on different time scales and thresholds of SPI. (A): SPI3 < −0.5; (B): SPI6 < −0.5; (C): SPI3 < −0.8; (D): SPI6 < −0.8.

Figure 5.
Changes in the frequency (days) of compound droughts and hot extremes for the two periods 1983–2012 and 1953–1982 for different regions in China. (A): SPI3 < −0.5; (B): SPI6 < −0.5; (C): SPI3 < −0.8; (D): SPI6 < −0.8.
Figure 5.
Changes in the frequency (days) of compound droughts and hot extremes for the two periods 1983–2012 and 1953–1982 for different regions in China. (A): SPI3 < −0.5; (B): SPI6 < −0.5; (C): SPI3 < −0.8; (D): SPI6 < −0.8.


Table 1.
Trend tests of the spatial extent of compound droughts and hot extremes for different regions in China (at the 0.05 significance level) during 1953–2012.
Table 1.
Trend tests of the spatial extent of compound droughts and hot extremes for different regions in China (at the 0.05 significance level) during 1953–2012.
| Regions | Rate of Changes in Areas Affected by Compound Extremes (Per Decade) | |||
|---|---|---|---|---|
| SPI3 < −0.5 | SPI3 < −0.8 | SPI6 < −0.5 | SPI6 < −0.8 | |
| CC | −0.01 | −0.01 | 0.06 | 0.04 |
| EC | 0.04 | 0.02 | 0.08 | 0.06 |
| NC | 0.21 * | 0.15 * | 0.20 * | 0.14 * |
| NEC | 0.05 | 0.04 | 0.05 | 0.04 |
| NWC | 0.02 | −0.01 | 0.04 | 0.01 |
| SC | 0.04 | 0.02 | 0.07 | 0.05 |
| SWC | 0.20 * | 0.13 * | 0.14 | 0.08 |
*: The star indicates statistically significant changes at the 0.05 significance level.
© 2019 by the authors. Licensee MDPI, Basel, Switzerland. This article is an open access article distributed under the terms and conditions of the Creative Commons Attribution (CC BY) license (http://creativecommons.org/licenses/by/4.0/).
Share and Cite
MDPI and ACS Style
Wu, X.; Hao, Z.; Hao, F.; Li, C.; Zhang, X. Spatial and Temporal Variations of Compound Droughts and Hot Extremes in China. Atmosphere 2019, 10, 95. https://doi.org/10.3390/atmos10020095
AMA Style
Wu X, Hao Z, Hao F, Li C, Zhang X. Spatial and Temporal Variations of Compound Droughts and Hot Extremes in China. Atmosphere. 2019; 10(2):95. https://doi.org/10.3390/atmos10020095
Chicago/Turabian StyleWu, Xinying, Zengchao Hao, Fanghua Hao, Chong Li, and Xuan Zhang. 2019. "Spatial and Temporal Variations of Compound Droughts and Hot Extremes in China" Atmosphere 10, no. 2: 95. https://doi.org/10.3390/atmos10020095
Note that from the first issue of 2016, this journal uses article numbers instead of page numbers. See further details here.