Extreme Weather Impacts on Inland Waterways Transport of Yangtze River


1
Intelligent Transportation Systems Research Center, Wuhan University of Technology, Wuhan 430070, China
2
School of Navigation, Wuhan University of Technology, Wuhan 430070, China
3
National Engineering Research Center for Water Transport Safety, Wuhan University of Technology, Wuhan 430070, China
4
Hubei Key Laboratory of Mineral Resources Processing and Environment, Wuhan University of Technology, Wuhan 430070, China
5
School of Resources and Environmental Engineering, Wuhan University of Technology, Wuhan 430070, China
*
Author to whom correspondence should be addressed.
Atmosphere 2019, 10(3), 133; https://doi.org/10.3390/atmos10030133
Submission received: 15 January 2019
/
Revised: 1 March 2019
/
Accepted: 8 March 2019
/
Published: 12 March 2019
(This article belongs to the Special Issue Weather and Climate Extremes: Current Developments)
Abstract
:The impact of extreme weather events on the navigation environment in the inland waterways of the Yangtze River is an interdisciplinary hotspot in subjects of maritime traffic safety and maritime meteorology, and it is also a difficult point for the implementation of decision-making and management by maritime and meteorological departments in China. The objective of this study is to review the variation trends and distribution patterns in the periods of adverse and extreme weather events that are expected to impact on inland waterways transport (IWT) on the Yangtze River. The frequency of severe weather events, together with the changes in their spatial extension and intensity, is analyzed based on the ERA-Interim datasets (1979–2017) and the GHCNDEX dataset (1979–2017), as well as the research progresses and important events (2004–2016) affecting the navigation environment. The impacts of extreme weather events on IWT accidents and phenomena of extreme weather (e.g., thunderstorms, lightning, hail, and tornadoes) that affect the navigation environment are also analyzed and discussed. The results show that: (1) the sections located in the plain climate zone is affected by extreme weather in every season, especially strong winds and heat waves; (2) the sections located in the hilly mountain climate zone is affected particularly by spring extreme phenomena, especially heat waves; (3) the sections located in the Sichuan Basin climate zone is dominated by the extreme weather phenomena in autumn, except cold waves; (4) the occurrence frequency of potential flood risk events is relatively high under rainstorm conditions and wind gusts almost affect the navigation environment of the Jiangsu and Shanghai sections in every year; (5) the heat wave indices (TXx, TR, and WSDI) tend to increase and the temperature of the coldest day of the year gradually increases; (6) the high occurrences of IWT accidents need to be emphasized by relevant departments, caused by extreme weather during the dry season; and (7) the trends and the degree of attention of extreme weather events affecting IWT are ranked as: heat wave > heavy rainfall > wind gust > cold spell > storm. Understanding the seasonal and annual frequency of occurrence of extreme weather events has reference significance for regional management of the Yangtze River.
1. Introduction
The Yangtze River passes through five spectacular canyons and nine provinces, the inland waterway is divided into upper- middle-, and lower reaches [1]. Upper reaches start in Yibin City with many tributaries and large gaps flowing from the north to the south through the Sichuan basin, and has an average annual runoff of 451 billion cubic meters, which is about half of the Yangtze River [2]. After reaching the large city of Chongqing, at 630 feet above sea level, it passes through the very large Changjiang plain, and can sail large ships, which is in the middle-lower reaches of the Yangtze River [3]. The inland waterway transport (IWT) system plays an important role in China’s transportation system, which links the prospering coastal regions with the less-developed inland. A previous study showed that about 55% of the total freight volume on China’s IWT is along the Yangtze, which saw cargo traffic rise to 1.855 billion tons in 2013, and cargo turnover up to 704.4 billion tons per kilometer via inland waters of the Yangtze River [4].
IWT has experienced the significant impact of complex weather events over the past few decades, affecting infrastructure of inland waterways and the navigable environment [5]. From 1880 to 2012, global warming caused rapid global land and ocean surface temperatures to rise by 0.85 °C, and more frequent extreme weather events (e.g., heavy rainfalls, droughts, and extreme hot/cold temperatures), and extreme weather has led to natural disasters that endanger human life and destroy the human living environment [6]. The Yangtze River’s navigable length is 2838 km, which consists entirely of high-grade waterways [7]. The navigable conditions of the Yangtze River were comparatively rough during the dry seasons, Extreme dry weather can reduce runoff and water level, causing limited ship carrying capacity and sailing time, and long-term low temperatures can cause icing on the waterways, triggering stoppages and infrastructure damage [8]. In the Yangtze valley, the heavy rainfall period from mid-June to mid-July, called “Meiyu” or “plum rain”, occurs when the stationary front has arrived [9]. Heavy rains in the Meiyu period usually lead to flooding and shipping disruption, but also to disruptions in human lives and properties [10]. A very large number of extreme weather impact studies at the YRIW level have been conducted, mostly for individual weather hazards, such as heat waves [11,12], river floods [13,14], streamflow droughts [15,16], and storms [17].
Extreme weather events continue to increase, and various ship accidents are associated with these extreme weather events. For every 1% increase in the incidence of extreme weather events, a direct economic loss will occur with approximately $487,000 USD [18]. In 2010, floods in the YRIW caused direct economic losses of $14.4 billion USD [19]. The impact of extreme weather events on the mainline traffic started to attract public attention in recent years [20]. For example, there was a gale event in the lower Yangtze River, with a maximum wind speed 32 m/s, causing 10 ships to sink and 34 people to drown in June 2009. Limited visibility due to dense fog in the Chang Wang Chau waterway caused a collision of three ships in July 2010, with a loss of $178,000 USD. In June 2015, a tornado blow in the Jianli section of YRIW with more than 12 levels of the most powerful wind, causing the “Oriental Star” passenger ship to sink and 442 people to die [21]. According to the literature searching in the largest dataset of China’s national knowledge infrastructure, 133 publications focused on the “Oriental Star” incident by the end of March 2016, indicating that extreme weather events affecting the public on the IWT have attracted unprecedented attention from the Chinese government, public, and media.
Studying extreme weather in the IWT is a major challenge because existing weather hazards are not consistently comparable due to differences in their processes and descriptive indicators, which are addressed through standardized methods such as indicator formulation and intensity classification [22]. However, such studies only describe limited weather hazards, and the methods that make different disasters comparable are highly heterogeneous. Furthermore, investigations of multiple data types are needed before the spatial-temporal results can be credibly integrated into wholesale management systems of the mainline navigation environment. This study focuses on the above challenges. This research is also part of the National Weather Service and the Yangtze River Administration of National Affairs’ Meteorological Security Service for the Yangtze River Navigation project, which aims to assess the impact of extreme weather on the YRIW system.
The objective of this study is to review the variation trends and distribution patterns in the periods of adverse and extreme weather events that are expected to impact on IWT in the Yangtze River. First, the definition and classification of extreme weather events are carried out by assessing the risk impact of extreme weather events on different regions and infrastructure, such as droughts, heavy precipitation, heat waves, cold spells, and wind gusts, as well as complex phenomenon (e.g., storm surges). Then, trends of all the weather phenomena and the frequency of extreme events were analyzed through new observed extremes data for the recent climatic phase (1979–2017), reflecting the possible relationships between large-scale patterns in extreme events over the inland waterway on the Yangtze River.
2. Methods
2.1. Study Area
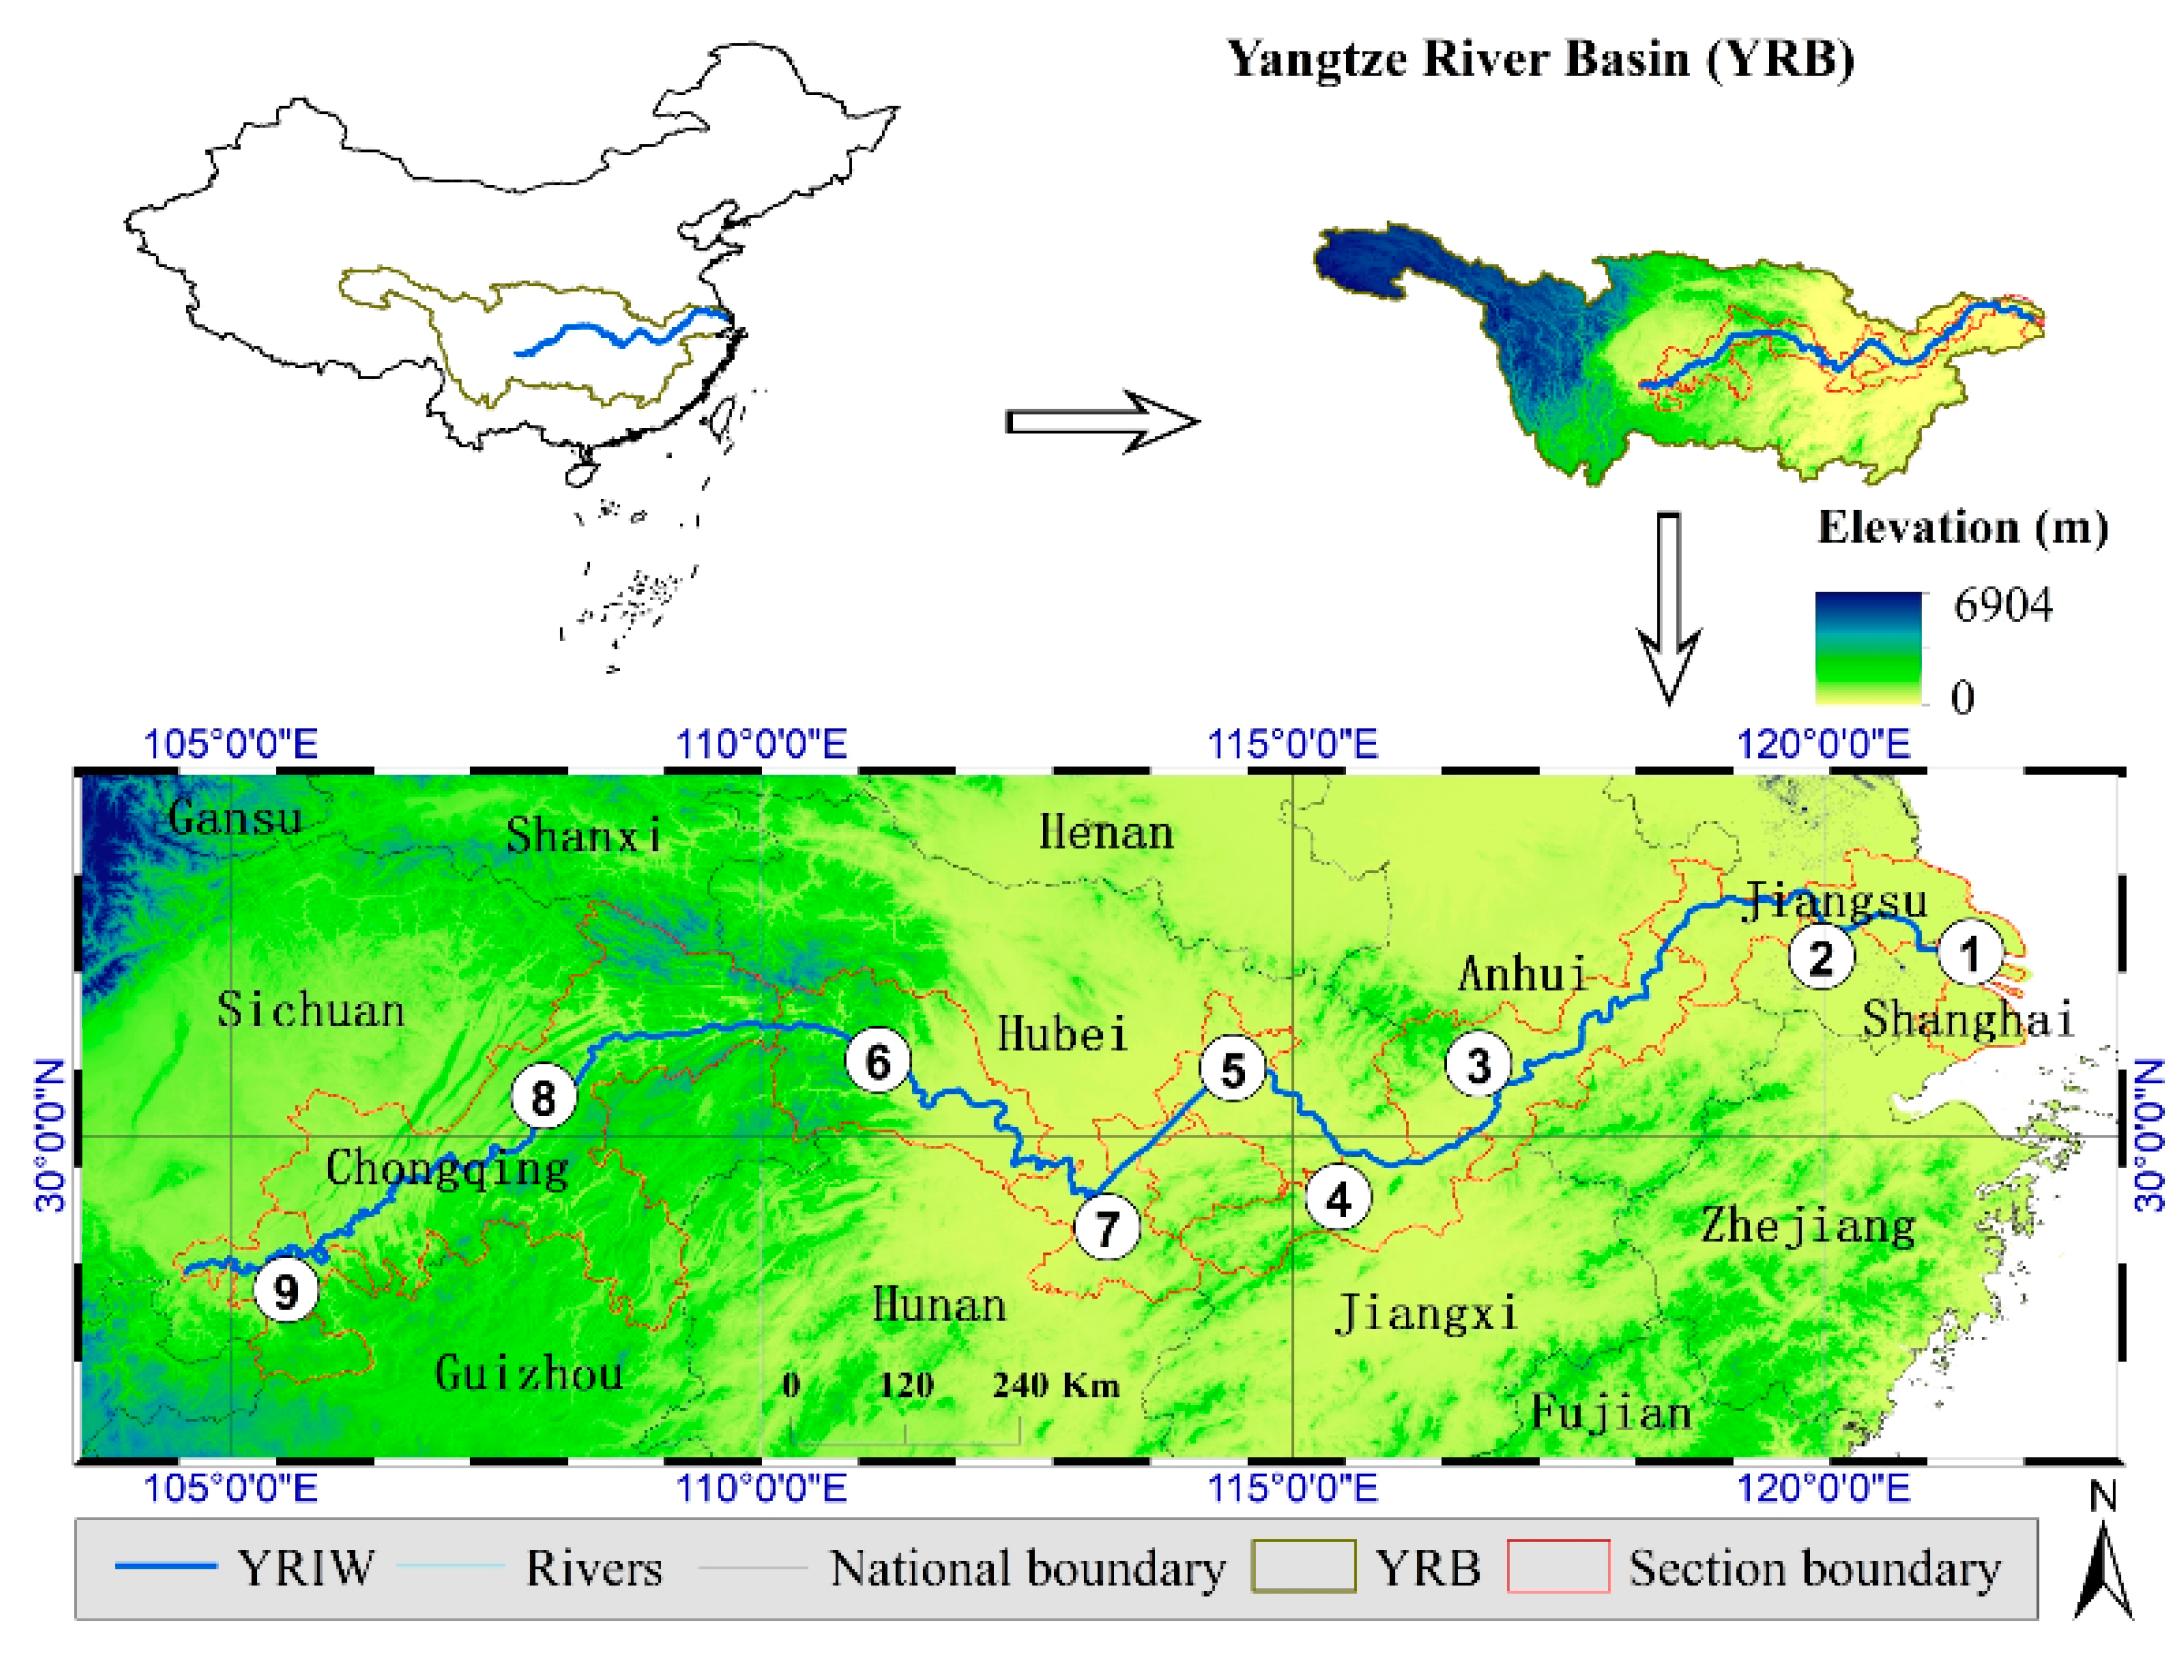
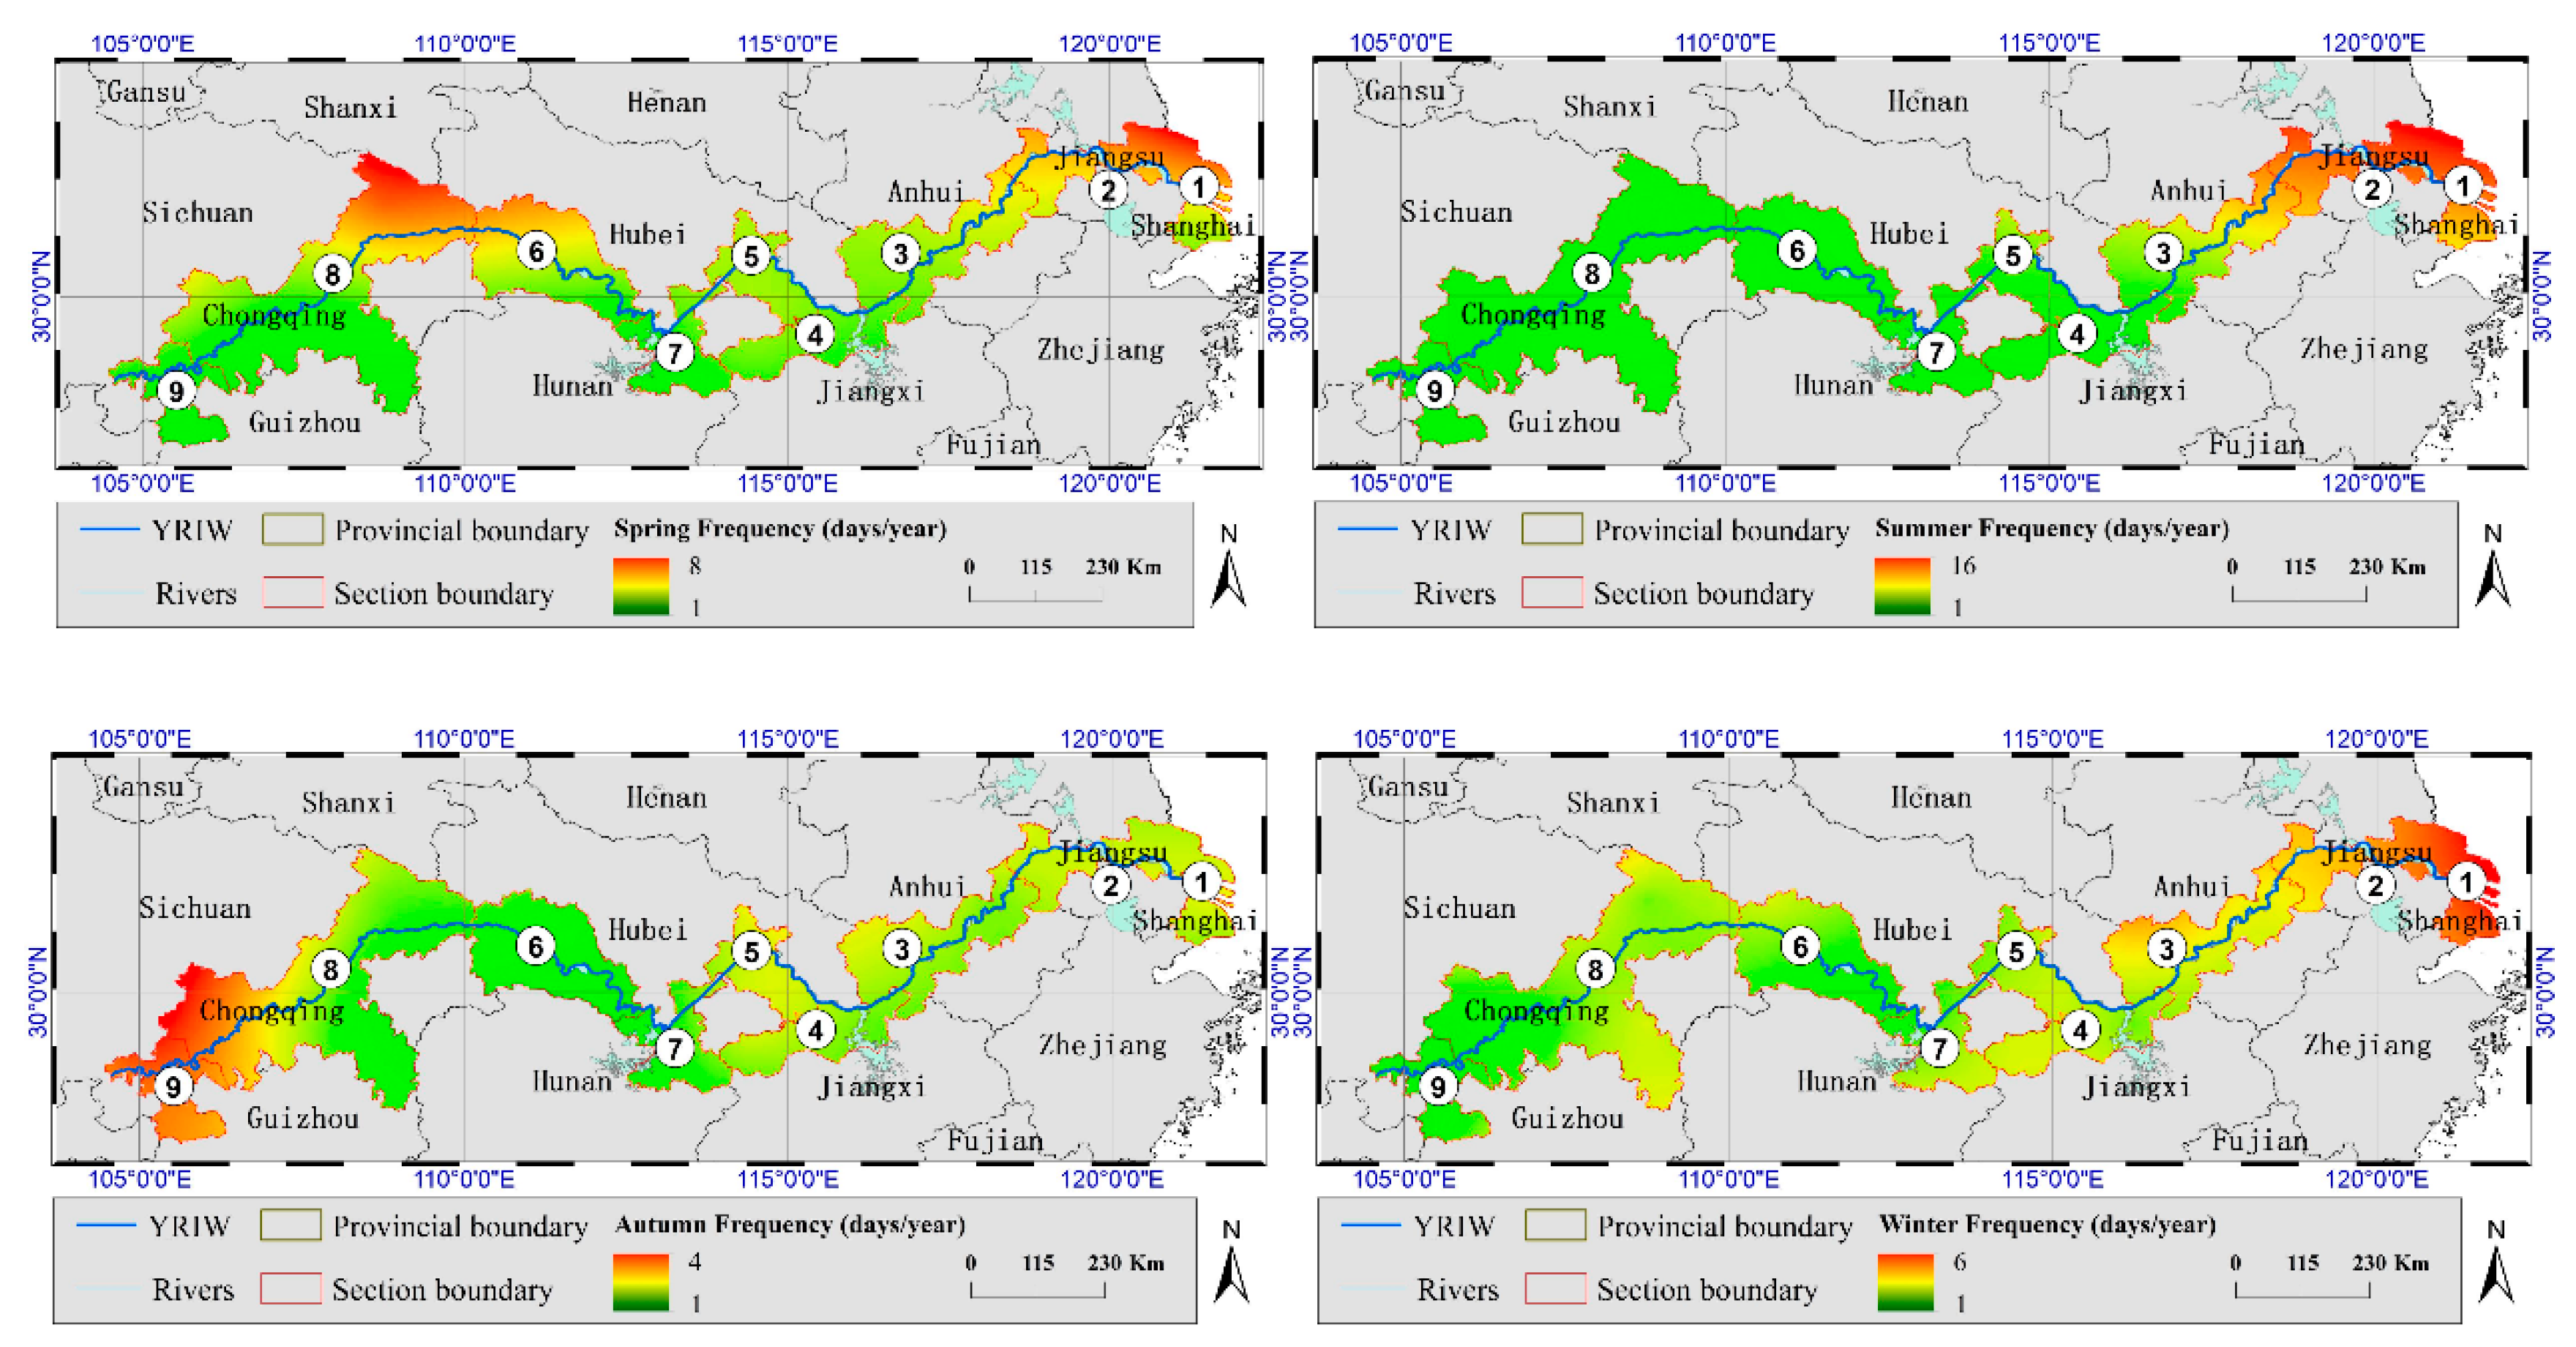
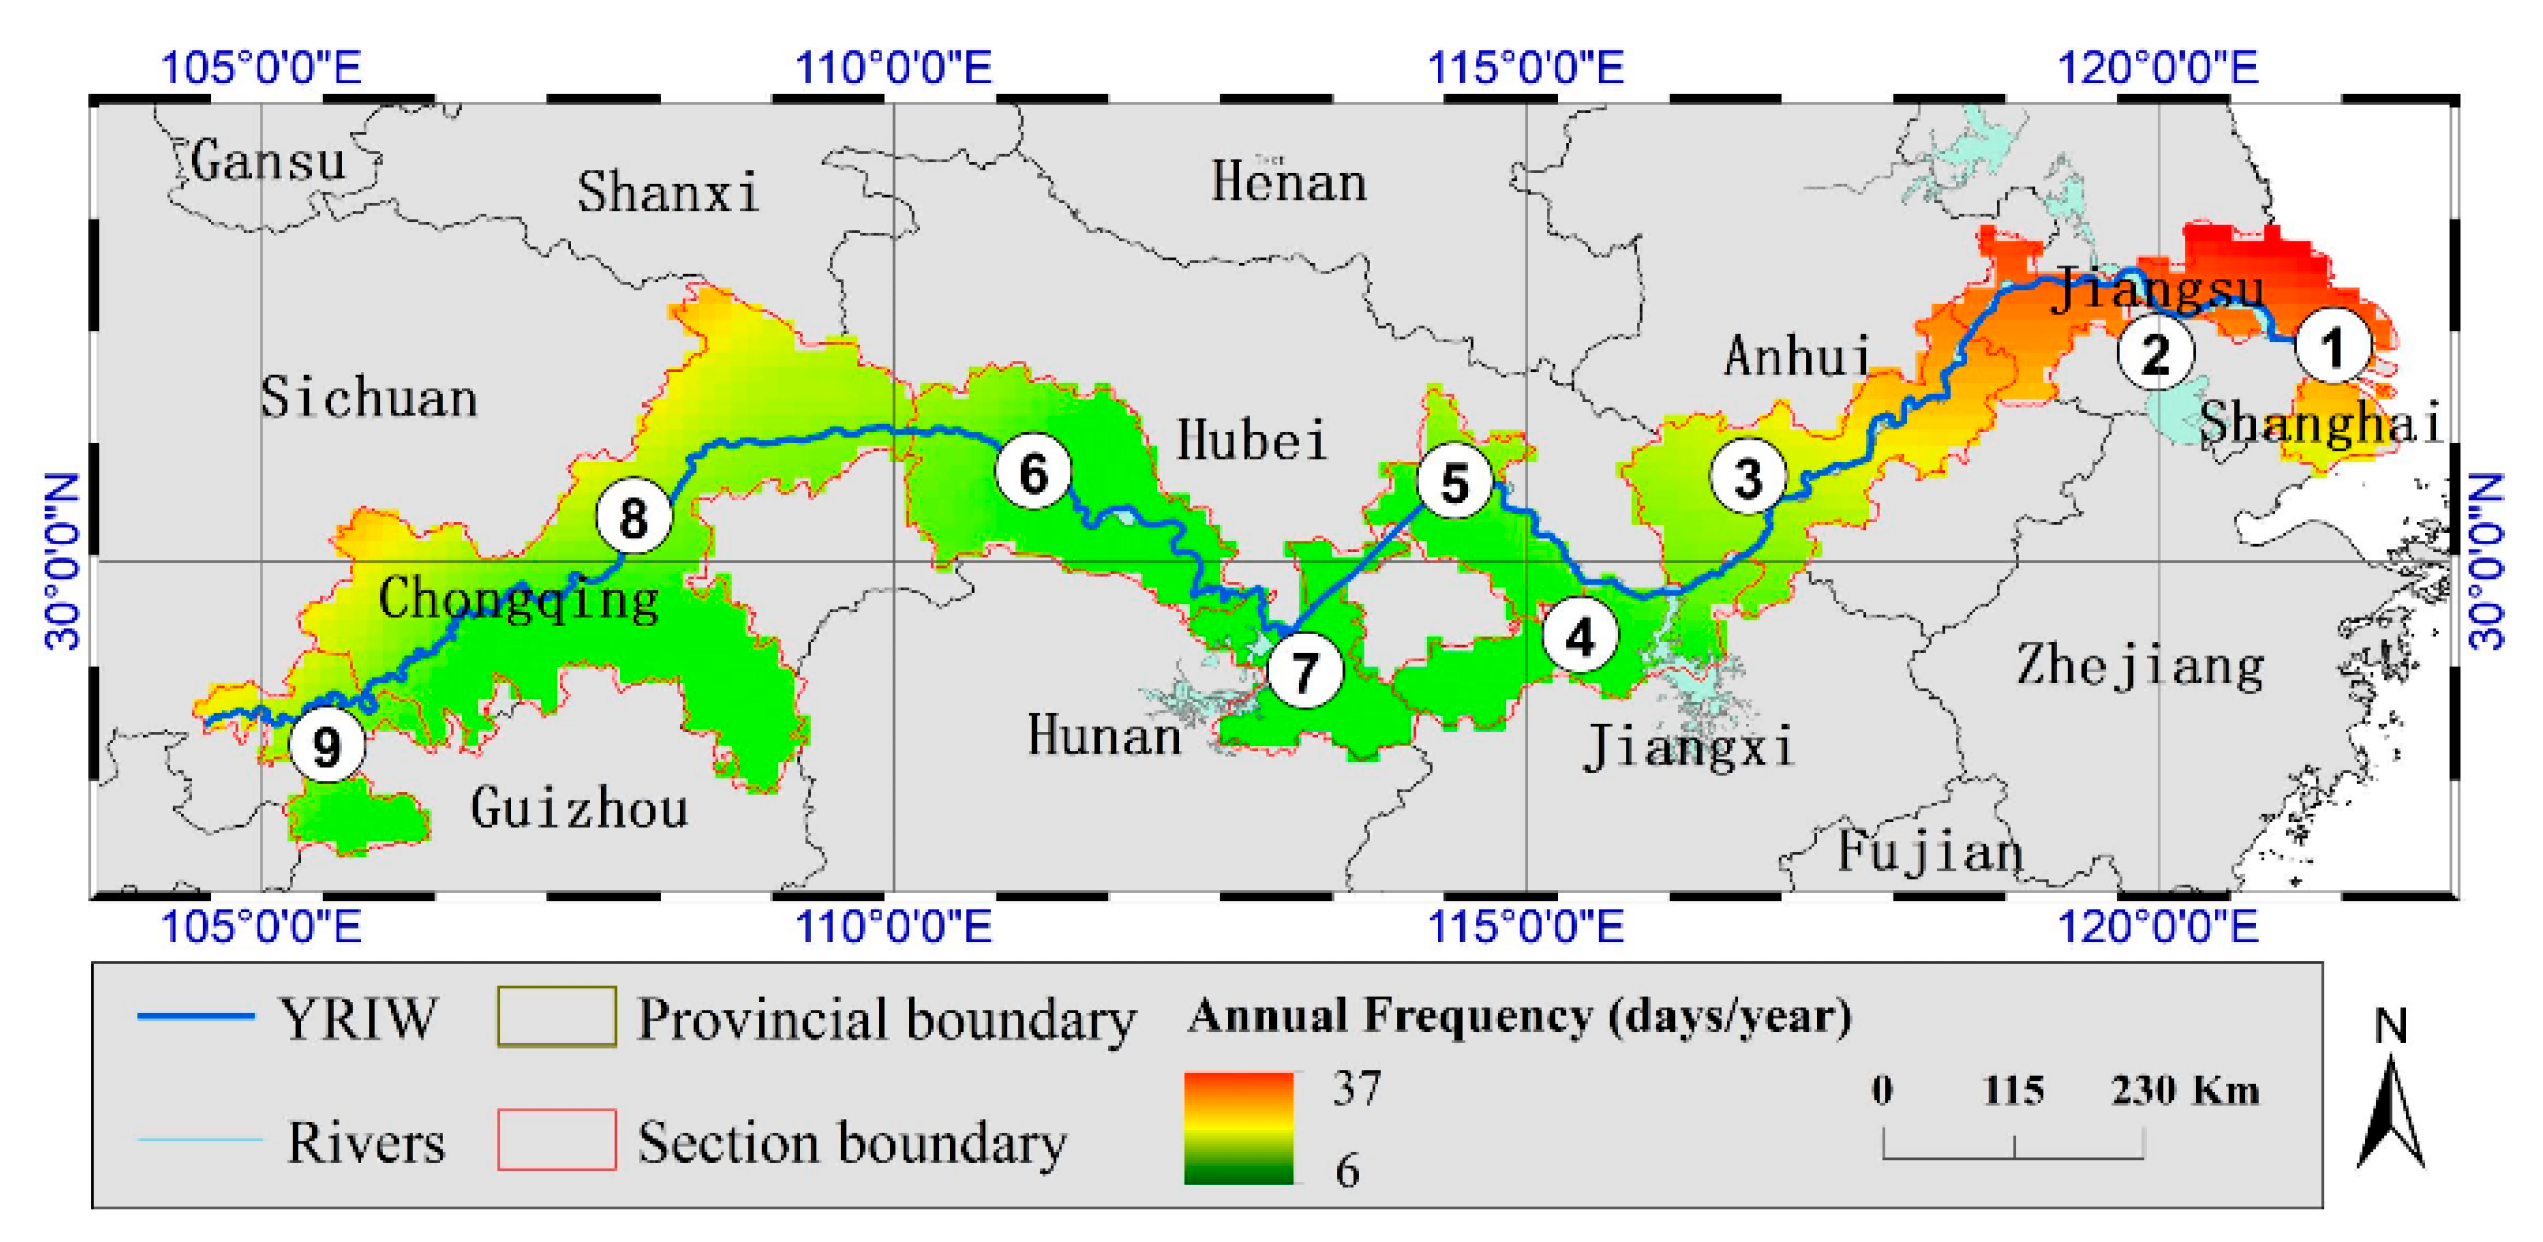
Basing on the Inland Waterway Regulations of the Yangtze River Administration of National affairs, the YRIW is divided into nine sections according to the provincial administrative region (Figure 1): (1) Shanghai section; (2) Jiangsu section; (3) Anhui section; (4) Jiangxi section; (5) Hunan section; (6) Eastern Hubei section; (7) Hubei western section; (8) Chongqing section; and (9) Sichuan section. In analyzing the impact of extreme weather events on the navigation environment of the YRIW, changes in climate factors at the basin scale should be considered. Under the influence of the subtropical monsoon circulation and the three-level terrace-like landforms, high in the west and low in the east, three major climate zones are formed in the Yangtze River basin [23]. The mainline climate is divided into the plain climate in the middle and lower Yangtze River (sections 1–5 and 7), the hilly mountain climate in the Three Gorges (sections 6 and 8), and the Sichuan Basin climate (section 9).
2.2. Defining the Selected Impact Indices
According to the only available “Statistical Bulletin on the Safety of Accidents in the Yangtze River Line” (2004–2016) published by the Yangtze River Maritime Bureau, the accidents caused by extreme weather events were mainly classified into four categories, including annual scale, the dry season (December–February), the normal season (March–May and October–November) and the flood season (June–September). The types and frequency of extreme weather events on the YRIW were summarized by the four categories, respectively (Table 1). At the annual scale, according to statistics that human error-related IWT accidents contributed to 89.5%, which suggested to be the main factors causing IWT accidents. A previous study showed that other elements, like the vessel or the environment, play an important role as indirect causes [24]; for example, the current skill level of inland voyagers regarding the determined effects of climate change is about 30%–50% [25]. Fifty-one accidents were caused by extreme weather, accounting for 8.25% of the total accidents. Among them, there were 16 accidents caused by strong winds; 33 accidents involving heavy fog, and two accidents involved flood events. In the dry season, 24 accidents were affected by extreme weather, which accounted for 15.48% of the total accidents. In the normal season, there were 17 accidents affected by strong wind, heavy fog, etc., accounting for 6.12%. The number and proportion of accidents were lower than those of the annual scale and dry season. In addition, there were 10 accidents in the flood season, accounting for 5.41%, with the lowest number of accidents and proportions. As a result, these extreme weather factors affecting the YRIW should be taken into account when evaluating IWT’s safety factors.
Furthermore, there are various ways to analyze existing extreme weather events, such as metrics, indices, intensity thresholds, and percentages that indicate significant social impact [26,27]. In previous studies, the EWENT (Extreme Weather impacts on European Networks of Transport—http://ewent.vtt.fi/) Project defined the most harmful extreme weather phenomena and their thresholds contributing to a holistic view of the weather impacts on European transport systems [28]. The effects and consequences of exceeding a specific threshold are various in different sections of the YRIW, depending on the local topography and climate. It is worth noting that some extreme events are less frequent, but they occur several times a year, and they only have a potentially harmful effect on IWT operations and infrastructure. We consider each weather phenomenon separately, covering the described destructive levels and their thresholds, as well as the effects and consequences reported in the IWT system. In addition, in estimating the impact threshold, the early warning classification by using Chinese Meteorological Services Criterions was also taken into the account of the National Yangtze Maritime Safety Administration (http://www.cjmsa.gov.cn/). To assess the impact of extreme weather events on IWT, we defined four impact thresholds based on key meteorological parameters, including wind data, precipitation, and daily temperature based on previous research. The four threshold values are defined as different weather parameters from the daily data series (Table 2), based on the determined effects and the severity of the consequences. In addition, the interval of regional climate analysis used in the assessment of changes in adverse weather phenomena in the future climate is also analyzed daily [29]. The specific thresholds are as follows: (1) Slight risk threshold: this may have no effect on the IWT system, except for events that occur rarely. (2) Middle risk threshold: the adverse effects on IWT systems may start to happen, particularly if the phenomena involved have very low resilience. (3) High risk threshold: expected to have some adverse effects. The extent of damage depends on the elasticity and robustness of the IWT system. (4) Extreme risk threshold: Irreversible damage caused by extreme weather.
2.3. Data Analysis
2.3.1. Observations
The extreme temperature and precipitation were calculated by using the climate extremes indices of the global grid dataset GHCNDEX observed from the stations. The GHCNDEX design is regularly updated to cover the period from 1951 to present [36]. Specifically, the GHCN-Daily is the highest and lowest temperature of the daily observation and the daily precipitation amount from the primary source of the different areas of the Earth. The dataset is integrated of observations from multiply data sources that have undergone extensive quality assurance reviews. GHCNDEX contains the 26 indices recommended by ETCCDI from the University of New South Wales Climate Change Research Centre (http://www.climdex.org), although most indices are defined by year, there are some that are monthly and can be counted as consecutive records and will be specified by absolute indices, threshold indices, percentile indices, and duration indices [37]. We also used the grid GHCNDEX dataset based on observational indices as comparison with reanalysis datasets.
2.3.2. Reanalyses
The frequency and range of severe weather events in the Yangtze River basin can be analyzed based on the European Centre for Medium Range Weather Forecasts for Atmospheric Research ERA-Interim reanalysis grid datasets [38]. The daily data of ERA-Interim reanalysis can be downloaded from the ECMWF Public Datasets web interface (https://apps.ecmwf.int/datasets/) and the ERA-Interim Archive is part of ECMWF’s Meteorological Archive and Retrieval System (MARS). It was produced by cycle 31r2 of ECMWF’s Integrated Forecast System (IFS) to describe the state of the atmosphere, as well as the ocean wave conditions and reduced 1.0 ° × 1.0 ° latitude/longitude grid. ERA-Interim reanalysis datasets are available on a reduced Gaussian grid with approximately uniform 79 km spacing for surface and other grid-point fields. The datasets were used to derive the adverse and extreme weather indices over the Yangtze River basin for the 39-year period (1979–2017) as follows: the 2-m daily minimum temperature for cold spell, the 2-m maximum temperature for heat wave, the 10-m wind speed for wind gusts, and the total daily precipitation for heavy rainfall and storms. The datasets do not distinguish between liquid and solid states of precipitation, thus, the frequency of snowfall by daily precipitation was calculated at the daily average temperature of less than 0 °C. Since the interpolation method has smoothed out the magnitude of the extreme value of the variable change, we have applied a rough correction: the factor for precipitation is 64%, and the factor for the maximum temperature data is −1.1 °C, which is verified by the station observation results [39]. The outer edges of the domains covered by the two datasets in this study are as follows: GHCNDEX OBS data between 25–35°N and 90–122°E and ERA-Interim Reanalysis data between 23.8–35.2°N and 90–111.9°E. The probability of adverse events and the spatial frequencies distribution of selected thresholds in the YRIW are studied, using the maps during the period 1979–2017, which were used Gaussian filtered methods for the quality-control, furtherly the long trends of the time series were analyzed and detected the significance by simple linear regression and non-parametric Mann–Kendall trend tests with Sen’s slope estimates [40]. Linear regression was used because of its statistical power when normality assumptions are met, and non-parametric Mann– Kendall was used for comparison, because it is robust to outliers.
3. Results
3.1. Heavy Rainfall
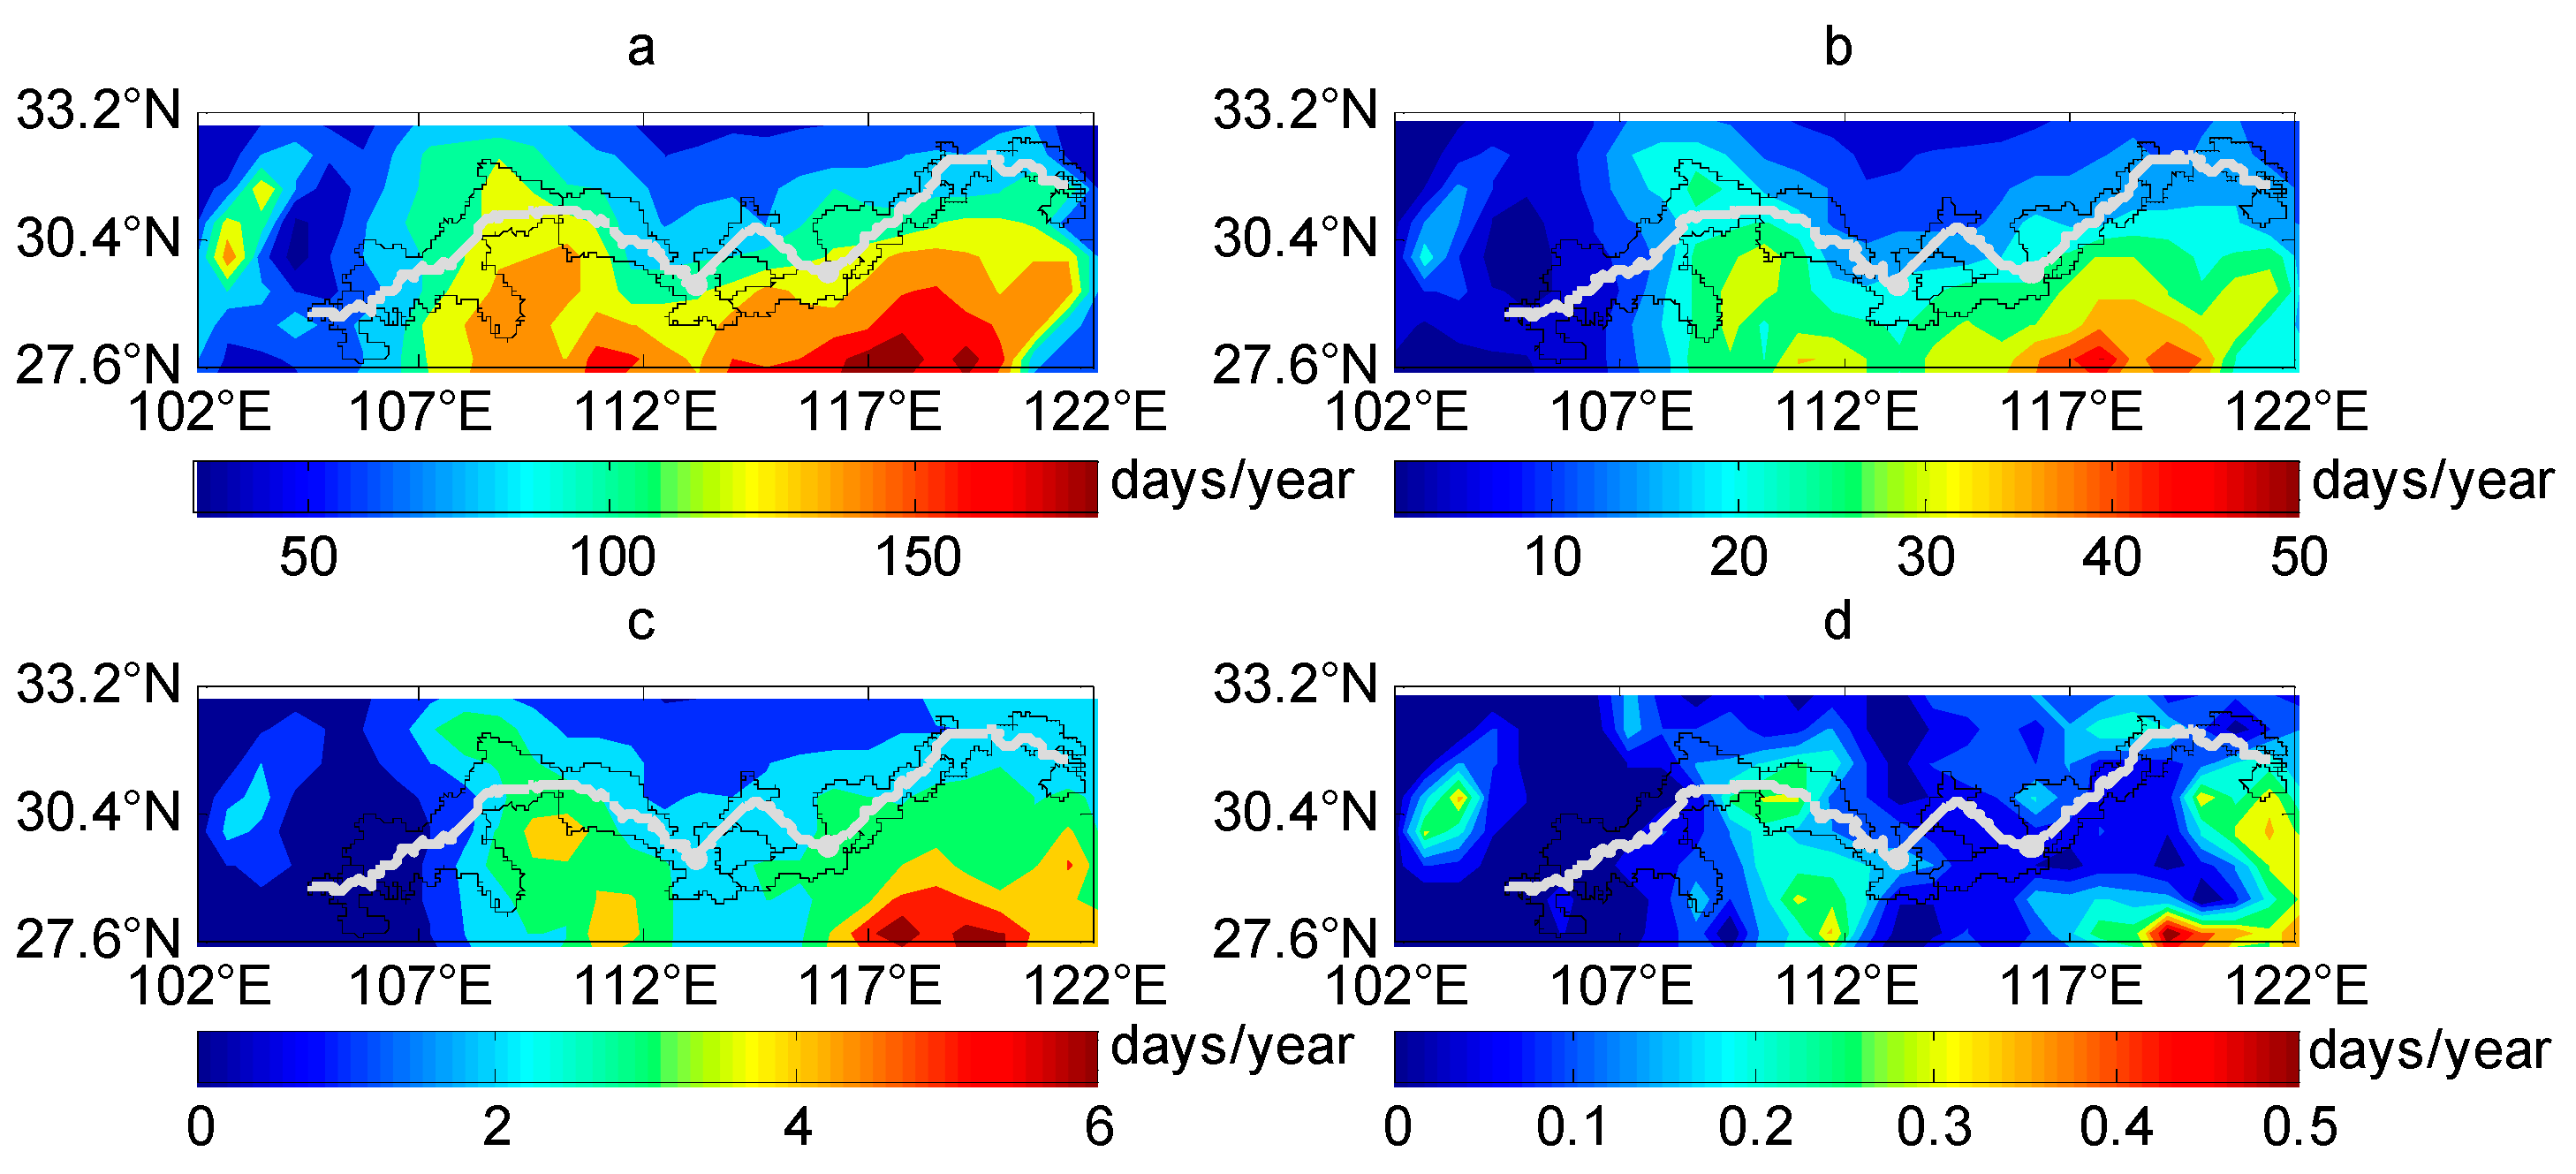
The spatial variation in strong rainfall intensities reveals that most sections in YRIW experiences 100–130 days/year with more than 10 mm of precipitation (Figure 2a). The wet zone with an annual rainfall of more than 1600 m is mainly located in the western and eastern edge of the Sichuan, Jiangxi, Hunan, and parts of Hubei. The frequency of middle risk heavy rainfall days with more than 25 mm ranges from 50–65 days/year in Sichuan and Chongqing sections to 40–50 days/year in the other sections (Figure 2b). The frequency of high risk heavy rainfall days with more than 50 mm ranges from 15–20 days/year in Sichuan sections to 10–15 days/year in the other sections (Figure 2c). Extremely heavy rainfall days with more than 100 mm are few, in general 1–5 cases/year occurring in 39 years over YRIW (Figure 2d). All stations on the YRIW that have occasionally measured precipitation amounts exceeding 200 mm per day, but these measurements may not always be part of the ERA-Interim Reanalysis data archive. Daily precipitation amounts of 150 mm are very rare to occur, and these high values are, therefore, mostly leveled out in ERA-Interim Reanalysis I gridded data.
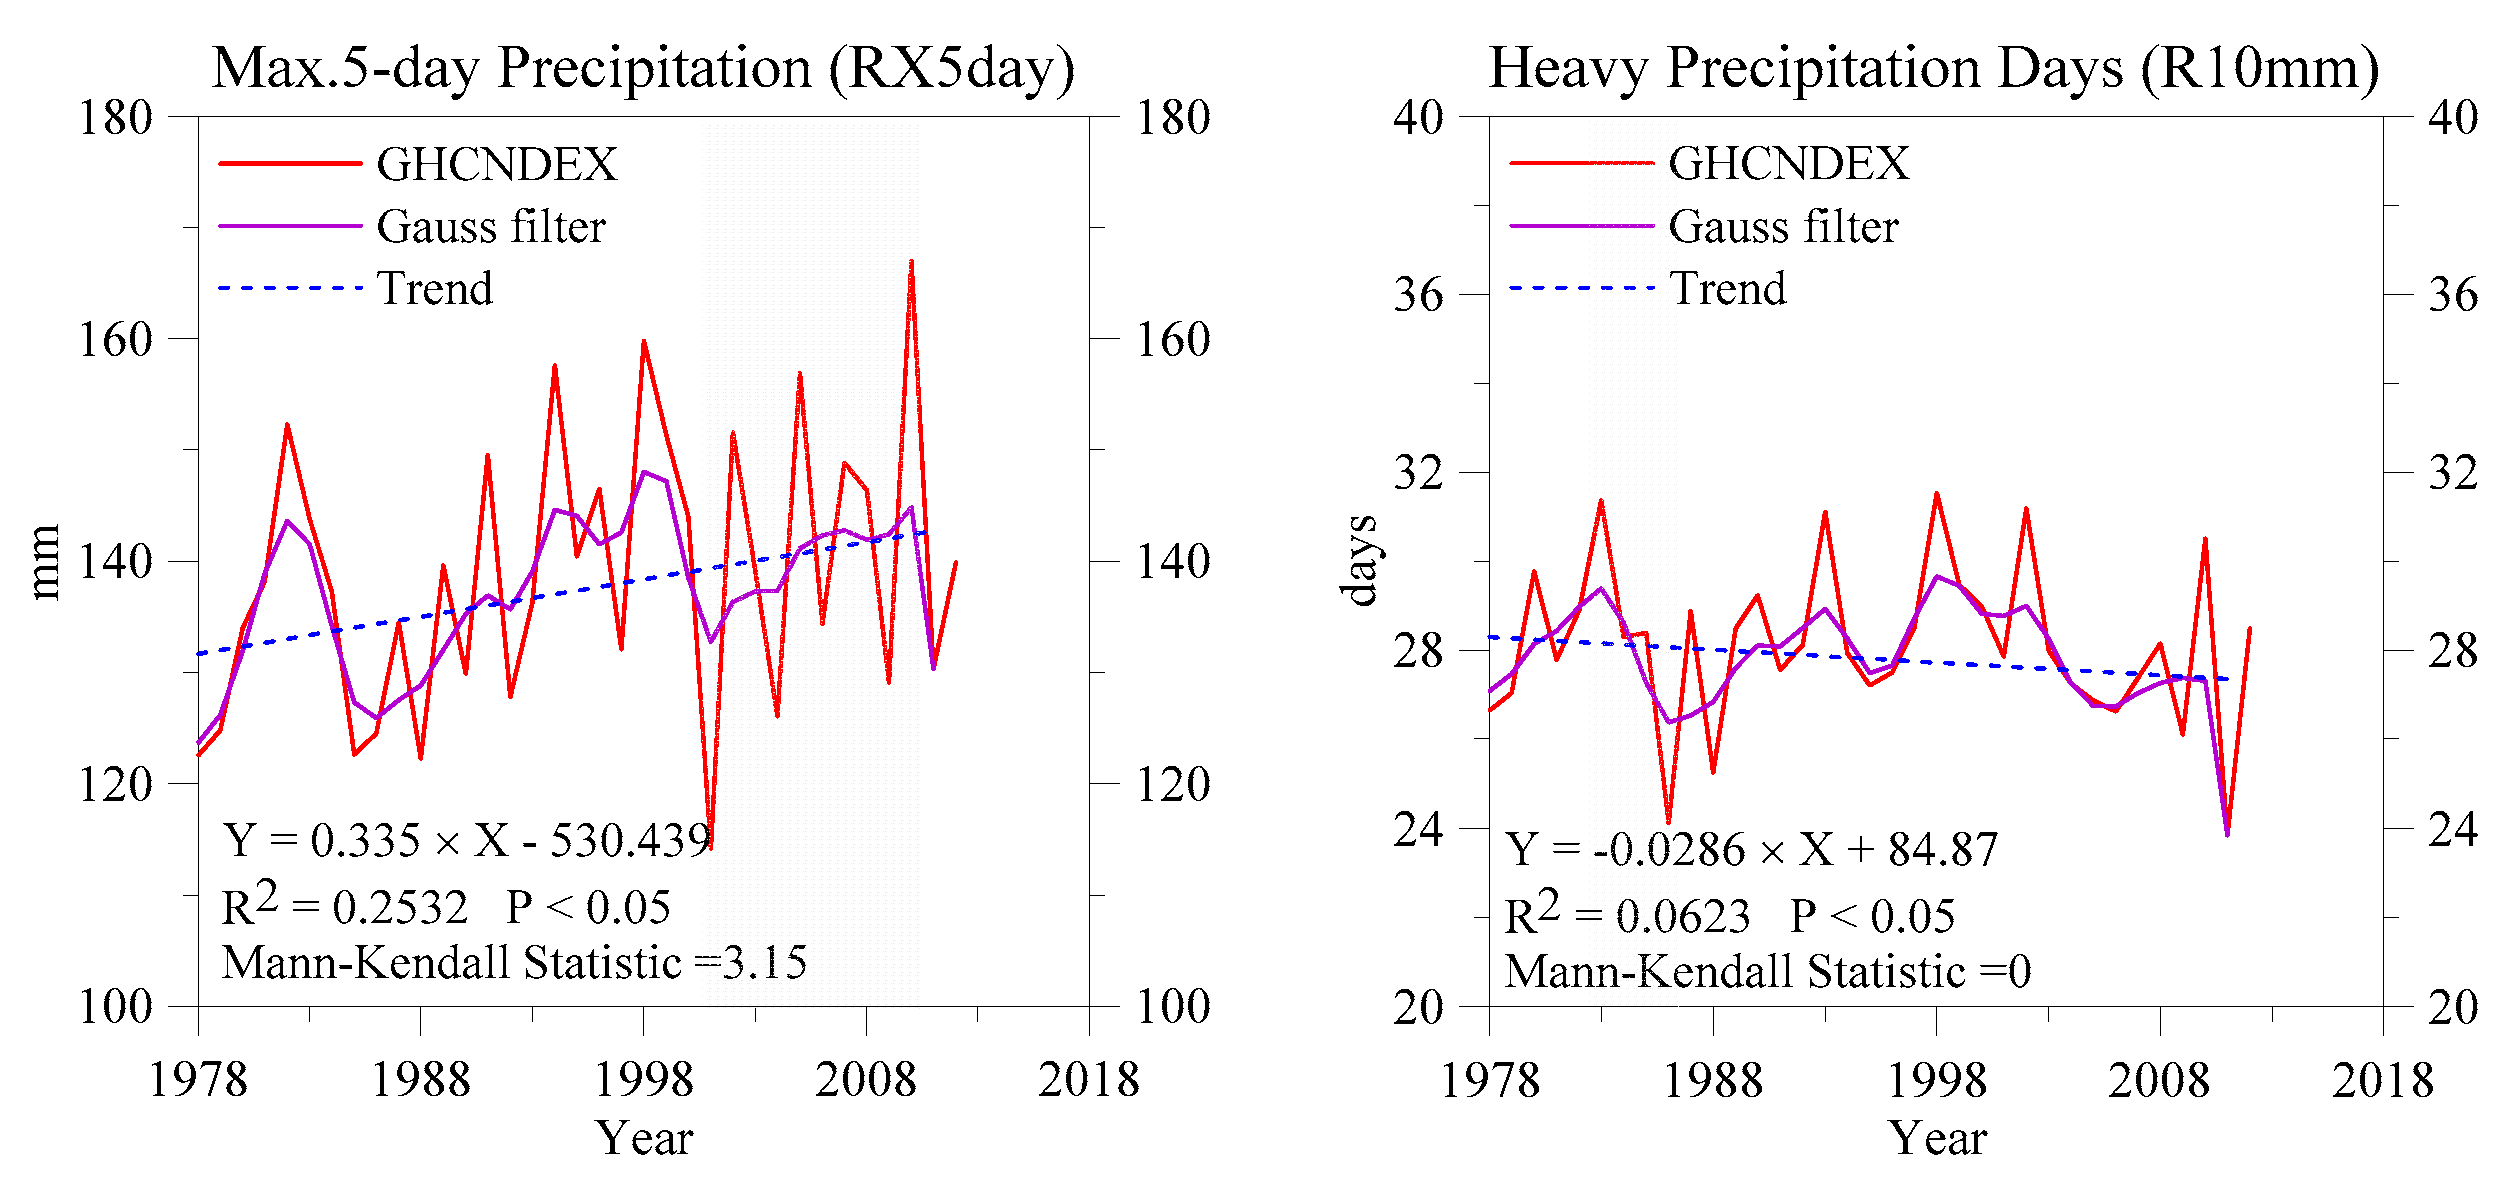
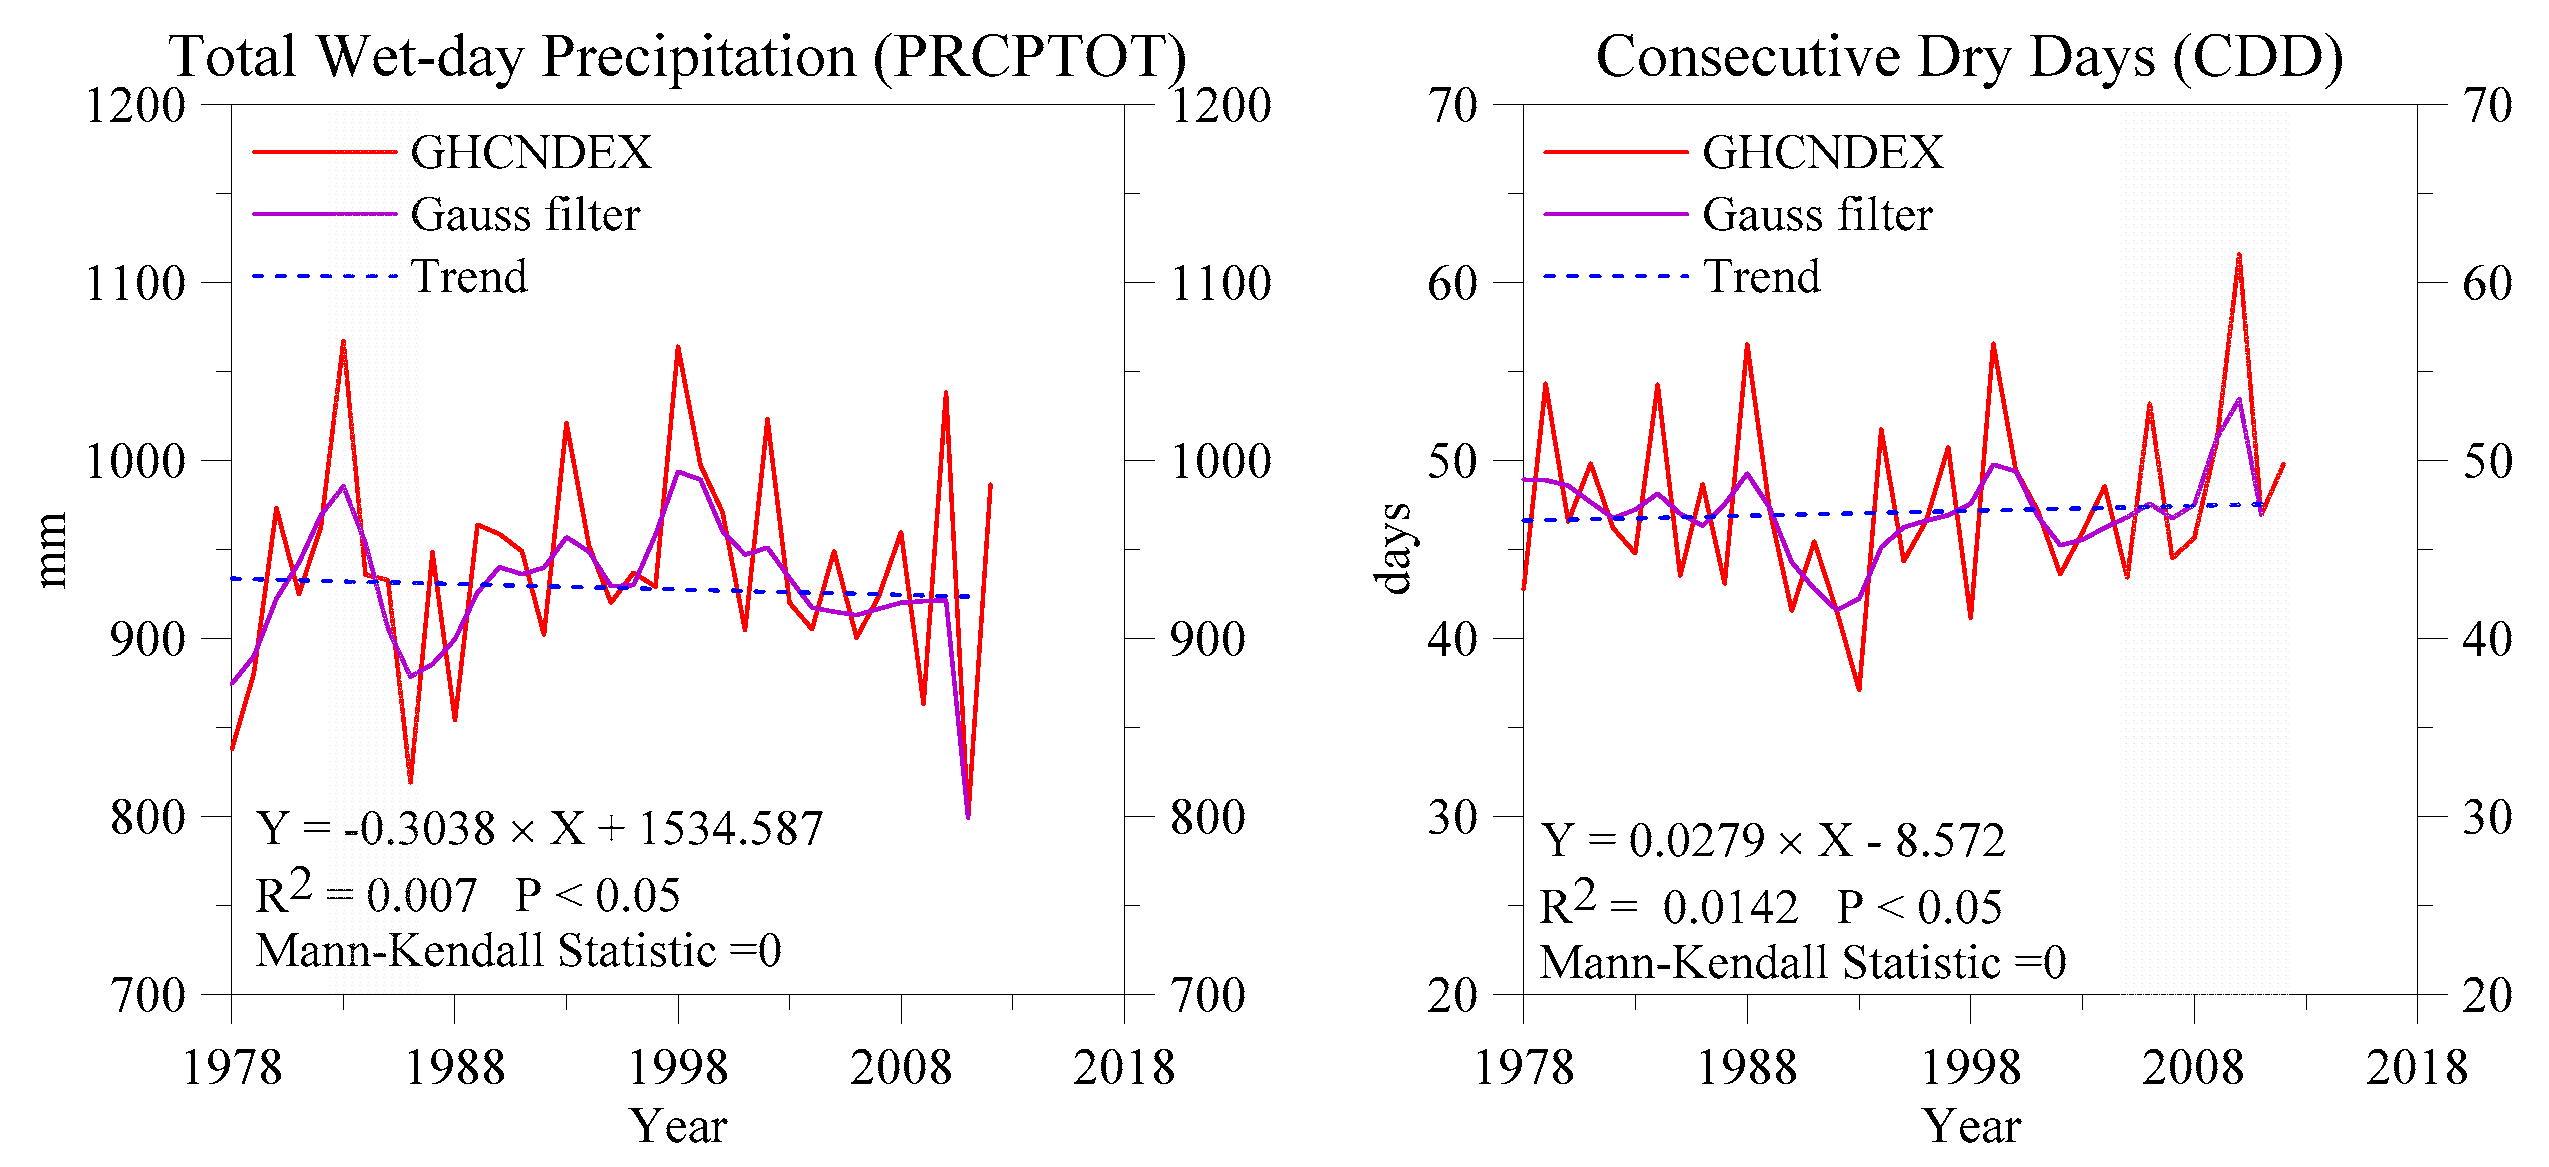
We select three extreme weather indices related to heavy rain in the ETCCDI index dataset (Figure 3). The maximum five-day precipitation index (RX5day) describes the monthly or annual maximum of five-day precipitation accumulations, which represent potential flood risks as heavy rain conditions; the heavy precipitation days index (R10mm) counts the number of days with more than 10 mm of precipitation and PRCPTOT describes the total annual amount of precipitation on wet days defined as days with more than 1 mm of precipitation. There was no significant trend observed using the linear regression (Figure 3). There was a significant upward trend perceived using the Mann–Kendall test (3.15) in the RX5day where the linear regression shows no significance at P < 0.05. The trend analysis of the heavy rain implies that the PRCPTOT and R10mm in the entire study area are on the decline slightly during the 39-year period. In 1998, Yangtze flood was a watershed flood, but the flooding and death toll was much lower than 1954. This is inseparable from the relationship between global warming. In addition, we selected the consecutive dry-day index (CDD) related to drought in the ETCCDI index, representing the length of the longest period of consecutive dry days (i.e., days with PR < 1 mm) in a year ending in that year, which are on the rise slightly (Figure 3). In 2010, China experienced the worst drought in history. Since 1990, high-intensity human activities and climate change have led to increased fluctuations in flood storage capacity and seasonal precipitation in the Poyang Lake, and the frequency and intensity of flood/drought on the mainline of the Yangtze River have increased significantly [41].
3.2. Heat Wave
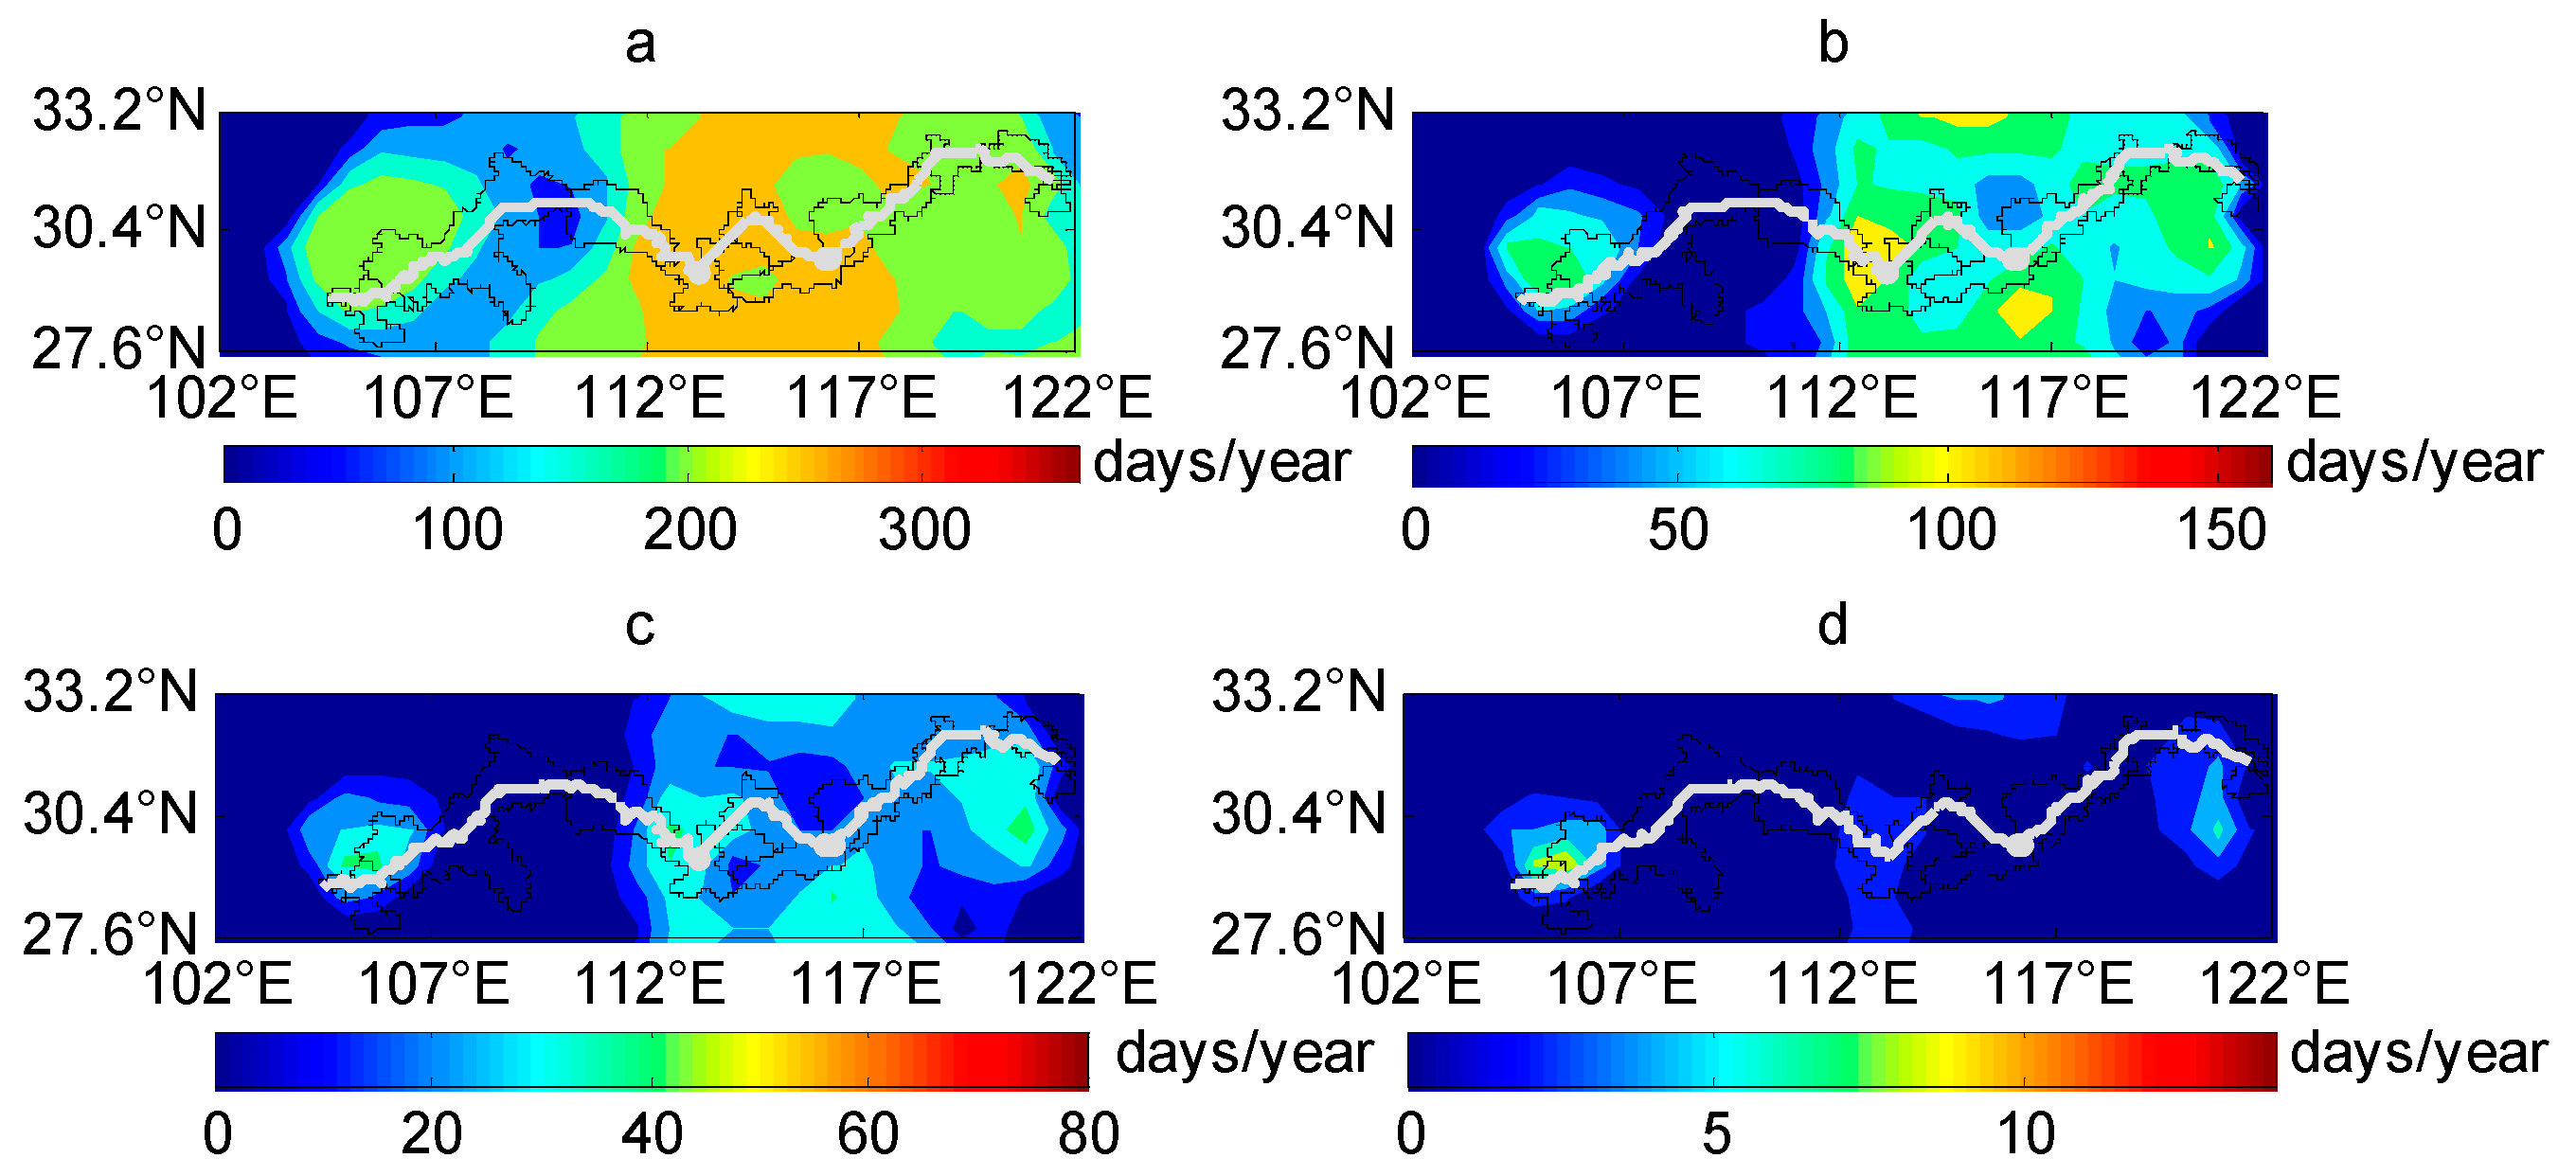
The YRIW is in the subtropical monsoon climate zone, there is almost no significant meridional decrease in the frequency of slight risk hot days (C ≥ 25 °C) in the Hubei section (200–250 days/year) (Figure 4a). The frequency of middle risk hot days (C ≥ 35 °C) ranges from 50–75 days/year in the Western YRIW to 75–100 days/year in the eastern YRIW (Figure 4b). The frequency of high risk hot days (C ≥ 39 °C) ranges from 25–30 days/year in Sichuan, from the Shanghai to Hubei sections to 30–40 days/year in the upper and middle YRIW (Figure 4c). Very hot days (daily maximum temperatures ≥ 43 °C) are very rare, with a maximum of seven days over the Sichuan, Hubei, and Shanghai sections (Figure 4d). However, it is worth noting that due to the application of gridding procedures in the ERA-INTERIM Reanalysis dataset. The high temperature values recorded at various stations were masked, therefore, the possibility of hot weather was partially underestimated.
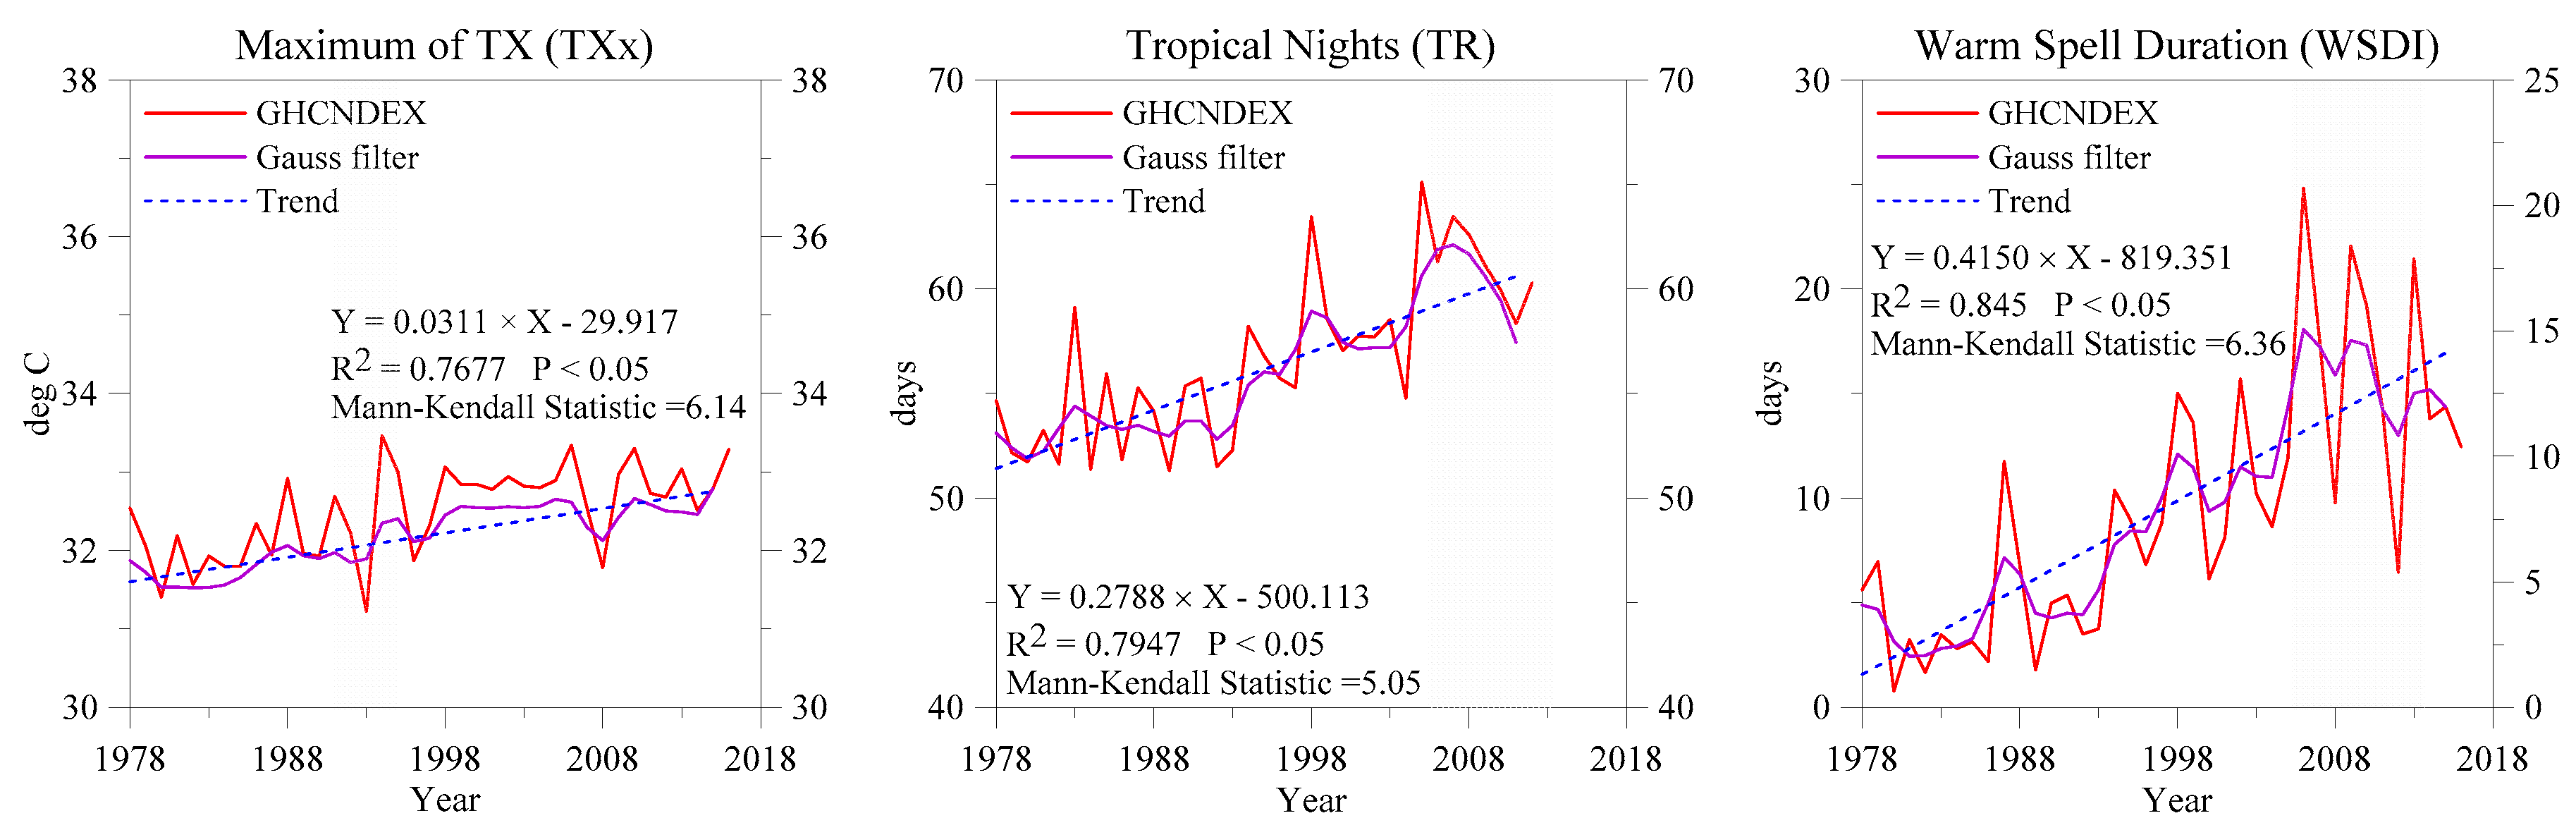
We also selected three indices related to extreme high temperatures in the ETCCDI index (Figure 5). The maximum of TX (TXx) represents the hottest day of a year, and TX presents daily maximum near surface temperatures. Tropical nights (TR) count the days when TX is above 20 °C. The warm spell duration indices (WSDI) count the number of days in a year when TX is above the 90th percentile for six consecutive days or longer. The TXx, TR, and WSDI was 33.06 °C, 63.45 days, and 15 days respectively, in 1998, which show a high temperature trough with extreme precipitation. The trend analysis of the hot days implies that the TXx did not show increasing trend of 0.0083 °C year−1 (p < 0.05) but there was a statistically significant increase over its entire record. TR and WSDI of the entire study area is a significant upward trend detected using the Mann–Kendall test during the 39-year period.
3.3. Cold Spell
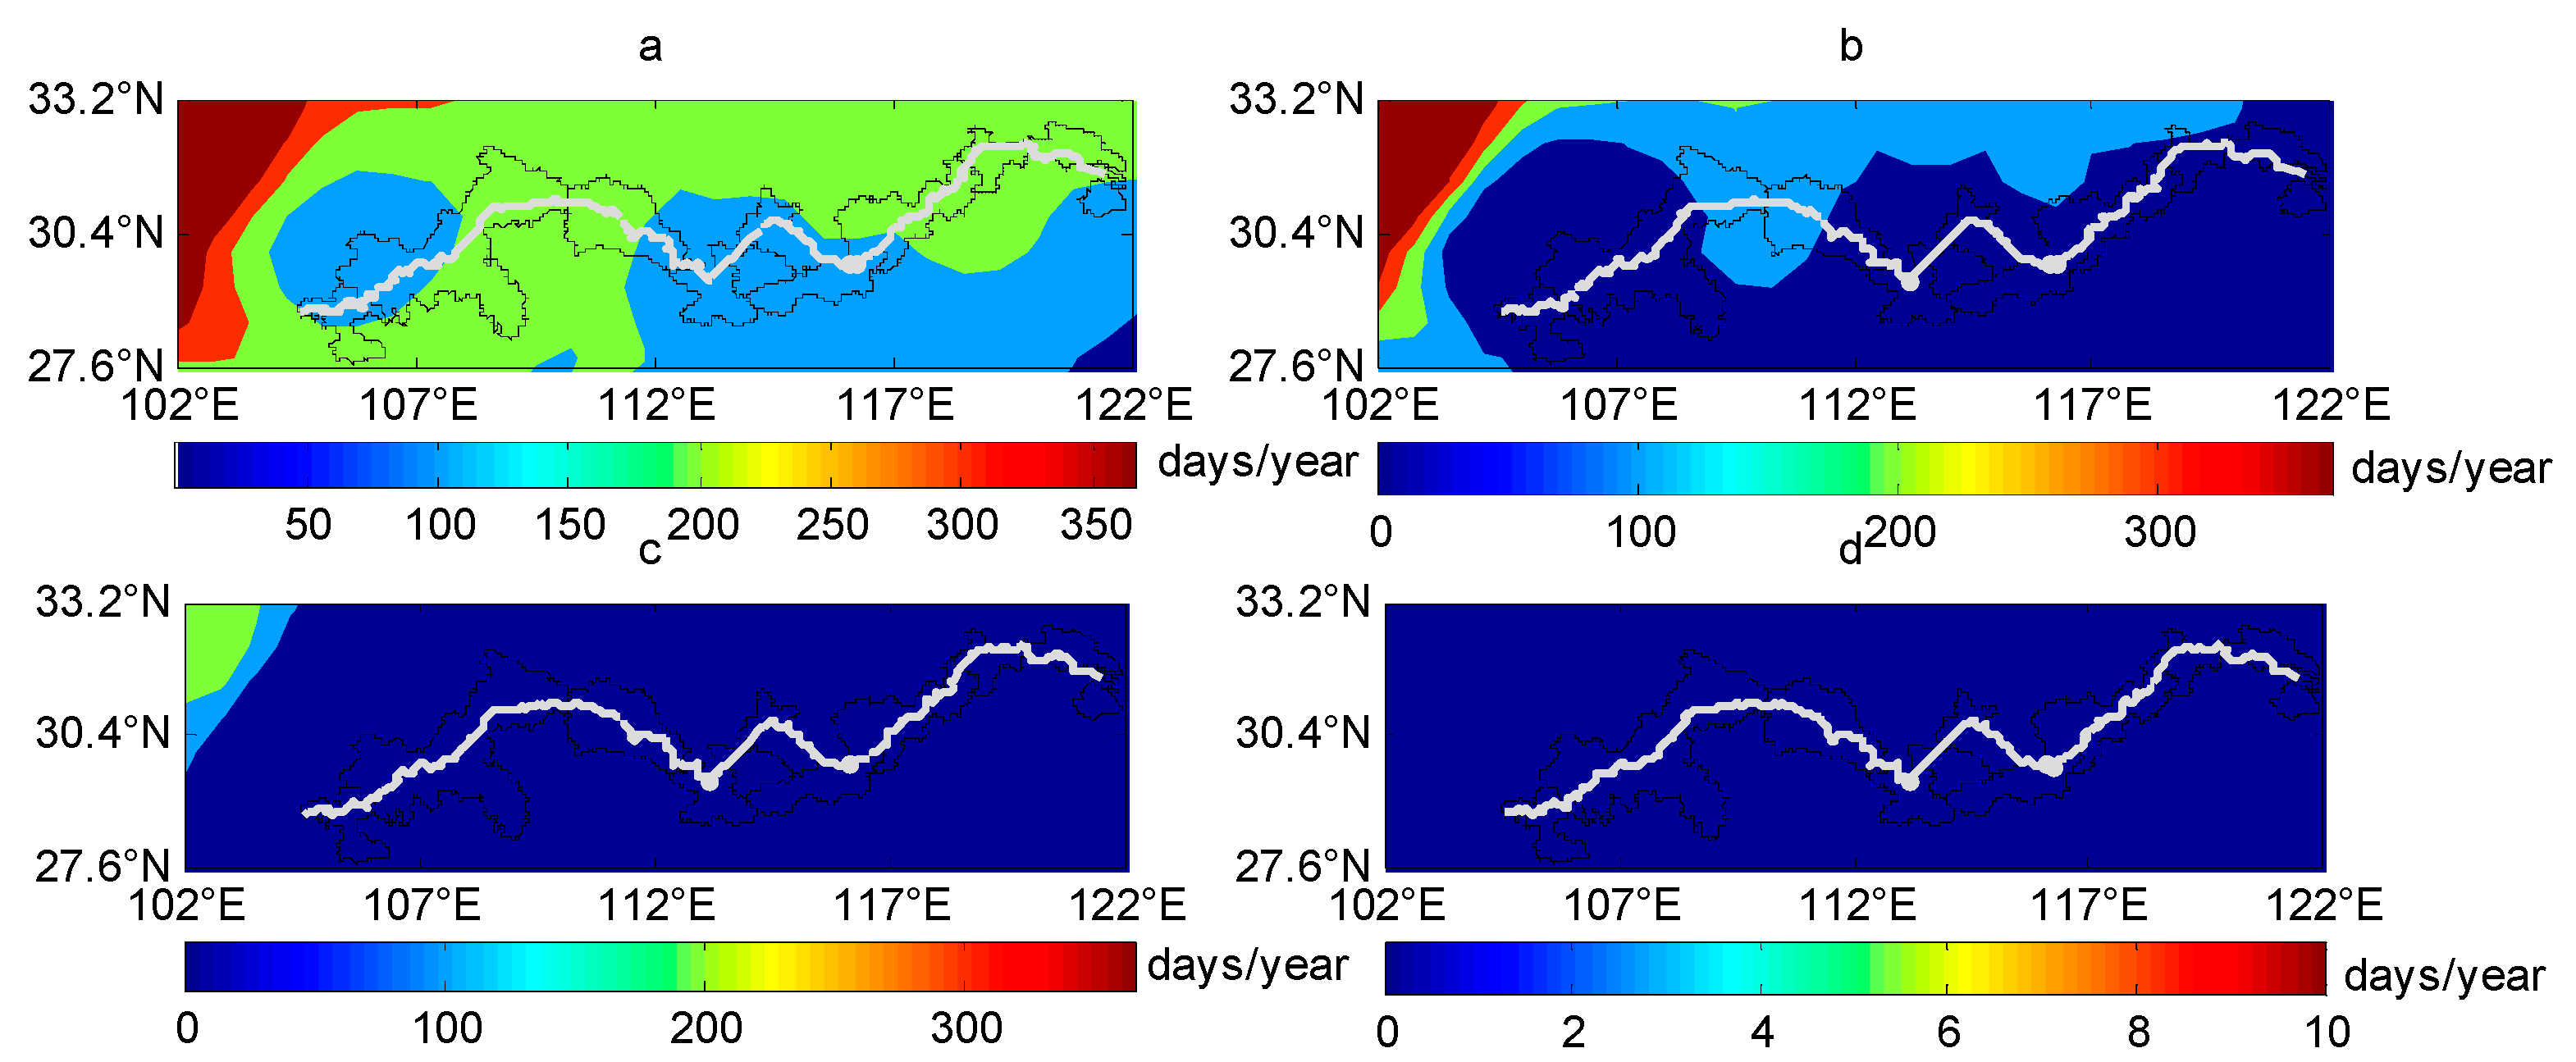
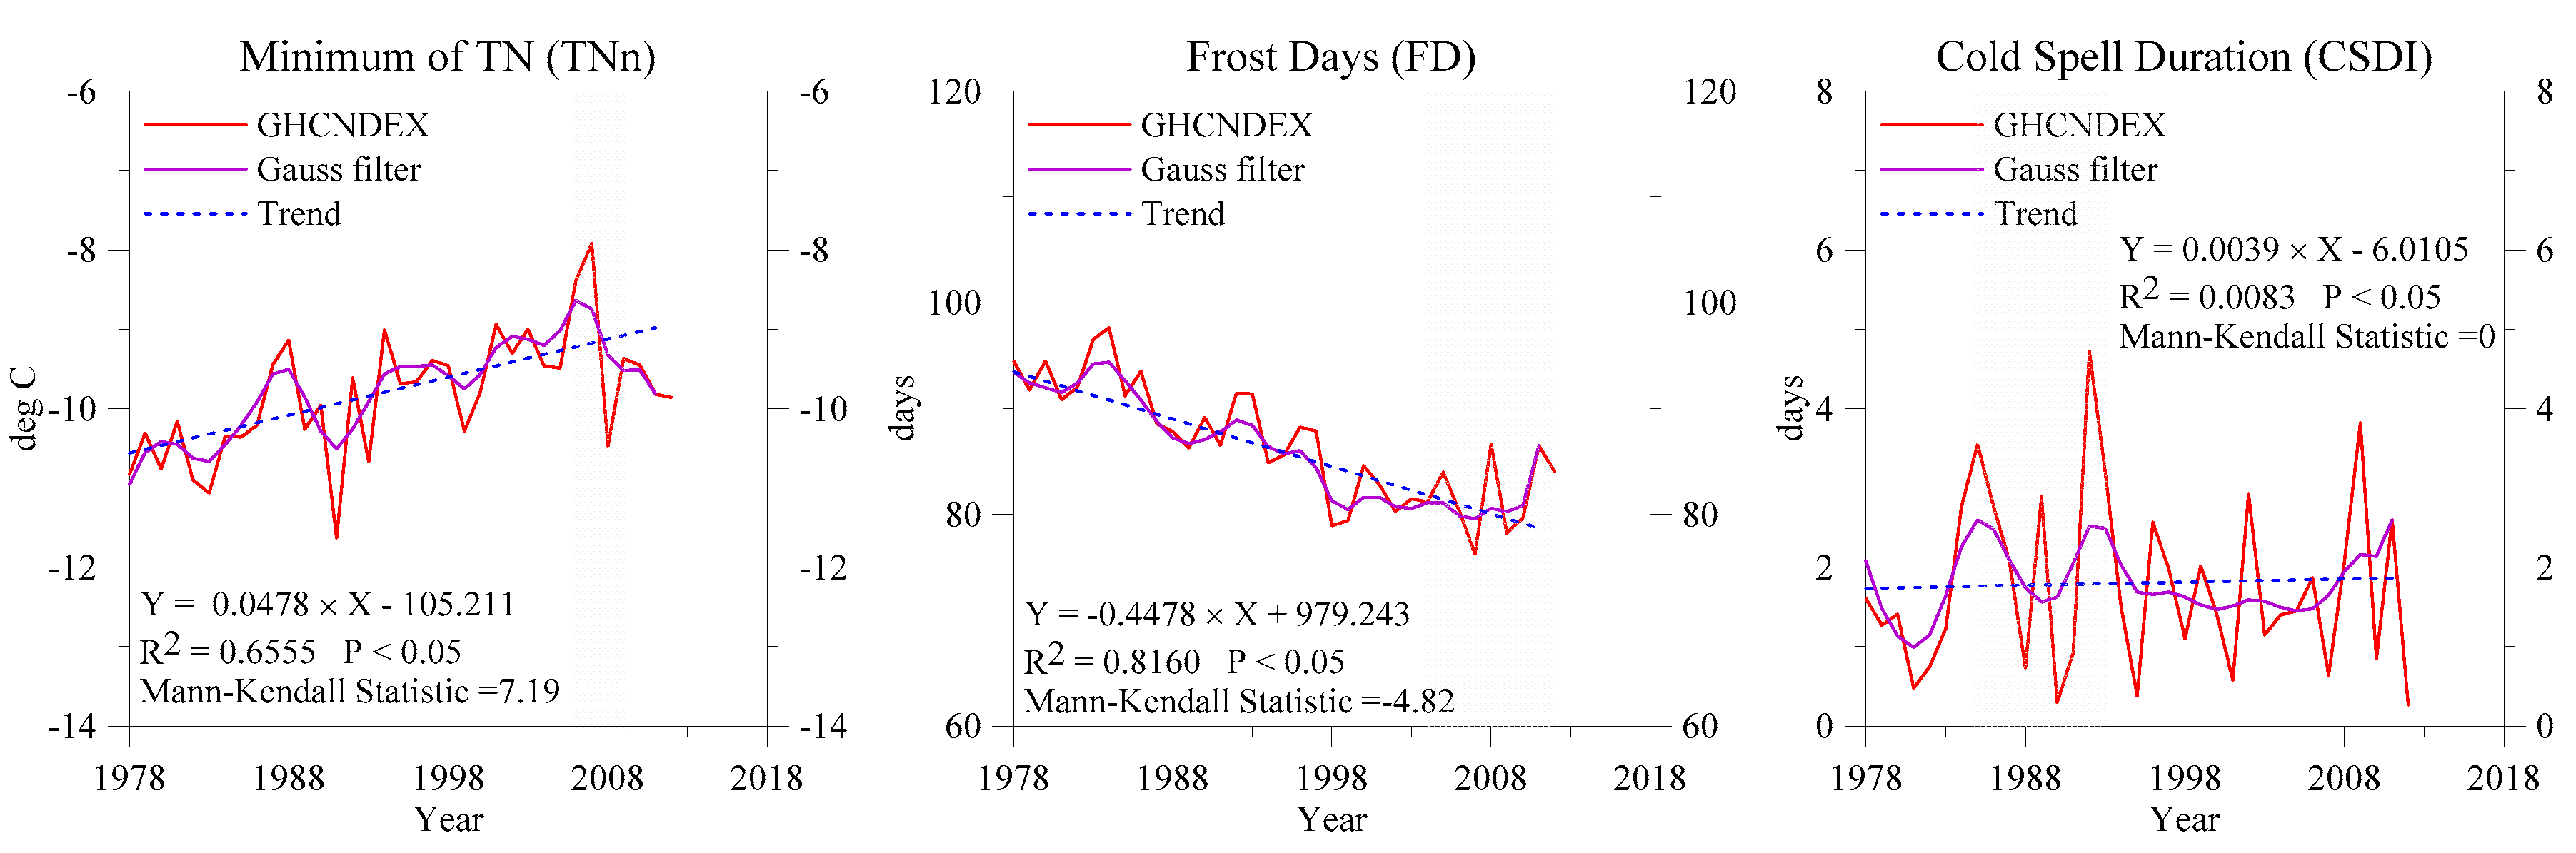
According to the spatial distribution of cold spell weather (Figure 6), except for the Jinsha River area where the source of the Yangtze River originated, there is no cold spell weather across the YRIW, and it is less likely to occur and occasionally occurs, which shows a slight risk to IWT. Three extreme weather indices were selected relating to low temperatures in the ETCCDI index. The minimum of TN (TNn) represents the coldest day of a year, and TN presents a daily minimum near surface temperatures. Frost days (FD) counts the days when TN is below 0 °C. The Cold Spell Duration Indices (CSDI) counts the number of days in a year when TN is above the 90th percentile for six consecutive days or longer. There was a significant trend observed using the Mann–Kendall test where the linear regression shows no significance at p < 0.05 in the trend of TNn, FD and CSDI (Figure 7). The change in TNn, FD and CSDI ranges from −11.6 (−) −9.6 °C, 79–91 days, and 1-4 days, respectively, from 1987 to 2017 during the third hotter stage. The trend analysis of the cold probability implies that the TNn of the entire study area is on the rise during the 39-year period (R2 = 0.6555), which indicates that the extreme cold events have increased. However, FD and CSDI are falling, indicating that the number of cold days in the Yangtze River is decreasing due to global warming.
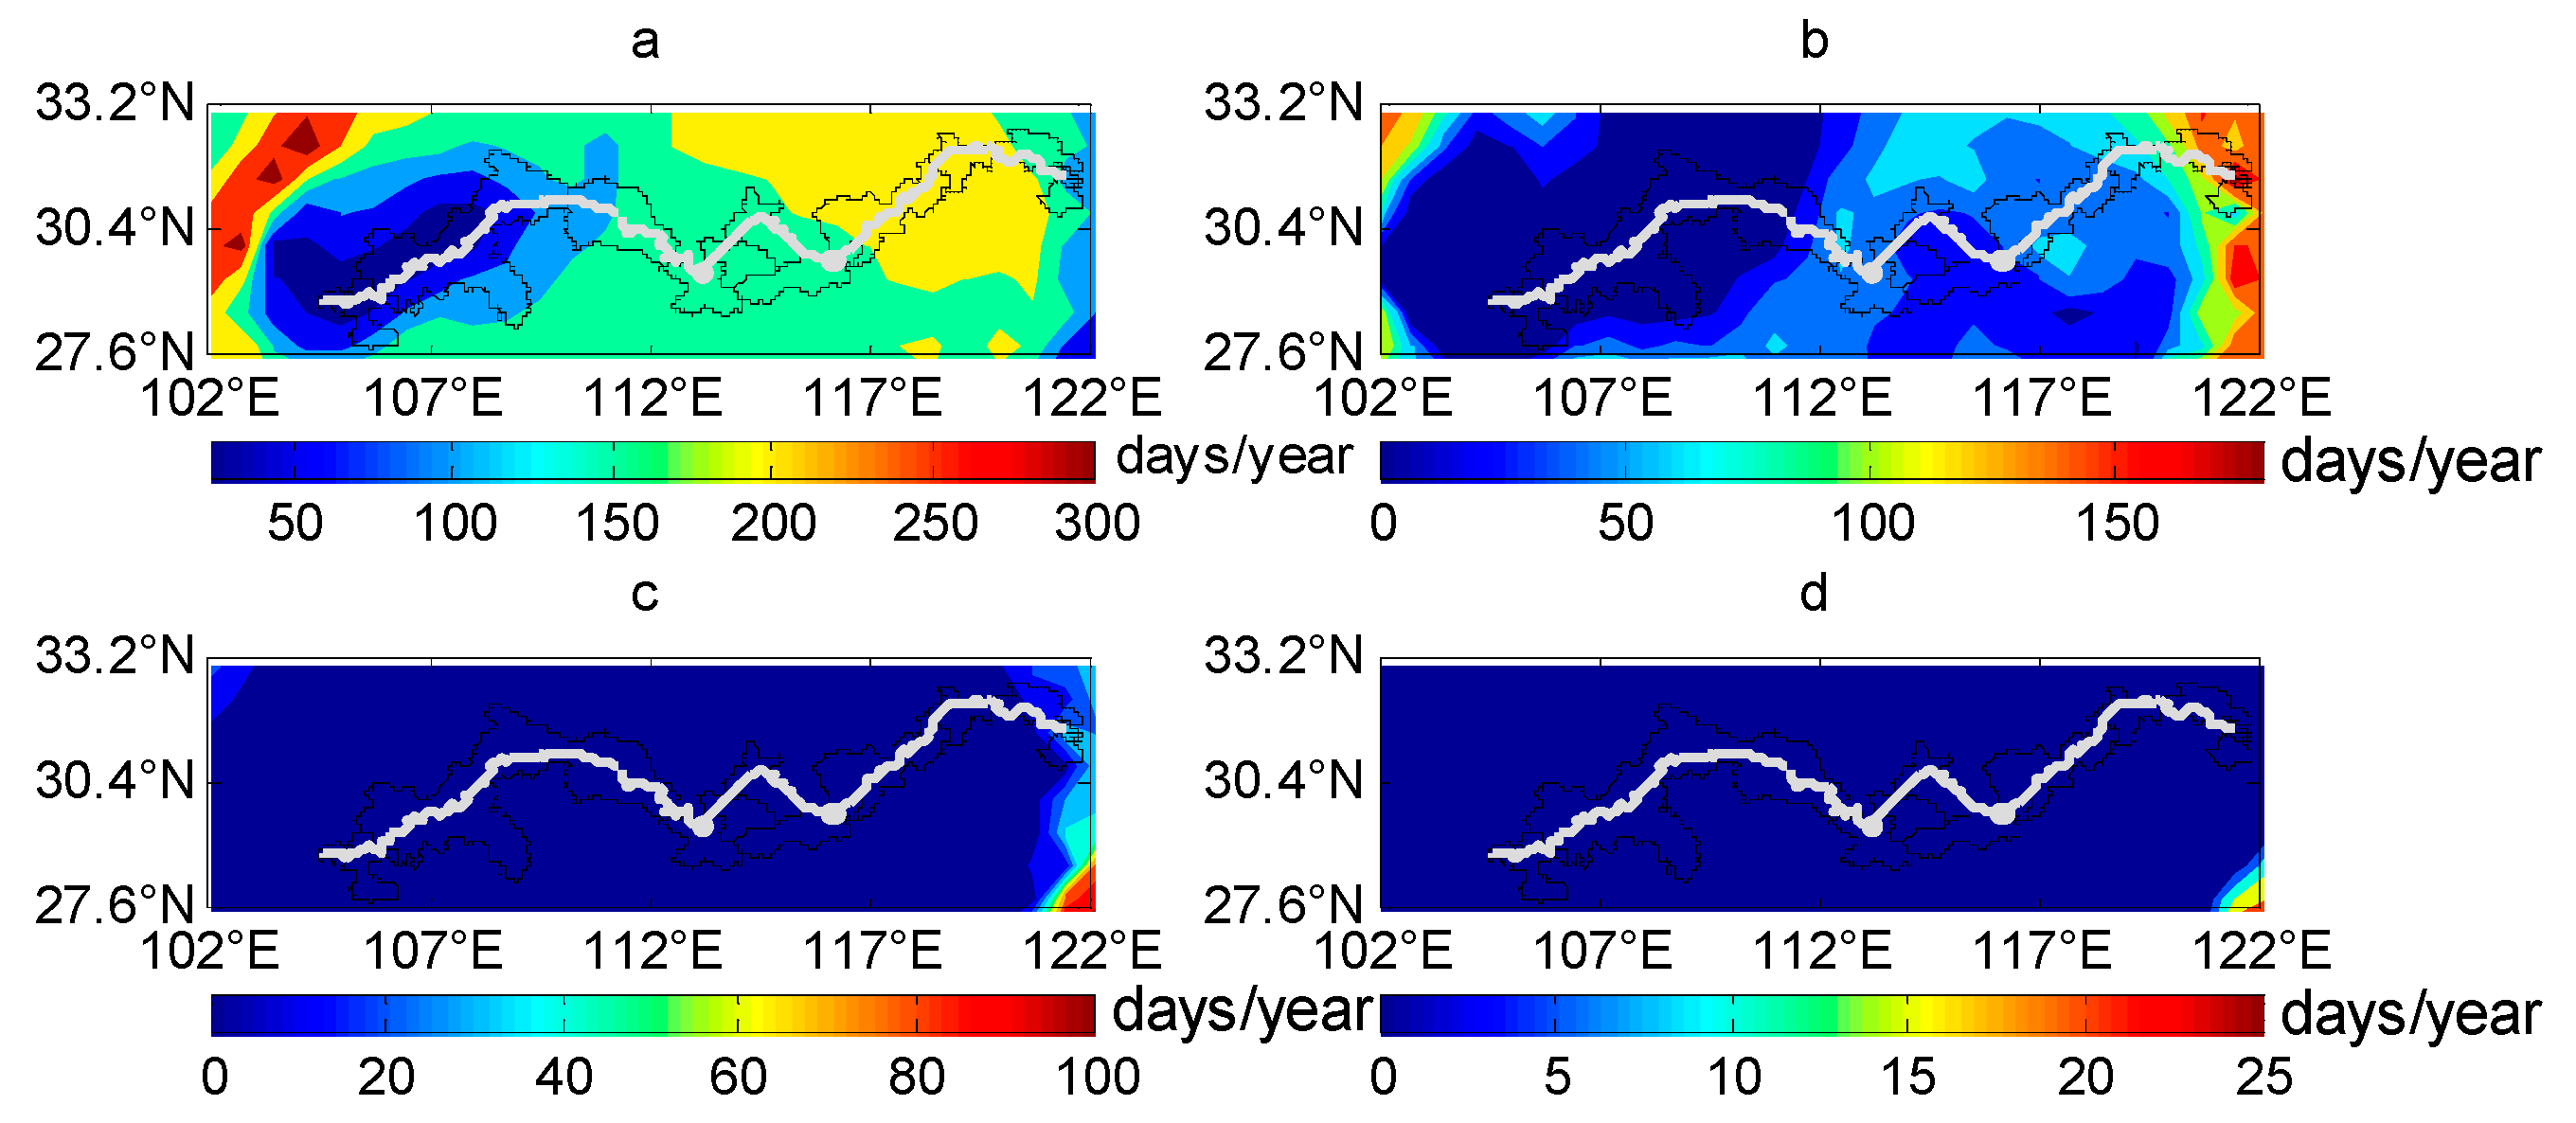
3.4. Wind Gust
Four thresholds (Table 2) have been considered in the wind speed analysis (Figure 8). The level 5 wind gusts along the northern segment of the entire YRIW are relatively frequent, especially in the sections of Sichuan, Jiangsu, Shanghai, Northern Anhui, and Eastern Hubei (6–10 days/year, gusts exceeding 10.8 m/s). Affected by coastal winds, the influence of level 6 wind gusts mostly occurred in Jiangsu and Shanghai sections (1–3 days/year, exceeding 13.8 m/s). Very extreme wind gust events (≥17.2 m/s) occur rarely on the YRIW.
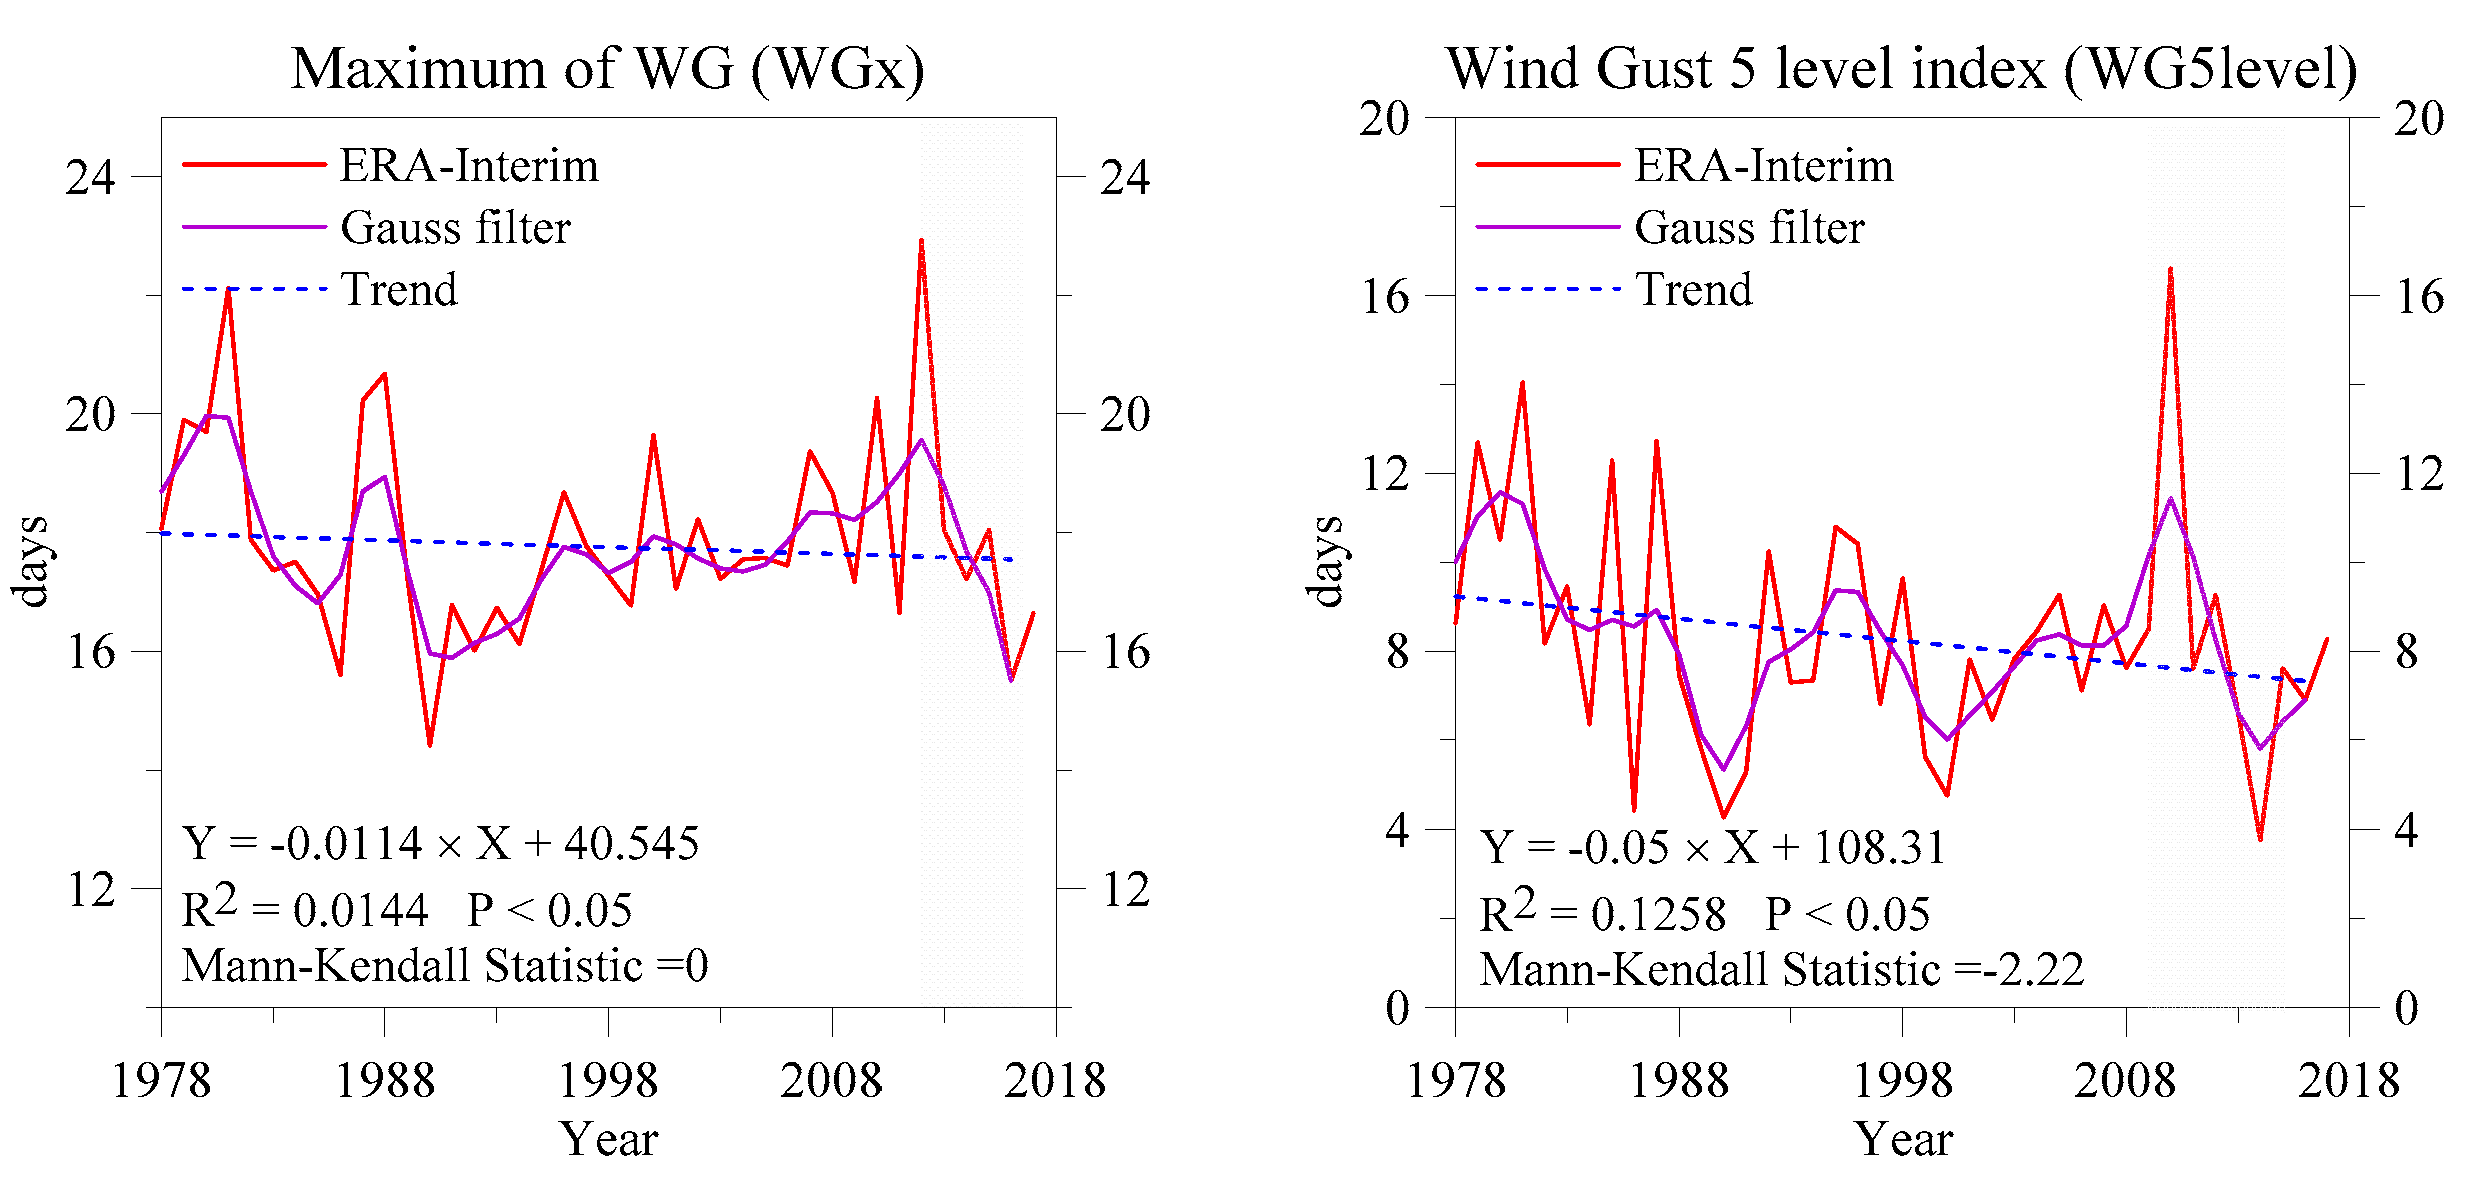
The maximum of WG (WGx) represent the maximum wind speed day of a year (Figure 9), the change of maximum wind speed in the past 39 years has not changed significantly, and the regressive model showed a slight downward trend (R2 = 0.1258). In 1991, the days of maximum wind speed reached the minimum value of 16 d, and then the wave-like growth reached a maximum value of 20 d in 2012, and began to decline after 2013. The Mann–Kendall test of WGx and WG5level did not show a statistically significant decrease over its entire record (p > 0.05). The wind gust five-level index (WG5level) counts the number of days with more than level 5 (10.8 m/s) of wind gusts, and the regressive model shows some dramatic fluctuations but slight downward trend (R2 = 0.0144) from 1979–2017, reaching maximum values (over 12 d) in 2010 and a minimum value of 6 d in 2014.
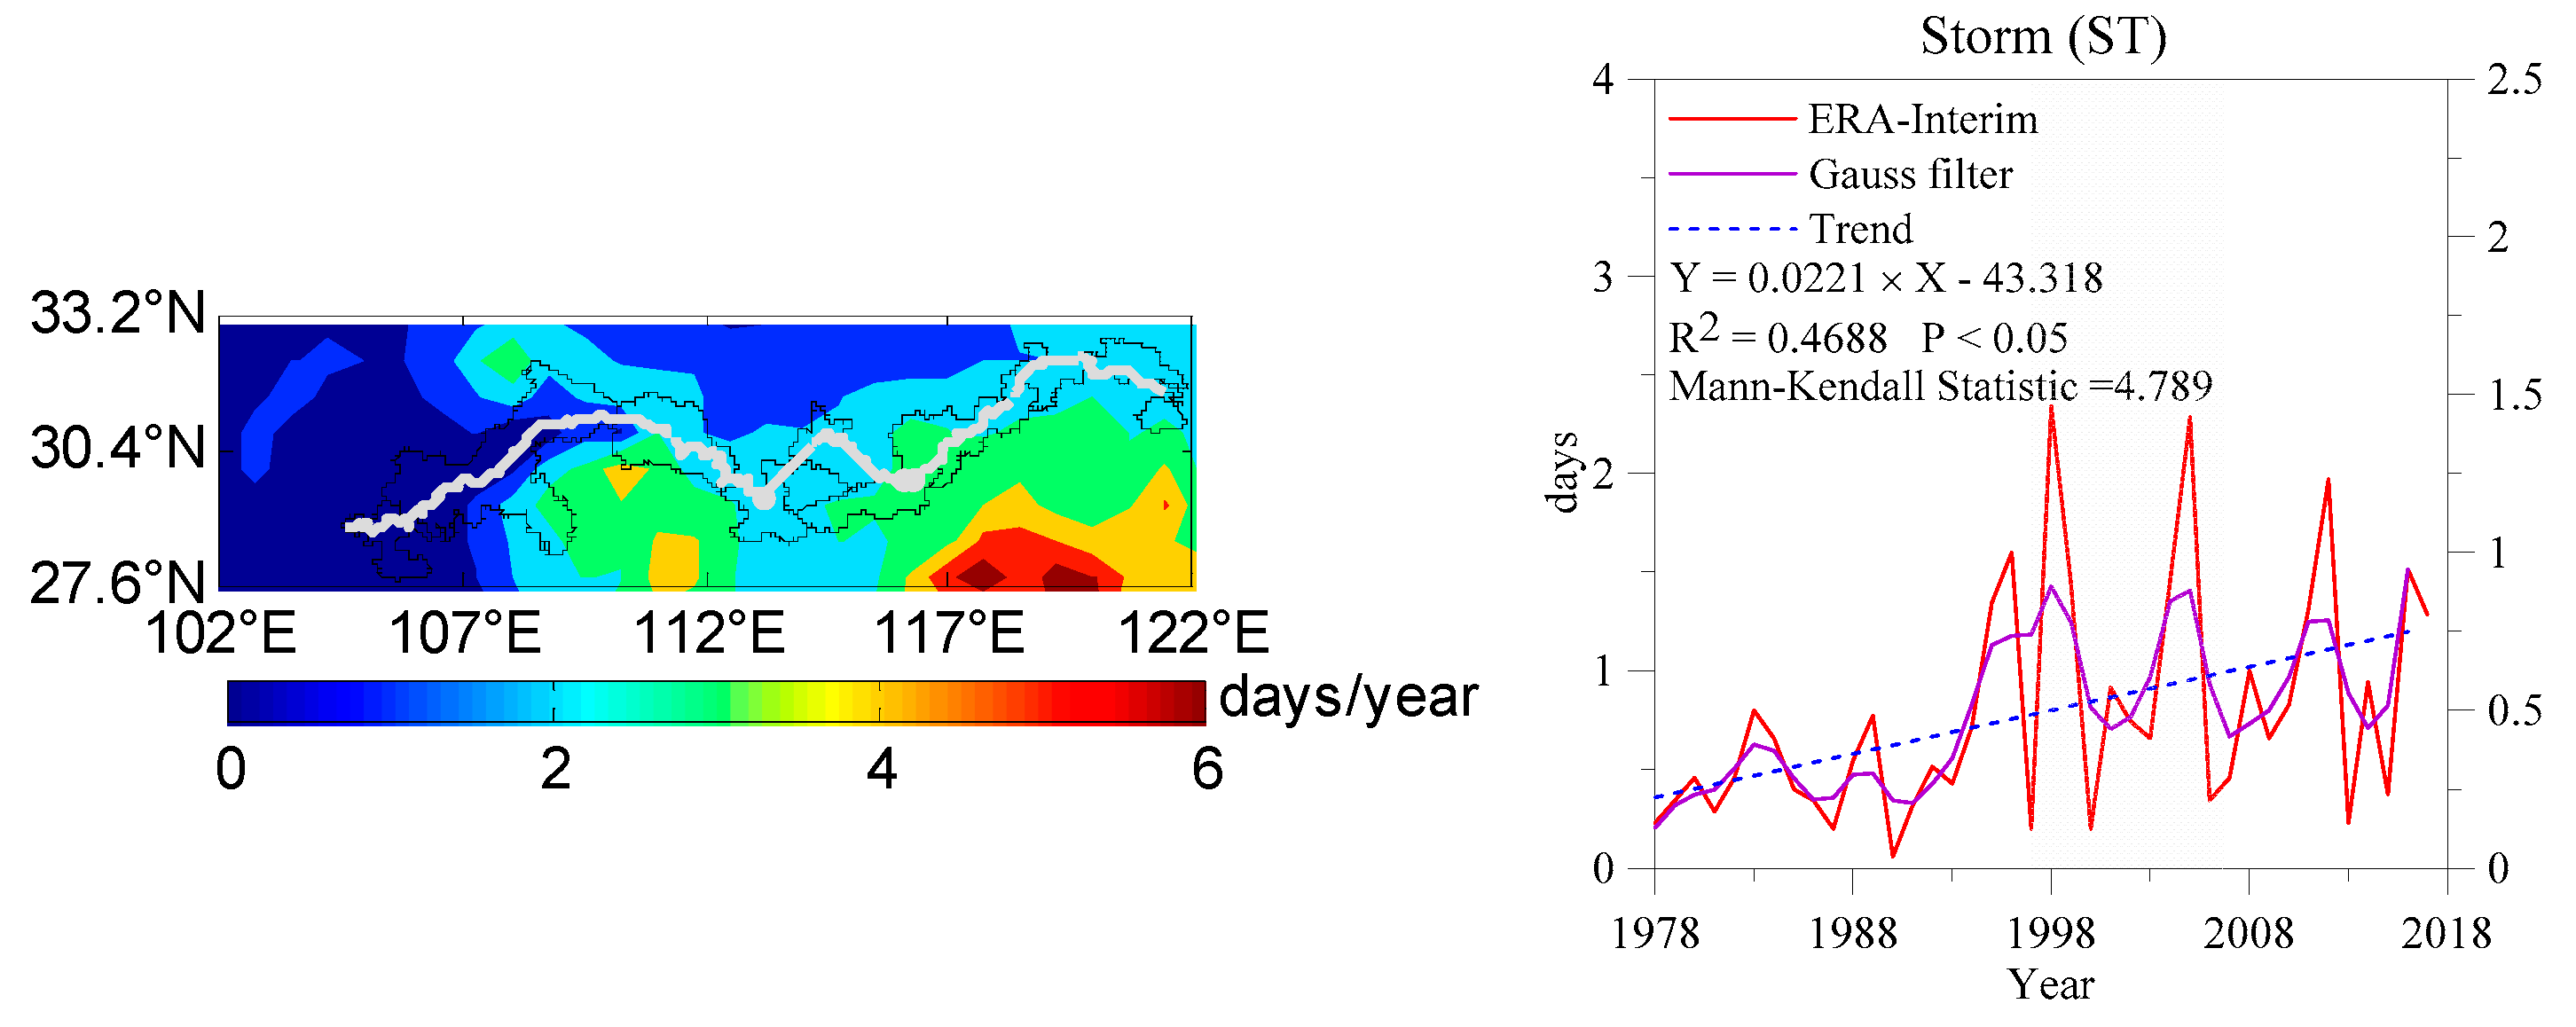
3.5. Storm
There is strong wind storm (R ≥ 100 mm/24 h; W ≥ 13.8 m/s) on the mainline of the YRIW every year, which are mainly concentrated on the YRIW upstream area around the Sichuan Basin (Figure 10). The storm (ST) counts the number of days with storm, show a significant upward trend (R2 = 0.4688) using the Mann–Kendall test (4.789) in the study area, and the changes of ST fluctuates dramatically. It was relatively large (over 2 d) in 1998, and reached a minimum value in 1990 (close to 0 d) (Figure 10).
3.6. Comprehensive Risk Assessment
Regarding the climatology of extreme weather, the YRIW must cope with a variety of extreme weather occurring with different intensity across the study area. Based on the frequency analyses of the extreme weather events listed in Figure 2, Figure 4, Figure 6, Figure 8, and Figure 10, the occurrence and type of severe extreme weather phenomena that affect the different regions can be delimited by season and annual scales (Figure 11 and Figure 12), thus providing a beneficial result for IWT risk assessment in the YRIW. From Shanghai to Jiangsu section, there are significant impacts of extreme weather on IWT where occur in spring, summer and winter. From Hubei to Chongqing section, there are significant impacts of extreme weather on IWT where occur in spring. From Chongqing to the Sichuan section, there are significant impacts of extreme weather on IWT that occur in autumn. Specifically, a comprehensive analysis of the extreme weather events and their impacts on the navigation environment was summarized on the YRIW during 1979–2017, with different climatic characteristics (Table 3).
4. Discussion and Conclusions
The impact of extreme weather events on the navigable environment of the YRIW has become a focus of research and attention in shipping, meteorology, transportation, and management science. Existing studies on the impacts of extreme weather events are divided into three categories: (1) the navigable water level of main rivers and lakes; (2) waterways, terminals, and ports; and (3) shipping economy, and management policies [42]. Although there are already a set of key indices of extreme climate events based on daily temperature and precipitation data, the application of these indices in the analysis centered on IWT is not targeted to reflecting various climatic aspects. Therefore, the newly introduced impact index relates variables to the observed impacts and damages in the IWT mode. Based on established threshold indicators, the IWT’s association with weather phenomena and its impact can be used to assess the navigable risk and the extreme consequences of infrastructure. The threshold indices provides valuable information to public safety agencies, allow the operators and transport service providers to manage related hazard risks, increase the cost-effectiveness and reliability of transport services, and plan for flexible IWT system.
In addition, analyze the mainline accidents caused by extreme weather events that affect the navigable environment, and we found that the frequency and intensity of the mainline navigation environment in the Yangtze River basin vary greatly due to extreme weather events. Specifically, (1) the sections located in plain climate zone is affected by extreme weather in every season, especially strong winds and heat waves; (2) the sections located in the hilly mountain climate zone is affected particularly by spring extreme phenomena, especially heat waves; (3) the sections located in the Sichuan Basin climate zone is dominated by the extreme weather phenomena in autumn, except cold waves; (4) the occurrence frequency of potential flood risk events is relatively high under rainstorm conditions and wind gusts almost affect the navigation environment of the Jiangsu and Shanghai sections in every year; (5) the heat wave indices (TXx, TR, and WSDI) tend to increase and the temperature of coldest day of a year gradually increases; and (6) the incidence of IWT accidents caused by extreme weather is: dry season > normal season > flood season, which needs to be paid attention by related departments.
Finally, we used available high-resolution datasets to assess quantified information on changing severe weather phenomena on a regional scale, ranked by average number of days per year with the total frequency of all extreme weather events in the whole region: heat wave > heavy rainfall > wind gust > cold spell > storm (Table 4). The frequency analysis and the comparison with local observations of weather events emphasize the relatively coarse spatiotemporal resolution of the data and its drawbacks to the reliability of certain parameters [43]. Even if the maximum temperature and precipitation data were corrected, the magnitude of the extremum was smooth compared with the station observations. Similarly, some features of gust data from reanalysis are not always consistent with observations. The results described well the large-scale spatial variations, but gusts due to small spatiotemporal scales at least partially increased the frequency of strong wind gusts and exceeded the frequency of reanalysis data. By increasing the resolution of reanalyzed datasets, gusts can be estimated more accurately, allowing a deeper understanding of small-scale effects and terrain-induced processes. The effects of heavy rainfall, extreme cold and heat, strong wind and heavy rain on IWT were studied. IWT’s policies and operations need to take into account the significant variabilities in the probability and intensity of these phenomena in the Yangtze region. The results of this study provide useful insights into improving the safety and efficiency of the shipping industry and can be further applied to a wider range of transport scenarios.
Ideally, a continuous response function between the intensity of weather phenomena and the consequences should be determined. However, the definition of a continuous response function requires a large amount of data, including meteorological information and consequences reports (e.g., crashes, delays, cost information) at different locations on the YRIW. The exposure and vulnerability of IWT are affected by transport policy, and socio-economic and technological development. To further expand the findings of this study, we will assess the probability and intensity of future IWT-related extreme weather events in the Yangtze River. Further analysis of meteorological and non-meteorological factors affecting the risk of each segment of YRIW can be carried out to determine the measures and options to optimize IWT management. For example, the threshold based on percentages contains built-in assumptions about the exposure and vulnerability of IWT systems. In addition, in the context of expected climate change, future extreme weather, and climate events are likely to continue to occur, and their potential impact on water transport systems may be negative or positive. This means that the challenges of disaster management and adaptation to climate change are enormous, including the need to innovate on old practices.
Author Contributions
Conceptualization, Y.W., L.L. and Y.L. Formal analysis, L.L. Methodology, Y.L. and L.L. Software, L.L. Supervision, Y.W. Validation, L.L., F.Z. and T.Y. Writing—original draft, Y.L. and L.L. Writing—review and editing, Y.W., Y.L., L.L. and F.Z.
Funding
This research was supported by the National Natural Science Foundation of China (grant no. 51709218, 51679180, and 41601184). This research has also been funded by the National Key R&D Program of China (grant no. 2018YFC1407405).
Acknowledgments
Thanks to the anonymous reviewers for their valuable comments and suggestions.
Conflicts of Interest
The authors declare no conflict of interest.
References
- Yang, S.; Milliman, J.; Li, P.; Xu, K. 50,000 Dams Later: Erosion of the Yangtze River and its Delta. Glob. Planet. Chang. 2011, 75, 14–20. [Google Scholar] [CrossRef]
- Wahby, W.S. The Three Gorges Dam of China: Technology to Bridge Two Centuries. J. Technol. Stud. 2003, 29, 19–25. [Google Scholar] [CrossRef]
- Liu, X.; Chen, J.; Maher, B.A.; Zhao, B.; Yue, W.; Sun, Q.; Chen, Z. Connection of the Proto-Yangtze River to the East China Sea Traced by Sediment Magnetic Properties. Geomorphology 2018, 303, 162–171. [Google Scholar] [CrossRef]
- Yang, D.; Wang, S. Analysis of the Development Potential of Bulk Shipping Network on the Yangtze River. Marit. Policy Manag. 2017, 44, 512–523. [Google Scholar] [CrossRef]
- Jonkeren, O.; Rietveld, P.; van Ommeren, J.; Te Linde, A. Climate Change and Economic Consequences for Inland Waterway Transport in Europe. Reg. Environ. Chang. 2014, 14, 953–965. [Google Scholar] [CrossRef]
- Pachauri, R.K.; Allen, M.R.; Barros, V.R.; Broome, J.; Cramer, W.; Christ, R.; Church, J.A.; Clarke, L.; Dahe, Q.; Dasgupta, P. Climate Change 2014: Synthesis Report; Contribution of Working Groups I, II and III to the Fifth Assessment Report of the Intergovernmental Panel on Climate Change; IPCC: Geneva, Switzerland, 2014. [Google Scholar]
- Peng, W.; Shuai, C.F.; Xin, X. Yangtze River: China’s Golden Waterway. Proc. Inst. Civil Eng. 2010, 163, 15. [Google Scholar] [CrossRef]
- Schweighofer, J. The Impact of Extreme Weather and Climate Change on Inland Waterway Transport. Nat. Hazards 2014, 72, 23–40. [Google Scholar] [CrossRef]
- Guan, Y.; Zhang, X.; Zheng, F.; Wang, B. Trends and Variability of Daily Temperature Extremes during 1960–2012 in the Yangtze River Basin, China. Glob. Planet. Chang. 2015, 124, 79–94. [Google Scholar] [CrossRef]
- Guan, Y.; Zheng, F.; Zhang, X.; Wang, B. Trends and Variability of Daily Precipitation and Extremes during 1960–2012 in the Yangtze River Basin, China. Int. J. Climatol. 2017, 37, 1282–1298. [Google Scholar] [CrossRef]
- Li, J.; Ding, T.; Jia, X.; Zhao, X. Analysis on the Extreme Heat Wave Over China Around Yangtze River Region in the Summer of 2013 and its Main Contributing Factors. Adv. Meteorol. 2015, 2015, 706713. [Google Scholar] [CrossRef]
- Pu, X.; Wang, T.; Huang, X.; Melas, D.; Zanis, P.; Papanastasiou, D.; Poupkou, A. Enhanced Surface Ozone during the Heat Wave of 2013 in Yangtze River Delta Region, China. Sci. Total Environ. 2017, 603, 807–816. [Google Scholar] [CrossRef]
- Yu, F.; Chen, Z.; Ren, X.; Yang, G. Analysis of Historical Floods on the Yangtze River, China: Characteristics and Explanations. Geomorphology 2009, 113, 210–216. [Google Scholar] [CrossRef]
- Niu, T.; Wang, J.; Yang, Y.; Liu, H.; Chen, M.; Liu, J. Development of a Meteorological and Hydrological Coupling Index for Droughts and Floods Along the Yangtze River Valley of China. Adv. Atmos. Sci. 2013, 30, 1653–1662. [Google Scholar] [CrossRef]
- Zhang, Z.; Chen, X.; Xu, C.; Hong, Y. Assessment of the Large-Scale Pattern of Precipitation in the Yangtze River Basin and its Possible Impact on Streamflow. In AGU Fall Meeting Abstracts; American Geophysical Union: Washington, DC, USA, 2011; Volume 43, p. 1328. [Google Scholar]
- Hong, X.; Guo, S.; Zhou, Y.; Xiong, L. Uncertainties in Assessing Hydrological Drought using Streamflow Drought Index for the Upper Yangtze River Basin. Stoch. Environ. Res. Risk Assess. 2015, 29, 1235–1247. [Google Scholar] [CrossRef]
- Tang, R.; Li, D.; Xiang, Y.; Xu, G.; Li, Y.; Chen, Y. Analysis of a Hailstorm Event in the Middle Yangtze River Basin using Ground Microwave Radiometers. Acta Meteorol. Sin. 2012, 70, 806–813. [Google Scholar]
- Chen, L.; Sun, N.; Zhou, C.; Zhou, J.; Zhou, Y.; Zhang, J.; Zhou, Q. Flood Forecasting Based on an Improved Extreme Learning Machine Model Combined with the Backtracking Search Optimization Algorithm. Water 2018, 10, 1362. [Google Scholar] [CrossRef]
- Vu, T.B.; Hammes, D. Dustbowls and High Water, the Economic Impact of Natural Disasters in China. Asia-Pac. J. Soc. Sci. 2010, 1, 122–132. [Google Scholar]
- Lung, T.; Lavalle, C.; Hiederer, R.; Dosio, A.; Bouwer, L.M. A Multi-Hazard Regional Level Impact Assessment for Europe Combining Indicators of Climatic and Non-Climatic Change. Glob. Environ. Chang. 2013, 23, 522–536. [Google Scholar] [CrossRef]
- Suo, X.; Fu, G.; Wang, C.; Jia, Q. An Application of 24Model to Analyse Capsizing of the Eastern Star Ferry. Pol. Marit. Res. 2017, 24, 116–122. [Google Scholar] [CrossRef] [Green Version]
- Abramo, G.; D’Angelo, C.A. A Farewell to the MNCS and Like Size-Independent Indicators. J. Informetr. 2016, 10, 646–651. [Google Scholar] [CrossRef]
- Zhang, Q.; Xu, C.; Zhang, Z.; Chen, Y.D.; Liu, C.; Lin, H. Spatial and Temporal Variability of Precipitation Maxima during 1960–2005 in the Yangtze River Basin and Possible Association with Large-Scale Circulation. J. Hydrol. 2008, 353, 215–227. [Google Scholar] [CrossRef]
- Zhang, D.; Yan, X.; Yang, Z.L.; Wall, A.; Wang, J. Incorporation of Formal Safety Assessment and Bayesian Network in Navigational Risk Estimation of the Yangtze River. Reliab. Eng. Syst. Saf. 2013, 118, 93–105. [Google Scholar] [CrossRef]
- Chowdhury, N.T. Water Management in Bangladesh: An Analytical Review. Water Policy 2010, 12, 32–51. [Google Scholar] [CrossRef]
- Petitta, M.; Calmanti, S.; Cucchi, M. The Extreme Climate Index: A Novel and Multi-Hazard Index for Extreme Weather Events. In EGU General Assembly Conference Abstracts; European Geosciences Union: Munich, Germany, 2017; Volume 19, p. 6761. [Google Scholar]
- Schär, C.; Ban, N.; Fischer, E.M.; Rajczak, J.; Schmidli, J.; Frei, C.; Giorgi, F.; Karl, T.R.; Kendon, E.J.; Tank, A.M.K. Percentile Indices for Assessing Changes in Heavy Precipitation Events. Clim. Chang. 2016, 137, 201–216. [Google Scholar] [CrossRef]
- Michaelides, S.; Leviäkangas, P.; Doll, C.; Heyndrickx, C. Foreward: EU-Funded Projects on Extreme and High-Impact Weather Challenging European Transport Systems. Nat. Hazards 2014, 72, 5–22. [Google Scholar] [CrossRef]
- Jolly, W.M.; Cochrane, M.A.; Freeborn, P.H.; Holden, Z.A.; Brown, T.J.; Williamson, G.J.; Bowman, D.M. Climate-Induced Variations in Global Wildfire Danger from 1979 to 2013. Nat. Commun. 2015, 6, 7537. [Google Scholar] [CrossRef]
- Nakayama, T.; Watanabe, M. Role of Flood Storage Ability of Lakes in the Changjiang River Catchment. Glob. Planet. Chang. 2008, 63, 9–22. [Google Scholar] [CrossRef]
- Wang, L.; Shao, Q.; Chen, X.; Li, Y.; Wang, D. Flood Changes during the Past 50 Years in Wujiang River, South China. Hydrol. Process. 2012, 26, 3561–3569. [Google Scholar] [CrossRef]
- Chinese Meteorological Administration. GBT 27962-2011 Graphical Symbols for Meteorological Disaster Warning Signal Icon; Chinese Meteorological Administration: Beijing, China, 2011.
- Zhang, F.; Gao, H.; Cui, X. Frequency of Extreme High Temperature Days in China, 1961–2003. Weather 2008, 63, 46–49. [Google Scholar] [CrossRef]
- Gille, J. High Water Impacts on Shipping and Ports. In Proceedings of the European Transport Conference 2012, Glasgow, UK, 8–10 October 2012; Association for European Transport (AET): Henley-in-Arden, UK; Transportation Research Board: Washington, DC, USA, 2012. [Google Scholar]
- Ding, Y. Summer Monsoon Rainfalls in China. J. Meteorol. Soc. Jpn. Ser. II 1992, 70, 373–396. [Google Scholar] [CrossRef] [Green Version]
- Donat, M.G.; Alexander, L.V.; Yang, H.; Durre, I.; Vose, R.; Caesar, J. Global Land-Based Datasets for Monitoring Climatic Extremes. Bull. Am. Meteorol. Soc. 2013, 94, 997–1006. [Google Scholar] [CrossRef] [Green Version]
- Xu, K.; Wu, C.; Hu, B.X. Projected Changes of Temperature Extremes Over Nine Major Basins in China Based on the CMIP5 Multimodel Ensembles. Stoch. Environ. Res. Risk Assess. 2019, 33, 321–339. [Google Scholar] [CrossRef]
- Berrisford, P.; Dee, D.; Poli, P.; Brugge, R.; Fielding, K.; Fuentes, M.; Kallberg, P.; Kobayashi, S.; Uppala, S.; Simmons, A. The ERA-Interim Archive, Version 2.0; European Centre for Medium-Range Weather Forecasts: Shinfield Park, UK, 2011. [Google Scholar]
- Zhou, C.; Wang, K. Contrasting Daytime and Nighttime Precipitation Variability between Observations and Eight Reanalysis Products from 1979 to 2014 in China. J. Clim. 2017, 30, 6443–6464. [Google Scholar] [CrossRef]
- Zhang, Q.; Liu, C.; Xu, C.; Xu, Y.; Jiang, T. Observed Trends of Annual Maximum Water Level and Streamflow during Past 130 Years in the Yangtze River Basin, China. J. Hydrol. 2006, 324, 255–265. [Google Scholar] [CrossRef]
- Wang, C.; Yang, K.; Li, Y.; Wu, D.; Bo, Y. Impacts of Spatiotemporal Anomalies of Tibetan Plateau Snow Cover on Summer Precipitation in Eastern China. J. Clim. 2017, 30, 885–903. [Google Scholar] [CrossRef]
- Li, J.; Notteboom, T.; Jacobs, W. China in Transition: Institutional Change at Work in Inland Waterway Transport on the Yangtze River. J. Transp. Geogr. 2014, 40, 17–28. [Google Scholar] [CrossRef]
- Teichmann, C.; Bülow, K.; Otto, J.; Pfeifer, S.; Rechid, D.; Sieck, K.; Jacob, D. Avoiding Extremes: Benefits of Staying Below 1.5 °C Compared to 2.0 °C and 3.0 °C Global Warming. Atmosphere 2018, 9, 11. [Google Scholar] [CrossRef]
Figure 1.
Map of the study area.
Figure 2.
Number of days with the Heavy rain ((a) slight risk, (b) middle risk, (c) high risk and (d) extreme risk) during the period 1979–2017 based on ERA-Interim Reanalysis data.
Figure 2.
Number of days with the Heavy rain ((a) slight risk, (b) middle risk, (c) high risk and (d) extreme risk) during the period 1979–2017 based on ERA-Interim Reanalysis data.
Figure 3.
Time series of area-averages Heavy rainfall indices (R × 5 day, R10 mm, PRCPTOT and CDD, and gray area indicates a more significant variability) during the period 1979–2017 based on GHCNDEX data.
Figure 3.
Time series of area-averages Heavy rainfall indices (R × 5 day, R10 mm, PRCPTOT and CDD, and gray area indicates a more significant variability) during the period 1979–2017 based on GHCNDEX data.
Figure 4.
Number of days with the heat wave ((a) slight risk, (b) middle risk, (c) high risk and (d) extreme risk) during the period 1979–2017 based on ERA-Interim Reanalysis data.
Figure 4.
Number of days with the heat wave ((a) slight risk, (b) middle risk, (c) high risk and (d) extreme risk) during the period 1979–2017 based on ERA-Interim Reanalysis data.
Figure 5.
Time series of area-averages heat wave indices (TXx, TR, and WSDI, and the gray area indicates a more significant variability) during the period 1979–2017 based on GHCNDEX data.
Figure 5.
Time series of area-averages heat wave indices (TXx, TR, and WSDI, and the gray area indicates a more significant variability) during the period 1979–2017 based on GHCNDEX data.
Figure 6.
Number of days with the cold spell ((a) slight risk, (b) middle risk, (c) high risk, and (d) extreme risk) during the period 1979–2017 based on ERA-Interim Reanalysis data.
Figure 6.
Number of days with the cold spell ((a) slight risk, (b) middle risk, (c) high risk, and (d) extreme risk) during the period 1979–2017 based on ERA-Interim Reanalysis data.

Figure 7.
Time series of area-averages cold spell indices (TNn, FD and CSDI, and the gray area indicates a more significant variability) during the period 1979–2017 based on GHCNDEX data.
Figure 7.
Time series of area-averages cold spell indices (TNn, FD and CSDI, and the gray area indicates a more significant variability) during the period 1979–2017 based on GHCNDEX data.
Figure 8.
Number of days with the wind gust ((a) slight risk, (b) middle risk, (c) high risk, and (d) extreme risk) during the period 1979–2017 based on ERA-Interim Reanalysis data.
Figure 8.
Number of days with the wind gust ((a) slight risk, (b) middle risk, (c) high risk, and (d) extreme risk) during the period 1979–2017 based on ERA-Interim Reanalysis data.

Figure 9.
Time series of area-averages wind gust indices (WGx and WG5level, and the gray area indicates a more significant variability) during the period 1979–2017 based on ERA-Interim Reanalysis data.
Figure 9.
Time series of area-averages wind gust indices (WGx and WG5level, and the gray area indicates a more significant variability) during the period 1979–2017 based on ERA-Interim Reanalysis data.

Figure 10.
Average number of days per year with the storm (the gray area indicates a more significant variability) during the period 1979–2017 based on ERA-Interim Reanalysis data.
Figure 10.
Average number of days per year with the storm (the gray area indicates a more significant variability) during the period 1979–2017 based on ERA-Interim Reanalysis data.
Figure 11.
The seasonal frequency of severe climate regions based on the changes in multiple spatial variations in extreme weather phenomena affecting the YRIW.
Figure 11.
The seasonal frequency of severe climate regions based on the changes in multiple spatial variations in extreme weather phenomena affecting the YRIW.

Figure 12.
The total annual frequency of severe climate regions based on the changes in multiple spatial variations in extreme weather phenomena affecting the YRIW.
Figure 12.
The total annual frequency of severe climate regions based on the changes in multiple spatial variations in extreme weather phenomena affecting the YRIW.


Table 1.
Categories of shipping accidents during 2004–2016.
| Accident Categories | Accident Categories Occurrences | |||
|---|---|---|---|---|
| Dry Season | Flood Season | Normal Season | Annual | |
| Human accident | 129 | 167 | 257 | 553 |
| Wind gust | 7 | 5 | 4 | 16 |
| Heavy fog | 17 | 4 | 12 | 33 |
| Miscellaneous | 2 | 8 | 4 | 14 |
| Floods | 0 | 1 | 1 | 2 |
| Percentage of environmental factors | 15.48 | 5.41 | 6.12 | 8.25 |
Table 2.
The impact thresholds for different weather phenomena.
| Phenomena | Thresholds | References | |||
|---|---|---|---|---|---|
| Slight risk | Middle risk | High risk | Extreme risk | ||
| Heavy rainfall | R ≥ 10 mm/24 h | R ≥ 25 mm/24 h | R ≥ 50 mm/24 h | ≥100 mm/24 h | [30] |
| Cold spell | T ≤ 10 °C | T ≤ 0 °C | T ≤ −7 °C | T ≤ −20 °C | [31,32] |
| Heat wave | Tmax ≥ 25 °C | Tmax ≥ 35 °C | Tmax ≥ 39 °C | Tmax ≥ 43 °C | [32,33] |
| Wind gust | W ≥ 8.0 m/s | W ≥ 10.8 m/s | W ≥ 13.8 m/s | W ≥ 17.2 m/s | [34] |
| Storm | R ≥ 100 mm/24 h; W ≥ 13.8 m/s | [35] | |||
Table 3.
Characterizations of climate regions based on the analysis of spatial variation in extreme weather affecting transportation.
Table 3.
Characterizations of climate regions based on the analysis of spatial variation in extreme weather affecting transportation.
| Region | Typical/Characteristic Phenomena/Features | Extreme Weather Affecting IWT |
|---|---|---|
| The plain climate zone | The frequency of high temperatures is higher over the downstream of the IWT (18–22 days/year, Tmax ≥ 37 °C), while high wind gusts are more common over the Shanghai and Jiangsu sections (15 cases with W ≥ 17.2 m/s) and areas with sporadically heavy rainfall (R ≥ 100 mm/24 h). The frequency of cold spells is the lowest within the plain climate zone and level of preparedness is low. | Region is affected by extreme weather in every season, especially strong winds and heat wave. |
| The hilly mountain climate zone | Characterized by the highest frequency of heat waves in Chongqing and Hubei western sections (22–27 days/year, Tmax ≥ 37 °C). Less than 6 days/year with WG ≤ 10.8 m/s; only few days with very heavy rainfall (R ≥ 100 mm/24 h). Due to the low frequency of extreme winter events, most of the affected cities have a reduced level of preparedness for winter phenomena. | Region is affected particularly by spring extreme phenomena, especially heat wave. |
| The Sichuan Basin climate zone | The frequency of heat wave, heavy rainfall and storm is the highest in YRIW (15 days/year with Tmax ≥ 43 °C in Sichuan and Chongqing sections). Extremely heavy rainfall locally over 1–5 cases/year as well as storms especially over 70 cases during 1979–2017. Although frost days and snowfalls may occur on an annual basis, extreme winter events are uncharacteristic. | Dominated by the extreme weather phenomena in autumn, except the cold wave. |
Table 4.
Characterizations of extreme weather affecting transportation based on the analysis of ETCCDI on the Yangtze River scale.
Table 4.
Characterizations of extreme weather affecting transportation based on the analysis of ETCCDI on the Yangtze River scale.
| Extreme Weather | Typical/Characteristic Phenomena/Features of ETCCDI | Affecting IWT | Regional Affecting Frequency (days/year) | Rank |
|---|---|---|---|---|
| Heavy rainfall | The frequency and intensity of flood/drought on the mainline of the Yangtze River have increased significantly. | The main impact and deserve the greatest attention | 229 | 2 |
| Cold spell | The extreme cold events have increased. The cold spell duration is on the decline because of global warming. | The effect of continued increase and the weather must focus | 35 | 4 |
| Heat wave | The extreme hot events are on the decline and the heat wave duration are on the rise. | The greatest impact and should receive the wide attention. | 244 | 1 |
| Wind gust | The extreme wind speed events have decreased slightly but the wind gust frequency above level 5 has increased. | Continuous impact and the weather needs focus. | 129 | 3 |
| Storm | The storm events show an upward trend. | Lower impact but still need attention. | 29 | 5 |
© 2019 by the authors. Licensee MDPI, Basel, Switzerland. This article is an open access article distributed under the terms and conditions of the Creative Commons Attribution (CC BY) license (http://creativecommons.org/licenses/by/4.0/).
Share and Cite
MDPI and ACS Style
Liu, L.; Wen, Y.; Liang, Y.; Zhang, F.; Yang, T. Extreme Weather Impacts on Inland Waterways Transport of Yangtze River. Atmosphere 2019, 10, 133. https://doi.org/10.3390/atmos10030133
AMA Style
Liu L, Wen Y, Liang Y, Zhang F, Yang T. Extreme Weather Impacts on Inland Waterways Transport of Yangtze River. Atmosphere. 2019; 10(3):133. https://doi.org/10.3390/atmos10030133
Chicago/Turabian StyleLiu, Lijun, Yuanqiao Wen, Youjia Liang, Fan Zhang, and Tiantian Yang. 2019. "Extreme Weather Impacts on Inland Waterways Transport of Yangtze River" Atmosphere 10, no. 3: 133. https://doi.org/10.3390/atmos10030133
Note that from the first issue of 2016, this journal uses article numbers instead of page numbers. See further details here.