Effect of Vertical Air Motion on Disdrometer Derived Z-R Coefficients


1
The Cyprus Institute, Nicosia 2121, Cyprus
2
Southeastern Universities Research Association, Kennedy Space Center, Merritt Island, FL 32899, USA
3
Department of Electrical Engineering and Information Technologies, Cyprus University of Technology, Limassol 3036, Cyprus
*
Author to whom correspondence should be addressed.
Atmosphere 2019, 10(2), 77; https://doi.org/10.3390/atmos10020077
Submission received: 29 December 2018
/
Revised: 28 January 2019
/
Accepted: 12 February 2019
/
Published: 14 February 2019
Abstract
:For synoptic-scale motions the vertical velocity component is typically of the order of a few centimeters per second. In general, the vertical velocity is not measured directly but must be inferred from other meteorological fields that are measured directly. In the present study, a Joss–Waldvogel disdrometer was used in order to establish the drop size distributions (DSD) at Athalassa, Cyprus. Data from a radiosonde station co-located with the disdrometer were also collected which were subsequently used to derive estimates of vertical velocities. Meteorological fields, including vertical velocities, were extracted from an atmospheric reanalysis, for an area centered over the disdrometer and radiosonde station instrumentation. The disdrometer data were used to determine the Z-R disdrometer derived coefficients, A and b, where Z = A Rb. To model the vertical air effect on the Z-R disdrometer derived coefficients an idealistic notion of flux conservation of the DSD is adopted. This adjusted DSD (FCM-DSD) is based on the exponential DSD and is modified by the relationship between drop terminal velocity (D) and vertical air speed . The FCM-DSD has a similar appearance to the popular gamma DSD for < 0. A clear segregation is seen in the A-w plane for both data and model. The data points are also clearly segregated in the b- plane, but the model points are on opposite sides of the = 0 line. It is also demonstrated that vertical velocities can be extracted from radiosonde data if initial balloon volume is accurately measured, along with an accurate measurement of the mass of the complete radiosonde-balloon system. To accomplish this, vertical velocities from radiosonde data were compared to reanalysis vertical velocity fields. The resulting values of initial balloon volume are found to be within the range of measured values.
1. Introduction
One meteorological variable which has a profound effect on the weather is the vertical velocity of the atmospheric air (hereafter denoted by in m s−1) [1,2,3]. Through sustained vertical motions, rising moist air cools adiabatically forming precipitating cloud [4], sometimes accompanied with more notable phenomena, like lightning and thunder [1]. Rising motions can lead to a steeper environmental temperature lapse rate [5] and strengthening of cyclonic systems [1,3]. On the contrary, descending air is heated by diabatic compression leading to cloud dissipation, damping of precipitation, clearer skies, and finer weather.
Bearing in mind the importance of vertical motions in the atmosphere, this study presents the methodology and results of an attempt to deduce information about the character of the vertical air motion adopting a methodology that combines measurements from three data sources: a Joss–Waldvogel disdrometer, radiosonde measurements, and fields from an atmospheric reanalysis.
For scales of motion in the Earth’s atmosphere with horizontal dimensions exceeding 100 km, the (horizontal) length scale significantly exceeds the depth (vertical) scale; most importantly and in connection to the focus of this paper, typical magnitudes of the horizontal velocity component exceed those of the vertical velocity component by several orders of magnitude [1,2], except in very strong convection currents where horizontal and vertical velocities attain comparable values (see [2]).
Typical large-scale vertical motions in the atmosphere are of the order of 0.01–0.1 m s−1. However, for highly unstable environments, the vertical velocity can reach values in excess of 70 m s−1 [2]. Such motions are extremely difficult to measure directly with sufficient accuracy. The existing worldwide network of radiosonde stations, which operates under the coordination of the World Meteorological Organization, does not incorporate vertical motions in its routinely observable and reported atmospheric variables, but the horizontal wind velocity is routinely reported; typical observational errors for wind measurements are of the order of 1 m s−1 [6]. Since the vertical motions are so important both in atmospheric research and in operational weather forecasting, quantitative estimates of vertical velocity must be inferred from quantities that can be directly measured with sufficient accuracy; the methodology adopted herein is explained below (Section 2.2 and Section 2.3).
Of all the instruments that use telemetry signals to collect upper-air data, radiosondes continue to be the basic platform for such observations. Most radiosondes in use today measure basic variables, such as temperature, pressure, and humidity. These measurements are carried out by sensors mounted in a package which also contains a radio-frequency transmitter [7].
The use of radiosondes as atmospheric probing systems dates before the satellite observing era. Radiosondes comprise an essential component of the global atmospheric observing system since the mid-20th century [8]. They constitute a systematic global-wise basic system providing meteorological information on the vertical profile of the atmosphere, from the Earth’s surface to several kilometers upwards. They are carried out at predefined times in a coordinated international effort of routinely collecting data which are subsequently used both for operational applications but also for research.
Horizontal wind profiles from radiosondes are derived from tracking the displacement of the balloon carrying the sonde (i.e., the probe that incorporates the sensors used to probe the meteorological variables), as a function of time. Modern balloons routinely used by most meteorological services are made of rubber or synthetic latex which expand as they ascend and lift the radiosonde commonly to heights between 20 and 26 km above the Earth’s surface, before bursting. The weight of the balloon depends largely on the size (volume) of the balloon, which is related to the speed of the flight. The mass of these balloons is usually between 0.2 and 0.5 kg.
The radiosonde can be tracked using a number of tracking techniques (such as a radar, radiotheodolite, and registering the navigational signals transmitted by the radiosonde). With the advent of modern space technologies though, most of these systems have been replaced by more accurate GPS (Global Positioning System) satellite tracking systems. An additional advantage of modern GPS-based technologies is that they allow a temporal resolution of the rate of ascent of the balloons. In the present research the rate of ascent is two seconds.
The estimation of sufficiently accurate vertical velocity fields is a long-standing issue [4]. Two widely known approaches for inferring the vertical motion field from other atmospheric variables are the kinematic method (based on the equation of continuity) and the adiabatic method (based on the thermodynamic energy equation) [4]. These two approaches have traditionally been adopted in a wide spectrum of meteorological applications where the vertical velocity is a core parameter. On the one hand, the kinematic method is quite sensitive to small inaccuracies in the horizontal velocity field. On the other hand, a disadvantage of the adiabatic method is that the local rate of change of temperature is required which is generally difficult to determine accurately over a large area; the adiabatic method is also rather inaccurate in situations where strong diabatic heating is present, such as storms in which heavy rainfall occurs over a large area [3].
Despite their deficiencies, both methods are widely applied adopting an isobaric coordinate system, (i.e., a coordinate system in which the vertical coordinate is atmospheric pressure instead of geometric height) so that ω = dp/dt is inferred rather than = dz/dt (p denotes atmospheric pressure, z the geometric height above the earth’s surface, and t is time). In an isobaric coordinate system where as explained above pressure replaces height as the vertical coordinate, the pressure tendency, namely ω, plays the role of vertical velocity = dz/dt in the Cartesian coordinate system; hence, ω = dp/dt is often referred to as the ω-vertical velocity following the motion.
Most commonly, vertical velocities available in data repositories of atmospheric variables are given in terms of ω. For example, vertical velocities in the ERA-Interim database (employed hereafter) maintained by the European Centre for Medium Range Forecasts (ECMWF) are given as pressure tendencies, ω = dp/dt. Nevertheless, as shown later in this paper, converting from ω-velocity to -velocity is feasible.
An alternative approach for estimating ω fields in the atmosphere, based on the so-called omega equation [3], that is free from the difficulties inherent in the above mentioned kinematic and adiabatic methods may be adopted. Nevertheless, this approach is also not free from deficiencies, despite its wide utilization [9].
The problem of direct observability of vertical velocities in the atmosphere is quite difficult and despite efforts to establish suitable directly observing systems, the problem is far from reaching a globally satisfactory level of coverage. On the one hand, lidar, sodar and wind profiling radar are capable of measuring vertical velocities (e.g., [10,11]), but only under conditions of presence of cloud droplets or ice crystals or aerosol particles, whereas under clear air conditions, no vertical velocities can be determined [12]. Hence, both lidars and cloud radars are practically used to derive information about particle velocities. On the other hand, wind profilers can measure vertical velocities in clear air [13]. However, although they have been explored for this purpose [14], their global-scale distribution is still very limited. Instruments like the above that can be used to observe directly vertical velocities of the air, are still under exploration mostly in campaign experiments [12].
SODAR (SOnic Detection And Ranging) comprise another technique that is used to measure wind speed at various heights above the ground; this wind profiler is based on the scattering of sound waves by atmospheric turbulence. SODAR has also been around for several decades [15].
The application of proxy techniques in estimating vertical velocities is also under investigation. For example, trace gas observations from satellite remote sensing instruments are compared to modeled trace gas distributions [16].
In any case, no global observing network for vertical velocities of the atmospheric air is in place and it is not foreseen to be established any time soon. This gap leaves ample room for further research focusing on the vertical velocity issue. The continual scientific interest in the determination of the vertical velocity fields is reflected in recent studies, such the one by Stepanyuk [17] where the authors present a comparison between ω derived from the ERA-Interim database (discussed immediately below) and values of ω derived from the generalized omega relationship.
Reanalyses of meteorological fields comprising long-term data sets with high spatiotemporal resolution are suitable for climate studies (e.g., [18]); the production of homogeneous data sets is at the core of such endeavors. However, comparing five reanalyses, Iwasaki et al. [19] noted important differences, even in zonally averaged vertical velocities. Nevertheless, it is worth noting that several aspects in the latest generation reanalyses have been enhanced [20]. Despite the improvements, vertical velocities in reanalyses still suffer from inaccuracies, especially in relation to particular applications [18].
Employing disdrometer DSD data to estimate the vertical air velocity has been approached in different ways, depending on the nature of the disdrometer. The method discussed in this current work is based on a procedure presented in previous work [21], using impact disdrometer data. In this case, the disdrometer extracted A-b coefficients, where Z = ARb, seem to be influenced by the magnitude of and especially the sign. In a more recent work, Kim and Song [22] have compared measured by a three-axis ultrasonic anemometer and by a collocated laser disdrometer. The considered by Kim and Song [22] is not the same considered by Lane et al. [21] and in this current paper. In the present work, is an average value from the surface to a reference height of zref = 10 km. In the work by Kim and Song [22], is the value measured at the surface. On a flat surface, should be zero, but because Kim and Song studied areas near mountain slopes, the vertical component of air motion at the surface can be non-zero.
The aim of the present research comprises an attempt to deduce information about the character of the vertical air motion from the disdrometer data. In this respect, the results of combining measurements from a Joss–Waldvogel disdrometer, radiosonde measurements and fields from atmospheric reanalysis are presented and discussed. The present paper aspires to contribute towards the better understanding of the long-standing vertical velocity estimation issue through the combined interplay of these three sources of data.
Section 2 presents the data used in this analysis together with the preprocessing approaches adopted. The methodology adopted is outlined in Section 3, whereas, the research outcomes are presented in Section 4 and discussed in Section 5. The paper concludes with Section 6. A list with the abbreviations and symbols used in this paper is given in Appendix A.
2. Data and Their Preprocessing
In this study, three different sources were used: disdrometer data, co-located radiosonde data, and data from the European Centre for Medium Range Forecasts (ECMWF). These data sources are discussed in the following together with the preprocessing procedures adopted in order to formulate them for further use in this research.
This study sets the theoretical foundations in reaching the aim of this research and only a limited number of cases were investigated. Eleven days in the period 2011–2014 were selected to showcase the aim of this research. The dates selected are the same used in a previous study by Lane et al. [21] and are shown in Table 1 of the present paper. In searching for candidate dates, the authors have tried to balance the updraft and downdraft cases and a variety of DSD types was also pursued. The relation to stratiform—convective precipitation was described in the paper by Lane et al. [21] in which all vertical speeds were simulated values and parameter fits. In the current work, matching ERA-Interim reanalysis data was used to get vertical velocity data, together with collocated radiosonde data.
2.1. Disdrometer Data
The disdrometer data were recorded by using a Joss–Waldvogel impact disdrometer located on the roof of a building at Athalassa, Cyprus (35.15° N, 33.40°, 161.0 m above Mean Sea Level, MSL). The impact sensor on the instrument produces an electrical impulse of size dependent on the momentum of the drop falling on the sense surface, and it is calibrated by the manufacturer to convert impulse size to drop diameter. The Joss–Waldvogel impact disdrometer is able to record drop diameters from 0.3 mm to 5.5 mm in 10-second intervals, thereby allowing for the establishment of the drop size distribution (DSD) representing this range of drop sizes [23,24]. As long as the manufacturer’s calibration certificate has not expired, the data is considered to be reliable.
2.2. Radiosonde Data
The data from the radiosonde station at Athalassa (next to the disdrometer) are collected for each of the days in the study. The equipment used is a Vaisala DigiCora® Sounding System MW41 which is GPS-based. The data are automatically collected by the ground station and are registered for every two seconds, as the radiosonde ascends freely in the atmosphere. A sample of a file containing radiosonde data is given in Appendix B. These data consist of the pressure (p), geopotential height (, in geopotential meters, gpm), temperature (T, in °C), relative humidity (RH, in %), Dew-point temperature depression (i.e., the difference between temperature and dew-point temperature, in °C), virtual temperature (in °C), temperature lapse rate (in °C km−1), and balloon ascent rate ( in m s−1).
Vertical air motion is deduced from the radiosonde data by comparing its GPS-based ascent velocity to the theoretical ascent velocity of a balloon in still air. Wang et al. [25] developed a procedure which results in Equation (1), yielding a calculated balloon still air ascent velocity,
is the initial balloon volume at the surface before release, is the air density at the surface, is air density as a function of height, is the mass of the complete radiosonde-balloon system ( = 0.9 kg, for the radiosonde system considered in this work), and is the global average of the acceleration due to gravity at MSL. The radiosonde reports several variables during its ascent as a function of time, which can easily be transformed into a function of height. Air density is neither measured by the radiosonde sensors nor reported in the radiosonde data file; however, density can be calculated from the variables that are being reported in the radiosonde data file, as explained immediately below.
From the ideal gas law, air density can be expressed as a function of pressure (p), temperature (T in K) and the gas constant for moist air ()
where, is defined by
with Rd (287.058 J kg−1 K−1) and Rv (461.5 J kg−1 K−1), denoting the gas constants for dry air and water vapor, respectively; q denotes the specific humidity (in kg kg−1). In the radiosonde data, however, specific humidity is not reported; instead the relative humidity (i.e., RH) is reported. To convert from relative humidity to specific humidity, we use the following relationship which is based on the Clausius–Clapeyron equation
where, T0 is a reference temperature (typically taken to be 273.16 K). Hence, specific humidity is
These values provide the preprocessing needed to compute Reynold’s number , coefficient of drag , and calculated still air vertical ascent speed . These three values are coupled and require a numerical algorithm to compute, as discussed below.
Ultimately, Equation (1) is defined for our needs as a function of height z and it should work for any planet with an atmosphere. If there is no atmosphere, Equation (1) fails to predict anything useful, since it is really the solution to a buoyancy problem such that > .
Equation (1) seems straightforward, but there is one problem: the coefficient of drag is a function of Reynold’s number, which is a function of . Wang et al. [25] take an easy way out and define to be a constant during the entire ascent. The value they use is in the range of 0.4 to 0.5. Sóbester et al. [26] go one step further and define to be a simplified function of Reynold’s number
where, = 0.425, = 0.225, = 329600, and = 365900. This improvement comes at a cost, since is a function of and
where, ρ and are from Equation (1), is the balloon diameter (which can be calculated directly from balloon volume V), and μ is the dynamic viscosity of the air (in kg m−1·s−1) given by the formula
where, the constants are: = 1.862 × 10⁻⁷ and β = 0.8062.
Equations (1), (6), and (7) represent a coupled set of equations that must be solved iteratively. A simple recursive solution to the above set of equations is to define an error which is then used to recursively find a solution to , , and . The iterative algorithm to find a solution starts by calculating from , using Equation (6). Next, is calculated using and Equation (1). An error is calculated which is then used to update
where, γ is the recursion gain factor set equal to 0.4 in this work. Equations (9) and (10) are computed N times with an initial guess for = 105. After N = 100 iterations, the value of drops to < 10−4 percent for all cases tried, resulting in the convergence of vertical speed at radiosonde sample time.
2.3. ECMWF ERA-Interim Reanalysis Data
In this paper, the ERA-Interim reanalysis dataset was utilized. The data is provided by the European Centre for Medium-Range Weather Forecasts (ECMWF) via its internet portal and it will be shown below how the meteorological fields retrieved are used in this work to estimate the vertical velocity, denoted by (in m s−1).
ERA-Interim is a global atmospheric reanalysis from 1979, continuously updated in real time. The ERA-Interim atmospheric model and reanalysis system uses cycle 31r2 of ECMWF’s Integrated Forecast System (IFS) [27]. The ERA-Interim reanalysis is described by Dee et al. (2011).
The ERA-Interim analyses produced and distributed by ECMWF, refer to an atmospheric model based on a hybrid vertical coordinate system [27,28]. Such a hybrid system consists of a terrain following coordinate σ = p/ps near the surface (where, p is pressure and ps is the surface pressure), but with a gradual transition to a pressure coordinate with height. In addition, archived ERA-Interim products comprise reanalysis fields from the atmospheric model evaluated on standard pressure levels; this latter form of data have been retrieved from ECMWF’s portal and are subsequently utilized in the present work.
The retrieved data refer to the finest grid available for the ERA-Interim, namely 0.125° × 0.125° (which over Cyprus corresponds to a grid with approximate distances along latitude and longitude of 13.9 km and 11.4 km, respectively). The data cover the area from 30 to 40° N and from 30 to 40° E. In the vertical, data for the 23 standard pressure levels in the range from 1000 to 200 hPa.
For the needs of the study here, a 1° × 1° sub-area centered at the disdrometer site at Athalassa has been considered, as shown in Figure 1. This area is bounded by meridians 33.0° E and 34.0° E and by latitude circles 34.6° N and 35.6° N. Because of the 0.125° × 0.125° ECMWF grid spacing, the sub-area that is extracted from the dataset needs to be no smaller than about 0.2° × 0.2°, otherwise the number of data points becomes too sparse for most calculations. With a 0.2° × 0.2° region, at least one data grid point will exist for every 1000 m increment above the surface.
ECMWF provides daily atmospheric data corresponding to a horizontal latitude-longitude grid and are available for every 6 h. This vast data set provides the spatiotemporal fields of many meteorological variables, including vertical air speed. The following meteorological variables were retrieved from the ERA-Interim database for each grid point and each pressure level: eastward and northward wind components (u, and v, respectively, in m s−1), temperature (T, in K), geopotential (Φ, in m−2s−2), specific humidity (q, in kg kg−1), and vertical velocity (ω = dp/dt, in Pa s−1, where p is pressure and t is time; as explained above, ω is defined as pressure tendency in a system where pressure is considered as the vertical coordinate).
The vertical velocity is calculated from the ERA-Interim data using the following relationship [3,29]
where, ρ is density (in kg m−3) and g is the acceleration due to gravity. Substituting ρ from Equation (2), the equation used for calculating the vertical velocity becomes
where, is defined by Equation (3).
The acceleration due to gravity is adjusted for latitude, φ, and height above the MSL, z, as follows: (https://www.sensorsone.com/local-gravity-calculator/)
where, IGF is the International Gravity Formula (in m s−2), given by the relationship [30,31]
and FAC is the Free Air Correction (in m s−2), given by the relationship
From the definition of the geopotential Φ(z) at height z as the work required to raise a unit mass to height z from MSL, and from the conversion of the geopotential into geopotential height
where is the global average of acceleration due to gravity at MSL, ≡ 9.80665 m s−2, the geopotential height is derived. In the troposphere and lower stratosphere, the geopotential height is numerically almost identical to the geometric height z, therefore the former can be used in Equation (15) to calculate the free air correction.
Figure 2 shows 3D contour plots of 1° × 1° ECMWF vertical wind data for each of the radiosonde observation times: 06:00 UTC and12:00 UTC 17 April 2013. The legend colors correspond to the range of values of . One notable characteristic of these plots is the apparent uniformity of air speeds at various height levels. This uniformity removes any significant dependence on region’s window size, as long as a minimum window of 0.2° × 0.2° is used. A maximum window of 1° × 1° is likely to provide minimum variation at the horizontal levels. All of the variation is in the vertical direction. This appears to be true at the 1 deg × 1 deg scale and smaller. Note that because of the spacing of ECMWF grid points, microscale features are not likely to show up.
In order to extract a useful and meaningful value of from the ECMWF data, all data at 1000 m levels are averaged to create wind profiles, as shown in Figure 3. The wind profile is integrated from the surface to form an accumulated average of the wind data profile. Finally, for comparison to the disdrometer derived A and b parameters as discussed below, the accumulated wind profile at a reference level is used. The reference level chosen for this comparison is zref = 10,000 m. The zref seems to provide a consistent comparison to the disdrometer A-b data; (zref) is simply the average of the wind profile from z = 0 to zref. Table 1 summarizes these results for 11 days of disdrometer-ECMWF data.
3. Methodology
3.1. DSD Flux Conservation Model
An approach to modeling the vertical air effect on the Z-R disdrometer derived coefficients is to start with the very idealistic notion of flux conservation of the DSD, where the DSD flux, is defined as
where, is drop terminal velocity and is the DSD. In this ideal world of flux conservation, drops do not interact, and they maintain their size and population during their lifetime and subsequent fall to the surface. The only characteristic that can change in time or location is drop velocity. Since is conserved and is therefore a constant for any , any change in must be accompanied by an inverse change in .
To understand how flux conservation model (FCM) will lead to a change in the DSD spectra, refer to Figure 4, where a DSD described by is falling with a combined terminal velocity and vertical air motion (see also Equations (27) and (28) in Lane et al. [21]). The DSD measured by a disdrometer at the surface is with flux , which can be found by equating the flux at the surface and F(D) in the vertical air column
3.2. Drop Velocity
Equation (18) is an oversimplification in more than one ways, but it provides a starting point for calculating the effect of vertical air motion on the surface DSD. The most glaring problem with Equation (18) as this is formulated, in addition to the problem of requiring ideal non-interacting drops, is that the right-hand side of this equation turns negative when is positive (updraft) for some drop sizes below a value of . This lower limit of can be found as the solution to = . We can use any approximation of , including a power law, to find a and demonstrate the dependence of the coefficients A and b (based on the Z-R relationship, as explained below) on .
We will use the following approximation for
where, = 4.67, = −0.789, = 0.0441 (see [21]). The and are model parameters that attempt to approximate the behavior of drops that are approaching the surface with velocities different than terminal velocity due to the finite distance needed to accelerate/decelerate from the vertical air column. The parameter is in most cases set equal to . The last term of Equation (19) may be especially useful in the case of a laser disdrometer derived Z-R since is measured directly. Since the disdrometer at Athalassa, Cyprus, is an impact disdrometer, we will not attempt to utilize the last term, which can be done by setting = 0 (or setting to a very large value). With the definition of drop velocity given by Equation (19), the still air terminal velocity for = 0. Solving for , where from the numerator of Equation (18), can be accomplished with some effort using standard root solving strategies (or with minor effort using Mathematica®). The exact solution was found using Mathematica. It is a long, unwieldy result. To simplify the exact Mathematica solution, a set of data was created from the exact formula, then that data was fitted to a third order polynomial
where, = 0.2502, = −0.01324, = 0.003405, and H(w) is the unit step function (also referred to as the Heaviside step function). The step function is required to prevent negative drop diameters and is defined as
D1 and D2 are defined as the lower and upper limits of the disdrometer sensitivity. Using the Joss–Waldvogel disdrometer limits of D1 = 0.3 mm and D2 = 5.5 mm [32], Equation (19) leads to the plot of Figure 5.
A severe shortcoming of Equation (18) is the implication that no drops will exist for the disdrometer to measure below . However, that is seldom the case (one might say never the case), since disdrometers are not likely to have a completely depleted distribution for all small drops below some drop size. A modification can be made to Equation (18) to account for drop breakup that partially repopulates the size distribution below in the region above the surface, but below the height where w is constant
where, . The prime has been dropped from the LHS of Equation (22) since, from this point forward, will correspond to the theoretical DSD at the disdrometer.
Combining Equations (19) and (22) results in what will henceforth be referred to as the FCM-DSD, which is the theoretical DSD experienced by the disdrometer, based on the FCM. Figure 6a shows the FCM-DSD of Equation (22) with = 8000 (mm−1 m−3), = 0.9, = 0, with three values of and two values of , i.e., the Marshall–Palmer rainfall rate parameter [33]. Figure 6b is the same but for = 1. The parameter mostly affects the updraft case. Referring to Equation (22), N(D) is mostly affected by w when v(D) and w are nearly equal. For approximately D > 2, the effect on N(D) is much less for values of w << v(D).
3.3. Z and R as DSD Moments
Computing Z and R from the DSD model of Equation (22) is nothing more than an exercise in computing integer moments of the DSD (see also [34])
Note that the limits of the moment integral are not shown as 0 to ∞, but are defined as the Joss disdrometer detection limits D1 and D2; Z is then computed directly from the 6th moment: Z = . R is an integral of the product of drop velocity , drop volume, and . If Equation (19) is used with = 0, then R becomes the sum of the fourth, fifth, and sixth moments, weighted by the coefficients in Equation (19)
where, for k = 1,2,3, = , and = which sets R in standard units of mm h−1. If is an exponential distribution
then
where, is the incomplete gamma function, as a result of the finite limits on the integral in Equation (23). Unfortunately, the form of the DSD based on Equation (25) does not lead to convenient forms for , except in the special case of = 0. In general, it is necessary to numerically evaluate the moments to attain values for Z and R.
3.4. A-b Coefficients
A parametric plot of Z versus R over a range of with a fixed generates nearly straight lines on a log–log plot, (as discussed below in conjunction with Figure 7). This inherent property of nearly straight lines is the source and motivation for expressing
This can be expressed as
The coefficient set {logA, b} is found from the linear fit of logR versus logZ. Equation (27) is an approximation that may be good under a limited set of circumstances. This conclusion becomes obvious by inspection of the DSD moment in Equation (26). Two requirements would need to be satisfied for Equation (27) to be exact: would need to be a constant for all time and drop terminal velocity would need to be accurately represented by a power law. Neither of these requirements are satisfied, except under very limited circumstances. Nevertheless, Equation (27) can be very useful as long as it is understood that it is just an approximation.
Figure 7 shows the Z-R curves generated with a parametric plot by running through a range of values (approximately 1 through 7). Three curves are shown from the FCM-DSD model with three values of , = 8000 (mm−1 m−3), = 1, and = 0. The limits of integration D1(w) and D2 as shown in Figure 5, are D1(0) = 0.3 (mm) and D2 = 5.5 (mm). In addition, the National Weather Service (NWS, United States of America) standard Z-R (see [35]) is shown for comparison. Figure 8 shows two sets of curves for comparison with widely varying values of . From these figures it is obvious that the Z-R line shifts with values of , corresponding to a different value of A. There are also accompanying changes in the slope. Changing and also shift the Z-R lines, producing different values of A and b. Setting turns off the effect has on the FCM-DSD (see Equation (22)). The short dotted and long dotted lines will converge to the solid line for each shown in Figure 7 and Figure 8. This parameter has the effect, on the DSD model of Equation (22), of mixing in a percentage of the standard exponential DSD from 0 to 100%.
Since may change during a rainfall event, as well as , a Monte Carlo approach is used. In Figure 9, the FSM-DSD is used to find a {A, b, w} set. Each line is composed of 1000 uniform random distribution Z-R points with ranging from 2000 to 32,000 and ranging from 2.2 to 5, with = 1. The red line is a linear fit to the = 3 m s−1 updraft case, the gray line is the = 0 no vertical wind case, and green is the = −4 m s−1 downdraft. Table 2 summarizes the power law fits. Figure 10 is a plot of Table 2 with the NWS standard Z = 300 R1.4 and the A-b pair plotted as a yellow square.
Verifying the prediction of Figure 10 can be performed by plotting {A,b, } of real data. The A and b can be derived directly from disdrometer data. Vertical wind data can be measured by a collocated microwave wind profiler or by an acoustic SODAR system, if available. Other sources include radiosonde balloon data and global or regional forecast models.
4. Results
4.1. ECMWF versus Radiosonde
Figure 11 is a plot of the average vertical air motion from z = 0 (or surface) to z = height of 10,000 m
for different values of the balloon volume . This curve shows a dramatic increase to the left as →/, the neutral buoyancy point, since any measured vertical motion would then be entirely attributed to an updraft. To the right, as increases, the ascent rate should increase, such that a nominally measured ascent velocity would be attributed to an increasing downdraft. Reasonable values of are on either side of ≈ 1.3 m3.
Initially, > , implying that the balloon starts out in the turbulent flow regime. As the balloon rises, decreases until it is less than . The point in time where = defines the time t = . In general, the value of will continue to decrease as the balloon continues to rise until the value is = . This is the time defined as when the flow turns to fully laminar. In Figure 11, the curves for and overlap which implies that jumps from to instantaneously. This also results in an instantaneous jump in and . Further analysis has shown that this artificial gap is a consequence of the model and can be mitigated by model modifications, such as reducing the derivative of (). For the purposes of this work, these discontinuities in the flow transition region can be mostly ignored. However, future radiosonde analysis models will certainly address this issue.
Table 3 is the result of taking the equivalent of Figure 11 for all cases considered and finding the best fit such that is equal to the ECMWF vertical velocity . Instead of , the equivalent is shown in Table 3. Note that coincidentally, is numerically equal to for = (6/π)1/2 = 1.38 (m). The values of found this way are constrained to a range from 1.18 to 1.45 (m).
4.2. ECMWF and Disdrometer
1° × 1° ECMWF averaged data to a reference height of 10,000 m, was calculated for the 11 entries of Table 2. This is compared to the A-b coefficients derived from the disdrometer Z-R computations. Finally, the {A, b, } points from Table 2 are plotted in Figure 12. The yellow squares in this figure correspond to coefficients, A = 300 and b = 1.4 which are the standard values used in the NWS [35]. The circles with black borders are from the Monte Carlo procedure described in the previous section, as shown in Figure 9. Figure 9 and Figure 10 were generated by a uniform distribution of DSD model parameters Λ and , from Equation (22), with 2.2 ≤ Λ ≤ 5 and 2000 ≤ ≤ 32,000. In order to line up the = 0 simulation based on Equation (22) with the NWS squares in Figure 12, the Monte Carlo limits were modified to, with 1.7 ≤ Λ ≤ 6 and 790 ≤ ≤ 11,000. This has the effect of shifting the A-b points for the specific cases in the A-b plane.
5. Discussion
The goal of this work is to try to deduce information about the character of the vertical air motion from the disdrometer data. This has been motivated by the postulation that the vertical component of the wind depends on the fall speed of hydrometeors (see [36]). This has mostly been limited to comparing the disdrometer derived Z-R coefficients A and b with any measurement or prediction of vertical wind . A major difficulty is that other mechanisms may dominate the DSD such as uncorrelated variations of . Nevertheless, the results of Figure 12 show a remarkable correlation. For the Athalassa disdrometer to ECMWF data comparison, there is a clear segregation of A-b points for < 0 and > 0. In addition, the separation line for both A and b matches the NWS point (yellow square). For the model of Equation (22), the correlation with the sign of is also displayed. The dependence of the model b parameter dependence is the opposite of the Athalassa data. In the case of the model data, the = 0 point was forced to line up with the NWS standard values of A = 300 and b = 1.4 point. Based on this relation, it can be concluded that the coefficients and the power series of the Z-R relation are classified according to the vertical velocity, which is one of the main results of this study.
Radiosonde deduced vertical air motion has many potential error sources. A primary error source is initial balloon volume (or diameter ). It is essential to tightly control the initial volume or at least be able to measure it before launch. Another source of error is the balloon total mass . Again, it is essential to tightly control the mass at launch time or be able to accurately measure the mass. A challenge in measuring inflated mass is the fact that it must not be corrupted by the buoyancy force. Therefore, measuring the deflated mass and the mass of the gas pumped into the balloon from a K-bottle for example, where the weight of the K-bottle is accurately monitored to determine mass of the gas lost from the bottle to the balloon. Even though many other error sources associated with the balloon and radiosonde payload exist, and are particularly sensitive because of the difference term in Equation (1). Small errors in numbers that are very nearly equal can have significant consequences. Other error sources may actually be larger in magnitude, but their effect would more likely be a scaling error.
6. Conclusions
The FCM-DSD is based on the exponential DSD and is modified by the relationship between drop terminal velocity and vertical air speed . The FCM-DSD has a similar appearance to the popular gamma DSD for < 0 (see [21]). When points {A, b, } are plotted, as shown by Figure 12, a clear segregation is seen in the A- plane for both data and model. The points from data are also clearly segregated in the b- plane, but the model data are on opposite sides of the = 0 line. Another surprise is that the segregation lines intersecting at = 0, yield the NWS standard A-b parameters, 300 and 1.4, respectively.
Generalizing any methodology that makes use of radiosonde data of different time periods or diverse localities should take into account issues related to radiosonde data homogeneity [37].
Radiosonde data are routinely assimilated in numerical weather prediction (NWP) models which are subsequently used in the atmospheric data reanalyses. However, NWP models are generally non-hydrostatic, considering vertical velocity as a prognostic variable of the model. However, no specific assimilation on this variable is normally performed [38]. The model derives its own vertical velocity field from the other meteorological fields in its first time-steps of integration. The reason behind is that no observing capability is able to produce some vertical velocity observations which are comparable to the model vertical velocity (at the scale of its mesh). A drastic increase on spatial resolutions of high-resolution NWP models is needed before these models can resolve the clouds and produce some vertical motion which can be compared to, for example, Doppler radar vertical velocity observations [36,39].
Radiosonde data constitute a unique source of information about the vertical atmospheric profile, hence they are essential for the assimilation efforts in generating climate databases, such as the ECMWF reanalyses [28] (and other reanalyses too, e.g., MERRA-2 [40] and JRA-55 [41]). However, vertical velocities are not directly measured from radiosonde observations and, in this respect, directly measured vertical velocities from radiosondes are not assimilated in reanalyses but the vertical velocity field is derived from other observable fields (refer, for example, to the kinematic method used in ERA-Interim). It is worth noting here that interrelationships between reanalysis data and radiosonde timeseries may also be used to homogenize the latter [42]
In this work, it was demonstrated that can be extracted from radiosonde data if initial balloon volume is accurately measured, along with an accurate measurement of . To accomplish this, vertical velocities from radiosonde data were equated to ECMWF vertical velocity fields, thus solving for with set to a constant 0.9 (kg). The resulting values of are shown to be within a reasonable range of values.
Future work will focus on using laser disdrometer and radiosonde data to further investigate the relationship between disdrometer derived A-b coefficients and vertical air speed . The disagreement between model and data of the b parameter location in the -b plane will be investigated in greater detail, but for now it remains inexplicable.
Author Contributions
S.M. and J.L. contributed to the conceptualization, investigation, formal analysis, writing, and reviewing of the paper. T.K. contributed to the resources, investigation, writing, and reviewing of the paper. All authors have read and approved the contents of this paper.
Funding
This research received no external funding.
Acknowledgments
The authors acknowledge the use of ERA-Interim database which is provided by the European Centre for Medium Range Forecasts (ECMWF) (https://www.ecmwf.int/en/forecasts/datasets/archive-datasets/reanalysis-datasets/era-interim). The radiosonde data for Athalassa were provided by the Cyprus Department of Meteorology. The authors wish to thank the three anonymous reviewers for their constructive comments.
Conflicts of Interest
The authors declare no conflict of interest.
Appendix A
List of abbreviations and symbols.
| Drop diameter | |
| Balloon diameter | |
| Initial balloon diameter | |
| DSD | Drop size distribution |
| D0 | Physical drop size cutoff due to updraft |
| D1 | Lower limit of the disdrometer sensitivity |
| D2 | Upper limit of the disdrometer sensitivity |
| ECMWF | European Centre for Medium Range Forecasts |
| FAC | Free air correction (in m s−2) |
| Drop size distribution flux | |
| FCM | Flux conservation model |
| GPS | Global Positioning System |
| g | Acceleration due to gravity |
| Global average of acceleration due to gravity at MSL ( ≡ 9.80665 m s−2) | |
| Heaviside Function | |
| IGF | International Gravity Formula (in m s−2) |
| MSL | Mean Sea level |
| Mass of the complete radiosonde-balloon system | |
| NA | Not available |
| Drop size distribution | |
| NWS | National Weather Service, United States of America |
| NWP | Numerical weather prediction |
| p | Pressure (Pa) |
| ps | Surface pressure (Pa) |
| q | Specific humidity (in kg kg−1) |
| R | Rain rate (in mm h−1) |
| RH | Relative humidity (in %) |
| Reynold’s number | |
| Rd | Gas constant for dry air (287.058 J kg−1 K−1) |
| Gas constant for moist air | |
| Rv | Gas constant for water vapor (461.5 J kg−1 K−1) |
| T | Temperature (in K or oC) |
| T0 | Reference temperature (typically taken to be 273.16 K) |
| t | Time (s) |
| Time when the flow turns to fully laminar | |
| Transition time from fully turbulent to laminar | |
| UTC | Coordinated Universal Time |
| V | Balloon volume (m3) |
| Initial balloon volume at the surface before release (m3) | |
| Drop terminal velocity | |
| Vertical velocity (in m s−1) | |
| Average vertical air motion from z = 0 (or surface) to z = height of 10,000 m | |
| Calculated balloon still air ascent velocity | |
| ECMWF vertical velocity | |
| Balloon ascent rate | |
| Empirical terminal velocity parameter accounting for deceleration of drops approaching a flat surface | |
| Z | Radar reflectivity factor (in mm6 m−3) |
| Geopotential height (geopotential meters, gpm) | |
| z | Height above MSL (in m) |
| Incomplete gamma function | |
| Recursion gain factor | |
| Marshall–Palmer rainfall rate parameter | |
| Parameter accounting for deceleration of drops approaching a flat surface | |
| μ | Dynamic viscosity of air (kg m−1·s−1) |
| Air density as a function of height | |
| Air density at the surface (kg m−3) | |
| σ | Vertical coordinate in ECMWF’s hybrid system (σ = p/ps) |
| Φ(z) | Geopotential at height z (m2 s−2) |
| φ | Latitude |
| ω | Pressure tendency (in Pa s−1) |
Appendix B
First three lines of radiosonde data file of 05:00 UTC 24 October 2012.
| Time | Pressure | Height | Temperature | Relative Humidity | Virtual Temperature | Dew Point Depression | Lapse Rate | Ascent Rate | |
| min | s | hPa | gpm | °C | % | °C | °C | °C km−1 | m s−1 |
| 0 | 0 | 995.5 | 165 | 14.0 | 94 | 15.7 | 0.9 | 0.0 | 0.0 |
| 0 | 2 | 993.9 | 179 | 15.1 | 82 | 16.7 | 3.0 | −78.6 | 7.0 |
| 0 | 4 | 992.9 | 188 | 15.7 | 80 | 17.3 | 3.4 | −66.7 | 4.5 |
| . | . | . | . | . | . | . | . | . | . |
| . | . | . | . | . | . | . | . | . | . |
References
- Wallace, J.M.; Hobbs, P.V. Atmospheric Science—An Introductory Survey, 2nd ed.; Academic Press: Amsterdam, Denmark, 2006; p. 483. ISBN 0-12-732951-X. [Google Scholar]
- Lynch, A.H.; Cassano, J.J. Applied Atmospheric Dynamics; Wiley: Chichester, UK, 2006. [Google Scholar]
- Holton, J.R.; Hakim, G.J. An Introduction to Dynamical Meteorology, 5th ed.; Academic Press: Amsterdam, Denmark, 2013. [Google Scholar]
- Panofksky, H.A. Methods for computing vertical motion in the atmosphere. J. Meteorol. 1946, 3, 45–49. [Google Scholar] [CrossRef]
- Durran, D.R.; Snellman, L.W. The diagnosis of synoptic-scale vertical motion in an operational environment. Wea. Forecast. 1987, 1, 17–31. [Google Scholar] [CrossRef]
- World Meteorological Organization. Guide to Meteorological Instruments Methods of Observation; WMO-No. 8, (Updated 2010); World Meteorological Organization: Geneva, Switzerland, 2012. [Google Scholar]
- World Meteorological Organization. Guide to the Global Observing System; 2010 edition (updated 2017), WMO No. 488; World Meteorological Organization: Geneva, Switzerland, 2017. [Google Scholar]
- Haimberger, L. Homogenization of radiosonde temperature time series using innovation statistics. J. Climate 2007, 20, 1377–1403. [Google Scholar] [CrossRef]
- Räisänen, J. Factors affecting synoptic-scale vertical motions: A statistical study using a generalized omega equation. Mon. Wea. Rev. 1995, 123, 2447–2460. [Google Scholar] [CrossRef]
- Giangrande, S.E.; Feng, Z.; Jensen, M.P.; Comstock, J.M.; Johnson, K.L.; Toto, T.; Wang, M.; Burleyson, C.; Bharadwaj, N.; Mei, F.; et al. Cloud characteristics, thermodynamic controls and radiative impacts during the Observations and Modeling of the Green Ocean Amazon (GoAmazon2014/5) experiment. Atmos. Chem. Phys. 2017, 17, 14519–14541. [Google Scholar] [CrossRef] [Green Version]
- Giangrande, S.E.; Luke, E.P.; Kollias, P. Characterization of vertical velocity and drop size distribution parameters in widespread precipitation at ARM facilities. J. Appl. Meteor. Climatol. 2012, 51, 380–391. [Google Scholar] [CrossRef]
- Bühl, J.; Leinweber, R.; Görsdorf, U.; Radenz, M.; Ansmann, A.; Lehmann, V. Combined vertical-velocity observations with Doppler lidar, cloud radar and wind profiler. Atmos. Meas. Tech. 2015, 8, 3527–3536. [Google Scholar] [CrossRef] [Green Version]
- Geerts, B.; Miao, Q. The use of millimeter Doppler radar echoes to estimate vertical air velocities in the fair-weather convective boundary layer. J. Atmos. Oceanic Technol. 2005, 22, 225–246. [Google Scholar] [CrossRef]
- Angevine, W.M. Errors in Mean Vertical Velocities Measured by Boundary Layer Wind Profilers. J. Atmos. Ocean. Tech. 1997, 14, 565–569. [Google Scholar] [CrossRef]
- Taconet, O.; Weill, A. Vertical velocity field in the convective boundary layer as observed with an acoustic Doppler sodar. Bound. Lay. Meteorol. 1982, 23, 133–151. [Google Scholar] [CrossRef]
- Hoppe, C.M.; Ploeger, F.; Konopka, P.; Müller, R. Kinematic and diabatic vertical velocity climatologies from a chemistry climate model. Atmos. Chem. Phys. 2016, 16, 6223–6239. [Google Scholar] [CrossRef] [Green Version]
- Stepanyuk, O.; Räisänen, J.; Sinclair, V.A.; Järvinen, H. Factors affecting atmospheric vertical motions as analyzed with a generalized omega equation and the OpenIFS model. Tellus 2017, 69, 1–9. [Google Scholar] [CrossRef]
- 1Abalos, M.; Legras, B.; Ploeger, F.; Randel, W.J. Evaluating the advective Brewer-Dobson circulation in three reanalyses for the period 1979–2012. J. Geophys. Res. 2015, 120, 7534–7554. [Google Scholar] [CrossRef]
- Iwasaki, T.; Hamada, H.; Miyazaki, K. Comparisons of Brewer-Dobson circulations diagnosed from reanalyses. J. Meteorol. Soc. Jpn. 2009, 87, 997–1006. [Google Scholar] [CrossRef]
- Simmons, A.J.; Poli, P.; Dee, D.P.; Berrisford, P.; Hersbach, H.; Kobayashi, S.; Peubey, C. Estimating low-frequency variability and trends in atmospheric temperature using ERA-Interim. Q. J. Roy. Meteorol. Soc. 2014, 140, 329–353. [Google Scholar] [CrossRef]
- Lane, J.; Kasparis, T.; Michaelides, S.; Metzger, P. A phenomenological relationship between vertical air motion and disdrometer derived Ab coefficients. Atmos. Res. 2018, 208, 94–105. [Google Scholar] [CrossRef]
- Kim, D.-K.; Song, C.-K. Characteristics of vertical velocities estimated from drop size and fall velocity spectra of a Parsivel disdrometer. Atmos. Meas. Tech. 2018, 11, 3851–3860. [Google Scholar] [CrossRef]
- Joss, J.; Waldvogel, A. Ein Spektrograph für Niederschlagstropfen mit automatischer Auswertung. Pure Appl. Geophys. 1967, 68, 240–246. [Google Scholar] [CrossRef]
- Joss, J.; Waldvogel, A. Raindrop size distribution and sampling size errors. J. Atmos. Sci. 1969, 26, 566–569. [Google Scholar] [CrossRef]
- Wang, J.; Bian, J.; Brown, W.O.; Cole, H.; Grubišić, V.; Young, K. Vertical air motion from T-REX radiosonde and dropsonde data. J. Atmos. Ocean. Tech. 2009, 26, 928–942. [Google Scholar] [CrossRef]
- Sóbester, A.; Castro, I.P.; Czerski, H.; Zapponi, N. Notes on meteorological balloon mission planning. In Proceedings of the AIAA Balloon Systems (BAL) Conference, Daytona Beach, FL, USA, 25–28 March 2013. [Google Scholar]
- Berrisford, P.; Dee, D.P.; Poli, P.; Brugge, R.; Fielding, K.; Fuentes, M.; Kållberg, P.W.; Kobayashi, S.; Uppala, S.; Simmons, A. The ERA-Interim archive Version 2.0. ERA Report Series 1. 2011. Available online: http://www.ecmwf.int/en/elibrary/8174-era-interim-archive-version-20 (accessed on 4 December 2018).
- Dee, D.P.; Uppala, S.M.; Simmons, A.J.; Berrisford, P.; Poli, P.; Kobayashi, S.; Andrae, U.; Balmaseda, M.A.; Balsamo, G.; Bauer, P.; et al. The ERA-Interim reanalysis: Configuration and performance of the data assimilation system. Q. J. R. Meteorol. Soc. 2011, 137, 553–597. [Google Scholar] [CrossRef]
- Lackmann, G.M. Midlatitude Synoptic Meteorology: Dynamics, Analysis, and Forecasting; American Meteorological Society: Boston, MA, USA, 2011. [Google Scholar]
- Moritz, H. Geodetic Reference System 1980. Bulletin Geodesique. 1980, 54, 395–405. [Google Scholar] [CrossRef]
- Tsen, A. Determination of Geoidal Height Difference Using Ring Integration Method; Technical Report No. 158; University of New Brunswick: Fredericton, NB, Canada, 1991. [Google Scholar]
- Tokay, A.; Kruger, A.; Krajewski, W.F. Comparison of drop size distribution measurements by impact and optical disdrometers. J. Appl. Meteorol. 2001, 40, 2083–2097. [Google Scholar] [CrossRef]
- Marshall, J.S.; Palmer, W.M.K. The distribution of raindrops with size. J. Meteorol. 1948, 5, 165–166. [Google Scholar] [CrossRef]
- Lane, J.; Kasparis, T.; Jones, L. A 3D drop-size distribution model based on the convolution of raindrops at terminal velocity. Int. J. Remote Sens. 2002, 23, 3115–3121. [Google Scholar] [CrossRef]
- Kuligowski, R.J. An overview of National Weather Service Quantitative Precipitation Estimates. Available online: http://www.nws.noaa.gov/im/pub/tdl97-4.pdf (accessed on 20 December 2018).
- Montmerle, T.; Faccani, C. Mesoscale Assimilation of Radial Velocities from Doppler radars in a preoperational framework. Mon. Wea. Rev. 2009, 137, 1939–1953. [Google Scholar] [CrossRef]
- Lanzante, J.R.; Klein, S.A.; Seidel, D.J. Temporal homogenization of monthly radiosonde temperature data. Part I: Methodology. J. Climate 2003, 16, 224–240. [Google Scholar] [CrossRef]
- Montmerle, T. Statement of Guidance for High-Resolution Numerical Weather Prediction (NWP). 2018. Available online: https://www.wmo.int/pages/prog/www/OSY/SOG/SoG-HighRes-NWP.pdf (accessed on 20 December 2018).
- Aoki, M.; Iwai, H.; Nakagawa, K.; Ishii, S.; Mizutani, K. Measurements of Rainfall Velocity and Raindrop Size Distribution Using Coherent Doppler Lidar. J. Atmos. Oceanic Technol. 2016, 33, 1949–1966. [Google Scholar] [CrossRef]
- Gelaro, R.; McCarty, W.; Suárez, M.J.; Todling, R.; Molod, A.; Takacs, L.; Randles, C.; Darmenov, A.; Bosilovich, M.G.; Reichle, R.; et al. The Modern-Era Retrospective Analysis for Research and Applications, Version 2 (MERRA-2). J. Climate 2017, 30, 5419–5454. [Google Scholar] [CrossRef]
- Kobayashi, S.; Ota, Y.; Harada, Y.; Ebita, A.; Moriya, M.; Onoda, H.; Onogi, K.; Kamahori, H.; Kobayashi, C.; Endo, H.; et al. The JRA-55 Reanalysis: General Specifications and Basic Characteristics. J. Meteorol. Soc. Jpn. 2015, 93, 5–48. [Google Scholar] [CrossRef] [Green Version]
- Haimberger, L. Homogenization of Radiosonde Temperature Time Series Using ERA-40 Analysis Feedback Information. ECMWF ERA-40 Project Rep. Series 23. 2005. Available online: https://www.ecmwf.int/node/9738 (accessed on 29 December 2018).
Figure 1.
The 1° × 1° sub-region of ECMWF data centered over Athalassa.
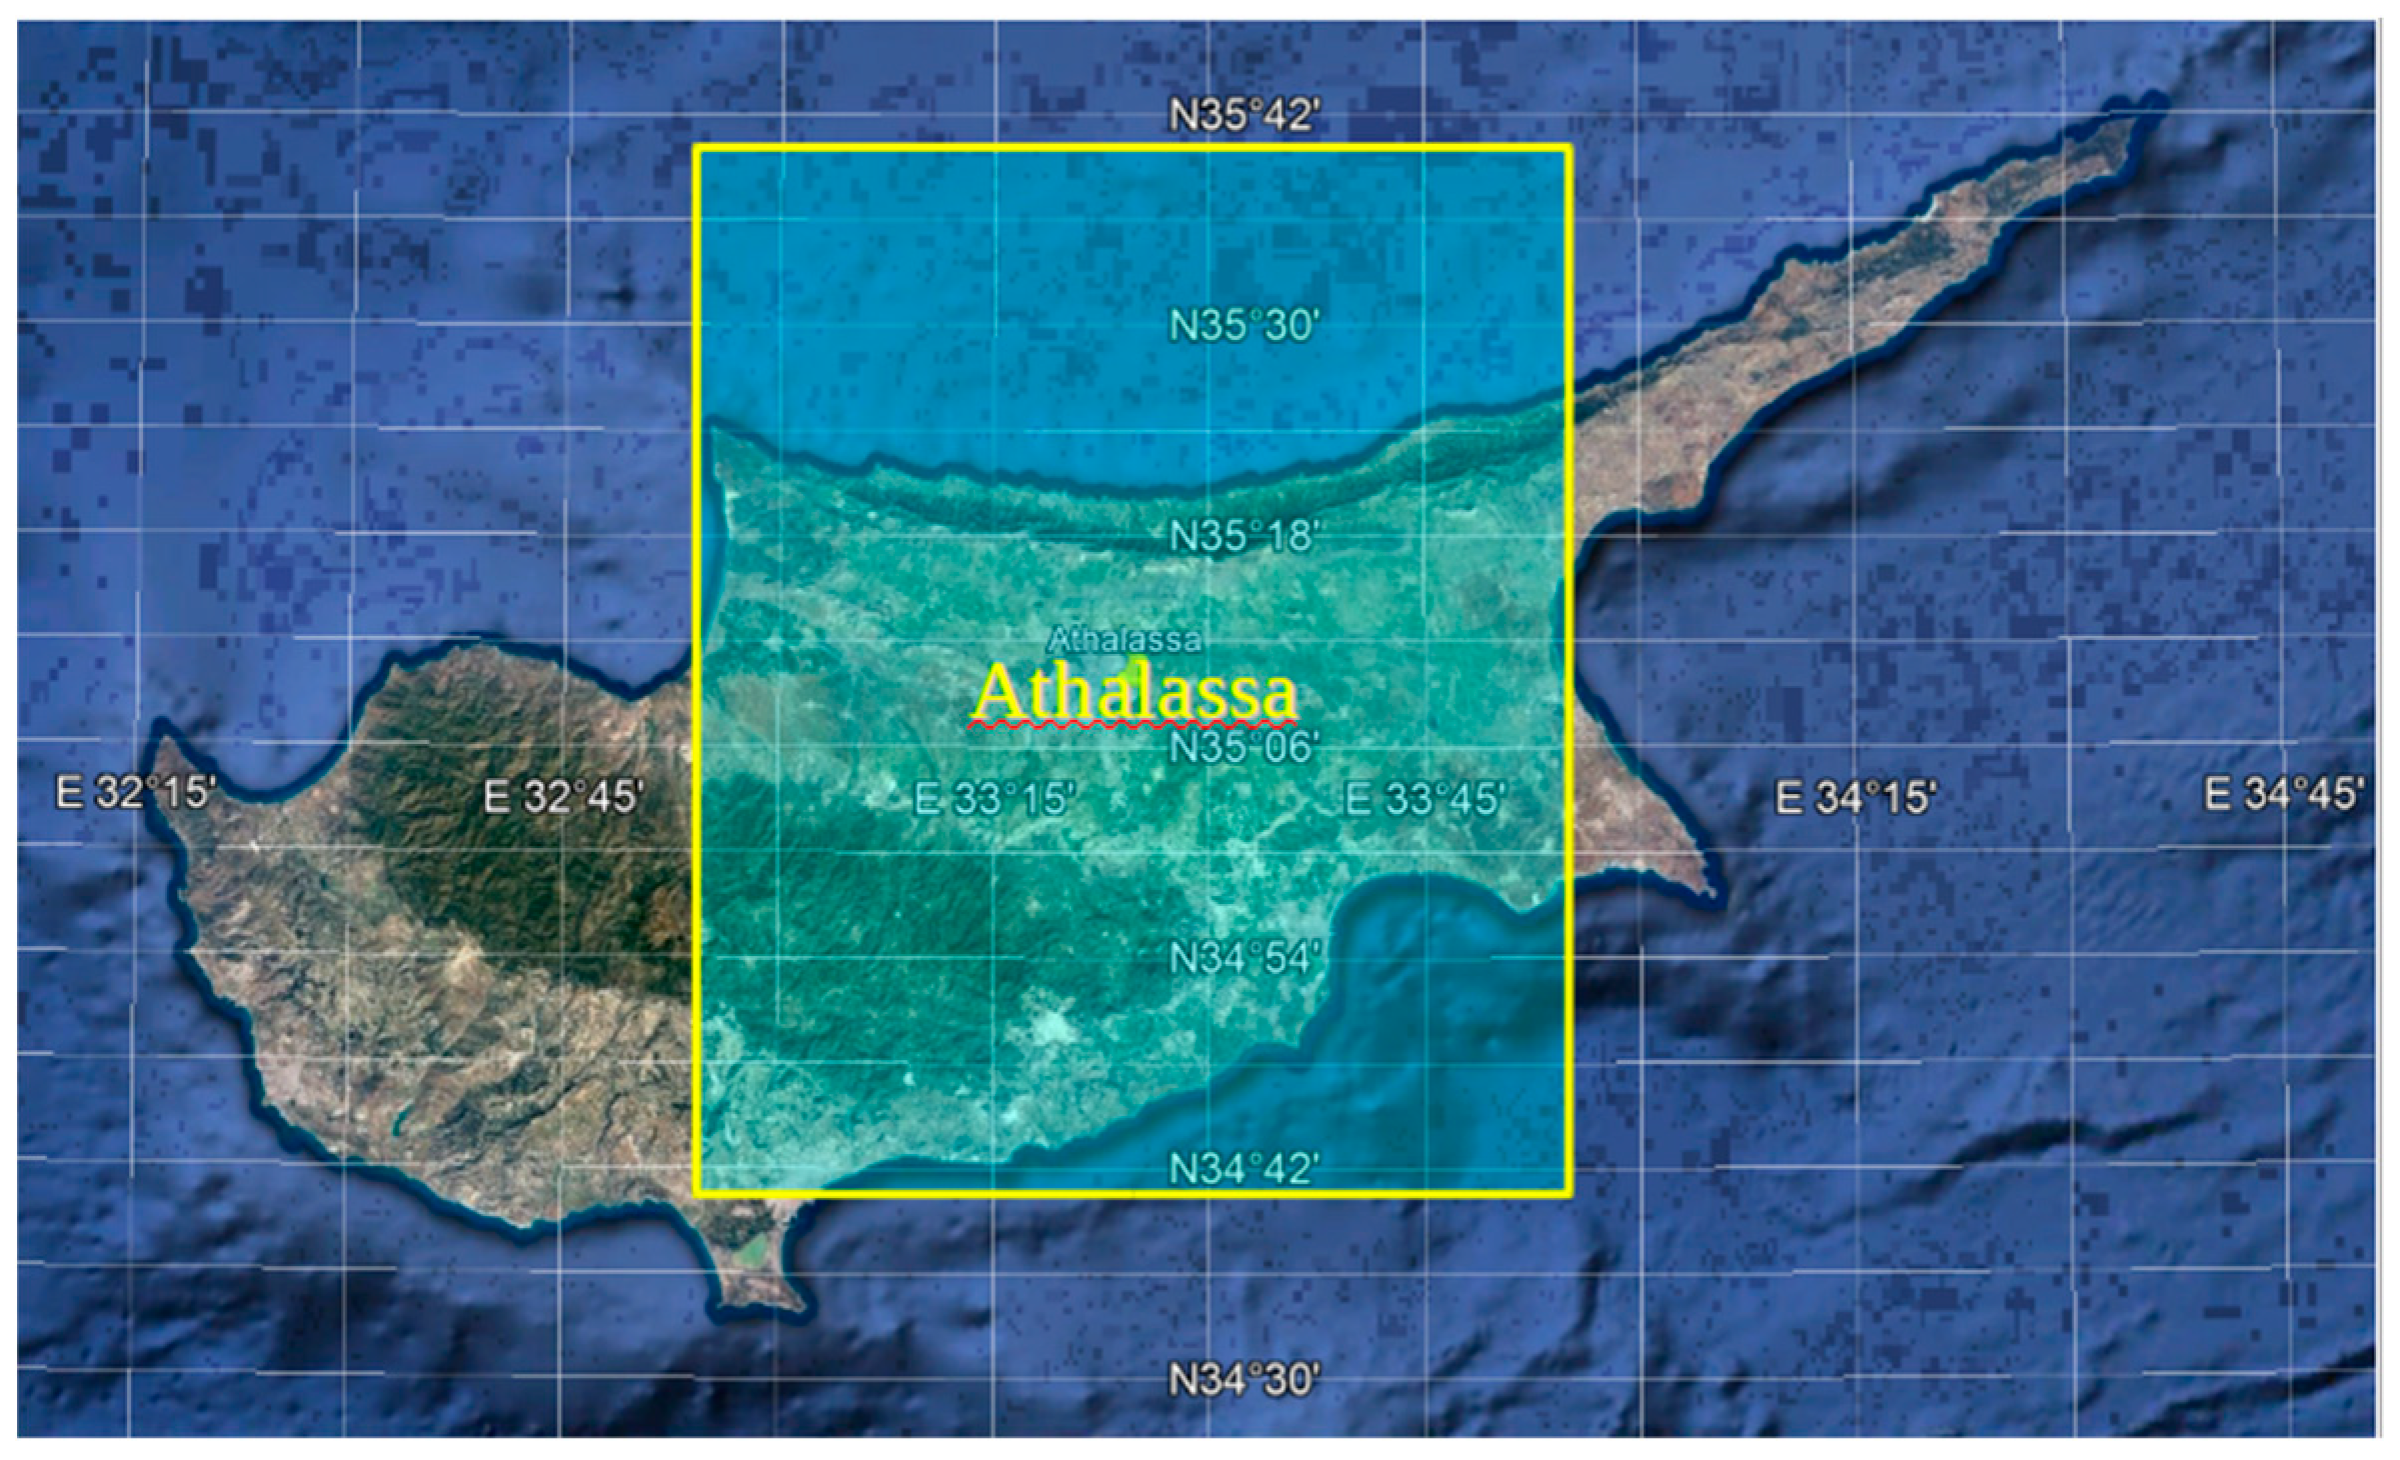
Figure 2.
1° × 1° ECMWF vertical wind data (centered over Athalassa) plotted as a 3D contour plot. Color key corresponds to in m s−1. Data refer to 17 April 2013: (left) 06:00 UTC (right) 12:00 UTC (right).
Figure 2.
1° × 1° ECMWF vertical wind data (centered over Athalassa) plotted as a 3D contour plot. Color key corresponds to in m s−1. Data refer to 17 April 2013: (left) 06:00 UTC (right) 12:00 UTC (right).

Figure 3.
Wind profile of 0.3° × 0.3° ECMWF vertical wind data (centered over Athalassa). Solid line: wind speed ; dotted line: average wind speed from ground. Data refer to 17 April 2013: (a) 06:00 UTC and (b) 12:00 UTC.
Figure 3.
Wind profile of 0.3° × 0.3° ECMWF vertical wind data (centered over Athalassa). Solid line: wind speed ; dotted line: average wind speed from ground. Data refer to 17 April 2013: (a) 06:00 UTC and (b) 12:00 UTC.
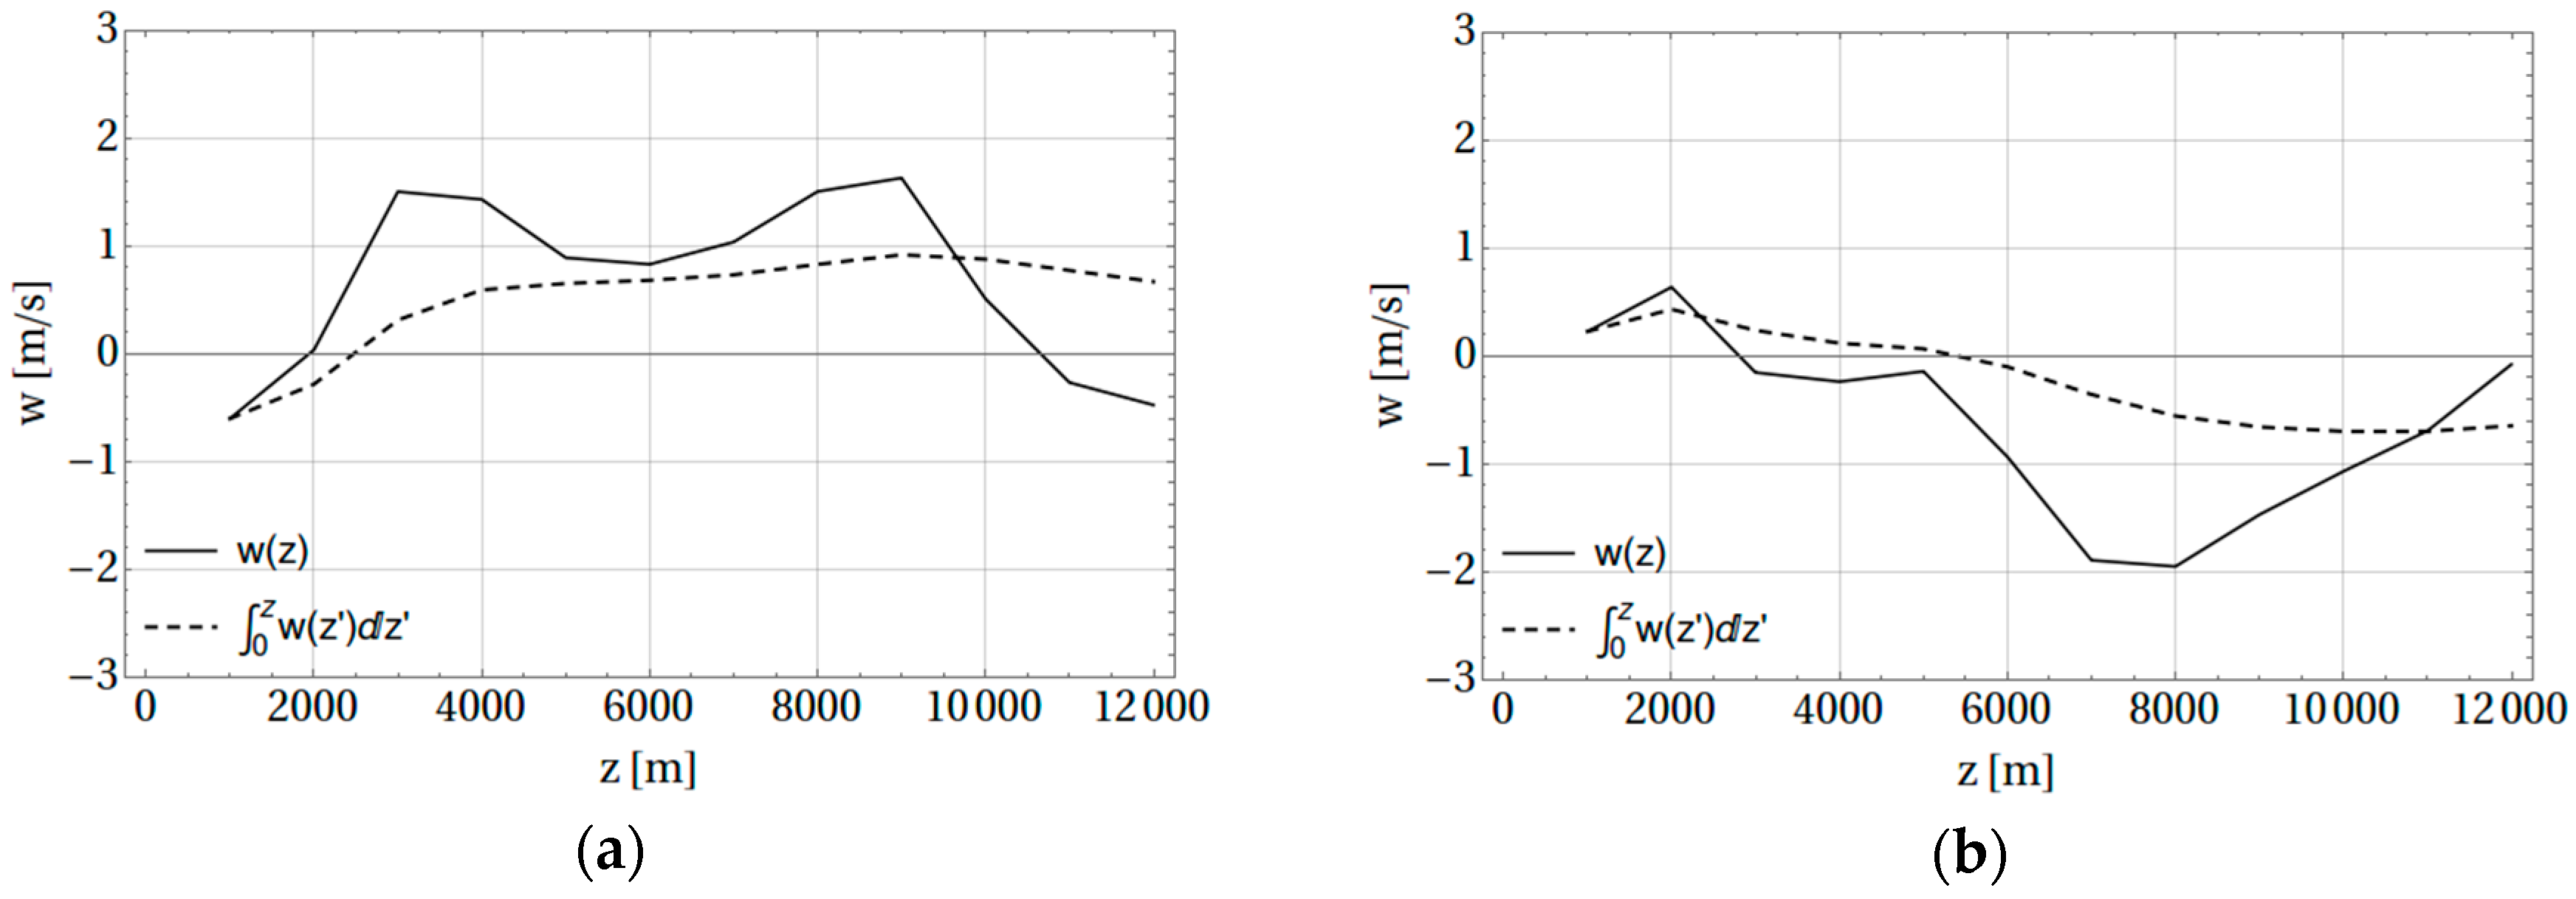
Figure 4.
Model of falling rain in a moving vertical air column.
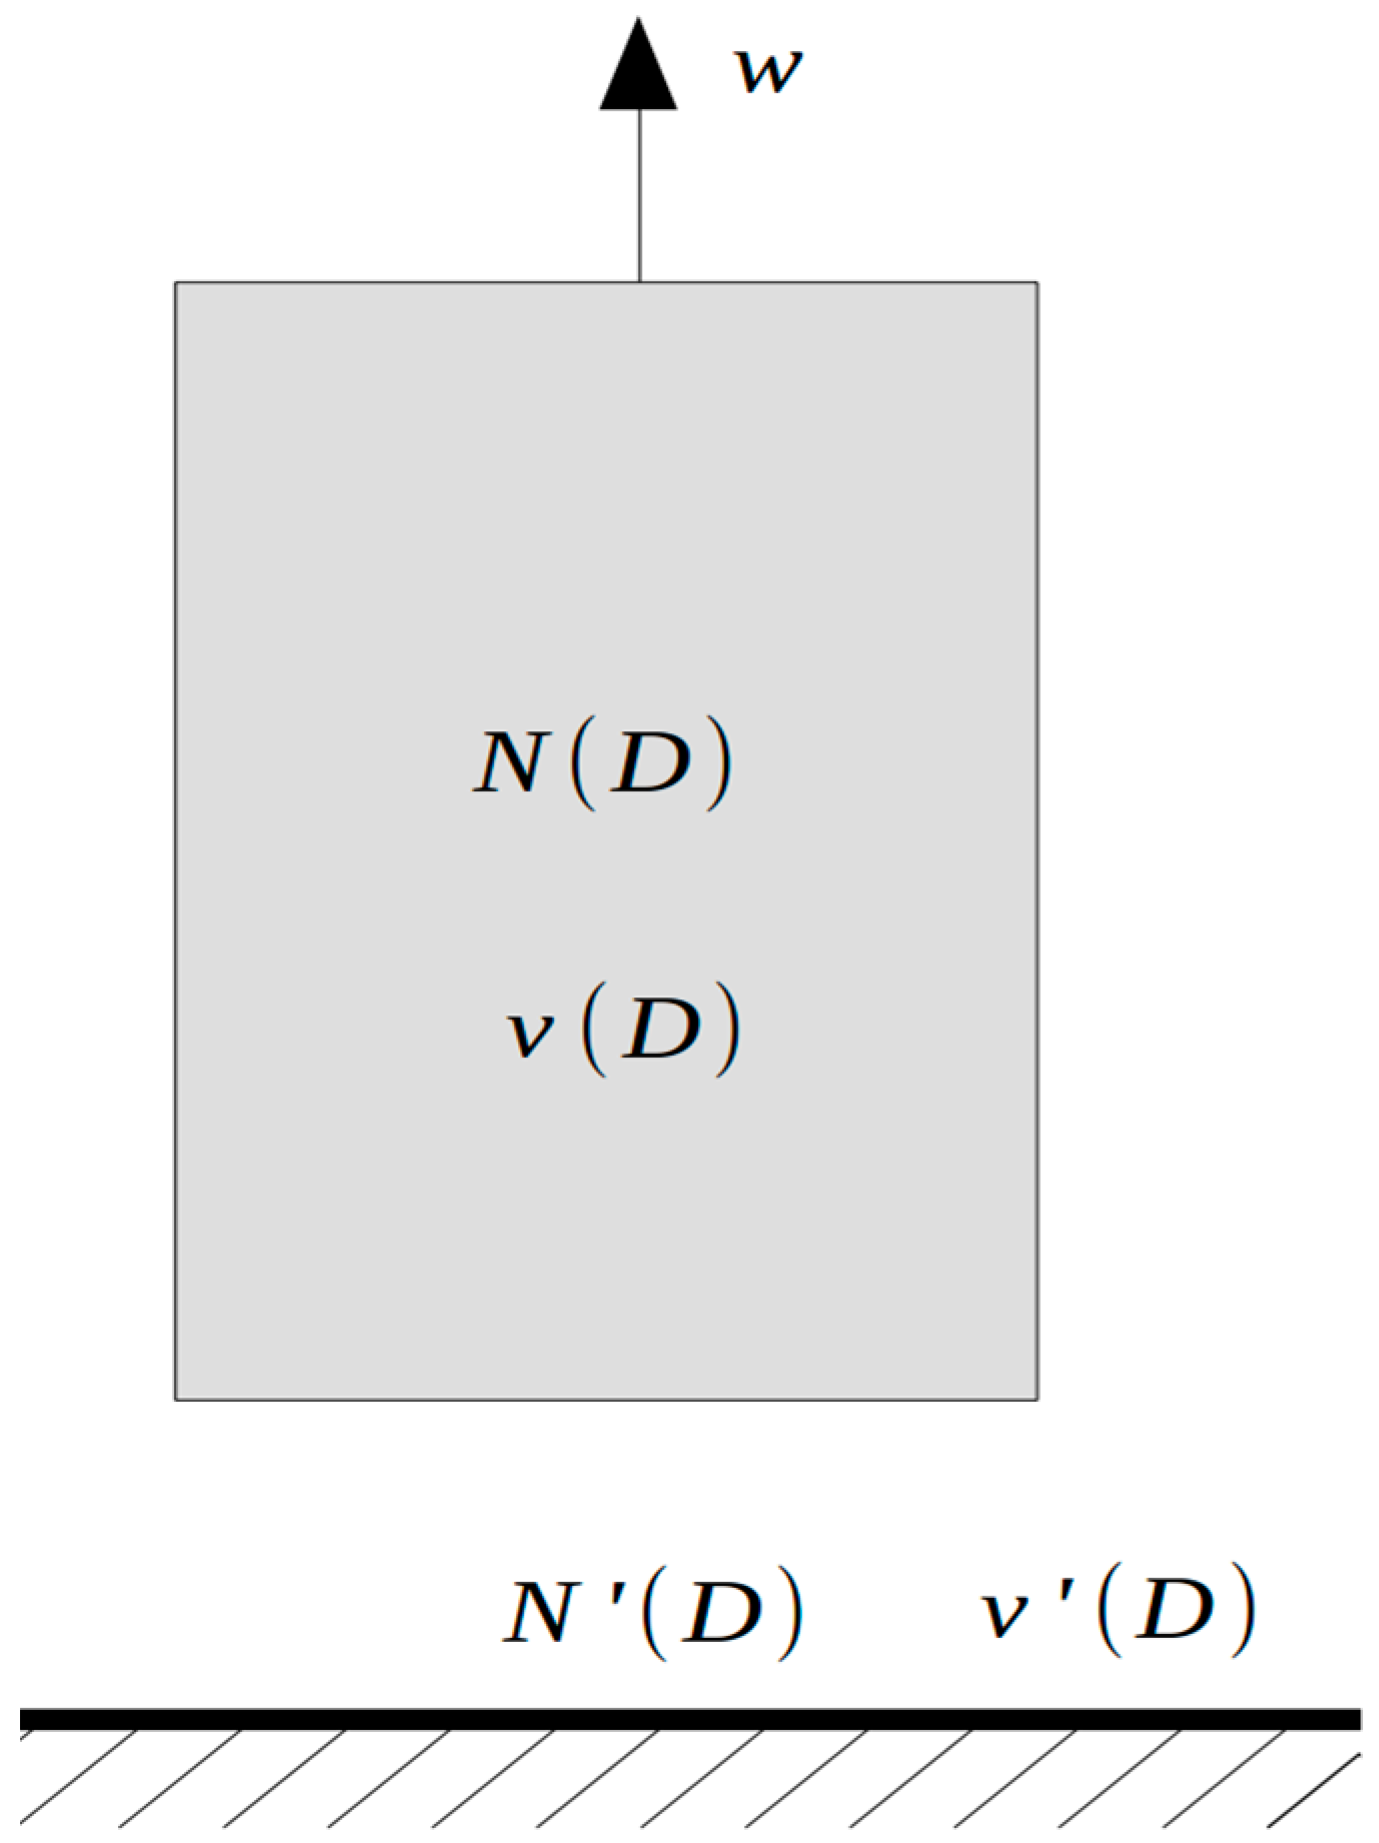
Figure 5.
Integration limits of disdrometer DSD.
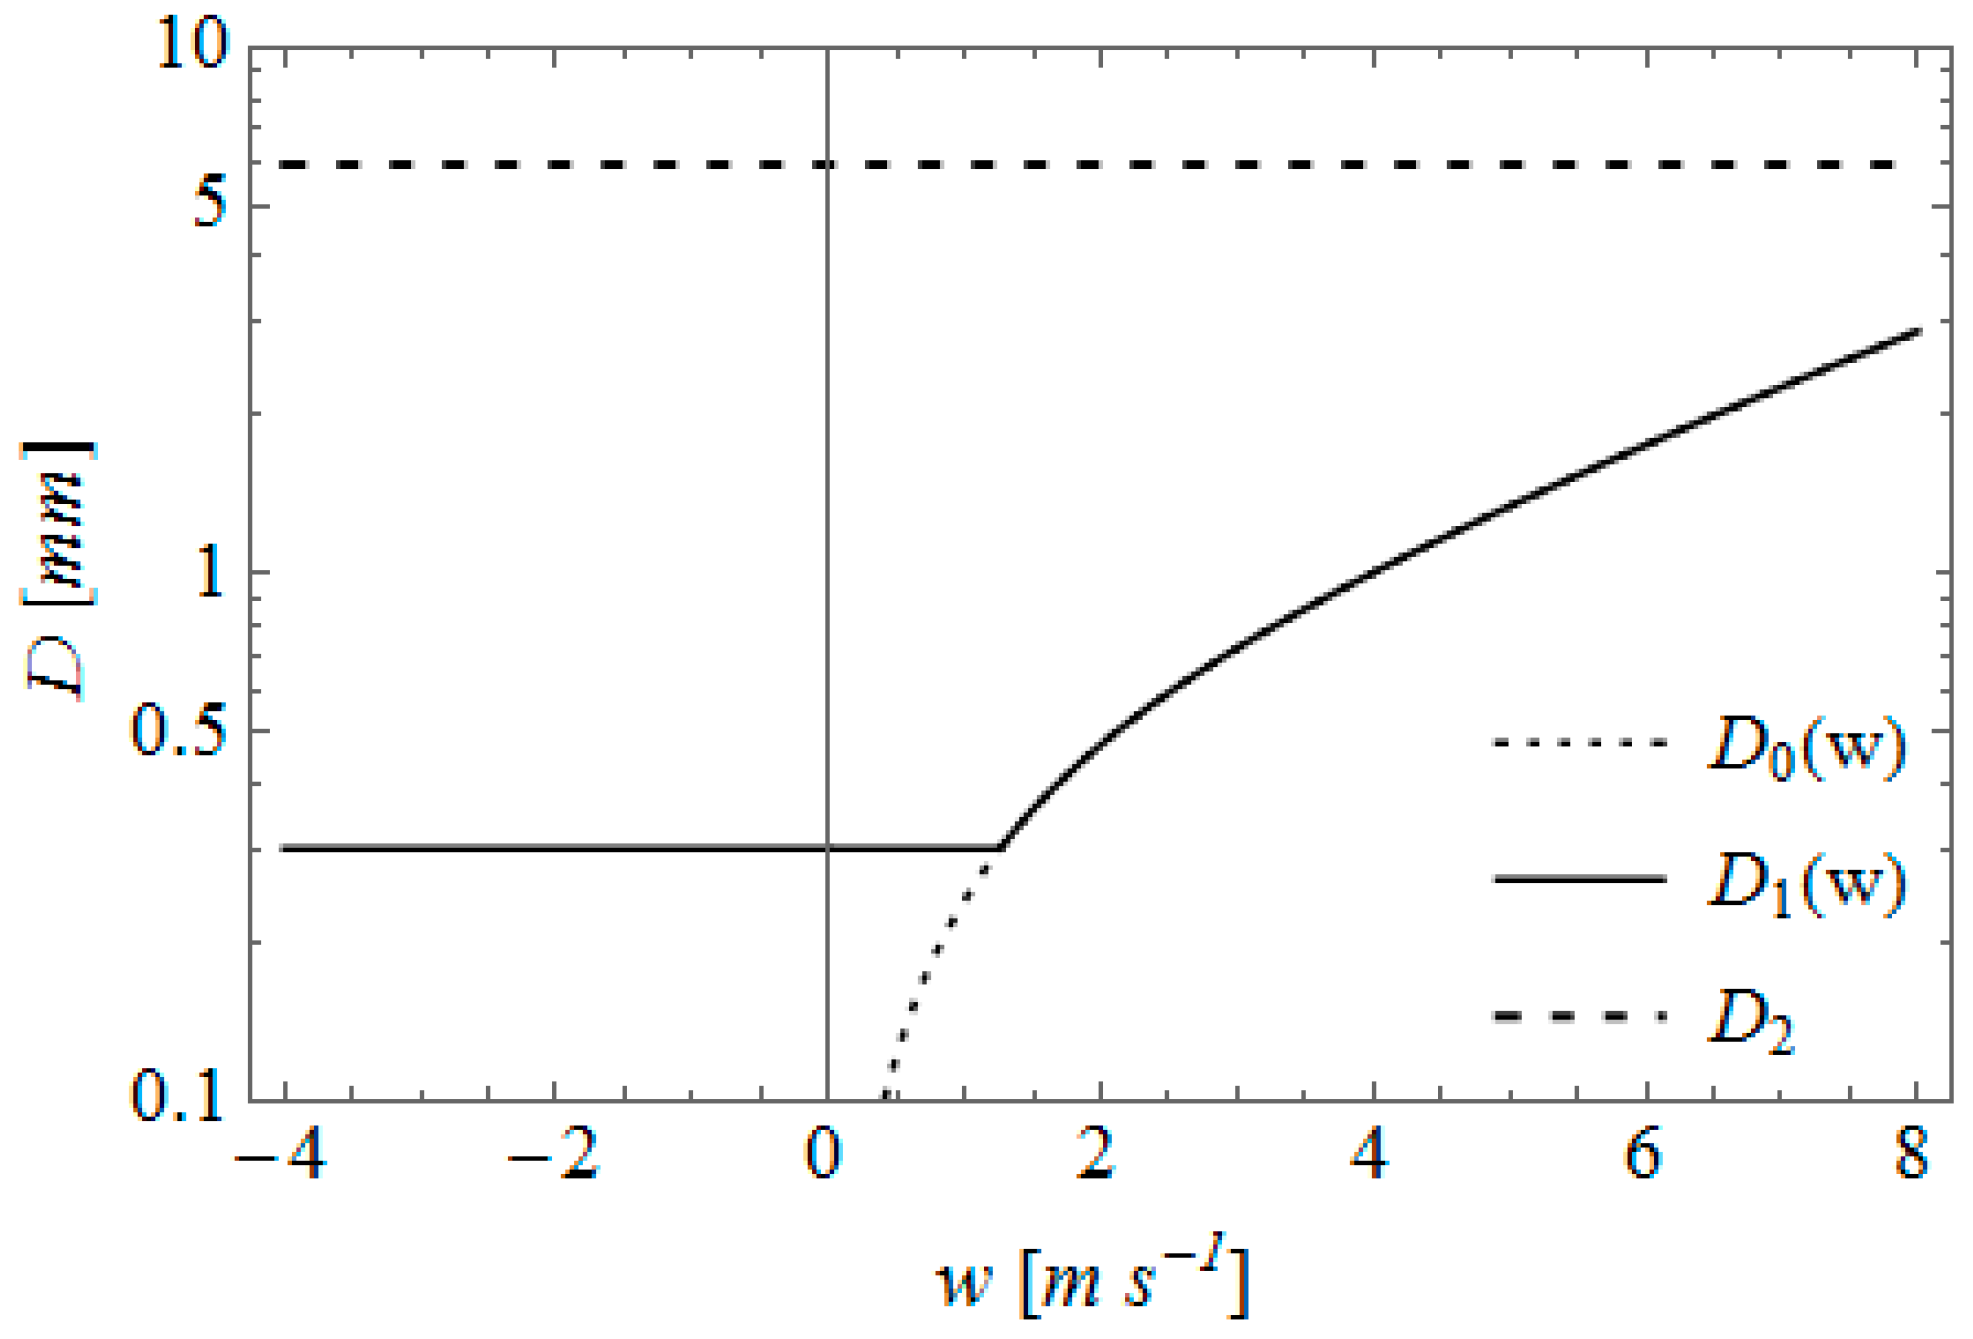
Figure 6.
FCM-DSD with downdraft, still air, and updraft examples, with: (a) = 8000 (mm−1 m−3), = 0.9, and = 0; (b) = 8000 (mm−1 m−3), = 1, and = 0.
Figure 6.
FCM-DSD with downdraft, still air, and updraft examples, with: (a) = 8000 (mm−1 m−3), = 0.9, and = 0; (b) = 8000 (mm−1 m−3), = 1, and = 0.

Figure 7.
Z-R curves generated by FCM-DSD model with = 8000 (mm−1 m−3), = 1, and = 0.
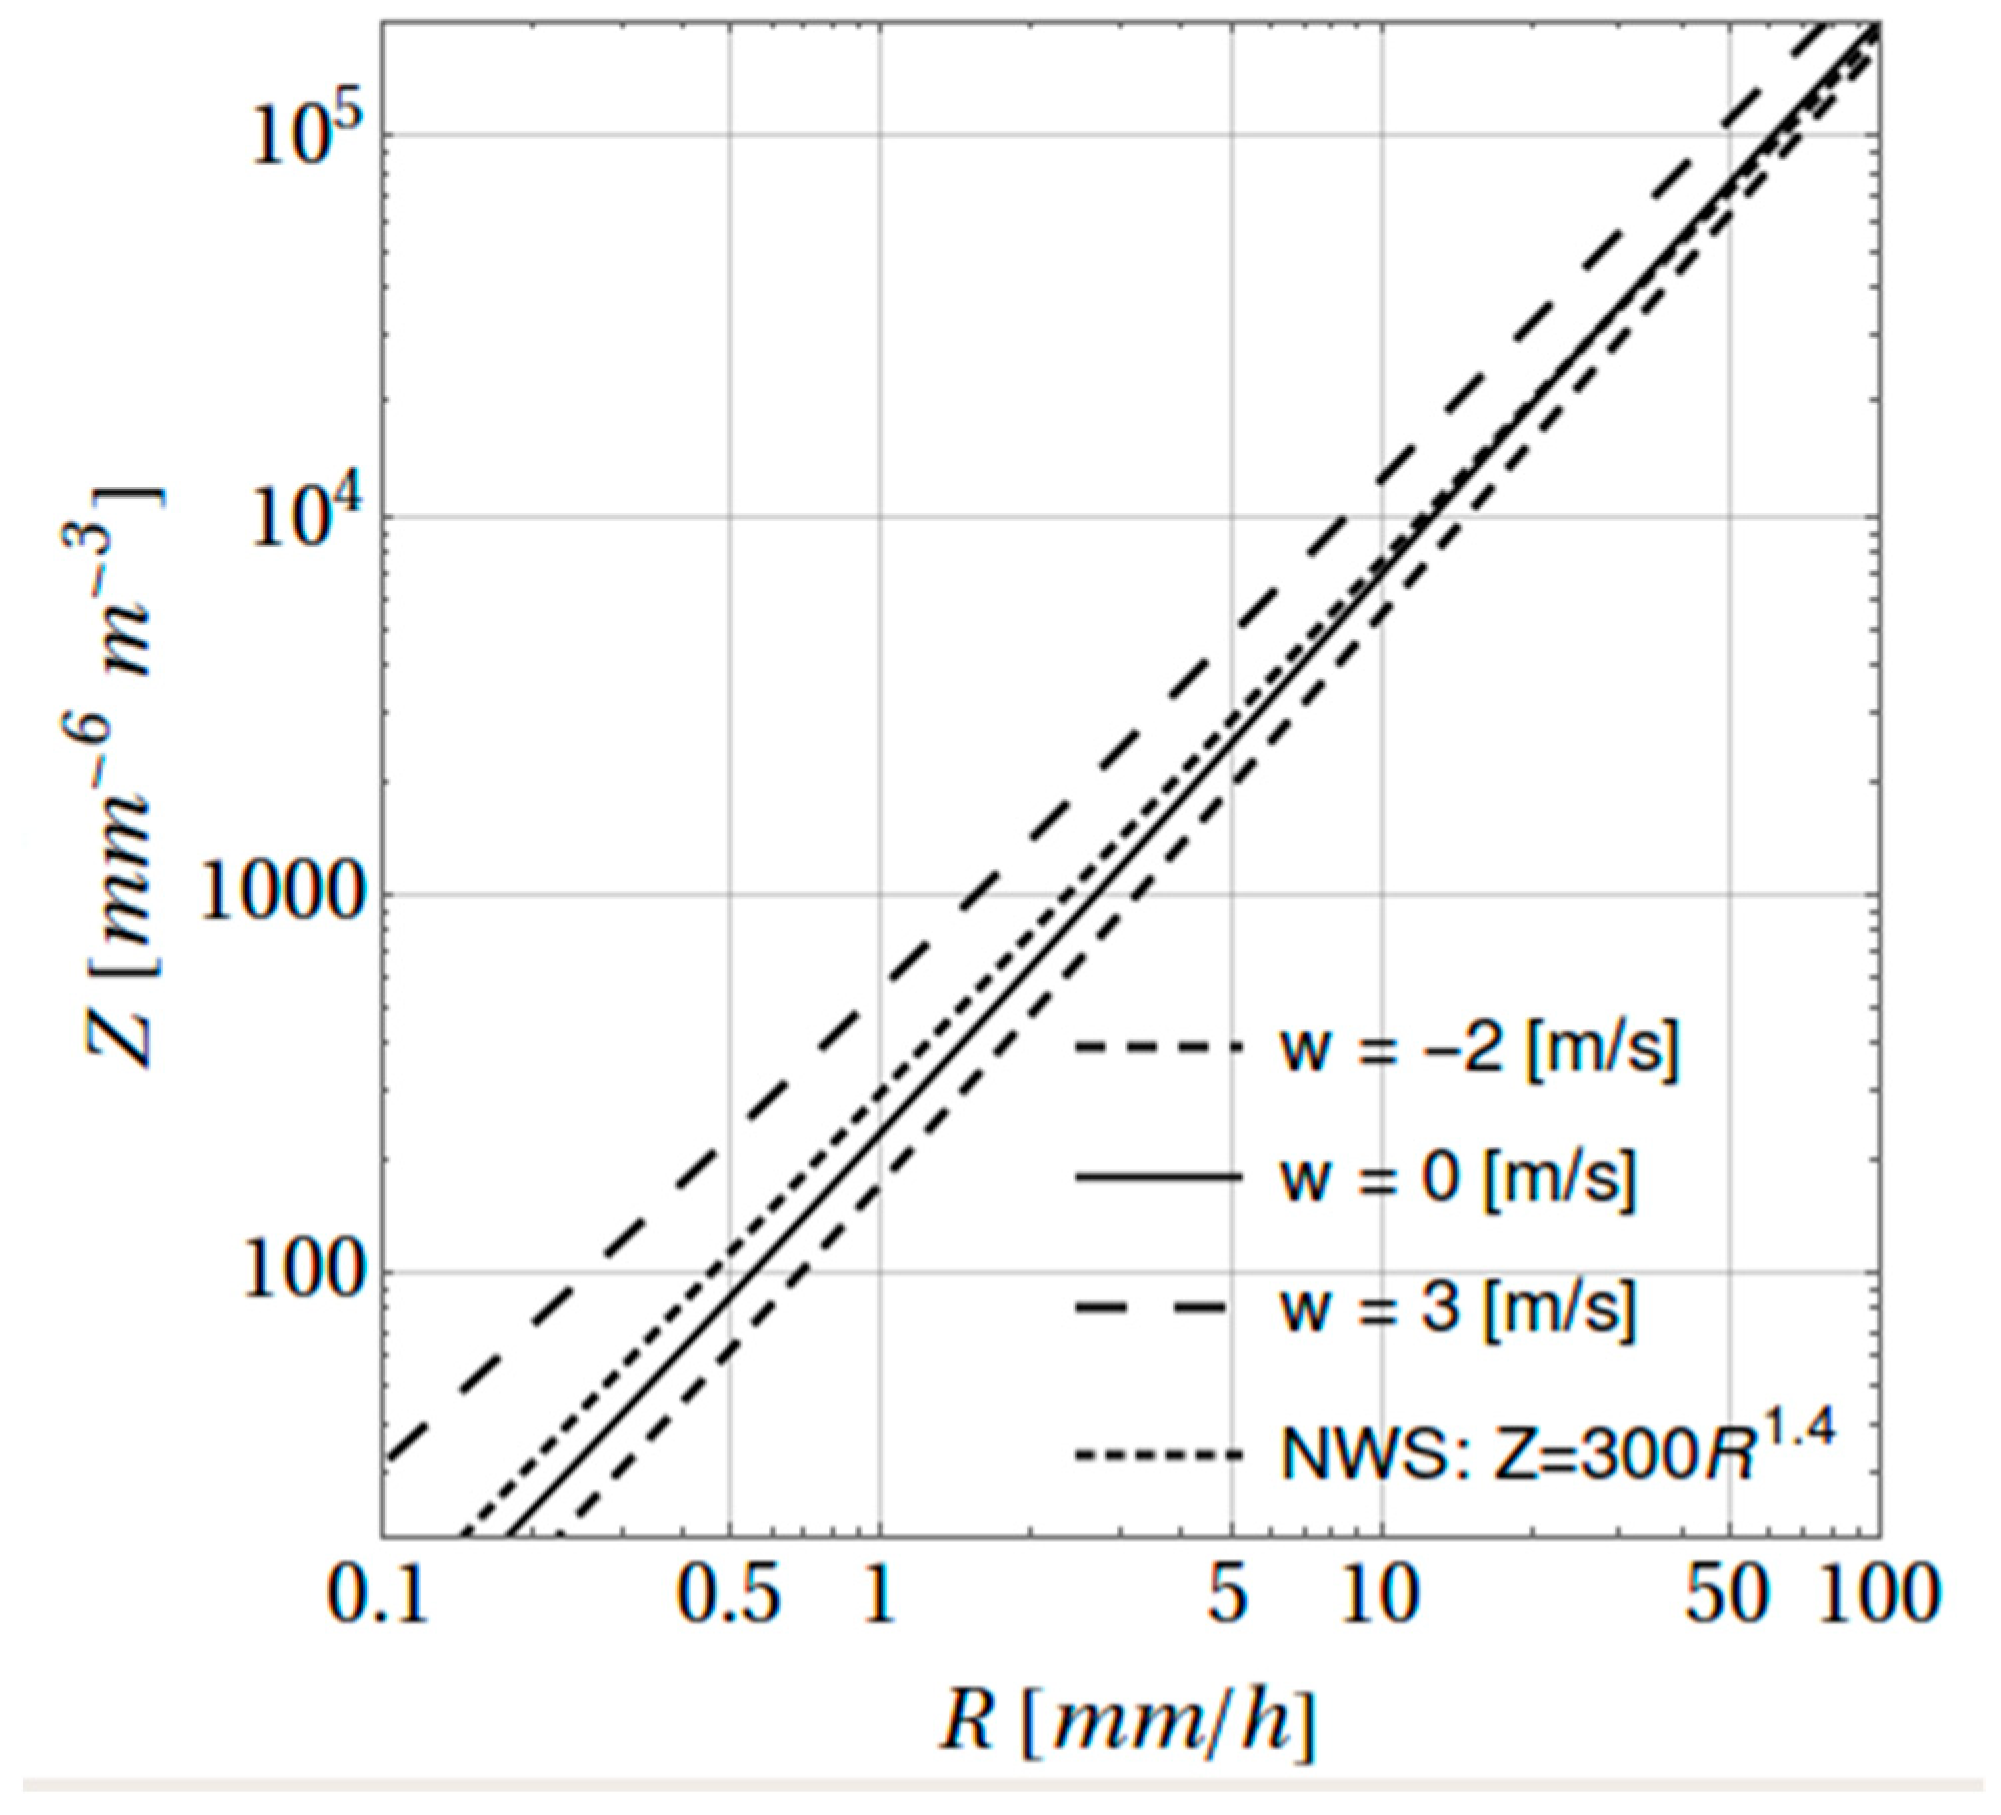
Figure 8.
Z-R curves generated by FCM-DSD model with = 0.9 and = 0.
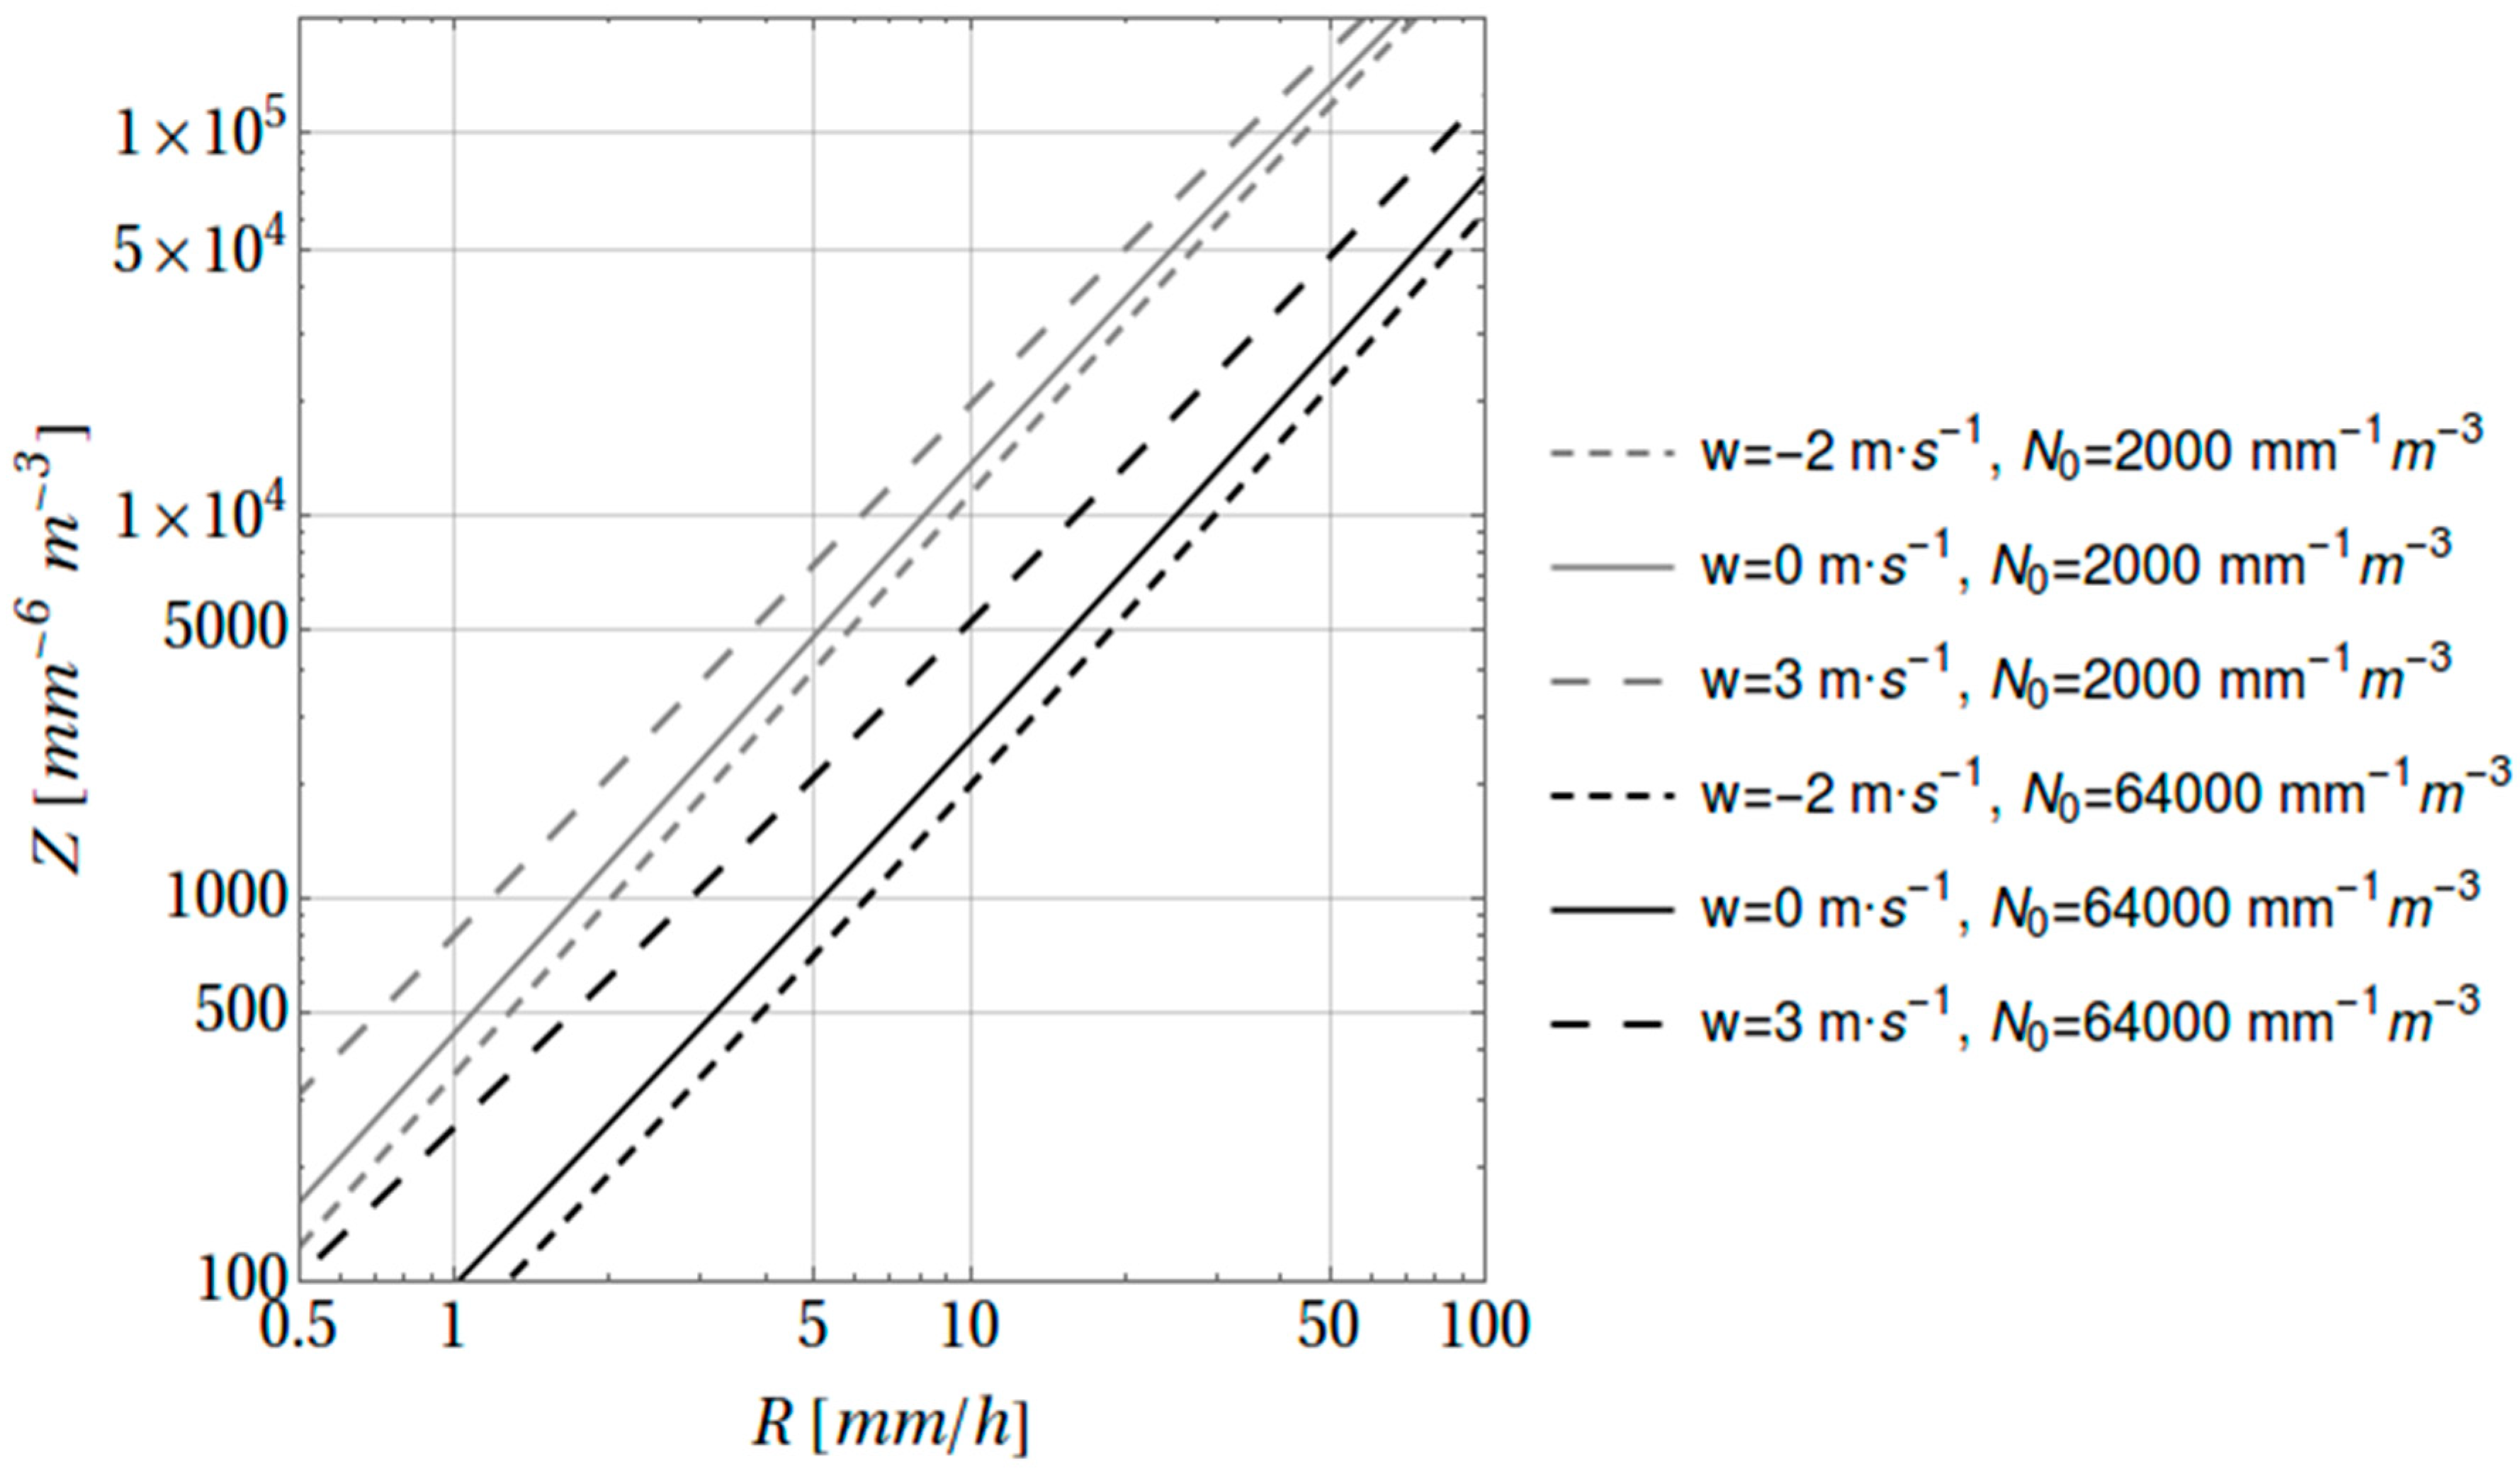
Figure 9.
Each line is 1000 uniform random distribution Z-R points with in the range of 2000 to 32,000 and in the range of 2.2 to 5, = 1: (red) = 3 m s−1; (gray) = 0; (green) = −4 m s−1.
Figure 9.
Each line is 1000 uniform random distribution Z-R points with in the range of 2000 to 32,000 and in the range of 2.2 to 5, = 1: (red) = 3 m s−1; (gray) = 0; (green) = −4 m s−1.
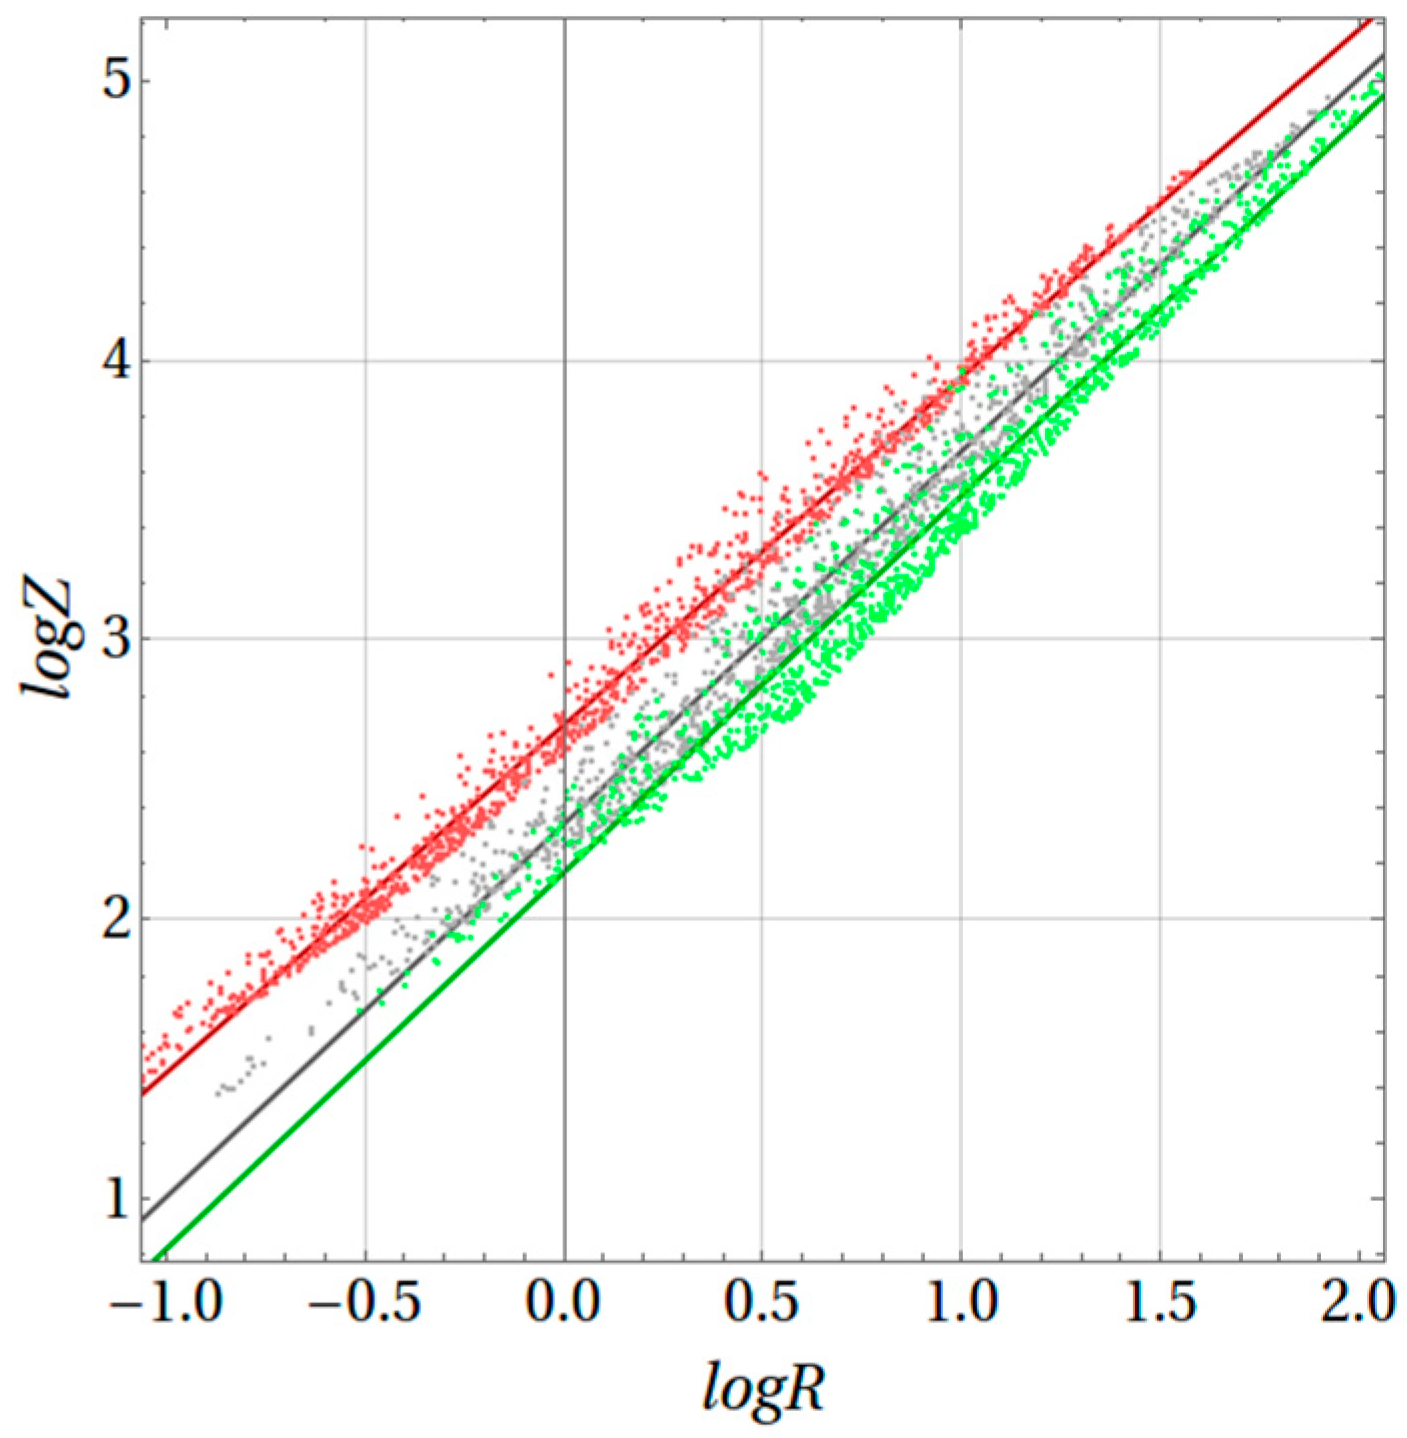
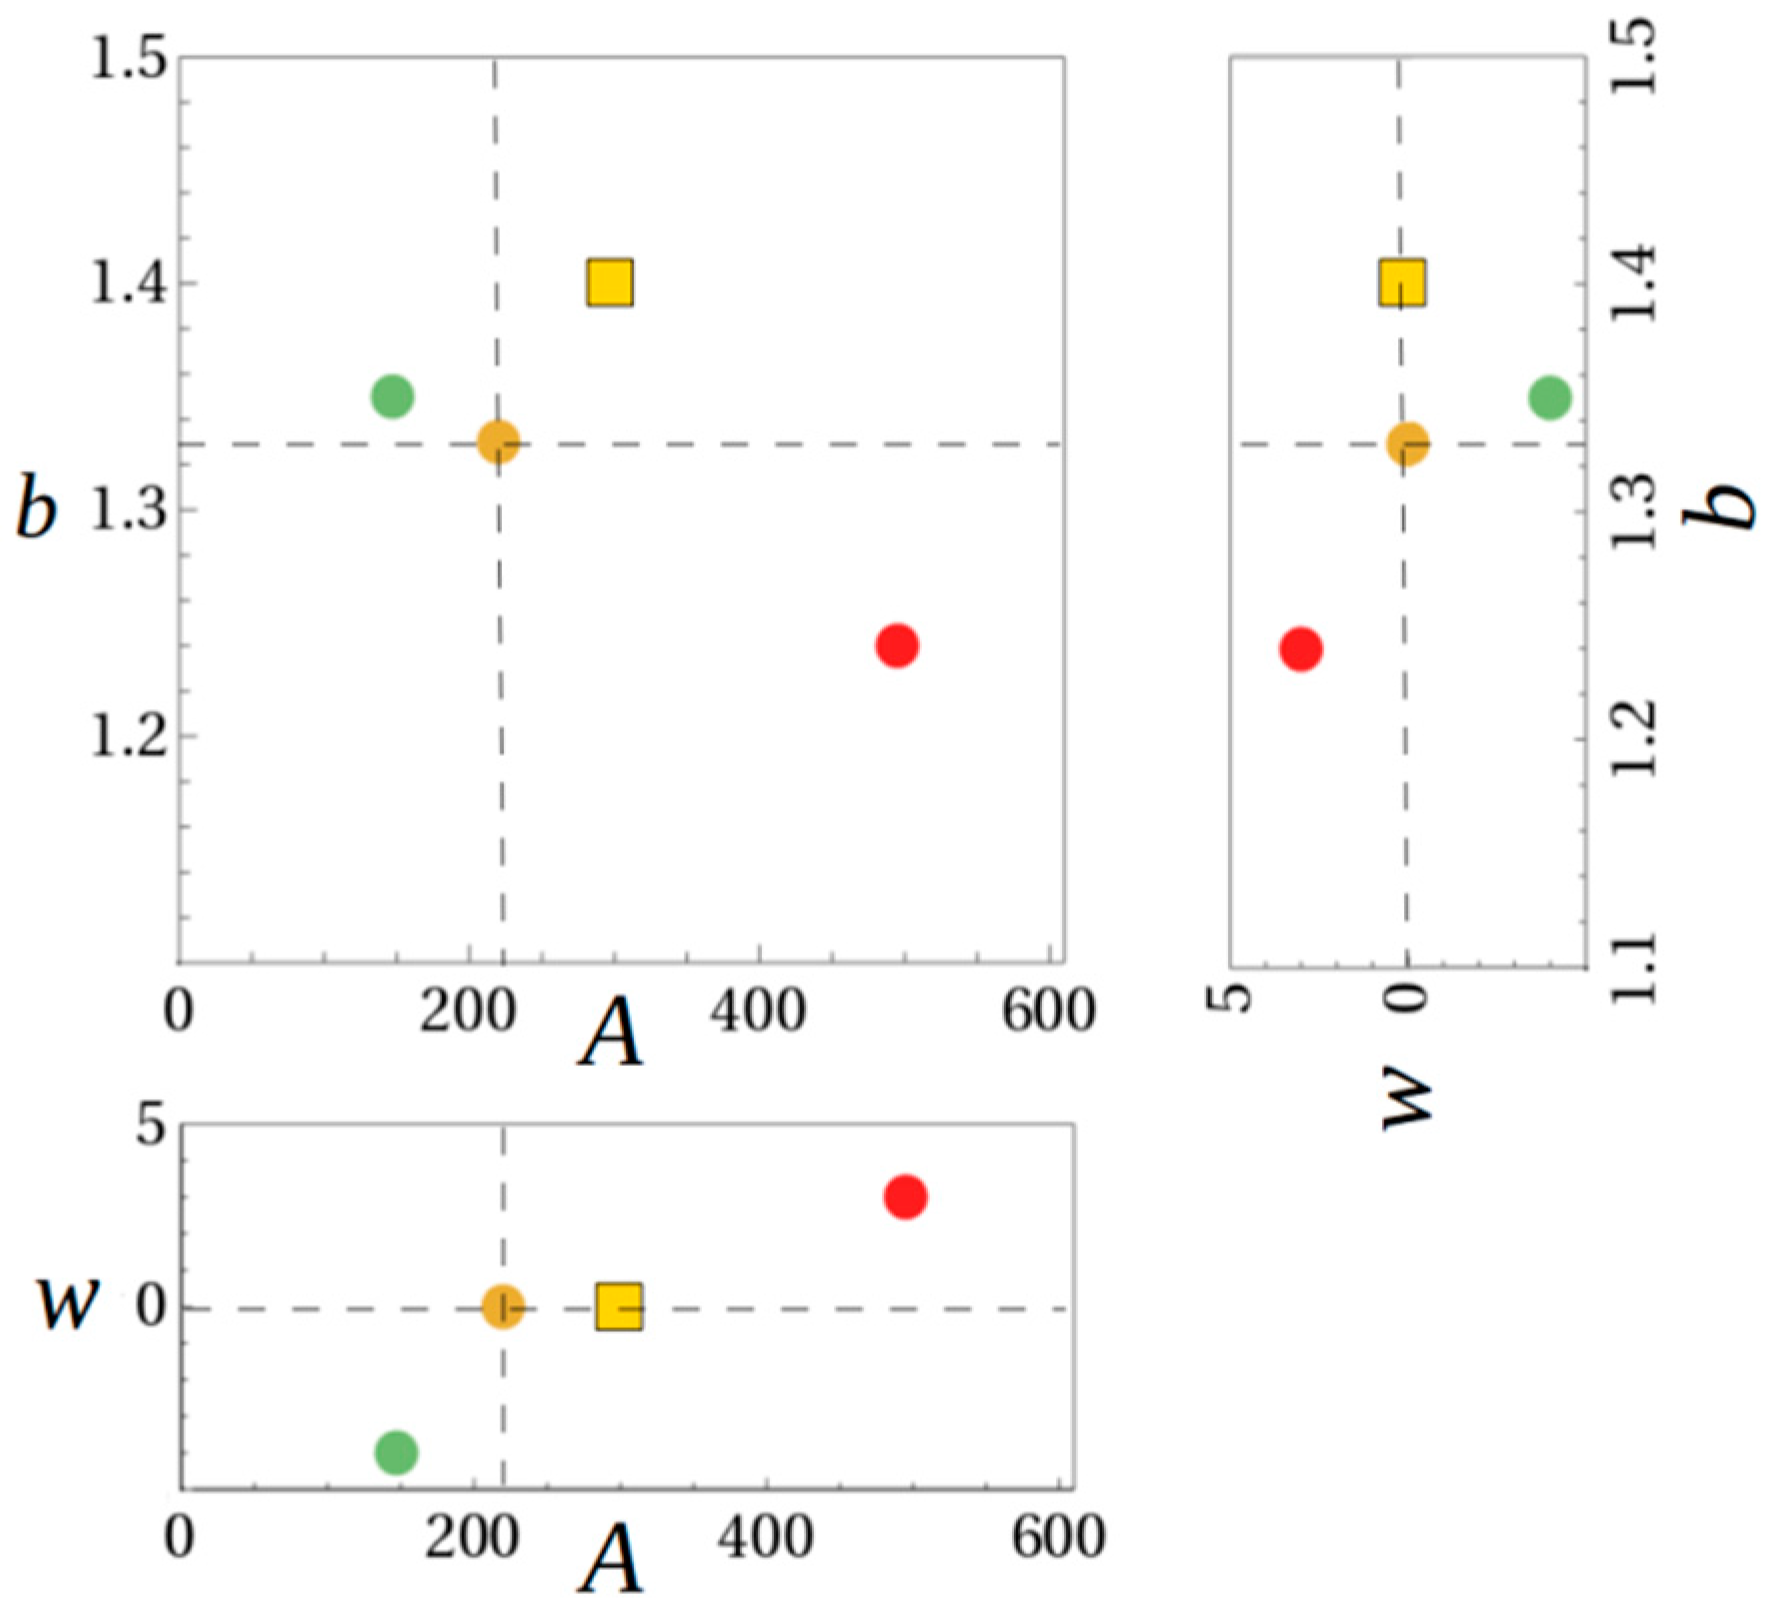
Figure 11.
24 October 2012 radiosonde data: thin line: derived vertical wind using Equations (1), (6), (7), (9), (10); dotted line: start of transition time from fully turbulent to laminar; thick gray line: time when flow becomes fully laminar (note that the lines for and overlap).
Figure 11.
24 October 2012 radiosonde data: thin line: derived vertical wind using Equations (1), (6), (7), (9), (10); dotted line: start of transition time from fully turbulent to laminar; thick gray line: time when flow becomes fully laminar (note that the lines for and overlap).
Figure 12.
Circles: {A, b, } data from Athalassa disdrometer-ECMWF data; Circles with black border: predictions based on theoretical DSD of Equation (22); Yellow square: NWS standard A-b; Yellow circle with black border: A-b for = 0 based on Equation (22).
Figure 12.
Circles: {A, b, } data from Athalassa disdrometer-ECMWF data; Circles with black border: predictions based on theoretical DSD of Equation (22); Yellow square: NWS standard A-b; Yellow circle with black border: A-b for = 0 based on Equation (22).

Table 1.
Eleven selected days for correlating ECMWF vertical wind to disdrometer derived A-b parameters. The value is the running accumulative average of the vertical wind speed, evaluated at an altitude of 10,000 m.
Table 1.
Eleven selected days for correlating ECMWF vertical wind to disdrometer derived A-b parameters. The value is the running accumulative average of the vertical wind speed, evaluated at an altitude of 10,000 m.
| Date | A | b | ||
|---|---|---|---|---|
| 1 | 29 May 2011 | 248 | 1.36 | −0.575 |
| 2 | 23 September 2011 | 432 | 1.43 | 2.285 |
| 3 | 10 August 2011 | 71 | 1.2 | −0.87 |
| 4 | 27 January 2012 | 354 | 1.4 | 2.75 |
| 5 | 24 October 2012 | 446 | 1.43 | 1.5 |
| 6 | 17 April 2013 | 280 | 1.38 | −0.38 |
| 7 | 10 May 2013 | 584 | 1.47 | 0.58 |
| 8 | 6 June 2013 | 221 | 1.3 | −2.7 |
| 9 | 18 October 2013 | 373 | 1.42 | 2.7 |
| 10 | 12 June2014 | 1391 | 1.64 | −1.0 |
| 11 | 5 July 2014 | 1765 | 1.63 | −0.75 |
| A | b | |
|---|---|---|
| 3 | 495 | 1.24 |
| 0 | 220 | 1.33 |
| −4 | 147 | 1.35 |
Table 3.
Fitting radiosonde to ECMWF vertical velocity.
| Date | Time (UTC) | (m s−1) | (m) | (h) | |
|---|---|---|---|---|---|
| 1 | 29May 2011 | 05:00 (NA) 11:00 | 0.60 −0.47 | - 1.40 | - 0.43 |
| 2 | 23 September 2011 | 05:00 11:00 | 0.38 0.59 | 1.35 1.35 | 0.21 0.20 |
| 3 | 10 August 2011 | 05:00 11:00 | −0.52 −1.24 | 1.42 1.45 | 0.38 0.45 |
| 4 | 27 January 2012 | 05:00 11:00 | 2.72 −0.43 | 1.18 1.36 | < 0 0.38 |
| 5 | 24 October 2012 | 05:00 11:00 | 1.19 1.41 | 1.30 1.30 | 0.10 0.07 |
| 6 | 17 April 2013 | 05:00 11:00 | 0.87 −0.70 | 1.30 1.38 | 0.07 0.40 |
| 7 | 10 May 2013 | 05:00 11:00 (NA) | 0.69 0.43 | 1.31 - | 0.01 - |
| 8 | 6 June 2013 | 05:00 (NA) 11:00 (NA) | −2.71 −2.79 | - - | - - |
| 9 | 18 October 2013 | 05:00 11:00 | 2.75 −1.16 | 1.20 1.40 | < 0 0.48 |
| 10 | 12 June 2014 | 05:00 11:00 | −0.30 −0.88 | 1.37 1.41 | 0.32 0.45 |
| 11 | 5 July 2014 | 05:00 (NA) 11:00 (NA) | −0.24 0.67 | - - | - - |
© 2019 by the authors. Licensee MDPI, Basel, Switzerland. This article is an open access article distributed under the terms and conditions of the Creative Commons Attribution (CC BY) license (http://creativecommons.org/licenses/by/4.0/).
Share and Cite
MDPI and ACS Style
Michaelides, S.; Lane, J.; Kasparis, T. Effect of Vertical Air Motion on Disdrometer Derived Z-R Coefficients. Atmosphere 2019, 10, 77. https://doi.org/10.3390/atmos10020077
AMA Style
Michaelides S, Lane J, Kasparis T. Effect of Vertical Air Motion on Disdrometer Derived Z-R Coefficients. Atmosphere. 2019; 10(2):77. https://doi.org/10.3390/atmos10020077
Chicago/Turabian StyleMichaelides, Silas, John Lane, and Takis Kasparis. 2019. "Effect of Vertical Air Motion on Disdrometer Derived Z-R Coefficients" Atmosphere 10, no. 2: 77. https://doi.org/10.3390/atmos10020077
Note that from the first issue of 2016, this journal uses article numbers instead of page numbers. See further details here.